Article

Initial Psychometric Evaluation of the Problematic Use of Generative Artificial Intelligence Scale Among Chinese School Students

1
The Affiliated Wenzhou Kangning Hospital of Wenzhou Medical University, Wenzhou 325000, China
2
School of Mental Health, Wenzhou Medical University, Wenzhou 325035, China
3
School of Public Health, Fudan University, Shanghai 200032, China
4
Center for Health Behaviours Research, Jockey Club School of Public Health and Primary Care, The Chinese University of Hong Kong, Hong Kong SAR, China
*
Author to whom correspondence should be addressed.
Behav. Sci. 2026, 16(10), 1763; https://doi.org/10.3390/bs16101763
Submission received: 20 August 2026 / Revised: 17 September 2026 / Accepted: 23 September 2026 / Published: 28 September 2026
(This article belongs to the Special Issue Artificial Intelligence and Students’ Mental Health)

Abstract

Generative artificial intelligence (GAI) is increasingly used by school students, yet validated instruments for assessing problematic GAI use (PUGAI) in this population remain scarce. This study evaluated the psychometric properties of the Problematic Use of Generative Artificial Intelligence Scale (PUGAIS) in a large school-based sample of Chinese students. A cross-sectional survey included 19,484 students in Grades 4–9 who had used GAI. The sample was randomly split for exploratory and confirmatory factor analyses. Internal consistency, measurement invariance across sex, school type, and developmentally defined age groups, concurrent validity, latent classes, and a preliminary threshold were also examined. Following item refinement, the 8-item PUGAIS (PUGAIS-8) showed a dominant one-factor structure, although confirmatory model-fit evidence was mixed. The scale showed high internal consistency (Cronbach’s α = 0.940) and measurement invariance of item thresholds and factor loadings across sex, school type, and age groups. Ordinal sensitivity analyses indicated that the item-reduction results were partly sensitive to analytic treatment, although the PUGAIS-8 showed a more favorable overall structural fit than the original 10-item specification. A substantial floor effect indicated limited differentiation at the lower end of the construct. PUGAIS-8 scores were positively associated with depressive symptoms, anxiety symptoms, insomnia symptoms, and short-video addiction (r = 0.365–0.413, all p < 0.01). Latent class analysis identified a high-score subgroup (7.2%), and an exploratory ROC analysis yielded an internally derived descriptive threshold of 20.5. Overall, the findings provide initial psychometric support for the PUGAIS-8 as a brief measure of PUGAI among Chinese school students, while indicating the need for independent replication of the item-reduction findings and further evaluation of its measurement properties and proposed threshold.

1. Introduction

Generative artificial intelligence (GAI) has rapidly become integrated into how people search for information, solve problems, create content, and complete everyday tasks (Dwivedi et al., 2023; Xian et al., 2024). Advances in GAI have made increasingly sophisticated tools readily accessible to the public (Bommasani et al., 2021; Dwivedi et al., 2023), with particularly rapid uptake in educational contexts. A recent U.S. survey found that approximately 70% of adolescents had used at least one GAI tool (Common Sense Media, 2024), while studies in other educational settings have documented widespread use for homework, information seeking, creative activities, and research (Dorta-González et al., 2024; Miranda et al., 2024). This growing integration of GAI into learning and everyday life may be particularly relevant during adolescence, when learning habits, self-regulation, values, and mental health continue to develop (Lin, 2018).
GAI can support learning and information seeking, enhance creativity and efficiency, and assist with everyday decision-making (Hermann & Puntoni, 2024; S. Huang et al., 2024; Kolding et al., 2025). At the same time, concerns have been raised about excessive reliance on AI-generated information, reduced independent cognitive engagement, privacy and security, and unequal access to digital resources (S. Huang et al., 2024; Salah et al., 2024; Zhou & Zhang, 2024). These concerns may be particularly relevant to adolescents because critical thinking, autonomous decision-making, and self-regulation are still developing. Discussions of responsible AI use have therefore emphasized maintaining human oversight and avoiding uncritical dependence on AI systems (Thurzo, 2025). Beyond the frequency or intensity of GAI use, it is important to identify patterns involving impaired control, distress, or functional disruption. We refer to such patterns as problematic GAI use (PUGAI).
PUGAI may share features with other forms of problematic technology use, particularly impaired control and continued use despite negative consequences (Zhou & Zhang, 2024). Behavioral addictions have been conceptualized in terms of reinforcement processes and diminished behavioral control (Brand et al., 2019; Griffiths, 2005), while socially oriented digital activities may additionally be reinforced by interpersonal feedback and social rewards (Meshi et al., 2015). GAI differs in that much of its use is instrumental and goal-directed, including learning (Bai & Wang, 2025), information seeking (Lund et al., 2026), problem solving (Urban et al., 2024), and content generation (Conde et al., 2026). Frequent or prolonged GAI use may therefore reflect legitimate task demands rather than problematic involvement, and reliance on GAI may occur within reflective, cautious, and collaborative forms of problem solving (Hou et al., 2025a, 2025b). Moreover, impaired control and interpersonal consequences are conceptually distinguishable features of problematic technology use (Brand et al., 2019; Müller et al., 2022), suggesting that poorly controlled GAI use need not involve prominent interpersonal conflict. We therefore conceptualize PUGAI as poorly regulated GAI use accompanied by distress or functional consequences, rather than as an established behavioral addiction. Intensive or sustained use for legitimate academic or task-related purposes should not, by itself, be considered problematic solely because of its frequency or duration (Liao et al., 2026).
Empirical evidence on PUGAI among adolescents remains limited. One adolescent study reported prevalence estimates of 17.14% and 24.19% across two waves (S. Huang et al., 2024), although these estimates were based on a threshold that had not undergone formal psychometric validation. Other recent studies have adapted measures of problematic or addictive technology use to assess problematic GAI-related behaviors (Y. H. Chen, 2025; Y. Huang & Huang, 2025; S. C. Yu et al., 2024; Zhou & Zhang, 2024). However, some instruments have not undergone comprehensive psychometric evaluation; some focus on a single platform such as ChatGPT, and evidence of their applicability to adolescents remains limited. These measurement gaps complicate comparisons across studies and the accumulation of evidence regarding the prevalence, correlates, and developmental consequences of PUGAI. A psychometrically evaluated measure is therefore needed to distinguish intensive GAI engagement from patterns characterized by diminished control, discomfort, or functional impairment (Y. Chen et al., 2025), and to provide a consistent basis for examining antecedents, outcomes, and group differences.
Measurement approaches in adjacent areas provide a useful starting point. Emerging GAI studies have examined AI dependence among adolescents (S. Huang et al., 2024), problematic ChatGPT use (Y. H. Chen, 2025), and technology addiction to generative AI chatbots (Y. Huang & Huang, 2025), but these approaches differ in conceptualization, technological focus, and target population. In the broader problematic-technology literature, the Smartphone Addiction Scale—Short Version (SAS-SV; Kwon et al., 2013) assesses features such as impaired control, increasing involvement, discomfort when access is restricted, and functional consequences and has been psychometrically evaluated in adolescents. These features provide a useful measurement foundation, but GAI differs from smartphones and other digital technologies because its use is often instrumental and goal-directed (Dorta-González et al., 2024; Dwivedi et al., 2023; Miranda et al., 2024). Thus, although a measure of PUGAI may draw on established indicators of impaired control and functional consequences (Kwon et al., 2013; Zhou & Zhang, 2024), these indicators require empirical evaluation in the specific context of GAI.
Accordingly, the present study adapted items from the SAS-SV (Kwon et al., 2013) to assess PUGAI. The SAS-SV was selected not because GAI use was assumed to be equivalent to smartphone addiction, but because it captures general behavioral features potentially relevant to poorly controlled technology use, including difficulties regulating use, functional consequences, and discomfort when access is restricted. The resulting Problematic Use of Generative Artificial Intelligence Scale (PUGAIS) was intended as a brief measure of problematic patterns of GAI use rather than as a diagnostic instrument or a comprehensive measure of GAI-related harms.
The present study evaluated the psychometric properties of the PUGAIS in a large school-based sample of Chinese school students. We first examined its factor structure using exploratory and confirmatory factor analyses in independent split-half subsamples and assessed internal consistency and floor and ceiling effects. We then examined measurement invariance across sex, school type, and developmentally defined age groups and evaluated concurrent validity through associations with depressive symptoms, anxiety symptoms, insomnia symptoms, and short-video addiction. Finally, latent class analysis was used exploratorily to characterize heterogeneity in PUGAIS-8 item-response patterns, followed by receiver operating characteristic analysis to examine an internally derived preliminary threshold. Given the absence of an independent clinical criterion, this threshold was considered exploratory and was not intended to represent a diagnostic cutoff.

2. Materials and Methods

2.1. Participants and Procedure

A cross-sectional, school-based survey was conducted in March 2025 across 72 schools (51 primary schools and 21 secondary schools) in Wenzhou, Zhejiang Province, China. All students in Grades 4–9 at the participating schools were invited to participate. Participants had a mean age of 12.14 years (SD = 1.75; range = 7–17 years). The study was approved by the Medical Ethics Committee of the Affiliated Kangning Hospital of Wenzhou Medical University (approval No. YJ-2024-21-02).
Data were collected in classroom settings by trained fieldworkers using an electronic questionnaire system. Before questionnaire administration, students were informed of the study purpose, procedures, voluntary nature of participation, and their right to decline participation or withdraw at any time without penalty. The same information was provided on the questionnaire cover page. Parents or legal guardians were informed about the study in advance, and written informed consent was obtained before their children were invited to participate. Written informed assent was also obtained from participating students according to the ethics-approved procedure. Students whose parents or legal guardians declined participation were not invited to participate. No incentives were provided. Questionnaires were completed without teachers present and submitted directly through the survey system. Similar procedures have been used in previous school-based adolescent research (Y. Yu et al., 2024). The final dataset was de-identified before analysis to protect participants’ privacy and confidentiality.
A total of 40,120 questionnaires were returned. Of these, 19,165 (47.77%) were excluded because the respondents reported never having used GAI. Among the 20,955 students who reported prior GAI use, a further 1471 questionnaires were excluded because information on sex or grade was missing or because more than 20% of responses were missing across the key study measures, including the Problematic Use of Generative Artificial Intelligence Scale (PUGAIS), the 9-item Patient Health Questionnaire (PHQ-9), the 7-item Generalized Anxiety Disorder scale (GAD-7), the 7-item Insomnia Severity Index (ISI), and the 6-item short-video addiction scale. The final analytic sample comprised 19,484 students, representing 93.0% of those who reported prior GAI use.
Sociodemographic information included sex, school type (primary or secondary school), whether participants lived with both parents, parental educational attainment, self-reported academic performance (lowest 20%, 61–80% from the top, 41–60% from the top, 21–40% from the top, or highest 20%), self-reported household income (very low/low, average, high/very high, or not reported), and boarding-school attendance.

2.2. Measures

All study measures were administered in a single electronic survey session. The questionnaire consisted of sociodemographic questions followed by the study measures described below, with each measure presented as a separate section in a fixed order.

2.2.1. Problematic Use of Generative Artificial Intelligence

The Problematic Use of Generative Artificial Intelligence Scale (PUGAIS) was adapted from the 10-item Smartphone Addiction Scale—Short Version (SAS-SV; Kwon et al., 2013). The Chinese SAS-SV has demonstrated good psychometric properties (Xiang et al., 2019) and has been widely used in Chinese samples (e.g., Lai et al., 2025; Xie et al., 2024). The SAS-SV was selected because it captures behavioral features relevant to poorly controlled technology use, including impaired control, functional impairment, and discomfort when access is restricted. PUGAI was not assumed to be equivalent to smartphone addiction.
For adaptation, smartphone-related wording was replaced with GAI-related wording, and several items were modified to fit students’ daily contexts. The translation and adaptation involved two behavioral scientists, two psychologists, one clinical psychologist, and one psychiatrist. DBW conducted the initial translation and adaptation, JTFL performed back-translation and further modification, and the research team reviewed the items through discussion, considering their relevance to PUGAI, comprehensibility for school students, and coverage of the intended construct. No formal content-validity assessment, cognitive interviewing, or separate pilot testing was conducted during the initial adaptation. The questionnaire defined GAI tools as systems capable of generating human-like content and provided examples of commonly available platforms in China.
Items were rated on a 4-point Likert scale (1 = strongly disagree to 4 = strongly agree), with higher scores indicating greater levels of PUGAI. No items were reverse-scored. The original 10-item version yielded scores ranging from 10 to 40. The original 10 items and the final retained items, with the original and final item numbers provided to show their correspondence, are presented in Supplementary S1.

2.2.2. Depressive Symptoms

Depressive symptoms were assessed using the 9-item Patient Health Questionnaire (PHQ-9; Kroenke et al., 2001). The PHQ-9 has been validated in Chinese populations (Zhang et al., 2013) and has been used in previous studies in China (Guo et al., 2021). Participants rated the frequency of depressive symptoms during the preceding 2 weeks on a 4-point scale ranging from 0 (not at all) to 3 (nearly every day). Total scores range from 0 to 27, with higher scores indicating more severe depressive symptoms. In the present sample, the PHQ-9 showed excellent internal consistency (Cronbach’s α = 0.911).

2.2.3. Anxiety Symptoms

Anxiety symptoms were assessed using the 7-item Generalized Anxiety Disorder scale (GAD-7; Löwe et al., 2008). The Chinese version of the GAD-7 has demonstrated good psychometric properties (Tong et al., 2016) and has been used in previous studies in China (Guo et al., 2021). Participants rated the frequency of anxiety symptoms during the preceding 2 weeks on a 4-point scale ranging from 0 (not at all) to 3 (nearly every day). Total scores range from 0 to 21, with higher scores indicating more severe anxiety symptoms. In the present sample, the GAD-7 showed excellent internal consistency (Cronbach’s α = 0.932).

2.2.4. Insomnia Symptoms

Insomnia symptoms were assessed using the 7-item Insomnia Severity Index (ISI; Gagnon et al., 2013; Morin, 1993). The ISI assesses several aspects of insomnia, including difficulties with sleep initiation and maintenance, early morning awakening, satisfaction with current sleep patterns, interference with daily functioning, noticeability of sleep problems, and distress related to sleep difficulties. Items are rated on a 5-point scale ranging from 0 to 4, yielding a total score from 0 to 28, with higher scores indicating greater insomnia severity. In the present sample, the ISI showed good internal consistency (Cronbach’s α = 0.875).

2.2.5. Short-Video Addiction

Short-video addiction was assessed using a 6-item measure adapted from the Bergen Social Media Addiction Scale (BSMAS; Andreassen et al., 2012). The items assess six behavioral features related to problematic short-video use and are rated on a 5-point Likert scale ranging from 1 (very rarely) to 5 (very often), with higher scores indicating greater levels of short-video addiction. The adapted measure has previously been used among Chinese school students and demonstrated acceptable reliability (Sun et al., 2024). In the present sample, the scale showed good internal consistency (Cronbach’s α = 0.874).

2.3. Statistical Analysis

A total of 92 item-level responses were missing across the 19,484 participants. Missing values were handled using multiple imputation (MI) with fully conditional specification (FCS), generating 20 imputed datasets (Graham, 2009). The imputation model included the PUGAIS items, depressive symptoms, anxiety symptoms, insomnia symptoms, short-video addiction, age, sex, and school type. The imputed data were used in subsequent psychometric analyses, with estimates combined across datasets where supported by the analytical procedure. Complete-case analyses were conducted as sensitivity analyses. Analyses were performed using IBM SPSS Statistics version 26.0, IBM SPSS Amos version 22.0, R version 4.4.1, and Mplus version 8.3. All statistical tests were two-tailed, with p < 0.05 considered statistically significant.
The psychometric evaluation was conducted sequentially. First, CFA using maximum likelihood estimation in IBM SPSS Amos version 22.0 was performed to evaluate the hypothesized one-factor structure of the original 10-item PUGAIS. Model fit was evaluated using χ2/df, CFI, TLI, RMSEA, and SRMR. Values of χ2/df < 5.0, CFI and TLI ≥ 0.90, and RMSEA and SRMR ≤ 0.08 were considered indicative of acceptable fit (Kline, 2015).
Because the initial 10-item model did not demonstrate satisfactory fit, the sample was randomly divided into an exploratory subsample (n = 9761) and a validation subsample (n = 9723) for scale refinement and cross-validation (Y. Yu et al., 2024). The primary item-reduction EFA was conducted in the exploratory subsample using principal axis factoring based on Pearson correlations with direct oblimin rotation. Items with primary factor loadings < 0.40 or substantial cross-loadings (≥0.40) were considered for removal (Field, 2013), with the solution re-estimated after each removal. The retained eight items were summed to calculate the PUGAIS-8 total score (range = 8–32). Parallel analysis based on polychoric correlations, using 1000 simulated datasets and the 95th percentile criterion, was used to further evaluate factor retention.
Given the four-category response format, ordinal sensitivity analyses were also conducted. The EFA was repeated using polychoric correlations, and the 10-, 9-, and 8-item specifications were evaluated using WLSMV with ordered categorical indicators. The models were compared in the same validation subsample to exclude differences in sample composition. These analyses complemented rather than replaced the primary item-reduction procedure. The final PUGAIS-8 was evaluated using WLSMV CFA in the independent validation subsample. School-level clustering was examined using ICCs and a cluster-adjusted CFA with robust maximum likelihood as a sensitivity analysis.
Internal consistency was evaluated using Cronbach’s α and ordinal McDonald’s ω, and inter-item correlations were examined for potential item redundancy. Floor and ceiling effects were defined as more than 15% of participants obtaining the minimum or maximum possible score, respectively (Terwee et al., 2007). Floor and ceiling effects were additionally examined across age groups, with differences evaluated using chi-square tests. Item-level response distributions were examined to characterize responses across the four categories. Concurrent validity was assessed using Pearson correlations of PUGAIS-8 scores with depressive symptoms, anxiety symptoms, insomnia symptoms, and short-video addiction.
Measurement invariance across sex, school type, and developmentally defined age groups was examined using multigroup CFA with WLSMV estimation and ordered categorical indicators (Putnick & Bornstein, 2016). Participants were grouped into three age categories (9–10, 11–12, and 13–15 years). Those aged 7–8 or 16–17 years were excluded from the age-group invariance analysis because of the small numbers at these age extremes (n = 35 in total) but remained included in the sex- and school-type analyses. Configural, threshold, and threshold-plus-loading invariance models were tested sequentially. Model fit was evaluated using χ2, CFI, TLI, RMSEA, and SRMR, with ΔCFI, ΔRMSEA, and ΔSRMR calculated between successive models. The prespecified primary criterion for measurement invariance was |ΔCFI| ≤ 0.01 (Cheung & Rensvold, 2002).
Latent class analysis (LCA) was conducted in Mplus version 8.3 as an exploratory person-centered analysis using the eight PUGAIS-8 items as categorical indicators. The items were modeled using the default categorical mixture-model parameterization, without additional within-class residual covariances. Models with two to five classes were estimated separately using 200 random sets of starting values, with 50 retained for final-stage optimization. Model selection considered AIC, BIC, likelihood-ratio tests, entropy, class size, substantive interpretability, and reproducibility across the exploratory and validation subsamples. Lower AIC and BIC indicated better relative fit, and entropy > 0.80 indicated good classification accuracy (Nylund-Gibson & Choi, 2018). Very small classes were interpreted cautiously. The LCA was used to characterize heterogeneity in PUGAIS-8 item-response patterns rather than to establish clinically or diagnostically distinct classes; the continuous PUGAIS-8 total score remained the primary representation of individual differences in PUGAI.
Finally, ROC analysis was conducted exploratorily to descriptively quantify the correspondence between the PUGAIS-8 total score and membership in the high-score class. Because both were derived from the same PUGAIS-8 item responses, the ROC analysis was not interpreted as evidence of criterion validity, diagnostic accuracy, or screening accuracy. The threshold was selected by maximizing the Youden index, with sensitivity and specificity also reported (Akobeng, 2007). The resulting threshold was considered internally derived and descriptive and requires validation against independent external criteria.

3. Results

3.1. Participant Characteristics

The final analytic sample comprised 19,484 participants, of whom 52.8% were boys and 49.5% were primary school students. Most participants (84.6%) lived with both parents, and 5.6% attended boarding schools. Regarding parental education, 36.5% of fathers and 35.0% of mothers had completed junior high school or below as their highest level of education. In addition, 40.9% of participants reported a high or very high household income. Detailed participant characteristics are presented in Table 1.

3.2. Psychometric Evaluation of the PUGAIS

3.2.1. Factor Structure of the Original 10-Item PUGAIS

All standardized factor loadings for the original 10-item PUGAIS were statistically significant and ranged from 0.573 to 0.867 (all p < 0.001). However, the hypothesized one-factor model did not provide an acceptable overall fit to the data, χ2(35) = 11,944.535, χ2/df = 341.272, CFI = 0.920, TLI = 0.897, RMSEA = 0.132, and SRMR = 0.051. The factor structure was therefore further examined using EFA in an exploratory subsample and CFA in a separate validation subsample.

3.2.2. Factor Structure of the PUGAIS-8

An EFA was conducted in the exploratory subsample to identify a more parsimonious factor structure, which was subsequently evaluated in the independent validation subsample.
In the exploratory subsample, sampling adequacy was excellent (KMO = 0.940), and Bartlett’s test of sphericity was significant, χ2(28) = 61,915.111, p < 0.001. Original Item 1 was removed because its loading was below the prespecified criterion of 0.40 (loading = 0.309). After re-estimation, Original Item 2 was also removed (loading = 0.396). The resulting PUGAIS-8 comprised Original Items 3–10, with loadings ranging from 0.583 to 0.772 (Table 2). The one-factor solution had an eigenvalue of 5.63 and explained 70.4% of the variance. Parallel analysis based on polychoric correlations also supported retention of a single dominant factor.
In the independent validation subsample (n = 9723), ordinal CFA using WLSMV yielded χ2(20) = 4453.77, CFI = 0.957, TLI = 0.940, RMSEA = 0.142, and SRMR = 0.027, with standardized loadings ranging from 0.811 to 0.929. Thus, although CFI, TLI, and SRMR were favorable, the elevated RMSEA indicated mixed evidence regarding the fit of a strictly unidimensional measurement model.
Sensitivity analyses further examined the effect of treating the four-category responses as ordinal. The polychoric EFA yielded higher loadings for Original Items 1 and 2; thus, their loading-based removal was not reproduced under the polychoric approach, indicating that the item-reduction results were sensitive to the correlation matrix used. In the identical complete-case validation subsample (n = 9723), WLSMV comparison of the 10-, 9-, and 8-item specifications showed a more favorable overall fit pattern for the PUGAIS-8 (CFI = 0.983, TLI = 0.976, RMSEA = 0.151, and SRMR = 0.027) than for the original 10-item model (CFI = 0.967, TLI = 0.958, RMSEA = 0.163, SRMR = 0.043). The maximum absolute residual correlation also decreased from 0.124 to 0.062. Detailed results of these ordinal sensitivity analyses are presented in Supplementary S2.
School-level clustering was modest (item ICCs = 0.013–0.024; total-score ICC = 0.023). In the cluster-adjusted sensitivity CFA, standardized loadings remained substantial (0.712–0.880), with CFI = 0.952, TLI = 0.933, RMSEA = 0.124, and SRMR = 0.032, indicating that accounting for school-level clustering did not materially alter the overall pattern of findings.

3.2.3. Measurement Invariance Across Sex, School Type, and Age Groups

Measurement invariance results across sex, school type, and developmentally defined age groups are presented in Supplementary S3. For the age-group analyses, participants were categorized as 9–10 years (n = 2198), 11–12 years (n = 3379), and 13–15 years (n = 4111). Participants aged 7–8 or 16–17 years (n = 35 in total) were excluded from the age-group invariance analysis because their small numbers precluded the formation of adequately sized groups for multigroup analysis. The configural models showed CFI = 0.956, TLI = 0.938, RMSEA = 0.144, and SRMR = 0.028 across sex; CFI = 0.950, TLI = 0.930, RMSEA = 0.154, and SRMR = 0.028 across school type; and CFI = 0.950, TLI = 0.931, RMSEA = 0.154, and SRMR = 0.028 across age groups. Across the subsequent threshold and threshold-plus-loading models, CFI ranged from 0.950 to 0.956, TLI from 0.942 to 0.955, RMSEA from 0.145 to 0.179, and SRMR remained approximately 0.028. Changes in CFI between successive models were ≤0.001 and therefore below the prespecified criterion of |ΔCFI| ≤ 0.01. Based on the prespecified ΔCFI criterion, these results supported invariance of item thresholds and factor loadings across sex, school type, and the developmentally defined age groups. However, the consistently elevated RMSEA values indicate limitations in absolute model fit; therefore, the invariance findings should be interpreted cautiously. Full model-fit statistics, including χ2, degrees of freedom, and changes in RMSEA and SRMR, are reported in Supplementary S3.

3.2.4. Internal Consistency and Floor and Ceiling Effects

The PUGAIS-8 demonstrated high internal consistency in the full analytic sample (n = 19,484; Cronbach’s α = 0.940; ordinal McDonald’s ω = 0.966), with similar estimates in the exploratory (n = 9761; α = 0.939; ω = 0.965) and validation subsamples (n = 9723; α = 0.940; ω = 0.965). In the full analytic sample, inter-item Pearson correlations ranged from 0.539 to 0.800, with the strongest correlation between Items 5 and 6 (r = 0.800), suggesting potential content overlap.
A substantial floor effect was observed, with 37.8% (n = 7363) of participants obtaining the minimum possible score, whereas the ceiling effect was negligible (0.9%, n = 170). Among participants aged 9–15 years, the proportion obtaining the minimum score ranged from 28.5% to 41.0% and exceeded the 15% criterion at every age. Floor-effect prevalence differed significantly across age groups, χ2(10) = 102.51, p < 0.001, although no clear monotonic age-related pattern was observed; ceiling-effect prevalence did not differ significantly, χ2(10) = 15.34, p = 0.120. Item-level response distributions are presented in Supplementary S4 and showed a consistent concentration in the lower response categories across all eight items, indicating that the floor effect was not driven by a single item. Complete-case sensitivity analyses yielded substantively unchanged conclusions regarding the main psychometric findings.

3.2.5. Concurrent Validity

Concurrent validity was examined in the full analytic sample (n = 19,484). Individual PUGAIS-8 items were positively correlated with depressive symptoms (r = 0.304–0.361), anxiety symptoms (r = 0.293–0.357), insomnia symptoms (r = 0.300–0.336), and short-video addiction (r = 0.326–0.374; all p < 0.01).
At the scale level, higher PUGAIS-8 scores were positively associated with depressive symptoms (r = 0.396), anxiety symptoms (r = 0.387), insomnia symptoms (r = 0.365), and short-video addiction (r = 0.413; all p < 0.01). The complete correlation matrix is presented in Table 3.

3.3. Latent Class Analysis

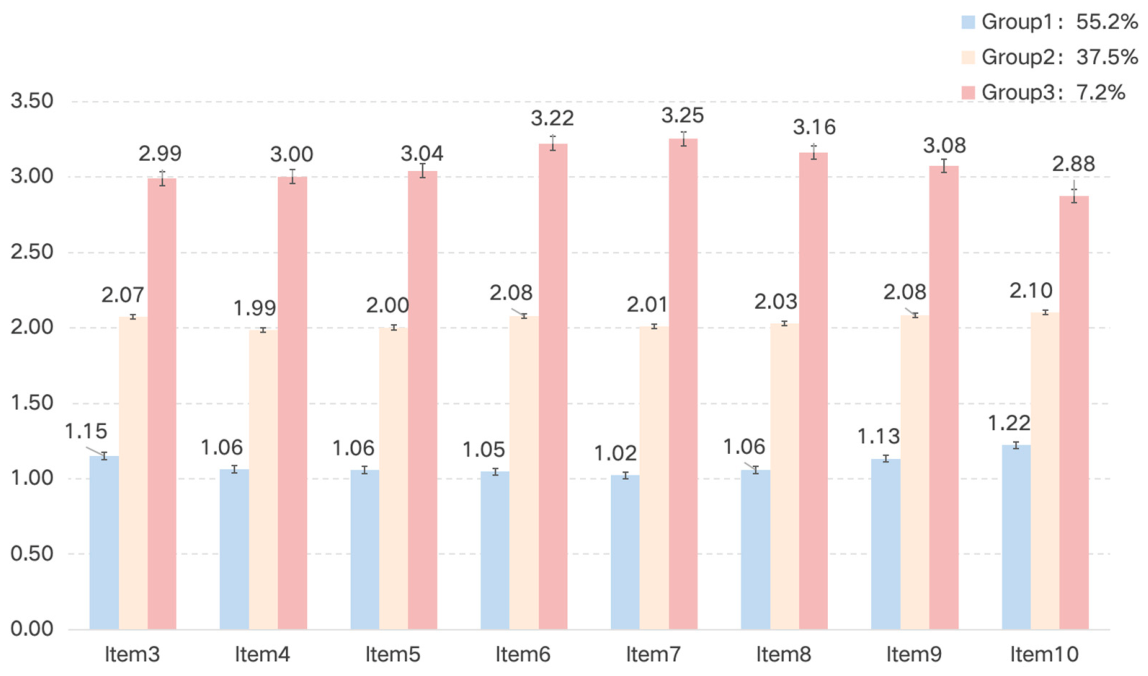
Latent class analysis (LCA) was conducted in the full analytic sample (n = 19,484) using the eight PUGAIS-8 items as class indicators. Models with two to five classes were compared. The two-class solution yielded AIC = 275,084.803, BIC = 275,281.738, entropy = 0.974, and LMRT = 86,678.403 (p = 0.333). The three-class solution yielded AIC = 239,311.047, BIC = 239,578.877, entropy = 0.980, and LMRT = 35,393.610 (p < 0.001). The four-class solution yielded AIC = 230,910.461, BIC = 231,249.187, entropy = 0.988, and LMRT = 8324.938 (p = 0.228), whereas the five-class solution yielded AIC = 226,563.273, BIC = 226,872.895, entropy = 0.971, and LMRT = 4321.437 (p = 0.138). Although AIC and BIC continued to decrease, the LMRT supported the three-class over the two-class solution but did not support the addition of a fourth or fifth class. Moreover, the four- and five-class solutions each contained a very small class (1.60% and 1.63%, respectively), raising concerns about stability and substantive interpretability. A comparable three-class solution was identified in both the exploratory and validation subsamples (Supplementary S5). Considering the information criteria, likelihood-ratio tests, classification accuracy, class sizes, substantive interpretability, and reproducibility across subsamples, the three-class solution was retained.
The three classes comprised 55.2%, 37.5%, and 7.2% of the sample and were descriptively characterized as low-score, moderate-score, and high-score classes, respectively. These classes represent relative patterns of PUGAIS-8 item endorsement within the present sample and should be interpreted as exploratory, sample-specific groupings rather than as evidence that PUGAI is inherently categorical or that the classes represent independently validated clinical or diagnostic categories. Accordingly, the continuous PUGAIS-8 total score remained the primary representation of individual differences in PUGAI, with LCA serving as a complementary person-centered characterization of item-response heterogeneity (Figure 1).

3.4. Exploratory Internally Derived Threshold for the PUGAIS-8

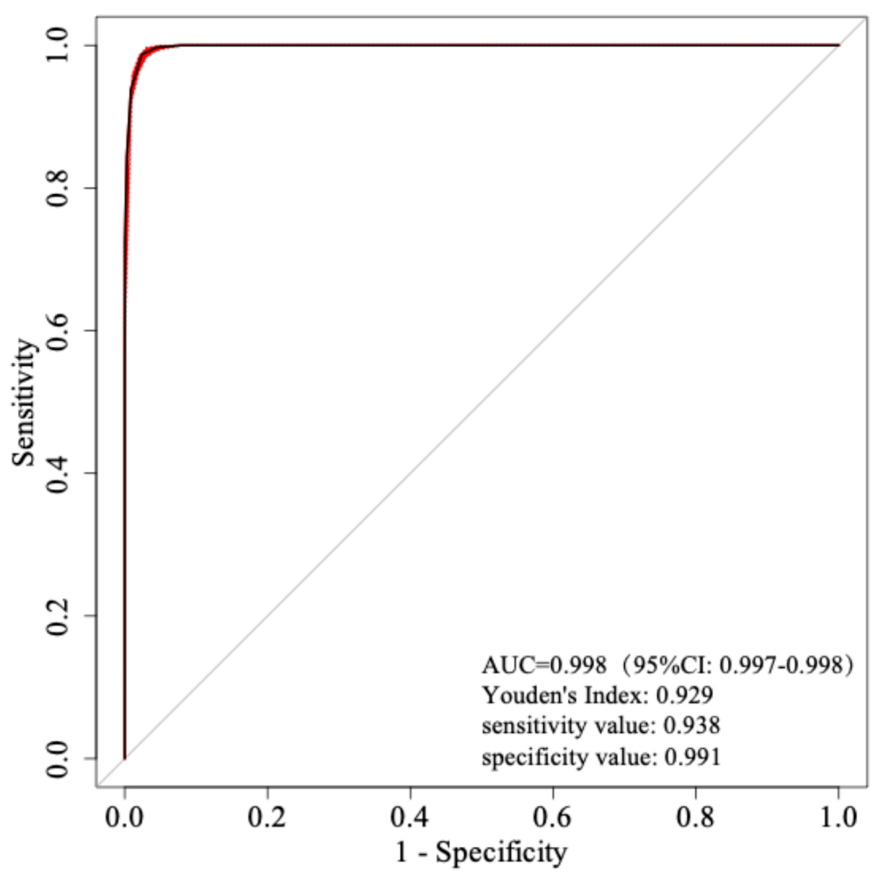
As an exploratory analysis, ROC analysis was used to descriptively quantify the correspondence between the continuous PUGAIS-8 total score and membership in the high-score class, rather than to evaluate independent classification or diagnostic performance. The AUC was 0.998 (95% CI [0.997, 0.998], p < 0.001), and the maximum Youden index (0.929) corresponded to a PUGAIS-8 score of 20.5, with a sensitivity of 0.938 and specificity of 0.991 (Figure 2). However, because both class membership and the total score were derived from the same PUGAIS-8 item responses, these estimates reflect internal correspondence rather than classification performance against an independent external criterion. Accordingly, the threshold of 20.5 should be regarded only as an exploratory, internally derived descriptive threshold and not as evidence of diagnostic or screening accuracy.

4. Discussion

The present study evaluated the psychometric properties of the PUGAIS in a large school-based sample of 19,484 Chinese school students. The hypothesized one-factor model of the original 10-item version did not demonstrate adequate fit. Subsequent EFA in the exploratory subsample resulted in the removal of two items with factor loadings below the prespecified criterion, yielding the PUGAIS-8. In the independent validation subsample, the shortened scale showed favorable CFI, TLI, and SRMR values, although the elevated RMSEA indicated mixed evidence regarding strict unidimensionality. The PUGAIS-8 also demonstrated high internal consistency, measurement invariance of item thresholds and factor loadings across sex, school type, and the included age groups, and positive associations with depressive symptoms, anxiety symptoms, insomnia symptoms, and short-video addiction. Exploratory LCA further identified three score-based classes, and ROC analysis provided an internally derived descriptive threshold. Overall, these findings provide initial evidence regarding the internal structure, reliability, measurement invariance, and relations with external variables of the PUGAIS-8 rather than comprehensive evidence for the validity of the broader PUGAI construct.
The findings also help clarify the conceptualization of PUGAI. Although the PUGAIS was adapted from an established measure of problematic technology use, features derived from such measures may not transfer uniformly to GAI. GAI is often used instrumentally for learning, information seeking, problem solving, and content generation (Bai & Wang, 2025; Lund et al., 2026; Urban et al., 2024). Accordingly, frequent, prolonged, or increasing use may reflect legitimate educational or task-related demands rather than problematic involvement. Such use becomes more relevant to PUGAI when accompanied by impaired control, distress, or meaningful functional consequences. Similarly, reliance on GAI may take reflective, cautious, and collaborative forms without necessarily indicating impaired control (Hou et al., 2025b). This distinction is particularly important for interpreting the retained items assessing increased GAI use and highlights the need for further refinement of the operationalization of PUGAI.
The item-reduction findings nevertheless require cautious interpretation. Two items were removed during the primary scale-refinement procedure because their factor loadings were below the prespecified criterion of 0.40. However, polychoric sensitivity analysis yielded higher loadings for these items, indicating sensitivity to the treatment of ordinal responses. Ordinal CFA sensitivity analyses showed a more favorable overall fit for the PUGAIS-8 than for the original 10-item specification, with higher CFI and TLI, lower RMSEA and SRMR, and smaller residual misfit. This pattern remained when the models were estimated in the identical validation subsample. Substantively, the first removed item assessed continued GAI use despite negative interpersonal consequences, which may operate differently in GAI than in socially oriented digital activities reinforced by interpersonal feedback and social rewards (Meshi et al., 2015). The second assessed longer-than-intended use, which may reflect legitimate task demands rather than impaired control. Overall, the findings support retaining the more parsimonious PUGAIS-8 while indicating that the item-reduction results are partly sensitive to analytic treatment and require independent replication.
The measurement-model findings also warrant qualification. Based on the prespecified change-in-fit criterion, the PUGAIS-8 showed invariance of item thresholds and factor loadings across sex, school type, and the included age groups (9–10, 11–12, and 13–15 years), indicating similarity of these measurement parameters across groups under the specified model. However, the elevated RMSEA values across the baseline and subsequent invariance models warrant caution regarding absolute fit. Internal consistency was high across the full analytic sample and both subsamples according to Cronbach’s α and ordinal McDonald’s ω, but high internal consistency alone is insufficient evidence of measurement quality. In particular, the strong correlation between Items 5 and 6 (r = 0.800) may indicate content overlap or local dependence. Similarly, although parallel analysis supported a dominant factor, the elevated RMSEA in both the ordinal CFA (0.142) and cluster-adjusted CFA (0.124) indicated mixed evidence regarding a strictly unidimensional measurement model despite favorable CFI, TLI, and SRMR values. Possible explanations include local dependence, relatively homogeneous item content, and model misspecification, although these possibilities were not formally tested. Thus, the findings support a dominant factor but should not be interpreted as establishing strict unidimensionality. Future studies should examine local dependence, potential item redundancy, and alternative measurement models.
The substantial floor effect further limits the measurement properties of the PUGAIS-8 at the lower end of the construct. Item-level distributions showed consistently greater endorsement of the lower response categories, indicating that the floor effect was not driven by a single item and was also evident across the major age groups. This pattern may reflect genuinely low levels of PUGAI, limited item coverage or suboptimal response thresholds, or limited GAI engagement. Because detailed measures of GAI engagement were unavailable, these explanations could not be distinguished. Future studies should incorporate measures of GAI use frequency, duration, and intensity and examine item thresholds, discrimination, and measurement precision, including whether additional GAI-specific items could improve differentiation at the lower end of the construct.
PUGAIS-8 scores showed positive cross-sectional associations with depressive symptoms, anxiety symptoms, insomnia symptoms, and short-video addiction, broadly consistent with previous evidence linking problematic forms of digital technology use with psychological and behavioral correlates (Burkauskas et al., 2022; Sun et al., 2024). The moderate correlations indicate that PUGAIS-8 scores covaried with, while remaining distinguishable from, these constructs in the present sample. However, the cross-sectional design precludes conclusions regarding temporal ordering or causality. These findings provide preliminary evidence of theoretically expected associations within the nomological network of PUGAI, but broader construct validity requires additional evidence (Clark & Watson, 2019; Flake et al., 2017). The substantial intercorrelations among the mental health measures should also be considered, and these measures were not specifically selected to evaluate convergent or discriminant validity. An independent external criterion for criterion-related validity was also unavailable (Boateng et al., 2018). Future studies incorporating theoretically targeted comparison measures, independent indicators of functional impairment, and longitudinal data are needed to evaluate the convergent, discriminant, incremental, and criterion-related validity of the PUGAIS-8.
The exploratory LCA suggested heterogeneity in PUGAIS-8 item-response patterns, with 7.2% of participants classified into the high-score class. Because the classes were derived from the same item responses, they should be interpreted as exploratory, sample-specific groupings rather than as evidence that PUGAI is inherently categorical or as independently validated behavioral subtypes or risk groups. The comparable three-class solution observed across the exploratory and validation subsamples provides some evidence of stability within the present dataset, but independent replication and examination of external functional outcomes and longitudinal trajectories are needed.
Similarly, the ROC-derived threshold of 20.5 should be interpreted cautiously. Both the high-score class used as the reference and the PUGAIS-8 total score were derived from the same item responses; therefore, the very high AUC primarily reflects their internal correspondence rather than independent classification accuracy or criterion validity. The threshold should consequently be regarded only as exploratory, internally derived, and descriptive. Independent validation against external criteria, such as functional impairment or independently assessed difficulties in controlling GAI use, is required before considering its use for screening or clinical purposes. Neither the high-score class nor the threshold establishes a clinical diagnosis or a distinct behavioral addiction. Although the term generative artificial intelligence addiction syndrome has recently been proposed (Kooli et al., 2025), evidence regarding its clinical validity and diagnostic boundaries remains limited.
The findings have implications primarily for future research. The PUGAIS-8 provides a brief measure for studying problematic patterns of GAI use among school students, and its measurement invariance may facilitate comparisons across sex, school type, and the included age groups. However, its substantial floor effect limits fine-grained differentiation at lower scores. More broadly, the findings reinforce the distinction between problematic use and frequent, intensive, or increasing GAI engagement. Future school-based research could examine whether approaches promoting self-regulated and critically reflective GAI use are useful and whether students showing persistent control difficulties together with functional problems may benefit from more targeted support. These possibilities require prospective and intervention-based evaluation and should not currently be used to assign students to intervention levels or guide clinical decisions.
Several limitations should be considered. First, the absence of an independent clinical or functional criterion precluded external validation of the LCA-derived high-score class and ROC threshold. Second, the cross-sectional design precludes conclusions about temporal or causal relationships; longitudinal studies are needed. Third, the sample was recruited from Grades 4–9 in a single city in Zhejiang Province, China, limiting geographical, developmental, and cultural generalizability. Independent replication in more diverse samples is therefore required. Fourth, test–retest data were unavailable, precluding evaluation of temporal stability. Fifth, because the PUGAIS was adapted from the SAS-SV, it may not fully capture GAI-specific features; in particular, the retained increased-use items require further evaluation because increased use alone does not necessarily indicate PUGAI. Sixth, peer interaction was not assessed. Finally, the substantial floor effect and absence of detailed GAI engagement measures limited interpretation of lower scores. Future research using item response theory may help clarify item thresholds, discrimination, and measurement precision across the latent continuum.

5. Conclusions

The present study provides initial psychometric support for the PUGAIS-8 as a brief measure of PUGAI among Chinese school students. The findings support a dominant factor, although the elevated RMSEA indicates mixed evidence regarding a strictly unidimensional measurement model. The scale showed high internal consistency and measurement invariance across sex, school type, and the included age groups. Although the item-reduction results were partly sensitive to analytic treatment, sensitivity analyses showed more favorable overall structural fit for the PUGAIS-8 than for the original 10-item version. The substantial floor effect limits differentiation at lower scores, and the ROC-derived threshold should be considered preliminary and descriptive. Further independent, longitudinal, and criterion-based validation is needed to establish the validity, generalizability, and measurement precision of the PUGAIS-8.

Supplementary Materials

The following supporting information can be downloaded at: https://www.mdpi.com/article/10.3390/bs16101763/s1, Supplementary S1: 1. Chinese version of PUGAIS. 2. Chinese version of PUGAIS-8. Supplementary S2: Sensitivity comparison of the 10-item, 9-item, and 8-item PUGAIS specifications using WLSMV estimation in the identical validation subsample (n = 9723). Supplementary S3: Measurement invariance of the PUGAIS-8 across sex, school type, and age groups. Supplementary S4: Item-level response distributions of the PUGAIS-8 in the full analytic sample (n = 19,484). Supplementary S5: Cross-validation summary of model fit using the exploratory and validation subsamples: first subsample (n = 9761) and second subsample (n = 9723). Supplementary S6: Analytical Syntax.

Author Contributions

Conceptualization, Y.W. and J.T.F.L.; methodology, Y.W. and J.T.F.L.; validation, J.T.F.L.; formal analysis, Y.W. and J.H.; investigation, J.H., D.B.W., H.S., X.L., T.Y., M.P., H.Y., and Y.Y.; resources, D.B.W.; data curation, J.H., D.B.W., H.S., X.L., T.Y., M.P., H.Y., and Y.Y.; writing—original draft preparation, Y.W. and J.T.F.L.; writing—review and editing, Y.W. and J.T.F.L.; supervision, J.T.F.L.; funding acquisition, J.T.F.L. All authors have read and agreed to the published version of the manuscript.

Funding

This research received no external funding.

Institutional Review Board Statement

The study was conducted in accordance with the Declaration of Helsinki and approved by the Medical Ethics Committee of the Affiliated Kangning Hospital of Wenzhou Medical University (approval No. YJ-2024-21-02; approval date: 14 May 2024).

Informed Consent Statement

Written informed consent was obtained from the participants’ parents or legal guardians, and written informed assent was obtained from the participating students prior to data collection.

Data Availability Statement

Participant-level data are not publicly available because the study involved minors and data sharing is restricted by the applicable ethical and informed-consent requirements. Detailed information on scale scoring, statistical procedures, software, estimators, and model specifications is provided in the Methods and Supplementary Materials to facilitate reproducibility. Additional methodological information may be provided by the corresponding author upon reasonable request, where appropriate.

Conflicts of Interest

The authors declare no conflicts of interest.

Abbreviations

The following abbreviations are used in this manuscript:
AICAkaike information criterion
AUCArea under the curve
BICBayesian information criterion
CFAConfirmatory factor analysis
CFIComparative fit index
EFAExploratory factor analysis
GAD-77-item Generalized Anxiety Disorder scale
GAIGenerative artificial intelligence
ISIInsomnia severity index
KMOKaiser–Meyer–Olkin measure of sampling adequacy
LCALatent class analysis
LMRTLo–Mendell–Rubin adjusted likelihood ratio test
MIMultiple imputation
PHQ-99-item Patient Health Questionnaire
PUGAIProblematic Use of Generative Artificial Intelligence
PUGAISProblematic Use of Generative Artificial Intelligence Scale
PUGAIS-88-item Problematic Use of Generative Artificial Intelligence Scale
ROCReceiver operating characteristic
RMSEARoot mean square error of approximation
SAS-SVSmartphone Addiction Scale—Short Version
SRMRStandardized root mean square residual
SVAShort-video addiction
TLITucker–Lewis Index

References

  1. Akobeng, A. K. (2007). Understanding diagnostic tests 3: Receiver operating characteristic curves. Acta Paediatrica, 96(5), 644–647. [Google Scholar] [CrossRef] [Scilit] [PubMed]
  2. Andreassen, C. S., Torsheim, T., Brunborg, G. S., & Pallesen, S. (2012). Development of a Facebook addiction scale. Psychological Reports, 110(2), 501–517. [Google Scholar] [CrossRef] [Scilit] [PubMed]
  3. Bai, Y., & Wang, S. (2025). Impact of generative AI interaction and output quality on university students’ learning outcomes: A technology-mediated and motivation-driven approach. Scientific Reports, 15, 24054. [Google Scholar] [CrossRef] [Scilit] [PubMed]
  4. Boateng, G. O., Neilands, T. B., Frongillo, E. A., Melgar-Quiñonez, H. R., & Young, S. L. (2018). Best practices for developing and validating scales for health, social, and behavioral research: A primer. Frontiers in Public Health, 6, 149. [Google Scholar] [CrossRef] [Scilit] [PubMed]
  5. Bommasani, R., Hudson, D. A., Adeli, E., Altman, R., Arora, S., von Arx, S., Bernstein, M. S., Bohg, J., Bosselut, A., Brunskill, E., Buch, S., Card, D., Castellon, R., Chatterji, N., Chen, A., Creel, K., Davis, J. Q., Demszky, D., Donahue, J., … Liang, P. (2021). On the opportunities and risks of foundation models. arXiv, arXiv:2108.07258. [Google Scholar] [CrossRef] [Scilit]
  6. Brand, M., Wegmann, E., Stark, R., Müller, A., Wölfling, K., Robbins, T. W., & Potenza, M. N. (2019). The Interaction of Person-Affect-Cognition-Execution (I-PACE) model for addictive behaviors: Update, generalization to addictive behaviors beyond internet-use disorders, and specification of the process character of addictive behaviors. Neuroscience & Biobehavioral Reviews, 104, 1–10. [Google Scholar] [CrossRef] [Scilit] [PubMed]
  7. Burkauskas, J., Gecaite-Stonciene, J., Demetrovics, Z., Griffiths, M. D., & Király, O. (2022). Prevalence of problematic Internet use during the coronavirus disease 2019 pandemic. Current Opinion in Behavioral Sciences, 46, 101179. [Google Scholar] [CrossRef] [Scilit] [PubMed]
  8. Chen, Y., Wang, M., Yuan, S., & Zhao, Y. (2025). Development and validation of the conversational AI dependence scale for Chinese college students. Frontiers in Psychology, 16, 1621540, (Correction in 2025, Frontiers in Psychology, 16, 1700281). [Google Scholar] [CrossRef] [Scilit] [PubMed]
  9. Chen, Y. H. (2025). Exploring the influence of generative artificial intelligence anxiety on problematic ChatGPT use: The fear of missing out and personality traits. Universal Access in the Information Society, 24, 2477–2490. [Google Scholar] [CrossRef] [Scilit]
  10. Cheung, G. W., & Rensvold, R. B. (2002). Evaluating goodness-of-fit indexes for testing measurement invariance. Structural Equation Modeling: A Multidisciplinary Journal, 9(2), 233–255. [Google Scholar] [CrossRef] [Scilit] [PubMed]
  11. Clark, L. A., & Watson, D. (2019). Constructing validity: New developments in creating objective measuring instruments. Psychological Assessment, 31(12), 1412–1427. [Google Scholar] [CrossRef] [Scilit] [PubMed]
  12. Common Sense Media. (2024). The dawn of the AI era: Teens, parents, and the adoption of generative AI at home and school. Available online: https://www.commonsensemedia.org/research/the-dawn-of-the-ai-era-teens-parents-and-the-adoption-of-generative-ai-at-home-and-school (accessed on 25 November 2025).
  13. Conde, M. Á., García-Pascual, R., Rodríguez-Sedano, F. J., & Román-Gallego, J.-Á. (2026). Expanding the lens: Multi-institutional evidence on student use of ChatGPT in higher education. Universal Access in the Information Society, 25, 48. [Google Scholar] [CrossRef] [Scilit]
  14. Dorta-González, P., López-Puig, A. J., Dorta-González, M. I., & González-Betancor, S. M. (2024). Generative artificial intelligence usage by researchers at work: Effects of gender, career stage, type of workplace, and perceived barriers. Telematics and Informatics, 94, 102187. [Google Scholar] [CrossRef] [Scilit]
  15. Dwivedi, Y. K., Kshetri, N., Hughes, L., Slade, E. L., Jeyaraj, A., Kar, A. K., Baabdullah, A. M., Koohang, A., Raghavan, V., Ahuja, M., Albanna, H., Albashrawi, M. A., Al-Busaidi, A. S., Balakrishnan, J., Barlette, Y., Basu, S., Bose, I., Brooks, L., Buhalis, D., … Wright, R. (2023). Opinion paper: “So what if ChatGPT wrote it?” Multidisciplinary perspectives on opportunities, challenges and implications of generative conversational AI for research, practice and policy. International Journal of Information Management, 71, 102642. [Google Scholar] [CrossRef] [Scilit]
  16. Field, A. (2013). Discovering statistics using IBM SPSS statistics (4th ed.). SAGE. [Google Scholar]
  17. Flake, J. K., Pek, J., & Hehman, E. (2017). Construct validation in social and personality research: Current practice and recommendations. Social Psychological and Personality Science, 8(4), 370–378. [Google Scholar] [CrossRef] [Scilit]
  18. Gagnon, C., Bélanger, L., Ivers, H., & Morin, C. M. (2013). Validation of the Insomnia Severity Index in primary care. The Journal of the American Board of Family Medicine, 26(6), 701–710. [Google Scholar] [CrossRef] [Scilit] [PubMed]
  19. Graham, J. W. (2009). Missing data analysis: Making it work in the real world. Annual Review of Psychology, 60, 549–576. [Google Scholar] [CrossRef] [Scilit] [PubMed]
  20. Griffiths, M. (2005). A ‘components’ model of addiction within a biopsychosocial framework. Journal of Substance Use, 10(4), 191–197. [Google Scholar] [CrossRef] [Scilit]
  21. Guo, X., McCutcheon, R., Pillinger, T., Arumuham, A., Chen, J., Ma, S., Yang, J., Wang, Y., Hu, S., Wang, G., & Liu, Z. C. (2021). Acute psychological impact of coronavirus disease 2019 outbreak among psychiatric professionals in China: A multicentre, cross-sectional, web-based study. BMJ Open, 11(5), e047828. [Google Scholar] [CrossRef] [Scilit] [PubMed]
  22. Hermann, E., & Puntoni, S. (2024). Artificial intelligence and consumer behavior: From predictive to generative AI. Journal of Business Research, 180, 114720. [Google Scholar] [CrossRef] [Scilit]
  23. Hou, C., Zhu, G., & Sudarshan, V. (2025a). The role of critical thinking on undergraduates’ reliance behaviours on generative AI in problem-solving. British Journal of Educational Technology, 56(5), 1919–1941. [Google Scholar] [CrossRef] [Scilit]
  24. Hou, C., Zhu, G., Sudarshan, V., Lim, F. S., & Ong, Y. S. (2025b). Measuring undergraduate students’ reliance on generative AI during problem-solving: Scale development and validation. Computers & Education, 234, 105329. [Google Scholar] [CrossRef] [Scilit]
  25. Huang, S., Lai, X., Ke, L., Li, Y., Wang, H., Zhao, X., Dai, X., & Wang, Y. (2024). AI technology panic—Is AI dependence bad for mental health? A cross-lagged panel model and the mediating roles of motivations for AI use among adolescents. Psychology Research and Behavior Management, 17, 1087–1102. [Google Scholar] [CrossRef] [Scilit] [PubMed]
  26. Huang, Y., & Huang, H. (2025). Exploring the effect of attachment on technology addiction to generative AI chatbots: A structural equation modeling analysis. International Journal of Human–Computer Interaction, 41(15), 9440–9449. [Google Scholar] [CrossRef] [Scilit]
  27. Kline, R. B. (2015). Principles and practice of structural equation modeling (4th ed.). Guilford Press. [Google Scholar]
  28. Kolding, S., Lundin, R. M., Hansen, L., & Østergaard, S. D. (2025). Use of generative artificial intelligence (AI) in psychiatry and mental health care: A systematic review. Acta Neuropsychiatrica, 37, e37. [Google Scholar] [CrossRef] [Scilit] [PubMed]
  29. Kooli, C., Kooli, Y., & Kooli, E. (2025). Generative artificial intelligence addiction syndrome: A new behavioral disorder? Asian Journal of Psychiatry, 107, 104476. [Google Scholar] [CrossRef] [Scilit] [PubMed]
  30. Kroenke, K., Spitzer, R. L., & Williams, J. B. (2001). The PHQ-9: Validity of a brief depression severity measure. Journal of General Internal Medicine, 16(9), 606–613. [Google Scholar] [CrossRef] [Scilit] [PubMed]
  31. Kwon, M., Kim, D. J., Cho, H., & Yang, S. (2013). The smartphone addiction scale: Development and validation of a short version for adolescents. PLoS ONE, 8(12), e83558. [Google Scholar] [CrossRef] [Scilit] [PubMed]
  32. Lai, C., Cai, P., Liao, J., Li, X., Wang, Y., Wang, M., Ye, P., Chen, X., Hambly, B. D., Yu, X., Bao, S., & Zhang, H. (2025). Exploring the relationship between physical activity and smartphone addiction among college students in Western China. Frontiers in Public Health, 13, 1530947. [Google Scholar] [CrossRef] [Scilit] [PubMed]
  33. Liao, H. Y., Ko, C. H., & Yen, C. F. (2026). Problematic ChatGPT use: Manifestations, etiologies, and evaluation. Biomedical Journal, 49(4), 100998. [Google Scholar] [CrossRef] [Scilit] [PubMed]
  34. Lin, C. D. (2018). Developmental psychology (3rd ed.). People’s Education Press. [Google Scholar]
  35. Löwe, B., Decker, O., Müller, S., Brähler, E., Schellberg, D., Herzog, W., & Herzberg, P. Y. (2008). Validation and standardization of the Generalized Anxiety Disorder Screener (GAD-7) in the general population. Medical Care, 46(3), 266–274. [Google Scholar] [CrossRef] [Scilit] [PubMed]
  36. Lund, B. D., Teel, Z. A., Mohammed, Y., Jagathpally, A., & Wang, T. (2026). Artificial intelligence (AI) and information seeking: A comparative exploration of AI chatbots, search engines, and library resources as information sources among university students. Journal of Librarianship and Information Science. Advance online publication. [Google Scholar] [CrossRef] [Scilit]
  37. Meshi, D., Tamir, D. I., & Heekeren, H. R. (2015). The emerging neuroscience of social media. Trends in Cognitive Sciences, 19(12), 771–782. [Google Scholar] [CrossRef] [Scilit] [PubMed]
  38. Miranda, J. P. P., Bansil, J. A., Fernando, E. Q., Gamboa, A. B., Hernandez, H. E., Cruz, M. A., Dianelo, R. F. B., Gonzales, D. D., & Penecilla, E. M. (2024, September 12–13). Prevalence, devices used, reasons for use, trust, barriers, and challenges in utilizing generative AI among tertiary students [Conference session]. 2024 2nd International Conference on Technology Innovation and Its Applications (ICTIIA) (pp. 1–6), Medan, Indonesia. [Google Scholar] [CrossRef] [Scilit]
  39. Morin, C. M. (1993). Insomnia: Psychological assessment and management. Guilford Press. [Google Scholar]
  40. Müller, S. M., Wegmann, E., Oelker, A., Stark, R., Müller, A., Montag, C., Wölfling, K., Rumpf, H.-J., & Brand, M. (2022). Assessment of Criteria for Specific Internet-use Disorders (ACSID-11): Introduction of a new screening instrument capturing ICD-11 criteria for gaming disorder and other potential Internet-use disorders. Journal of Behavioral Addictions, 11(2), 427–450. [Google Scholar] [CrossRef] [Scilit] [PubMed]
  41. Nylund-Gibson, K., & Choi, A. Y. (2018). Ten frequently asked questions about latent class analysis. Translational Issues in Psychological Science, 4(4), 440–461. [Google Scholar] [CrossRef] [Scilit]
  42. Putnick, D. L., & Bornstein, M. H. (2016). Measurement invariance conventions and reporting: The state of the art and future directions for psychological research. Developmental Review, 41, 71–90. [Google Scholar] [CrossRef] [Scilit] [PubMed]
  43. Salah, M., Abdelfattah, F., & Al Halbusi, H. (2024). The good, the bad, and the GPT: Reviewing the impact of generative artificial intelligence on psychology. Current Opinion in Psychology, 59, 101872. [Google Scholar] [CrossRef] [Scilit] [PubMed]
  44. Sun, R., Zhang, M. X., Yeh, C., Ung, C. O. L., & Wu, A. M. S. (2024). The metacognitive-motivational links between stress and short-form video addiction. Technology in Society, 77, 102548. [Google Scholar] [CrossRef] [Scilit]
  45. Terwee, C. B., Bot, S. D., de Boer, M. R., van der Windt, D. A. W. M., Knol, D. L., Dekker, J., Bouter, L. M., & de Vet, H. C. W. (2007). Quality criteria were proposed for measurement properties of health status questionnaires. Journal of Clinical Epidemiology, 60(1), 34–42. [Google Scholar] [CrossRef] [Scilit] [PubMed]
  46. Thurzo, A. (2025). How is AI transforming medical research, education and practice? Bratislava Medical Journal, 126, 243–248. [Google Scholar] [CrossRef] [Scilit]
  47. Tong, X., An, D., McGonigal, A., Park, S. P., & Zhou, D. (2016). Validation of the Generalized Anxiety Disorder-7 (GAD-7) among Chinese people with epilepsy. Epilepsy Research, 120, 31–36. [Google Scholar] [CrossRef] [Scilit] [PubMed]
  48. Urban, M., Děchtěrenko, F., Lukavský, J., Hrabalová, V., Svacha, F., Brom, C., & Urban, K. (2024). ChatGPT improves creative problem-solving performance in university students: An experimental study. Computers & Education, 215, 105031. [Google Scholar] [CrossRef] [Scilit]
  49. Xian, X., Chang, A., Xiang, Y. T., & Liu, M. T. (2024). Debate and dilemmas regarding generative AI in mental health care: Scoping review. Interactive Journal of Medical Research, 13, e53672. [Google Scholar] [CrossRef] [Scilit] [PubMed]
  50. Xiang, M. Q., Wang, Z. R., & Ma, B. (2019). Reliability and validity of the Chinese version of the smartphone addiction scale in adolescents. Chinese Journal of Clinical Psychology, 27(5), 959–964. [Google Scholar] [CrossRef]
  51. Xie, Y., Zeng, F., & Dai, Z. (2024). The links among cumulative ecological risk and smartphone addiction, sleep quality in Chinese university freshmen: A two-wave study. Psychology Research and Behavior Management, 17, 379–392. [Google Scholar] [CrossRef] [Scilit] [PubMed]
  52. Yu, S. C., Chen, H. R., & Yang, Y. W. (2024). Development and validation the problematic ChatGPT use scale: A preliminary report. Current Psychology, 43, 26080–26092. [Google Scholar] [CrossRef] [Scilit]
  53. Yu, Y., Chen, J. H., Lau, J. T. F., Wu, A. M. S., Du, M., Chen, Y., Chen, B., Du, M., Zhang, G., Wang, D. B., & Du, D. (2024). Validation of the school refusal assessment scale-revised (SRAS-R) in the general adolescent population in China. School Mental Health: A Multidisciplinary Research and Practice Journal, 16(2), 436–446. [Google Scholar] [CrossRef] [Scilit]
  54. Zhang, Y. L., Liang, W., Chen, Z. M., Zhang, H. M., Zhang, J. H., Weng, X. Q., Yang, S. C., Zhang, L., Shen, L. J., & Zhang, Y. L. (2013). Validity and reliability of patient health questionnaire-9 and patient health questionnaire-2 to screen for depression among college students in China. Asia-Pacific Psychiatry: Official Journal of the Pacific Rim College of Psychiatrists, 5(4), 268–275. [Google Scholar] [CrossRef] [Scilit] [PubMed]
  55. Zhou, T., & Zhang, C. (2024). Examining generative AI user addiction from a CAC perspective. Technology in Society, 78, 102653. [Google Scholar] [CrossRef] [Scilit]
Figure 1. Latent class analysis results for the PUGAIS-8.
Behavsci 16 01763 g001
Figure 2. Exploratory receiver operating characteristic analysis of the PUGAIS-8 using the internally derived high-score class classification.
Behavsci 16 01763 g002
Table 1. Participant characteristics of Chinese school students who had ever used generative artificial intelligence (n = 19,484).
n%
Sex
Male10,29052.80%
Female919447.20%
School type
Primary school964049.50%
Secondary school984450.50%
Living with parents
With both parents16,42784.60%
With mother only12396.40%
With father only6373.30%
Not living with any parents11035.70%
Father’s education level
Junior high school or below708836.50%
Senior high school or equal541127.80%
College or above586930.20%
Mother’s education level
Junior high school or below681335.00%
Senior high school or equal507026.10%
College or above651233.50%
Self-reported academic performance
Lowest (Bottom 20%)12986.70%
Lower-middle (Bottom 21–40%)348818.00%
Middle (Middle 20%)397320.40%
Upper-middle (Top 21–40%)596930.70%
Top (Top 20%)470124.20%
Self-reported family income level
Very low/low12096.20%
Average940248.40%
High/very high794440.90%
Not reported8684.50%
Boarding school students
Yes10975.60%
No18,34594.40%
Table 2. Original item numbers and exploratory and confirmatory factor loadings of the retained PUGAIS-8 items in the exploratory and validation subsamples.
Final PUGAIS-8 ItemsOriginal PUGAIS ItemEFA (n = 9761)
(Factor Loading)
CFA (n = 9723)
(β)
Item 1. I have tried to spend less time using GAI tools, but I have been unable to do so.Original Item 30.5830.811
Item 2. I have experienced physical discomfort, such as sore eyes or muscle aches, due to prolonged use of GAI tools.Original Item 40.6590.858
Item 3. I habitually use GAI tools before going to sleep, which has reduced my sleep time or worsened my sleep quality.Original Item 50.7190.895
Item 4. My use of GAI tools has had negative effects on my academic or work performance.Original Item 60.7420.905
Item 5. I would feel distressed if I were suddenly restricted from using GAI tools.Original Item 70.7540.917
Item 6. I feel psychologically uncomfortable if I do not use GAI tools for a period of time.Original Item 80.7720.929
Item 7. I have noticed that the amount of time I spend using GAI tools has been increasing.Original Item 90.7490.906
Item 8. Compared with three months ago, the average amount of time I spend using GAI tools each week has increased substantially.Original Item 100.6560.861
Variance explained (%) 70.413%
Table 3. Item-level and scale-level correlations of the PUGAIS-8 with external variables.
Item 1Item 2Item 3Item 4Item 5Item 6Item 7Item 8PUGAIDepressive SymptomsAnxiety SymptomsInsomnia Symptoms
Item 11
Item 20.651 **1
Item 30.627 **0.695 **1
Item 40.617 **0.688 **0.743 **1
Item 50.594 **0.635 **0.697 **0.715 **1
Item 60.594 **0.636 **0.690 **0.723 **0.800 **1
Item 70.584 **0.607 **0.667 **0.685 **0.744 **0.770 **1
Item 80.547 **0.569 **0.611 **0.629 **0.669 **0.700 **0.751 **1
PUGAI0.778 **0.817 **0.850 **0.860 **0.869 **0.877 **0.862 **0.815 **1
Depressive symptoms0.304 **0.332 **0.321 **0.320 **0.361 **0.360 **0.337 **0.327 **0.396 **1
Anxiety symptoms0.293 **0.318 **0.312 **0.308 **0.354 **0.357 **0.335 **0.322 **0.387 **0.817 **1
Insomnia symptoms0.300 **0.315 **0.315 **0.310 **0.331 **0.336 **0.321 **0.303 **0.365 **0.711 **0.656 **1
Short video addiction0.331 **0.326 **0.334 **0.337 **0.374 **0.368 **0.360 **0.350 **0.413 **0.528 **0.514 **0.463 **
“**” indicates p < 0.01.
Disclaimer/Publisher’s Note: The statements, opinions and data contained in all publications are solely those of the individual author(s) and contributor(s) and not of MDPI and/or the editor(s). MDPI and/or the editor(s) disclaim responsibility for any injury to people or property resulting from any ideas, methods, instructions or products referred to in the content.