
The Effects of Landmark Salience on Drivers’ Spatial Cognition and Takeover Performance in Autonomous Driving Scenarios

Abstract
1. Introduction
1.1. Research Background
1.2. Literature Review
1.2.1. How Does Driving Performance Differ Between Autonomous and Manual Driving?
1.2.2. Autonomous Driving and Takeover
1.2.3. Autonomous Driving and Landmarks
1.3. Research Questions and Hypotheses
1.4. Significance of the Study
2. Experiment 1
2.1. Methods
2.1.1. Participants
2.1.2. Design
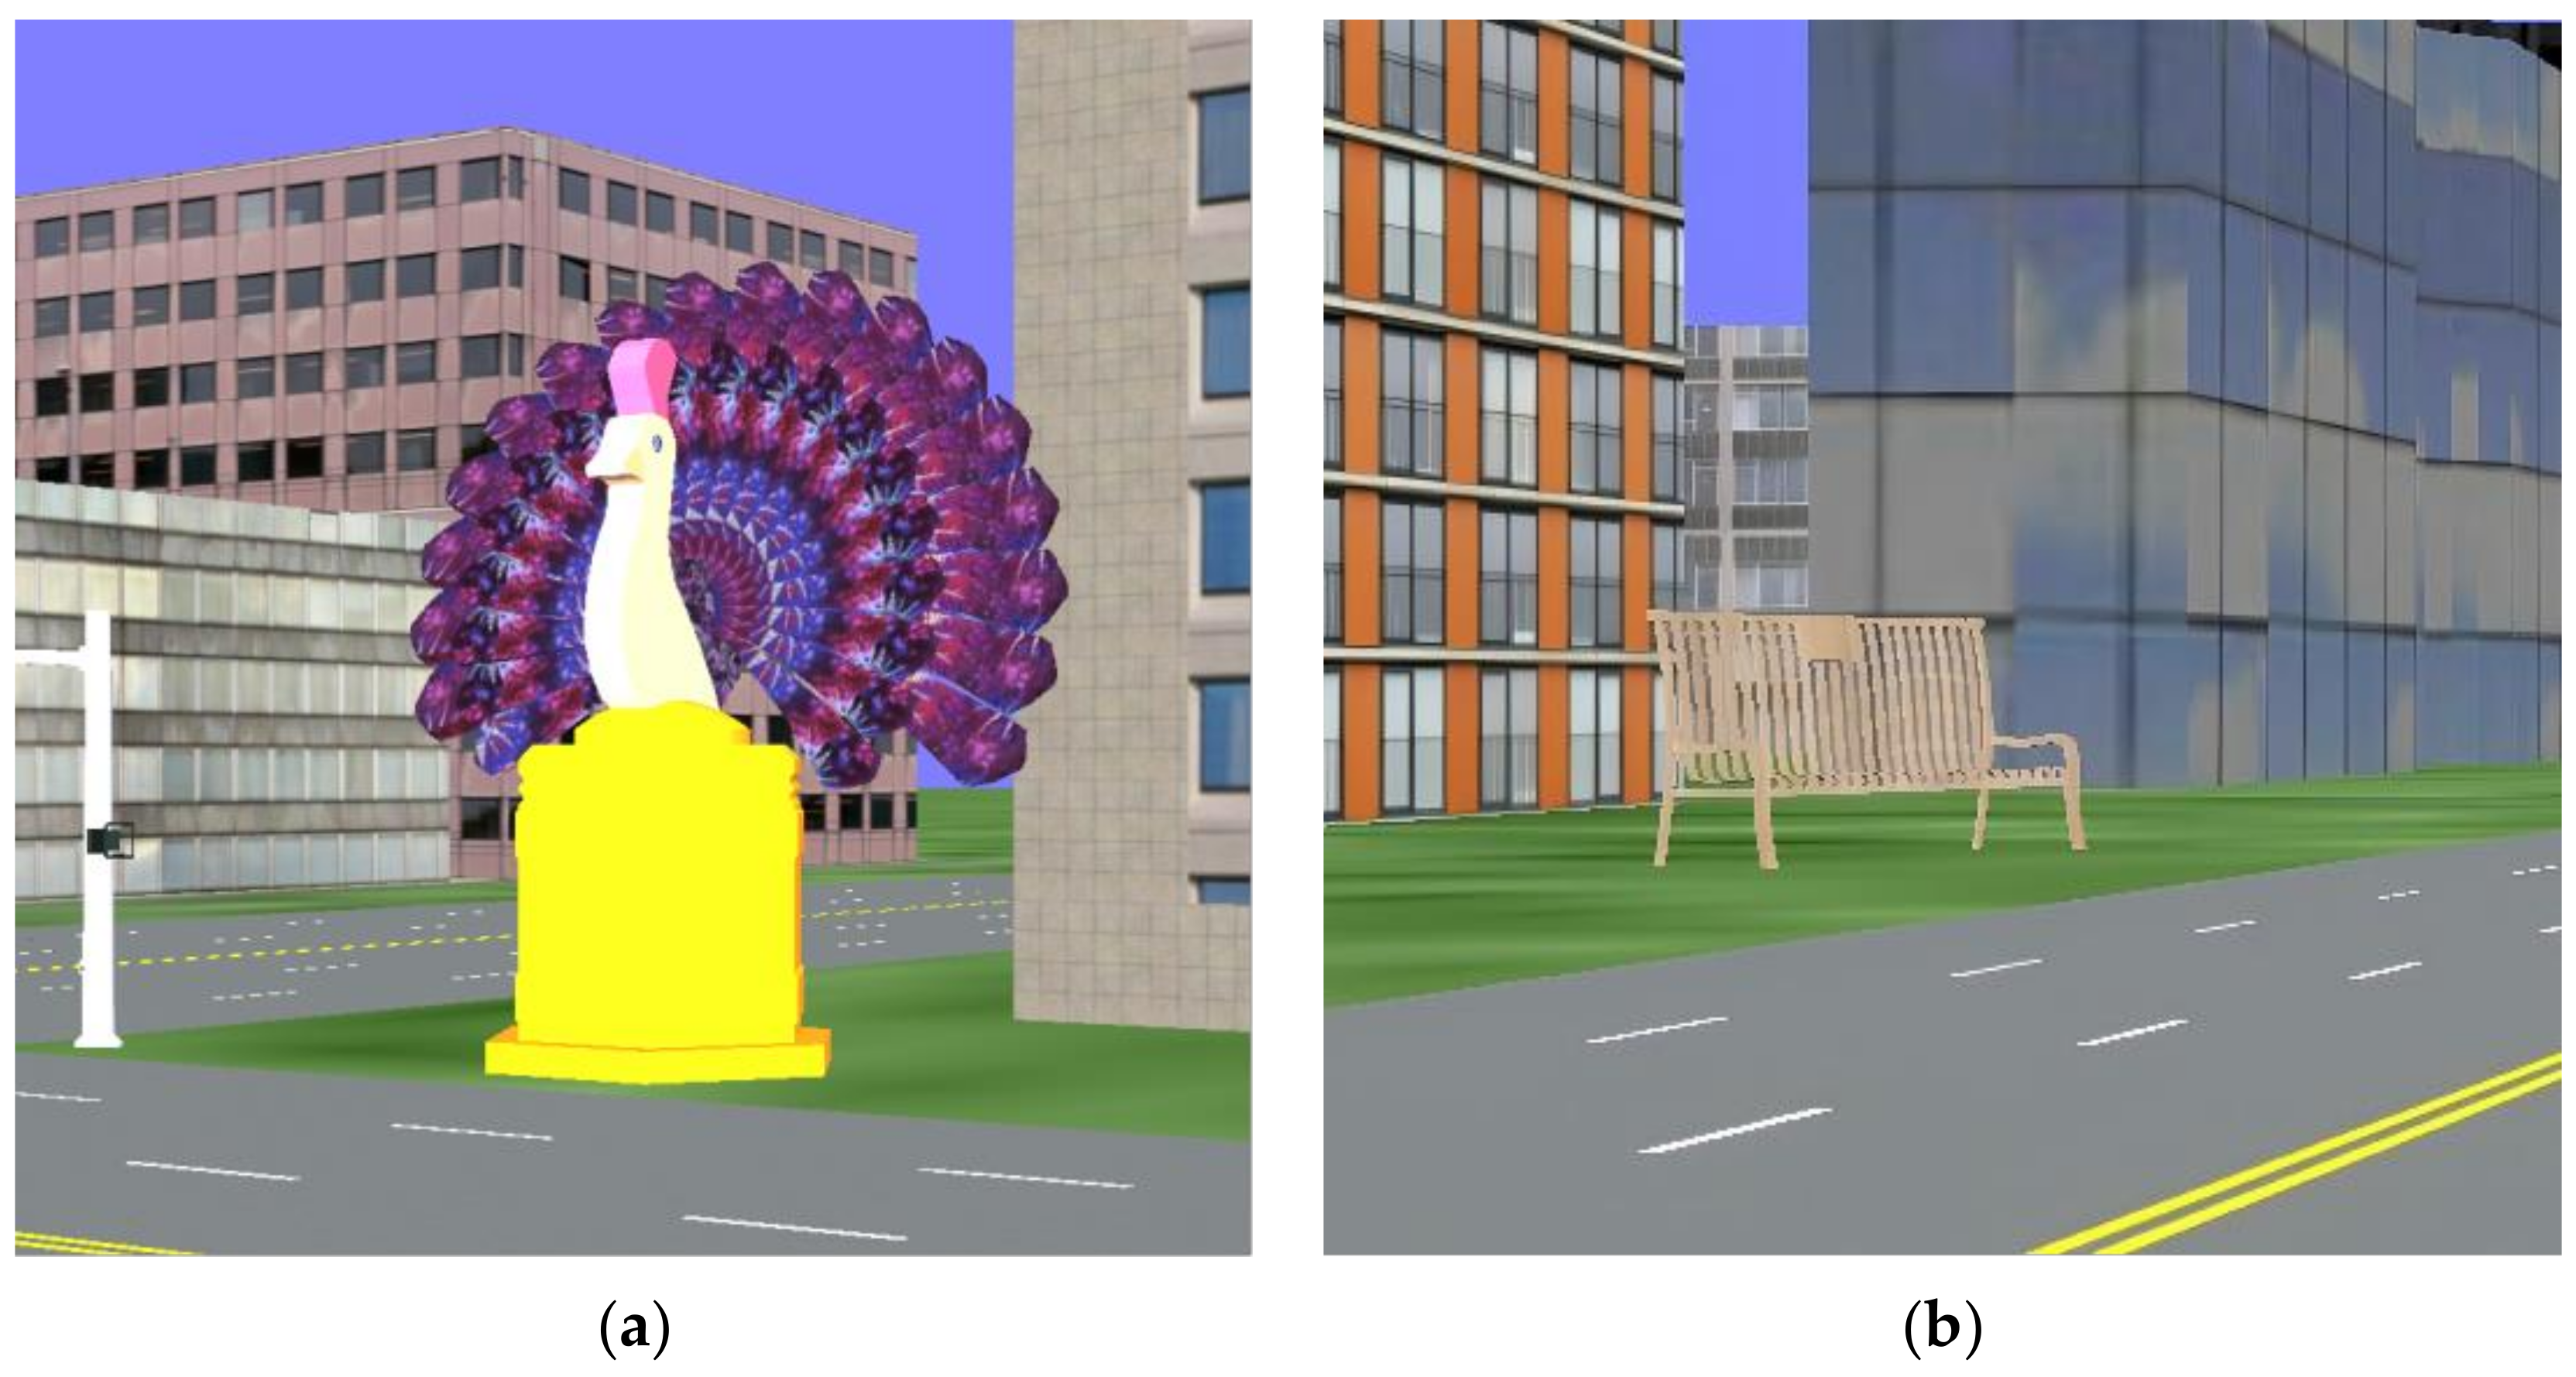
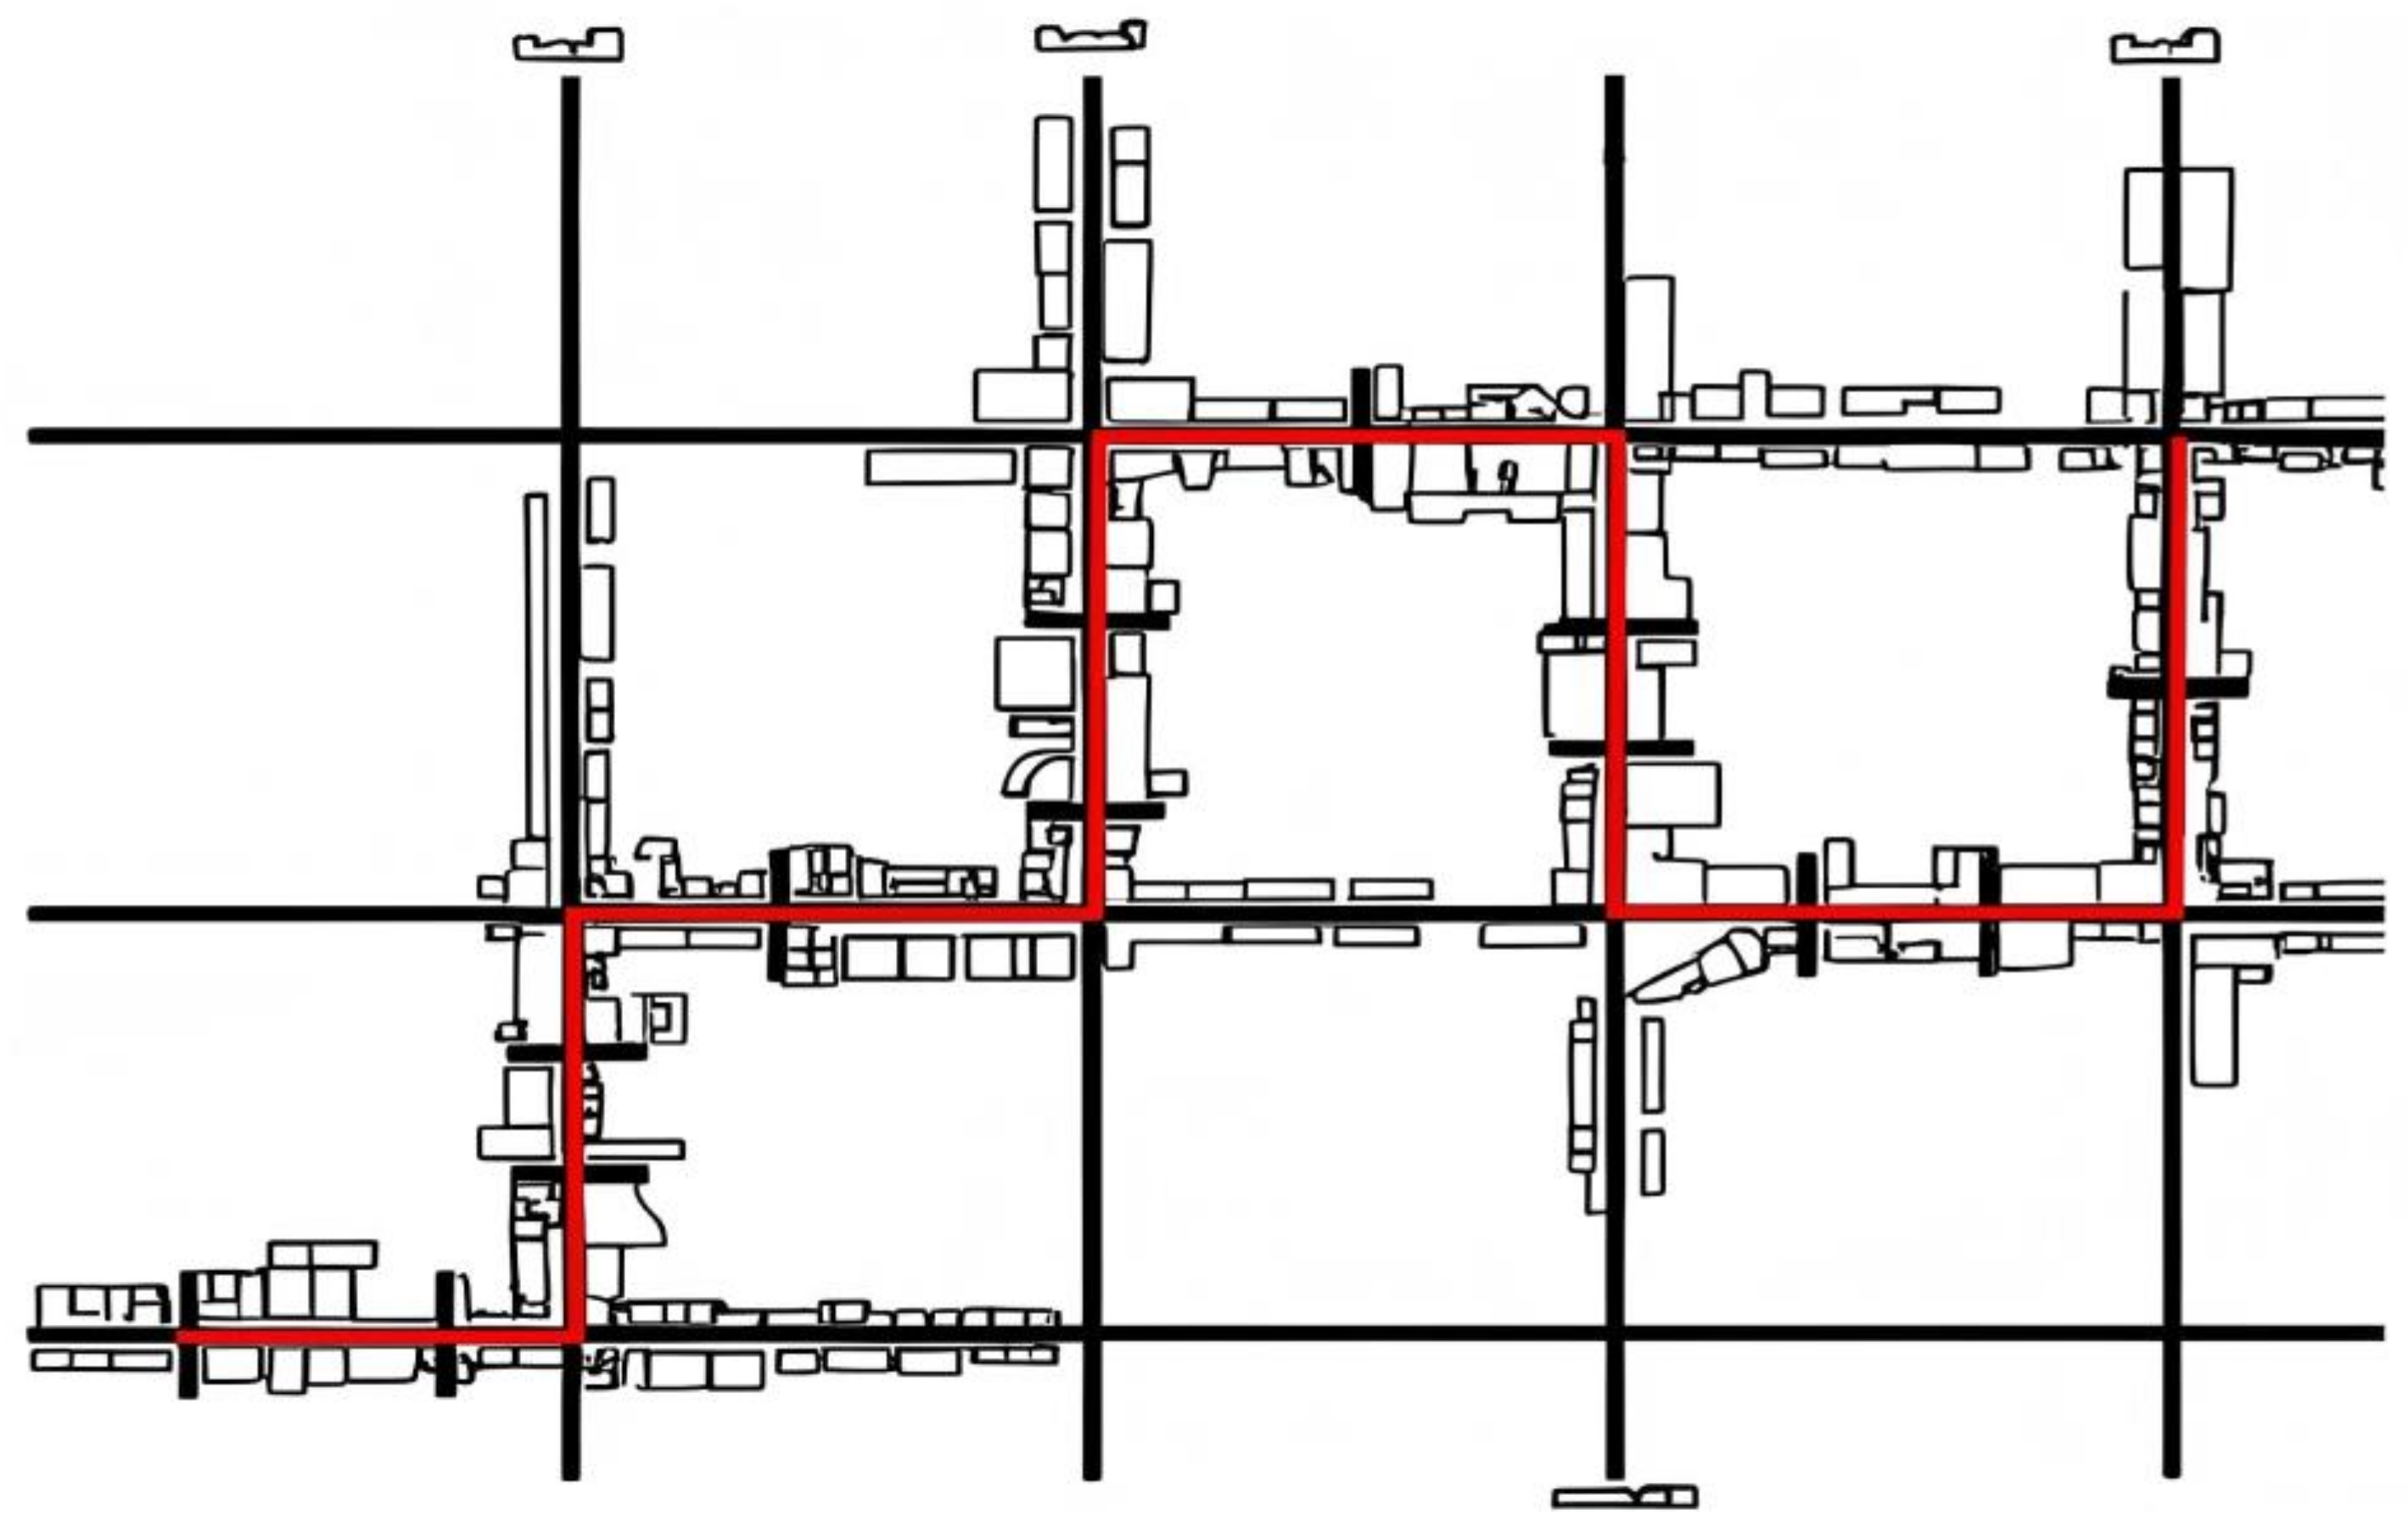
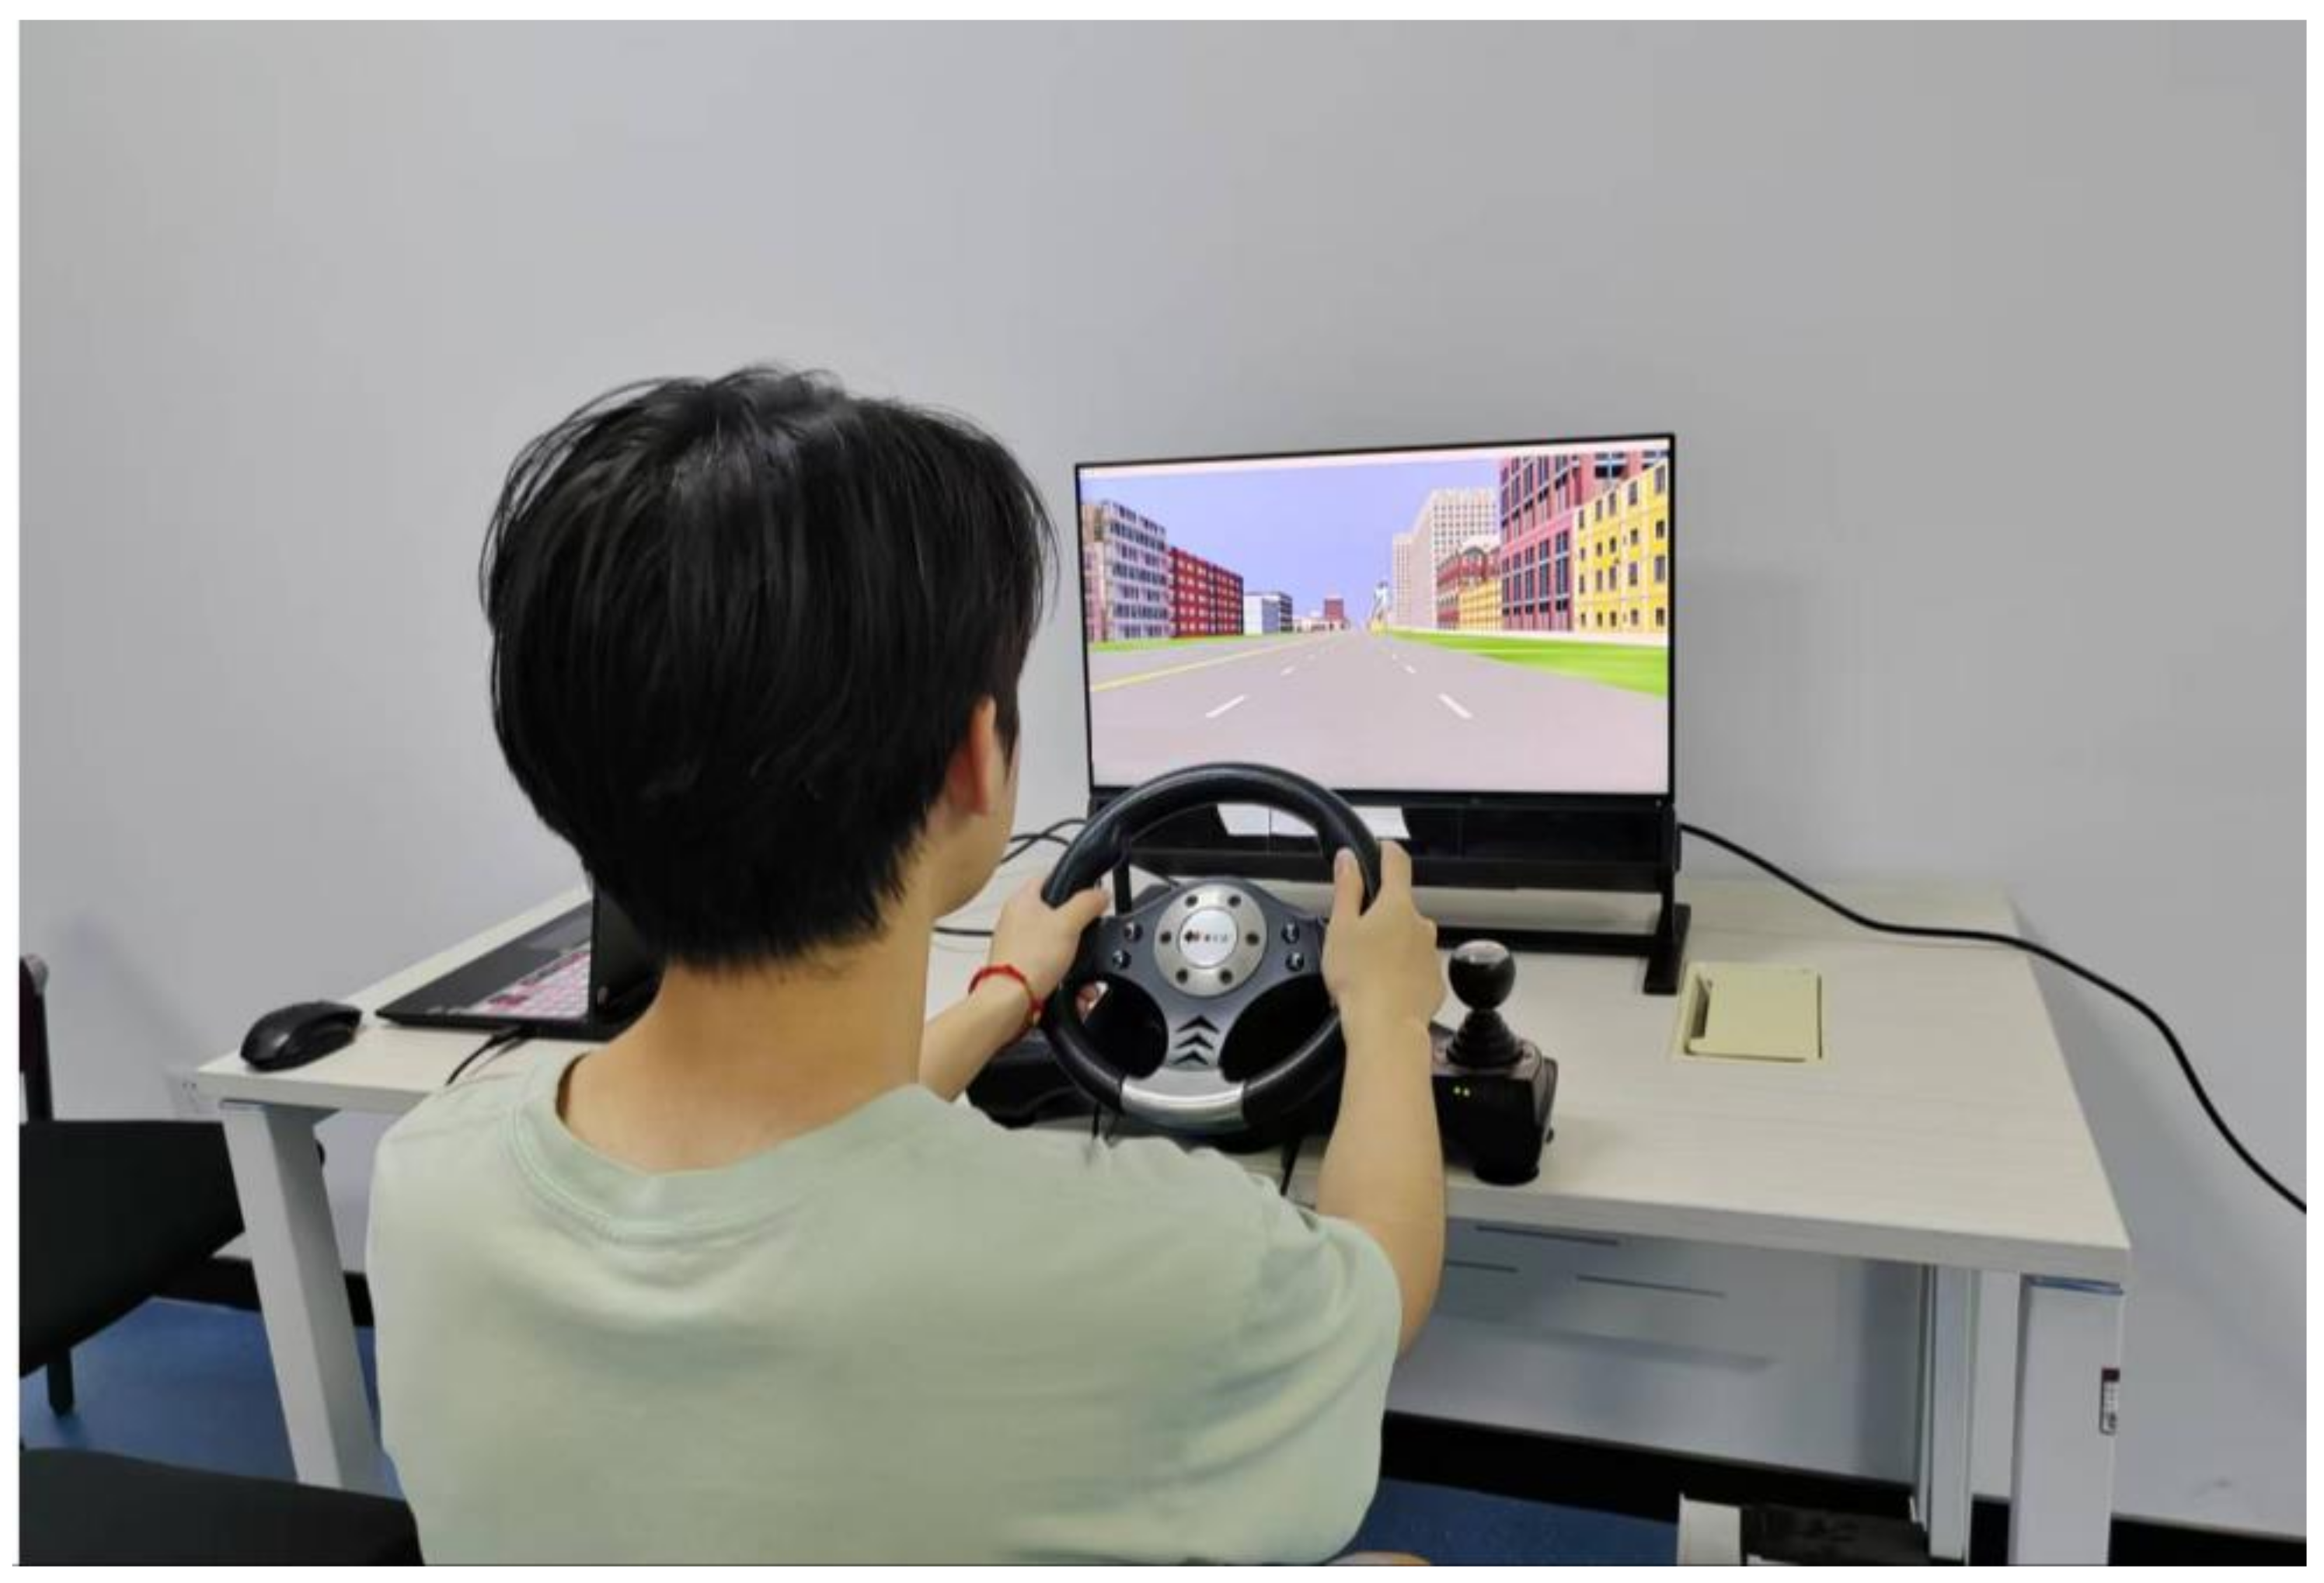
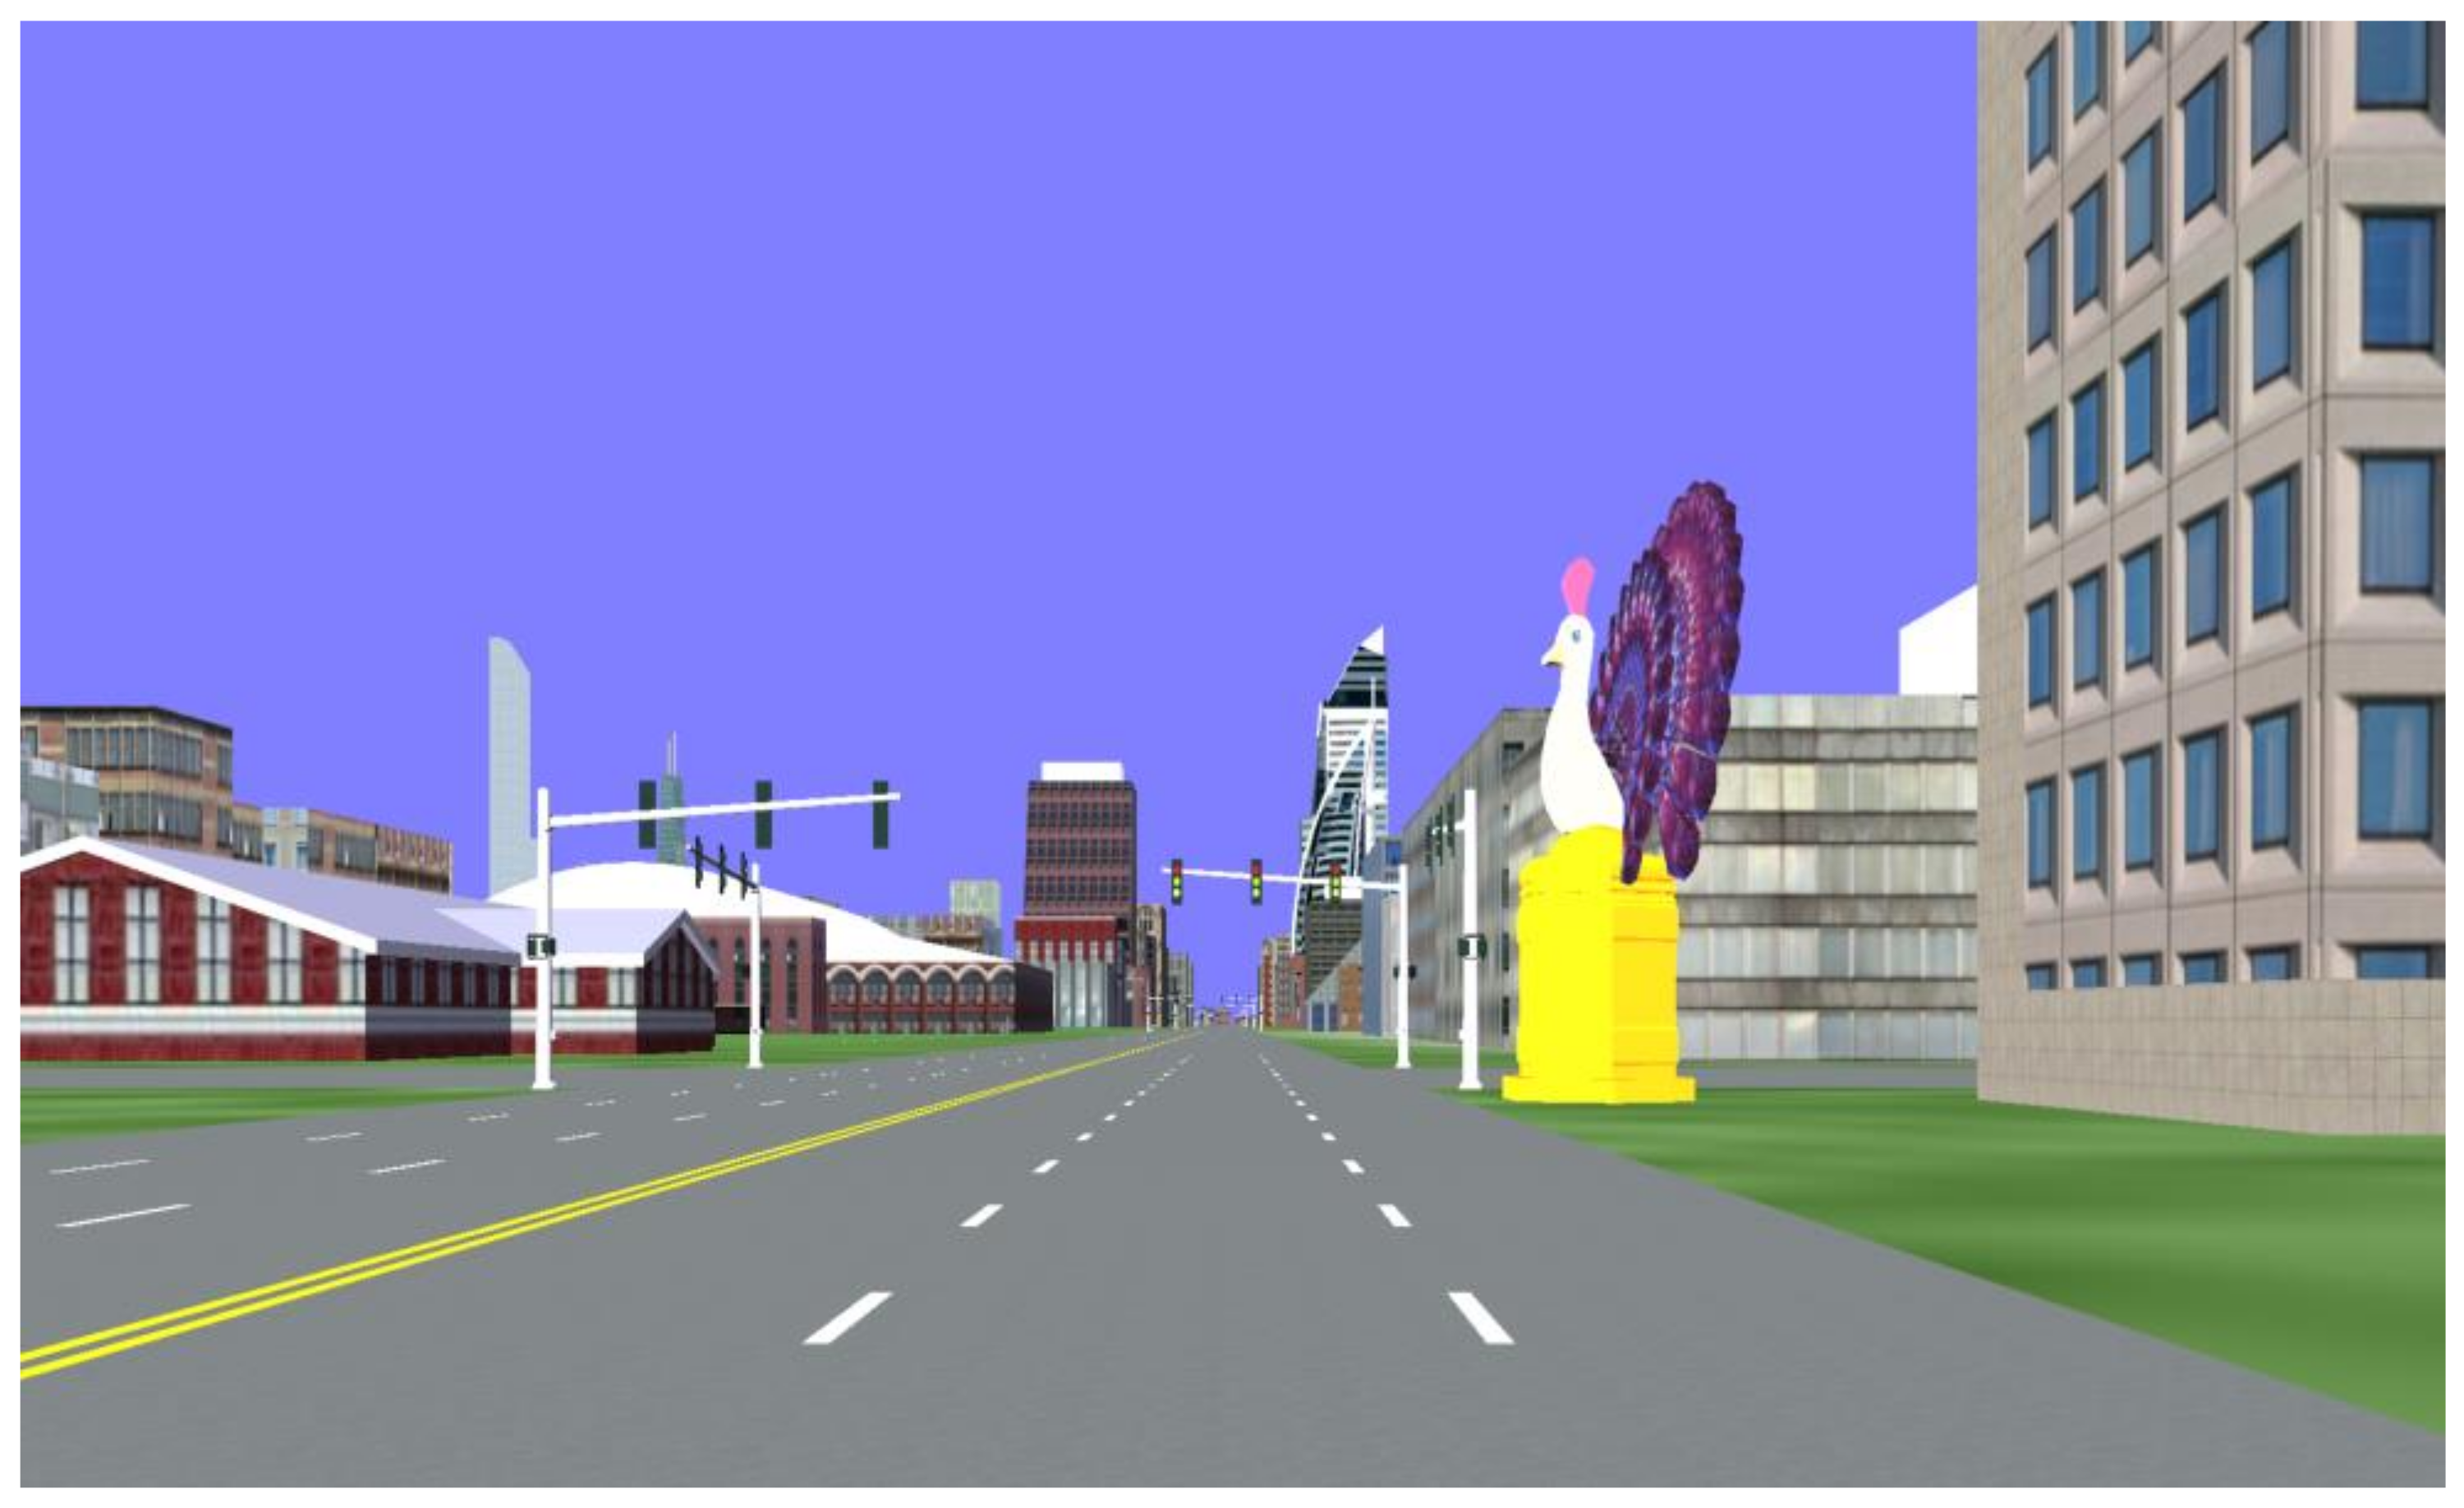
2.1.3. Materials
2.1.4. Procedure
2.1.5. Data Analysis
2.2. Results
2.2.1. Re-Cruise Task
2.2.2. Scene Recognition Task
2.2.3. Sequence Recognition Task
2.3. Discussion
3. Experiment 2
3.1. Methods
3.1.1. Participants
3.1.2. Design
3.1.3. Materials
3.1.4. Procedure
3.1.5. Data Analysis
3.2. Results
3.3. Discussion
4. General Discussion
5. Conclusions
Author Contributions
Funding
Institutional Review Board Statement
Informed Consent Statement
Data Availability Statement
Acknowledgments
Conflicts of Interest
Abbreviations
| AVs | Autonomous vehicles |
| NDRTJ | Non-driving-related tasks |
| (TOR) | Take-Over request |
| GPS | Global Positioning System |
| LSLV | Low structural, Low visual |
| LSHV | Low structural, High visual |
| HSLV | High structural, Low visual |
| HSHV | High structural, High visual |
References
- Ahmed, H. U., Huang, Y., Lu, P., & Bridgelall, R. (2022). Technology Developments and impacts of connected and autonomous vehicles: An overview. Smart Cities, 5(1), 382–404. [Google Scholar] [CrossRef]
- Bianchi Piccinini, G. F., Rodrigues, C. M., Leitão, M., & Simões, A. (2015). Reaction to a critical situation during driving with Adaptive Cruise Control for users and non-users of the system. Safety Science, 72, 116–126. [Google Scholar] [CrossRef]
- Broadbent, D. P., D’Innocenzo, G., Ellmers, T. J., Parsler, J., Szameitat, A. J., & Bishop, D. T. (2023). Cognitive load, working memory capacity and driving performance: A preliminary fNIRS and eye tracking study. Transportation Research Part F: Traffic Psychology and Behaviour, 92, 121–132. [Google Scholar] [CrossRef]
- Bruns, C. R., & Chamberlain, B. C. (2019). The influence of landmarks and urban form on cognitive maps using virtual reality. Landscape and Urban Planning, 189, 296–306. [Google Scholar] [CrossRef]
- Caduff, D., & Timpf, S. (2008). On the assessment of landmark salience for human navigation. Cognitive Processing, 9(4), 249–267. [Google Scholar] [CrossRef] [PubMed]
- Cheng, Z. (2022). Spatial knowledge acquisition characteristics of drivers and passengers in traditional driving and automated driving modes [Master’s thesis, Tianjin Normal University]. [Google Scholar]
- Denis, M., Mores, C., Gras, D., Gyselinck, V., & Daniel, M.-P. (2014). Is memory for routes enhanced by an environment’s richness in visual landmarks? Spatial Cognition and Computation, 14(4), 284–305. [Google Scholar] [CrossRef]
- Dillmann, J., den Hartigh, R. J. R., Kurpiers, C. M., Pelzer, J., Raisch, F. K., Cox, R. F. A., & de Waard, D. (2021). Keeping the driver in the loop through semi-automated or manual lane changes in conditionally automated driving. Accident Analysis & Prevention, 162, 106397. [Google Scholar] [CrossRef]
- Eriksson, A., & Stanton, N. A. (2017). Takeover time in highly automated vehicles: Noncritical transitions to and from manual control. Human Factors, 59(4), 689–705. [Google Scholar] [CrossRef]
- Fagnant, D. J., & Kockelman, K. (2015). Preparing a nation for autonomous vehicles: Opportunities, barriers and policy recommendations. Transportation Research Part A: Policy and Practice, 77, 167–181. [Google Scholar] [CrossRef]
- Gold, C., Damböck, D., Lorenz, L., & Bengler, K. (2013, September 30–October 4). “Take over!” How long does it take to get the driver back into the loop? [Conference session]. Human Factors and Ergonomics Society Annual Meeting, San Diego, CA, USA. [Google Scholar] [CrossRef]
- Gold, C., Körber, M., Hohenberger, C., Lechner, D., & Bengler, K. (2015). Trust in automation—Before and after the experience of take-over scenarios in a highly automated vehicle. Procedia Manufacturing, 3, 3025–3032. [Google Scholar] [CrossRef]
- Gold, C., Körber, M., Lechner, D., & Bengler, K. (2016). Taking over control from highly automated vehicles in complex traffic situations. Human Factors, 58(4), 642–652. [Google Scholar] [CrossRef]
- Greenlee, E. T., DeLucia, P. R., & Newton, D. C. (2018). Driver vigilance in automated vehicles: Effects of demands on hazard detection performance. Human Factors, 61(3), 474–487. [Google Scholar] [CrossRef]
- Guo, H., Zhang, Y., Cai, S., & Chen, X. (2021). Effects of level 3 automated vehicle drivers’ fatigue on their take-over behaviour: A literature review. Journal of Advanced Transportation, 2021(1), 8632685. [Google Scholar] [CrossRef]
- Haas, E. C., & van Erp, J. B. F. (2014). Multimodal warnings to enhance risk communication and safety. Safety Science, 61, 29–35. [Google Scholar] [CrossRef]
- Hamburger, K., & Röser, F. (2014). The role of landmark modality and familiarity in human wayfinding. Swiss Journal of Psychology, 73(4), 205–213. [Google Scholar] [CrossRef]
- Hegarty, M., Richardson, A. E., Montello, D. R., Lovelace, K., & Subbiah, I. (2002). Development of a self-report measure of environmental spatial ability. Intelligence, 30(5), 425–447. [Google Scholar] [CrossRef]
- Heikoop, D. D., de Winter, J. C. F., van Arem, B., & Stanton, N. A. (2016). Psychological constructs in driving automation: A consensus model and critical comment on construct proliferation. Theoretical Issues in Ergonomics Science, 17(3), 284–303. [Google Scholar] [CrossRef]
- Horrey, W. J., Lesch, M. F., Garabet, A., Simmons, L., & Maikala, R. (2017). Distraction and task engagement: How interesting and boring information impact driving performance and subjective and physiological responses. Applied Ergonomics, 58, 342–348. [Google Scholar] [CrossRef]
- Itti, L., & Koch, C. (2000). A saliency-based search mechanism for overt and covert shifts of visual attention. Vision Research, 40(10–12), 1489–1506. [Google Scholar] [CrossRef]
- Janzen, G. (2006). Memory for object location and route direction in virtual large-scale space. Quarterly Journal of Experimental Psychology, 59(3), 493–508. [Google Scholar] [CrossRef]
- Janzen, G., & van Turennout, M. (2004). Selective neural representation of objects relevant for navigation. Nature Neuroscience, 7(6), 673–677. [Google Scholar] [CrossRef]
- Kumsa Kurse, T., Gebresenbet, G., & Fikadu Daba, G. (2024). Assessment of the state of the art in the performance and utilisation level of automated vehicles. International Journal of Sustainable Engineering, 17(1), 537–553. [Google Scholar] [CrossRef]
- Li, S., Blythe, P., Guo, W., & Namdeo, A. (2018). Investigation of older driver’s takeover performance in highly automated vehicles in adverse weather conditions. IET Intelligent Transport Systems, 12(9), 1157–1165. [Google Scholar] [CrossRef]
- Liang, N., Yang, J., Yu, D., Prakah-Asante, K. O., Curry, R., Blommer, M., Swaminathan, R., & Pitts, B. J. (2021). Using eye-tracking to investigate the effects of pre-takeover visual engagement on situation awareness during automated driving. Accident Analysis & Prevention, 157, 106143. [Google Scholar] [CrossRef]
- Louw, T., Kountouriotis, G., Carsten, O., & Merat, N. (2015, November 9–11). Driver inattention during vehicle automation: How does driver engagement affect resumption of control? [Conference session]. 4th International Conference on Driver Distraction and Inattention, Sydney, Australia. [Google Scholar]
- Louw, T., Markkula, G., Boer, E., Madigan, R., Carsten, O., & Merat, N. (2017). Coming back into the loop: Drivers’ perceptual-motor performance in critical events after automated driving. Accident Analysis & Prevention, 108, 9–18. [Google Scholar] [CrossRef] [PubMed]
- Lovelace, K. L., Hegarty, M., & Montello, D. R. (1999, August 25–29). Elements of good route directions in Familiar and unfamiliar environments. [Conference session]. International Cognitive and Computational Foundations of Geographic Information Science Conference, Stade, Germany. [Google Scholar] [CrossRef]
- McWilliams, T., & Ward, N. (2021). Underload on the road: Measuring vigilance decrements during partially automated driving. Frontiers in Psychology, 12, 631364. [Google Scholar] [CrossRef]
- Megías, A., Maldonado, A., Catena, A., Di Stasi, L. L., Serrano, J., & Cándido, A. (2011). Modulation of attention and urgent decisions by affect-laden roadside advertisement in risky driving scenarios. Safety Science, 49(10), 1388–1393. [Google Scholar] [CrossRef]
- Michon, P.-E., & Denis, M. (2001, September 19–23). When and why are visual landmarks used in giving directions? [Conference session]. International Cognitive and Computational Foundations of Geographic Information Science Conference, Morro Bay, CA, USA. [Google Scholar] [CrossRef]
- Mok, B., Johns, M., Lee, K. J., Miller, D., Sirkin, D., Ive, P., & Ju, W. (2015, September 15–18). Emergency, automation off: Unstructured transition timing for distracted drivers of automated vehicles. [Conference session]. 18th International Conference on Intelligent Transportation Systems, Gran Canaria, Spain. [Google Scholar] [CrossRef]
- Parasuraman, R., & Nestor, P. G. (1991). Attention and driving skills in aging and Alzheimer’s disease. Human Factors, 33(5), 539–557. [Google Scholar] [CrossRef]
- Pipkorn, L., Dozza, M., & Tivesten, E. (2022). Driver visual attention before and after take-over requests during automated driving on public roads. Human Factors, 66(2), 336–347. [Google Scholar] [CrossRef]
- Radlmayr, J., & Bengler, K. (2015). Literaturanalyse und methodenauswahl zur gestaltung von systemen zum hochautomatisierten fahren. FAT Schriftenreihe, 276, 1–57. [Google Scholar]
- Radlmayr, J., Gold, C., Lorenz, L., Farid, M., & Bengler, K. (2014, October 27–31). How traffic situations and non-driving related tasks affect the take-over quality in highly automated driving. [Conference session]. Human Factors and Ergonomics Society Annual Meeting, Chicago, IL, USA. [Google Scholar] [CrossRef]
- Robertson, R. D., Woods-Fry, H., Vanlaar, W. G. M., & Mainegra Hing, M. (2019). Automated vehicles and older drivers in Canada. Journal of Safety Research, 70, 193–199. [Google Scholar] [CrossRef]
- Röser, F., Hamburger, K., & Knauff, M. (2011). The Giessen virtual environment laboratory: Human wayfinding and landmark salience. Cognitive Processing, 12(2), 209–214. [Google Scholar] [CrossRef] [PubMed]
- Röser, F., Hamburger, K., Krumnack, A., & Knauff, M. (2012). The structural salience of landmarks: Results from an on-line study and a virtual environment experiment. Journal of Spatial Science, 57(1), 37–50. [Google Scholar] [CrossRef]
- Shi, E., & Frey, A. T. (2021). Non-driving-related tasks during level 3 automated driving phases–measuring what users will be likely to do. Technology, Mind, and Behavior, 2(2), 1–13. [Google Scholar] [CrossRef]
- Siegel, A. W., & White, S. H. (1975). The development of spatial representations of large-scale environments. Advances in Child Development and Behavior, 10, 9–55. [Google Scholar] [CrossRef]
- Sorrows, M. E., & Hirtle, S. C. (1999, August 25–29). The nature of landmarks for real and electronic spaces. [Conference session]. International Cognitive and Computational Foundations of Geographic Information Science Conference, Stade, Germany. [Google Scholar] [CrossRef]
- Sweller, J., van Merriënboer, J. J. G., & Paas, F. (2019). Cognitive architecture and instructional design: 20 years later. Educational Psychology Review, 31(2), 261–292. [Google Scholar] [CrossRef]
- Tan, X., & Zhang, Y. (2025). Driver Situation awareness for regaining control from conditionally automated vehicles: A systematic review of empirical studies. Human Factors, 67(4), 367–403. [Google Scholar] [CrossRef]
- Theeuwes, J. (1994). Stimulus-driven capture and attentional set: Selective search for color and visual abrupt onsets. Journal of Experimental Psychology: Human Perception and Performance, 20(4), 799–806. [Google Scholar] [CrossRef]
- Tivesten, E., Victor, T. W., Gustavsson, P., Johansson, J., & Ljung Aust, M. (2019). Out-of-the-loop crash prediction: The automation expectation mismatch (AEM) algorithm. IET Intelligent Transport Systems, 13(8), 1231–1240. [Google Scholar] [CrossRef]
- Tlauka, M., & Wilson, P. N. (1994). The effect of landmarks on route-learning in a computer-simulated environment. Journal of Environmental Psychology, 14(4), 305–313. [Google Scholar] [CrossRef]
- Victor, T. W., Harbluk, J. L., & Engström, J. A. (2005). Sensitivity of eye-movement measures to in-vehicle task difficulty. Transportation Research Part F: Traffic Psychology and Behaviour, 8(2), 167–190. [Google Scholar] [CrossRef]
- von Stülpnagel, R., & Frankenstein, J. (2015). Configurational salience of landmarks: An analysis of sketch maps using Space Syntax. Cognitive Processing, 16(S1), 437–441. [Google Scholar] [CrossRef]
- Walker, H. E. K., & Trick, L. M. (2019). How the emotional content of roadside images affect driver attention and performance. Safety Science, 115, 121–130. [Google Scholar] [CrossRef]
- Wandtner, B., Schmidt, D. G., Schömig, D. N., & Kunde, D. W. (2018). Non-driving related tasks in highly automated driving—Effects of task modalities and cognitive workload on take-over performance. Humam Factors, 60(6), 870–881. [Google Scholar] [CrossRef] [PubMed]
- Wang, C., Chen, Y., Zheng, S., Yuan, Y., & Wang, S. (2020). Research on generating an indoor landmark salience model for self-location and spatial orientation from eye-tracking data. ISPRS International Journal of Geo-Information, 9(2), 97. [Google Scholar] [CrossRef]
- Wenczel, F., Hepperle, L., & von Stülpnagel, R. (2017). Gaze behavior during incidental and intentional navigation in an outdoor environment. Spatial Cognition and Computation, 17(1–2), 121–142. [Google Scholar] [CrossRef]
- Wolbers, T., & Wiener, J. M. (2014). Challenges for identifying the neural mechanisms that support spatial navigation: The impact of spatial scale. Frontiers in Human Neuroscience, 8, 571. [Google Scholar] [CrossRef] [PubMed]
- Wu, C., Wu, H., Lyu, N., & Zheng, M. (2019). Take-over performance and safety analysis under different scenarios and secondary tasks in conditionally automated driving. IEEE Access, 7, 136924–136933. [Google Scholar] [CrossRef]
- Xie, S., Chen, S., Zheng, J., Tomizuka, M., Zheng, N., & Wang, J. (2022). From human driving to automated driving: What do we know about drivers? IEEE Transactions on Intelligent Transportation Systems, 23(7), 6189–6205. [Google Scholar] [CrossRef]
- Xu, Y. (2021). Driver’s spatial memory and visual features in L2 autonomous driving scenarios [Master’s thesis, Tianjin Normal University]. [Google Scholar]
- Yang, B., Inoue, K., Yan, Z., Wang, Z., Kitazaki, S., & Nakano, K. (2024). Influences of level 2 automated driving on driver behaviors: A comparison with manual driving. IEEE Transactions on Intelligent Transportation Systems, 25(1), 144–158. [Google Scholar] [CrossRef]
- Yesiltepe, D., Dalton, R. C., & Torun, A. O. (2021). Landmarks in wayfinding: A review of the existing literature. Cognitive Processing, 22, 369–410. [Google Scholar] [CrossRef]
- Zeeb, K., Buchner, A., & Schrauf, M. (2015). What determines the take-over time? An integrated model approach of driver take-over after automated driving. Accident Analysis & Prevention, 78, 212–221. [Google Scholar] [CrossRef]
Disclaimer/Publisher’s Note: The statements, opinions and data contained in all publications are solely those of the individual author(s) and contributor(s) and not of MDPI and/or the editor(s). MDPI and/or the editor(s) disclaim responsibility for any injury to people or property resulting from any ideas, methods, instructions or products referred to in the content. |
© 2025 by the authors. Licensee MDPI, Basel, Switzerland. This article is an open access article distributed under the terms and conditions of the Creative Commons Attribution (CC BY) license (https://creativecommons.org/licenses/by/4.0/).
Share and Cite
Liu, X.; Zhou, Y.; Zhang, Y. The Effects of Landmark Salience on Drivers’ Spatial Cognition and Takeover Performance in Autonomous Driving Scenarios. Behav. Sci. 2025, 15, 966. https://doi.org/10.3390/bs15070966
Liu X, Zhou Y, Zhang Y. The Effects of Landmark Salience on Drivers’ Spatial Cognition and Takeover Performance in Autonomous Driving Scenarios. Behavioral Sciences. 2025; 15(7):966. https://doi.org/10.3390/bs15070966
Chicago/Turabian StyleLiu, Xianyun, Yongdong Zhou, and Yunhong Zhang. 2025. "The Effects of Landmark Salience on Drivers’ Spatial Cognition and Takeover Performance in Autonomous Driving Scenarios" Behavioral Sciences 15, no. 7: 966. https://doi.org/10.3390/bs15070966
APA StyleLiu, X., Zhou, Y., & Zhang, Y. (2025). The Effects of Landmark Salience on Drivers’ Spatial Cognition and Takeover Performance in Autonomous Driving Scenarios. Behavioral Sciences, 15(7), 966. https://doi.org/10.3390/bs15070966