
What Is the Contribution of Community Programs to the Physical Activity of Women? A Study Based on Public Open Spaces in Brazil

 , and
, and
Abstract
1. Introduction
2. Materials and Methods
2.1. Design, Locals’ Contextualization, and Ethical Aspects
2.2. Selection of Public Open Spaces (POS) for Physical Activity (PA)
2.3. Participants Selection
2.4. Data Collection
2.5. Outcome Variable: Physical Activity (PA)
2.6. Predictor Variables
2.6.1. Sociodemographic Characteristics
2.6.2. Health Conditions
2.6.3. Public Open Spaces (POS) Usage
2.7. Data Quality Control
2.8. Data Analysis
3. Results
3.1. Participants’ Description
3.2. Description of Accelerometer (ACC) Usage
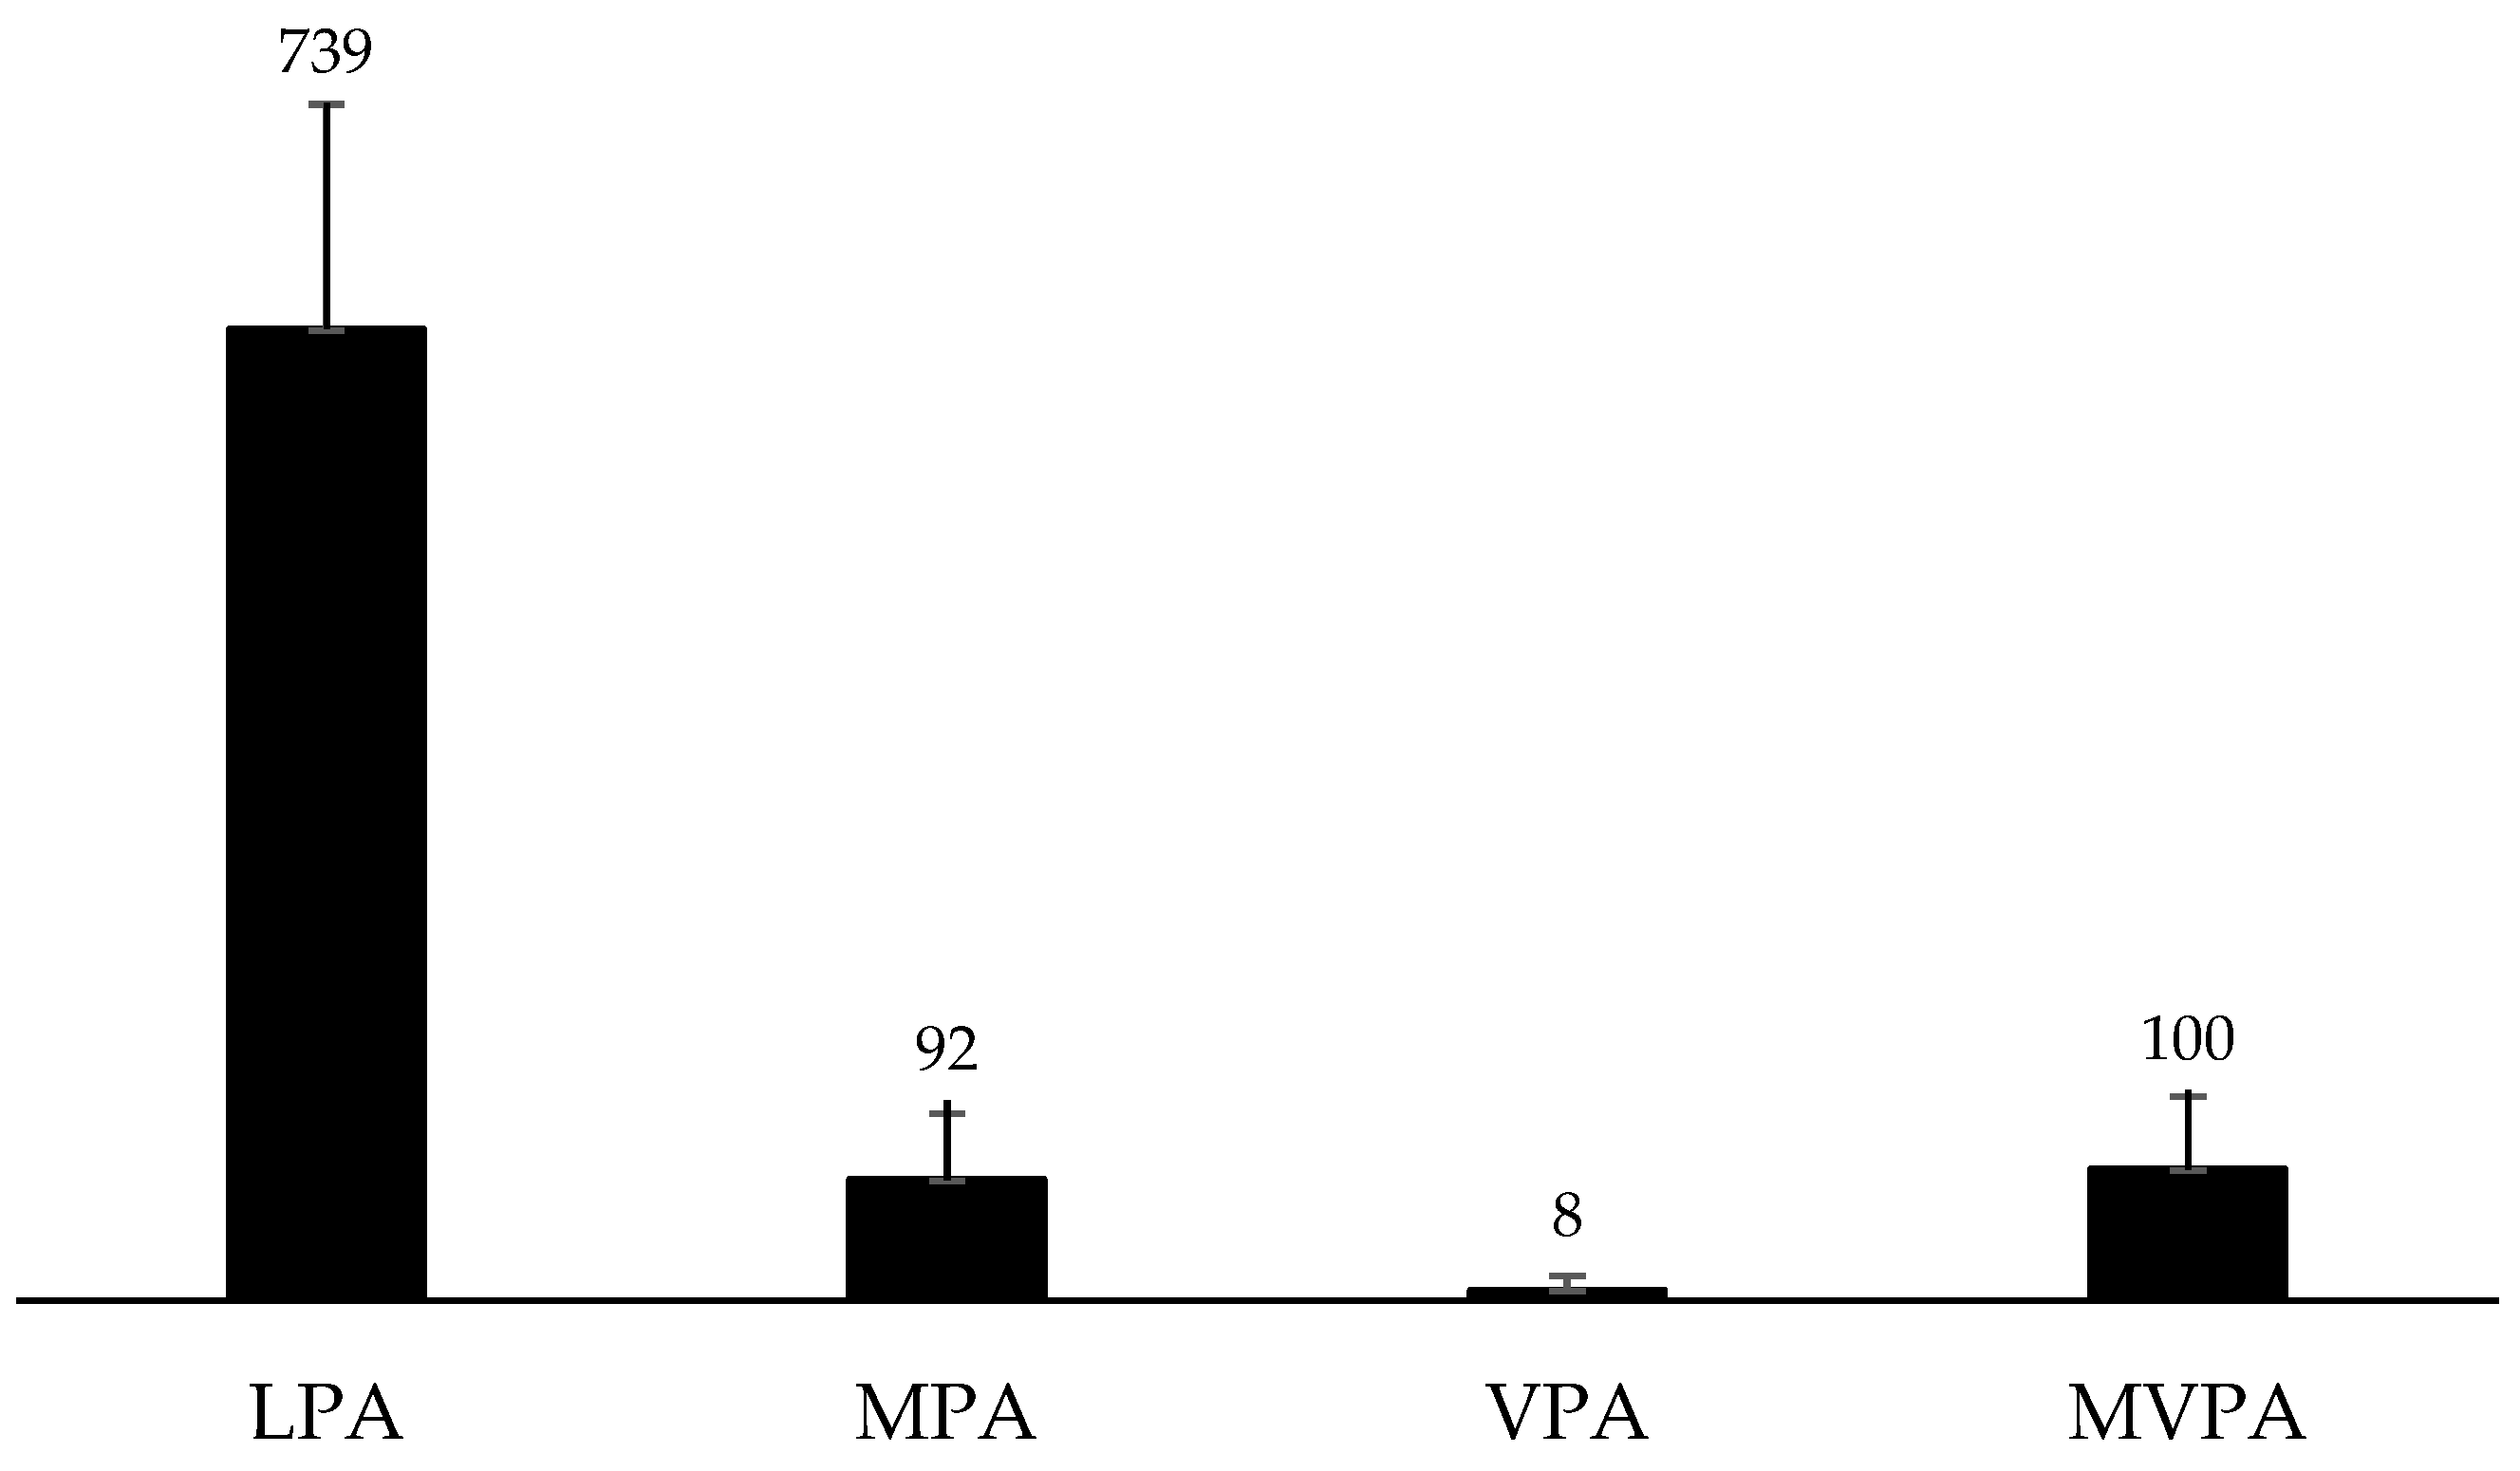
3.3. Description of Physical Activity (PA)
3.4. Relationship between Sociodemographic Characteristics, Health Conditions, POS Usage, and Women′s PA
4. Discussion
5. Conclusions
Author Contributions
Funding
Institutional Review Board Statement
Informed Consent Statement
Data Availability Statement
Acknowledgments
Conflicts of Interest
References
- Lee, I.M.; Shiroma, E.J.; Lobelo, F.; Puska, P.; Blair, S.N.; Katzmarzyk, P.T.; Lancet Physical Activity Series Working Group. Effect of physical inactivity on major non-communicable diseases worldwide: An analysis of burden of disease and life expectancy. Lancet 2012, 380, 219–229. [Google Scholar] [PubMed]
- Bull, F.C.; Al-Ansari, S.S.; Biddle, S.; Borodulin, K.; Buman, M.P.; Cardon, G.; Carty, C.; Chaput, J.-P.; Chastin, S.; Chou, R.; et al. World Health Organization 2020 guidelines on physical activity and sedentary behaviour. Br. J. Sports Med. 2020, 54, 1451–1462. [Google Scholar] [CrossRef]
- Costa-Santos, A.; Willlumsen, J.; Meheus, F.; Ilbawi, A.; Bull, F.C. The cost of inaction on physical inactivity to healthcare systems. A population-attributable fraction analysis. Lancet Glob. Health 2023, 11, e32–e39. [Google Scholar] [CrossRef] [PubMed]
- Guthold, R.; Stevens, G.A.; Riley, L.M.; Bull, F.C. Worldwide trends in insufficient physical activity from 2001 to 2016: A pooled analysis of 358 population-based surveys with 1·9 million participants. Lancet Glob. Health. 2018, 6, e1077–e1086. [Google Scholar] [CrossRef]
- Sallis, J.F.; Bull, F.; Guthold, R.; Heath, G.W.; Inoue, S.; Kelly, P.; Oyeyemi, A.L.; Perez, L.G.; Richards, J.; Hallal, P.C. Progress in physical activity over the Olympic quadrennium. Lancet 2016, 38, 1325–1336. [Google Scholar]
- Bauman, A.E.; Reis, R.S.; Sallis, J.F.; Wells, J.C.; Loos, R.J.F.; Martin, B.W.; Lancet Physical Activity Series Working Group. Correlates of physical activity: Why are some people physically active and others not? Lancet 2012, 380, 258–271. [Google Scholar] [PubMed]
- Werneck, A.O.; Araujo, R.H.O.; Anza-Ramírez, C.; Brazo-Sayavera, J.; García-Witulski, C.; Aguilar-Farias, N.; Baldew, S.-S.; Sadarangani, K.P.; Ramírez-Vélez, R.; García-Hermoso, A.; et al. Physical activity and sitting time patterns and sociodemographic correlates among 155,790 South American adults. J. Phys. Act. Health 2023, 20, 716–726. [Google Scholar]
- Fancourt, D.; Aughterson, H.; Finn, S.; Walker, E.; Andrew, S. How leisure activities affect health: A narrative review and multi-level theoretical framework of mechanisms of action. Lancet Psychiatry 2021, 8, 329–339. [Google Scholar]
- Koohsari, M.J.; Mavoa, S.; Villianueva, K.; Sugiyama, T.; Badland, H.; Kaczynski, A.T.; Owen, N.; Giles-Corti, B. Public open space, physical activity, urban design and public health: Concepts, methods and research agenda. Health Place 2015, 33, 75–82. [Google Scholar]
- Nguyen, P.Y.; Astell-Burt, T.; Rahimi-Ardabili, H.; Feng, X. Effect of nature prescriptions on cardiometabolic and mental health, and physical activity: A systematic review. Lancet Planet Health 2023, 7, e313–e328. [Google Scholar] [PubMed]
- Navarrete-Hernandez, P.; Vetro, A.; Concha, P. Building safer public spaces: Exploring gender difference in the perception of safety in public space through urban design interventions. Landsc. Urban Plan. 2021, 214, 104180. [Google Scholar] [CrossRef]
- Rech, C.R.; Pazin, J.; Rodrigues, E.Q.; Paiva-Neto, F.T.; Knebel, M.T.G.; Coco, T.G.S.; Fermino, R.C. How can public open spaces contribute to physical activity promotion? Rev. Bras. Ativ. Fís. Saude. 2023, 28, 1–6. [Google Scholar] [CrossRef]
- Rech, C.R.; Reis, R.S.; Hino, A.A.; Rodriguez-Añez, C.R.; Fermino, R.C.; Gonçalves, P.B.; Hallal, P.C. Neighborhood safety and physical inactivity in adults from Curitiba, Brazil. Int. J. Behav. Nutr. Phys. Act. 2012, 9, 72. [Google Scholar] [CrossRef] [PubMed]
- Gomez, L.F.; Sarmiento, R.; Ordoñez, M.F.; Pardo, C.F.; Sá, T.H.; Mallarino, C.H.; Miranda, J.J.; Mosquera, J.; Parra, D.C.; Reis, R.; et al. Urban environment interventions linked to the promotion of physical activity: A mixed methods study applied to the urban context of Latin America. Soc. Sci. Med. 2015, 131, 18–30. [Google Scholar] [CrossRef] [PubMed]
- Hoehner, C.M.; Ribeiro, I.C.; Parra, D.C.; Reis, R.S.; Azevedo, M.R.; Hino, A.A.; Soares, J.; Hallal, P.C.; Simões, E.J.; Brownson, R.C. Physical activity interventions in Latin America: Expanding and classifying the evidence. Am. J. Prev. Med. 2013, 44, 31–40. [Google Scholar] [CrossRef] [PubMed]
- Heath, G.W.; Parra, D.C.; Sarmiento, O.L.; Andersen, L.B.; Owen, N.; Goenka, S.; Montes, F.; Brownson, R.C.; The Lancet Physical Activity Series Working Group. Evidence-based intervention in physical activity: Lessons from around the world. Lancet 2012, 380, 272–281. [Google Scholar] [CrossRef]
- Hunter, R.F.; Christian, H.; Veitch, J.; Astell-Burt, T.; Hipp, J.A.; Schipperijn, J. The impact of interventions to promote physical activity in urban green space: A systematic review and recommendations for future research. Soc. Sci. Med. 2015, 124, 246–256. [Google Scholar] [CrossRef]
- Reis, R.S.; Yan, Y.; Parra, D.C.; Brownson, R.C. Assessing participation in community-based physical activity programs in Brazil. Med. Sci. Sports Exerc. 2014, 46, 92–98. [Google Scholar] [CrossRef]
- Bedimo-Rung, A.L.; Mowen, A.J.; Cohen, D.A. The significance of parks to physical activity and public health: A conceptual model. Am. J. Prev. Med. 2005, 28, 159–168. [Google Scholar] [CrossRef]
- Fermino, R.C.; Reis, R.S. Individual, environmental and social variables associated with public open spaces usage for physical activity: A systematic review. Rev. Bras. Atividade Fís. Saúde 2013, 18, 523–535. [Google Scholar]
- Mello, R.L.; Lopes, A.A.S.; Fermino, R.C. Exposure to public open spaces and leisure-time physical activity: An analysis of adults in Primary Health Care in Brazil. Int. J. Environ. Res. Public Health 2022, 19, 8355. [Google Scholar] [CrossRef]
- Sallis, J.F.; Cerin, E.; Conway, T.L.; Adams, M.A.; Frank, L.D.; Pratt, M.; Salvo, D.; Schipperijn, J.; Smith, G.; Cain, K.L.; et al. Physical activity in relation to urban environments in 14 cities worldwide: A cross-sectional study. Lancet 2016, 387, 2207–2217. [Google Scholar] [CrossRef]
- Prada, E.T.P.; Camargo-Lemos, D.M.; Fermino, R.C. Participation and physical activity in Recreovia of Bucaramanga, Colombia. J. Phys. Act. Health 2021, 18, 1277–1285. [Google Scholar] [CrossRef]
- Sarmiento, O.L.; Rios, A.; Paez, D.; Quijano, K.; Fermino, R.C. The recreovía of Bogotá, a community-based physical activity program to promote physical activity among women: Baseline results of the natural experiment al ritmo de las comunidades. Int. J. Environ. Res. Public Health 2017, 14, 633. [Google Scholar] [CrossRef]
- Fermino, R.C.; Hallal, P.C.; Reis, R.S. Frequecy of park use and physical activity in adults from Curitiba, Brazil. Rev. Bras. Med. Esporte 2017, 23, 264–269. [Google Scholar] [CrossRef]
- Fermino, R.C.; Reis, R.S.; Hallal, P.C.; Kaczynski, A.T. Who are the users of urban parks? A study with adults from Curitiba, Brazil. J. Phys. Act. Health. 2015, 12, 58–67. [Google Scholar]
- Manta, S.W.; Reis, R.S.; Benedetti, T.R.B.; Rech, C.R. Public open spaces and physical activity: Disparities of resources in Florianopolis. Rev. Saude Publica 2019, 53, 112. [Google Scholar] [CrossRef]
- Evenson, K.R.; Wen, F.; Hillier, A.; Cohen, D.A. Assessing the contribution of parks to physical activity using global positioning system and accelerometry. Med. Sci. Sports Exerc. 2013, 45, 1981–1987. [Google Scholar] [CrossRef] [PubMed]
- Vich, G.; Delclòs-Alió, X.; Maciejewska, M.; Marquet, O.; Schipperijn, J.; Miralles-Guasch, C. Contribution of park visits to daily physical activity levels among older adults: Evidence using GPS and accelerometery data. Urban For. Urban Green. 2021, 63, 127225. [Google Scholar] [CrossRef]
- Marquet, O.; Hirsch, J.A.; Kerr, J.; Jankowska, M.M.; Mitchell, J.; Hart, J.E.; Laden, F.; Hipp, J.A.; James, P. GPS-based activity space exposure to greenness and walkability is associated with increased accelerometer-based physical activity. Environ. Int. 2022, 165, 107317. [Google Scholar] [CrossRef] [PubMed]
- Schipperijn, J.; Cerin, E.; Adams, M.A.; Reis, R.; Smith, G.; Cain, K.; Christiansen, L.B.; van Dyck, D.; Gidlow, C.; Frank, L.D.; et al. Access to parks and physical activity: An eight country comparison. Urban For. Urban Green. 2017, 27, 253–263. [Google Scholar] [CrossRef] [PubMed]
- Gonçalves, P.B.; Hallal, P.C.; Hino, A.A.F.; Reis, R.S. Individual and environmental correlates of objectively measured physical activity and sedentary time in adults from Curitiba, Brazil. Int. J. Public Health 2017, 62, 831–840. [Google Scholar] [CrossRef] [PubMed]
- Silva, A.T.; Santos, L.P.; Rodriguez-Añez, C.R.; Fermino, R.C. Logic model of “Cidade Ativa, Cidade Saudável Program” in São José dos Pinhais, Brazil. Rev. Bras. Ativ. Fís. Saude 2021, 26, e0193. [Google Scholar]
- Custódio, I.G.; Lopes, A.A.S.; Kopp, D.; Silva, A.T.; Chaves, R.N.; Rodriguez-Añez, C.R.; Fermino, R.C. Pattern of use of public open spaces and physical activity levels in São José dos Pinhais, Brazil. Rev. Bras. Ciênc. Esporte 2021, 43, e011220. [Google Scholar] [CrossRef]
- STROBE. Strengthening the Reporting of Observational Studies in Epidemiology. Available online: https://www.strobe-statement.org/ (accessed on 1 May 2020).
- Dowd, K.; Maciaszek, J.; VanderPloeg, H.; Minetto, M.; Murphy, M.; Polito, A.; Ghigo, E.; van der Ploeg, H.; Ekelund, U.; Maciaszek, J.; et al. A systematic literature review of reviews on techniques for physical activity measurement in adults: A DEDIPAC study. Int. J. Behav. Nutr. Phys. Act. 2018, 15, 15. [Google Scholar] [CrossRef] [PubMed]
- Choi, L.; Ward, S.C.; Schnelle, J.F.; Buchowski, M.S. Assessment of wear/nonwear time classification algorithms for triaxial accelerometer. Med. Sci. Sports Exerc. 2012, 44, 2009–2016. [Google Scholar] [CrossRef]
- Sasaki, J.E.; Hélio-Júnior, J.; Meneguci, J.; Tribess, S.; Marocolo-Júnior, M.; Stabelini-Neto, A.; Virtuoso-Júnior, J.S. Number of days required for reliably estimating physical activity and sedentary behaviour from accelerometer data in older adults. J. Sports Sci. 2017, 36, 1572–1577. [Google Scholar] [CrossRef]
- Veitch, J.; Ball, K.; Crawford, D.; Abbott, G.; Salmon, J. Is park visitation associated with leisure-time and transportation physical activity? Prev. Med. 2013, 57, 732–734. [Google Scholar] [CrossRef] [PubMed]
- ABEP. Brazilian Association of Research Companies. Brazil Economic Classification Criteria 2019. Available online: http://www.abep.org/criterio-brasil (accessed on 2 May 2020).
- WHO. World Health Organization Expert Committee on Physical Status: The Use and Interpretation of Anthropometry. Report of a WHO Expert Committee. Available online: https://www.who.int/childgrowth/publications/physical_status/en/ (accessed on 12 April 2022).
- Brazil. Ministry of Health, Secretariat of Health Surveillance. Department of Health Analysis and Surveillance of Noncommunicable Diseases. VIGITEL Brazil 2021: Surveillance System for Risk and Protective Factors for Chronic Diseases by Telephone Survey. Brasilia-DF. 2022. Available online: https://www.gov.br/saude/pt-br/centrais-de-conteudo/publicacoes/svsa/vigitel/vigitel-brasil-2021-estimativas-sobre-frequencia-e-distribuicao-sociodemografica-de-fatores-de-risco-e-protecao-para-doencas-cronicas (accessed on 28 March 2022).
- Ainsworth, B.E.; Haskell, W.L.; Herrmann, S.D.; Meckes, N.; Bassett, D.R.; Tudor-Locke, C.; Greer, J.L.; Vezina, J.; Whitt-Glover, M.C.; Leon, A.S. 2011 compendium of physical activities: A second update of codes and MET values. Med. Sci. Sports Exerc. 2011, 43, 1575–1581. [Google Scholar] [CrossRef]
- Bowling, A. Research Methods in Health: Investigating Health and Health Services, 4th ed.; McGraw-Hill Education: New York, NY, USA, 2014. [Google Scholar]
- Bowling, A. Mode of questionnaire administration can have serious effects on data quality. J. Public Health. 2005, 27, 281–291. [Google Scholar] [CrossRef]
- Scarapicchia, T.M.F.; Amireault, S.; Faulkner, G.; Sabiston, C.M. Social support and physical activity participation among healthy adults: A systematic review of prospective studies. Int. Rev. Sport Exerc. Psychol. 2017, 10, 50–83. [Google Scholar] [CrossRef]
- Peterman, J.E.; Loy, S.; Carlos, J.; Arena, R.; Kaminsky, L.A. Increasing physical activity in the community setting. Prog. Cardiovasc. Dis. 2021, 64, 27–32. [Google Scholar] [CrossRef] [PubMed]


| Variables | Category | n | % |
|---|---|---|---|
| Sociodemographics characteristics | |||
| Age group (yrs old) | 18–39 | 50 | 32.3 |
| 40–59 | 76 | 49.0 | |
| ≥60 | 29 | 18.7 | |
| Economic level | Low | 105 | 67.7 |
| High | 50 | 32.3 | |
| Education level | Elementary education or less | 63 | 40.6 |
| Junior high school | 71 | 45.8 | |
| High school or more | 21 | 13.5 | |
| Health conditions | |||
| Body mass index (kg/m2) | Normal weight | 66 | 42.6 |
| Overweight | 89 | 57.4 | |
| Hypertension | No | 121 | 78.1 |
| Yes | 34 | 21.9 | |
| Hyperglycemia | No | 148 | 95.5 |
| Yes | 7 | 4.5 | |
| Hypercholesterolemia | No | 132 | 85.2 |
| Yes | 23 | 14.8 | |
| Hypertriglyceridemia | No | 148 | 95.5 |
| Yes | 7 | 4.5 | |
| Comorbidities * | 0 | 105 | 67.7 |
| 1 | 33 | 21.3 | |
| 2 | 15 | 9.7 | |
| ≥3 | 2 | 1.3 | |
| Public Open Space (POS) Usage | |||
| Weekly frequency (times/week) | 1–2 | 45 | 29.0 |
| 3 | 47 | 30.3 | |
| 4 | 32 | 20.6 | |
| 5 | 31 | 20.0 | |
| Time spent at the POS (min/day) | ≤59 | 44 | 28.4 |
| 60 | 54 | 34.8 | |
| ≥61 | 57 | 36.8 | |
| Time of usage (yrs) | <1 | 26 | 16.8 |
| 1–2 | 41 | 26.5 | |
| >2 | 88 | 56.8 | |
| Intensity of main PA in POS | Light | 42 | 27.1 |
| Moderate-to-vigorous | 113 | 72.9 | |
| Average ± S.D. | Min.–Max. | |
|---|---|---|
| Valid days | 6.5 ± 2.8 | 4–13 |
| Valid days in POS | 2.5 ± 1.5 | 1–7 |
| Usage time per week (min) | 5807.2 ± 824.9 | 4413.0–9256.3 |
| Usage time in POS per week (min) | 189.4 ± 101.4 | 25.0–515.0 |
| Usage time in POS per day (min) | 66.4 ± 19.5 | 25.0–150.0 |
| Intensity | Median | Min.–Max. | IQR |
|---|---|---|---|
| LPA | 737.1 | 366.7–1398.5 | 187.7 |
| MPA | 82.7 | 0.5–265.7 | 63.4 |
| VPA | 2.5 | 0.0–66.0 | 11.6 |
| MVPA | 90.4 | 0.5–271.9 | 72.8 |
| Average ± S.D. | Min.–Max. | |
|---|---|---|
| Daily PA level | ||
| Time per week (min) | ||
| Light | 5116.7 ± 849.6 | 3467.8–8646.2 |
| Moderate | 639.6 ± 229.0 | 64.2–1246.0 |
| Vigorous | 45.8 ± 37.1 | 0.0–182.8 |
| Very vigorous | 14.4 ± 15.2 | 0.0–74.5 |
| Time per day (min) | ||
| Light | 700.1 ± 138.7 | 462.4–1285.4 |
| Moderate | 91.2 ± 32.6 | 9.2–178.0 |
| Vigorous | 6.2 ± 5.0 | 0.0–26.1 |
| Very vigorous | 1.9 ± 2.0 | 0.0–10.6 |
| PA level in POS | ||
| Time per week (min) | ||
| Light | 105.6 ± 57.6 | 19.7–400.5 |
| Moderate | 58.5 ± 44.5 | 5.5–206.0 |
| Vigorous | 18.2 ± 20.5 | 0.0–102.5 |
| Very vigorous | 8.3 ± 10.4 | 0.0–49.5 |
| Time per day (min) | ||
| Light | 38.9 ± 16.4 | 12.7–112.0 |
| Moderate | 20.2 ± 13.4 | 1.8–119.3 |
| Vigorous | 6.1 ± 5.4 | 0.0–25.7 |
| Very vigorous | 3.0 ± 3.9 | 0.0–29.5 |
| Crude Model β (S.E.) min/day | Model 1 β (S.E.) min/day | Model 2 β (S.E.) min/day | Model 3 β (S.E.) min/day | Model 4 β (S.E.) min/day | |
|---|---|---|---|---|---|
| Constant | 696.5 ± 126.5 | 741.6 ± 49.4 | 716.4 ± 16.5 | 748.2 ± 49.0 | 812.0 ± 80.8 |
| Sociodemographic characteristics | |||||
| Age group | −26.5 (14.3) | −26.8 (12.2) | −19.0 (21.2) | ||
| Economic level | 8.4 (21.8) | 6.2 (23.6) | 7.5 (24.2) | ||
| Education level | 8.2 (14.8) | −1.9 (16.9) | −7.3 (17.3) | ||
| Health conditions | |||||
| Body mass index | −27.2 (20.4) | −26.5 (20.5) | −25.3 (20.8) | ||
| Comorbidities # | −10.9 (13.1) | −10.2 (13.1) | −5.3 (14.2) | ||
| POS usage | |||||
| Weekly frequency | −3.3 (9.3) | −1.2 (9.3) | −1.2 (9.5) | ||
| Time spent | −20.7 (12.6) | −20.0 (12.7) | −41.6 (34.2) | ||
| Time of usage | −20.7 (13.3) | −16.4 (13.8) | −19.5 (13.2) | ||
| Intensity of main PA | 23.9 (22.8) | 17.2 (23.8) | −14.7 (14.2) | ||
| r2 | 2% | 1% | 2% | 5% | |
| p-value | 0.332 | 0.309 | 0.262 | 0.503 | |
| Crude Model β (S.E.) min/day | Model 1 β (S.E.) min/day | Model 2 β (S.E.) min/day | Model 3 β (S.E.) min/day | Model 4 β (S.E.) min/day | |
|---|---|---|---|---|---|
| Constant | 96.9 ± 42.1 | 125.4 ± 16.2 | 103.4 ± 5.5 | 44.3 ± 15.2 | 62.0 ± 25.0 |
| Sociodemographic characteristics | |||||
| Age group | −7.6 (4.8) | −10.8 (5.0) * | −0.9 (6.5) | ||
| Economic level | 3.7 (7.2) | 9.3 (7.7) | 5.2 (7.4) | ||
| Education level | −6.2 (4.9) | −12.0 (5.5) * | −8.1 (5.3) | ||
| Health conditions | |||||
| Body mass index | −8.3 (6.8) | −8.1 (6.8) | −8.9 (6.4) | ||
| Comorbidities # | −4.2 (4.2) | −4.0 (4.3) | −2.8 (4.4) | ||
| POS usage | |||||
| Weekly frequency | 11.8 (2.8) ** | 11.4 (2.9) ** | 10.9 (2.9) ** | ||
| Length of stay | 8.7 (4.1) * | 6.1 (3.9) | 5.0 (4.1) | ||
| Time of usage | 2.0 (4.4) | 1.5 (4.3) | 1.4 (4.3) | ||
| Intensity of main PA | 21.0 (7.4) ** | 22.0 (7.3) ** | 22.4 (9.6) * | ||
| r2 | 21.0 (7.4) ** | 9% | 2% | 14% | 14% |
| p-value | 0.052 | 0.312 | <0.001 | <0.001 | |
| Crude Model β (S.E.) min/day | Model 1 β (S.E.) min/day | Model 2 β (S.E.) min/day | Model 3 β (S.E.) min/day | Model 4 β (S.E.) min/day | |
|---|---|---|---|---|---|
| Constant | 38.4 ± 15.9 | 29.4 ± 5.9 | 36.9 ± 2.0 | 38.3 ± 5.6 | 36.1 ± 9.1 |
| Sociodemographic characteristics | |||||
| Age group | 5.9 (1.7) ** | 4.7 (1.8) * | 1.5 (2.4) | ||
| Economic level | 3.0 (2.7) * | 6.5 (2.8) * | 5.9 (2.7) * | ||
| Education level | −4.8 (1.8) ** | −5.1 (2.0) * | −4.7 (2.0) * | ||
| Health conditions | |||||
| Body Mass Index | 3.3 (2.5) | 3.4 (2.6) | 3.5 (2.4) | ||
| Comorbidities # | −1.0 (1.6) | −1.0 (1.6) | −1.2 (1.6) | ||
| POS usage | |||||
| Weekly frequency | −1.4 (1.1) | −2.2 (1.0) * | −2.5 (1.1) * | ||
| Length of stay | 6.2 (1.5) ** | 6.7 (0.3) ** | 6.0 (1.5) ** | ||
| Time of usage | 3.3 (1.6) * | 1.6 (1.6) | 1.0 (1.6) | ||
| Intensity of main PA | −8.6 (2.8) ** | −8.3 (2.7) ** | −6.3 (3.5) | ||
| r2 | 10% | 1% | 17% | 21% | |
| p-value | <0.001 | 0.318 | <0.001 | <0.001 | |
| Crude Model β (S.E.) min/day | Model 1 β (S.E.) min/day | Model 2 β (S.E.) min/day | Model 3 β (S.E.) min/day | Model 4 β (S.E.) min/day | |
|---|---|---|---|---|---|
| Constant | 28.6 ± 14.6 | 36.6 ± 5.7 | 30.5 ± 10.0 | 9.2 ± 4.2 | 14.4 ± 6.8 |
| Sociodemographic characteristics | |||||
| Age group | −3.3 (1.6) * | −3.4 (1.7) * | −2.1 (1.8) | ||
| Economic level | −1.0 (2.5) | −1.5 (2.7) | −3.8 (2.0) * | ||
| Education level | 0.8 (1.5) | 1.0 (1.9) | 2.3 (1.4) | ||
| Health conditions | |||||
| Body Mass Index | −2.5 (2.3) | −2.5 (2.3) | −2.1 (1.7) | ||
| Comorbidities # | −1.0 (1.5) | −1.1 (1.5) | 0.8 (1.2) | ||
| POS usage | |||||
| Weekly frequency | 3.5 (1.0) ** | 2.5 (0.8) ** | 2.4 (0.8) ** | ||
| Length of stay | 11.0 (1.1) ** | 10.4 (1.0) ** | 11.0 (1.1) ** | ||
| Time of usage | 0.08 (1.7) | −1.3 (1.1) | −1.0 (1.2) | ||
| Intensity of main PA | 9.0 (2.5) ** | 8.0 (2.0) ** | 5.9 (2.6) * | ||
| r2 | 1% | 1% | 45% | 46% | |
| p-value | 0.235 | 0.456 | <0.001 | <0.001 | |
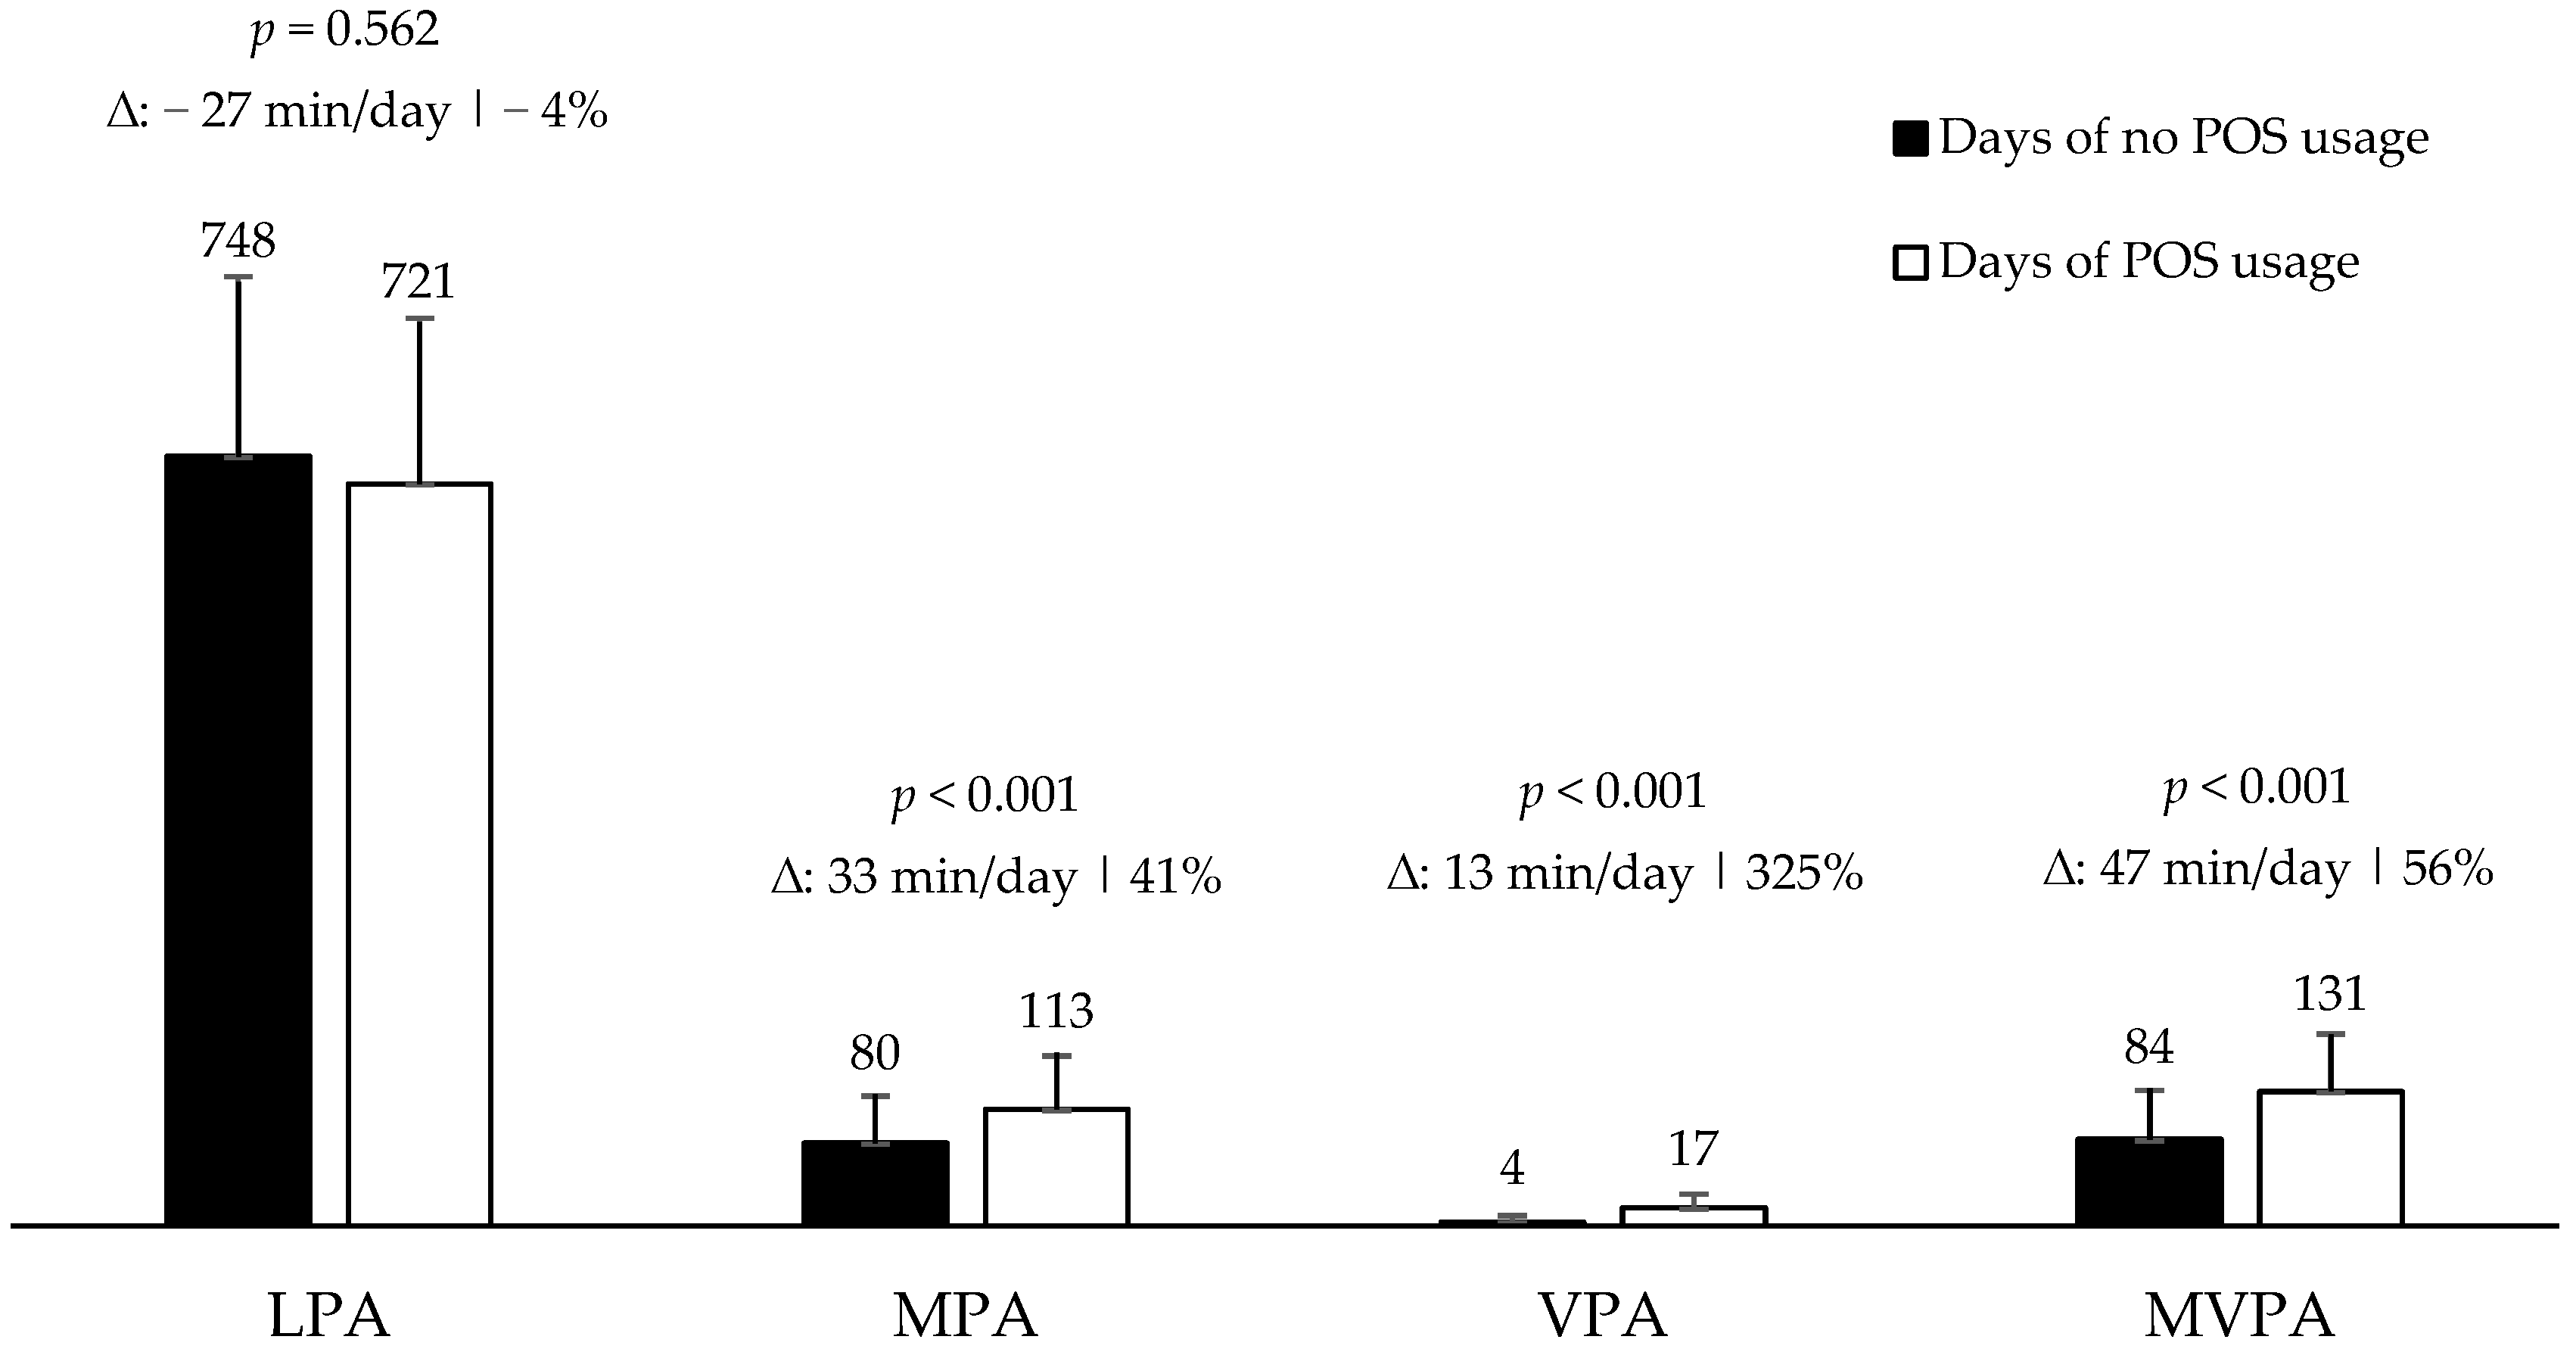
| Days of No POS Usage | Days of POS Usage | All Day | |||||||
|---|---|---|---|---|---|---|---|---|---|
| Intensity | Median | Min.–Max. | IQR | Median | Min.–Max. | IQR | Median | Min.–Max. | IQR |
| LPA | 738.3 | 366.7–1398.5 | 175.5 | 728.5 | 366.7–1334.7 | 215.0 | 737.1 | 366.7–1398.5 | 187.7 |
| MPA | 72.0 | 0.5–265.7 | 57.2 | 105.5 * | 8.0–265.7 | 70.5 | 82.7 | 0.5–265.7 | 63.4 |
| VPA | 1.2 | 0.0–66.0 | 2.8 | 14.7 * | 0–66.0 | 16.5 | 2.5 | 0–66.0 | 11.6 |
| MVPA | 76.2 | 0.5–271.9 | 59.5 | 123.2 * | 9.2–271.7 | 75.2 | 90.4 | 0.5–271.9 | 72.8 |
Disclaimer/Publisher’s Note: The statements, opinions and data contained in all publications are solely those of the individual author(s) and contributor(s) and not of MDPI and/or the editor(s). MDPI and/or the editor(s) disclaim responsibility for any injury to people or property resulting from any ideas, methods, instructions or products referred to in the content. |
© 2023 by the authors. Licensee MDPI, Basel, Switzerland. This article is an open access article distributed under the terms and conditions of the Creative Commons Attribution (CC BY) license (https://creativecommons.org/licenses/by/4.0/).
Share and Cite
Funez, E.I.B.; da Silva, A.T.; dos Santos, L.P.; Rodriguez-Añez, C.R.; de Paula da Silva, A.A.; Fermino, R.C. What Is the Contribution of Community Programs to the Physical Activity of Women? A Study Based on Public Open Spaces in Brazil. Behav. Sci. 2023, 13, 718. https://doi.org/10.3390/bs13090718
Funez EIB, da Silva AT, dos Santos LP, Rodriguez-Añez CR, de Paula da Silva AA, Fermino RC. What Is the Contribution of Community Programs to the Physical Activity of Women? A Study Based on Public Open Spaces in Brazil. Behavioral Sciences. 2023; 13(9):718. https://doi.org/10.3390/bs13090718
Chicago/Turabian StyleFunez, Eduardo Irineu Bortoli, Alice Tatiane da Silva, Letícia Pechnicki dos Santos, Ciro Romelio Rodriguez-Añez, Alexandre Augusto de Paula da Silva, and Rogério César Fermino. 2023. "What Is the Contribution of Community Programs to the Physical Activity of Women? A Study Based on Public Open Spaces in Brazil" Behavioral Sciences 13, no. 9: 718. https://doi.org/10.3390/bs13090718
APA StyleFunez, E. I. B., da Silva, A. T., dos Santos, L. P., Rodriguez-Añez, C. R., de Paula da Silva, A. A., & Fermino, R. C. (2023). What Is the Contribution of Community Programs to the Physical Activity of Women? A Study Based on Public Open Spaces in Brazil. Behavioral Sciences, 13(9), 718. https://doi.org/10.3390/bs13090718