
Assessing the Capability of Government Information Intervention and Socioeconomic Factors of Information Sharing during the COVID-19 Pandemic: A Cross-Country Study Using Big Data Analytics


Abstract
:1. Introduction
2. Government Information Intervention to Health Risk
3. Risk Communication and the Resilience of Infectious Disease
4. Materials and Methods
4.1. Data Collection
4.2. Citation Network Analysis
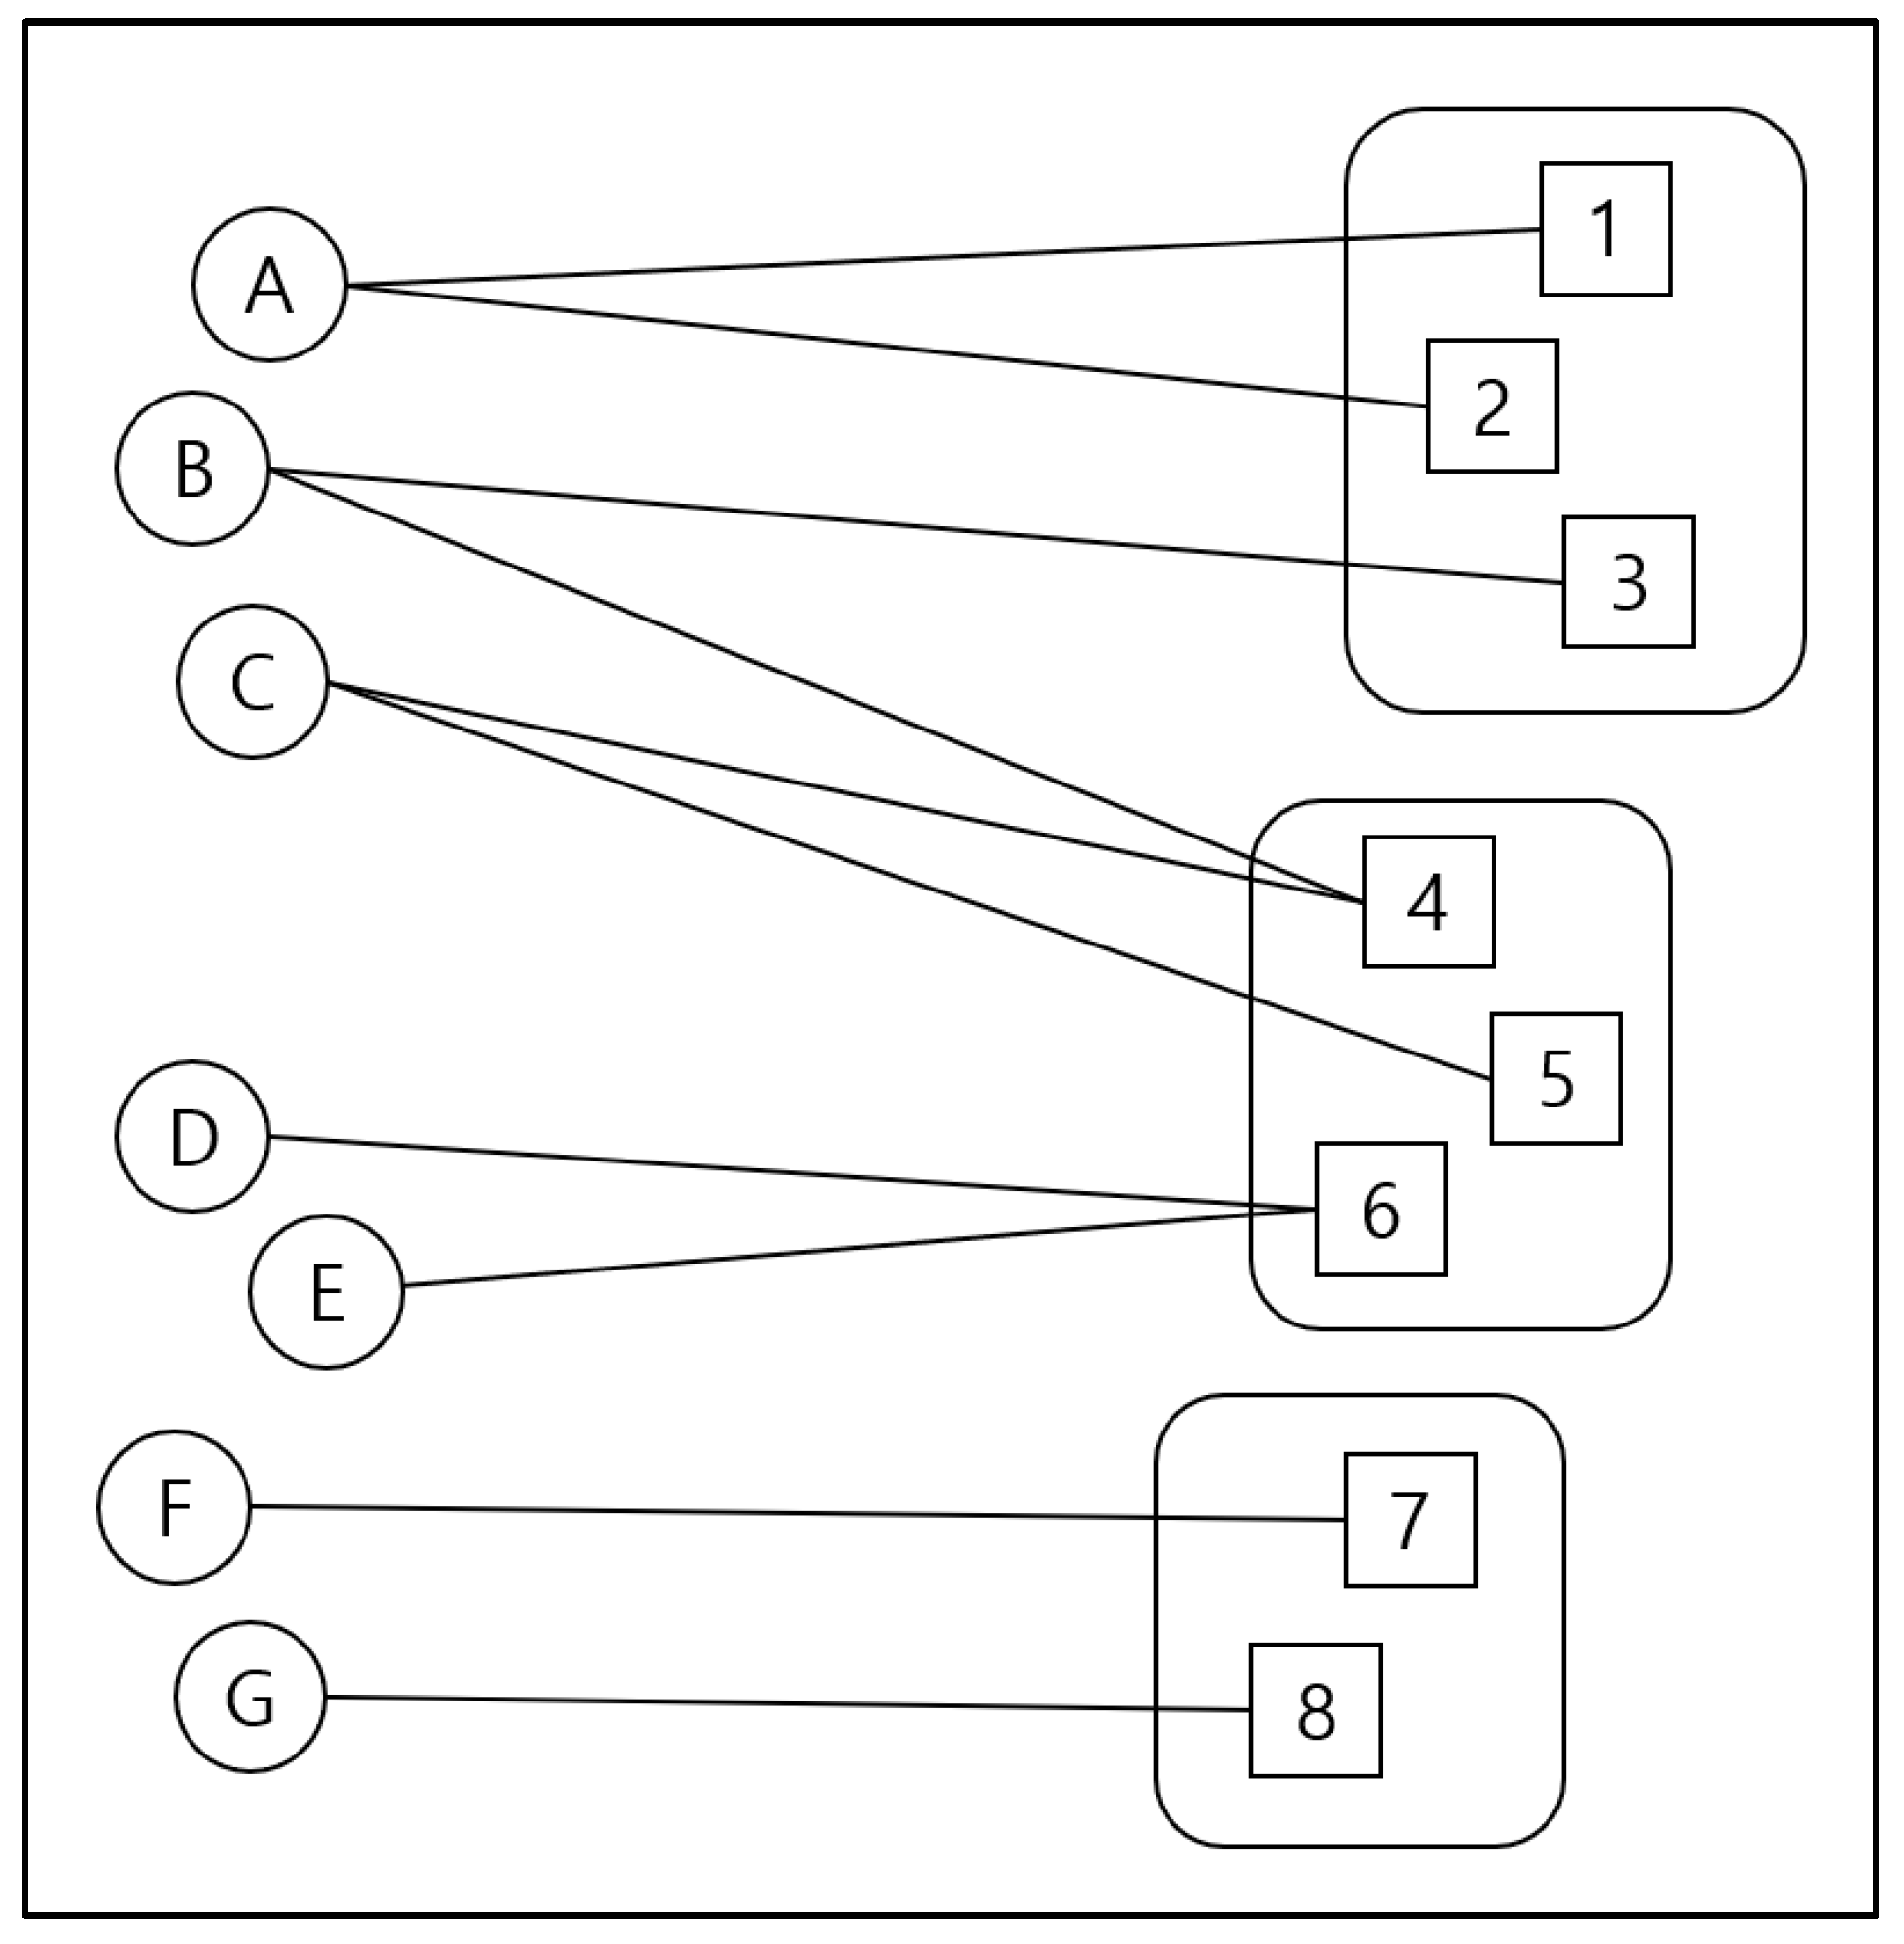
4.3. Bipartite Exponential Random Graph Modeling (ERGM)
4.3.1. Country-Level Variables of Health Organizations
4.3.2. TLD Types
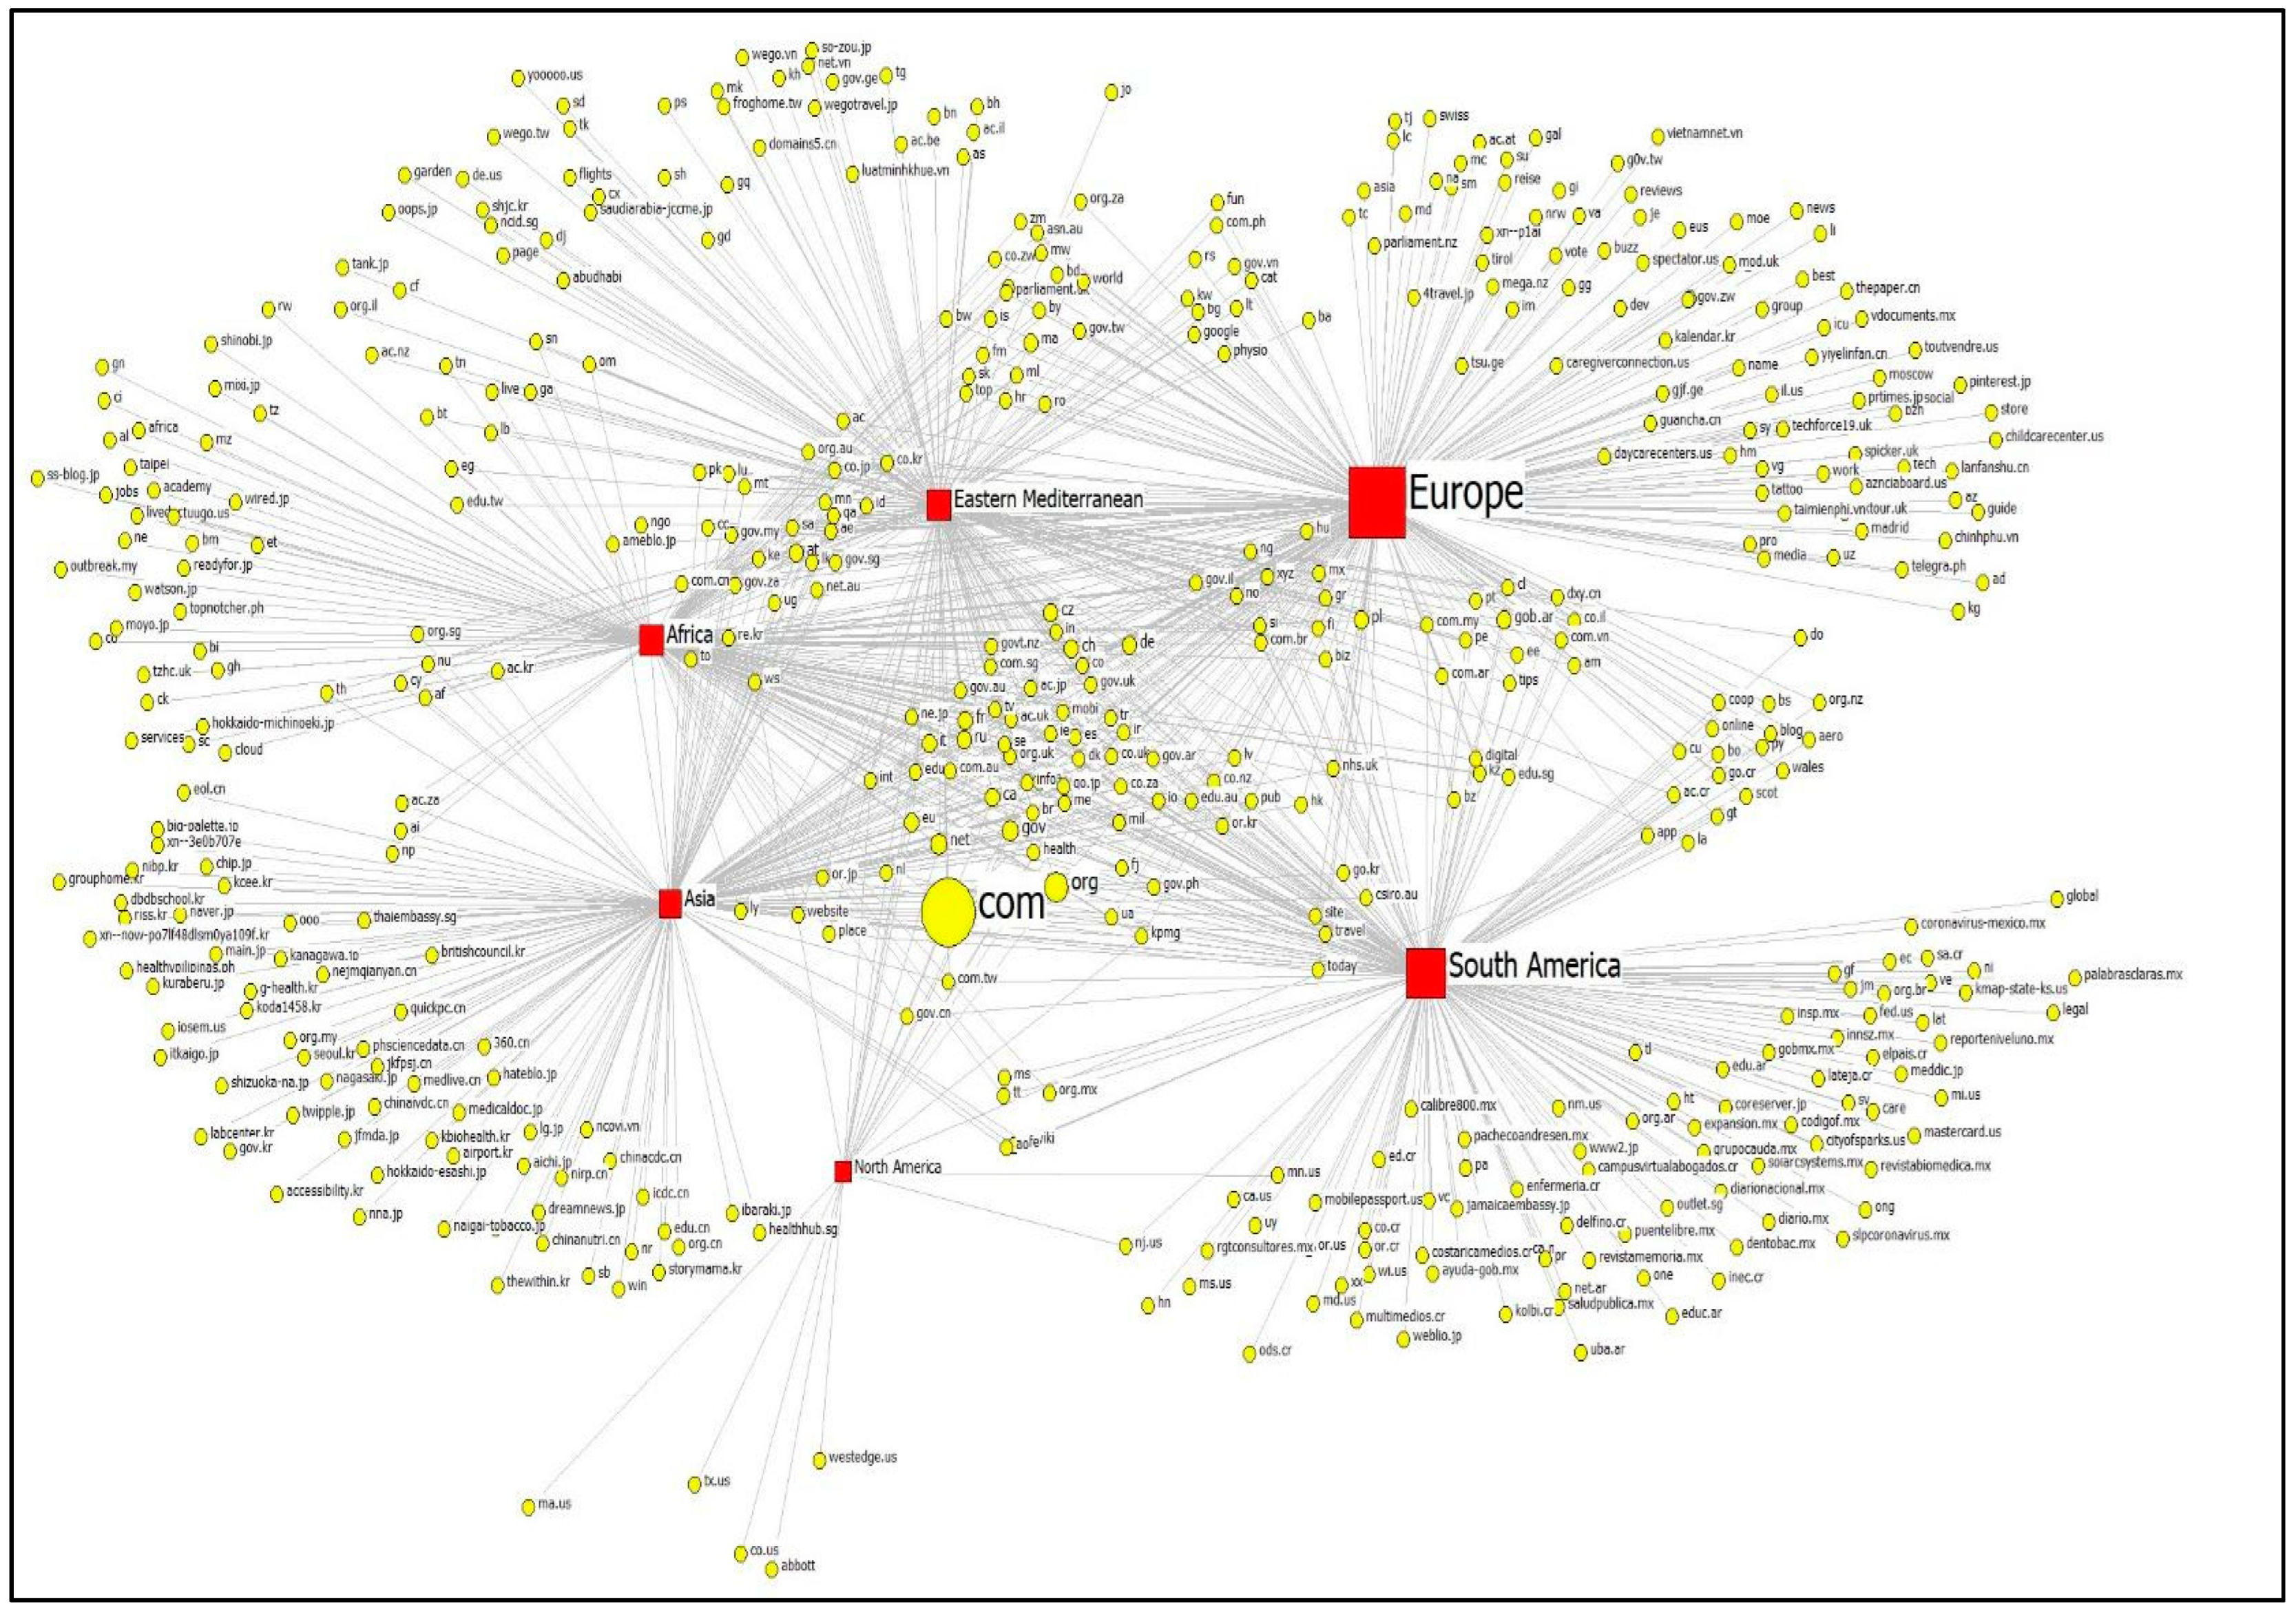
5. Results
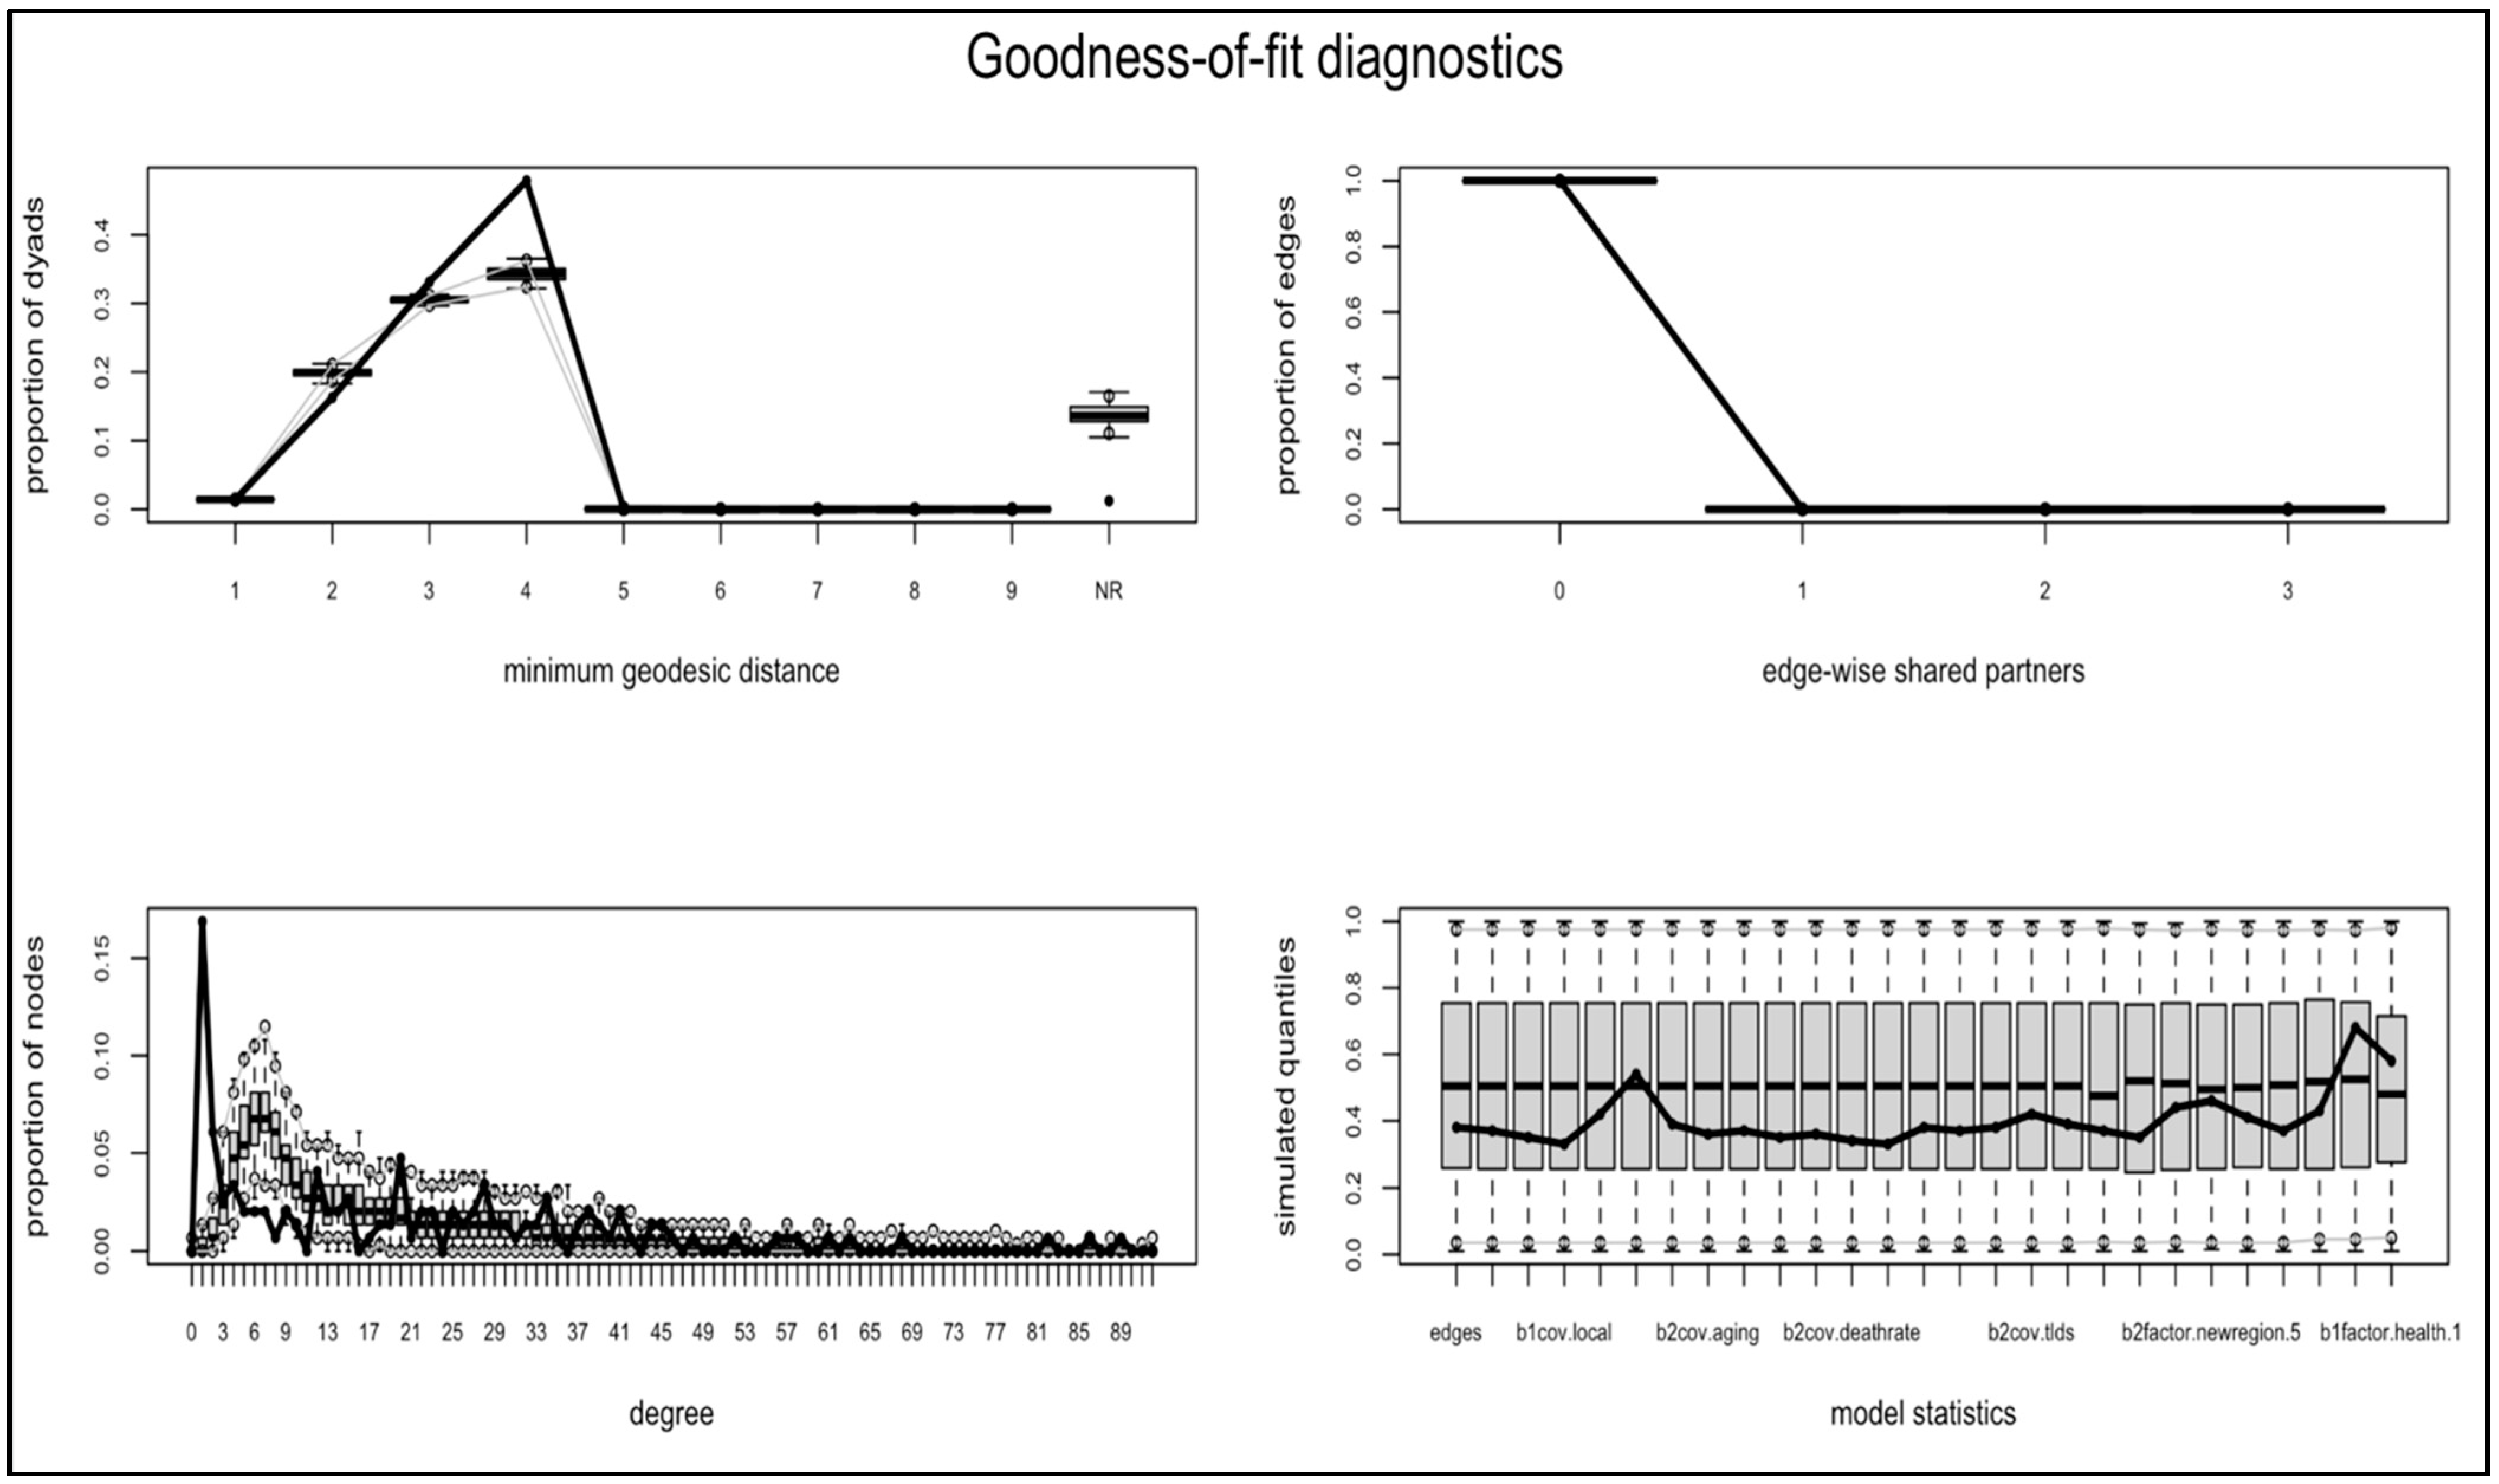
Bipartite ERGM Results
6. Discussion and Conclusions
Author Contributions
Funding
Institutional Review Board Statement
Informed Consent Statement
Data Availability Statement
Conflicts of Interest
References
- Gallotti, R.; Valle, F.; Castaldo, N.; Sacco, P.; De Domenico, M. Assessing the risks of ‘infodemics’ in response to COVID-19 epidemics. Nat. Hum. Behav. 2020, 4, 1285–1293. [Google Scholar] [CrossRef]
- Patel, M.P.; Kute, V.B.; Agarwal, S.K. COVID-19 Working Group of Indian Society of Nephrology. “Infodemic” COVID 19: More pandemic than the virus. Indian J. Nephrol. 2020, 30, 188. [Google Scholar] [CrossRef]
- Ferguson, N. Capturing Human Behaviour. Nature 2007, 446, 733. [Google Scholar] [CrossRef]
- Ruan, Z.; Tang, M.; Liu, Z. Epidemic spreading with information-driven vaccination. Phys. Rev. E 2012, 86, 036117. [Google Scholar] [CrossRef] [Green Version]
- Taha, S.A.; Matheson, K.; Anisman, H. H1N1 was not all that scary: Uncertainty and stressor appraisals predict anxiety related to a coming viral threat. Stress Health 2014, 30, 149–157. [Google Scholar] [CrossRef]
- Jones, N.M.; Thompson, R.R.; Schetter, C.D.; Silver, R.C. Distress and rumor exposure on social media during a campus lockdown. Proc. Natl. Acad. Sci. USA 2017, 114, 11663–11668. [Google Scholar] [CrossRef] [Green Version]
- Sun, Y.; Hu, Q.; Grossman, S.; Basnyat, I.; Wang, P. Comparison of COVID-19 Information seeking, trust of information sources, and protective behaviors in China and the US. J. Health Commun. 2021, 26, 657–666. [Google Scholar] [CrossRef]
- Choi, J.A.; Park, S. Infodemiological study on the use of face masks during Covid-19: Comparing US and Korea. Druš. Istraž. Čas. Opća Druš. Pitanja 2021, 30, 359–378. [Google Scholar] [CrossRef]
- Lu, Y.; Ji, Z.; Zhang, X.; Zheng, Y.; Liang, H. Re-thinking the role of government information intervention in the COVID-19 pandemic: An agent-based modeling analysis. Int. J. Environ. Res. Public Health 2021, 18, 147. [Google Scholar] [CrossRef]
- Hua, J.; Shaw, R. Corona virus (COVID-19) “infodemic” and emerging issues through a data lens: The case of china. Int. J. Environ. Res. Public Health 2020, 17, 2309. [Google Scholar] [CrossRef] [Green Version]
- Tang, B.; Wang, X.; Li, Q.; Bragazzi, N.L.; Tang, S.; Xiao, Y.; Wu, J. Estimation of the transmission risk of the 2019-nCoV and its implication for public health interventions. J. Clin. Med. 2020, 9, 462. [Google Scholar] [CrossRef] [Green Version]
- Yin, S.; Zhang, N.; Dong, H. Preventing COVID-19 from the perspective of industrial information integration: Evaluation and continuous improvement of information networks for sustainable epidemic prevention. J. Ind. Inf. Integr. 2020, 19, 100157. [Google Scholar] [CrossRef]
- Park, S.; Chung, D.; Park, H.W. Analytical framework for evaluating digital diplomacy using network analysis and topic modeling: Comparing South Korea and Japan. Inf. Process. Manag. 2019, 56, 1468–1483. [Google Scholar] [CrossRef] [Green Version]
- Bragazzi, N.L.; Watad, A.; Brigo, F.; Adawi, M.; Amital, H.; Shoenfeld, Y. Public health awareness of autoimmune diseases after the death of a celebrity. Clin. Rheumatol. 2017, 36, 1911–1917. [Google Scholar] [CrossRef]
- Jung, K.; Park, S.; Wu, W.N.; Park, H.W. A webometric approach to policy analysis and management using exponential random graph models. Qual. Quant. 2015, 49, 581–598. [Google Scholar] [CrossRef]
- Park, S.; Park, H.W. Diffusion of cryptocurrencies: Web traffic and social network attributes as indicators of cryptocurrency performance. Qual. Quant. 2020, 54, 297–314. [Google Scholar] [CrossRef]
- Eysenbach, G. Infodemiology and infoveillance: Framework for an emerging set of public health informatics methods to analyze search, communication and publication behavior on the Internet. J. Med. Internet Res. 2009, 11, e1157. [Google Scholar] [CrossRef]
- Barbour, J.B.; Bierling, D.H.; Sommer, P.A.; Trefz, B.A. Risk communication infrastructure and community resilience: Does involvement in planning build cross-sector planning and response networks? J. Appl. Commun. Res. 2020, 48, 91–113. [Google Scholar] [CrossRef]
- Kim, K.H.; Tandi, T.E.; Choi, J.W.; Moon, J.M.; Kim, M.S. Middle East respiratory syndrome coronavirus (MERS-CoV) outbreak in South Korea, 2015: Epidemiology, characteristics and public health implications. J. Hosp. Infect. 2017, 95, 207–213. [Google Scholar] [CrossRef] [Green Version]
- Huang, Y.; Yang, C. A metacognitive approach to reconsidering risk perceptions and uncertainty: Understand information seeking during COVID-19. Sci. Commun. 2020, 42, 616–642. [Google Scholar] [CrossRef]
- Entress, R.; Tyler, J.; Sadiq, A.A. Managing mass fatalities during COVID-19: Lessons for promoting community resilience during global pandemics. Public Adm. Rev. 2020, 80, 856–861. [Google Scholar] [CrossRef]
- Yoosefi Lebni, J.; Abbas, J.; Moradi, F.; Salahshoor, M.R.; Chaboksavar, F.; Irandoost, S.F.; Nezhaddadgar, N.; Ziapour, A. How the COVID-19 pandemic effected economic, social, political, and cultural factors: A lesson from Iran. Int. J. Soc. Psychiatry 2021, 67, 298–300. [Google Scholar] [CrossRef]
- Thelwall, M.; Sud, P. A comparison of methods for collecting web citation data for academic organisations. J. Am. Soc. Inf. Sci. Technol. 2011, 62, 1488–1497. [Google Scholar] [CrossRef]
- Bickley, M.S.; Kousha, K.; Thelwall, M. Can the impact of grey literature be assessed? An investigation of UK government publications cited by articles and books. Scientometrics 2020, 125, 1425–1444. [Google Scholar] [CrossRef]
- Hubbard, D.W. Pulse: The New Science of Harnessing Internet Buzz to Track Threats and Opportunities; Wiley: Hoboken, NJ, USA, 2011. [Google Scholar]
- Yang, Y.; Pan, B.; Song, H. Predicting hotel demand using destination marketing organization’s web traffic data. J. Travel Res. 2014, 53, 433–447. [Google Scholar] [CrossRef] [Green Version]
- Wang, P.; Pattison, P.; Robins, G. Exponential random graph model specifications for bipartite networks—A dependence hierarchy. Soc. Netw. 2013, 35, 211–222. [Google Scholar] [CrossRef]
- Shumate, M.; Hsieh, Y.P.; O’Connor, A. A nonprofit perspective on business–nonprofit partnerships: Extending the symbiotic sustainability model. Bus. Soc. 2018, 57, 1337–1373. [Google Scholar] [CrossRef]
- Wang, R. Marginality and team building in collaborative crowdsourcing. Online Inf. Rev. 2020, 44, 827–846. [Google Scholar] [CrossRef]
- Snijders, T.A.; Pattison, P.E.; Robins, G.L.; Handcock, M.S. New specifications for exponential random graph models. Sociol. Methodol. 2006, 36, 99–153. [Google Scholar] [CrossRef]
- Johns Hopkins University. COVID-19 Dashboard. Center for Systems Science and Engineering at Johns Hopkins University. Available online: https://coronavirus.jhu.edu/ (accessed on 1 July 2021).
- Valente, T.W. Social Networks and Health: Models, Methods, and Applications; Oxford University Press: New York, NY, USA, 2010. [Google Scholar]
- Hunter, D.R.; Goodreau, S.M.; Handcock, M.S. Goodness of fit of social network models. J. Am. Stat. Assoc. 2008, 103, 248–258. [Google Scholar] [CrossRef]
- Bilancini, E.; Boncinelli, L.; Capraro, V.; Celadin, T.; Di Paolo, R. The effect of norm-based messages on reading and understanding COVID-19 pandemic response governmental rules. arXiv 2020, arXiv:2005.03998. [Google Scholar]
- Fetzer, T.R.; Witte, M.; Hensel, L.; Jachimowicz, J.; Haushofer, J.; Ivchenko, A.; Caria, S.; Reutskaja, E.; Roth, C.; Fiorin, S.; et al. Global Behaviors and Perceptions at the Onset of the COVID-19 Pandemic (No. w27082). Natl. Bur. Econ. Res. 2020, 1–45. [Google Scholar] [CrossRef]
- Mavragani, A. Tracking COVID-19 in Europe: Infodemiology approach. JMIR Public Health Surveill. 2020, 6, e18941. [Google Scholar] [CrossRef] [PubMed] [Green Version]
- Gibney, E. Whose coronavirus strategy worked best? Scientists hunt most effective policies Researchers sift through data to compare nations’ vastly different containment measures. Nature 2020, 581, 15–16. [Google Scholar] [CrossRef] [PubMed]
- Anttiroiko, A.V. Successful government responses to the pandemic: Contextualizing national and urban responses to the COVID-19 outbreak in east and west. Int. J. E-Plan. Res. (IJEPR) 2021, 10, 1–17. [Google Scholar] [CrossRef]
- Vestal, C. Compliance and Defiance: States React to New CDC Mask Guidelines. PEW. Available online: https://www.pewtrusts.org/en/research-and-analysis/blogs/stateline/2021/08/03/compliance-and-defiance-states-react-to-new-cdc-mask-guidelines (accessed on 3 August 2021).
- CDC. What We Know about Quarantine and Isolation. Centers for Disease Control and Prevention. Available online: https://www.cdc.gov/coronavirus/2019-ncov/if-you-are-sick/quarantine-isolation-background.html (accessed on 25 February 2022).
- Batova, T. To wear or not to wear: A commentary on mistrust in public comments to CDC tweets about mask-wearing during COVID19. Int. J. Bus. Commun. 2021, 59, 287–308. [Google Scholar] [CrossRef]
- Elgar, F.J.; Stefaniak, A.; Wohl, M.J. The trouble with trust: Time-series analysis of social capital, income inequality, and COVID-19 deaths in 84 countries. Soc. Sci. Med. 2020, 263, 113365. [Google Scholar] [CrossRef]
- Ágh, T.; van Boven, J.F.; Wettermark, B.; Menditto, E.; Pinnock, H.; Tsiligianni, I.; Petrova, G.; Potočnjak, I.; Kamberi, F.; Kardas, P.; et al. A cross-sectional survey on medication management practices for noncommunicable diseases in Europe during the second wave of the COVID-19 pandemic. Front. Pharmacol. 2021, 12, 1433. [Google Scholar] [CrossRef]
- Enders, A.M.; Uscinski, J.E.; Klofstad, C.; Stoler, J. The different forms of COVID-19 misinformation and their consequences. Harv. Kennedy Sch. Misinform. Rev. 2020, 1, 1–21. [Google Scholar] [CrossRef]
- Rotter, D.; Doebler, P.; Schmitz, F. Interests, Motives, and Psychological Burdens in Times of Crisis and Lockdown: Google Trends Analysis to Inform Policy Makers. J. Med. Internet Res. 2021, 23, e26385. [Google Scholar] [CrossRef]


| Regions | Degree | Closeness | Betweenness |
|---|---|---|---|
| Europe | 0.48031497 | 0.42656952 | 0.101202324 |
| South America | 0.39763778 | 0.41675794 | 0.087235093 |
| Eastern Mediterranean | 0.34055117 | 0.41024259 | 0.055006839 |
| Asia | 0.32874015 | 0.40891993 | 0.067508161 |
| Africa | 0.30511811 | 0.40630007 | 0.046052024 |
| North America | 0.04724409 | 0.37974051 | 0.005251393 |
| TLDs | Degree | Closeness | Betweenness |
|---|---|---|---|
| com | 0.011811024 | 0.428974062 | 0.001684475 |
| org | 0.011811024 | 0.428974062 | 0.001684475 |
| gov | 0.011811024 | 0.428974062 | 0.001684475 |
| net | 0.011811024 | 0.428974062 | 0.001684475 |
| de | 0.00984252 | 0.427528083 | 0.001309713 |
| it | 0.00984252 | 0.427528083 | 0.001309713 |
| ca | 0.011811024 | 0.428974062 | 0.001684475 |
| cz | 0.00984252 | 0.427528083 | 0.001309713 |
| fr | 0.00984252 | 0.427528083 | 0.001309713 |
| ch | 0.00984252 | 0.427528083 | 0.001309713 |
| ru | 0.00984252 | 0.427528083 | 0.001309713 |
| at | 0.007874016 | 0.408042908 | 0.000639691 |
| pl | 0.007874016 | 0.412689805 | 0.000698267 |
| gob.ar | 0.005905512 | 0.40457204 | 0.000421699 |
| ma | 0.005905512 | 0.393892348 | 0.000243672 |
| eu | 0.011811024 | 0.428974062 | 0.001684475 |
| cl | 0.005905512 | 0.40457204 | 0.000421699 |
| edu | 0.011811024 | 0.428974062 | 0.001684475 |
| be | 0.00984252 | 0.427528083 | 0.001309713 |
| es | 0.00984252 | 0.427528083 | 0.001309713 |
| ro | 0.005905512 | 0.393892348 | 0.000243672 |
| int | 0.011811024 | 0.428974062 | 0.001684475 |
| lt | 0.003937008 | 0.385707051 | 0.00009826798 |
| pe | 0.005905512 | 0.40457204 | 0.000421699 |
| ie | 0.00984252 | 0.427528083 | 0.001309713 |
| info | 0.011811024 | 0.428974062 | 0.001684475 |
| uy | 0.001968504 | 0.366041362 | 0 |
| gov.au | 0.00984252 | 0.427528083 | 0.001309713 |
| dk | 0.00984252 | 0.427528083 | 0.001309713 |
| pt | 0.005905512 | 0.40457204 | 0.000421699 |
| Parameter | Estimate | S.E. | p Value |
|---|---|---|---|
| Edges | −7.32 | 0.43 | <0.001 |
| b1cov. degree | 43.97 | 3.80 | <0.001 |
| b1cov.eigenvector_degree | −141.60 | 11.25 | <0.001 |
| b1cov.local | 644.50 | 46.55 | <0.001 |
| b1cov.closeness | −0.001 | 0.001 | 0.25 |
| b1cov.betweenness | −96.87 | 8.69 | <0.001 |
| b2cov.population.logged | 0.01 | 0.01 | 0.31 |
| b2cov.aging | −1.28 × 10⁻⁵ | 2.88 × 10⁻⁴ | 0.96 |
| B2cov.GDP.per.capita | 5.03 × 10⁻⁶ | 1.15 × 10⁻⁶ | <0.001 |
| b2cov.incomeinequality | 0.01 | 0.006 | 0.02 |
| b2cov.gini | −0.003 | 0.008 | 0.72 |
| b2cov.ihdi | −0.25 | 0.33 | 0.44 |
| b2cov.deathrate | −1.10 | 0.92 | 0.23 |
| b2cov.casepercentage | 1.06 | 3.99 | 0.79 |
| b2cov.urls | 0.008 | 0.001 | <0.001 |
| b2cov.sites | −0.001 | 0.001 | 0.27 |
| b2cov.domains | −0.007 | 0.001 | <0.001 |
| b2cov.tlds | 0.01 | 0.006 | 0.04 |
| b2cov.stlds | 0.03 | 0.005 | <0.001 |
| b2factor_North_America | −0.02 | 0.27 | 0.94 |
| b2factor_South_America | 0.39 | 0.11 | <0.001 |
| b2factor_Eastern Mediterranean | 0.21 | 0.12 | 0.08 |
| b2factor_Europe | 0.51 | 0.13 | <0.001 |
| b2factor_Asia | 0.46 | 0.12 | <0.001 |
| b1factor_cctld | 0.06 | 0.08 | 0.45 |
| b1factor_allpublic | −0.33 | 0.14 | 0.016 |
| b1factor_business | 0.39 | 0.20 | 0.047 |
| b1factor_health | 0.35 | 0.30 | 0.24 |
| AIC = 15,504; BIC = 15,762 | |||
Publisher’s Note: MDPI stays neutral with regard to jurisdictional claims in published maps and institutional affiliations. |
© 2022 by the authors. Licensee MDPI, Basel, Switzerland. This article is an open access article distributed under the terms and conditions of the Creative Commons Attribution (CC BY) license (https://creativecommons.org/licenses/by/4.0/).
Share and Cite
Park, S.; Wang, R. Assessing the Capability of Government Information Intervention and Socioeconomic Factors of Information Sharing during the COVID-19 Pandemic: A Cross-Country Study Using Big Data Analytics. Behav. Sci. 2022, 12, 190. https://doi.org/10.3390/bs12060190
Park S, Wang R. Assessing the Capability of Government Information Intervention and Socioeconomic Factors of Information Sharing during the COVID-19 Pandemic: A Cross-Country Study Using Big Data Analytics. Behavioral Sciences. 2022; 12(6):190. https://doi.org/10.3390/bs12060190
Chicago/Turabian StylePark, Sejung, and Rong Wang. 2022. "Assessing the Capability of Government Information Intervention and Socioeconomic Factors of Information Sharing during the COVID-19 Pandemic: A Cross-Country Study Using Big Data Analytics" Behavioral Sciences 12, no. 6: 190. https://doi.org/10.3390/bs12060190
APA StylePark, S., & Wang, R. (2022). Assessing the Capability of Government Information Intervention and Socioeconomic Factors of Information Sharing during the COVID-19 Pandemic: A Cross-Country Study Using Big Data Analytics. Behavioral Sciences, 12(6), 190. https://doi.org/10.3390/bs12060190