
Alcohol Use and Prefrontal Cortex Volume Trajectories in Young Adults with Mood Disorders and Associated Clinical Outcomes

 , , ,
, , ,
Abstract
1. Introduction
2. Materials and Methods
2.1. Participants
2.2. Structural MRI Acquisition and Preprocessing
2.3. Assessment of Recent Substance Use
2.4. Longitudinal Interval Follow-Up Evaluation
2.5. Statistical Analyses
2.5.1. Between-Group Differences in Demographics and Baseline Clinical Factors and Alcohol Use
2.5.2. Alcohol Use and Prefrontal Cortex Structure
2.5.3. Associations between Alcohol Use and PFC Volume Change with Prospective Mood Symptoms
2.5.4. Exploratory Analysis on the Effect of Mood Disorder Diagnosis
3. Results
3.1. Between Group Differences in Demographics and Baseline Clinical Factors
3.2. Alcohol Use and Prefrontal Cortex Structure
3.3. Associations between Alcohol Use and Volume Change with Prospective Mood Symptoms
3.4. Exploratory Analysis on the Effects of Mood Disorder Diagnosis
4. Discussion
Limitations
Author Contributions
Funding
Institutional Review Board Statement
Informed Consent Statement
Data Availability Statement
Acknowledgments
Conflicts of Interest
References
- Kessler, R.C.; Nelson, C.B.; McGonagle, K.A.; Edlund, M.J.; Frank, R.G.; Leaf, P.J. The epidemiology of cooccurring addictive and mental disorders: Implications for prevention and service utilization. Am. J. Orthopsychiatr. 1996, 66, 17–31. [Google Scholar] [CrossRef] [PubMed]
- Goldberg, J.F. Bipolar disorder with comorbid substance abuse: Diagnosis, prognosis, and treatment. J. Psychiatr. Pract. 2001, 7, 109–122. [Google Scholar] [CrossRef] [PubMed]
- Sullivan, L.E.; Fiellin, D.A.; O’Connor, P.G. The prevalence and impact of alcohol problems in major depression: A systematic review. Am. J. Med. 2005, 118, 330–341. [Google Scholar] [CrossRef]
- Boschloo, L.; Vogelzangs, N.; Brink, W.V.D.; Smit, J.H.; Veltman, D.J.; Beekman, A.T.F.; Penninx, B.W.J.H. Alcohol use disorders and the course of depressive and anxiety disorders. Br. J. Psychiatry 2012, 200, 476–484. [Google Scholar] [CrossRef]
- Messer, T.; Lammers, G.; Müller-Siecheneder, F.; Schmidt, R.-F.; Latifi, S. Substance abuse in patients with bipolar disorder: A systematic review and meta-analysis. Psychiatry Res. 2017, 253, 338–350. [Google Scholar] [CrossRef] [PubMed]
- McHugh, R.K.; Weiss, R.D. Alcohol use disorder and depressive disorders. Alcohol Res. 2019, 40, e1–e8. [Google Scholar] [CrossRef] [PubMed]
- Nery, F.G.; Miranda-Scippa, A.; Nery-Fernandes, F.; Kapczinski, F.; Lafer, B. Prevalence and clinical correlates of alcohol use disorders among bipolar disorder patients: Results from the Brazilian Bipolar Research Network. Compr. Psychiatry 2014, 55, 1116–1121. [Google Scholar] [CrossRef]
- Goldstein, B.I.; Velyvis, V.P.; Parikh, S.V. The association between moderate alcohol use and illness severity in bipolar disorder: A preliminary report. J. Clin. Psychiatry 2006, 67, 102–106. [Google Scholar] [CrossRef]
- Strakowski, S.M.; DelBello, M.P.; Fleck, D.E.; Adler, C.M.; Anthenelli, R.M.; Keck, P.E.; Arnold, L.M.; Amicone, J. Effects of co-occurring alcohol abuse on the course of bipolar disorder following a first hospitalization for mania. Arch. Gen. Psychiatry 2005, 62, 851–858. [Google Scholar] [CrossRef]
- Strakowski, S.M.; DelBello, M.P.; Fleck, E.D.; Arndt, S. The impact of substance abuse on the course of bipolar disorder. Biol. Psychiatry 2000, 48, 477–485. [Google Scholar] [CrossRef]
- Cardoso, T.D.A.; Bauer, I.E.; Jansen, K.; Suchting, R.; Zunta-Soares, G.; Quevedo, J.; Glahn, D.C.; Soares, J.C. Effect of alcohol and illicit substance use on verbal memory among individuals with bipolar disorder. Psychiatry Res. 2016, 243, 225–231. [Google Scholar] [CrossRef] [PubMed]
- Sánchez-Moreno, J.; Martinez-Arán, A.; Colom, F.; Scott, J.; Tabarés-Seisdedos, R.; Sugranyes, G.; Torrent, C.; Daban, C.; Benabarre, A.; Goikolea, J.M.; et al. Neurocognitive dysfunctions in euthymic bipolar patients with and without prior history of alcohol use. J. Clin. Psychiatry 2009, 70, 1120–1127. [Google Scholar] [CrossRef] [PubMed]
- Nery, F.G.; Hatch, J.P.; Monkul, E.S.; Matsuo, K.; Zunta-Soares, G.B.; Bowden, C.L.; Soares, J.C. Trait impulsivity is increased in bipolar disorder patients with comorbid alcohol use disorders. Psychopathology 2013, 46, 145–152. [Google Scholar] [CrossRef] [PubMed]
- Currie, S.R.; Patten, S.B.; Williams, J.V.; Wang, J.; Beck, A.C.; El-Guebaly, N.; Maxwell, C. Comorbidity of major depression with substance use disorders. Can. J. Psychiatry 2005, 50, 660–666. [Google Scholar] [CrossRef]
- Davis, L.; Uezato, A.; Newell, J.M.; Frazier, E. Major depression and comorbid substance use disorders. Curr. Opin. Psychiatry 2008, 21, 14–18. [Google Scholar] [CrossRef]
- Oquendo, M.A.; Currier, D.; Liu, S.M.; Hasin, D.S.; Grant, B.F.; Blanco, C. Increased risk for suicidal behavior in comorbid bipolar disorder and alcohol use disorders: Results from the National Epidemiologic Survey on Alcohol and Related Conditions (NESARC). J. Clin. Psychiatry 2010, 71, 902–909. [Google Scholar] [CrossRef]
- Finseth, P.I.; Morken, G.; Andreassen, O.A.; Malt, U.F.; Vaaler, A.E. Risk factors related to lifetime suicide attempts in acutely admitted bipolar disorder in patients. Bipolar Disord. 2012, 14, 727–734. [Google Scholar] [CrossRef]
- McGrady, A.; Lynch, D.; Rapport, D. Psychosocial factors and comorbidity associated with suicide attempts: Findings in patients with bipolar disorder. Psychopathology 2017, 50, 171–174. [Google Scholar] [CrossRef]
- Chambers, R.A.; Taylor, J.R.; Potenza, M.N. Developmental neurocircuitry of motivation in adolescence: A critical period of addiction vulnerability. Am. J. Psychiatry 2003, 160, 1041–1052. [Google Scholar] [CrossRef]
- Blumberg, H.P.; Kaufman, J.; Martin, A.; Charney, D.S.; Krystal, J.H.; Peterson, B.S. Significance of adolescent neurodevelopment for the neural circuitry of bipolar disorder. Ann. N. Y. Acad. Sci. 2004, 1021, 376–383. [Google Scholar] [CrossRef]
- Goldstein, R.Z.; Volkow, N.D. Dysfunction of the prefrontal cortex in addiction: Neuroimaging findings and clinical implications. Nat. Rev. Neurosci. 2011, 12, 652–669. [Google Scholar] [CrossRef] [PubMed]
- Strakowski, S.M.; Adler, C.M.; Almeida, J.; Altshuler, L.L.; Blumberg, H.; Chang, K.D.; DelBello, M.P.; Frangou, S.; McIntosh, A.; Phillips, M.L.; et al. The functional neuroanatomy of bipolar disorder: A consensus model. Bipolar Disord. 2012, 14, 313–325. [Google Scholar] [CrossRef] [PubMed]
- Weathers, J.; Lippard, E.; Spencer, L.; Pittman, B.; Wang, F.; Blumberg, H.P. Longitudinal diffusion tensor imaging study of adolescents and young adults with bipolar disorder. J. Am. Acad. Child Adolesc. Psychiatry 2018, 57, 111–117. [Google Scholar] [CrossRef]
- Drevets, W.C.; Öngür, D.; Price, J.L. Neuroimaging abnormalities in the subgenual prefrontal cortex: Implications for the pathophysiology of familial mood disorders. Mol. Psychiatry 1998, 3, 220–226. [Google Scholar] [CrossRef] [PubMed]
- Koolschijn, P.C.M.; van Haren, N.E.; Lensvelt-Mulders, G.J.; Hulshoff Pol, H.E.; Kahn, R.S. Brain volume abnormalities in major depressive disorder: A meta-analysis of magnetic resonance imaging studies. Hum. Brain Mapp. 2009, 30, 3719–3735. [Google Scholar] [CrossRef] [PubMed]
- Grieve, S.M.; Korgaonkar, M.S.; Koslow, S.H.; Gordon, E.; Williams, L.M. Widespread reductions in gray matter volume in depression. NeuroImage Clin. 2013, 3, 332–339. [Google Scholar] [CrossRef] [PubMed]
- Najt, P.; Wang, F.; Spencer, L.; Johnston, J.A.; Lippard, E.; Pittman, B.P.; Lacadie, C.; Staib, L.; Papademetris, X.; Blumberg, H.P. Anterior cortical development during adolescence in bipolar disorder. Biol. Psychiatry 2016, 79, 303–310. [Google Scholar] [CrossRef]
- Wise, T.; Radua, J.; Via, E.; Cardoner, N.; Abe, O.; Adams, T.M.; Amico, F.; Cheng, Y.; Cole, J.H.; de Azevedo Marques Perico, C.; et al. Common and distinct patterns of grey-matter volume alteration in major depression and bipolar disorder: Evidence from voxel-based meta-analysis. Mol. Psychiatry 2017, 22, 1455–1463. [Google Scholar] [CrossRef]
- Hibar, D.P.; for the ENIGMA Bipolar Disorder Working Group; Westlye, L.T.; Doan, N.T.; Jahanshad, N.; Cheung, J.W.; Ching, C.R.K.; Versace, A.; Bilderbeck, A.C.; Uhlmann, A.; et al. Cortical abnormalities in bipolar disorder: An MRI analysis of 6503 individuals from the ENIGMA Bipolar Disorder Working Group. Mol. Psychiatry 2018, 23, 932–942. [Google Scholar] [CrossRef]
- De Bellis, M.D.; Narasimhan, A.; Thatcher, D.L.; Keshavan, M.S.; Soloff, P.; Clark, D.B. Prefrontal cortex, thalamus, and cerebellar volumes in adolescents and young adults with adolescent-onset alcohol use disorders and comorbid mental disorders. Alcohol. Clin. Exp. Res. 2005, 29, 1590–1600. [Google Scholar] [CrossRef]
- Hassel, S.; Almeida, J.R.; Frank, E.; Versace, A.; Nau, S.A.; Klein, C.R.; Kupfer, D.J.; Phillips, M.L. Prefrontal cortical and striatal activity to happy and fear faces in bipolar disorder is associated with comorbid substance abuse and eating disorder. J. Affect. Disord. 2009, 118, 19–27. [Google Scholar] [CrossRef] [PubMed]
- Nery, F.G.; Stanley, J.A.; Chen, H.-H.; Hatch, J.P.; Nicoletti, M.A.; Monkul, E.S.; Lafer, B.; Soares, J.C. Bipolar disorder comorbid with alcoholism: A 1H magnetic resonance spectroscopy study. J. Psychiatr. Res. 2010, 44, 278–285. [Google Scholar] [CrossRef] [PubMed]
- Nery, F.G.; Matsuo, K.; Nicoletti, M.A.; Monkul, E.S.; Zunta-Soares, G.B.; Hatch, J.P.; Lafer, B.; Soares, J.C. Association between prior alcohol use disorders and decreased prefrontal gray matter volumes in bipolar I disorder patients. Neurosci. Lett. 2011, 503, 136–140. [Google Scholar] [CrossRef] [PubMed]
- Uhlmann, A.; Bandelow, B.; Stein, D.J.; Bloch, S.; Engel, K.R.; Havemann-Reinecke, U.; Wedekind, D. Grey matter structural differences in alcohol-dependent individuals with and without comorbid depression/anxiety—An MRI study. Eur. Arch. Psychiatry Clin. Neurosci. 2018, 269, 285–294. [Google Scholar] [CrossRef]
- White, A.M.; Swartzwelder, H.S. Age-related effects of alcohol on memory and memory-related brain function in adolescents and adults. In Recent Developments in Alcoholism; Springer Science and Business Media: Boston, MA, USA, 2005; Volume 17, pp. 161–176. [Google Scholar]
- Shaw, P.; Kabani, N.J.; Lerch, J.P.; Eckstrand, K.; Lenroot, R.; Gogtay, N.; Greenstein, D.; Clasen, L.; Evans, A.; Rapoport, J.L.; et al. Neurodevelopmental trajectories of the human cerebral cortex. J. Neurosci. 2008, 28, 3586–3594. [Google Scholar] [CrossRef] [PubMed]
- Silveri, M.M. Adolescent brain development and underage drinking in the United States: Identifying risks of alcohol use in college populations. Harv. Rev. Psychiatry 2012, 20, 189–200. [Google Scholar] [CrossRef]
- Jacobus, J.; Tapert, S.F. Neurotoxic effects of alcohol in adolescence. Annu. Rev. Clin. Psychol. 2013, 9, 703–721. [Google Scholar] [CrossRef]
- Squeglia, L.M.; Rinker, D.A.; Bartsch, H.; Castro, N.; Chung, Y.; Dale, A.M.; Jernigan, T.L.; Tapert, S.F. Brain volume reductions in adolescent heavy drinkers. Dev. Cogn. Neurosci. 2014, 9, 117–125. [Google Scholar] [CrossRef]
- Squeglia, L.M.; Tapert, S.F.; Sullivan, E.V.; Jacobus, J.; Meloy, M.J.; Rohlfing, T.; Pfefferbaum, A. Brain development in heavy-drinking adolescents. Am. J. Psychiatry 2015, 172, 531–542. [Google Scholar] [CrossRef]
- Pfefferbaum, A.; Kwon, D.; Brumback, T.; Thompson, W.K.; Cummins, K.; Tapert, S.F.; Brown, S.A.; Colrain, I.M.; Baker, F.; Prouty, D.; et al. Altered brain developmental trajectories in adolescents after initiating drinking. Am. J. Psychiatry 2018, 175, 370–380. [Google Scholar] [CrossRef]
- Lees, B.; Meredith, L.; Kirkland, A.E.; Bryant, B.E.; Squeglia, L.M. Effect of alcohol use on the adolescent brain and behavior. Pharmacol. Biochem. Behav. 2020, 192, 172906. [Google Scholar] [CrossRef] [PubMed]
- Rao, U.; Chen, L.-A.; Bidesi, A.S.; Shad, M.U.; Thomas, M.A.; Hammen, C.L. Hippocampal changes associated with early-life adversity and vulnerability to depression. Biol. Psychiatry 2010, 67, 357–364. [Google Scholar] [CrossRef] [PubMed]
- Kirsch, D.E.; Tretyak, V.; Radpour, S.; Weber, W.A.; Nemeroff, C.B.; Fromme, K.; Strakowski, S.M.; Lippard, E.T.C. Childhood maltreatment, prefrontal-paralimbic gray matter volume, and substance use in young adults and interactions with risk for bipolar disorder. Sci. Rep. 2021, 11, 123. [Google Scholar] [CrossRef] [PubMed]
- Chitty, K.M.; Lagopoulos, J.; Hickie, I.B.; Hermens, D.F. Risky alcohol use in young persons with emerging bipolar disorder is associated with increased oxidative stress. J. Affect. Disord. 2013, 150, 1238–1241. [Google Scholar] [CrossRef]
- Berk, M.; Kapczinski, F.; Andreazza, A.; Dean, O.; Giorlando, F.; Maes, M.; Yücel, M.; Gama, C.; Dodd, S.; Dean, B.; et al. Pathways underlying neuroprogression in bipolar disorder: Focus on inflammation, oxidative stress and neurotrophic factors. Neurosci. Biobehav. Rev. 2011, 35, 804–817. [Google Scholar] [CrossRef]
- Salim, S. Oxidative stress and psychological disorders. Curr. Neuropharmacol. 2014, 12, 140–147. [Google Scholar] [CrossRef]
- Cheetham, A.; Allen, N.B.; Whittle, S.; Simmons, J.; Yücel, M.; Lubman, D.I. Volumetric differences in the anterior cingulate cortex prospectively predict alcohol-related problems in adolescence. Psychopharmacology 2014, 231, 1731–1742. [Google Scholar] [CrossRef]
- Lippard, E.; Mazure, C.M.; Johnston, J.A.; Spencer, L.; Weathers, J.; Pittman, B.; Wang, F.; Blumberg, H.P. Brain circuitry associated with the development of substance use in bipolar disorder and preliminary evidence for sexual dimorphism in adolescents. J. Neurosci. Res. 2017, 95, 777–791. [Google Scholar] [CrossRef]
- First, M.B.; Williams, J.B.; Karg, R.S.; Spitzer, R.L. Structured Clinical Interview for DSM-5—Research Version (SCID-5 for DSM-5, Research Version; SCID-5-RV); American Psychiatric Association: Arlington, VA, USA, 2015. [Google Scholar]
- Wechsler, D. Wechsler Abbreviated Scale of Intelligence Manual; Harcourt Brace and Company: San Antonio, TX, USA, 1999. [Google Scholar]
- Hamilton, M. The assessment of anxiety states by rating. Psychol. Psychother. Theory Res. Pract. 1959, 32, 50–55. [Google Scholar] [CrossRef]
- Hamilton, M. A rating scale for depression. J. Neurol. Neurosurg. Psychiatry 1960, 25, 56–61. [Google Scholar] [CrossRef]
- Young, R.C.; Biggs, J.T.; Ziegler, V.E.; Meyer, D.A. A rating scale for mania: Reliability, validity and sensitivity. Br. J. Psychiatry 1978, 133, 429–435. [Google Scholar] [CrossRef] [PubMed]
- Keller, M.B.; Lavori, P.W.; Friedman, B.; Nielsen, E.; Endicott, J.; McDonald-Scott, P.; Andreasen, N.C. The longitudinal interval follow-up evaluation. A comprehensive method for assessing outcome in prospective longitudinal studies. Arch. Gen. Psychiatry 1987, 44, 540–548. [Google Scholar] [CrossRef] [PubMed]
- Fischl, B. FreeSurfer. NeuroImage 2012, 62, 774–781. [Google Scholar] [CrossRef] [PubMed]
- Reuter, M.; Rosas, H.D.; Fischl, B. Highly accurate inverse consistent registration: A robust approach. NeuroImage 2010, 53, 1181–1196. [Google Scholar] [CrossRef]
- Desikan, R.S.; Ségonne, F.; Fischl, B.; Quinn, B.T.; Dickerson, B.C.; Blacker, D.; Buckner, R.L.; Dale, A.M.; Maguire, R.P.; Hyman, B.T.; et al. An automated labeling system for subdividing the human cerebral cortex on MRI scans into gyral based regions of interest. NeuroImage 2006, 31, 968–980. [Google Scholar] [CrossRef]
- Lees, B.; Mewton, L.; Stapinski, L.A.; Squeglia, L.M.; Rae, C.; Teesson, M.R. Neurobiological and cognitive profile of young binge drinkers: A systematic review and meta-analysis. Neuropsychol. Rev. 2019, 29, 357–385. [Google Scholar] [CrossRef]
- Collins, R.L.; Parks, G.A.; Marlatt, G.A. Social determinants of alcohol consumption: The effects of social interaction and model status on the self-administration of alcohol. J. Consult. Clin. Psychol. 1985, 53, 189. [Google Scholar] [CrossRef]
- Parks, G. The Daily Drug-Taking Questionnaire (DDTQ)—Version 1: A Measure of Typical and Peak Drug Use; University of Washington: Seattle, WA, USA, 2001; unpublished manuscript. [Google Scholar]
- Bowen, S.; Witkiewitz, K.; Dillworth, T.M.; Chawla, N.; Simpson, T.L.; Ostafin, B.D.; Larimer, M.E.; Blume, A.W.; Parks, G.A.; Marlatt, G.A. Mindfulness meditation and substance use in an incarcerated population. Psychol. Addict. Behav. 2006, 20, 343–347. [Google Scholar] [CrossRef]
- Bludau, S.; Bzdok, D.; Gruber, O.; Kohn, N.; Riedl, V.; Sorg, C.; Palomero-Gallagher, N.; Müller, V.I.; Hoffstaedter, F.; Amunts, K.; et al. Medial prefrontal aberrations in major depressive disorder revealed by cytoarchitectonically informed voxel-based morphometry. Am. J. Psychiatry 2016, 173, 291–298. [Google Scholar] [CrossRef]
- Abé, C.; Ching, C.R.; Liberg, B.; Lebedev, A.V.; Agartz, I.; Akudjedu, T.N.; Alda, M.; Alnæs, D.; Alonso-Lana, S.; Benedetti, F.; et al. Longitudinal structural brain changes in bipolar disorder: A multicenter neuroimaging study of 1232 individuals by the ENIGMA Bipolar Disorder Working Group. Biol. Psychiatry 2021, 9, 582–592. [Google Scholar] [CrossRef]
- Burgess, P.W.; Dumontheil, I.; Gilbert, S.J. The gateway hypothesis of rostral prefrontal cortex (area 10) function. Trends Cogn. Sci. 2007, 11, 290–298. [Google Scholar] [CrossRef] [PubMed]
- Bramson, B.; Folloni, D.; Verhagen, L.; Hartogsveld, B.; Mars, R.; Toni, I.; Roelofs, K. Human lateral frontal pole contributes to control over emotional approach–avoidance actions. J. Neurosci. 2020, 40, 2925–2934. [Google Scholar] [CrossRef] [PubMed]
- Hermann, A.; Neudert, M.K.; Schäfer, A.; Zehtner, I.R.; Fricke, S.; Seinsche, R.J.; Stark, R. Lasting effects of cognitive emotion regulation: Neural correlates of reinterpretation and distancing. Soc. Cogn. Affect. Neurosci. 2021, 16, 268–279. [Google Scholar] [CrossRef] [PubMed]
- Christoff, K.; Gabrieli, J.D.E. The frontopolar cortex and human cognition: Evidence for a rostrocaudal hierarchical organization within the human prefrontal cortex. Psychobiology 2000, 28, 168–186. [Google Scholar] [CrossRef]
- Johnson, M.K.; Nolen-Hoeksema, S.; Mitchell, K.J.; Levin, Y. Medial cortex activity, self-reflection and depression. Soc. Cogn. Affect. Neurosci. 2009, 4, 313–327. [Google Scholar] [CrossRef]
- Ray, R.D.; Ochsner, K.N.; Cooper, J.C.; Robertson, E.R.; Gabrieli, J.D.; Gross, J.J. Individual differences in trait rumination and the neural systems supporting cognitive reappraisal. Cogn. Affect. Behav. Neurosci. 2005, 5, 156–168. [Google Scholar] [CrossRef]
- Squeglia, L.M.; Jacobus, J.; Tapert, S.F. The effect of alcohol use on human adolescent brain structures and systems. Handb. Clin. Neurol. 2014, 125, 501–510. [Google Scholar] [CrossRef]
- Velanova, K.; Wheeler, M.E.; Luna, B. Maturational changes in anterior cingulate and frontoparietal recruitment support the development of error processing and inhibitory control. Cereb. Cortex 2008, 18, 2505–2522. [Google Scholar] [CrossRef]
- West, R.K.; Najjar, L.Z.; Leasure, J.L. Chapter Nine—Exercise-driven restoration of the alcohol-damaged brain. In International Review of Neurobiology; Yau, S.-Y., So, K.-F., Eds.; Academic Press: Cambridge, MA, USA, 2019; pp. 219–267. [Google Scholar]
- Squeglia, L.M.; Sorg, S.F.; Schweinsburg, A.D.; Wetherill, R.R.; Pulido, C.; Tapert, S.F. Binge drinking differentially affects adolescent male and female brain morphometry. Psychopharmacology 2011, 220, 529–539. [Google Scholar] [CrossRef]
- Hafeman, D.M.; Chang, K.D.; Garrett, A.S.; Sanders, E.M.; Phillips, M.L. Effects of medication on neuroimaging findings in bipolar disorder: An updated review. Bipolar Disord. 2012, 14, 375–410. [Google Scholar] [CrossRef]


| Baseline | Follow-Up | Within Group Changes over Time | |||||||
|---|---|---|---|---|---|---|---|---|---|
| Typically Developing (N = 17) | Mood Disorder (N = 24) | p-Value | Typically Developing (N = 17) | Mood Disorder (N = 24) | p-Value | Typically Developing p-Value | Mood Disorder p-Value | ||
| Demographics | Mean Age (SD) | 20.5 (1.4) | 20.8 (2.0) | 0.6 | 21.7 (1.4) | 22.0 (1.9) | 0.6 | --- | --- |
| Number of Females (%) | 9 (53) | 20 (83) | 0.05 F | --- | --- | --- | --- | --- | |
| Mean WASI-II FSIQ A | 115.8 (12.5) | 118.8 (11.7) | 0.4 | --- | --- | --- | --- | --- | |
| Clinical Mood Symptoms | HDRS B (SD) | 2.5 (3.1) | 7.8 (6.3) | 0.002 Z | 2.8 (3.9) | 8.0 (6.5) | 0.002 Z | 0.9 S | 0.5 S |
| HARS C (SD) | 2.4 (3.3) | 7.4 (7.0) | 0.002 Z | 3.2 (3.7) | 7.8 (7.1) | 0.02 Z | 0.4 S | 0.6 S | |
| YMRS D (SD) | 0.6 (1.5) | 1.4 (3.4) | 0.9 Z | 0.1 (0.2) | 1.4 (2.4) | 0.005 Z | 0.06 S | 0.8 S | |
| Mood Disorder | Major Depressive Disorder (%) | --- | 12 (50) | --- | 2 (12) | 11 (46) | --- | 0.5 M | 1 M |
| Bipolar Disorder (%) | --- | 12 (50) | --- | --- | 13 (54) | --- | --- | 1 M | |
| Alcohol/ Cannabis Use Disorders (A/CUD) | Current AUD, mild (%) | 0 | 0 | 1 F | 1 (6) | 0 | 0.4 F | 1 M | --- |
| Current AUD, moderate (%) | 0 | 0 | 1 M | 1 (6) | 2 (8) | 1 F | 1 M | 0.5 M | |
| Past AUD, mild (%) | 0 | 1 (4) | 1 F | 0 | 1 (4) | 1 F | 1 M | 1 M | |
| Current CUD, mild (%) | 0 | 1 (4) | 1 F | 0 | 3 (13) | 0.3 F | 1 M | 0.6 M | |
| Current CUD, moderate (%) | 1 (6) | 1 (4) | 1 F | 0 | 2 (8) | 1 F | 1 M | 1 M | |
| Current CUD, severe (%) | 0 | 1 (4) | 1 F | 1 (6) | 0 | 0.4 F | 1 M | 1 M | |
| Past CUD, mild (%) | 0 | 2 (8) | 0.5 F | 1 (6) | 2 (8) | 1 F | 1 M | 0.5 M | |
| Recent Alcohol and Cannabis Use | Total Drinks/Week E (SD) | 6.9 (7.3) | 9.4 (9.5) | 0.3 Z | 8.9 (9.0) | 8.7 (8.9) | 0.9 Z | 0.08 S | 0.08 S |
| Cannabis Users (%) | 7 (41) | 10 (42) | 1.0 | 7 (41) | 11 (46) | 0.8 | 0.7 S | 1 S | |
| Cannabis Use Days/Week G (SD) | 1.7 (2.7) | 1.7 (2.5) | 1.0 Z | 1.1 (1.9) | 1.7 (2.6) | 0.6 Z | 0.5 S | 0.6 S | |
| Positive Urinalysis Toxicology Screen | Tetrahydrocannabinol (%) | 2 (12) | 7 (29) | 0.3 F | 2 (12) | 7 (29) | 0.3 F | 0.5 M | 0.6 M |
| Cocaine (%) | 0 | 1 (4) | 1 F | 0 | 1 (4) | 1 F | 1 M | 1 M | |
| Amphetamines (%) | 0 | 2 (8) | 0.5 F | 0 | 3 (13) | 0.3 F | 1 M | 1 M | |
| Benzodiazepines (%) | 0 | 1 (4) | 1 F | 0 | 1 (4) | 1 F | 1 M | 0.5 M | |
| Phencyclidines (%) | 0 | 1 (4) | 1 F | 0 | 1 (4) | 1 F | 1 M | 0.5 M | |
| Clinical Factors & Comorbidities | Lifetime Suicide Attempt (%) | --- | 6 (25) | --- | --- | 6 (25) | --- | --- | 1 M |
| Comorbid Anxiety Disorders H (%) | --- | 5 (21) | --- | --- | 6 (25) | --- | --- | 1 M | |
| Medications I | Unmedicated at scan (%) | 17 | 14 (58) | --- | 15 | 15 (63) | --- | 0.5 M | 1 M |
| Antispychotic (%) | 0 | 4 (17) | --- | 0 | 4 (17) | --- | 1 M | 1 M | |
| Anticonvulsant (%) | 0 | 3 (13) | --- | 0 | 4 (17) | --- | 1 M | 1 M | |
| Antidepressant/SSRIs (%) | 0 | 2 (8) | --- | 2 (12) | 3 (13) | 1 F | 0.5 M | 1 M | |
| Stimulant (%) | 0 | 2 (8) | --- | 0 | 2 (8) | --- | 1 M | 0.5 M | |
| Lithium (%) | 0 | 4 (17) | --- | 0 | 4 (17) | --- | 1 M | 0.5 M | |
| Anxiolytics (%) | 0 | 1 (4) | --- | 0 | 0 | --- | 1 M | 1 M | |
| Sedatives/Antihistamines (%) | 0 | 2 (8) | --- | 0 | 0 | --- | 1 M | 0.5 M | |
| Baseline | Follow-Up | |||
|---|---|---|---|---|
| Typically Developing (N = 17) | Mood Disorder (N = 24) | Typically Developing (N = 17) | Mood Disorder (N = 24) | |
| Left Orbitofrontal Cortex Volume (SD) | 14,601 (1810) | 14,079 (1290) | 14,524 (1753) | 14,106 (1394) |
| Right Orbitofrontal Cortex Volume (SD) | 14,785 (1781) | 14,416 (1102) | 14,788 (1771) | 14,287 (1248) |
| Left Anterior Cingulate Cortex Volume (SD) | 4942 (920) | 4888 (928) | 4905 (840) | 4873 (839) |
| Right Anterior Cingulate Cortex Volume (SD) | 4537 (751) | 4497 (770) | 4541 (864) | 4637 (1030) |
| Left Frontal Pole Volume (SD) | 1318 (197) | 1162 (198) | 1281 (174) | 1215 (186) |
| Right Frontal Pole Volume (SD) | 1599 (298) | 1519 (183) | 1588 (210) | 1532 (206) |
| Typically Developing (N = 17) | Mood Disorder (N = 24) | p-Value | |
|---|---|---|---|
| Met Criteria for Major Depressive Episode (%) | 2 (12) | 9 (38) | 0.09 F |
| Average Duration: % Weeks met Criteria for Major Depressive Episode (SD); range | 1 (2); 0–8 | 12 (21); 0–77 | 0.06 Z |
| Met Criteria for Mania (%) A | --- | 5 (21) | --- |
| Average Duration: % Weeks met Criteria for Mania (SD); range A | --- | 7 (17); 0–73 | --- |
| Orbitofrontal Cortex | Anterior Cingulate Cortex | Frontal Pole | ||||
|---|---|---|---|---|---|---|
| Left | Right | Left | Right | Left | Right | |
| Time | F(1,34) = 6.7, p = 0.01 | F(1,34) = 4.9, p = 0.03 | F(1,34) = 2.5, p = 0.1 | F(1,34) = 3.4, p = 0.08 | F(1,34) = 0.3, p = 0.6 | F(1,34) = 0.01, p = 0.9 |
| Group | F(1,34) = 0.4, p = 0.5 | F(1,34) = 0.4, p = 0.5 | F(1,34) = 0.4, p = 0.5 | F(1,34) = 0.03, p = 0.9 | F(1,34) = 1.5, p = 0.2 | F(1,34) = 0.02, p = 0.9 |
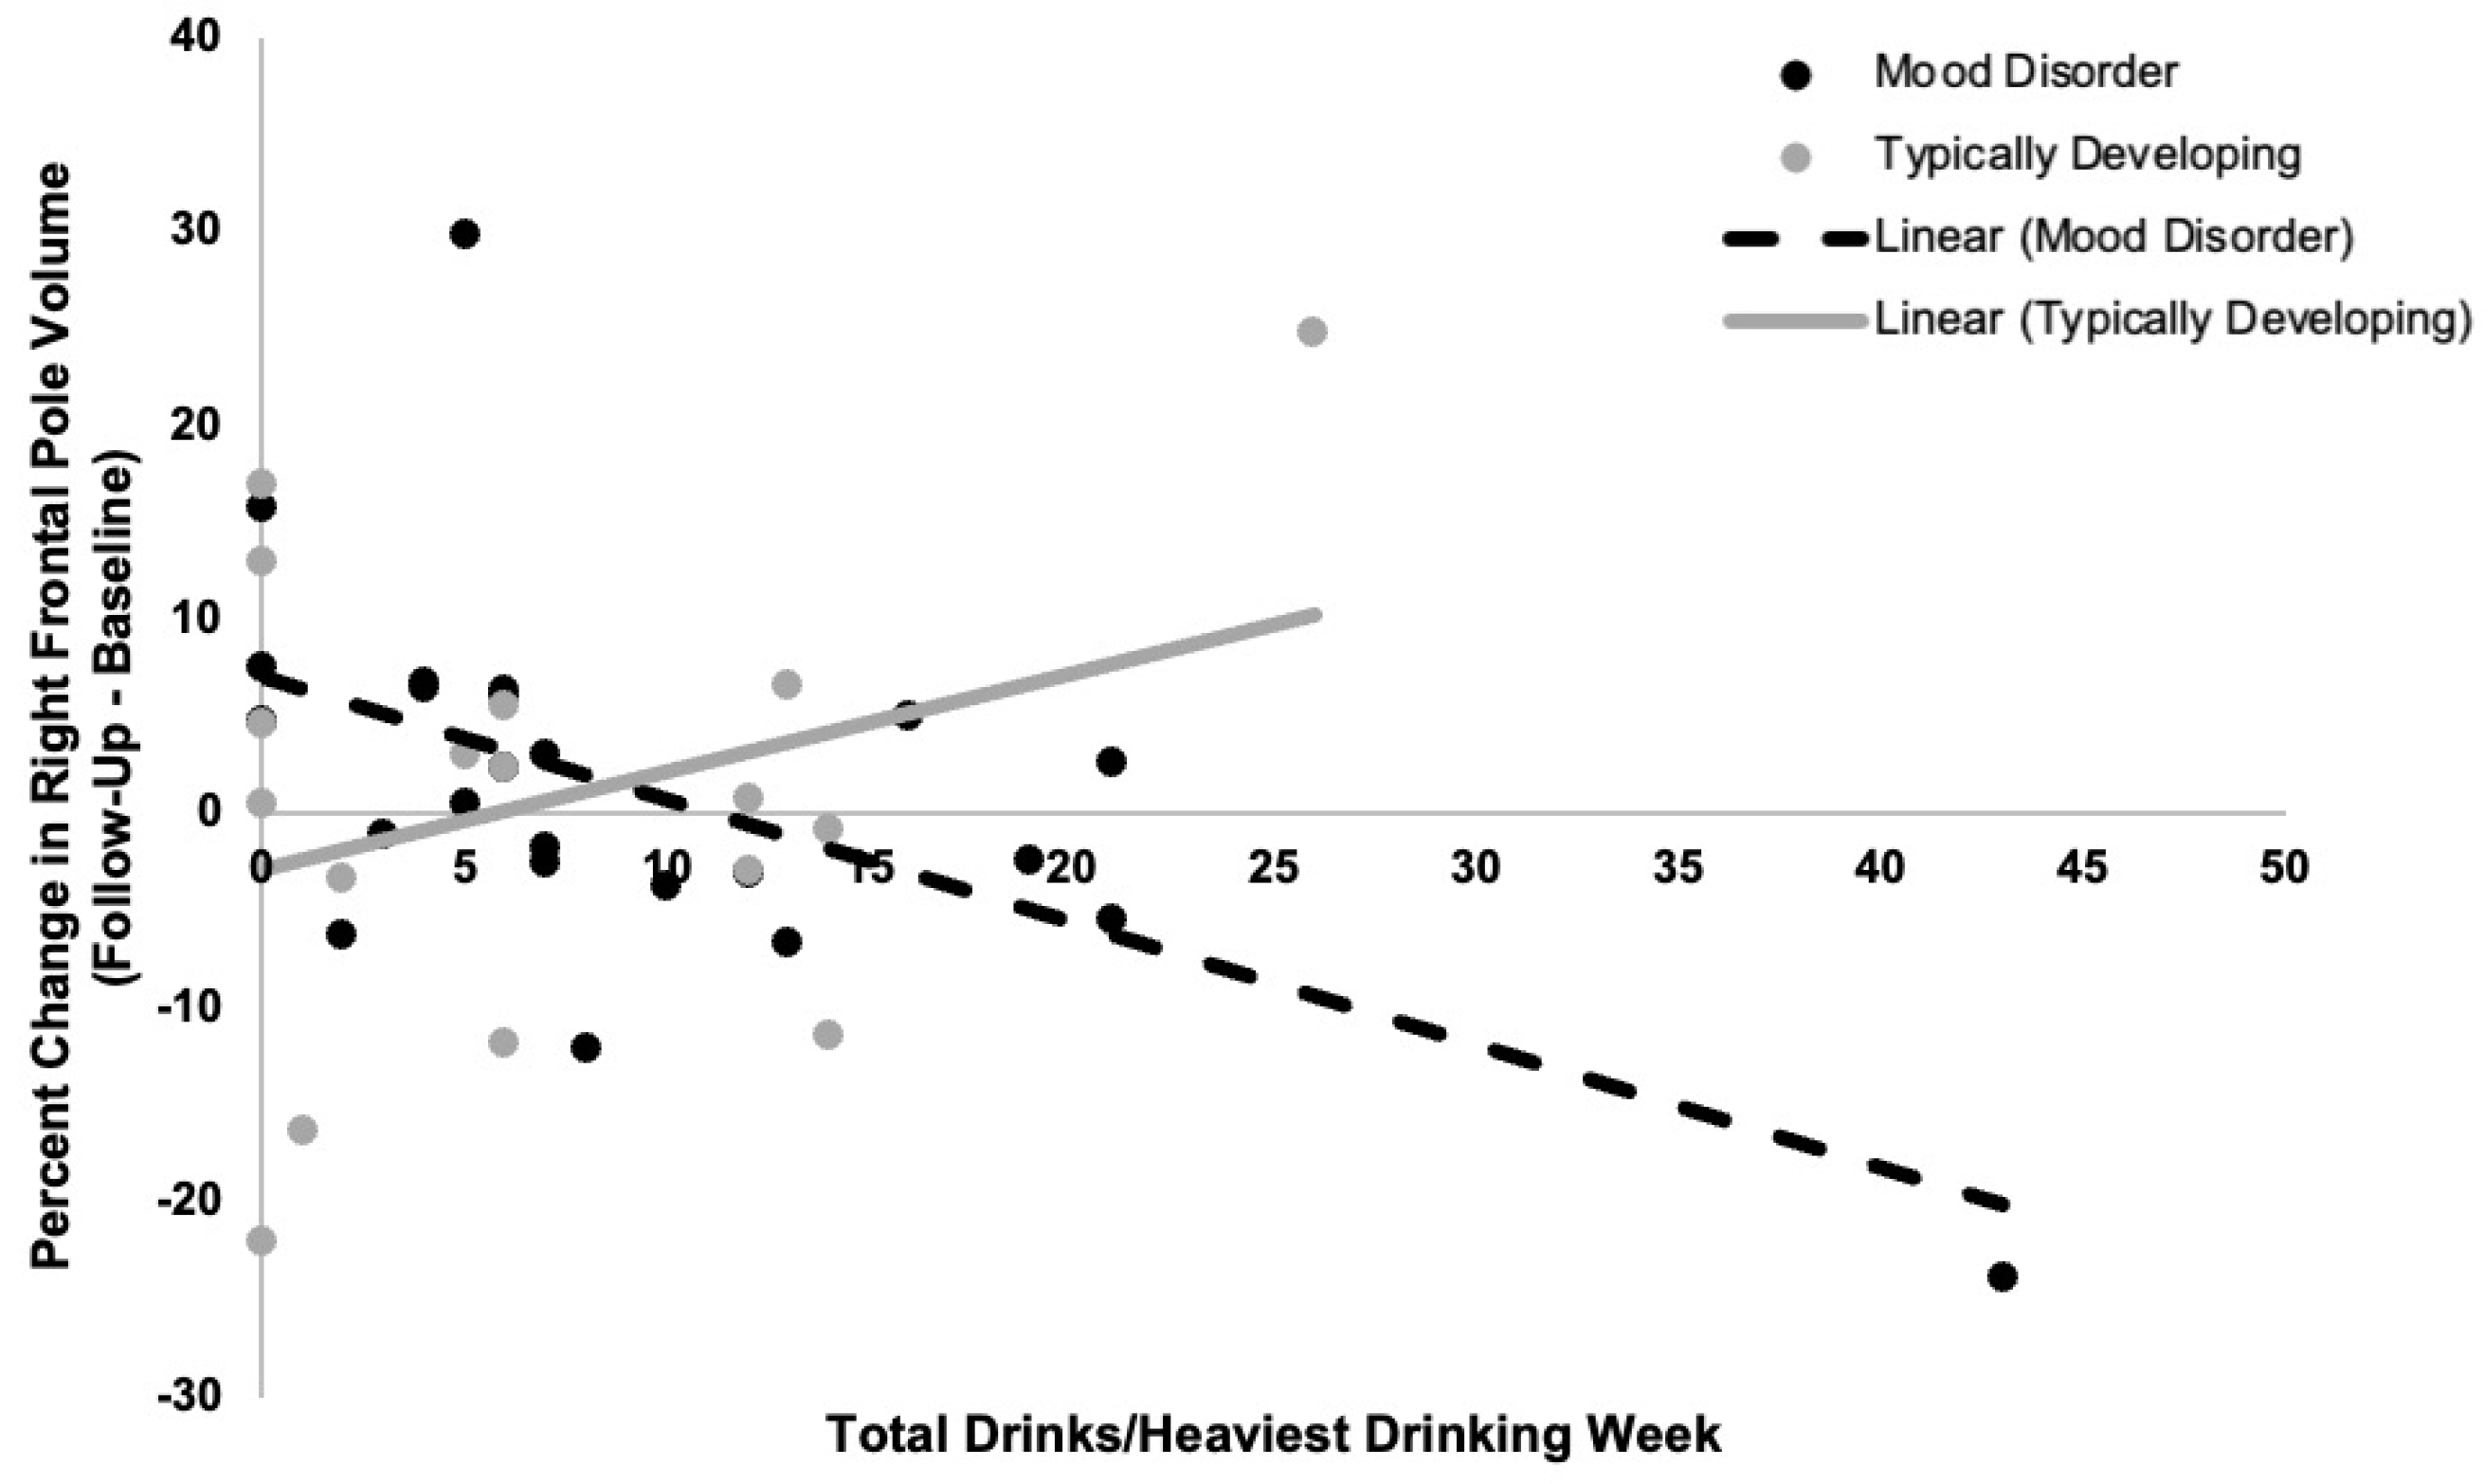
| Alcohol Use | F(1,34) = 0.2, p = 0.7 | F(1,34) = 0.005, p = 0.9 | F(1,34) = 0.1, p = 0.7 | F(1,34) = 1.7, p = 0.2 | F(1,34) = 2.6, p = 0.1 | F(1,34) = 5.1, p = 0.03 |
| Time × Group | F(1,34) = 0.03, p = 0.9 | F(1,34) = 0.3, p = 0.6 | F(1,34) = 0.03, p = 0.9 | F(1,34) = 0.7, p = 0.4 | F(1,34) = 3.4, p = 0.07 | F(1,34) = 0.01, p = 0.9 |
| Time × Alcohol Use | F(1,34) = 0.0004, p = 1.0 | F(1,34) = 1.0, p = 0.3 | F(1,34) = 0.02, p = 0.9 | F(1,34) = 0.08, p = 0.8 | F(1,34) = 1.4, p = 0.2 | F(1,34) = 3.3, p = 0.08 |
| Group × Alcohol Use | F(1,33) = 0.02, p = 0.9 | F(1,33) = 0.9, p = 0.3 | F(1,33) = 0.08, p = 0.8 | F(1,33) = 0.05, p = 0.8 | F(1,33) = 2.5, p = 0.1 | F(1,33) = 3.6, p = 0.07 |
| Time × Group × Alcohol Use | F(1,33) = 1.0, p = 0.3 | F(1,33) = 4.0, p = 0.05 | F(1,33) = 0.03, p = 0.9 | F(1,33) = 0.001, p = 1.0 | F(1,33) = 0.03, p = 0.9 | F(1,33) = 8.3, p = 0.007 |
Publisher’s Note: MDPI stays neutral with regard to jurisdictional claims in published maps and institutional affiliations. |
© 2022 by the authors. Licensee MDPI, Basel, Switzerland. This article is an open access article distributed under the terms and conditions of the Creative Commons Attribution (CC BY) license (https://creativecommons.org/licenses/by/4.0/).
Share and Cite
Kirsch, D.E.; Tretyak, V.; Le, V.; Huffman, A.; Fromme, K.; Strakowski, S.M.; Lippard, E.T.C. Alcohol Use and Prefrontal Cortex Volume Trajectories in Young Adults with Mood Disorders and Associated Clinical Outcomes. Behav. Sci. 2022, 12, 57. https://doi.org/10.3390/bs12030057
Kirsch DE, Tretyak V, Le V, Huffman A, Fromme K, Strakowski SM, Lippard ETC. Alcohol Use and Prefrontal Cortex Volume Trajectories in Young Adults with Mood Disorders and Associated Clinical Outcomes. Behavioral Sciences. 2022; 12(3):57. https://doi.org/10.3390/bs12030057
Chicago/Turabian StyleKirsch, Dylan E., Valeria Tretyak, Vanessa Le, Ansley Huffman, Kim Fromme, Stephen M. Strakowski, and Elizabeth T.C. Lippard. 2022. "Alcohol Use and Prefrontal Cortex Volume Trajectories in Young Adults with Mood Disorders and Associated Clinical Outcomes" Behavioral Sciences 12, no. 3: 57. https://doi.org/10.3390/bs12030057
APA StyleKirsch, D. E., Tretyak, V., Le, V., Huffman, A., Fromme, K., Strakowski, S. M., & Lippard, E. T. C. (2022). Alcohol Use and Prefrontal Cortex Volume Trajectories in Young Adults with Mood Disorders and Associated Clinical Outcomes. Behavioral Sciences, 12(3), 57. https://doi.org/10.3390/bs12030057