Article

The Impact of Salt Tectonics on the Thermal Evolution and the Petroleum System of Confined Rift Basins: Insights from Basin Modeling of the Nordkapp Basin, Norwegian Barents Sea

Department of Energy Resources, University of Stavanger, 4036 Stavanger, Norway
*
Author to whom correspondence should be addressed.
Geosciences 2019, 9(7), 316; https://doi.org/10.3390/geosciences9070316
Submission received: 27 May 2019 / Revised: 14 July 2019 / Accepted: 15 July 2019 / Published: 17 July 2019

Abstract

:
Although the thermal effect of large salt tongues and allochthonous salt sheets in passive margins is described in the literature, little is known about the thermal effect of salt structures in confined rift basins where sub-vertical, closely spaced salt diapirs may affect the thermal evolution and petroleum system of the basin. In this study, we combine 2D structural restorations with thermal modeling to investigate the dynamic history of salt movement and its thermal effect in the Nordkapp Basin, a confined salt-bearing basin in the Norwegian Barents Sea. Two sections, one across the central sub-basin and another across the eastern sub-basin, are modeled. The central sub-basin shows deeply rooted, narrow and closely spaced diapirs, while the eastern sub-basin contains a shallower rooted, wide, isolated diapir. Variations through time in stratigraphy (source rocks), structures (salt diapirs and minibasins), and thermal boundary conditions (basal heat flow and sediment-water interface temperatures) are considered in the model. Present-day bottom hole temperatures and vitrinite data provide validation of the model. The modeling results in the eastern sub-basin show a strong but laterally limited thermal anomaly associated with the massive diapir, where temperatures in the diapir are 70 °C cooler than in the adjacent minibasins. In the central sub-basin, the thermal anomalies of closely-spaced diapirs mutually interfere and induce a combined anomaly that reduces the temperature in the minibasins by up to 50 °C with respect to the platform areas. Consequently, source rock maturation in the areas thermally affected by the diapirs is retarded, and the hydrocarbon generation window is expanded. Although subject to uncertainties in the model input parameters, these results demonstrate new exploration concepts (e.g., deep hydrocarbon kitchens) that are important for evaluating the prospectivity of the Nordkapp Basin and similar basins around the world.

1. Introduction

The occurrence of evaporitic intervals in sedimentary basins and their subsequent mobilization play an important role in the evolution of the petroleum system [1,2]. Salt mobilization and diapirism control the spatial and temporal distribution of suprasalt reservoirs and source rocks [3,4,5], and they influence the style and timing of stratigraphic and structural traps. Salt’s low permeability also inhibits the vertical migration of hydrocarbons, deflecting migration pathways [6]. Likewise, local salt depletion by salt withdrawal may lead to the formation of welds, which can provide migration pathways between subsalt source rocks and suprasalt reservoirs [7].
Salt has a thermal conductivity that is 2 to 3 times higher than sedimentary formations [6,8,9]. Accordingly, salt structures can modify the spatial and temporal thermal regime of the basin through focusing and defocusing of heat [8,10]. Salt domes create a dipole-shaped thermal anomaly with a negative thermal anomaly towards their base and a positive thermal anomaly in the suprasalt strata [9]. When salt bodies reach the surface, the dipole-shaped anomaly becomes a negative monopole, creating a conduit of low thermal resistance for heat conduction out of the basin [10]. Due to the difference in thermal conductivity between the salt and the surrounding sedimentary formations, thermal anomalies are also induced in the vicinity of salt bodies. The size and shape of these anomalies is controlled by the size of the salt bodies [8,10]. Maturation of kerogen within source rocks and reservoir diagenesis are temperature-controlled processes; therefore, any salt-related temperature deviation from the regional trend may have a significant impact on these processes.
The Nordkapp basin is a NE-SW trending rift basin of Late Paleozoic age located in the Norwegian Barents Sea (Figure 1A,B). Thick Pennsylvanian-Lower Permian layered evaporite sequences (LES) and their subsequent Mesozoic and Cenozoic mobilization generated numerous and closely spaced salt diapirs along the basin axis, and salt pillows generated along the basin margins [11,12,13,14]. Hydrocarbon exploration in the basin dates back to the 1980s. However, exploration has exclusively focused on the western sub-basin, while the central and eastern sub-basins remain underexplored (Rojo and Escalona, 2018). Only one non-commercial discovery in the western sub-basin, the Pandora discovery (well 7228/7-1A, Figure 1B), has been made in Triassic sediments which flank a salt diapir [15].
The Norwegian Barents Sea is known to host various petroleum systems sourced by Upper Paleozoic and Mesozoic organic rich intervals [16,17]. In the Nordkapp Basin, however, Paleozoic and Mesozoic strata are deeply buried due to Triassic halokinesis [18]. Therefore, it is tempting to assume that these source rocks became overmature for hydrocarbon generation in the Mesozoic. Interestingly, 2D structural restorations by [18,19] show that diapirs reached the seafloor since the Triassic, which may have cooled the basin and delayed maturation of the source rocks, as documented in offshore Mexico and Brazil [6,9]. Hence, this can open the possibility for a deeper prospectivity of the Nordkapp Basin and other salt-bearing basins in the Barents Sea.
Although there is potential for commercial discoveries in the Nordkapp Basin, there is an imperative need for understanding the impact of halokinesis on the thermal history of the basin and source rock maturation. In particular, the effect of closely spaced diapirs on the thermal evolution of this confined basin must be addressed. Therefore, in this study we explore the dynamic history of salt movement and its thermal effect by integrating 2D structural restorations with thermal modeling in order to: (1) evaluate how halokinesis impacted the thermal distribution of the basin through time, and (2) explore the implications of the modeled thermal history on the petroleum system and prospectivity of the basin. We use the structural restorations and selected model parameter values as a reasonable scenario to accomplish these objectives. Testing the sensitivity of different restoration or thermal parameters is beyond the scope of this work.

2. Geologic Evolution of the Nordkapp Basin

2.1. Late Paleozoic

The Nordkapp Basin formed as the result of two extensional events of different orientation [19,20,21,22,23] (Figure 1B): (1) pre-Mississippian NE-SW extension, which reactivated previous NW-SE Caledonian structures and formed the central sub-basin; and (2) Pennsylvanian NW-SE extension which reactivated NE-SW Caledonian structures, forming the western and eastern sub-basins. Based on outcrops in Svalbard [24,25] and wells in the Finnmark platform [26], the syn-rift section of the Nordkapp basin is expected to contain siliciclastics interbedded with coal of the Mississippian Billefjorden Group (Figure 1C). Potential Mississippian reservoirs include sandstones deposited within meandering and braided fluvial systems, and interlayered coals are potential gas-prone source rocks.
Basin extension continued from the Pennsylvanian to the Early Permian, and it was followed by a period of thermal subsidence until the end of the Paleozoic [17,27]. Basin restriction favored the precipitation of syn-rift to early post-rift evaporites along the basin axis, whereas deposition of warm water carbonate buildups and gypsum occurred at the basin boundaries (Gipsdalen Group) [28,29,30] (Figure 1C). These deposits were overlain by cool-water carbonates of the Bjarmeland Group and cold water carbonates and spiculites of the Tempelfjorden Group [17,27] (Figure 1C). Based on the Alta and Ghota discoveries in the Loppa High, Upper Permian carbonaceous mudstones and limestones of the Tempelfjorden Group are expected to contain intervals of oil-prone source rocks, and possible reservoirs associated with karstified carbonates in the Nordkapp Basin [17].

2.2. Mesozoic

The onset of salt mobilization and diapirism occurred during the earliest Triassic, and it was triggered by basement-involved extension and differential loading induced by prograding siliciclastic sediments sourced from the Uralides [14,18,19,31]. Minibasin growth and diapir uplift ceased by the end of the Middle Triassic due to welding of the underlying salt [14,18]. Diapir growth after the Middle Triassic is attributed to evacuation of remaining salt adjacent to diapirs and basinward suprasalt gliding and contraction [14]. The Triassic minibasins of the Nordkapp Basin record the NW-SE transgressive-regressive fluviodeltaic systems of the Sassendalen and Kapp Toscana groups, which progressively prograded towards the NW of the Barents Shelf (Figure 1C) [32,33,34,35]. Based on the Goliat discovery in the Hammerfest Basin, oil and gas-prone source rocks may be present in the Sansendalen Group, whereas shallow marine and fluviodeltaic reservoirs can be present in the Sassendalen and Kapp Toscana groups [5,17].
The Late Triassic-Early Jurassic was marked by a regional decrease in accommodation in the Barents Shelf, including the Nordkapp Basin [36]. This resulted in a complex drainage system characterized by erosion and reworking of previous Triassic deposits, which favored the deposition of shallow marine and fluviodeltaic Lower Jurassic reservoirs of good quality (e.g., Stø Formation in the Kapp Toscana Group) [17]. A new episode of extension associated with the initial opening of the North Atlantic to the west of the Barents Shelf [21], partially affected the Nordkapp Basin during the Late Jurassic-Early Cretaceous [12] (Figure 1C). Normal fault systems at basin boundaries caused basinward gravity gliding of suprasalt strata and subsequent thin-skinned contraction and growth of pre-existing diapirs [14]. Lower Jurassic deposits were flooded and overlain by the Upper Jurassic marine black shales of the Hekkingen Formation, which is considered to be a potential source rock in the Barents Sea [16,17]. These marine shales were in turn covered by Lower Cretaceous, SSW prograding sediments sourced from the northern Barents Shelf [37,38].

2.3. Late Cretaceous-Cenozoic

During the Late Cretaceous-Cenozoic, the Nordkapp Basin underwent several contractional events, which are attributed to plate tectonic reorganizations related to the opening of the North Atlantic (Figure 1C; [21]). Consequently, pre-existing diapirs in the Nordkapp Basin were rejuvenated by contractional diapirism [13,14]. Finally, successive events of uplift and erosion, including the Pleistocene glacial erosion, removed about 1.5 km of Cretaceous and Cenozoic strata in the basin [39,40].

3. Methodology

In order to model the thermal evolution of the Nordkapp Basin, we considered two processes: (1) the evolving basin geometry, and (2) the evolution of thermal boundary conditions, i.e., basal heat flow and sediment-water interface temperatures. The evolving basin geometry was reconstructed from structural restoration of two sections, one across the central sub-basin (section A) and another across the eastern sub-basin (section B) (Figure 2). Section A has deeply rooted, narrow and closely spaced diapirs (Figure 2A), whereas section B contains a shallower rooted, wider, isolated diapir (Figure 2B). Before the restoration process, the sections were depth-converted using the velocity model from Rojo et al. [18], which uses interval velocities and k factors (change in interval velocities vs depth) from wells 7228/9-1, 7228/7-1, 7125/1-1, 7124/3-1, and 7229/11-1 (Figure 3).
Details of the restoration are described in Rojo et al. [18]. In short, kinematic restorations were performed using the Move software (Midland Valley). These restorations account for uplift and erosion in the Late Cenozoic, restore the Cenozoic and pre-diapir units using flexural slip, restore the syn-diapir units using vertical shear, and assume flexural isostasy with a lithospheric elastic thickness of 20 km [41].
Thermal modeling of selected restoration stages (paleo-geometries) was performed using the PetroMod software (Schlumberger). Each stage was imported into the software, and polygons representing each seismic unit (Figure 2B,D) were digitized. At each stage, the lower boundary condition of the thermal model is the heat flow at the basement-sediment interface. The evolution of this basal heat flow through time was reconstructed from the present thermal gradient of the basin from nearby wells, the history of rifting and evolution of the stretching (β) factor [42], and inverse modeling using a modified McKenzie model [43]. The upper boundary condition of the thermal model is the sediment-water interface temperature (SWIT). This surface temperature was reconstructed from the paleo-latitude of the basin and water depths over time. The following section describes the input paleo-geometries, thermal boundary conditions, and model parameters in detail.

4. Paleo-Geometries, Boundary Conditions, and Model Parameters

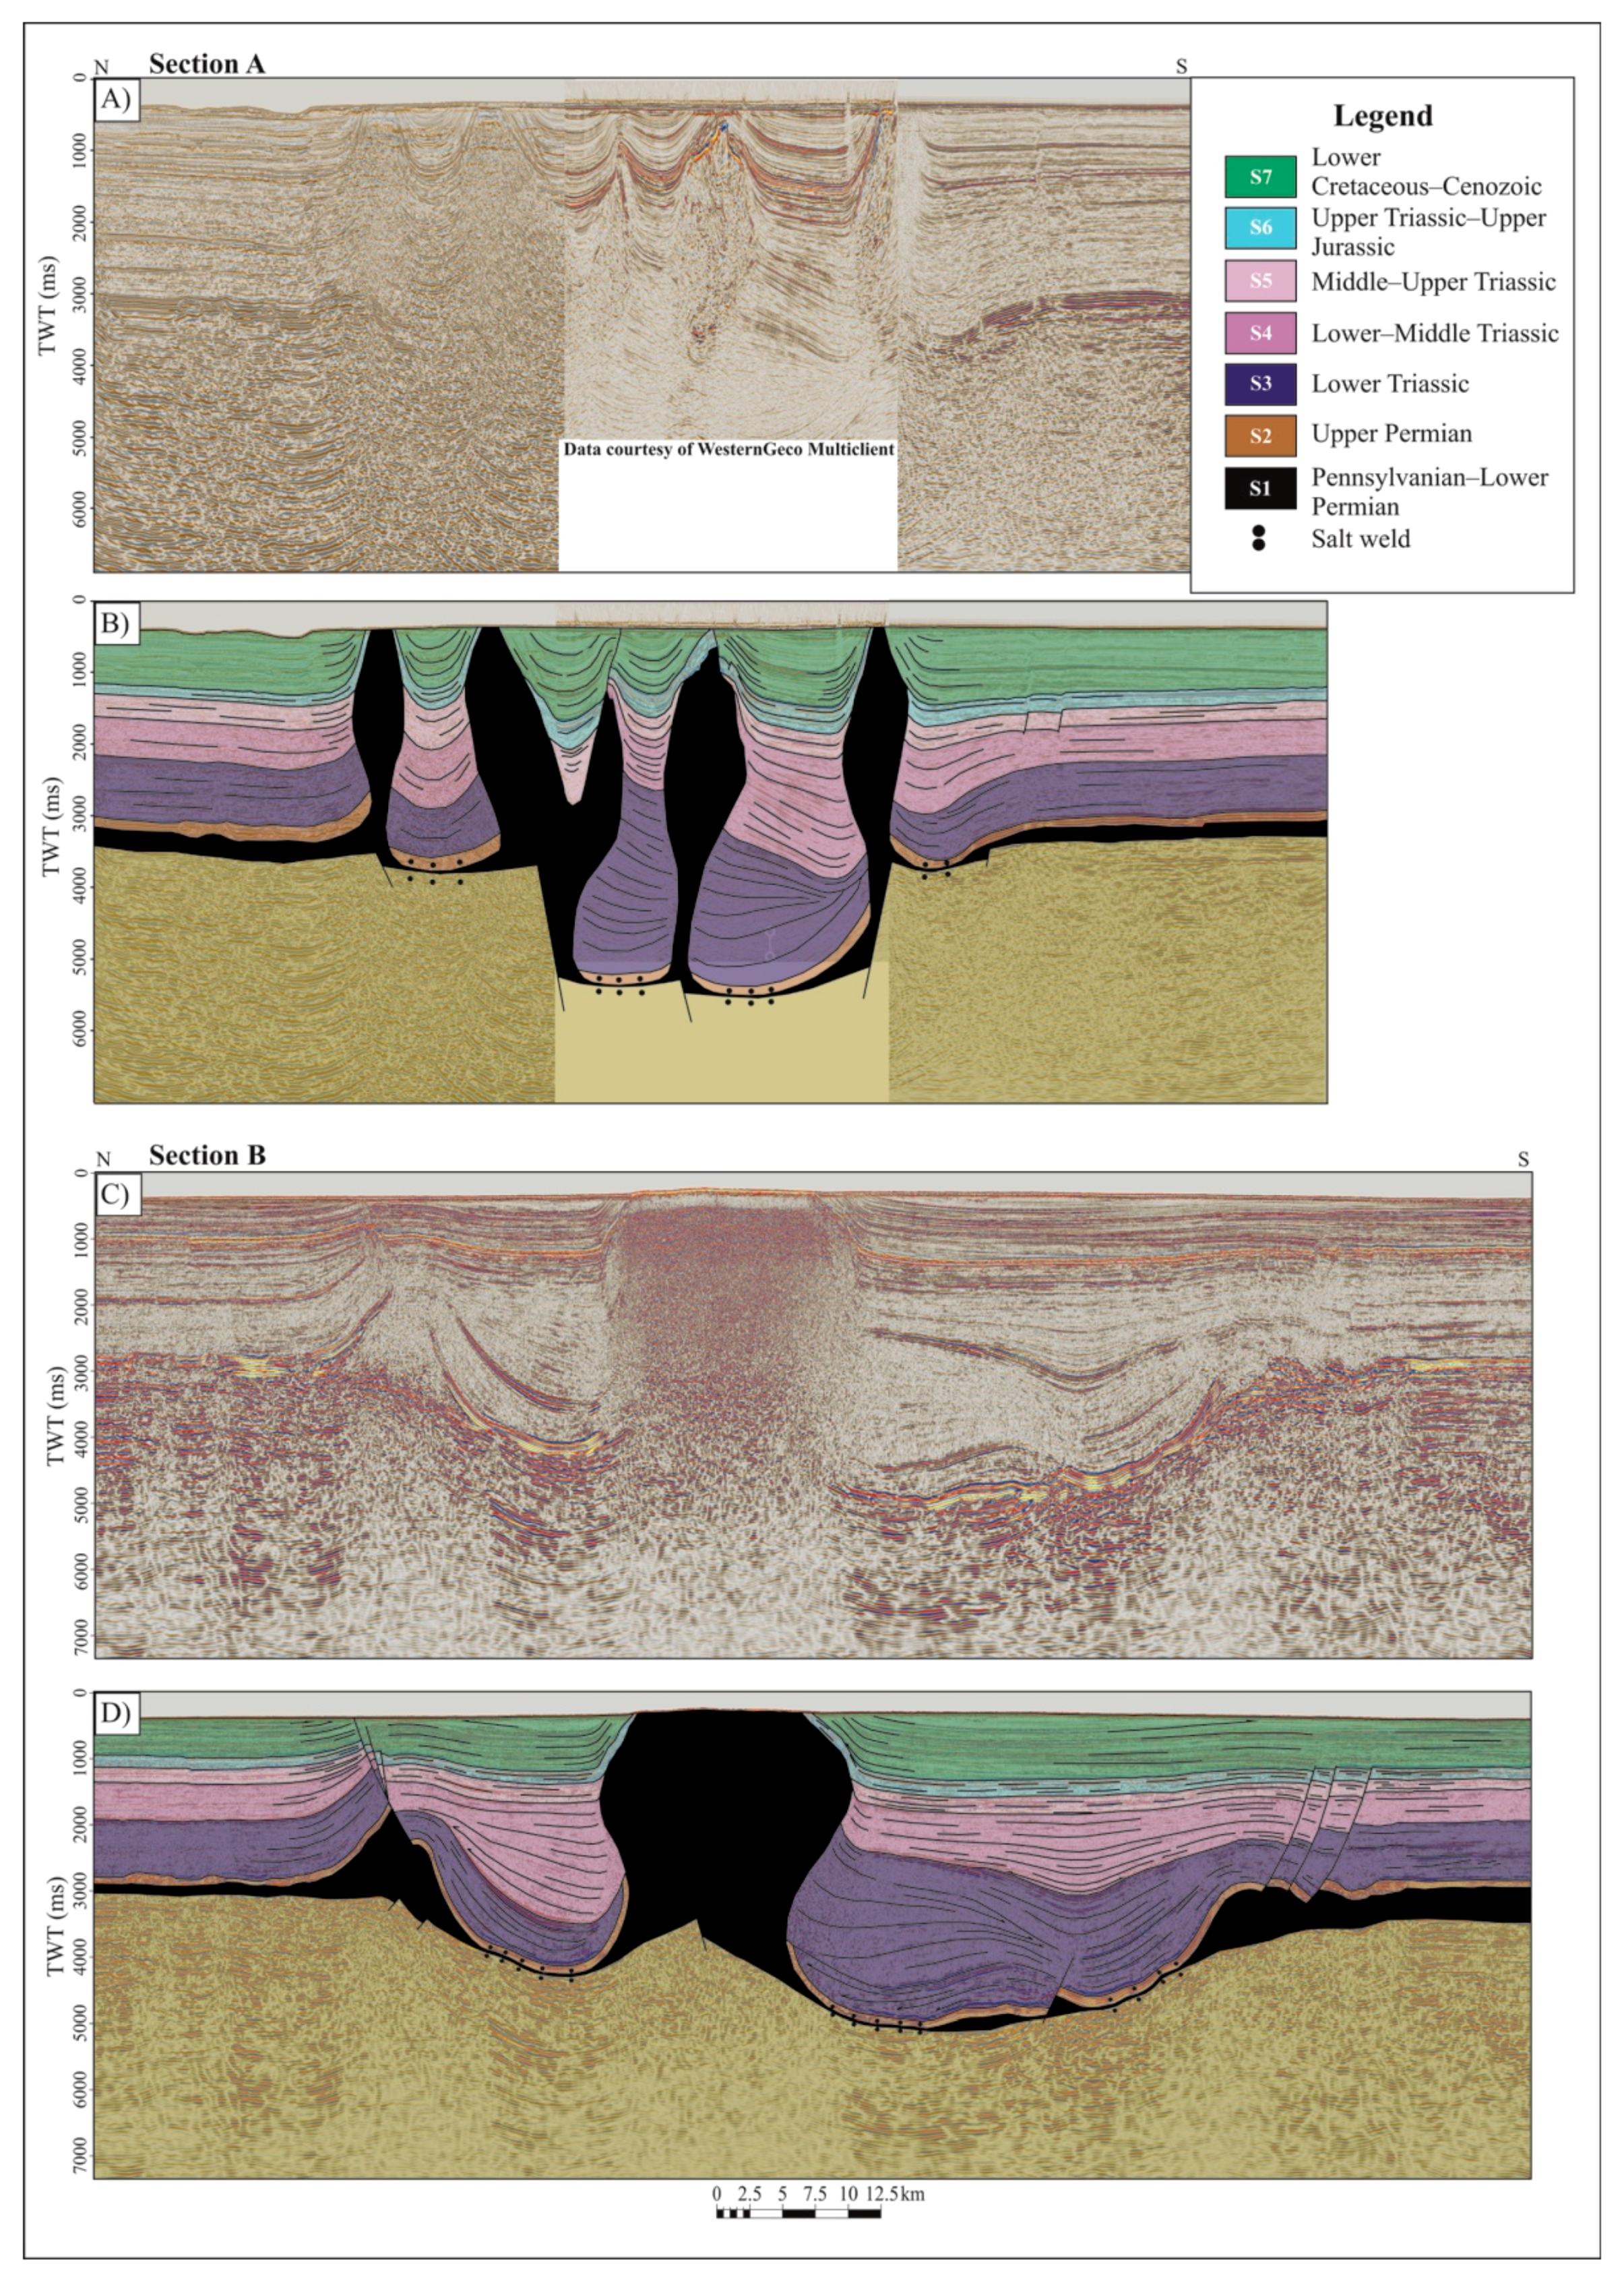
4.1. Paleogeometries

Figure 4 displays the restoration of the two cross sections in the central (section A, Figure 4A) and eastern (section B, Figure 4B) sub-basins. The restoration stages are the paleo-geometries input to the thermal model. It should be noted that in Figure 4 and later figures (Figures 7 and 9), for the purpose of display and comparison between sections, section A is not vertically exaggerated while section B has a vertical exaggeration of 2. Below we present a short description of the geologic evolution portrayed by the restorations.

4.1.1. Section A, Central Sub-basin

Syn-rift to early post-rift layered evaporate sequences (LES) precipitated in a symmetric graben and were overlain by pre-kinematic Upper Permian carbonates (Figure 4A, VIII). During the earliest Triassic, thick-skinned extension accompanied by differential loading of Triassic sediments sourced from the Urals, created a structural style consisting of NW shifting patterns in salt withdrawal and ENE-WSW-trending passive diapirs (Figure 4A, V–VII). Passive diapirism and welding occurred diachronously across the section, and first occurred in the northern part of the graben due to the preferential loading of salt in this region (Figure 4A, V). In the southern part, minor loading caused the formation of a salt pillow. During the Early-Middle Triassic, differential loading focused on the southern part of the graben, which caused a shift in salt withdrawal and subsequent salt expulsion towards the south (Figure 4A, IV). This favored the formation of a half turtle structure and a passive diapir above the southern boundary fault. By the end of this period, the minibasins grounded the base salt forming salt welds (Figure 4A, IV). During the Late Triassic to Late Jurassic, thick-skinned extension induced diapir collapse of the northern diapir since the underlying salt was almost totally evacuated (Figure 4A, III). This formed a minibasin above the diapir crest, filled by Upper Triassic and Jurassic strata. Minor differential loading of the remaining salt in the south favored the continued growth of the southern and central salt diapirs (Figure 4A, III). During the Cretaceous and Cenozoic, higher sedimentation rates than diapir growth rates led to burial of the salt diapirs (Figure 4A, II). This episode was then followed by Late Cenozoic contraction, diapirism and uplift, which eroded approximately 1.5 km of Cretaceous and Cenozoic strata (Figure 4A, I).

4.1.2. Section B, Eastern Sub-basin

LES in this section precipitated in a more sag-type basin, which was later covered by Upper Permian carbonates (Figure 4B, VIII). Earliest Triassic sediment loading accompanied by thick-skinned extension generated expulsion rollovers towards the north and a central passive diapir (Figure 4B, V–VII). Differential loading occurred preferentially at the basin axis forming the first salt weld by the earliest Triassic, whereas a significant amount of salt remained on the northern and southern basin boundaries (Figure 4B, V–VI). During the Middle Triassic, differential loading focused mostly on the north, forming the northern minibasin and favoring the growth of the northern salt pillow and the central passive diapir (Figure 4B, IV). To the south, differential loading caused a shift in salt withdrawal, which resulted in the welding of the southern minibasin and the formation of a half-turtle structure. Continuous basin subsidence by thick-skinned extension and salt withdrawal produced the flexure and extension of suprasalt strata at basin boundaries, resulting in the generation of suprasalt fault complexes (Figure 4B, IV). By the end of the Middle Triassic, the northern and southern minibasins grounded the base salt (Figure 4B, IV). Even though most of the underlying salt was evacuated, the central salt diapir continued to grow during the rest of the Mesozoic by gliding of suprasalt strata towards the basin axis and thin-skinned contraction (Figure 4B, II–IV). Higher sedimentation rates than diapir growth rates caused the burial of salt structures during the Cretaceous and Cenozoic (Figure 4B, II). During the Cenozoic, salt structures were rejuvenated by contraction. This episode was followed by Late Cenozoic uplift and erosion, which removed approximately 1.5 km of Cretaceous and Cenozoic strata (Figure 4B, I).

4.2. Thermal Boundary Conditions

Thermal boundary conditions determine the primary energetic inputs to reproduce the temperature history of the basin and, consequently, for the maturation of source rocks. As mentioned above, the sediment-water interface temperature (SWIT) represents the upper boundary condition whereas the basal heat flow represents the lower boundary condition. These parameters were constrained to ensure that the modeled thermal field best-fits temperature data in the basin.
For the SWIT, we used the automatic SWIT tool in PetroMod, which extracts a standard temperature at sea level over geological time based on the basin’s present-day geographic location and paleo-latitude (Figure 5A). A transformation that corrects the surface temperature against the paleo-water depth was applied and the SWIT estimated. The latitudinal position assigned to the Nordkapp basin was 72°N, and paleo-water depths (Figure 4B) were taken from [18].
The basal heat flow was calculated by reconstructing the lithospheric thickness from the Late Carboniferous to the present (Figure 5C). In order to do this, we adopted mean values for the stretching factor (β) of each rift phase (Figure 5, yellow rectangles): Late Carboniferous (320–305 Ma, β = 1.6), Late Permian (270–250 Ma, β = 1.25), and Late Jurassic–Early Cretaceous (165–145 Ma, β = 1.15), as proposed by [42]. The Post-Caledonian lithosphere and crustal thicknesses were defined at the rift initiation. An initial lithospheric thickness of 120 km and an initial crustal thickness of 35 km (17.5 km upper crust, 17.5 km lower crust) were adopted from Clark et al. (2014). The present-day crustal thickness is 18 km (16 km upper crust, 2 km lower crust) as documented by [41,42,44]. The temperature at the lithosphere-asthenosphere boundary was set to 1300 °C and the mantle heat flow to 30 mW/m2. Figure 5C,D depict the modeled lithospheric thickness and basal heat flow through time, respectively.
A good fit between measured and calculated temperature values of five exploration wells (7228/7-1B, 7228/7-1S, 7228/2-1S, 7228/7-1A, 7228/2-1S) and three shallow wells in the Nordkapp Basin (7227/11-U-02, 7227/07-U-01, 7230/08-U-01) was achieved using estimated basal heat flow values of ~45 mW/m2 (Figure 6A). Extrapolating the thermal model calculated in the western sub-basin to the entire Nordkapp Basin is unrealistic due to possible variations in the initial thickness of the Post-Caledonian crust and lithosphere [42], and the magnitude of rifting across the basin. Nevertheless, we chose to do so it in order keep the model as simple as possible and to avoid biasing the model with poorly-constrained inputs. In addition, the effects of episodic glacial loading-unloading and erosion during the Late Cenozoic documented by several authors [45,46,47,48,49] are not considered in the model.
Unlike temperature, vitrinite reflectance data display higher maturities than the calculated trend (Figure 6B). Vitrinite measurements from wells 7228/7-1A and 7228/7-1S in the central part of the basin plot closer to the calculated trend than corresponding values from well 7228/2-1S in the northern rim of the basin (Figure 6B, see Figure 1B for well locations). This most likely reflects different amounts of erosion at different locations in the basin. Well 7228/2-1 S shows a characteristic pattern of increasing thermal maturity with stratigraphic age from Cenozoic to Middle Triassic (Figure 6B). However, at ~3600 m depth, a sudden increase in vitrinite values is observed near the top of the Lower Triassic Havert Formation. Here, the well values define a steeper vitrinite trend, implying higher temperature gradient. Igneous activity could explain this higher thermal gradient, but there is no evidence of such activity. The modeled paleo-heat flow (Figure 5D) depicts higher flow rates (~54 mW/m2) during and immediately after the Late Permian rifting, which seem to be a plausible explanation to the higher thermal gradient. Thus, the modeled heat flow (Figure 5D) is a reasonable scenario for the Nordkapp Basin, and together with the SWIT (Figure 5A), it defines the boundary conditions for the thermal model. Transient heat-flow conditions were assumed at all times.

4.3. Model Parameters

The restoration stages in Figure 4 were imported and digitized in Petromod for thermal modeling. Sediment types and ages were defined based on the seismic units in Figure 1C. Rock properties were assigned to each unit (Table 1). Lithologies were user-defined considering the proportion of different sediments, i.e., sandstone, siltstone, shale, limestone, coal, and salt. Each defined lithology was assigned an initial porosity value and a porosity versus depth trend (factor c in Table 1) that decreases exponentially with the greatest porosity loss happening at shallow depths [50,51]. The thermal conductivity of the various units was set to vary linearly as a function of porosity. The model also accounts for variations in the thermal conductivity with increasing temperature following the model described by [52], i.e., the conductivity of salt drops from 6.5 (W/mk) at 20 °C to 4.14 (W/mk) at 220 °C. Finally, the thermal model was computed numerically using finite elements on a regular grid with 300(x) × 150(y) cells.
Five source rock intervals were modeled: The Upper Jurassic Hekkingen Formation (S6), the Upper Triassic Snadd Formation (S5), the Lower to Middle Triassic Kobbe Formation (S4), the Permian Tempelfjorden Group (S2), and a Carboniferous pre-salt coaly source rock (Figure 1C, green rows in Table 1). Since S4 is remarkably thick (Figure 2), we considered the source rock interval, presumably correlatable with the Botneheia Formation in the western Barents Sea [33,35,53], to be only in the uppermost 300 m of this unit. The large stratigraphic interval encompassed by the modeled source rocks reflects the uncertainty in source rock distribution and thickness in the basin.

5. Results

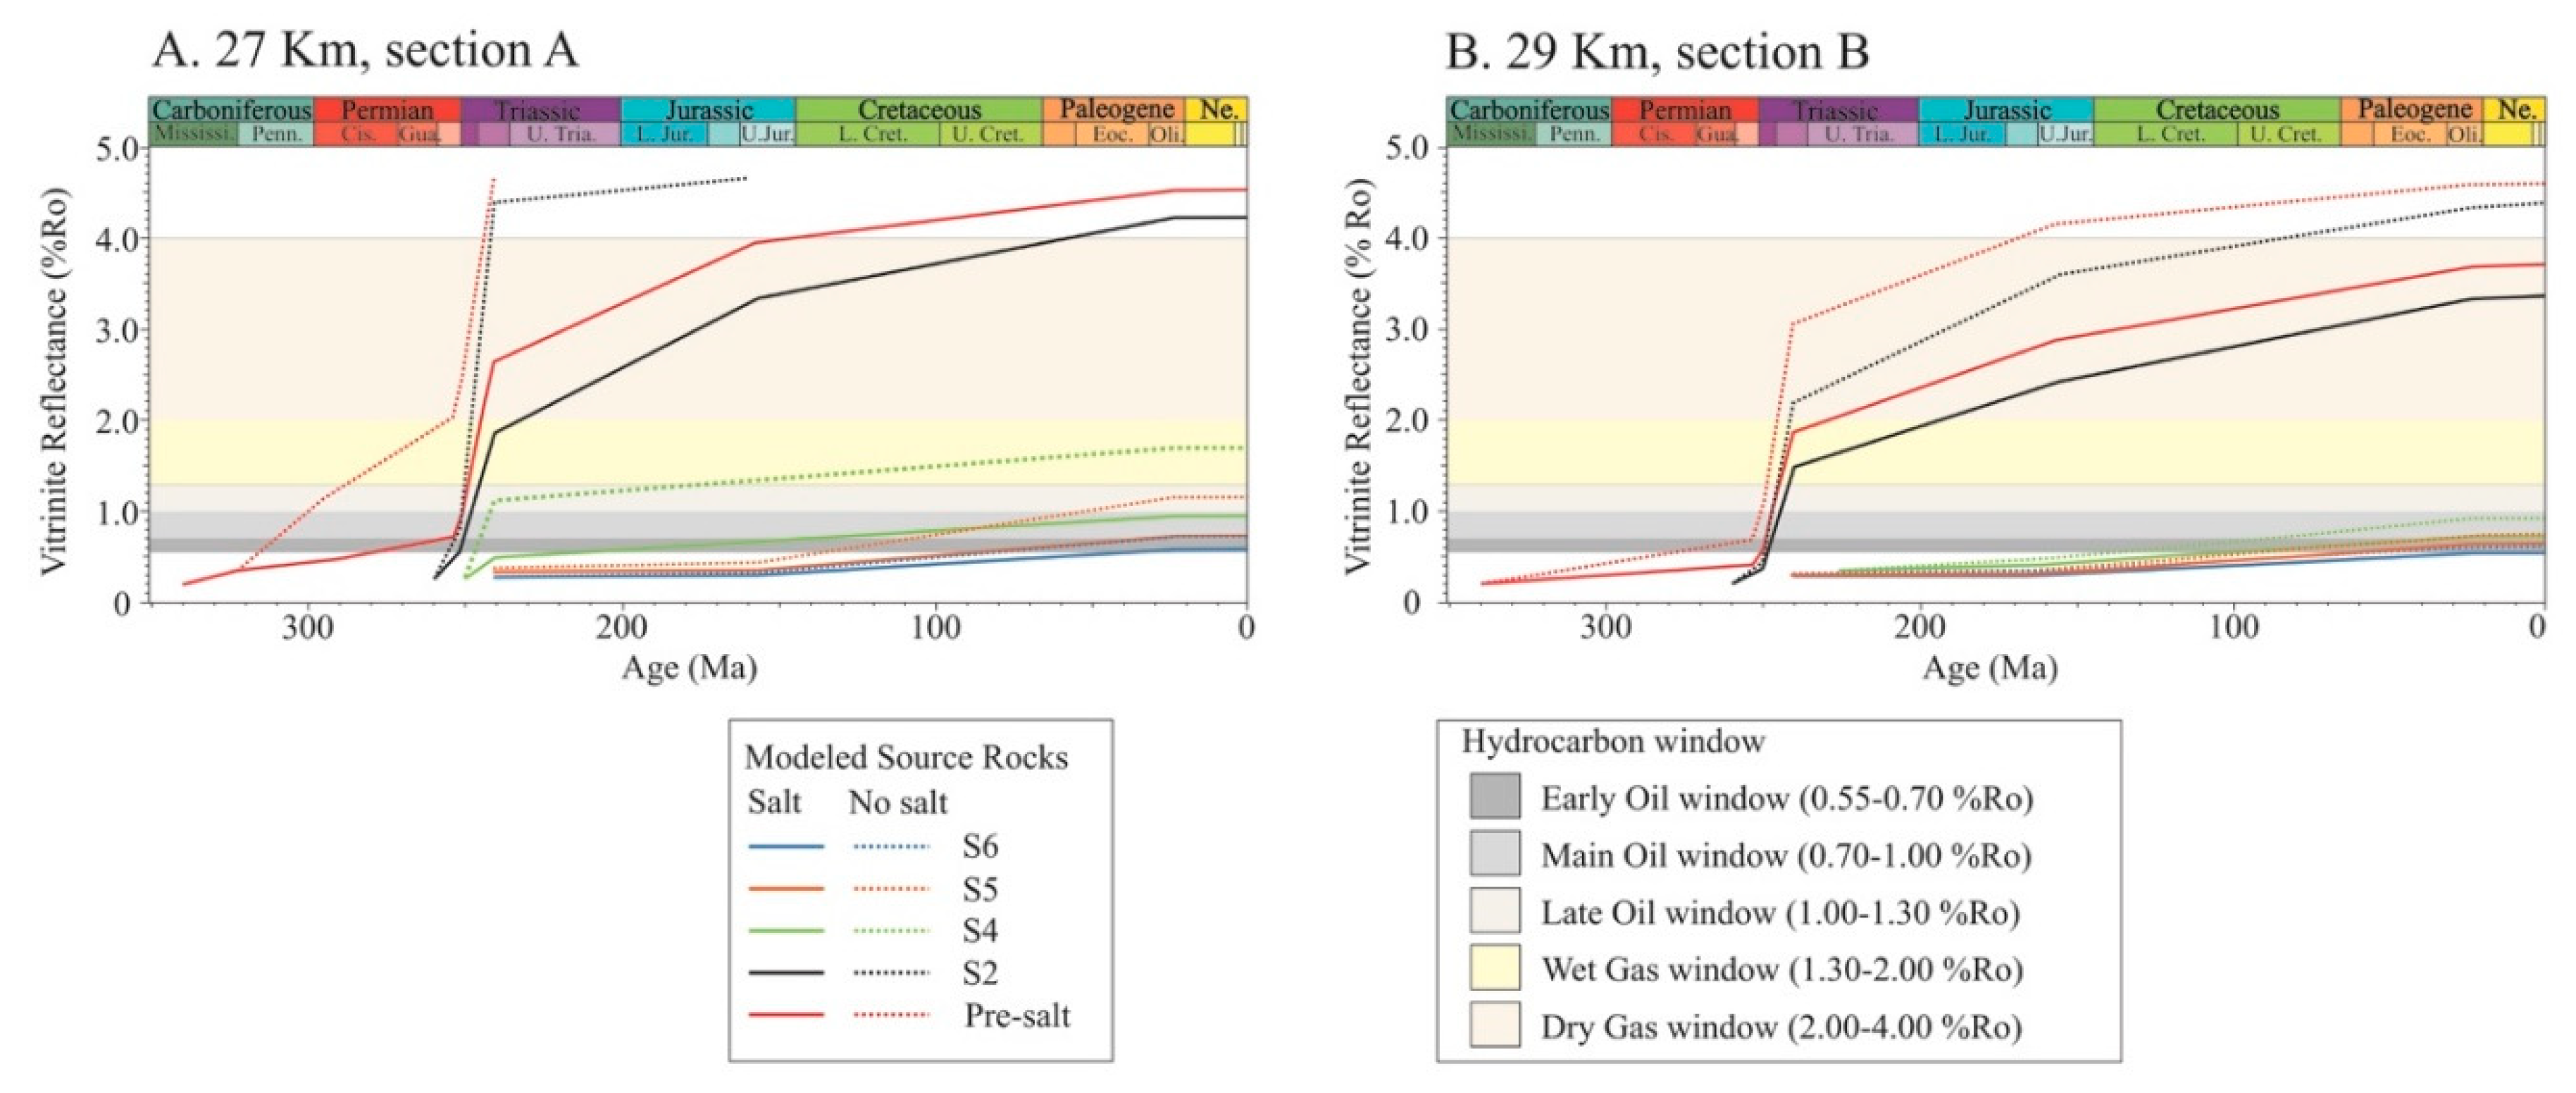
5.1. Thermal Evolution

Figure 7 depicts the modeled evolution of temperature through time in the central sub-basin (Figure 7A) and eastern sub-basin (Figure 7B). During the initial Late Permian stage prior to salt mobilization, in the central part of the basin the thermal gradient is reduced within the salt (up to 3 km thick) as depicted by widely spaced isotherms (Figure 7A,B, VIII). Temperatures are elevated above the salt, implying enhanced heat flow. Towards the shoulders of the basin, the regional thermal gradient is reestablished.
In the Early to Middle Triassic stages, when salt was mobilized and reached the surface (Figure 7, IV to VII), the temperature distribution was altered as salt diapirs provided vertical conduits for conducting heat out of the basin, inducing a negative thermal anomaly in the interior of the diapirs. This thermal anomaly is highest at the center of the diapirs and gradually decreases outwards. Isotherms within the diapirs are widely spaced and, as a consequence, isotherms are deeper below salt than in the adjacent minibasins. Around the salt diapirs, the temperature is also affected by the reduced geothermal gradient inside the diapir. The wide, isolated diapir in the eastern sub-basin shows this effect more clearly (Figure 7B, IV). In this diapir, the temperature contrast between the salt interior and surrounding minibasins at ~3 km is as much as 30 °C. In the central sub-basin (section A), the negative thermal anomaly of a single diapir cannot be seen as the diapirs are narrower and closer together (Figure 7A, IV). In this section, the thermal effect of each diapir mutually interferes, resulting in a combined effect that lowers the isotherms below the regional trend. In the center of the basin, temperatures are as much as 60 °C lower than those in the platform areas far from the salt effect.
After deposition of the Upper Jurassic and Cretaceous-Cenozoic sediments, the salt diapirs are no longer connected to the surface (Figure 7, stages II and III). A positive thermal anomaly developed above the closely spaced diapirs in section A and above the single diapir in section B owing to the focusing of heat by the underlying salt. In section A, the temperature rises ~10 °C above the largest diapir compared to the surrounding sediments (Figure 7A, II) while in section B the temperature rises ~15 °C above the massive diapir (Figure 7B, II). The negative thermal anomaly within the salt diapirs is still present, but at a lower intensity than in previous stages.
Several pseudo-wells along the sections demonstrate the thermal effect of the salt at present day. In the central sub-basin (section A), we extracted temperatures in pseudo-wells through a small diapir at 9 km from the northern edge of the cross-section, and through a wider diapir at 17 km. Temperatures were also extracted in pseudo-wells at 27 km and at 56 km in a minibasin and a platform area, respectively (Figure 7A, I). Figure 8A depicts the distribution of temperature in these wells. The thermal gradient in the small diapir (9 km well) is greater than in the large diapir (17 km well). The temperature difference between these wells is ~15 °C at a depth of 5 km. In both diapirs, the thermal gradient beneath the salt increases and depicts a similar trend to the one observed at the well in the platform area (56 km well). The temperature beneath the small diapir (9 km well) is still ~25 °C higher than below the large diapir (17 km well) (Figure 8A). These differences are most likely related to the size of the diapirs, with the wider diapir conducting heat more efficiently. Significant thermal differences exist between the two wells outside salt structures (27 and 56 km wells). The maximum temperature difference between these two wells is ~35 °C at a depth of 5 km (Figure 8A). Although both wells are outside the salt diapirs, the well in the minibasin (27 km) is between closely spaced diapirs whose mutually interfering effect induces a broad negative thermal anomaly in the central part of the basin. Therefore, temperatures in the minibasin resemble those in the salt diapirs rather than those in the platform areas.
In the eastern sub-basin (section B), we extracted temperatures in pseudo-wells at 29 km from the northern edge of the cross-section in a minibasin, at 45 km through the massive diapir, and at 100 km in the platform area (Figure 7B, I). Figure 8B displays the distribution of temperature in these wells. The temperature gradient in the salt diapir (45 km well) is considerably lower than in the minibasin and platform area (29 and 100 km wells). The greatest temperature difference is ~110 °C at a depth of 7 km between the wells in the diapir (45 km) and the platform area (100 km). The well in the minibasin (29 km) shows intermediate temperatures, although still it is ~70 °C warmer than the diapir at a depth of 7 km (Figure 8B). These significant thermal differences are most likely related to the large size (width) of the salt diapir.

5.2. Source Rock Maturation

Figure 9 depicts the evolution in thermal maturity that each of the modeled source rock units experienced through time. The vitrinite reflectance model developed by Sweeney and Burnham [54] was implemented for maturation modeling of the source rocks. It simulates the onset of the oil window at 0.55%Ro, and the upper limit of thermogenic gas (dry) generation at 4%Ro.
In the Late Permian, pre-salt source rocks in the central part of the basin were buried at depths of more than 4 km, and maturities of 0.7–1.0%Ro were attained (Figure 9, VIII). In the basin’s margins, the same rocks were shallower at ~2 km and accordingly, they were immature (<0.5%Ro). Upper Permian (S2) source rocks were shallowest and immature.
From the Early Triassic until the Late Jurassic, salt mobilization was confined to the central part of the basin (Figure 9, III–VII). Salt evacuation resulted in minibasin subsidence and infilll, causing progressive maturation along the axes of the rapidly subsiding minibasins. Pre-salt and Upper Permian (S2) source rock units were deeply buried in the central part of the basin where their maturities were highest. Maturity in these units systematically decreases updip away from the salt bodies. In the central sub-basin, source rock maturity exceeded 2.0%Ro and reached maturities beyond any hydrocarbon generation (>4%Ro, Figure 9A, III). In the eastern sub-basin, the thermal maturities generally were lower and ranged from 0.55 to 4.0%Ro, although locally these source rocks exceeded values of 4.0%Ro (Figure 9B, III). The base of the source rocks modeled at the top of the Lower to Middle Triassic (S4) unit locally attained maturity values higher than 0.55%Ro in the central sub-basin (Figure 9A, III).
From the Early Cretaceous through the Cenozoic, widespread sedimentation increased the burial of source rocks to their maximum maturity. In the central sub-basin, Paleozoic (pre-salt and S2) source rocks mostly became overmature (>4%Ro) in the central part of the basin, whereas over the platforms they lied within the gas window (1.3–4%Ro, Figure 9A, II). In the eastern sub-basin, the Paleozoic source rocks lied within the gas window, except in the southern mini-basin where they were overmature (Figure 9B, II). The maturity of the Triassic (S4 to S5) and Jurassic (S6) source rocks generally exceeded 0.55%Ro, and locally reached a maximum of 1.0–1.3%Ro in the central sub-basin (Figure 9A, II). In the eastern sub-basin, Upper Triassic to Jurassic source rocks (S5 and S6) were immature near the diapir, while Upper Permian source rocks (S2) were still in the late oil to wet gas window adjacent to this diapir (Figure 9B, II). A similar although less pronounced effect is observed along the flanks of the northern, widest diapir of the central sub-basin (Figure 9A, II).
In the Late Cenozoic, compression caused widespread uplift and exhumation, and subsequently the Mesozoic-Cenozoic section underwent erosion, freezing maturation. At present-day, exceptionally low maturity in the Upper Permian to Jurassic source rocks exists along the flanks of the salt diapirs (Figure 9, I). This reduction in thermal maturation in the vicinity of salt diapirs is ubiquitous, indicating that source rock maturation was not only controlled by burial, but also by the thermal anomalies induced by the salt structures. In the central part of the basin, pre-salt and Upper Permian (S2) source rocks are deeper and mostly overmature in the central sub-basin, while in the eastern sub-basin they are in the late oil to dry gas window (Figure 9, I).
In order to better visualize the effect of salt on source rock maturation, we generate vitrinite reflectance versus depth trends in two pseudo-wells through minibasin locations, at 27 km in section A and at 29 km in section B (Figure 9, I). 1D modeling was performed both with the presence of the salt diapirs (continuous lines, Figure 10) and with the salt diapirs substituted by sediments (dashed lines, Figure 10). It should be noted that maturation freezes at ~23 Ma when regional uplift of the basin is simulated.
At the 27 km location in the central sub-basin, pre-salt and Upper Permian (S2) source rocks experienced a rapid maturation that drove them into the dry (pre-salt) and wet gas (S2) window at ~240 Ma (Figure 10A). Thermal maturation continued, and both intervals became overmature (>4%Ro) at around 150 Ma (pre-salt) and 50 Ma (S2). Without the negative thermal effect of salt structures, these source rocks would have entered the oil window as early as 315 Ma (pre-salt) and 255 Ma (S2), and they would have become overmature at ~255 Ma. The Lower-Middle Triassic (S4) source rocks entered the oil window at ~220 Ma, and gradually maturated to present values of ~1%Ro (Figure 10A). In the absence of salt structures, these rocks would have reached the oil window at ~250 Ma, and they would presently be in the wet gas window (~1.7%Ro). The Middle-Upper Triassic (S5) source rocks entered the oil window at ~85 Ma and reached a maximum vitrinite reflectance of ~0.8%Ro. On the other hand, The Upper Triassic-Upper Jurassic (S6) source rocks barely reached the oil window at ~30 Ma (Figure 10A). These two organic rich intervals would have been oil mature at ~135 Ma and 75 Ma, and they would presently be in the late (1.15%Ro) and main (0.75%Ro) oil window, respectively, if no salt structures existed in the basin.
In the eastern sub-basin at the 29 km location, the pre-salt and Upper Permian (S2) source rocks experienced a rapid transition from immature to the wet gas window in the Early Triassic (~250 Ma, Figure 10B). Maturation continued without interruption and these units reached the dry gas window (pre-salt = 3.7 and S2 = 3.35%Ro) before the Oligocene uplift (~23 Ma). In the absence of salt structures, these potential source rocks would have been overmature at ~170 Ma and 85 Ma, respectively. Mesozoic source rocks (S4, S5, and S6) are overall marginally to mid-mature (Figure 10B). The Lower-Middle Triassic (S4) source rocks entered the oil window at ~105 Ma, and reached a maximum maturity of ~0.7%Ro. The Middle-Upper Triassic (S5) interval entered the oil window at ~60 Ma and attained a maturity of ~0.65%Ro. The youngest Triassic-Upper Jurassic (S6) source rocks are marginally mature with vitrinite values of ~0.53%Ro. Without the massive salt diapir, the maturity of these three organic rich intervals would be 0.9, 0.75, and 0.65%Ro, respectively.

6. Discussion

6.1. Uncertainties

In confined salt-bearing basins, such as the Nordkapp Basin, seismic imaging and interpretation of salt bodies are certainly challenging due to the steeply dipping diapir flanks and complex ray paths of the seismic waves travelling through the salt [55,56]. Consequently, poor seismic imaging of salt structures can lead to incorrect interpretation of their shapes, which undoubtedly has negative consequences for determining the progressive evolution and thermal effect of salt structures through time. Uncertainty also arises from depth conversion of the seismic profiles. Figure 3A displays a wide range of interval velocities due to lateral variations in lithology and different degrees of compaction and diagenesis. In addition, the velocities of deep sediments within the Nordkapp minibasins are unknown because there are no exploration wells through the entire minibasins stratigraphy. Despite these uncertainties, the velocity model used in this study provides similar results (depths) to previous magnetic and gravity studies by Gernigon et al. [23] in the Eastern Barents Sea.
2D structural reconstructions involve several uncertainties associated with the type of unfolding method (flexural slip vs simple shear), decompaction curves, water depth, and elastic thickness. Testing different restoration parameters will indeed result in different paleogeometries. However, the objective of this paper is not to test the sensitivity of model parameters but rather use reasonable parameter values. For example, we use simple shear to remove the deformation caused by passive diapirism because the length loss adjacent to salt diapirs is negligible compared to the length of the section. On the other hand, we use flexural slip in sequences SU2 and SU3 because it preserves length in these parallel-folded units [57]. Based on studies by Klausen and Helland-Hansen [58], we use the Sclater and Christie [51] decompaction curve because it fits well the porosity versus depth trends observed on borehole data in the Barents Sea. Finally, an elastic thickness of 20 km was chosen based on Gac et al. [41].
In terms of thermal modeling, most of the crucial stages (IV to VIII) for the formation of the Nordkapp Basin encompass a relatively short (~20 Ma) and old (Permian-Early Triassic) time interval (Figure 5D). Therefore, restoring sensible boundary conditions (basal heat flow and SWTI) for this period is crucial. Inevitably, assumptions are intrinsic to the model due to the general lack of calibration data, with the exception of a few bottom well temperatures and vitrinite data (Figure 6). Extrapolating boundary conditions calculated in the western sub-basin to the central and eastern sub-basins can be unrealistic, since the initial thickness of the Post-Caledonian crust and lithosphere, and the amount of rifting defined by β most likely varied along the basin [42]. Additional uncertainty arises from the need to simplify lithologies, particularly for the deepest units, given the importance of their thermal conductivities and heat capacities in the simulations.
On the other hand, the model, as designed, would greatly benefit from assessing the distribution and thickness of the source rocks in each of the minibasins. For the petroleum system, the evaluation of the actual presence of good reservoir levels in the basin is a must. Despite these limitations, the modeling results represent the Nordkapp Basin geology and tectonic evolution, and they can be used to develop further exploration concepts in this basin and other basins alike.

6.2. The Importance of Thermal Modeling in Confined Salt-bearing Basins

The thermal effect of salt structures has been documented by previous studies in passive margins such as the Gulf of Mexico [6,9]. In this tectonic setting, salt deposition occurs in unconfined large areas where accommodation is controlled by thermal subsidence [59]. This also produces tilting of the margin, which in turn triggers downslope salt gliding and structures such as salt stocks, salt tongues, and allochthonous salt sheets [2]. These structures have received special attention due to their sealing capacity and their impact on maturation of underlying source rocks [6,8,9,10].
In the case of salt-bearing rift basins, syn-rift salt deposition is really limited by the rift geometry [59]. Salt mobilization by either extension and/or differential loading results in a structural style consisting of sub-vertical and closely spaced salt structures, which commonly coincide with the presence of subsalt faults [60,61,62]. Factors such as diapir shape and spacing play an important role in the thermal evolution of these basins [9].
Combined structural restorations and thermal modeling from the Nordkapp Basin indicate that the shape of salt diapirs and their inherent thermal anomalies vary through time and display a characteristic negative thermal effect (i.e., downward shift of isotherms), which is directly proportional to the width of the salt diapir (Figure 7). This is clearly observed in the eastern sub-basin (section B), where the presence of a wider and isolated salt diapir induces a strong, but laterally limited, negative anomaly. Temperatures along the diapir flanks could be up to 70 °C cooler and exceptionally low (~150 °C) at depths of ~9 km beneath the diapir. This integrated approach also highlights that closely-spaced diapirs in the central sub-basin mutually interfere and produce a combined negative thermal anomaly, which lowers the temperature in the minibasins by up to 50 °C with respect to the adjacent platform areas. Thus, although large salt tongues and allochthonus salt sheets are absent in confined basins, sub-vertical and closely spaced salt structures still generate a combined thermal anomaly that extends over large areas of the basin.

6.3. Implications for the Petroleum System

Salt diapirs in confined basins impact the petroleum system by retarding maturation of organic rich sediments, expanding the hydrocarbon generation window, and hindering diagenetic processes in reservoir levels. Figure 11 summarizes the implications of our results for the petroleum system of the Nordkapp Basin.

6.3.1. Source rocks

Present day vitrinite reflectance values in the Nordkapp Basin indicate that when maturation ceased upon uplift in the Oligocene, Mississippian (gas-prone) and Permian (oil-prone) source rock units were mostly overmatured (Figure 9A, I, and Figure 11). In areas where pre-salt source rocks lied at shallower depths (e.g., eastern sub-basin and basin shoulders), Paleozoic source rocks were still within the gas window (Figure 9B, I, and Figure 11). The modeled Permian source rocks show exceptional low maturity at the flanks of the massive salt diapir in the eastern sub-basin. The Middle-Upper Triassic oil and gas prone source rocks were most probably able to generate hydrocarbons as they entered well into the oil window (Figure 10 and Figure 11). Hydrocarbon generation from the Upper Jurassic oil-prone source rocks, however, is limited since these rocks were marginally to early mature. It is noteworthy that in the vicinity of salt structures, i.e., minibasins, thermal maturation rates are diminished (Figure 10). In the absence of such structures, the timing of maturation and generation of the different hydrocarbon phases is much earlier than what is implied in Figure 11, substantially affecting the petroleum system evolution.

6.3.2. Reservoirs

The negative thermal anomaly caused by salt diapirs may have prevented temperature-driven diagenetic processes (e.g., quartz cementation) in potential reservoirs of Triassic and Jurassic age (Figure 7, II). Nevertheless, diapir widening must also be considered when assessing the impact of diagenesis in flanking reservoirs. This process can naturally enhance the stress at diapir flanks, causing quartz pressure dissolution, and subsequent decrease of reservoir quality [2]. This needs to be given attention in the Nordkapp Basin since structural restorations suggest significant diapir widening from the Middle Triassic to the Late Jurassic (Figure 4, III–IV).

6.3.3. Traps

Based on the structural restorations, near-diapir structural and stratigraphic traps were present since the end of the Early Triassic (Figure 4 and Figure 11). Megaflaps [5,63] and halokinetic sequences [5,64,65], which formed in response to the active and passive stages of diapirism from the Early Triassic to Cretaceous (Figure 4, IV–VII, and Figure 11), are present at different stratigraphic levels. Potential traps also include Early–Middle Triassic half turtle structures (Figure 4, IV) and suprasalt fault complexes at the basin boundaries (Figure 4B, I).

6.3.4. Seal and migration

Impermeable salt can act as a seal rock for vertical and lateral migration of hydrocarbons in the Nordkapp Basin. The structural restorations illustrate that salt welds were present since the end of the Early Triassic (Figure 4, V). This welding may have allowed gas migration from Mississippian gas-prone source rocks into suprasalt Mesozoic reservoirs, which in turn may have favored reservoir porosity preservation at high depths, as documented by McBride et al. [6] for the Gulf of Mexico. Additionally, closely spaced diapirs in the central sub-basin can generate laterally sealed minibasins, which if capped by fine-grained rocks could create favorable scenarios for hydrocarbon entrapment.
Continuous diapir growth and successive reactivation of suprasalt fault complexes during the Mesozoic and Cenozoic could have also modified and/or destroyed structural traps and breached seals, causing migration of hydrocarbons to shallower traps or escape from the system (Rojo et al. [18]; their Figure 20). Late Cenozoic regional uplift and erosion [39] may have led to hydrocarbon phase separation, top seal failure, and remigration. The modification and destruction of traps, together with deep hydrocarbon kitchens, could have resulted in a complex petroleum system, where migration of petroleum, flushing of older traps, and mixing of hydrocarbons of different maturity and ages are dominant features. These observations are consistent with the current understanding of the petroleum system and geochemical data by Ohm et al. [16] and Lerch et al. [66] for the Norwegian Barents Sea.

7. Conclusions

In this study, we have integrated 2D structural restorations with thermal modeling to investigate how halokinesis impacted the thermal evolution of the basin through time and to explore the implications of the modeled thermal history on the petroleum system of the Nordkapp Basin, a confined, salt-bearing rift basin.
Combined structural restorations and thermal modeling show that the shape of salt diapirs and their negative thermal effect change through time. In the case of an isolated salt diapir, it induces a strong, but laterally limited, negative anomaly, which is directly proportional to its width. Temperatures along the diapir flanks are 70 °C cooler and are exceptionally low (~150 °C) at depths of ~9 km beneath the salt. On the other hand, the thermal anomalies of closely-spaced diapirs mutually interfere and generate a combined negative thermal anomaly that reduces the temperature in the minibasins by up to 50 °C with respect to the adjacent platform areas.
Although large salt tongues and allochthonus salt sheets are generally absent in confined rift basins, sub-vertical and closely spaced salt structures still generate a combined anomaly that extends over large areas of the basin. As a result, thermal maturation of the source rocks in the minibasins is retarded, and the hydrocarbon generation window is expanded. Thus, laterally-sealed minibasins offer favorable scenarios for deeper than normal hydrocarbons kitchens and entrapment in various near-diapir structural and stratigraphic traps.

Author Contributions

Conceptualization, A.C., L.A.R., N.C. and L.C.; methodology, A.C., L.A.R., L.C. and N.C.; software, A.C., L.A.R., L.C. and N.C.; validation, A.C., L.A.R., L.C. and N.C.; formal analysis, A.C., L.A.R., N.C. and L.C.; investigation, A.C., L.A.R., N.C. and L.C.; resources, A.C., L.A.R., L.C. and N.C.; writing—original draft preparation, A.C., L.A.R., N.C. and L.C.; writing—review and editing, A.C., L.A.R., N.C., L.C. and A.E.; visualization, A.C., L.A.R., N.C. and L.C.; supervision, A.C., L.A.R. and N.C.; project administration, A.C., L.A.R. and N.C.

Funding

This research received no direct funding. However, Andrés Cedeño was supported by the JuLoCrA project.

Acknowledgments

This work evolved from a Master thesis by Luis Centeno at the University of Stavanger. We are grateful to WesternGeco Multiclient for providing full azimuth 3D seismic data from the Nordkapp Basin, and the Norwegian Petroleum Directorate for kindly providing the NPD-BA-11 2D seismic survey in the eastern Norwegian Barents Sea. Thanks to Schlumberger and Midland Valley for providing academic licenses of their softwares PetroMod and Move, respectively. The authors are grateful to two anonymous reviewers and to the guest editor Willy Fjeldskaar for their valuable contributions. Andres Cedeno thanks the JuLoCrA project for economic support.

Conflicts of Interest

The authors declare no conflict of interest.

References

  1. Hudec, M.R.; Jackson, M.P. Terra infirma: Understanding salt tectonics. Earth-Sci. Rev. 2007, 82, 1–28. [Google Scholar] [CrossRef]
  2. Jackson, M.P.; Hudec, M.R. Salt Tectonics: Principles and Practice; Cambridge University Press: Cambridge, UK, 2017; 498p. [Google Scholar]
  3. Matthews, W.J.; Hampson, G.J.; Trudgill, B.D.; Underhill, J.R. Controls on fluviolacustrine reservoir distribution and architecture in passive salt-diapir provinces: Insights from outcrop analogs. AAPG Bull. 2007, 91, 1367–1403. [Google Scholar] [CrossRef]
  4. Banham, S.G.; Mountney, N.P. Controls on fluvial sedimentary architecture and sediment-fill state in salt-walled mini-basins: Triassic Moenkopi Formation, Salt Anticline Region, SE Utah, USA. Basin Res. 2013, 25, 709–737. [Google Scholar] [CrossRef] [Green Version]
  5. Rojo, L.A.; Escalona, A. Controls on minibasin infill in the Nordkapp Basin: Evidence of complex Triassic synsedimentary deposition influenced by salt tectonics. AAPG Bull. 2018, 102, 1239–1272. [Google Scholar] [CrossRef]
  6. McBride, B.C.; Weimer, P.; Rowan, M.G. The effect of allochthonous salt on the petroleum systems of northern Green Canyon and Ewing Bank (offshore Louisiana), northern Gulf of Mexico. AAPG Bull. 1998, 82, 1083–1112. [Google Scholar]
  7. Rowan, M.G.; Lawton, T.F.; Giles, K.A. Anatomy of an exposed vertical salt weld and flanking strata, La Popa Basin, Mexico. In Salt Tectonics, Sediments and Prospectivity; Alsop, G.I., Archer, S.G., Hartley, A.J., Grant, N.T., Hodgkinson, R., Eds.; Geological Society: London, UK, 2012; Volume 363, pp. 33–57. [Google Scholar]
  8. Lerche, I.; O’brien, J.J. Dynamical Geology of Salt and Related Structures; Academic Press: San Diego, CA, USA, 1987; p. 832. [Google Scholar]
  9. Mello, U.T.; Karner, G.D.; Anderson, R.N. Role of salt in restraining the maturation of subsalt source rocks. Mar. Pet. Geol. 1995, 12, 697–716. [Google Scholar] [CrossRef]
  10. Yu, A.; Lerche, I. Thermal impact of salt: Simulation of thermal anomaly in the Gulf of Mexico. Pure Appl. Geophys. 1992, 2, 180–192. [Google Scholar] [CrossRef]
  11. Gabrielsen, R.; Kløvjan, O.; Rasmussen, A.; Stølan, T. Interaction between halokinesis and faulting: Structuring of the margins of the Nordkapp Basin, Barents Sea region. In Structural and Tectonic Modeling and Its Implication to Petroleum Geology; Larsen, B., Brekke, H., Larsen, B., Talleraas, E., Eds.; Norwegian Petroleum Society (NPF): Oslo, Norway, 1992; Volume 1, pp. 121–131. [Google Scholar]
  12. Jensen, L.N.; Sørensen, K. Tectonic framework and halokinesis of the Nordkapp Basin, Barents Sea. In Structural and Tectonic Modeling and Its Application to Petroleum Geology; Larsen, R.M., Brekke, H., Larsen, B.T., Talleraas, E., Eds.; Norwegian Petroleum Society (NPF), Special Publications: Oslo, Norway, 1992; Volume 1, pp. 109–120. [Google Scholar]
  13. Koyi, H.; Talbot, C.J.; Tørudbakken, B.O. Salt tectonics in the Northeastern Nordkapp basin, Southwestern Barents Sea. In Salt Tectonics: A Global Perspective; Jackson, M.P.A., Roberts, D.G., Snelson, S., Eds.; American Association of Petroleum Geologists: Tulsa, OK, USA, 1995; AAPG Memoir 65; pp. 437–447. [Google Scholar]
  14. Nilsen, K.T.; Vendeville, B.C.; Johansen, J.-T. Influence of regional tectonics on halokinesis in the Nordkapp Basin, Barents Sea. In Salt Tectonics: A Global Perspective; Jackson, M.P.A., Roberts, D.G., Snelson, S., Eds.; American Association of Petroleum Geologists: Tulsa, OK, USA, 1995; AAPG Memoir 65; pp. 413–436. [Google Scholar]
  15. Stadtler, C.; Fichler, C.; Hokstad, K.; Myrlund, E.A.; Wienecke, S.; Fotland, B. Improved salt imaging in a basin context by high resolution potential field data: Nordkapp Basin, Barents Sea. Geophys. Prospect. 2014, 62, 615–630. [Google Scholar] [CrossRef]
  16. Ohm, S.E.; Karlsen, D.A.; Austin, T. Geochemically driven exploration models in uplifted areas: Examples from the Norwegian Barents Sea. AAPG Bull. 2008, 92, 1191–1223. [Google Scholar] [CrossRef]
  17. Henriksen, E.; Bjørnseth, H.; Hals, T.; Heide, T.; Kiryukhina, T.; Kløvjan, O.; Larssen, G.; Ryseth, A.; Rønning, K.; Sollid, K. Uplift and erosion of the greater Barents Sea: Impact on prospectivity and petroleum systems. In Arctic Petroleum Geology; Spencer, A.M., Embry, A.F., Gautier, D.L., Stoupakova, A.V., Sørensen, K., Eds.; Geological Society, London, Memoirs: Lodon, UK, 2011; Volume 35, pp. 271–281. [Google Scholar]
  18. Rojo, L.A.; Cardozo, N.; Escalona, A.; Koyi, H. Structural style and evolution of the Nordkapp Basin, Norwegian Barents Sea. AAPG Bull. 2019, in press. [Google Scholar] [CrossRef]
  19. Rowan, M.G.; Lindsø, S. Chapter 12—Salt Tectonics of the Norwegian Barents Sea and Northeast Greenland Shelf A2. In Permo-Triassic Salt Provinces of Europe, North Africa and the Atlantic Margins; Soto, J.I., Flinch, J.F., Tari, G., Eds.; Elsevier: Amsterdam, The Netherlands, 2017; pp. 265–286. [Google Scholar]
  20. Dengo, C.; Røssland, K. Extensional tectonic history of the western Barents Sea. In Structural and Tectonic Modeling and Its Application to Petroleum Geology; Larsen, R.M., Brekke, H., Larsen, B.T., Talleraas, E., Eds.; Norwegian Petroleum Society (NPF): Oslo, Norway, 1992; Volume 1, pp. 91–108. [Google Scholar]
  21. Faleide, J.I.; Tsikalas, F.; Breivik, A.J.; Mjelde, R.; Ritzmann, O.; Engen, O.; Wilson, J.; Eldholm, O. Structure and evolution of the continental margin off Norway and the Barents Sea. Episodes 2008, 31, 82–91. [Google Scholar]
  22. Gernigon, L.; Brönner, M.; Roberts, D.; Olesen, O.; Nasuti, A.; Yamasaki, T. Crustal and basin evolution of the southwestern Barents Sea: From Caledonian orogeny to continental breakup. Tectonics 2014, 33, 347–373. [Google Scholar] [CrossRef]
  23. Gernigon, L.; Brönner, M.; Dumais, M.-A.; Gradmann, S.; Grønlie, A.; Nasuti, A.; Roberts, D. Basement inheritance and salt structures in the SE Barents Sea: Insights from new potential field data. J. Geodyn. 2018, 119, 82–106. [Google Scholar] [CrossRef]
  24. Worsley, D. The post-Caledonian development of Svalbard and the western Barents Sea. Polar Res. 2008, 27, 298–317. [Google Scholar] [CrossRef]
  25. Smyrak-Sikora, A.; Johannessen, E.P.; Olaussen, S.; Sandal, G.; Braathen, A. Sedimentary architecture during Carboniferous rift initiation—The arid Billefjorden Trough, Svalbard. J. Geol. Soc. 2018, 176, 225–252. [Google Scholar] [CrossRef]
  26. Bugge, T.; Mangerud, G.; Elvebakk, G.; Mork, A.; Nilsson, I.; Fanavoll, S.; Vigran, J. Upper Paleozoic succession on the Finnmark platform, Barents Sea. Nor. J. Geol. 1995, 75, 3–30. [Google Scholar]
  27. Gudlaugsson, S.; Faleide, J.; Johansen, S.; Breivik, A. Late Palaeozoic structural development of the south-western Barents Sea. Mar. Pet. Geol. 1998, 15, 73–102. [Google Scholar] [CrossRef]
  28. Stemmerik, L.; Elvebakk, G.; Worsley, D. Upper Palaeozoic carbonate reservoirs on the Norwegian arctic shelf; delineation of reservoir models with application to the Loppa High. Pet. Geosci. 1999, 5, 173–187. [Google Scholar] [CrossRef] [Green Version]
  29. Stemmerik, L. Late Palaeozoic evolution of the North Atlantic margin of Pangea. Palaeogeogr. Palaeoclimatol. Palaeoecol. 2000, 161, 95–126. [Google Scholar] [CrossRef]
  30. Stemmerik, L.; Worsley, D. 30 years on-Arctic Upper Palaeozoic stratigraphy, depositional evolution and hydrocarbon prospectivity. Nor. J. Geol. 2005, 85, 151–168. [Google Scholar]
  31. Koyi, H.; Talbot, C.J.; Torudbakken, B. Analogue models of salt diapirs and seismic interpretation in the Nordkapp Basin, Norway. Pet. Geosci. 1995, 1, 185–192. [Google Scholar] [CrossRef]
  32. Glørstad-Clark, E.; Faleide, J.I.; Lundschien, B.A.; Nystuen, J.P. Triassic seismic sequence stratigraphy and paleogeography of the western Barents Sea area. Mar. Pet. Geol. 2010, 27, 1448–1475. [Google Scholar] [CrossRef]
  33. Klausen, T.G.; Ryseth, A.E.; Helland-Hansen, W.; Gawthorpe, R.; Laursen, I. Regional development and sequence stratigraphy of the Middle to Late Triassic Snadd Formation, Norwegian Barents Sea. Mar. Pet. Geol. 2015, 62, 102–122. [Google Scholar] [CrossRef]
  34. Eide, C.H.; Klausen, T.G.; Katkov, D.; Suslova, A.A.; Helland-Hansen, W. Linking an Early Triassic delta to antecedent topography: Source-to-sink study of the southwestern Barents Sea margin. GSA Bull. 2017, 130, 263–283. [Google Scholar] [CrossRef] [Green Version]
  35. Klausen, T.; Aas, T.J.; Haug, E.C.; Behzad, A.; Snorre, O.; Domenico, C. Clinoform development and topset evolution in a mud-rich delta—The Middle Triassic Kobbe Formation, Norwegian Barents Sea. Sedimentology 2018, 65, 1132–1169. [Google Scholar] [CrossRef]
  36. Anell, I.; Braathen, A.; Olaussen, S. The Triassic—Early Jurassic of the northern Barents Shelf: A regional understanding of the Longyearbyen CO2 reservoir. Nor. J. Geol. 2014, 94, 83–98. [Google Scholar]
  37. Grundvåg, S.A.; Marin, D.; Kairanov, B.; Śliwińska, K.K.; Nøhr-Hansen, H.; Jelby, M.E.; Escalona, A.; Olaussen, S. The Lower Cretaceous succession of the northwestern Barents Shelf: Onshore and offshore correlations. Mar. Pet. Geol. 2017, 86, 834–857. [Google Scholar] [CrossRef] [Green Version]
  38. Marin, D.; Escalona, A.; Nøhr-Hansen, H.; Kasia, K.Ś.; Mordasova, A. Sequence stratigraphy and lateral variability of Lower Cretaceous clinoforms in the SW Barents Sea. AAPG Bull. 2017, 101, 1487–1517. [Google Scholar] [CrossRef]
  39. Henriksen, E.; Ryseth, A.; Larssen, G.; Heide, T.; Rønning, K.; Sollid, K.; Stoupakova, A. Tectonostratigraphy of the greater Barents Sea: Implications for petroleum systems. In Arctic Petroleum Geology; Spencer, A.M., Embry, A.F., Gautier, D.L., Stoupakova, A.V., Sørensen, K., Eds.; Geological Society, London, Memoirs: London, UK, 2011; Volume 35, pp. 163–195. [Google Scholar]
  40. Baig, I.; Faleide, J.I.; Jahren, J.; Mondol, N.H. Cenozoic exhumation on the southwestern Barents Shelf: Estimates and uncertainties constrained from compaction and thermal maturity analyses. Mar. Pet. Geol. 2016, 73, 105–130. [Google Scholar] [CrossRef]
  41. Gac, S.; Klitzke, P.; Minakov, A.; Faleide, J.I.; Scheck-Wenderoth, M. Lithospheric strength and elastic thickness of the Barents Sea and Kara Sea region. Tectonophysics 2016, 691, 120–132. [Google Scholar] [CrossRef]
  42. Clark, S.A.; Glørstad-Clark, E.; Faleide, J.I.; Schmid, D.; Hartz, E.H.; Fjeldskaar, W. Southwest Barents Sea rift basin evolution: Comparing results from backstripping and time-forward modeling. Basin Res. 2014, 26, 550–566. [Google Scholar] [CrossRef]
  43. He, Z.; Crews, S.G.; Corrigan, J. Rifting and Heat Flow: Why the Mckenzie model is only part of the story: AAPG Hedberg Conference. In Proceedings of the Basin Modeling Perspectives: Innovative Developments and Novel Applications, The Hague, The Netherlands, 6–9 May 2007. [Google Scholar]
  44. Klitzke, P.; Faleide, J.I.; Scheck-Wenderoth, M.; Sippel, J. A lithosphere-scale Structural model of the Barents Sea and Kara Sea region. Solid Earth 2015, 6, 153–172. [Google Scholar] [CrossRef]
  45. Gac, S.; Hansford, P.A.; Faleide, J.I. Basin modeling of the SW Barents Sea. Mar. Pet. Geol. 2018, 95, 167–187. [Google Scholar] [CrossRef]
  46. Riis, F. Dating and measuring of erosion, uplift and subsidence in Norway and the norwegian shelf in glacial periods. Norsk Geologisk Tidsskrift 1992, 72, 325–331. [Google Scholar]
  47. Fjeldskaar, W.; Lindholm, C.; Dehls, J.F.; Fjeldskaar, I. Postglacial uplift, neo- tectonics and seismicity in Fennoscandia. Quat. Sci. Rev. 2000, 19, 413–1422. [Google Scholar] [CrossRef]
  48. Cavanagh, A.J.; di Primio, R.; Scheck-Wenderoth, M.; Horsfield, B. Severity and timing of Cenozoic exhumation in the Southwestern Barents Sea. J. Geol. Soc. 2006, 163, 761–774. [Google Scholar] [CrossRef]
  49. Fjeldskaar, W.; Amantov, A. Effects of glaciations on sedimentary basins. J. Geodyn. 2018, 118, 66–81. [Google Scholar] [CrossRef]
  50. Athy, L.F. Density, porosity and compaction of sedimentary rocks. AAPG Bull. 1930, 14, 1–24. [Google Scholar]
  51. Sclater, J.G.; Christie, P.A.F. Continental stretching: An explanation of the post-mid Cretaceous subsidence of the Central North Sea Basin. J. Geophys. Res. 1980, 85, 3711–3739. [Google Scholar] [CrossRef]
  52. Sekiguchi, K. A method for determining terrestrial heat flow in oil basin areas. In Terrestrial Heat Flow Studies and Structure of the Lithosphere; Rybach, C.L., Chapman, D.S., Eds.; Tectonophysics, Science Direct: Liblice, Czechoslovakia, 1984; Volume 103, pp. 67–79. [Google Scholar]
  53. Mørk, A.; Dallmann, W.K.; Dypvik, H.; Johannessen, E.P.; Larssen, G.B.; Nagy, J.; Nøttvedt, A.; Olaussen, S.; Pchelina, T.M.; Worsley, D. Mesozoic lithostratigraphy. In Lithostratigraphic Lexicon of Svalbard. Review and Recommendations for Nomenclature Use. Upper Palaeozoic to Quaternary Bedrock; Dallmann, W.K., Ed.; Norsk Polarinstitutt: Tromsø, Norway, 1999; pp. 127–214. [Google Scholar]
  54. Sweeney, J.J.; Burnham, A.K. Evaluation of a simple model of vitrinite reflectance based on chemical kinetics (1). AAPG Bull. 1990, 74, 1559–1570. [Google Scholar]
  55. Jones, I.F.; Davison, I. Seismic imaging in and around salt bodies. Interpretation 2014, 2, 1–20. [Google Scholar] [CrossRef]
  56. Rojo, L.A.; Escalona, A.; Schulte, L. The use of seismic attributes to enhance imaging of salt structures in the Barents Sea. First Break 2016, 34, 41–49. [Google Scholar] [CrossRef]
  57. Rowan, M.G.; Ratliff, R.A. Cross-section restoration of salt-related deformation: Best practices and potential pitfalls. J. Struct. Geol. 2012, 41, 24–37. [Google Scholar] [CrossRef]
  58. Klausen, T.; Helland-Hansen, W. Methods for Restoring and Describing Ancient Clinoform Surfaces. J. Sediment. Res. 2018, 88, 241–259. [Google Scholar] [CrossRef]
  59. Warren, J.K. Evaporites through time: Tectonic, climatic and eustatic controls in marine and nonmarine deposits. Earth-Sci. Rev. 2010, 98, 217–268. [Google Scholar] [CrossRef]
  60. Koyi, H.; Petersen, K. Influence of basement faults on the development of salt structures in the Danish Basin. Mar. Pet. Geol. 1993, 10, 82–94. [Google Scholar] [CrossRef]
  61. Stewart, S.; Ruffell, A.; Harvey, M. Relationship between basement-linked and gravity-driven fault systems in the UKCS salt basins. Mar. Pet. Geol. 1997, 14, 581–604. [Google Scholar] [CrossRef]
  62. Withjack, M.O.; Callaway, S. Active normal faulting beneath a salt layer: An experimental study of deformation patterns in the cover sequence. AAPG Bull. 2000, 84, 627–651. [Google Scholar]
  63. Rowan, M.G.; Giles, K.A.; Hearon, T.E., IV; Fiduk, J.C. Megaflaps adjacent to salt diapirs. AAPG Bull. 2016, 100, 1723–1747. [Google Scholar] [CrossRef]
  64. Giles, K.A.; Rowan, M.G. Concepts in halokinetic-sequence deformation and stratigraphy. In Salt Tectonics, Sediments and Prospectivity; Alsop, G.I., Archer, S.G., Hartley, A.J., Grant, N.T., Hodgkinson, R., Eds.; Geological Society: London, UK, 2012; Volume 363, pp. 7–31. [Google Scholar]
  65. Hearon, T.E., IV; Rowan, M.G.; Giles, K.A.; Hart, W.H. Halokinetic deformation adjacent to the deepwater Auger diapir, Garden Banks 470, northern Gulf of Mexico: Testing the applicability of an outcrop-based model using subsurface data. Interpretation 2014, 2, SM57–SM76. [Google Scholar] [CrossRef]
  66. Lerch, B.; Karlsen, D.A.; Matapour, Z.; Seland, R.; Backer-Owe, K. Organic geochemistry of Barents Sea petroleum: Thermal maturity and alteration and mixing processes in oils and condensates. J. Pet. Geol. 2016, 39, 125–148. [Google Scholar] [CrossRef]
Figure 1. (A) Main structural elements of the Barents Sea. The Nordkapp Basin is indicated by the black rectangle. (B) Main structural elements of the Nordkapp Basin (modified from Rojo et al. [18]. The basin is divided in three sub-basins: western, central and eastern sub-basins. Black dots are exploration and shallow stratigraphic wells, whereas black lines show the location of the studied sections through the central (section A) and eastern (section B) sub-basins. (C). A chronostratigraphic chart illustrating the main stratigraphic units, depositional environments, tectonic events, and mapped seismic units of the Barents Sea and Nordkapp Basin (based on [17,18]).
Geosciences 09 00316 g001
Figure 2. (A) Uninterpreted seismic section A across the central sub-basin. The central seismic panel is from a higher-resolution, full azimuth seismic data provided by WesternGeco Multiclient. (B) Interpreted section A. The base salt was estimated based on parallel seismic sections that extend to 7000 ms. (C) Uninterpreted seismic section B across the eastern sub-basin. (D) Interpreted section B. Legend shows the interpreted seismic units (Figure 1C). See Figure 1B for location of these sections. Figures modified from Rojo et al. [18].
Geosciences 09 00316 g002
Figure 3. (A) Plot showing calculated interval velocities vs depth from wells 7228/9-1, 7228/7-1A, 7125/1-1, 7124/3-1, 7229/11-1. (B) Seismic section B showing the location of the main velocity transitions. (C) Seismic section B displaying the interval velocities used to depth convert the seismic profile (modified from Rojo et al. [18]).
Geosciences 09 00316 g003
Figure 4. (A) Structural restoration of section A (Figure 2B) in the central sub-basin. (B) Structural restoration of section B (Figure 2D) in the eastern sub-basin. The different restoration stages are the paleo-geometries input to the thermal model. Colored rock units correspond to the interpreted seismic units in Figure 2 (and Figure 1C). See Figure 1B for location of the sections. Restorations modified from Rojo et al. [18].
Geosciences 09 00316 g004
Figure 5. Modeled (A) sediment-water interface temperature (SWIT), (B) water depth, (C) lithospheric thickness, and (D) basal heat flow through time in the Nordkapp Basin. Yellow rectangles show the three rifting periods. Dots in D are the selected restoration stages in Figure 4.
Geosciences 09 00316 g005
Figure 6. (A) Bottom hole temperature measurements of wells 7228/7-1B (black), 7227/11-U-02 (orange), 7227/07-U-01 (light blue), 7230/08-U-01 (light green), 7228/7-1S (red), 7228/2-1S (purple), 7228/7-1A (dark blue), and 7228/2-1S (dark green). Line shows the modeled, present temperature versus depth trend. (B) Vitrinite reflectance data from wells 7228/7-1S (red), 7228/7-1A (blue), and 7228/2-1S (green). Line shows the modeled vitrinite reflectance. Figure 1B shows the location of the wells.
Geosciences 09 00316 g006
Figure 7. Evolution of temperature through time in (A) section A in the central sub-basin, and (B) section B in the eastern sub-basin. Black lines are unit contacts and red lines are isotherms. For guidance, stippled unit is the Lower to Middle Triassic Kobbe Formation (S4). Figure 1B shows the location of the sections.
Geosciences 09 00316 g007
Figure 8. Modeled, present temperature distribution in pseudo-wells along (A) section A in the central sub-basin, and (B) section B in the eastern sub-basin. Thick lines in the minibasins and platforms wells show the temperature distribution in potential reservoirs. Figure 6 (I) shows the location of the pseudo-wells.
Geosciences 09 00316 g008
Figure 9. Source rock maturation through time in (A) section A in the central sub-basin, and (B) section B in the eastern sub-basin. Figure 1B shows the location of the sections.
Geosciences 09 00316 g009
Figure 10. Source rock maturation through time in a pseudo-well perforating a minibasin in (A) section A in the central sub-basin, and (B) section B in the eastern sub-basin. Two scenarios are compared: One with salt structures as observed today (continuous lines), and another without salt structures (dashed lines). Figure 9 (I) shows the location of the pseudo-wells.
Geosciences 09 00316 g010
Figure 11. Petroleum systems chart for the Nordkap Basin. Insights from the modeling results are incorporated in the chart.
Geosciences 09 00316 g011
Table 1. Rock units and their parameter values for thermal modeling. For lithology definition, the percentage of sandstone (ss), siltstone (slt), shale (sh), limestone (ls), coal (co) and salt (sl) is defined. Source rock intervals are colored green. Values of thermal conductivity and heat capacity are given for each unit at 20 °C.
UnitLithologyDensity (kg/m3)Surface Porosity (%)Factor c (1/km)Thermal Conductivity (W/mK)Radiogenic Heat (microW/m3)Specific Heat Capacity (Kcal/K/Kg)
S7ss20, sh80273053.50.572.011.310.21
S6ss10, shs20,sh70272159.50.652.111.370.21
S5ss70. sh30271449.70.473.030.880.2
S4ss30, sh70256661.30.672.131.310.21
S3ss30, sh70270661.30.672.131.310.21
S2sh10, ls90270952.90.552.510.730.2
S1sl100 6.50.010.21
Pre-saltss25, sh50, co25254063.650.641.340.970.23
BasementGneiss 2.720.19

