Abstract
Landslides are one of the most devastating and commonly recurring natural hazards in the Indian Himalayas. They contribute to infrastructure damage, land loss and human casualties. Most of the landslides are primarily rainfall-induced and the relationship has been well very well-established, having been commonly defined using empirical-based models which use statistical approaches to determine the parameters of a power-law equation. One of the main drawbacks using the traditional empirical methods is that it fails to reduce the uncertainties associated with threshold calculation. The present study overcomes these limitations by identifying the precipitation condition responsible for landslide occurrence using an algorithm-based model. The methodology involves the use of an automated tool which determines cumulated event rainfall–rainfall duration thresholds at various exceedance probabilities and the associated uncertainties. The analysis has been carried out for the Kalimpong Region of the Darjeeling Himalayas using rainfall and landslide data for the period 2010–2016. The results signify that a rainfall event of 48 hours with a cumulated event rainfall of 36.7 mm can cause landslides in the study area. Such a study is the first to be conducted for the Indian Himalayas and can be considered as a first step in determining more reliable thresholds which can be used as part of an operational early-warning system.
1. Introduction
Landslides are one of the most destructive natural disasters, causing massive loss of human lives and property [1]. Globally, the triggering factor for most of the landslides is rainfall [1]. The global dataset of landslide events between 2004–2016 showed that 75% of landslides occurred in Asia with a considerable incidence in the Himalayan arc [2], which contributes to more than 70% of landslide-related fatalities across the globe [2]. One of the most affected regions in this area is the Darjeeling-Sikkim Himalayas, which contributes to 40% of the land area in India susceptible to landsliding [3]. Landslides in this region cause havoc during the monsoon season, incurring substantial human and financial losses and disrupting the livelihood of local people. The problem is likely to increase due to over-exploitation of natural resources, deforestation and the increase in infrastructure development due to an increase in the population [2]. One of the most affected areas in this region is Kalimpong, where a high number of landslides are initiated by monsoonal rainfall (Geological Survey of India Report, 2016).
The most common method to analyze the relationship between rainfall conditions and landslide incidents is statistical analysis [4,5,6,7,8,9]. The statistical methods determine a threshold in either the intensity-duration (ID) or cumulated event-duration (ED) planes over which landslides are likely to happen [5,9,10]. However, there are certain drawbacks with its use: (i) Availability and quality of the input data, which may lead to an increase in uncertainty [6,11,12]; (ii) identification and definition of the rainfall event [13], which also highlighted that a common shortcoming of traditional rainfall threshold approaches is the subjectivity of the analysis, which leads to the non-replicability of the analysis, and the estimation of the real rainfall event, i.e., the actual amount of rain responsible for the landslide triggering. To overcome such drawbacks, researchers developing techniques for an objective definition of empirical rainfall [14,15,16] introduced several new methods to overcome these concerns by establishing thresholds to be used as an early warning system [17]. They developed an automated model to reconstruct rainfall conditions responsible for landslide events and determine the thresholds using both rain-gauge and satellite data [18]. Cluster analysis methodology was used to calculate rainfall thresholds and determine the safety factor to develop an early warning system. Recently, the use of machine learning and artificial intelligence techniques are also being used to forecast landslides [19,20,21].
The research on threshold estimation in the Indian Himalayan region is minimal and is confined to defining the intensity-duration (ID) thresholds ([22] for Sikkim [23]; Uttarakhand [3]; and Kalimpong). The threshold estimation for the Indian Himalayan region lacks the use of the objective definition of thresholds which is crucial for better predictability of landslides. For the present study, rainfall thresholds have been defined for the Kalimpong Region by using a semi-automatic empirical approach, namely the Calculation of Thresholds for Rainfall-Induced Landslides-Tool (CTRL-T), using rainfall data and landslide records from 2010–2016 [15,24]. The tool uses an algorithm to reconstruct rainfall triggering conditions and uses statistical methods to determine cumulated event rainfall-rainfall duration thresholds and quantify uncertainty [15,24].
2. Study Area
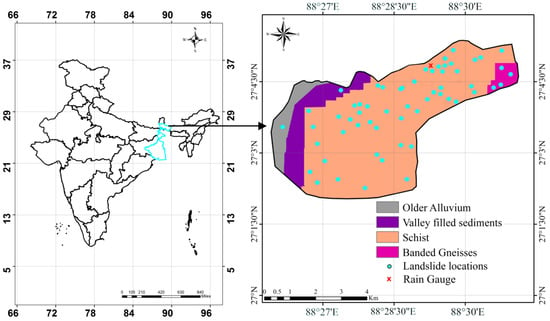
The study region is Kalimpong (87.47°–89.47° N, 26.07°–28.07° E) enclosed by the Teesta and Relli rivers in the east and west respectively (Figure 1). The region has an elevation ranging from 400 to 1665 m above sea level (a.s.l) and is drained by numerous mountain streams which have further raised the issue of landslides in the area [3,25]. Figure 1 depicts the hydrogeological map of Kalimpong, where 82% of the region lies between 804–1440m. The geology of the region can be categorized into rock types which vary from banded gneiss, schist, sandstone with shale and younger alluvium, with rock age ranging from Archean to Quarternary [3,26]. The rock most susceptible to landsliding in the region is mica schist (GSI Report, 2016).

Figure 1.
Location of the study area along with a hydrogeological map of the region.
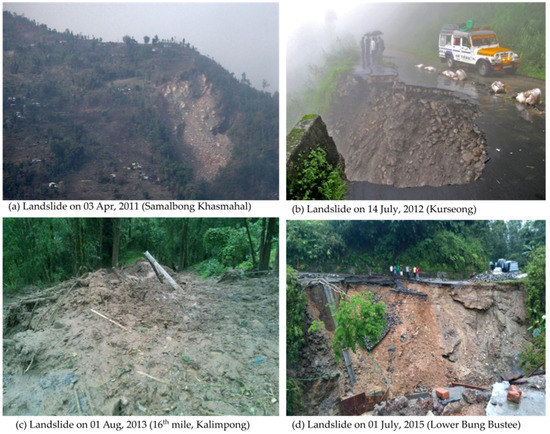
Landslides in Kalimpong are mostly shallow in nature, with depth varying from few centimeters to meters. The material and movements of the landslides as per classification are rockfall, debris slide, and debris flow, as identified by the Geological Survey of India [27]. The concern of slide activity has generally been on an increasing trend with every passing monsoon, which can be attributed to several factors like rainfall, improper drainage, toe cutting by Teesta, and an increase in construction activities [3]. The landslides in the region predominantly occur due to heavy monsoonal rainfall and surface drainage. The water from the mountain streams flows down the hill as a water source for the people. During monsoons these streams overflow and due to the improper drainage system, they often get built up, leading to extensive scouring and erosion [3]. The increase in construction activities has further intensified the issue of landslides as it blocks the passage of water flow. A field survey after the monsoons of 2016 and 2017 revealed that most of the landslide occurrences were on road cutting, which is indicative of both construction practices and improper drainage systems. The major roads connecting the city to Kalimpong often get disrupted during monsoons due to landslides, affecting both tourists and locals alike. Figure 2 shows the damages caused by rainfall in various years.

Figure 2.
Landslide damage in the region during various rainfall events (Source: Save The Hills).
3. Data
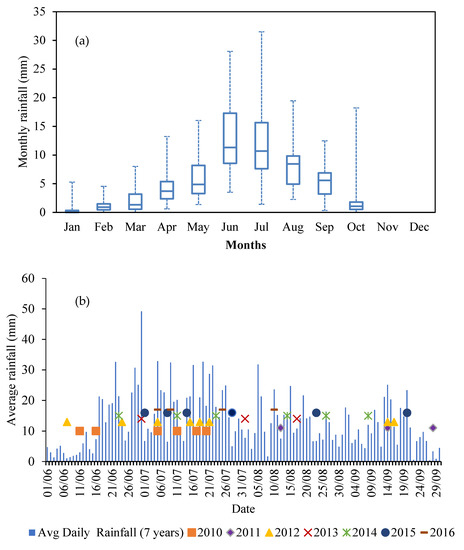
The input files required for the model are rainfall data series with rain gauge location along with the landslide event occurrence dates and its coordinates for events between 2010–2016 [24,28]. The daily rainfall data was collected from a single rain gauge maintained by the Save The Hills organization. During this period, the average annual and monsoonal rainfall (June–September) was 1850.5 mm and 1637.7 mm respectively, which indicates that 88.5% of yearly rainfall occurred in the monsoon season (Figure 3). The average rainfall during the monsoon season is 13.3 mm/day. For the investigated period, the maximum and minimum monsoonal rainfall occurred in 2014 and 2012, respectively. The variation in the minimum and maximum values of rainfall for various days is significant and is on a rising trend for every year.

Figure 3.
Representation of (a) monthly rainfall data in box and whisker plot (2010–2016), (b) average daily monsoonal rainfall along with landslide events considered for analysis.
The total number of landslide events identified for the same time period was 99, of which 61 landslides were triggered by rainfall (Figure 1b). During this period, 18 landslide events occurred in 2010–2012, with the majority of landslides in 2010. Most of the landslides (87%) occurred during the monsoon season, with the highest number in July. The landslide events used for the analysis are confined to a single landslide event, i.e., multiple landslide occurrences in a day are counted as a single event. Figure 3b depicts the average daily monsoonal rainfall along with landslide occurrences during the study period.
4. Methodology
The reconstruction of rainfall thresholds is performed by means of a Calculation of Thresholds for Rainfall-Induced Landslides-Tool (CTRL-T) proposed in [15,24]. The tool uses an algorithm to automatically extract rainfall events from daily rainfall series, reconstruct triggering rainfall conditions responsible for landslide occurrences, and calculates rainfall thresholds at various exceedance probabilities. The input parameters for the tool require the locations and the dates of occurrence of the landslides, coordinates of the rain gauge and hourly rainfall series. The tool considers the effect of spatial variability by drawing a circular radius buffer with landslide location as its center [24,28]. The authors of [24] had suggested a buffer radius of 5 km, although the studies in Kalimpong, as well as in nearby locations, have used a radius of 15 km as a large search radius is needed when the rain gauge network is sparse (e.g., low rain gauge density); moreover, a small radius would result in many landslide events without a reference rain gauge [28,29]. The tool works in three different steps: (i) The input is received as continuous rainfall series and distinct rainfall events are reconstructed determining the duration (D) in hours and cumulated event rainfall (E) in mm. (ii) The reconstructed rainfall events depend on the selection of a rain gauge to minimize the effect of spatial variability of precipitation distribution (this is achieved by reconstructing single or multiple rainfall conditions (MRC) most likely to result in failures and assigning a weight to them); (iii) finally, the tool reconstructs the MRC within the selected rainfall event and assigns a weight (w) proportional to the cumulated rainfall and the mean intensity of the MRC and to the inverse square distance between the rain gauge and the landslide. For each landslide, the highest w is used to identify the representative rain gauge and to determine the maximum probability rainfall conditions (MPRC). Finally, using only the MRC with the maximum weight (MPRC) for each failure, the rainfall thresholds at several exceedance probabilities and the uncertainties associated with them are calculated [15,24,28]. The thresholds use power law equation cumulated rainfall E (mm) to rainfall duration D (h) and uses the frequentist method proposed in [4], which can be depicted as:
where α represents the scaling parameter which describes the intercept and γ is the shape parameter which defines the slope of the power law equation; Δα, Δγ. The delta parameters (Δα, Δγ) depict the uncertainties related with the two parameters, which in turn are determined using a bootstrap nonparametric statistical technique. The tool determines the mean values of the parameters and their uncertainties using a bootstrap technique by calculating for 5000 synthetic series of rainfall conditions [15,28].
5. Results and Discussions
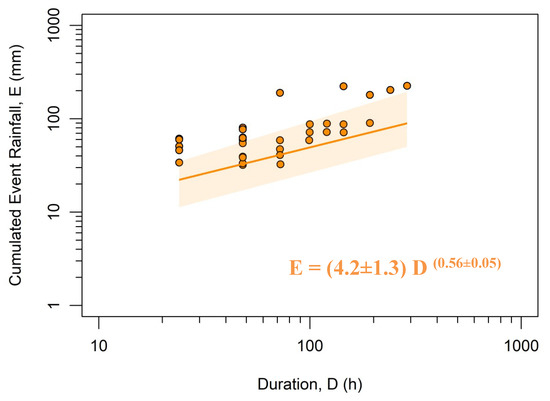
The tool (CTRL-T) reconstructed 130 rainfall events for the simulated time period (2010–2016). It is often difficult to link a specific landslide occurrence with a rainfall event, due to an irregularity in rainfall measurement by rain gauges, the higher radial distance between landslide location and rain gauges, along with occurrences of several landslides at the same location or in proximity [28]. Considering the above-mentioned factors, 61 landslides were identified as induced by rainfall. Thereafter, the landslide conditions were further analyzed by understanding the variation in the maximum daily rainfall with three days prior to the landslide event, including the day of the slide occurrence. The distribution is quite varied, with the median value being 79.2 mm; range from 4.6 mm to 361 mm and the average value of 83.5 mm. Such an analysis is critical as it helps to reject the landslide events which are not exclusively associated with rainfall, especially for the incidences associated with a daily rainfall lower than 27.4 mm (25th percentile) [28]. Considering these conditions along with the effect of spatial variation in precipitation measurements, the number of landslides was reduced to 36 (Figure 3b). The tool discarded eight landslides, which made the total number of landslide events used for analysis to be 28. The reconstructed rainfall and landslide data were used to determine cumulated event rainfall-duration (ED) thresholds, where E = (4.2 ± 1.3) D(0.56±0.05). Figure 4 represents the ED thresholds on a log-log curve using the 28 rainfall conditions which led to landslides (marked as points) at an exceedance probability of 5% (shown as a line) and the uncertainty region associated with it (shaded area).

Figure 4.
Cumulated event rainfall-rainfall duration (ED) thresholds for Kalimpong Region at a 5% exceedance probability level (T5,B). The shaded area depicts the uncertainty associated with the threshold.
The rainfall conditions necessary for landslides cover a range of 288 h (24 ≤ D ≤ 288 h), which is the range of validity for the thresholds with the range of cumulative rainfall being 10 ≤ E ≤ 226 mm. Table 1 depicts that with the increase of duration there is an increase in the minimum, mean, and maximum values of event rainfall.

Table 1.
Values of number of maximum probability rainfall conditions (MPRC), minimum, mean, and maximum values of event rainfall (E) for various duration (D).
Table 2 depicts the various threshold parameters α, Δα, γ, and Δγ for various exceedance probabilities. To achieve reliable threshold values, the relative uncertainty parameter (Δγ/γ) should be less than 10% and in this case, it was found to be 8.9% [28]. However, the relative uncertainty in α is slightly higher than 30%, with the maximum value for 50% exceedance probability which can be attributed also to the daily temporal resolution of rainfall data used as observed in [28]. The high uncertainty is a result of low sample points used to determine thresholds and can be reduced with the addition of landslide events and using hourly rainfall data.

Table 2.
Parameters α and γ, and related uncertainties Δα and Δγ at various exceedance probabilities.
The threshold equation depicts that a rainfall event of 48 h for a cumulated rainfall of 36.7 mm is enough for landslides to occur [3], and calculated the thresholds for the same region using the Bayesian inference technique for 61 landslides. The results depicted a rainfall event of 12.9 mm for 24 h was required for landslides to occur. For similar conditions, the probabilities of landslides using Bayes’ theorem achieved maximum probability for an event rainfall of 30 mm for a duration of three days [26]. The thresholds calculated using various techniques depict very contrasting results. Therefore, validation of the thresholds needs to be performed for a better understanding of the thresholds to be used as a warning system. However, there have been no recorded landslides in 2017 and 2018, except for the small movement of unstable slopes in Southwestern Kalimpong [25,29].
6. Conclusions
The Darjeeling Himalayan region is one of the most rugged mountains in the world, with very high rainfall levels contributing to the majority of the devastating landslides in India. Landslides cause havoc during the monsoons in these hilly terrains. leading to substantial human and financial losses. To understand the relationship between rainfall and landslide incidences, several techniques were applied and thresholds generated. The thresholds determined usually lacked critical information on the selection of rain gauges and reconstructing the rainfall events responsible for landslide incidences. A newly proposed tool (CTRL-T) of reconstructing rainfall events and determining thresholds overcomes the limitations of the traditional threshold estimation methods. The tool was applied to the Kalimpong Region of the Darjeeling Himalayas using rainfall and landslide data for 2010–2016. The thresholds calculated depicted that a cumulated event rainfall of 36.7 mm for 48 h is required for landslide occurrence. However, to obtain reliable thresholds the availability of further triggering rainfall conditions and landslide events along with hourly rainfall data is necessary to reduce the associated uncertainties. The crucial part in threshold analysis is the validation of the determined values, which can be achieved using an independent dataset other than the one used for simulation, which is not available for this region. The present work can be understood as a first step to determine rainfall thresholds for Indian landslide regions using an algorithm-based approach, which should be viewed as preferable to conventional methods.
Author Contributions
A.D. and T.S.T. organized and analysed the data, A.D. wrote the article, N.S. supervised the entire work.
Funding
This research was funded by Department of Science & Technology (DST), New Delhi, Grant No. (NRDMS/02/31/015(G)).
Acknowledgments
The authors are thankful to Praful Rao, President, Save The Hills organization, for providing the rainfall data, and Yeshu Sharma, International Institute of Information Technology, Hyderabad, for GIS expertise.
Conflicts of Interest
The authors declare no conflicts of interest.
References
- Petley, D. Global patterns of loss of life from landslides. Geology 2012, 40, 927–930. [Google Scholar] [CrossRef]
- Froude, M.J.; Petley, D.N. Global fatal landslide occurrence from 2004 to 2016. Hazards Earth Sci. 2018, 18, 2161–2181. [Google Scholar] [CrossRef]
- Dikshit, A.; Satyam, D.N. Estimation of rainfall thresholds for landslide occurrences in Kalimpong, India. Innov. Infrastruct. Solut. 2018, 3, 24. [Google Scholar] [CrossRef]
- Brunetti, M.T.; Peruccacci, S.; Rossi, M.; Luciani, S.; Valigi, D.; Guzzetti, F. Rainfall thresholds for the possible occurrence of landslides in Italy. Hazards Earth Sci. 2010, 10, 447–458. [Google Scholar] [CrossRef]
- Guzzetti, F.; Peruccacci, S.; Rossi, M.; Stark, C.P. Rainfall thresholds for the initiation of landslides in central and southern Europe. Theor. Appl. Clim. 2007, 98, 239–267. [Google Scholar] [CrossRef]
- Segoni, S.; Piciullo, L.; Gariano, S.L. A review of the recent literature on rainfall thresholds for landslide occurrence. Landslides 2018, 15, 1483–1501. [Google Scholar] [CrossRef]
- Staley, D.M.; Kean, J.W.; Cannon, S.H.; Schmidt, K.M.; Laber, J.L. Objective definition of rainfall intensity–duration thresholds for the initiation of post-fire debris flows in southern California. Landslides 2013, 10, 547–562. [Google Scholar] [CrossRef]
- Tien Bui, D.; Pradhan, B.; Lofman, O.; Revhaug, I.; Dick, O.B. Regional prediction of landslide hazard using probability analysis of intense rainfall in the Hoa Binh province, Vietnam. Nat. Hazards 2013, 66, 707. [Google Scholar] [CrossRef]
- Guzzetti, F.; Peruccacci, S.; Rossi, M.; Stark, C.P. The rainfall intensity–duration control of shallow landslides and debris flows: An update. Landslides 2008, 5, 3–17. [Google Scholar] [CrossRef]
- Vennari, C.; Gariano, S.L.; Antronico, L.; Brunetti, M.T.; Iovine, G.; Peruccacci, S.; Terranova, O.; Guzzetti, F. Rainfall thresholds for shallow landslide occurrence in Calabria, southern Italy. Hazards Earth Sci. 2014, 14, 317–330. [Google Scholar] [CrossRef]
- Peruccacci, S.; Brunetti, M.T.; Luciani, S.; Vennari, C.; Guzzetti, F. Lithological and seasonal control on rainfall thresholds for the possible initiation of landslides in central Italy. Geomorphology 2012, 139, 79–90. [Google Scholar] [CrossRef]
- Gariano, S.L.; Brunetti, M.; Iovine, G.; Melillo, M.; Peruccacci, S.; Terranova, O.; Vennari, C.; Guzzetti, F. Calibration and validation of rainfall thresholds for shallow landslide forecasting in Sicily, southern Italy. Geomorphology 2015, 228, 653–665. [Google Scholar] [CrossRef]
- Rosi, A.; Peternel, T.; Jemec-Auflič, M.; Marko Komac, M.; Segoni, S.; Casagli, N. Rainfall thresholds for rainfall-induced landslides in Slovenia. Landslides 2016, 13, 1571. [Google Scholar] [CrossRef]
- Segoni, S.; Rossi, G.; Rosi, A.; Catani, F. Landslides triggered by rainfall: A semi-automated procedure to define consistent intensity–duration thresholds. Comput. Geosci. 2014, 63, 123–131. [Google Scholar] [CrossRef]
- Melillo, M.; Brunetti, M.T.; Peruccacci, S.; Gariano, S.L.; Guzzetti, F. An algorithm for the objective reconstruction of rainfall events responsible for landslides. Landslides 2015, 12, 311–320. [Google Scholar] [CrossRef]
- Vessia, G.; Parise, M.; Brunetti, M.T.; Peruccacci, S.; Rossi, M.; Vennari, C.; Guzzetti, F. Automated reconstruction of rainfall events responsible for shallow landslides. Hazards Earth Sci. 2014, 14, 2399–2408. [Google Scholar] [CrossRef]
- Rossi, M.; Luciani, S.; Valigi, D.; Kirschbaum, D.; Brunetti, M.; Peruccacci, S.; Guzzetti, F. Statistical approaches for the definition of landslide rainfall thresholds and their uncertainty using rain gauge and satellite data. Geomorphology 2017, 285, 16–27. [Google Scholar] [CrossRef]
- Naidu, S.; Sajinkumar, K.; Oommen, T.; Anuja, V.; Samuel, R.A.; Muraleedharan, C. Early warning system for shallow landslides using rainfall threshold and slope stability analysis. Geosci. Front. 2018, 9, 1871–1882. [Google Scholar] [CrossRef]
- Tien Bui, D.; Shahabi, H.; Omidvar, E.; Shirzadi, A.; Geertsema, M.; Clague, J.J.; Khosravi, K.; Pradhan, B.; Pham, B.T.; Chapi, K.; et al. Shallow landslide prediction using a novel hybrid functional machine learning algorithm. Remote Sens. 2019, 11, 931. [Google Scholar] [CrossRef]
- Arabameri, A.; Pradhan, B.; Rezaei, K.; Lee, C.-W. Assessment of landslide susceptibility using statistical- and artificial intelligence-based fr–rf integrated model and multiresolution DEMs. Remote. Sens. 2019, 11, 999. [Google Scholar] [CrossRef]
- Pourghasemi, H.R.; Rahmati, O. Prediction of the landslide susceptibility: Which algorithm, which precision? Catena 2018, 162, 177–192. [Google Scholar] [CrossRef]
- Sengupta, A.; Gupta, S.; Anbarasu, K. Rainfall thresholds for the initiation of landslide at Lanta Khola in North Sikkim, India. Nat. Hazards 2010, 52, 31–42. [Google Scholar] [CrossRef]
- Kanungo, D.P.; Sharma, S. Rainfall thresholds for prediction of shallow landslides around Chamoli-Joshimath region, Garhwal Himalayas, India. Landslides 2014, 11, 629–638. [Google Scholar] [CrossRef]
- Melillo, M.; Brunetti, M.T.; Peruccacci, S.; Gariano, S.L.; Roccati, A.; Guzzetti, F. A tool for the automatic calculation of rainfall thresholds for landslide occurrence. Environ. Model. Softw. 2018, 105, 230–243. [Google Scholar] [CrossRef]
- Dikshit, A.; Satyam, D.N.; Towhata, I. Early warning system using tilt sensors in Chibo, Kalimpong, Darjeeling Himalayas, India. Nat. Hazards 2018, 94, 727–741. [Google Scholar] [CrossRef]
- Dikshit, A.; Sarkar, R.; Satyam, N. Probabilistic approach toward Darjeeling Himalayas landslides-A case study. Cogent Eng. 2018, 5, 1–11. [Google Scholar] [CrossRef]
- Cruden, D.M.; Varnes, D.J. Landslide types and processes. In Landslides: Investigation and Mitigation: Special Report 247; Turner, A.K., Schuster, R.L., Eds.; National Academy Press: Washington, DC, USA, 1996; pp. 36–75. [Google Scholar]
- Gariano, S.L.; Sarkar, R.; Dikshit, A.; Dorji, K.; Brunetti, M.T.; Peruccacci, S.; Melillo, M. Automatic calculation of rainfall thresholds for landslide occurrence in Chukha Dzongkhag, Bhutan. Eng. Geol. 2018, 1–8. [Google Scholar] [CrossRef]
- Dikshit, A.; Satyam, N. Probabilistic rainfall thresholds in Chibo, India: Estimation and validation using monitoring system. J. Mt. Sci. 2019, 16, 870–883. [Google Scholar] [CrossRef]
© 2019 by the authors. Licensee MDPI, Basel, Switzerland. This article is an open access article distributed under the terms and conditions of the Creative Commons Attribution (CC BY) license (http://creativecommons.org/licenses/by/4.0/).