Abstract
The Zagros thrust belt is a zone of deformed crustal rocks well exposed along the southwest region of Iran. To obtain a better knowledge of this mountain chain, we elaborated a 2D model reproducing the thermal structure of the “Mountain Front Fault”. This study, which is focused on the Lurestan region, is based on a model made by merging published sections and available information on the depth of the Moho. We present the isotherms and the geotherms calculated using an analytical methodology. The calculation procedure includes the temperature variation due to the re-equilibrated conductive state after thrusting, frictional heating, heat flow density data, and a series of geologically derived constraints. In order to perform the temperature calculations, the crustal structure in the Lurestan region is simplified as composed of two domains: A lower unit made by crystalline basement and an upper unit including all the lithostratigraphic units forming the sedimentary cover. The resulting model is compared with the numerical results obtained by previous studies to improve the description of the thermal structure of this geologically important area.
1. Introduction
The Zagros thrust belt forms part of the Iranian mountains which are actively deforming due to the convergence between the Arabian and Eurasian plates. Recent geodetic calculations estimate a motion of the Arabian plate to ~20 mm/yr with a northward direction in the fixed-Eurasia reference frame [1]. Only 6–9 mm/yr of the plate convergence are accommodated in the Zagros Mountains, the remaining deformation being located in the Alborz and in the South Caspian basin [1,2]. The Central Iranian block, located between Arabia and Eurasia, does not significantly deform, but rather acts as a backstop for the Zagros thrust belt. The relative velocity between the Arabian plate and the Central Iranian block is ~7 mm/yr in a north–south direction [1].
This research takes into account the northern part of the Lurestan region, where the Arabian Plate collides with the Central Iranian Block producing high-magnitude seismicity, including the seismic event of 12 November 2017 (Mw = 7.3) [3]. In order to gain a better understanding of the tectonic behavior of this sector of the Zagros orogen, taking into account that crustal/lithospheric rheology depends on the thermal field due to the temperature effect on crustal viscosity, it is fundamental to define the thermal structure of the study area.
In this study, we build a model by merging previous published geological sections [4,5] implemented with the Moho depth obtained by Paul et al. [6]. Using an analytical methodology, we propose a geotherm calculation and a thermal model that takes into account the temperature variation due to the re-equilibrated conductive state associated with thrusting. Frictional heating, heat flow density data, and a series of geologically derived constraints are used in the model. Our results are then compared with previous published thermal models proposed by Vernant and Chéry [7] and Tunini et al. [8].
2. Geological Background
The Zagros mountain belt extends for over 2000 km from Turkey to SE Iran (Figure 1). It was formed in Late Cretaceous to Cenozoic times due to the closure of the Neo-Tethys Ocean and the subsequent continental collision between the Eurasian and Arabian plates [9,10,11,12,13,14,15,16,17].
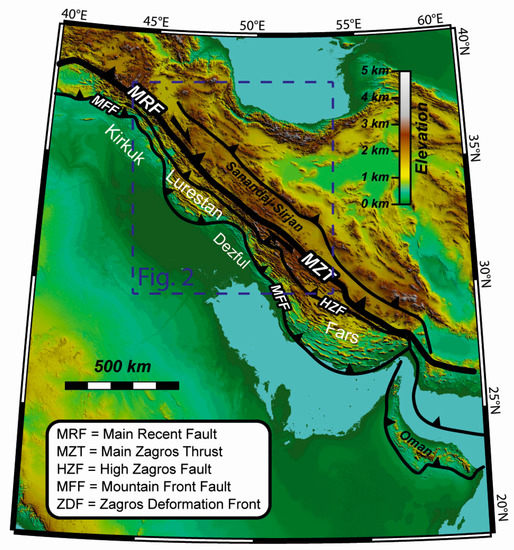
Figure 1.
Tectonic sketch map of the Zagros Mts.
In detail, the Main Recent Fault and the Main Zagros thrust define the suture zone, separating the Sanandaj–Sirjan zone, to the NE, from the former Arabian passive margin to the SW. These blocks were separated by an oceanic domain and collided during the Early Miocene [18,19]. Since this period, the former Arabian passive continental margin was deformed in the Zagros belt. Two main thrusts occur in this belt: The High Zagros Fault and the Mountain Front Fault (MFF). The hanging wall of the former (the so called High Zagros Zone) includes terrains of the former distal portion of the Arabian passive margin [20]. The area comprised between the High Zagros Fault and the Mountain Front Fault is the Folded Belt, which deforms terrains of the proximal domain of the Arabian margin. The MFF [18] divides the belt from its foreland basin and has a sinusoidal shape that defines salient and recesses. These, from NW to SE are: The Kirkuk embayment, the Lurestan arc, the Dezful embayment, and the Fars arc (Figure 1).
This research focuses on the NW part of the Zagros thrust belt, as the study area is located between the Lurestan arc and the Kirkuk embayment (Figure 1 and Figure 2). Recent geodetic calculations show an oblique plate convergence, with a motion of the Arabian plate of ca. 7 mm/yr in a north–south direction with respect fixed Eurasia [1]. The strike–slip component of the Zagros orogeny during continental collision is accommodated by the previously mentioned Main Recent Fault (MRF), which separates the Iran block from the Arabian Plate [18,19,21,22,23,24]. In the study area, the MFF, which bounds the Lurestan arc to the SW, is responsible for high-magnitude seismicity, as witnessed by the seismic event of 12 November 2017 Mw = 7.3 [4].
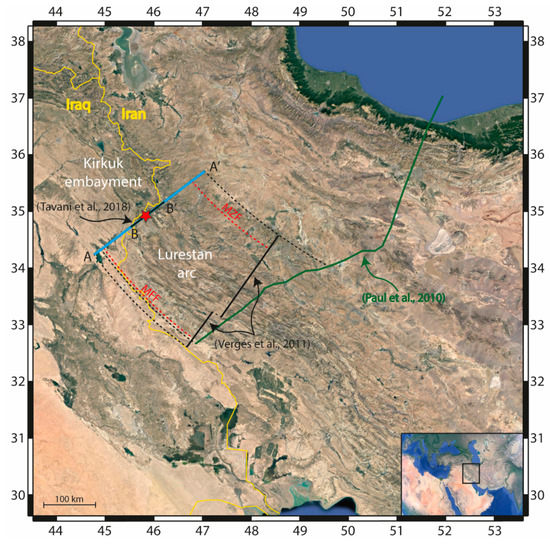
Figure 2.
Satellite image of the study area. The yellow line represents the political boundary between Iraq and Iran. Green line shows the trace of the composite profile “Zagros03” and “Alborz03” by Paul et al. [6], providing the Moho depth used in this research. Black lines show traces of published geological sections. Red and black dashed lines are the guidelines used to project sections and faults on our model (blue line A–A’). Red star is the epicentral position of the seismic event of 12 November 2017 (Mw = 7.3) [3].
The Arabian sedimentary cover is formed by a series of stratigraphic groups and formations ranging in age from the Cambrian to the Quaternary. These are mainly composed of limestones and sandstones and were deposited on top of a crystalline basement [25,26,27,28,29].
Jurassic to Early Eocene calc-alkaline magmatic rocks and products of gabbroic plutonism form the Sanandaj–Sirjan zone, a domain representing the western part of the Central Iranian block [14,30,31,32].
3. Methods
In order to investigate the thermal structure of the Zagros thrust belt, an analytical procedure was used. This procedure is based on a simplified conceptual model extrapolated from a pre-built geometric model.
3.1. Geometric Model
The geometric model was implemented on the basis of the geological section by Tavani et al. [4]. In order to include the entire MFF in the section, this was integrated with two further sections by Vergés et al. [5]. Moho depth and geometry are included in the model by using a projection of the Moho calculated by Paul et al. [6] (Figure 2). The resulting model was divided into three different homogeneous zones: (i) Arabian cover (or sedimentary cover), (ii) Arabian basement, and (iii) Sanandaj–Sirjan zone. Faults geometry and kinematics shown in Figure 3 (red and blue arrows) are from Tavani et al. [4].
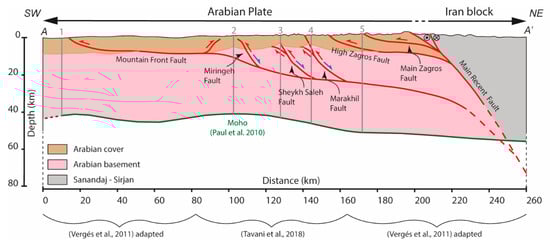
Figure 3.
Model section A–A’ (located in Figure 2). The composite section was built by integrating the section by Tavani et al. [4] (for the central sector) and two adapted sections by Vergés et al. [5] (southwest and northeast sectors). The Moho was projected using the average profile by Paul et al. [6]. In gray the vertical lines are used to calculate the thermal structure. The model was subdivided into three different homogeneous zones as shown in the legend.
3.2. Conceptual Model
The conceptual model was built using three vertical lines (2, 3, and 4 in Figure 4) traced on the pre-built geometric model (Figure 3). To perform temperature calculations, the crustal structure of the study area was simplified as consisting of two units: (i) An upper unit that includes all the sedimentary layers from the Cambrian to the Quaternary, with a constant thickness of 7.5 km; and (ii) a granitoid basement with a variable thickness depending on the Moho depth (Figure 4). These two units are, respectively, the Arabian cover and the Arabian basement of the geometric model shown in Figure 3.
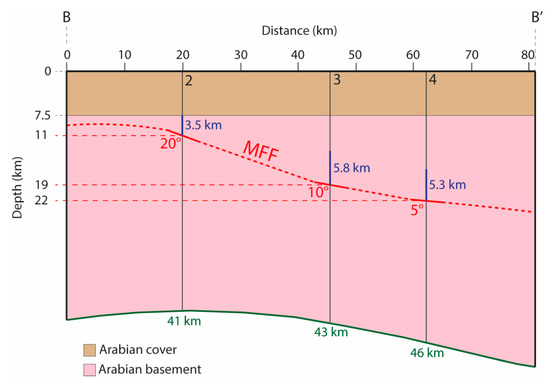
Figure 4.
Conceptual model for geothermal calculation along the B–B’ section (located in Figure 2). The graph describes the parameters used in the analytical calculation: Crustal thickening values (∆z) are identified by blue numbers, thrust angles by red numbers, and Moho depth values by green numbers.
Within the basement, the vertical lines cross the MFF at different depths (Figure 4). Using the restored section made by Tavani et al. [4], we calculated the amount of basement offset by the MFF (blue numbers on Figure 4) for a total section shortening of ~20 km. Taking into account the reconstructed geometry of the Arabian margin by Le Garzic et al. [32], the timing of activity of the faults in our model (Figure 3) is variable and it is divided into three steps: (i) Campanian/Maastrichtian, 84–66 Ma for the Main Zagros and High Zagros faults, (ii) Miocene, 20–10 Ma for the Main Recent Fault and the Marakhil, Sheykh Saleh, and Miringeh faults, and (iii) 10 Ma–Present for the MFF. Based on the timing of faulting activity, the slip rate of the MFF was calculated considering a total shortening of 20 km in the range of 20–10 Ma. The resulting slip rate (v) is in the range of 1–2 mm/yr, and therefore, we used an average value of 1.5 mm/yr.
In the model, we used the following parameters: (i) A constant heat production rate (HC) as proposed by Tunini et al. [8], with HC = 1.0 µW/m3; (ii) a thermal conductivity KC = 2.0 W/km for the sedimentary cover; (iii) a heat production rate HB = 0.4 µW/m3, and (iv) a thermal conductivity KB = 2.2 W/km for the basement. We assumed a constant thickness of the sedimentary cover (hC) of 7.5 km and a variable thickness of the basement (hB) depending on Moho depth, based on Tavani et al. [4] and Paul et al. [8], respectively. The heat flux at the Moho has a value Qm = 20 mW/m2 [33]. However, taking into account that higher values have been proposed for the Red Sea zone of the Arabian plate [34,35], a value of Qm = 25 mW/m2 was also considered in the calculation of the geotherms along our profile.
The fundamental heat sources to be considered in the computations are both the heat rising from the mantle and the radiogenic heat due to the presence of radioactive elements in the lower and in the upper units of the model. In fold and thrust belts such as the Zagros Mountains, a further heat source is represented by frictional heating associated with thrust faulting. The shear stress (σ), which enters in the calculation of frictional heating, was obtained using Sibson’s [36] formulation for favorably oriented thrust faults at the chosen depths under hydrostatic pore-fluid conditions, with the friction coefficient (μ) equal to 0.6. The analytical procedure applied in this study takes into account both the temperature variation due to the balanced conductive state and the overthrust and frictional heating. Input parameters include data on heat flux density and geologically derived constraints (thrust depth, lithology) based on Tavani et al. [4]. A basal heat flow of 20 mW/m2 coming from the mantle is assumed, corresponding to a shield type heat flow at the Moho [33].
3.3. Analytical Procedure
The computing procedure follows the analytical method developed by Molnar et al. [37]:
The new equilibrium final state and a time dependent term:
where:
with and is the perturbed initial state, which depend on the heat source type, the thrust depth (), the crustal thickness (), the thermal capacity (k), and diffusivity (K).
In the ideal case with no thrusts, we obtain the following equations of heat flow
and these other equations of temperature
where
In the case of a thrust fault involving the basement along the vertical profile of geotherm calculation, the changes of temperature are due to the perturbation of the mantle-derived heat flow and of the radiogenic heat flow. Furthermore, for the calculation of the thermal state of the upper unit of the model, the increase of radiogenic heat associated with the increased basement thickness () must be taken into account, as well as the variation of temperature due to the perturbation of the mantle-derived heat flow [38]. Furthermore, the frictional heat must be added to the other two heat flow components. The heat flow and the temperatures for the two units of the model are obtained by the following equations:
where , is the average slip rate along the thrust, and is the shear stress at the thrust depth .
Each term depending on time has the generic Equation (1), where is the final temperature of the new equilibrium status ( and is calculated by Equations (2) and (3). and show differences due to thermal source type and depending on thrusting involving the sedimentary cover [39] or the basement along the vertical profile of geotherm computation [38]. Following the method by Molnar et al. [37], the parameters of the perturbed initial and the final temperature are used to compute the coefficient An (Equation (3)), then the time dependent term (Equation (2)), and lastly the time dependent temperature (Equation (1)).
The final temperature for the cover unit is given by:
and the perturbed initial state associated uniquely with the radiogenic heat increase is given by:
The final temperature for the basement is given by:
and the perturbed initial state associated uniquely with increased basement thickness is given by:
For both units of the model, the perturbation of the mantle-derived heat flow causes small temperature changes as described by Candela et al., 2015 [38], and the temperature increment due to frictional heating is added as follows:
and in this latter case the final temperature coincides with the perturbed initial state.
4. Results
We calculated the isotherms, the heat flow QS (QS = Q(0)), and the geotherms at different points along the cross-sections shown in Figure 3. The different depth of the MFF, with the related tectonic thickening, and the constant thickness of the sedimentary cover produce a variable trend of the temperature with depth, which was obtained through the analytical procedure explained in the previous paragraph (based on Molnar et al. [37] and modified considering a constant radiogenic heat, as proposed by Tunini et al. [8]).
Figure 5a shows the heat flow QS (QS = Q(0)) obtained using an interpolation which takes into account the value calculated using the vertical lines traced on the pre-built geometric model of Figure 3. The graph shows how the heat flow QS increases its value from SW to NE due to the heat flow produced by MFF friction (TFH), basement thickening () and deepening of the Moho.
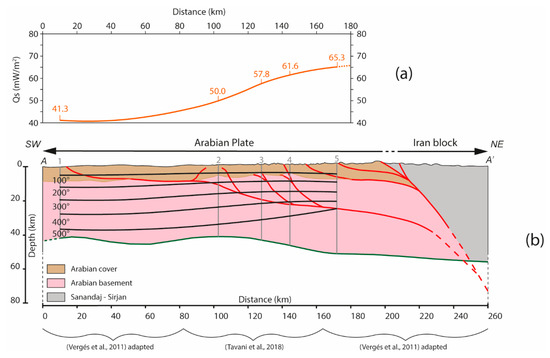
Figure 5.
(a) Surface heat flow (Qs) curve calculated using the five vertical lines of our model (refer to Figure 3). (b) Thermal structure of Zagros Mountains of western Lurestan as defined by isotherms produced by interpolation among the vertical lines.
In Figure 5b we present our modeling results for the thermal structure of the Zagros thrust belt. The temperature shows a constant increase with depth into the undeformed Arabian plate (SW) and an increment of temperature moving to the NE, due to thrusting and deepening of the Moho. The temperature increase from ~400 °C at 30 km depth along vertical line 1, to ~500 °C at the same depth along vertical line 5, where the MFF offsets a significant amount of basement.
The calculated geotherms are shown in Figure 6. The geotherm relative to vertical line 1 shows a constant increment of temperature with depth due to the absence of thrusts. On the other hand, in the sector of vertical lines 3, 4, and 5, the isotherms are elevated and closer to each other as a result of thrusting. The geotherm relative to vertical line 2 shows a smooth change with respect to that of vertical line 1 because the thrust at vertical line 2 involved only minor basement thickening. The resulting surface heat flow (QS) ranges from 41 to 65 mW/m2.
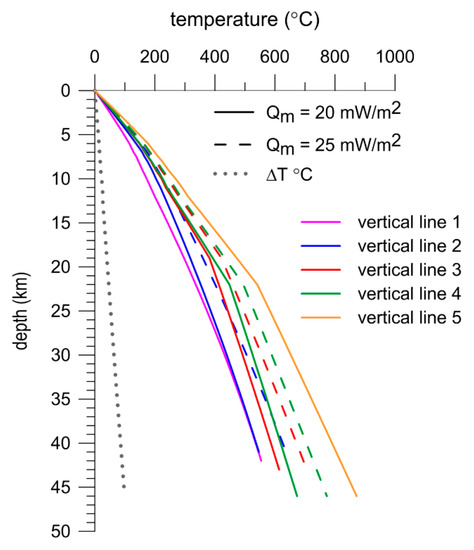
Figure 6.
Calculated geotherms corresponding to the five vertical lines shown in Figure 3 for Qm of 20 mW/m2 (solid lines) and 25 mW/m2 (dashed lines, calculated for verticals 2 to 4 only). The dotted gray line indicates the maximum change of temperature ∆T(z) between the two geotherms with Qm of 20 and 25 mW/m2 computed for the three vertical lines shown in Figure 4.
5. Discussion and Conclusions
Our model displays five geotherms calculated assuming mantle heat flow (Qm) values of 20 mW/m2 and 25 mW/m2 (Figure 6). A maximum ∆T value of ca. 100 °C (at ca. 45 km depth) is reached for vertical lines 2, 3, and 4. Surface heat flow (QS) values are of 50 and 55 mW/m2 (line 2), 57.8 and 62.8 mW/m2 (line 3), 61.6 and 66.6 mW/m2 (line 4) for Qm values of 20 mW/m2 and 25 mW/m2, respectively. With respect to previously published results [40], QS values obtained in this study display a more marked variation from lower values in the foreland and thrust front region to the thrust belt interior to the NE (Figure 7a). As pointed out by Megna et al. [39], the largest temperature changes are obtained by varying the heat flow, while temperature changes are in the range of 2–5% when thickness, thrusting depth, thermal conductivity, timing of activity, and slip rate values vary by 10% of their initial chosen value.
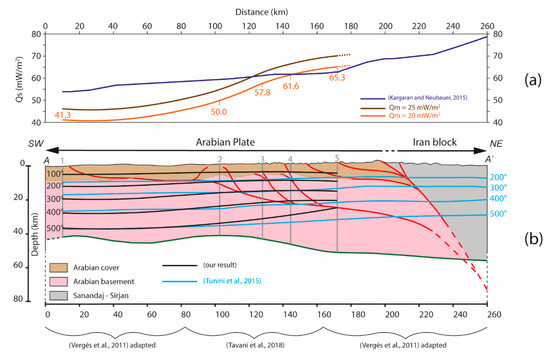
Figure 7.
(a) Surface heat flow (Qs) curves obtained for Qm values of 20 and 25 mW/m2, compared with the Kargaran and Neubauer [40] curve. (b) Thermal structure of the study area, compared with the isotherms by Tunini et al. [8].
The diagram of Figure 7a shows how an increment of Qm (from 20 mW/m2 to 25 mW/m2) produces a shift of the QS curve without changing its shape. Both curves remain within the range of 40–80 mW/m2, which is consistent with recent studies by Shekarifard et al. [41] and by Kargaran and Neubauer [40]. The QS curve obtained for a Qm value of 20 mW/m2 provides a better fit as compared with the results by Kargaran and Neubauer [40]. In particular, a value congruency of about 61mW/m2 is met for vertical line 4, while a minor difference occurs for vertical line 5. The QS curve obtained for Qm = 25 mW/m2 shows a congruency in correspondence of vertical line 3, but displays a larger difference towards the NE. This comparison highlights how an analytical calculation (used in this work) produces different results with respect to published ones, however still in the range of QS values of 40–80 mW/m2 that are considered realistic for the Zagros thrust belt [40,41]. As a matter of fact, our temperature isolines are generally consistent with those obtained by Tunini et al. [8] (Figure 7b). Some difference occurs in the NE part of the section, but our results are in good agreement with the trend obtained by Vernant and Chery [7].
This study provides, for the first time, a comprehensive picture of the thermal structure of the Zagros fold and thrust belt calculated using an analytical procedure. This information is of pivotal importance for any quantitative modeling of the tectonic behavior of the actively deforming Iran sector located along the Arabia–Eurasia plate boundary.
Author Contributions
Conceptualization, S.M., S.S., A.M., and M.B.; methodology, S.S. and A.M.; software, A.M.; validation, S.S., A.M., S.T., and M.B.; formal analysis, S.M. and S.T; investigation, S.T. and S.M.; resources, S.M.; data curation, M.B.; writing—original draft preparation, M.B.; writing—review and editing, M.B., S.S., S.T., A.M., and S.M.; visualization, M.B., S.M., and S.T.; supervision, S.M.; project administration, S.S.
Funding
This research received no external funding.
Acknowledgments
The authors are grateful to the editor for his helpful support in organizing the manuscript. We thank three anonymous reviewers for their useful comments and suggestions.
Conflicts of Interest
The authors declare no conflict of interest.
References
- Vernant, P.; Nilforoushan, F.; Hatzfeld, D.; Abassi, M.; Vigny, C.; Masson, F.; Nankali, H.; Martinod, J.; Ashtiani, A.; Bayer, R.; et al. Contemporary Crustal Deformation and Plate Kinematics in Middle East constrained by GPS Measurements in Iran and North Oman. Geophys. J. Int. 2004, 157, 381–398. [Google Scholar] [CrossRef]
- Jackson, J.; McKenzie, D. Active tectonics of the Alpine-Himalayan belt between Turkey and Pakistan. Geophys. J. Int. 1984, 77, 185–264. [Google Scholar] [CrossRef]
- USGS.gov|Science for a Changing World. Available online: https://www.usgs.gov/ (accessed on 26 November 2018).
- Tavani, S.; Parente, M.; Puzone, F.; Corradetti, A.; Gharabeigli, G.; Valinejad, M.; Morsalnejad, D.; Mazzoli, S. The seismogenic fault system of the 2017 Mw 7.3 Iran-Iraq earthquake: Constraints from surface and subsurface data, cross-section balancing, and restoration. Solid Earth 2018, 9, 821–831. [Google Scholar] [CrossRef]
- Vergés, J.; Saura, E.; Casciello, E.; Fernàndez, M.; Villaseñor, A.; Jiménez-Munt, I.; García-Castellanos, D. Crustal-scale cross-sections across the NW Zagros belt: Implications for the Arabian margin reconstruction. Geol. Mag. 2011, 148, 739–761. [Google Scholar] [CrossRef]
- Paul, A.; Hatzfeld, D.; Kaviani, A.; Tatar, M.; Péquegnat, C. Seismic imaging of the lithospheric structure of the Zagros mountain belt (Iran). Geol. Soc. Lond. Spec. Publ. 2010, 330, 5–18. [Google Scholar] [CrossRef]
- Vernant, P.; Chéry, J. Mechanical modelling of oblique convergence in the Zagros, Iran. Geophys. J. Int. 2006, 165, 991–1002. [Google Scholar] [CrossRef]
- Tunini, L.; Jiménez-Munt, I.; Fernàndez, M.; Vergés, J.; Villaseñor, A. Lithospheric mantle heterogeneities beneath the Zagros Mountains and the Iranian Plateau: A petrological-geophysical study. Geophys. J. Int. 2015, 200, 596–614. [Google Scholar] [CrossRef]
- Stocklin, J. Structural History and Tectonic of Iran: A Review. Am. Assoc. Pet. Geol. Bull. 1968, 52, 1229–1258. [Google Scholar] [CrossRef]
- Ricou, L.E.; Braud, J.; Brunn, J.H. Le Zagros. In Livre à la Mémoire de Albert, F. de Lapparent; Mémoire hors-série; Societe Geologique de France: Paris, France, 1977; No. 8; pp. 33–52. (In French) [Google Scholar]
- Berberian, M.; King, G.C.P. Towards a paleogeography and tectonic evolution of Iran. Can. J. Earth Sci. 1981, 18, 2010–2065. [Google Scholar] [CrossRef]
- Dercourt, J.; Zonenshain, L.P.; Ricou, L.E.; Kazmin, V.G.; Le Pichon, X.; Knipper, A.L.; Grandjacquet, C.; Sbortshikov, I.M.; Geyssant, J.; Lepvrier, C.; et al. Geological evolution of the Tethys belt from the Atlantic to the Pamirs since the LIAS. Tectonophysics 1986, 123, 241–315. [Google Scholar] [CrossRef]
- Braud, J. La suture du Zagros au niveau de Kermanshah (Kurdistan Iranien): Reconstitution Paléogéographique, Evolution Géodynamique, Magmatique et Structurale. Ph.D. Thesis, University of Paris-Sud, Paris, France, 1987. Unpublished Thesis (In French). [Google Scholar]
- Alavi, M. Tectonics of the Zagros orogenic belt of Iran: New data and interpretations. Tectonophysics 1994, 229, 211–238. [Google Scholar] [CrossRef]
- Stampfli, G.M.; Borel, G.D. A plate tectonic model for the Paleozoic and Mesozoic constrained by dynamic plate boundaries and restored synthetic oceanic isochrons. Earth Planet. Sci. Lett. 2002, 196, 17–33. [Google Scholar] [CrossRef]
- Agard, P.; Omrani, J.; Jolivet, L.; Mouthereau, F. Convergence history across Zagros (Iran): Constraints from collisional and earlier deformation. Int. J. Earth Sci. 2005, 94, 401–419. [Google Scholar] [CrossRef]
- Koshnaw, R.I.; Horton, B.K.; Stockli, D.F.; Barber, D.; Tamar-Agha, M.; Kendall, J.J. Neogene shortening and exhumation of the Zagros fold-thrust belt and foreland basin in the Kurdistan region of northern Iraq. Tectonophysics 2017, 694, 332–355. [Google Scholar] [CrossRef]
- Berberian, F.; Berberian, M. Tectono-Plutonic Episodes in Iran. In Zagros-Hindu Kush-Himalaya Geodynamic Evolution; American Geophysical Union: Washington, DC, USA, 1981; Volume 3, pp. 5–32. [Google Scholar]
- McQuarrie, N.; van Hinsbergen, D.J.J. Retrodeforming the Arabia-Eurasia Collision zone: Age of collision versus magnitude of continental subduction. Geology 2013, 41, 315–318. [Google Scholar] [CrossRef]
- Tavani, S.; Parente, M.; Vitale, S.; Iannace, A.; Corradetti, A.; Bottini, C.; Morsalnejad, D.; Mazzoli, S. Early Jurassic Rifting of the Arabian Passive Continental Margin of the Neo-Tethys. Field Evidence from the Lurestan Region of the Zagros Fold-and-Thrust Belt, Iran. Tectonics 2018, 37, 2586–2607. [Google Scholar] [CrossRef]
- Talebian, M.; Jackson, J. Offset on the Main Recent Fault of NW Iran and implications for the late Cenozoic tectonics of the Arabia–Eurasia collision zone. Geophys. J. Int. 2002, 157, 381–398. [Google Scholar] [CrossRef]
- Allen, M.; Jackson, J.; Walker, R. Late Cenozoic reorganization of the Arabia-Eurasia collision and the comparison of short-term deformation rates. Tectonics 2004, 23, TC2008. [Google Scholar] [CrossRef]
- Authemayou, C.; Chardon, D.; Bellier, O.; Malekzadeh, Z.; Shabanian, E.; Abbassi, M.R. Late Cenozoic partitioning of oblique plate convergence in the Zagros fold-and-thrust belt (Iran). Tectonics 2006, 25, TC3002. [Google Scholar] [CrossRef]
- Sadeghi, S.; Yassaghi, A. Spatial evolution of Zagros collision zone in Kurdistan, NW Iran: Constraints on Arabia–Eurasia oblique convergence. Solid Earth 2016, 7, 659–672. [Google Scholar] [CrossRef]
- Colman-Saad, S.P. Fold development in Zagros simply folded belt, southwest Iran. Am. Assoc. Pet. Geol. Bull. 1978, 62, 984–1003. [Google Scholar]
- Sepeher, M.; Cosgrove, J.W. Structural framework of the Zagros Fold–Thrust Belt, Iran. Mar. Pet. Geol. 2004, 21, 829–843. [Google Scholar] [CrossRef]
- Rudkiewicz, J.L.; Sherkati, S.; Letouzey, J. Evolution of Maturity in Northern Fars and in the Izeh Zone (Iranian Zagros) and Link with Hydrocarbon Prospectivity. In Thrust Belts and Foreland Basins; Lacombe, O., Roure, F., Lavé, J., Vergés, J., Eds.; Frontiers in Earth Sciences book series; Springer: Berlin/Heidelberg, Germany, 2007. [Google Scholar]
- Casciello, E.; Vergés, J.; Saura, E.; Casini, G.; Fernàndez, N.; Blanc, E.J.P.; Homke, S.; Hunt, D. Fold patterns and multilayer rheology of the Lurestan Province, Zagros Simply Folded Belt (Iran). J. Geol. Soc. Lond. 2009, 166, 947–959. [Google Scholar] [CrossRef]
- Gavillot, Y.G.; Axen, G.J.; Stockli, D.F.; Horton, B.K.; Fakhari, M. Timing of thrust activity in the High Zagros fold-thrust belt, Iran, from (U-Th)/He thermochronometry. Tectonics 2010, 29, TC4025. [Google Scholar] [CrossRef]
- Leterrier, J. Mineralogical, Geochemical and isotopic evolution of two Miocene mafic intrusions from the Zagros (Iran). Lithos 1985, 18, 311–329. [Google Scholar] [CrossRef]
- Baharifar, A.; Moinevaziri, H.; Bellon, H.; Pique, A. The crystalline complexes of Hamadan (Sanandaj-Sirjan zone, western Iran): Metasedimentary Mesozoic sequences affected by Late Cretaceous tectono-metamorphic and plutonic events. C. R. Geosci. 2004, 336, 257–282. [Google Scholar] [CrossRef]
- Le Garzic, E.; Vergés, J.; Sapin, F.; Saura, E.; Meresse, F.; Ringenbach, J.C. Evolution of the NW Zagros Fold-and-Thrust Belt in Kurdistan Region of Iraq from balanced and restored crustal-scale sections and forward modeling. J. Struct. Geol. 2019, 124, 51–69. [Google Scholar] [CrossRef]
- Francois, T.; Burov, E.; Agard, P.; Meyer, B. Buildup of a dynamically supported orogenic plateau: Numerical modeling of the Zagros/Central Iran case study. Geochem. Geophys. Geosyst. 2014, 15, 2632–2654. [Google Scholar] [CrossRef]
- Förster, H.J.; Förster, A.; Oberhänsli, R.; Stromeyer, D. Lithospheric composition and thermal structure of the Arabian Shield in Jordan. Tectonophysics 2010, 481, 29–37. [Google Scholar] [CrossRef]
- Schütz, F.; Förster, H.J.; Förster, A. Thermal conditions of the central Sinai Microplate inferred from new surface heat-flow values and continuous borehole temperature logging in central and southern Israel. J. Geodyn. 2014, 76, 8–24. [Google Scholar] [CrossRef]
- Sibson, R.H. Frictional constraints on thrust, wrench and normal faults. Nature 1974, 249, 542–544. [Google Scholar] [CrossRef]
- Molnar, P.; Chen, W.P.; Padovani, E. Calculated temperatures in overthrust terrains and possible combinations of heat sources responsible for the tertiary granites in the greater Himalaya. J. Geophys. Res. 1983, 88, 6415–6429. [Google Scholar] [CrossRef]
- Candela, S.; Mazzoli, S.; Megna, A.; Santini, S. Finite element modelling of stress field perturbations and interseismic crustal deformation in the Val d’Agri region, southern Apennines, Italy. Tectonophysics 2015, 657, 245–259. [Google Scholar] [CrossRef]
- Megna, A.; Candela, S.; Mazzoli, S.; Santini, S. An analytical model for the geotherm in the Basilicata oil fields area (southern Italy). Ital. J. Geosci. 2014, 133, 204–213. [Google Scholar] [CrossRef]
- Kargaran, F.; Neubauer, F. Lithospheric thinning associated with formation of a metamorphic core complex and subsequent formation of the Iranian plateau. GSA Today 2015, 25, 4–8. [Google Scholar] [CrossRef]
- Shekarifard, A.; Baudin, F.; Seyed-Emami, K.; Schnyder, J.; Laggoun-Défarge, F.; Riboulleau, A.; Brunet, M.F.; Shahidi, A. Thermal maturity of the Upper Triassic-Middle Jurassic Shemshak Group (Alborz Range, Northern Iran) based on organic petrography, geochemistry and basin modelling: Implications for source rock evaluation and petroleum exploration. Geol. Mag. 2012, 149, 19–38. [Google Scholar] [CrossRef]


© 2019 by the authors. Licensee MDPI, Basel, Switzerland. This article is an open access article distributed under the terms and conditions of the Creative Commons Attribution (CC BY) license (http://creativecommons.org/licenses/by/4.0/).