Article

Satellite Pre-Failure Detection and In Situ Monitoring of the Landslide of the Tunnel du Chambon, French Alps

by
Mathilde Desrues
1,2,*,
Pascal Lacroix
2 and
Ombeline Brenguier
2
1
Société Alpine de Géotechnique (SAGE), 2 Rue de la Condamine, 38610 Gières, France
2
Univ. Grenoble Alpes, Univ. Savoie Mont Blanc, CNRS, IRD, IFSTTAR, ISTerre, 38000 Grenoble, France
*
Author to whom correspondence should be addressed.
Geosciences 2019, 9(7), 313; https://doi.org/10.3390/geosciences9070313
Submission received: 14 May 2019 / Revised: 8 July 2019 / Accepted: 9 July 2019 / Published: 16 July 2019
(This article belongs to the Special Issue Analysis of the Kinematic Evolution of Active Landslides)

Abstract

:
Recent studies using satellite data have shown a growing interest in detecting and anticipating landslide failures. However, their value for an actual landslide prediction has shown variable results. Therefore, the use of satellite images for that purpose still requires additional attention. Here, we study the landslide of the Tunnel du Chambon in the French Alps that ruptured in July 2015, generating major impacts on economic activity and infrastructures. To evaluate the contribution of very high-resolution optical satellite images to characterize and potentially anticipate the landslide failure, we conduct here a retro analysis of its evolution. Two time periods are analyzed: September 2012 to September 2014, and May to July 2015. We combine Pléiades optical images analysis and geodetic measurements from in situ topographic monitoring. Satellite images were correlated to detect pre-failure motions, showing 1.4-m of displacement between September 2012 and September 2014. In situ geodetic measures were used to analyze motions during the main activity of the landslide in June and July 2015. Topographic measurements highlight different areas of deformations and two periods of strong activity, related to the last stage of the tertiary creep and to anthropic massive purges of unstable masses. The law of acceleration toward the rupture observed in June and July 2015 over the topographic targets also fits well the satellite observation between 2012 and 2014, showing that the landslide probably already entered into tertiary creep 2.5 years before its failure.

1. Introduction

Landslides of medium-scale volumes (>105 mm3) are common phenomena in the Alps, where they pose permanent threats to industrialized and narrow valleys. The main risk associated with those landslides is their potential to form natural dams, which could block the rivers in the narrow valleys [1,2], and have devastating consequences for people and facilities downstream in the case of a rupture. Landslides could also affect infrastructures over the long-term, as some of they can block the connectivity between territories for many years. These landslides, thus, highlight the vulnerability of the alpine territory to natural hazards.
Detection and monitoring of landslide activity has been one of the main responses to this problem in the French Alps for more than 30 years, together with large deviation works of the roads and digging of tunnels for the rivers [3]. Landslide detection can, however, be very tricky in steep and inaccessible areas. That is why the use of satellite data for landslide motion detection has gained a growing interest in the last few years [4,5], and this includes pre-failure motions [6], which can be precursory of catastrophic failures [7].
Detection before rupture is important to anticipate the possible consequences of landslides. Notably, cracking or creeping can sometimes be observed [8]. Such pre-failure motions can be explained through the tertiary creep stage of the material [9], and have been found to follow in some cases a power-law of acceleration pattern. This power-law has been used to tentatively estimate a date of failure, with more or less success [10].
The speed of the pre-failure motion can have different orders of magnitude (between 0.1 and 2000 cm/day) [11], such that acceleration sometimes occurs over a very short period of time, making the final rupture difficult to predict. Pre-failure motions can be identified from in situ observations and monitoring in areas where visual signs of instabilities exist, but several recent developments have shown that these pre-failure accelerations can also be detected from space using Interferometric Synthetic Aperture Radar (InSAR) data [12,13] or optical images [6].
However, such a detection is still limited to very few case-studies [6,12,13,14,15,16], revealing in particular that the application of InSAR is limited to centimetric motions per month, and that for larger motions, optical images with a frequent revisit time (e.g., Sentinel-2, 5 days at the Equator), despite the mean resolution of 10 m, have a high detection value. Its use is nevertheless limited to large landslides with metric motions before failures. Based on modeling and on the analysis of monitoring data from 56 old landslides, a previous study [17] concluded that pre-failure motion could have been detected on 30% of the case studies using recent InSAR data, based on motion detection of lambda/4 between two acquisitions, that is, 1.4 cm every 10 days for Sentinel-1. Despite its interest, this study remains purely theoretical, and does not take into account the fact that precursory motions can occur on very limited areas of the landslide (as shown in a previous study [12]), and thus the detection with medium resolution satellites (either optical or radar) is difficult. This review shows the interest of estimating the value of Very High-Resolution (VHR) optical satellite data.
To demonstrate the possibility of detecting pre failure motion with optical satellites, more case studies need to be carried out with data of various resolutions and revisit times. For smaller landslides or lower pre-failure landslide motions, very high-resolution optical satellites have the advantages of lower ground motion uncertainties and the ability to detect slow-moving landslides of lower extents [18,19] than for medium resolution satellites. In particular, previous studies have shown horizontal motion uncertainties using correlation of Pléiades satellite images (70 cm of resolution) of 15 cm. Despite their lower frequency of revisit, the ability of pre-failure landslide motion detection with VHR data must be evaluated.
Such is the main goal of our study, and we take advantage of a specific landslide where good knowledge and in situ measurements where available during the failure process.
We focus on a late-detected, medium-scale landslide in the French Alps, the landslide of the Tunnel du Chambon that provoked an important road cut over 2.5 years over a major road axis, frequented by about 2700 vehicles per day. It impacted local populations and economy in the long term, and gained some fame as the Tour de France bicycling race had to be diverted in July 2015. The landslide was only detected 3 months before its final rupture in July 2015 [20], and the question is raised in this study about the existence of some landslide activity before this date. We indeed detect and analyze slow-motions before the failure using both in situ measurements and very high-resolution satellite images from the Pléiades satellites.

2. Data and Method

2.1. Site Study

The landslide of the Tunnel du Chambon is located in the French Alps along the Chambon artificial lake reservoir (Figure 1a). The landslide affects the tunnel of the road linking Grenoble to Briançon, two vibrant agglomerations. Since its construction in 1935, the tunnel has undergone several kinds of damage, including rock falls, such as in 1977 and 1978, or the growth of unfavorable cracks [20]. From there the tunnel was monitored by convergence measures on its walls. In 2010, as a result of this convergence acceleration, a diagnostic was performed. However, it concluded that there was no major landslide affecting the area. Nevertheless, remedial works were realized in 2012 and extensometers were set up inside the tunnel. Between 2012 and 2014, disorders in the tunnel amplified, and it finally closed in April 2015 after the emergence of several surface fissures. The mapping of these observed fissures delimits 3 main compartments, noted as B1, B2, and B3 in Figure 1b. Each compartment could, hence, hold a different kinematical behavior.
On July 4 a major but incomplete rupture of the landslide occurred. As a consequence, all of the actors of the landslide risk management team decided to increase the lake level to purge the remaining unstable masses. The lake level was raised several meters in one week.
Due to the high traffic of the road in this touristic area, authorities decided to build an emergency access road on the other side of the valley that was delivered in late November 2015, and a new tunnel was constructed, making normal traffic possible in December 2017, more than 2.5 years after the first landslide detection.
During its activity in April–July 2015, an in situ instrumentation described in Section 2.4 (extensometers, topographic targets, geophysical surveys) was set up by the SAGE society (Société Alpine de Géotechnique, France) to monitor the phenomenon.
From a geological point of view, the landslide affected lower Jurassic sedimentary rocks (Lias), mainly comprising slate, the orientation range of which is from 0° N to 35° N and dipping from 60° to 65° toward the east. It reaches a length of 250 m and a width of 100 m. From drillings, cross-sections, and geophysical surveys, a previous study [20] estimated a volume involved of approximately 600,000 m3 and a maximal thickness of 25 m. Two thalwegs frame the landslide and a head-scarp has been developing since April 2015, bounding the limits of the most active part. The lower limit of the slide cannot be determined, because the landslide toe stands below the lake level. From top to bottom, the study site can be divided into four geomorphological parts (Figure 1b): a bench tilted at 15 to 20°; a grassed area tilted at 40°; rock steps on the west side and steep ravines on the east side; and an area in the lower part of the landslide sloping at 37°.

2.2. Satellite Data

Here, we used 6 very high-resolution optical satellite images from the Pléiades constellation, corresponding to all the Pléiades data available for our period of study on this area. Their spatial resolutions are 70 cm in panchromatic mode. They were captured at four different times: 28 September 2012, and 26 September 2014, images were acquired in a monoscopic mode, and the 19 July 2016, and 22 September 2016, images were acquired in a stereoscopic mode. The B/H ratio (baseline between the two optical images to altitude of the satellite ratio, which defines the sensitivity of the stereo pair to the topography [21]) of the two stereo-pairs is similar and equals 0.3. These acquisitions are, therefore, suitable for generating fine Digital Elevation Model (DEM) for the area. Indeed, precedent studies using Pléiades images in low vegetative areas have shown metric uncertainties of the Pléiades DEMs [19,22]. The common area between all images covers a footprint of 23 km2 (Figure 1a).

2.3. Satellite Images Processing

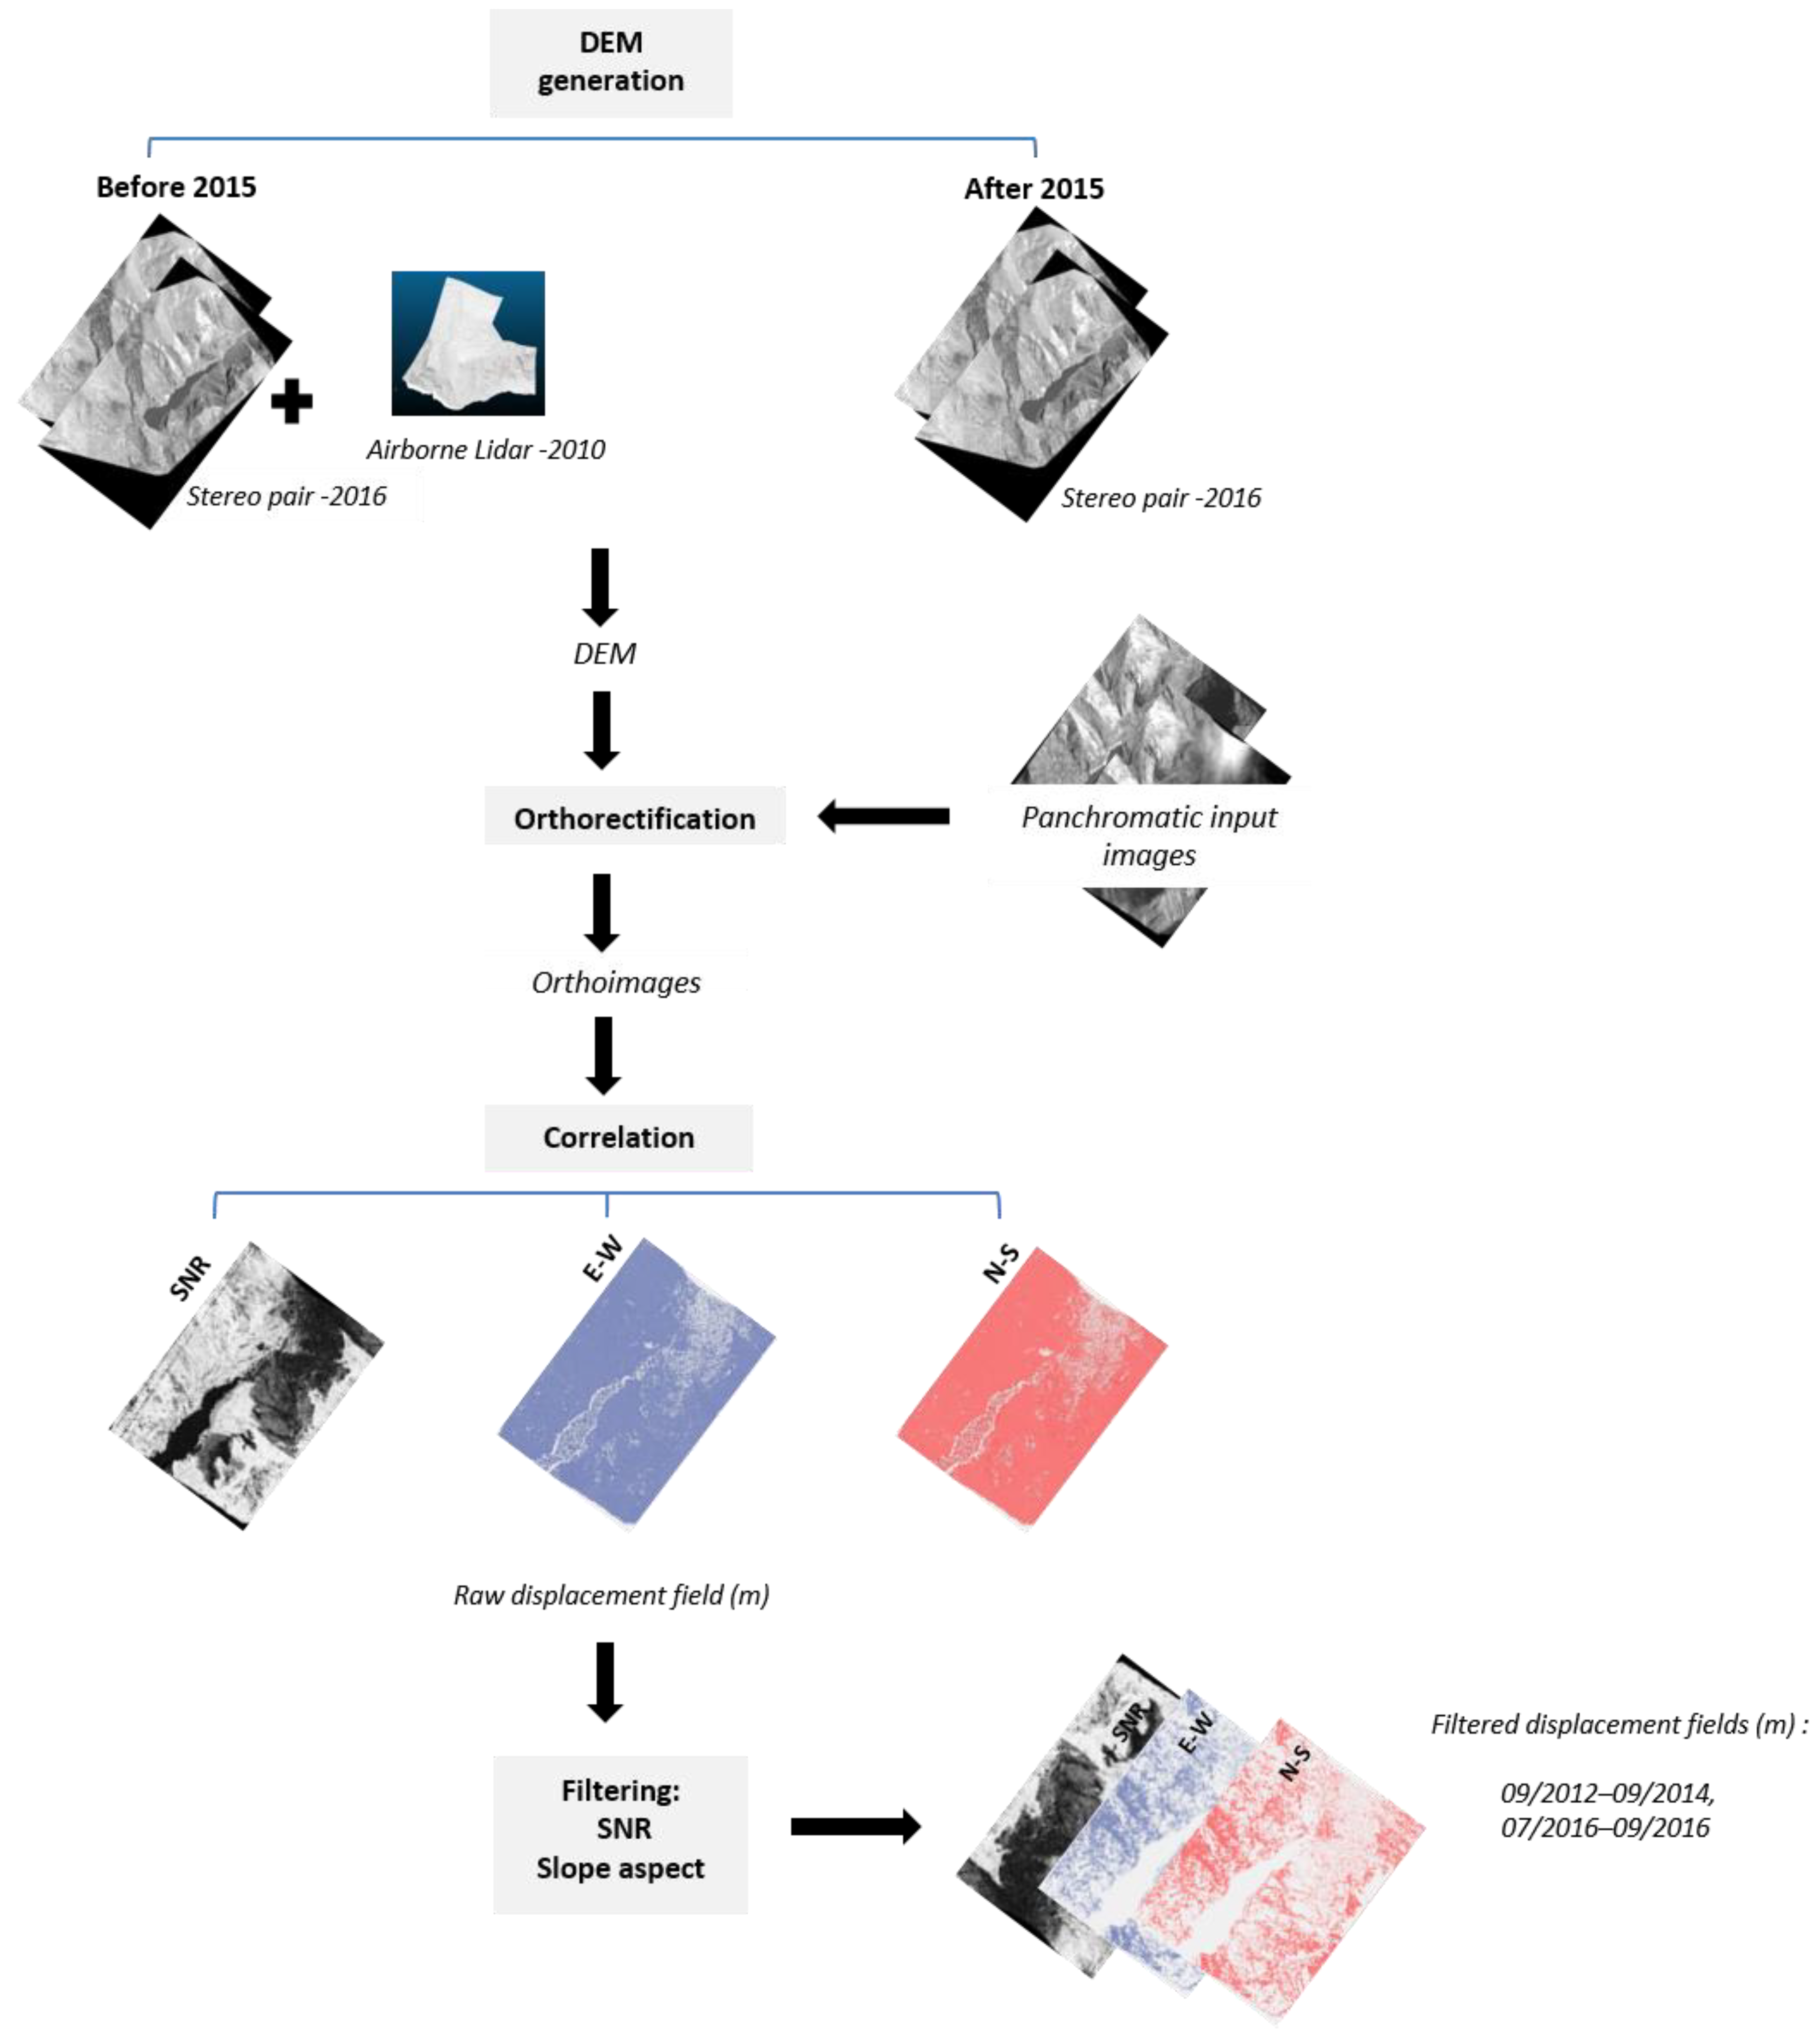
We processed the Pléiades images to measure ground displacements at multiple times. As described in Figure 2, a classical approach [18,19,23] was used. First, a DEM was generated from stereoscopic images using the open source software Ames Stereo Pipeline [24] and the methodology described in a previous study [25] to get the DEMs after the major rupture events of July 2015. Due to monoscopic mode acquisitions, no DEMs could have been generated before July 2015. This is why we used available data from an airborne Light Detection And Ranging method (LiDAR), a DEM acquired in 2010 over the landslide area. The high-resolution of an airborne LiDAR provides a centimetric accuracy for vertical positions and a decametric accuracy for planimetric positions, depending on the field [26,27]. The Lidar was acquired with a planimetric resolution of 50 cm and the vegetation was filtered from the data. We combined the 2016 Pléiades DEM (covering the whole Pléiades area) and the 2010 LiDAR DEM (covering only an area around the landslide) to get a realistic topography over the whole area of study before the 2015 landslide rupture. We first corrected for the horizontal and vertical shifts between LiDAR and Pléiades DEM using the method from a previous study [28], before combining the two DEMs. The difference in morphology between 2010 and 2016 was estimated by subtracting the Lidar and the Pléiades once shifted.
Then, the Pléiades images were orthorectified with the Ames Stereo Pipeline using the Rational Polynomial Coefficient (RPC) provided by the satellites and the concomitant DEM. The 2012 and 2014 images were, therefore, orthorectified on the 2010 DEM, whereas the 2016 images were orthorectified using the 2016 Pléiades DEM. Thereafter, we estimated the ground displacements between successive images using the subpixel correlator developed in Cosi-corr [23]. We used a classical correlation window size of 32 pixels [19]. This rather large correlation window was adopted after a process of trial and error to reduce the noise and to cope with variations of the surface state [29]. We then corrected for the possible bias in the image orthorectification by subtracting the mean value of EW and NS displacement fields. Finally, to exclude noisy or aberrant values, displacement fields were then filtered [5,6,22,30]. Here, we considered two filter parameters. We masked pixels with Signal Noise Ratio (SNR) lower than 0.6 and with motion orientation not larger than 70° from the slope aspect. Parameters were chosen, after a sensitivity analysis, to filter the aberrant values or values that are not consistent with a gravitational motion. We finally got two displacement fields spanning the periods September 2012–September 2014 and July 2016–September 2016.

2.4. In-Situ Data

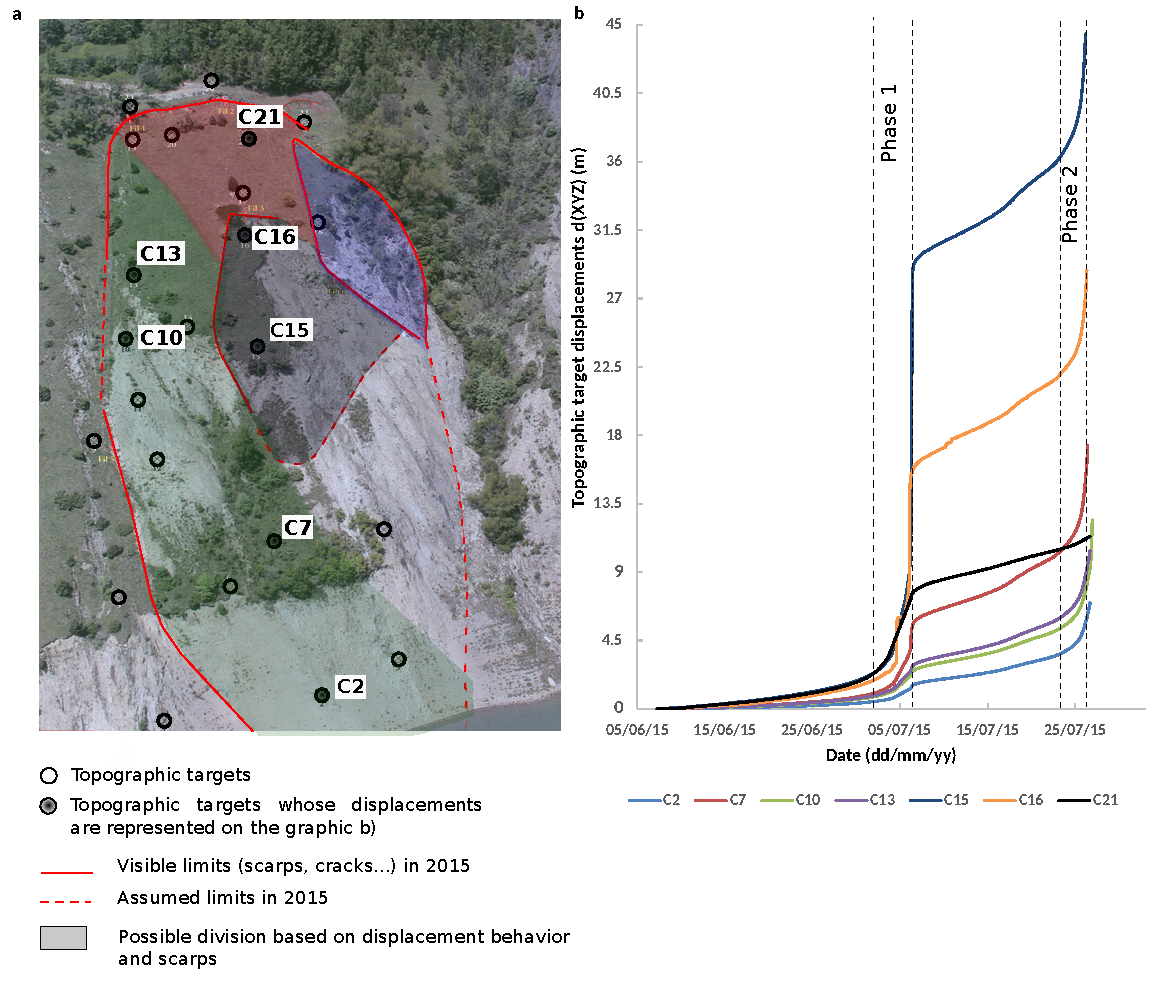
A network of 24 topographic targets was set up on the landslide area in June 2015 by the SAGE society (Figure 3a). Seven targets were located in stable areas around the movement and 17 on the unstable mass. Planimetric and altimetric displacements were regularly recorded thanks to an automatic theodolite placed in the southern side of the lake in front of the movement. The measurement frequency was 1.5 h with a precision of 2 mm, as estimated from the standard deviation calculated on targets located in the stable parts. After the main crisis in July 2015, most of the topographic targets disappeared or were destroyed. Therefore, a new network of 24 topographic points was installed with a measurement frequency of 6 h until early 2017.

3. Results

3.1. In Situ Landslide Motion

The topographic monitoring clearly reveals two different periods of landslide activity (Figure 3b). The first one until 6 July, where all topographic targets on the landslide present an accelerating pattern of motion. For instance, the most active target accelerates from 0.2 to 4 m/day from the July 4 to 6 July. This is followed by a quieter period, where velocities are reduced. Later, a second active period then occurs, from 25 July to 27 July, and most of the targets accelerate.
We identify three different areas based on the displacement behaviors: on the Eastside of the landslide, targets represented by C16 and C15 (black area on Figure 3a) undergo important displacements (d(XYZ) > 10 m) during the first crisis, whereas targets located on the Westside, which are represented by C13, C10, and C2, moved only by a few meters (d(XYZ) < 5 m). In the same period, the targets located at the top (C21) present displacements of between 5 and 10 m. The second crisis shows a more homogeneous displacement of the targets. This phase is induced by the elimination of the unstable masses, from the mentioned raised lake level. Yet, the targets situated at the top of the landslide (C21) present a constant and relatively low displacement during this second step. This corresponds to only a land subsidence at the top, whereas the rest of the terrain shows a global slide. The different areas were delimited based on both the visible and assumed scarps at the beginning of 2015 (Figure 3a): the green area, where displacements don’t exceed a few meters before the first phase; the black area, where displacements are more pronounced (d(XYZ) > 10 m before the first phase); and the red area, where displacements are also important but are not affected by the second phase. Additional to the three zones, the blue area collapsed during the first phase and could not be followed further, and the transparent area did not hold enough indicators for its behavior to be correctly resolved. The topographic measures were abandoned at the beginning of 2017, and the measures acquired during 2016 to 2017 only showed a slow activity (centimetric displacements per month), which was mainly located in the 2015 green area.

3.2. Satellite Images Processing Uncertainties

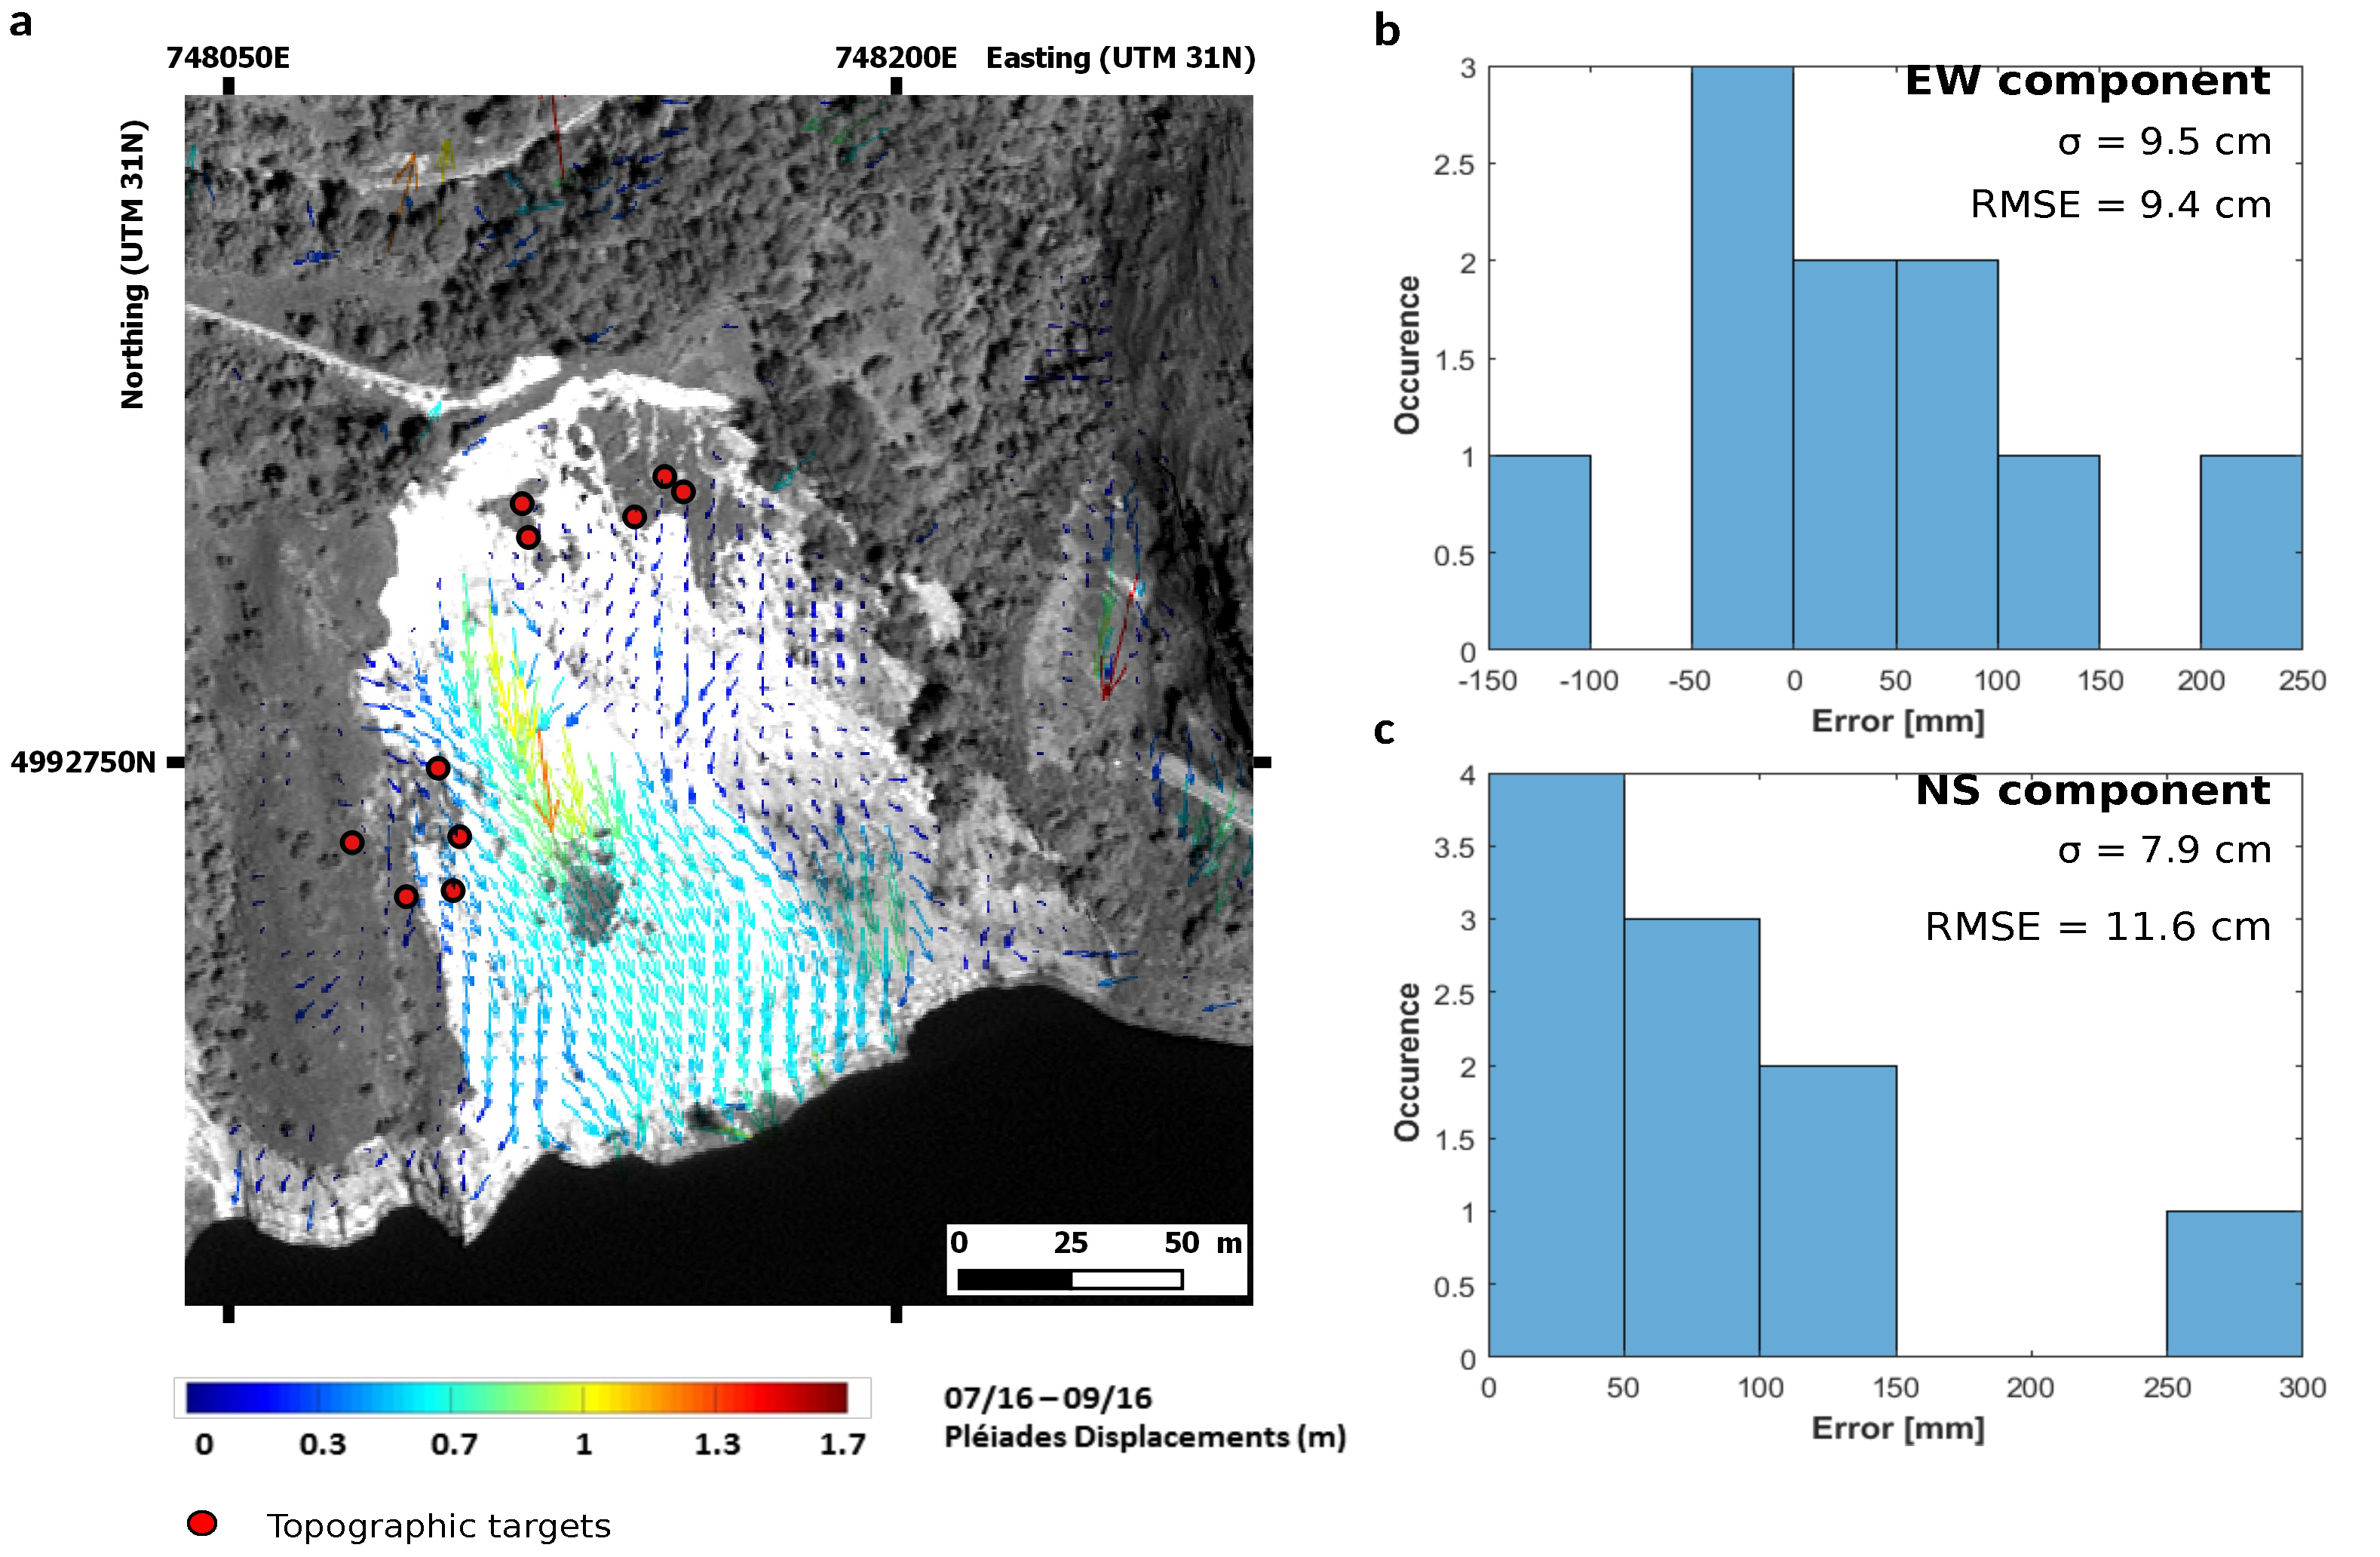
The uncertainty of the satellite image processing can be estimated by comparison with the theodolite measurements available in the period from July to September (covering the 2016 acquisition). Ten topographic targets distributed inside and around the landslide (Figure 4a) were selected from the 2016 network for comparison (Figure 4b). Only the targets whose displacements could be recorded without too many discontinuities were selected. The standard deviations of the distribution (difference of Pléiades and theodolite displacements) for the components EW and NS are, respectively, 9.5 cm and 7.9 cm.
The error distribution shows a root-mean-square-error (RMSE) of 9.4 cm in the EW component and of 11.6 cm in the NS component.
Unfortunately, no in situ data are available for the two acquisitions before the 2015 crisis. Therefore, we decided to also estimate the uncertainty on the displacement fields by analyzing the distribution of Pléiades displacements in the stable part of the images (the footprint shown in Figure 5). The standard deviation of the 2012–2014 displacement distribution is 11 cm for the EW component and 11 cm for the NS component (Figure 5a,b). As a comparison, the displacements detected by Pléiades between July and September 2016 display a standard deviation of 18 cm in the EW component and 18 cm in the NS component (Figure 5c,d). The differences of the acquisition parameters, such as the angle of incidence, or the difference of shadow between July and September, could explain the larger uncertainties in the 2016 displacement field. We can also notice that the uncertainty of the displacement distribution estimated on the stable area is slightly higher (×1.5 times higher) than the uncertainty calculated by comparison with the topographic targets for the 2016 displacement field. It is, however, on the same order of magnitude, so that we have used this number as an estimator of the uncertainty.

3.3. 2012–2014 Motions

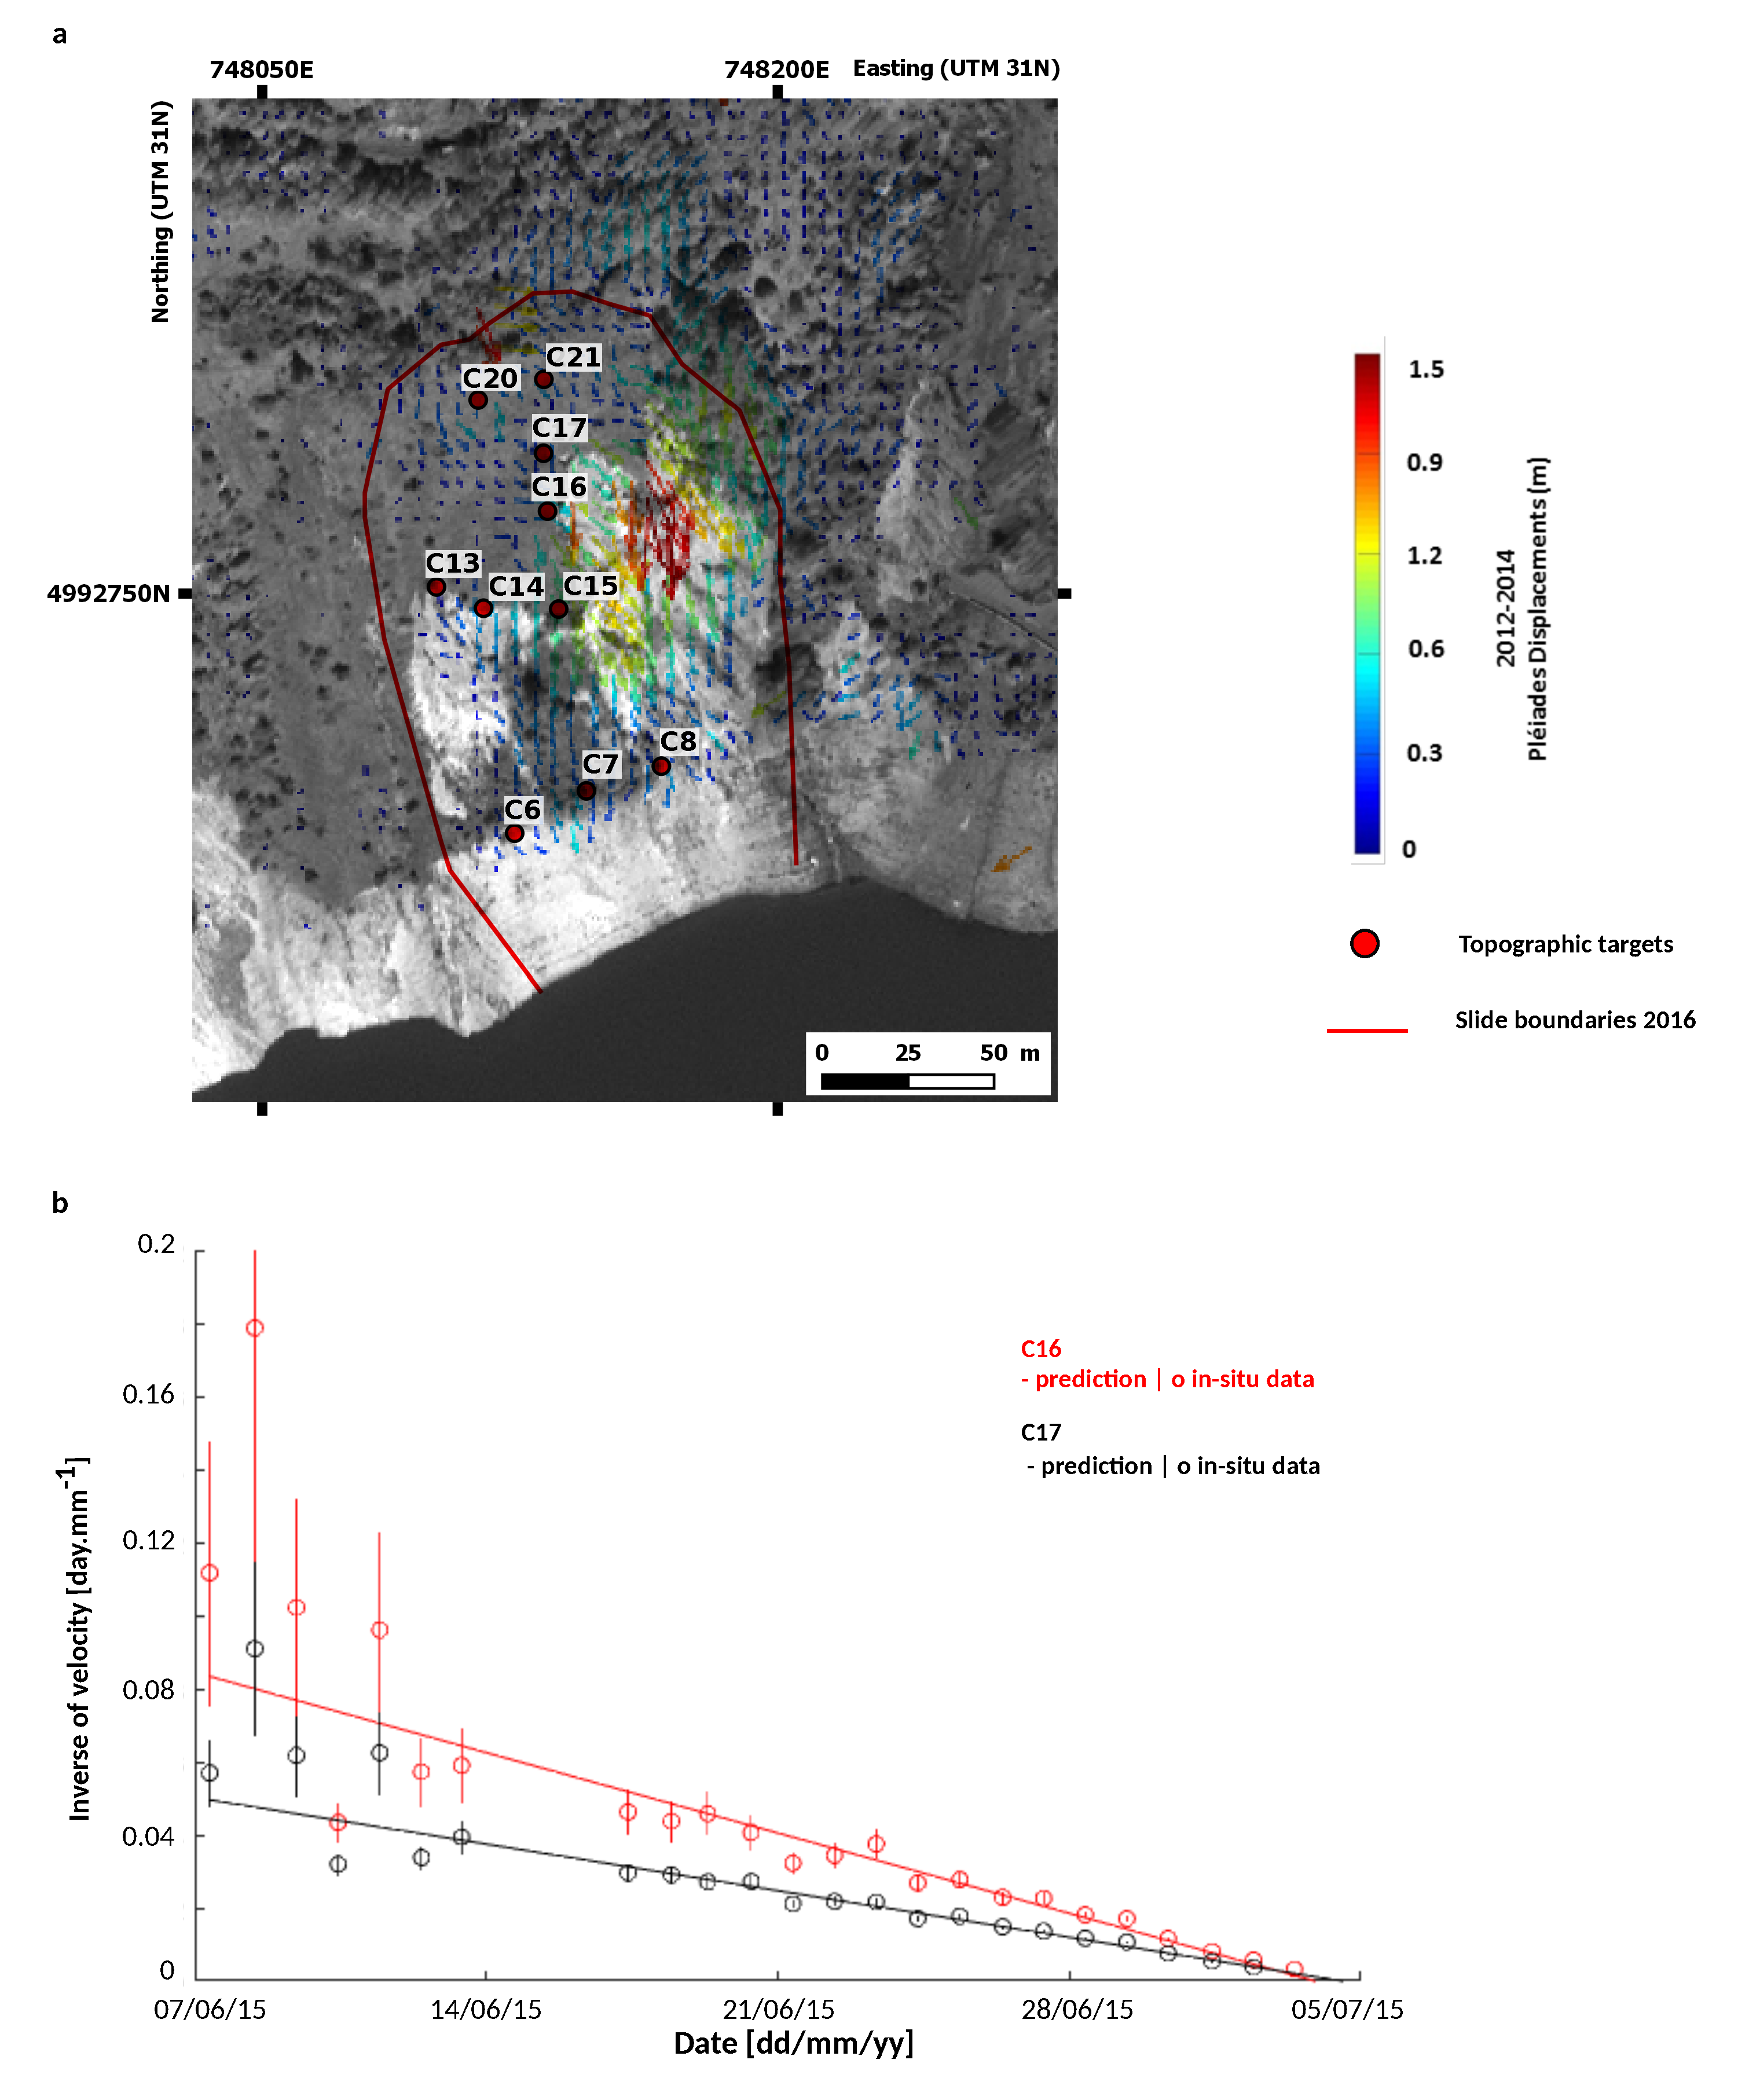
The correlation between the images prior to the crisis (from September 2012 to September 2014) clearly indicates significant motions over the landslide (Figure 6a). The maximum displacement detected on the landslide is 1.50 +/− 0.11 m. The western boundary is quite well visible compared to the eastern boundary. Some patches of motions are also detected in the displacement field outside of the landslide limits, despite the two filters applied, which are mostly northeast of the landslide. We assume those motions are related to vegetation effects and associated with shadow changes [19] or errors of orthorectification. Indeed, errors arise on areas where orthorectification of the 2012 and 2014 images were undertaken on the LiDAR Digital Terrain Model (DTM), which does not take the vegetation into account. This DTM, combined with difference of satellite acquisition angles, leads to difference of orthorectification of the vegetation. Conveniently, such errors do not arise on the actual landslide, due to the low vegetative cover there.

4. Discussion

4.1. Landslide Characterization

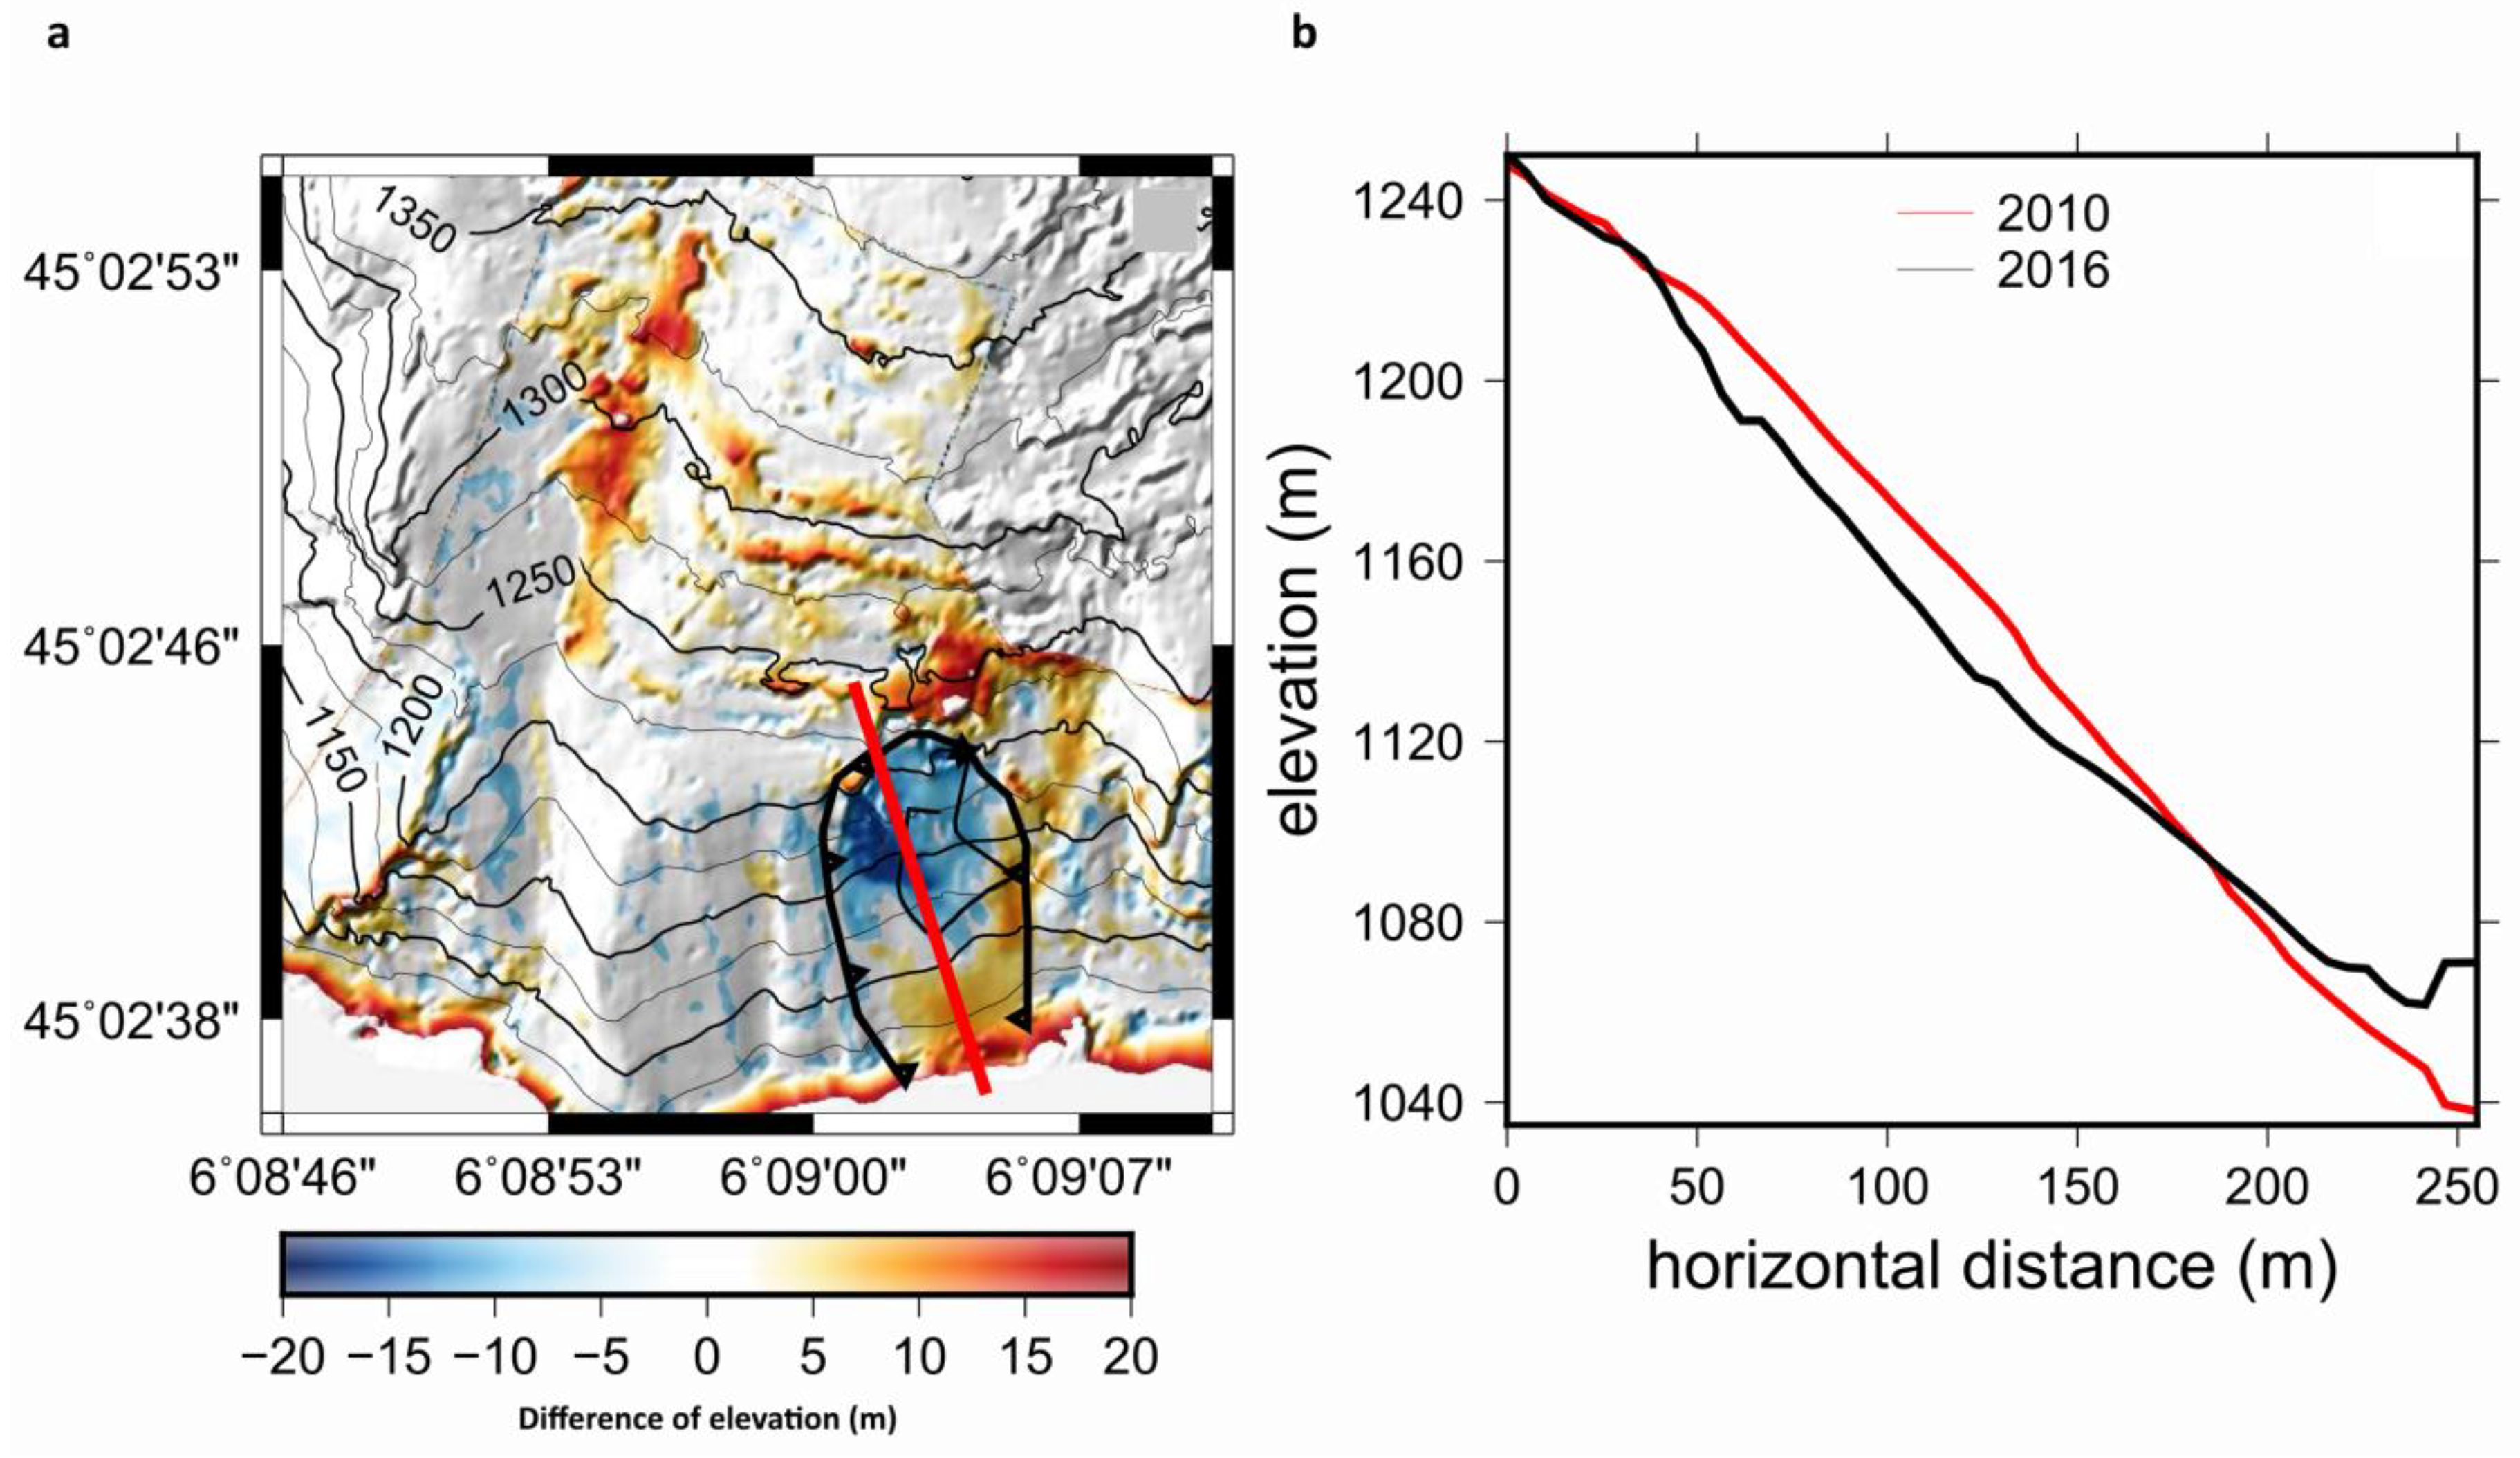
The motion of the topographic targets, which shows some subsidence at the top and a global slide along the slope, is consistent with a rotational movement. In addition, the difference in DEM from 2010 to 2016 clearly shows the development of the landslide head scarp at the top, and the bulging at the slope toe (Figure 7). The maximum altitude difference between both DEMs shows a 20 m erosion, close to the head scarp, and 15 m of accretion at its toe. The latter cannot be well estimated because of the lake level not being the same in 2010 and 2016. This indicates the landslide toe is situated under the lake level. The comparison shows that this landslide has a thickness of at least 20 m, which correspond to the thickness of rock damage inferred by geophysical investigations [20]. Around the study site, we have observed some positive variations of altitude that coincide with vegetation areas. Indeed, the 2010 Topography is a LiDAR DTM corrected from the vegetation, whereas the 2016 Topography generated with the Pléiades stereoscopic images is a Digital Surface Model (DSM). The DEM difference does not impact the measures in the study area because of the low vegetation (see Figure 7a).
The two phases observed in the theodolite targets reveal two different physical processes. The first one corresponds to the tertiary creep of the failure [11], whereas the second phase coincides with the variation of the lake level, as shown in a previous study [20].

4.2. Landslide Prediction

Concerning the landslide prediction, the motions observed in the month before the main failure (Figure 6a) display a classical pattern of acceleration versus time [31], which can be fitted by a linear function with time of 1/v [11]. The parameters of this linear fit (Equation (1)) calculated from norm L2 (least-squares), which are estimated over the last month for all available targets and situated in the landslide area, are given in Table 1.
d t 1 t 2 = 1 a × log ( a t 2   +   b a t 1   +   b ) ,
where   d t 1 t 2 , t 1 and t 2 , a , and b are, respectively, the theoretical displacement between 2012 and 2014, the interval time span, and the parameters of the linear function. In total, 10 targets were available during the complete period (Figure 6a). The RMSE associated with the linear fit is under 10−3 mm (Table 1), and all the fits agree with a main rupture occurring between 1 July and 5 July (Table 1). The linear approximation reproduces the whole dataset finely, given the uncertainty of the measurements (Figure 6b). Such acceleration of motion versus time is classically explained as the final stage of creep processes of brittle materials [32,33,34,35], corresponding to a landslide fault zone sufficiently matured to evolve toward the landslide collapse [36].
The motion of 1.50 +/− 0.11 m, measured with Pléiades for a period of 2.5 years before the failure, indicates a preparation of the landslide over several years. Thus, we can wonder whether those yearly motions are consistent with the short-term acceleration observed in the month before the failure. Therefore, we retroactively predict the displacement that should be observed during the 2012 to 2014 Pléiades period, using the laws of displacement versus time, inverted from the geodetic measurements in the month before the rupture. Results for 10 targets indicate a predicted motion between 3 and 117 cm over two years, (Table 1), which compares well with the Pléiades motions observed at these different points, given the Pléiades displacement field uncertainty. Indeed, differences between retroactive prediction and Pléiades displacement are between 2 and 40 +/− 11 cm. This comparison suggests that the landslide could have entered into tertiary creep for at least 2.5 years. This conclusion is of interest for the prediction of landslide ruptures from satellite data, had a time-series of images been available. In particular, it shows the importance of the very high-resolution required to detect slow motions on small areas with high accuracy.
Previous studies have focused on the detection of pre-failure motions using medium resolution optical satellites (Sentinel-2) with high frequency revisiting [6]. These datasets lead to metric motion uncertainties between 2 acquisitions. As the pre-failure motions are often smaller [11] and affect only small areas, the use of such medium resolution satellites is limited. Our study indicates the high value of high-resolution imagery to detect the slow movements related to landslide pre-failure. We clearly show that the area detected is small (and much smaller than the total mass that collapsed) and its ground motion is only detectable with VHR satellites. This case-study is, therefore, of importance for deriving operational tools for landslide detection.
However, the availability of datasets of very high-resolution images, limited by cloud coverage in mountainous areas, and the image acquisition policy restrict the use of these data to landslides with long time evolution. This limitation can be partially overpassed thanks to the use of high-frequency and the relatively high-resolution (3 m) of PlanetLabs images acquisitions. Moreover, the complexity of the landslide history, with different phases of rupture, shows that landslide failure prediction depends on the environmental forcing.

5. Conclusions

This study shows that the Chambon landslide is a deep landslide of 20-m thickness. It presents rotational movements and segmented areas of deformation, with at least three areas that evolved differently. Two different periods of strong activity are visible on the displacement curves from theodolite measurements. Those two periods are provoked by two distinct forcings. The first one seems to be the final stage of tertiary creep of a gravitational rupture, whereas the second is linked to anthropogenic massive purges caused by the lake level increase. The monitoring of the Chambon landslide with the Pléiades images and the comparison with in situ data shows its long history and seems to indicate that it entered into tertiary creep more than 2.5 years before its main failure in July 2015. This suggests that the fault zone was mature for several years.
We can finally continue from of previous studies [18,19] to point out the large interest of these high-resolution images to detect areas of instability. Furthermore, we show the high value of these satellites to anticipate the consequences of geological effects. Indeed, the detection of moving areas, even those small in size, can evolve toward large failures. High-resolution satellites are, therefore, major tools for pre-failure landslide detection purposes.
However, velocities at the rupture time can vary from 0.1 to 2000 cm/day [14]. The revisit time of image acquisitions is, therefore, a key parameter for the detection and the characterization of the tertiary creep. The limited acquisition frequency of the high-resolution images restrict their use for short-term evolution of landslides.
In the case of the Chambon landslide, the authorities decided to close the road within 3 weeks after the landslide detection, which did not help in planning other logistics solutions for transportation of workers, pupils, and tourists. An emergency road was constructed within 7 months after the road closure, which saved the valley from complete economic losses. These 7 months of road closure could, however, have been reduced by detecting this landslide earlier. Real opportunities to detect active landslides are arising, owing to the free access to high-resolution images on an annual basis over large territories. For instance, French institutions now provide annual coverage of the whole French territory with SPOT 6-7 data (System Pour l’Observation de la Terre satellites) at 1.5-m resolution.

Author Contributions

Conceptualization, P.L. and O.B.; data curation, M.D. and P.L.; formal analysis, M.D. and P.L.; investigation, P.L.; methodology, M.D. and P.L.; project administration, P.L.; resources, P.L. and O.B.; software, M.D.; supervision, P.L. and O.B.; validation, M.D., P.L., and O.B.; visualization, M.D. and P.L.; writing—original draft, M.D.; writing—review and editing, M.D. and P.L.

Funding

This research received no external funding.

Acknowledgments

Authors would like to gratefully acknowledge the SAGE society for providing theodolite measurements, as well as their expertise. We also thank the CNES (Centre National d’Etudes Spatiales) for sharing optical satellite images through the KALIDEOS project (kalideos.cnrs.fr).

Conflicts of Interest

The authors declare no conflict of interest.

References

  1. Panet, M.; Bonnard, C.; Lunardi, P.; Presbitero, M. Expertise Relative aux Risques D’éboulement du Versant des Ruines de Séchilienne; Collège D’experts, Ministère de l’Aménagement du Territoire et de l’Environnement: Grenoble, France, 2000. (In French) [Google Scholar]
  2. Bonnard, C.; Forlati, F.; Scavia, C. Identification and Mitigation of Large Landslide Risks in Europe: Advances in Risk Assessment; CRC Press: Boca Raton, FL, USA, 2014; ISBN 1-4822-8387-5. [Google Scholar]
  3. Durville, J.-L.; Bonnard, C.; Pothérat, P. The Séchilienne (France) landslide: A non-typical progressive failure implying major risks. J. Mt. Sci. 2011, 8, 117–123. [Google Scholar] [CrossRef]
  4. Hong, Y.; Adler, R.; Huffman, G. Use of satellite remote sensing data in the mapping of global landslide susceptibility. Nat. Hazards 2007, 43, 245–256. [Google Scholar] [CrossRef] [Green Version]
  5. Stumpf, A.; Malet, J.-P.; Delacourt, C. Correlation of satellite image time-series for the detection and monitoring of slow-moving landslides. Remote Sens. Environ. 2017, 189, 40–55. [Google Scholar] [CrossRef]
  6. Lacroix, P.; Bièvre, G.; Pathier, E.; Kniess, U.; Jongmans, D. Use of Sentinel-2 images for the detection of precursory motions before landslide failures. Remote Sens. Environ. 2018, 215, 507–516. [Google Scholar] [CrossRef]
  7. Hendron, A.J.; Patton, F.D. The Vaiont Slide. A Geotechnical Analysis Based on New Geologic Observations of the Failure Surface, Volume 1: Main Text; U.S. Army Corps of Engineers: Washington, DC, USA, 1985.
  8. Roberti, G.; Ward, B.; de Vries, B.V.W.; Friele, P.; Perotti, L.; Clague, J.J.; Giardino, M. Precursory slope distress prior to the 2010 Mount Meager landslide, British Columbia. Landslides 2018, 15, 637–647. [Google Scholar] [CrossRef]
  9. Siddle, H.; Moore, R.; Carey, J.; Petley, D. Pre-failure behaviour of slope materials and their significance in the progressive failure of landslides. In Landslides and Climate Change: Challenges and Solutions; Taylor & Francis Group: London, UK, 2007; pp. 207–215. [Google Scholar]
  10. Petley, D.N. The evolution of slope failures: Mechanisms of rupture propagation. Nat. Hazards Earth Syst. Sci. 2004, 4, 147–152. [Google Scholar] [CrossRef]
  11. Federico, A.; Popescu, M.; Elia, G.; Fidelibus, C.; Internò, G.; Murianni, A. Prediction of time to slope failure: A general framework. Environ. Earth Sci. 2012, 66, 245–256. [Google Scholar] [CrossRef]
  12. Intrieri, E.; Raspini, F.; Fumagalli, A.; Lu, P.; Del Conte, S.; Farina, P.; Allievi, J.; Ferretti, A.; Casagli, N. The Maoxian landslide as seen from space: Detecting precursors of failure with Sentinel-1 data. Landslides 2018, 15, 123–133. [Google Scholar] [CrossRef]
  13. Kos, A.; Amann, F.; Strozzi, T.; Delaloye, R.; Von Ruette, J.; Springman, S. Contemporary glacier retreat triggers a rapid landslide response, Great Aletsch Glacier, Switzerland. Geophys. Res. Lett. 2016, 43, 12,466–12,474. [Google Scholar] [CrossRef]
  14. Dong, J.; Zhang, L.; li, M.; Yu, Y.; Liao, M.; Gong, J.; Luo, H. Measuring precursory movements of the recent Xinmo landslide in Mao County, China with Sentinel-1 and ALOS-2 PALSAR-2 datasets. Landslides 2018, 15, 135–144. [Google Scholar] [CrossRef]
  15. Carlà, T.; Farina, P.; Intrieri, E.; Ketizmen, H.; Casagli, N. Integration of ground-based radar and satellite InSAR data for the analysis of an unexpected slope failure in an open-pit mine. Eng. Geol. 2018, 235, 39–52. [Google Scholar] [CrossRef]
  16. Ouyang, C.; Zhao, W.; An, H.; Zhou, S.; Wang, D.; Xu, Q.; Li, W.; Peng, D. Early identification and dynamic processes of ridge-top rockslides: Implications from the Su Village landslide in Suichang County, Zhejiang Province, China. Landslides 2019, 16, 799–813. [Google Scholar] [CrossRef]
  17. Moretto, S.; Bozzano, F.; Esposito, C.; Mazzanti, P.; Rocca, A. Assessment of Landslide Pre-Failure Monitoring and Forecasting Using Satellite SAR Interferometry. Geosciences 2017, 7, 36. [Google Scholar] [CrossRef]
  18. Stumpf, A.; Malet, J.-P.; Allemand, P.; Ulrich, P. Surface reconstruction and landslide displacement measurements with Pléiades satellite images. ISPRS J. Photogramm. Remote Sens. 2014, 95, 1–12. [Google Scholar] [CrossRef]
  19. Lacroix, P.; Berthier, E.; Maquerhua, E.T. Earthquake-driven acceleration of slow-moving landslides in the Colca valley, Peru, detected from Pléiades images. Remote Sens. Environ. 2015, 165, 148–158. [Google Scholar] [CrossRef]
  20. Mathy, A. Etude Géologique du Movement Rocheux Tunnel du Grand Chambon, RD1091 PR 46+467 à 47+219; Internal report of SAGE Society; SAGE Society: Gières, France, 2015; Unpublished. (In French) [Google Scholar]
  21. Lacroix, P.; Zavala, B.; Berthier, E.; Audin, L. Supervised Method of Landslide Inventory Using Panchromatic SPOT5 Images and Application to the Earthquake-Triggered Landslides of Pisco (Peru, 2007, Mw8.0). Remote Sens. 2013, 5, 2590–2616. [Google Scholar] [CrossRef] [Green Version]
  22. Berthier, E.; Vincent, C.; Magnusson, E.; Gunnlaugsson, Á.Þ.; Pitte, P.; Le Meur, E.; Masiokas, M.; Ruiz, L.; Palsson, F.; Belart, J.M.C.; et al. Glacier topography and elevation changes derived from Pléiades sub-meter stereo images. Cryosphere 2014, 8, 2275–2291. [Google Scholar] [CrossRef]
  23. Leprince, S.; Ayoub, F.; Barbot, S.; Avouac, J.-P. Automatic and Precise Orthorectification, Coregistration, and Subpixel Correlation of Satellite Images, Application to Ground Deformation Measurements. IEEE Trans. Geosci. Remote Sens. 2007, 45, 1529–1558. [Google Scholar] [CrossRef] [Green Version]
  24. Shean, D.E.; Alexandrov, O.; Moratto, Z.M.; Smith, B.E.; Joughin, I.R.; Porter, C.; Morin, P. An automated, open-source pipeline for mass production of digital elevation models (DEMs) from very-high-resolution commercial stereo satellite imagery. ISPRS J. Photogramm. Remote Sens. 2016, 116, 101–117. [Google Scholar] [CrossRef] [Green Version]
  25. Lacroix, P. Landslides triggered by the Gorkha earthquake in the Langtang valley, volumes and initiation processes. Earth Planets Space 2016, 68, 46. [Google Scholar] [CrossRef]
  26. Behan, A.; Maas, H.-G.; Vosselman, G. Steps towards quality improvement of airborne laser scanner data. In Proceedings of the 26th Annual Conference of the Remote Sensing Society, Leicester, UK, 12–14 September 2000. [Google Scholar]
  27. Rau, J.-Y.; Chang, K.; Shao, Y.-C.; Lau, C.-C. Semi-automatic shallow landslide detection by the integration of airborne imagery and laser scanning data. Nat. Hazards 2012, 61, 469–480. [Google Scholar] [CrossRef]
  28. Nuth, C.; Kääb, A. Co-registration and bias corrections of satellite elevation data sets for quantifying glacier thickness change. Cryosphere 2011, 5, 271–290. [Google Scholar] [CrossRef] [Green Version]
  29. Delacourt, C.; Allemand, P.; Casson, B.; Vadon, H. Velocity field of the “La Clapière” landslide measured by the correlation of aerial and QuickBird satellite images. Geophys. Res. Lett. 2004, 31. [Google Scholar] [CrossRef]
  30. Scherler, D.; Leprince, S.; Strecker, M.R. Glacier-surface velocities in alpine terrain from optical satellite imagery—Accuracy improvement and quality assessment. Remote Sens. Environ. 2008, 112, 3806–3819. [Google Scholar] [CrossRef]
  31. Saito, M. Forecasting time of slope failure by tertiary creep. In Proceedings of the Seventh International Conference on Soil Mechanics and Foundation Engineering, Mexico City, Mexico; 1969; pp. 677–683. [Google Scholar]
  32. Saito, M.; Uezawa, H. Failure of soil due to creep. In Proceedings of the 5th International Conference on Soil Mechanics and Foundation Engineering, Paris, France, 17–22 July 1961; pp. 315–318. [Google Scholar]
  33. Kennedy, B.A.; Niermeyer, K.E. Slope monitoring systems used in the prediction of a major slope failure at the Chuquicamata mine, Chili. In Planning of Open Pit Mines: Proceedings of the Symposium on the Theoretical Background to the Planning of Open Pit Mines, with Special Reference to Slope Stability; South African Institute of Mining and Metallurgy: Johannesburg, South Africa, 1970. [Google Scholar]
  34. Voight, B. A Relation to Describe Rate-Dependent Material Failure. Science 1989, 243, 200–203. [Google Scholar] [CrossRef] [PubMed] [Green Version]
  35. Heap, M.; Baud, P.; Meredith, P.; Vinciguerra, S.; Bell, A.; Main, I.; Meredith, P. Brittle creep in basalt and its application to time-dependent volcano deformation. Earth Planet. Sci. Lett. 2011, 307, 71–82. [Google Scholar] [CrossRef]
  36. Lacroix, P.; Amitrano, D. Long-term dynamics of rockslides and damage propagation inferred from mechanical modeling. J. Geophys. Res. Earth Surf. 2013, 118, 2292–2307. [Google Scholar] [CrossRef] [Green Version]
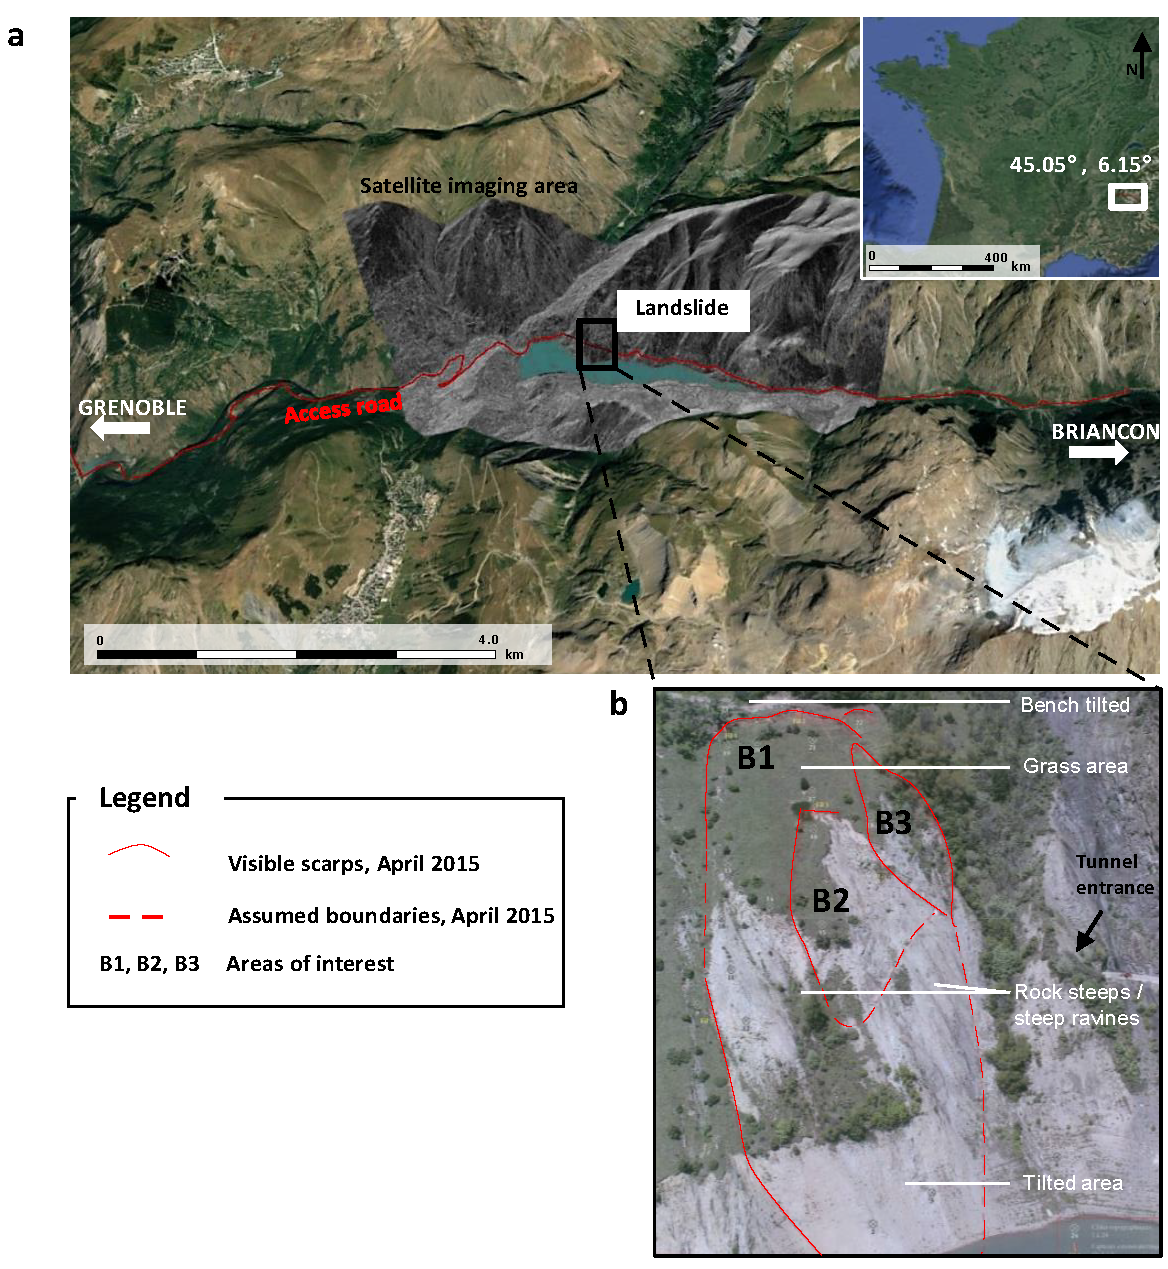
Figure 1. Landslide of the Tunnel du Chambon. (a) Area of study with its situation in France (source: Google Earth). The rectangular is the localization of the landslide. Shaded relief indicates the satellite imaging area used in this study. (b) Photography of the landslide [20].
Geosciences 09 00313 g001
Figure 2. Schematic workflow used to analyze VHR satellite images.
Geosciences 09 00313 g002
Figure 3. General behavior of the landslide during summer 2015. (a) Position of the topographic targets on a photograph [20]. Numerated targets are used in (b). (b) Displacements in meters of the selected topographic targets (filled circles in (a)). Phase 1 indicates the main rupture (4–6 July 2015), whereas phase 2 indicates the induced purge of the unstable masses (25–27 July 2015).
Geosciences 09 00313 g003
Figure 4. Comparison between the planimetric displacements originated from the correlation between July 2016 and September 2016 with the planimetric displacements recorded by the automatic theodolite. (a) Position of the topographic targets that are used for the comparison (orthoimage dating of July 19 2016). The displacement field is represented by arrows. Colors indicate the magnitude in meters. (b) Histogram for the EW component of the difference of the displacements from both methods. (c) Histogram for the NS component of the difference of the displacements from both methods.
Geosciences 09 00313 g004
Figure 5. Histograms of the displacement distributions for the EW component and the NS component calculated in a restricted area without taking into account the landslide part represented by the rectangular shape (e). (a,b) Histograms stem from the correlation between September 2012 and September 2014. (c,d) Histograms stem from the correlation between July 2016 and September 2016. Here, σ represents the standard deviation, and the red curve represents the Gaussian fit. (e) Zoom-in of the area of interest in which the calculation was performed.
Geosciences 09 00313 g005
Figure 6. Displacements preceding the failure. (a) Displacement field between September 2012 and September 2014. The arrows show its orientation and the color map indicates its amplitude in meters. The predicted time of slope failure is applied to 10 topographic targets with numeration represented by red circles. (b) Inverse of velocity versus time for targets C26 and C17, with the associated standard deviation. For these two targets, the rupture was predicted, respectively, on 3 July and 4 July 2015.
Geosciences 09 00313 g006
Figure 7. (a) DEM difference between the 2010 topography (LiDAR DTM) and the 2016 topography (DSM from the Pléiades stereoscopic images). (b) Topographic profile related to the red line (a).
Geosciences 09 00313 g007
Table 1. Prediction of time slope failure and comparison between the theoretical displacements and the Pléiades motion in mm. The RMSE is calculated from the difference between the theoretical displacements and the linear function fitting.
Topographic PointsPrediction of Time Slope FailureTheoretical Displacement (mm)Pléiades Motion (mm)RMSE Fitting (×10−3 mm)
C604/07/153432960.46
C704/07/155513550.039
C801/07/155364350.32
C1304/07/153272550.33
C1404/07/154544790.0057
C1504/07/1511677590.31
C1603/07/156303370.44
C1705/07/154772530.11
C2004/07/153213810.048
C2103/07/157214131.3