Abstract
The Antarctic Peninsula (AP) climate is characterized by a high degree of variability, which poses a problem when attempting to put modern change in the context of natural variation. Therefore, novel methods are required to disentangle sometimes conflicting climate records from the region. In recent years, the development of Antarctic moss-cellulose isotopes as a proxy for summer terrestrial growing conditions has become more widespread, with the isotopes Δ13C and δ18O reflecting moss productivity and peatbank moisture conditions, respectively. Here, we used a combined Δ13C and δ18O isotope analysis of moss Chorisodontium aciphyllum cellulose from a peatbank located on Litchfield Island in the western AP to document changes in climate over the last 1700 years. High Δ13C values (>15‰) indicate warm and productive conditions on Litchfield Island from 1600 to 1350 cal yr BP (350 to 600 AD) and over the last 100 years. The δ18O record shows two distinct intervals of dry conditions at 1350–1000 cal yr BP (600–950 AD) and at 500–0 cal yr BP (1450–1950 AD). Our record indicates that terrestrial ecosystems in the AP have responded to regional climate driven by atmospheric circulation, such as the southern annular mode (SAM) and, to a lesser extent, changes in ocean circulation.
1. Introduction
Rapid change in glaciers and ecosystems on the Antarctic Peninsula (AP) have been attributed to warming climate over the 20th century [1]. Despite an accelerated increase in atmospheric CO2, there has been a lack of warming trend across the AP over the last 20 years (Figure 1), indicating that recent warming in the AP region may be within natural variability [2,3,4]. The climate variability over the southern hemisphere in general, and the AP specifically, is characterized by strong regional and seasonal contrasts and a coupling of atmospheric, oceanic, sea-ice, and ice-sheet processes [5]. Therefore, understanding atmospheric and ocean circulation patterns can provide insight into what climate regimes operated over the AP in the past.
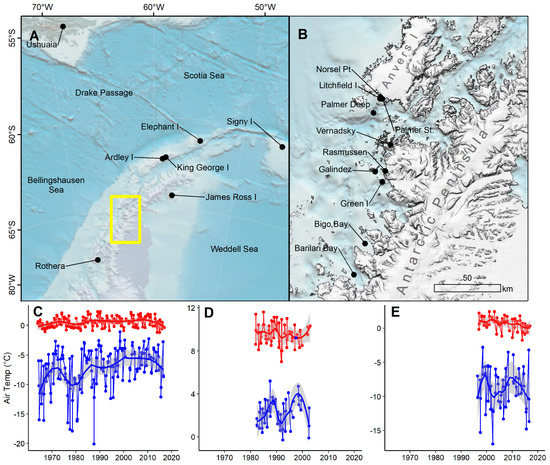
Figure 1.
Antarctic Peninsula (AP) regional map and climate data: (A) Locations mentioned in text for the maritime Antarctic region and southern South America (yellow box shown in panel B); (B) locations of climate and paleoclimate records in the western AP near our study site, Litchfield Island; (C–E) air temperature data for summer (red) and winter (blue) for (C) Vernadsky Station (UKR), (D) Ushuaia (ARG), and (E) and Rothera Station (GBR). All weather station data are from [11], bathymetry sourced from [12] and digital elevation model from [13].
Modern climate on the AP is driven by synoptic-scale patterns that fluctuate between two phases related to the southern annular mode (SAM). The low pressure over the Amundsen and Bellingshausen Sea (LAB) transports warm and moist air over the AP and is often associated with precipitation events in the AP [6]. In contrast, a low over the Drake Passage (LDP) is associated with bringing colder, drier climate from the pole to the AP. Reanalysis data for the period 1979–2018 shows that LAB occurrence increases with positive SAM, while LDP is negatively correlated with SAM [4]. However, during December, January, and February (DJF; the growing season for terrestrial ecosystems), positive SAM conditions are significantly correlated with cooling in the western AP [7]. Pollen and charcoal evidence from the Falkland Islands indicate that the contemporary synoptic conditions were established over the Drake Passage by 2500 cal yr BP [8]. As these climate systems are uniquely tied to the phase of the SAM, knowledge of the SAM phase during the past is important for interpretation of other southern hemisphere paleoclimate records. To date, the SAM has only been reconstructed for the past 1000 years, showing a peak in positive phase around 600 cal yr BP and a low around 450 cal yr BP before increasing in the last 100 years [9,10]. Surprisingly, modern observations are dominated by a positive phase of the SAM, so the 20th century warming trend may be anomalous in the context of the 1000-year SAM record.
Paleoclimate records from the AP have been derived from proxies archived in ice [14], marine sediments [15,16,17,18], and accumulations of peat [19,20,21,22,23]. Interestingly, opposite temperature trends have been noted on the western versus the eastern AP, which could be attributed to existence of an AP dipole [24]. However, terrestrial records of biological productivity from the western AP correlate well with the temperature record from James Ross Island (JRI), where there was pronounced cooling from 2500 to 600 cal yr BP, followed by warming since 600 cal yr BP [14,23], indicating that inconsistencies between records in the AP region could be due to differences in the dominant forcing (atmospheric versus ocean) of the proxy medium. For example, ocean temperatures are the dominant forcing of glacier retreat on the western AP [25], which could be a limiting factor of ice-free land area and the establishment of moss peatbanks in the region. In contrast with this, the biological productivity in established peatbanks will be driven by changes in atmospheric circulation [23] as peatbank moisture, temperature, and growing season length will be the most important factors influencing annual growth. Here, we provide a case study to show that terrestrial ecosystem records, such as those from moss peatbanks, could therefore be used to robustly record past patterns in ocean and atmospheric circulation affecting the western AP.
Chorisodontium aciphyllum Cellulose Isotopes
Peatbanks are accumulations of plant material that can form in the western AP, and in this region they are dominated by Polytrichum and Chorisodontium moss species [26]. This study focuses on Chorisodontium aciphyllum, a Dicranaceae endemic to Antarctica and Patagonia [27]. Compared with the other co-dominant moss species found in Antarctic peatbanks, i.e., Polytrichum strictum, C. aciphyllum possesses traits that indicate that it may be more sensitive to climate. For example, unlike P. strictum, C. aciphyllum lacks any pseudovascular tissues, so water for photosynthesis is attained from the leaf apices [28]. In addition, an experimental study that measured photosynthesis response under controlled conditions has found that the optimal growing temperatures for C. aciphyllum are 10–20 °C and that it has relatively low assimilation rates (5–7 µmol CO2 g−1 (DW) h−1) with light saturation reached at 500 µmol photons m−2 s−1 [29]. Also, that study showed that, after cessation of moisture saturation, C. aciphyllum dries relatively quickly (2–3 times more quickly than another moss species tested). C. aciphyllum is therefore a good candidate as a possible archive of terrestrial ecosystem isotope proxies as (1) it accumulates slowly but with regularity, (2) its water is sourced from precipitation, and (3) it is well adapted to Antarctic Peninsula climate, saturating and drying quickly, recording snapshots of climate over millennia.
We use stable isotopes to interpret paleoenvironment (for a review, see [30,31]). The δ18O in moss cellulose has been shown to reflect the isotopic composition of precipitation and therefore an archive of climate [30]. However, other factors can affect the oxygen isotope ratio of the cellulose, including evaporative enrichment, water vapor isotopic exchange, fractionation during cellulose synthesis, exchangeable organic molecules, and the time lag between precipitation events and when cellulose is synthesized. It has been established that C. aciphyllum moss can have greater isotopic enrichment than the 27 ± 3‰ biochemical fractionation factor [32] (but see [33]), suggesting that there is evaporative enrichment (up to 5‰) in leaf apices prior to cellulose synthesis [34]. For comparison, there is a greater degree of evaporative enrichment found in mosses than open water due to the greater surface area of moss leaves [35,36]. While this enrichment can be a result of microclimate [31], measurements down-core from an individual peatbank will be representative of the effective surface moisture (precipitation minus evaporation) of the peatbank during the season of plant production. High values of δ18OC therefore reflect periods of strong evaporative enrichment [34,37]. Precipitation in the AP region (Figure 2) can vary seasonally, with the highest δ18O values during DJF. Measurements of precipitation at the nearest Global Network of Isotopes in Precipitation (GNIP) station to our study site (Figure 2C) showed δ18O values to be between −5‰ and −10‰ for the time period 1964 to 2016 AD [11]. Assuming a fractionation of 27‰, δ18O values between 14‰ and 25‰ can be expected if there is no evaporative enrichment.
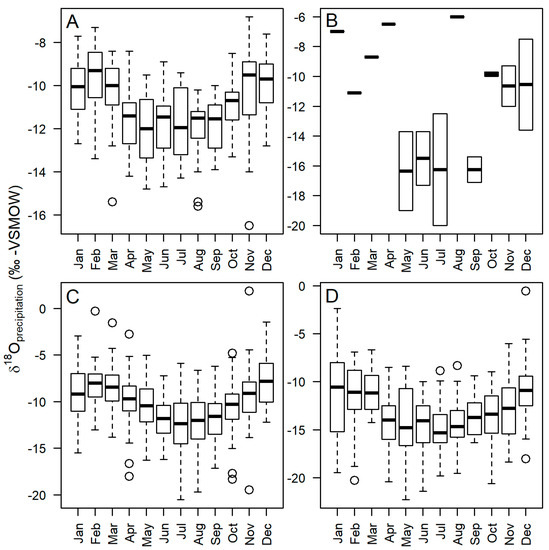
Figure 2.
Stable isotope (δ18O) measurements from the Global Network of Isotopes in Precipitation (GNIP) showing the seasonal variability in precipitations at stations north to south in the AP region: (A) Ushuaia (ARG); (B) King George Island; (C) Vernadsky Station (UKR), the closest to our study site; (D) and Rothera Station (GBR) [11].
The δ13C of moss cellulose provides a direct proxy for bioavailable water, allowing reconstructions of moisture for coastal Antarctica [38], and has been used to reflect moisture condition in mosses and peat deposits [30,31,39]. The δ13C of plant tissue represents the biochemical fractionation (up to 29‰) of the carboxylase enzyme RuBisCO in C3 plants [40]. This will discriminate against carbon-13, the extent of which is the Δ13C, and is calculated using the following equation [41]:
where Δ13C is the source-independent photosynthetic carbon isotope discrimination; δ13Ca is the atmospheric CO2; and δ13Cp is plant material, in this case cellulose. It is proposed that, for C. aciphyllum, discrimination is dominated by resistance to CO2 diffusion by external water layers, thus representative of peatbank moisture conditions at the time of photosynthesis [20,29,30]. As δ13C is a record of photosynthetic conditions, there is a greater amount of discrimination against 13C (higher Δ13C) under optimal conditions and a lower amount of discrimination (lower Δ13C) when photosynthesizing under suboptimal conditions [31]. It has been suggested that the dominant environmental factor influencing Δ13C is dryness, with Δ13C increasing as the moss approaches optimal dry conditions [30,31].
Although both δ18O and Δ13C should positively correlate with evaporation, a lack of correlation between these two isotopes has been observed in Antarctic moss. For example, Royles et al. [31] showed that there was a significantly lower δ13C (greater amount of discrimination) on higher-elevation peatbanks on Elephant Island compared with the more protected Norsel Point. This was interpreted as representative of greater dryness on Elephant Island due to more wind and evaporation. In contrast, the δ18O record showed no indication of increased evaporative enrichment on Elephant Island when compared with Norsel Point. Additionally, there did not appear to be a correlation between δ18O and Δ13C in a synthesis of Chorisodontium aciphyllum surface samples [30]. This disconnect has been explained due to differences in timing and moisture from when a moss is photosynthesizing (processes related to carbon discrimination) to when those molecules are biosynthesized into cellulose (processes related to δ18O equilibration). Over millennial timescales, however, we propose that analysis of stable isotopes will show an integrated mass balance of decades of moss growth, and the dominant climate signal will be robust and informative.
The objective of this study was to derive a late Holocene record of Δ13C and δ18O from a moss peatbank to better understand the moisture and productivity variability over centennial timescales. We then attempted to put our 1700-year-long AP peatbank record in the context of regional marine-core, terrestrial ecosystem, and ice-core records of climate change.
2. Methods
Cellulose Isotope Analysis
We extracted core LIT-4 from Litchfield Island 64°46’12.9” S, 64°5’20.1” W (−64.770, −64.089) in 2014, and the core was kept frozen until subsampling of moss material for cellulose extraction (see [42] for core and study site description). We selected samples of whole plant Chorisodontium aciphyllum from macrofossil samples at 1-cm intervals under a stereomicroscope, and we cleaned the whole plant samples with deionized water. We followed the procedure for extracting cellulose using the alkaline bleaching method [43]; however, we used the modified procedure for more fragile Antarctic moss samples [31]. Samples were transferred to polypropylene columns (Poly-Prep) and then given 2 rounds of 50 min each in 1.4% (w/v) sodium chlorite bleaching acidified with glacial acetic acid in a hot water bath at 80 °C, rinsing with deionized water in between. Then, they were reacted with 10% (w/v) sodium hydroxide at 75 °C for 30 min, followed by a final round of bleaching. The cellulose samples were rinsed using distilled deionized water and transferred to small vials. Afterward, they were homogenized using an ultrasonic probe and freeze dried.
For oxygen and carbon isotope analysis, ~0.4 mg (n = 63) and ~1.1 mg (n = 58) cellulose materials were enclosed in silver and tin capsules, respectively. There were some core intervals where no analysis was possible due to limited suitable sample material, resulting in slightly more oxygen isotope samples. Oxygen isotope compositions were determined on an Elementar PyroCube interfaced to an Isoprime VisION isotope-ratio mass spectrometer (IRMS). Carbon isotope compositions were determined on a PDZ Europa ANCA-GSL elemental analyzer interfaced to a PDZ Europa 20-20 IRMS. Both isotope analyses were carried out at the Stable Isotope Facility of University of California, Davis. Isotope results were calibrated with lab standards and reported as δ notation (in per mille) referenced to VSMOW (Vienna Standard Mean Ocean Water) for δ18O and VPDB (Vienna Pee Dee Belemnite) for δ13C. The laboratory analytical precision is reported as 0.3‰ for δ18O and 0.2‰ for δ13C. We calculated anomalies from the mean of the entire 1700-year record (250 to 2014 AD) for δ18O and Δ13C from smoothed 50-year increments. Statistics were run using R programming language version 3.5.1 [44].
3. Results
3.1. Carbon Isotope Results
All stable isotope results can be found in Supplementary Table S1. According to the age–depth model [42], the record of δ13C from core LIT-4 on Litchfield Island extended from 1600 cal yr BP (350 AD) to −64 cal yr BP (2014 AD), with temporal resolution of 27 ± 13 years. The δ13C values (Figure 3A) ranged from −23.5‰ to −19.1‰ with a median of −20.7 ± 1.1‰ (SD). These values are similar to, but slightly more positive than, C. aciphyllum samples from Norsel Point (median −22.5‰) or Green Island (median −23‰) [31]. Over the last 1700 years, atmospheric CO2 shifted from −6.5‰ to −8‰ [45] (Figure 3B), yielding Δ13C values (using Equation (1)) that ranged from 12.9‰ to 16.8‰ with a median of 14.4 ± 1‰ SD (Figure 3C). The values from core LIT-4 are in line with other measurements of C. aciphyllum from the region, such as on Signy Island, where Δ13C values were found to range from 14‰ to 16.5‰ [20,30]. We then calculated Δ13C anomalies at 50-year intervals (Figure 3D), which showed that C. aciphyllum on Litchfield Island was characterized by generally low discrimination for long periods of time. The record of Δ13C anomaly was mostly positive from 1600 to 1350 cal yr BP. This was followed by a shift to negative anomaly, reaching the lowest Δ13C value in the core of 12.9‰ at ca. 1150 cal yr BP. Then, there was a shift toward slightly positive anomaly by 1000 cal yr BP, before dropping again to a long negative anomaly that persisted from 850 to ca. 50 cal yr BP. However, during this long negative anomaly, there were sporadic positive peaks in Δ13C. From 50 cal yr BP to 2014 AD, there was a positive anomaly, with Δ13C values of ca. 15–16‰.
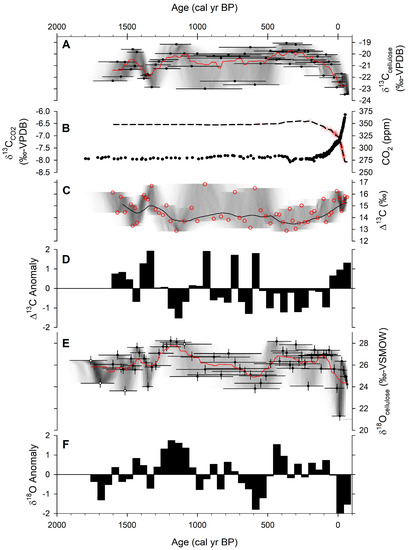
Figure 3.
Stable isotope results for peatbank core LIT-4 from Litchfield Island: (A) δ13Ccellulose from C. aciphyllum with age uncertainty (shading); (B) ice-core measurements of atmospheric δ13CCO2 (red), smoothed curve (black dashed line), and CO2 concentration (black) [45]; (C) Δ13C for C. aciphyllum moss from core LIT-4 (see equation (1)) with age uncertainty (shading); (D) resampled 50-year intervals and calculated anomaly of Δ13C; (E) δ18Ocellulose from C. aciphyllum (samples smaller than the smallest reference noted in white) with age uncertainty (shading); (F) resampled 50-year intervals and calculated anomaly of δ18Ocellulose.
3.2. Oxygen Isotope Results
Our record of δ18O from core LIT-4 began from 1780 cal yr BP, with only slightly lower temporal resolution of 30 ± 23 years. The δ18O values ranged from 21.3‰ to 28.2‰ with a median of 26.2 ± 1.2‰ (Figure 3E). The median values are in line with other studies from the region, such as 26–30‰ on Signy Island [30] and 26–28‰ on Norsel Point [31]. Furthermore, Green Island (southeast of our study site) had a value of 22‰. These values are likely within the context of natural variability, as δ18O of precipitation can vary by 4–6‰ between these locations (Figure 2). We also calculated anomalies for the δ18O record (Figure 3F), and this showed a robust pattern of multi-centennial-scale fluctuations. From 1750 to 1500 cal yr BP, there was generally a negative δ18O anomaly, followed by a shift to positive anomaly by 1450–1350 cal yr BP. Then, a 350-year positive anomaly persisted from ca. 1350 to 1000 cal yr BP, during which the highest value of δ18O in the core of 28.2‰ was reached at ca. 1200 cal yr BP. This was followed by a period of negative δ18O anomaly down to two standard deviations from the mean at ca. 600 cal yr BP. A slightly positive δ18O anomaly characterized the period from 500 to 0 cal yr BP. From 1950 AD to 2014 AD, a negative anomaly persisted, with the lowest value in the core of 21.3‰ occurring at ca. 1960 AD.
4. Discussion
4.1. Interpretations of Isotope Records in Moss Peatbanks
There was a statistically significant negative correlation between Δ13C and δ18O for the paired down-core samples from core LIT-4 (Pearson correlation p < 0.01, r = −0.39; Figure 4). Additionally, the resampled 50-year anomaly highlighted this relationship, with positive anomalies of δ18O corresponding to negative anomalies in Δ13C. This means that, for samples where there was a high degree of discrimination (high Δ13C) and photosynthesis was likely occurring under optimal conditions, there was lower evaporative enrichment (low δ18O) and vice versa.
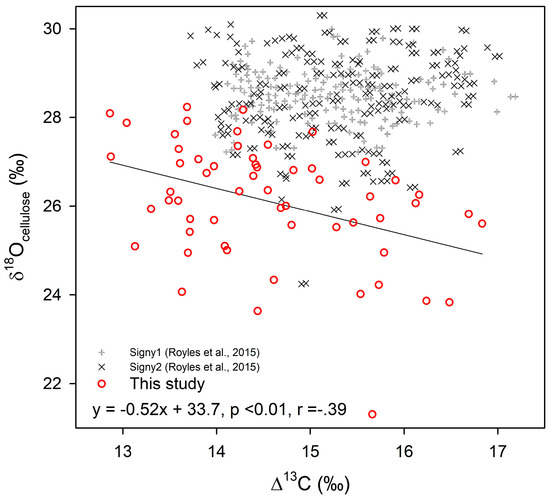
Figure 4.
Correlation of δ18O vs. Δ13C from moss C. aciphyllum cellulose of peatbank core samples from Litchfield Island, Antarctica, compared with results from Signy Island [30]. There was a significant negative relationship (p < 0.01, r = −0.39) for our results.
This observed trend is counter to other studies of both isotopes in C. aciphyllum moss [30]. An experimental study of carbon isotope discrimination indicated that Δ13C is low (15–20‰) immediately after saturation to 1100% relative water content (RWC), but upon drying to 800% RWC, Δ13C increases (to >20‰) before drastically decreasing to <10‰ as the moss continues to dry at 400% RWC [29]. When considering how these instantaneous responses would be recorded over decades, these values act as end-members of the stable isotope mass balance, integrating stems from individual moss plants that may have had slightly different microtopographic exposure to wind, precipitation, canopy shade, and growth rates [29]. Furthermore, as C. aciphyllum moss dries rapidly after cessation of moisture input, it is unlikely that the moss spent much time at the optimal moisture for the greatest amount of discrimination. Therefore, for the LIT-4 peat core record, we propose that, during intervals where there were low values of Δ13C (<15‰), a greater amount of carbon was fixed under extremely dry conditions (approaching 400% RWC). On the other hand, where there were high Δ13C values (>15‰), a greater amount of carbon was fixed under semisaturated or optimal moisture conditions. Overall, the peatbank mosses photosynthesized in extremely dry conditions throughout the last 1700 years, except during the last 250 years and prior to 1350 cal yr BP. These results indicate that, over the course of peatbank accumulation, photosynthesis generally occurred under less than optimal conditions.
The majority of δ18O values in core LIT-4 were between 26‰ and 28‰, suggesting that evaporative enrichment in leaf apices is a persistent process affecting C. aciphyllum at this location through time. Our interpretation of the δ18O record indicates a 5‰ enrichment due to evaporation in peatbanks, in addition to 27 ± 3‰ fractionation that occurs during biosynthesis of cellulose [32,33,34]. Currently, precipitation near Litchfield Island likely has δ18O values between −5‰ and −10‰ (Figure 2; [11]), while moss water has values between −5‰ and −15‰ [31]. We would therefore expect that, without evaporative enrichment, moss cellulose values should range from a theoretical minimum of 9‰ up to 25‰. The pattern of δ18O variations show multi-centennial-scale variability, with four major shifts in peatbank wetness occurring over the last 1700 years. Two major phases of increased evaporative enrichment stood out at 1350–1000 cal yr BP and at 500–0 cal yr BP.
4.2. Wet and Warm Period at 1750–1350 cal yr BP (200–600 AD)
The δ18O record from core LIT-4 on Litchfield Island began with generally negative anomaly, except a minor drying interval around 1400 cal yr BP, indicating less isotopic enrichment corresponding to wet conditions. In general, Δ13C was positive with an exception around 1450 cal yr BP. Our Δ13C anomaly, mostly above 15‰, indicates that peatbank conditions were warm and wet, supporting high productivity that is similar to modern climate. Similarly, the temperature anomaly at James Ross Island had near-modern temperatures prior to 1400 cal yr BP [14] (Figure 5F). Other proxies from terrestrial records support this interpretation, including the increase in peat carbon accumulation and high biological activity [19,23,42]. There was up to 6 °C warmer conditions evidenced by the record of a Deschampsia bog peat found at 65°S near Cape Rasmussen [21]. This would be best explained by a climate system where warm, moist air was delivered to the AP, and it is likely that a low-pressure system over the Amundsen–Bellingshausen Seas had been dominant during this time [4].
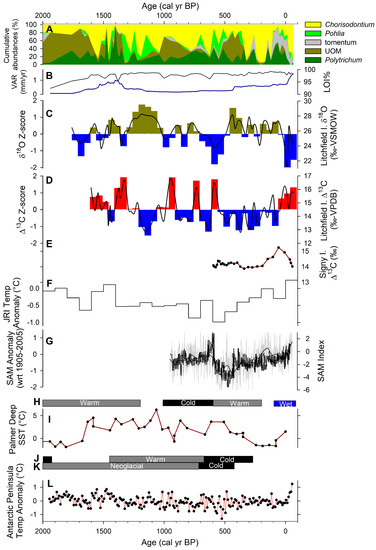
Figure 5.
Comparison of paleoclimate proxy records from Litchfield Island and other records near the AP: (A) core LIT-4 macrofossil relative abundance [42]; (B) core LIT-4 loss-on-ignition at 550 °C (black) and vertical accumulation rate (VAR; blue) [42]; (C) δ18Ocellulose for C. aciphyllum from core LIT-4 (black) and 50-year anomaly (brown/blue bars); (D) Δ13C for C. aciphyllum from core LIT-4 (black) and 50-year anomaly (red/blue bars); (E) Signy Island peatbank Δ13C [29]; (F) ice-core record of temperature anomaly from James Ross Island (JRI) [14]; (G) southern annular mode (SAM) index from [9] (grey) and [10] (black); (H) moss peatbank synthesis interpretations for the AP region [21]; (I) sea surface temperature (SST) from Palmer Deep [16]; (J) marine core interpretation from Barilari Bay [17]; (K) marine core interpretation from Bigo Bay [18]; (L) AP temperature anomaly [46].
At 1400 cal yr BP, the δ18O and Δ13C record were strongly anticorrelated, indicating that the climate was possibly too warm and that increased drying, thereby inhibiting productivity. This observation is also supported by drier Polytrichum that dominates along with increased unidentified organic material (UOM) [42]. This drop in C. aciphyllum productivity (low Δ13C), increased dryness (high δ18O), dominance of dry Polytrichum moss, and increased UOM were anomalous during this generally warm and wet productive period (Figure 5A).
When comparing this to the marine sediment record, the sea surface temperature (SST) at Palmer Deep increased 4–5 °C around 1600 cal yr BP [16], and although sea ice was increasing, there was seasonally open marine conditions in Barilari Bay [17]. The combination of warm and wet weather driven by atmospheric circulation with warm surface ocean likely created the optimal environment for terrestrial ecosystems to flourish. Furthermore, the Antarctic Peninsula temperature anomaly record from an ice-core synthesis show a peak at 1600–1400 cal yr BP [46]. Glaciers were retreating on South Georgia Island at that time, suggesting warming beyond the eastern AP [47]. There is robust evidence that this wet and warm climate was widespread in the Southern Hemisphere (Figure 5).
4.3. Cold and Dry Period at 1350–1100 cal yr BP (600–850 AD)
The isotopic evidence for this period indicates that conditions were suboptimal for productivity, with maximum evaporation. The Δ13C values were low (<15‰), reflecting that the conditions were less optimal, possibly a shortened growing season due to cold conditions. The lowest Δ13C value of 12.9‰ at 1150 cal yr BP indicates that a large proportion of carbon was fixed near total desiccation, prior to the point where net assimilation had ceased. The δ18O record was characterized by a positive anomaly, implying an extended period of evaporative enrichment due to prevalent dry peatbank conditions.
Regionally, biological productivity was in a decline during this period [23]. Furthermore, there was a hiatus in the record of Deschampsia peat deposition; therefore, it was disturbed sometime after 1200 cal yr BP, although it was attributed to a cool interval that might have begun much later [21]. In core LIT-4, there was a low peat accumulation rate (<0.3 mm/yr) and well-preserved moss macrofossils, with a low amount of UOM (Figure 5A) [42]. Low accumulation with a low degree of decomposition would be expected under cold, as opposed to warm, conditions. These trends are consistent with increased occurrence of low pressure over the Drake Passage, where southerly winds bring cold and dry continental air mass to the AP [4]. Furthermore, to the north on South Georgia, there is evidence of glacier advance over this time [47], suggesting that atmospheric circulation is primarily driving this cold period as the evidence exists on both sides of the Drake Passage.
In contrast, the record of Palmer Deep shows that SST were at modern temperatures, if not slightly higher [16]. Likewise, the ocean further south was warm during that time period [17,18]. The low moss productivity and increased evaporative enrichment indicates that regional atmospheric systems may have a greater influence on peatbank productivity and may be decoupled from trends in SST.
4.4. Brief Warming Interlude at 1100–900 cal yr BP (850–1050 AD)
The Δ13C isotope record shows a shift to optimal, likely warm, conditions at 1100–900 cal yr BP. Corresponding to this, the δ18O had a negative anomaly, reflecting that there was less evaporative enrichment and possibly increased precipitation. The macrofossil evidence shows an increase in UOM from 1000 to 800 cal yr BP [42], indicating increased decomposition during this time, while the lowest accumulation rate was observed (0.3 mm/yr). The Δ13C evidence points to optimal conditions for productivity, so this low vertical accumulation rate was likely due to a greater amount of decomposition over production. Additionally, there were also several peatbanks with basal ages found at this time in the region, near Cape Rasmussen, Cierva Point, and on other slopes of Litchfield Island [21,42], suggesting that, in general, this time was marked by moss peatbank expansion. Regionally, there was a positive temperature anomaly [46]. Furthermore, a warm shift was indicated at 1000–900 cal yr BP on South Georgia [47] (Figure 5), suggesting that atmospheric circulation at this period might have been dominated by the LAB.
The marine record over this time period supports a brief warm interlude, with SST at Palmer Deep reaching a peak of 5 °C near 1100 cal yr BP [16]. There was a warm ocean south of our study site, and although sea ice coverage had been increasing since 2800 cal yr BP, seasonally open marine conditions persisted in Barilari Bay until 730 cal yr BP [17]. This supports the hypothesis whereby warm oceans prompt deglaciation and possibly expedite the freeing up of new land area for moss peatbank colonization.
4.5. Cold and Wet Period at 900–500 cal yr BP (1050–1450 AD)
The Litchfield Island moss Δ13C values were generally low with sporadic increases, while the δ18O show a mostly wet phase during this time period, with the lowest δ18O reaching at approximately 600–550 cal yr BP. We caution against over-interpretations of the timing of these sporadic peaks due to dating uncertainty at 1000–500 cal yr BP in core LIT-4 (see grey shading in Figure 3). Regionally, moss kill ages and a lack of peatbank basal dates suggest that glaciers were expanding at this time [21,48], supporting the interpretation of cold conditions and possibly increased precipitation. Regionally, the lowest biological productivity was from 700 to 400 cal yr BP [23]. The relative lack of UOM suggests that the low amount of peat accumulation was due to lack of productivity [42]. The SAM was in a negative phase during this period, indicating that a LDP dominated the climate system [9].
There was a noted drop in SST of up to 6 °C [16], and both Barilari Bay [17] and Bigo Bay [18] showed a cold period at around 700 cal yr BP. There is evidence of glacier advance on South Georgia at 450 ± 200 cal yr BP [47], although van der Bilt et al. [49] found glacier minimum ca. 550 with the Little Ice Age (LIA) occurring later at 300 cal yr BP.
All these lines of evidence reflect regional-scale climate shift. Regionally, this could be an expression of the LIA in the Antarctic Peninsula. These records indicate that this widespread phenomenon occurs when ocean and atmospheric circulation work in conjunction to bring cold climate and low SST to the western AP (Figure 5).
4.6. Warm and Dry Period at 500–0 cal yr BP (1450–1950 AD)
A generally low Δ13C anomaly was found during this interval, indicating a lack of productive conditions from 500 to 0 cal yr BP. This corresponds to a similar change on Signy Island, where generally low discrimination was seen for this period [28,29]. The δ18O record from core LIT-4 supports an extended dry period, with isotopic enrichment reaching its highest value around 450 cal yr BP. Despite isotopic evidence for unproductive conditions, there was a doubling of vertical accumulation rate at this time (from 0.3 to 0.6 mm/yr) (Figure 5B) as well as a peak in UOM at 500 cal yr BP and increased abundance in dry Polytrichum moss species [42]. Regionally, there is evidence that productivity in peatbanks of the AP began a slow recovery at 1850 AD [23]. At ca. 500 cal yr BP, there was the highest frequency of peatbank initiation, and this occurred after cold conditions indicated by moss peatbank kill ages [21]. Additionally, the ice-core record at JRI shows that −1 °C anomaly at 600–500 cal yr BP was followed by a consistent rise in temperatures [14] (Figure 5F). These factors together indicate that warm dry conditions persisted, so there might have been a longer growing season due to warming, the insolation heating affecting the peatbank by drying and increasing the decomposition. Regionally, during this time period, SAM intensified and reached its positive phase ca. 150 cal yr BP [9,10]. This would indicate that LAB had once again become dominant.
The inferred lower amount of moisture in the region during this period might have been due to a decoupling of ocean and atmospheric circulation. The SST at Palmer Deep decreased by up to 6 °C over this time [16], possibly reducing the amount of moisture sourced over the Bellingshausen Sea. In contrast, there was reduced sea ice at Barilari Bay, which again became seasonally open marine [17], indicating that ocean currents might have experienced regional heterogeneity at this time.
4.7. Modern Period over the Last 60 Years (1950–2014 AD)
Since 0 cal yr BP (1950 AD), there has been an increase in Δ13C concurrent with a δ18O negative excursion, suggesting a warm and wet climate. The ecology of the peatbank system supports this interpretation, with extremely tomentose Chorisodontium coming to dominate in core LIT-4 after a brief period of Polytrichum concurrent with accumulation rate increasing from 0.6 to 1.4 mm/yr, or a doubling of production over decomposition [42]. Regionally, there are multiple lines of evidence for wet conditions [21], including an increase in snowfall accumulation [50,51], a rapid rise in peatbank productivity [23], an increase in AP temperature anomaly [46], and a warmer SST [15] (Figure 5). These records indicate that modern climate patterns in the AP may be anomalously warm and wet in the context of the last 1700 years. However, our isotope record lends support to the hypothesis that, although anomalous, the climate of the last 60 years is not outside the range of natural variability.
5. Conclusions
Moss isotopes from peatbanks have proven to be informative for paleoclimate interpretations in the western Antarctic Peninsula. As recorders of summer terrestrial surface conditions, they show multi-centennial-scale patterns of changes in peatbank wetness and photosynthesizing conditions, indicating that atmospheric circulation is the dominant influence on moss ecology and productivity and therefore accumulation rates. In a paleoclimate context, regional conditions now are most similar to those ca. 1350 cal yr BP and may not be outside the range of natural variability. Furthermore, when comparing moss isotope records to marine or ice-core records, it is apparent that there is disagreement about the timing and trajectory of discrete events in the region. These events are likely forced by a combination of ocean SST and synoptic-scale atmospheric patterns that can work in conjunction to bring centuries of climate shifts to the Antarctic Peninsula region
Supplementary Materials
The following are available online at https://www.mdpi.com/2076-3263/9/7/282/s1, The stable isotope results for this study can be found in Table S1: The stable isotope results of C. aciphyllum cellulose from core LIT-4.
Author Contributions
Conceptualization, J.M.S. and Z.Y.; Funding acquisition, Z.Y.; Investigation, J.M.S.; Project administration, Z.Y.; Supervision, Z.Y.; Writing—original draft, J.M.S.; Writing—review & editing, J.M.S. and Z.Y.
Funding
This project was funded by US NSF—Antarctic Earth Sciences Program (PLR 1246190 and 1246359).
Acknowledgments
We thank David Beilman for field assistance and discussion; Ted Doerr, Cara Ferrier, Adam Jenkins, Carolyn Lipke, Ryan Wallace, and others at U.S. Palmer Station and on the R/V LMG for field assistance; and NSF-funded Polar Geospatial Center for access to Antarctic DEM (REMA). We thank two anonymous journal reviewers for comments that improved the manuscript.
Conflicts of Interest
The authors declare no conflict of interest.
References
- Vaughan, D.G.; Marshall, G.J.; Connolley, W.M.; Parkinson, C.; Mulvaney, R.; Hodgson, D.A.; King, J.C.; Pudsey, C.J.; Turner, J. Recent rapid regional climate warming on the Antarctic Peninsula. Clim. Chang. 2003, 60, 243–274. [Google Scholar] [CrossRef]
- Turner, J.; Lu, H.; White, I.; King, J.C.; Phillips, T.; Hosking, J.S.; Bracegirdle, T.J.; Marshall, G.J.; Mulvaney, R.; Deb, P. Absence of 21st century warming on Antarctic Peninsula consistent with natural variability. Nature 2016, 535, 411–415. [Google Scholar] [CrossRef] [PubMed]
- Oliva, M.; Navarro, F.; Hrbáček, F.; Hernández, A.; Nývlt, D.; Pereira, P.; Ruiz-Fernández, J.; Trigo, R. Recent regional climate cooling on the Antarctic Peninsula and associated impacts on the cryosphere. Sci. Total Environ. 2017, 580, 210–223. [Google Scholar] [CrossRef] [PubMed]
- Gonzalez, S.; Vasallo, F.; Recio-Blitz, C.; Guijarro, J.A.; Riesco, J. Atmospheric patterns over the Antarctic Peninsula. J. Clim. 2018, 31, 3597–3608. [Google Scholar] [CrossRef]
- Jones, J.M.; Gille, S.T.; Goosse, H.; Abram, N.J.; Canziani, P.O.; Charman, D.J.; Clem, K.R.; Crosta, X.; de Lavergne, C.; Eisenman, I.; et al. Assessing recent trends in high-latitude southern hemisphere surface climate. Nat. Clim. Chang. 2016, 6, 917–926. [Google Scholar] [CrossRef]
- van Loon, H. The half-yearly oscillations in middle and high southern latitudes and the coreless winter. J. Atmos. Sci. 1967, 24, 472–486. [Google Scholar] [CrossRef]
- Clem, K.R.; Renwick, J.A.; McGregor, J.; Fogt, R.L. The relative influence of ENSO and SAM on Antarctic Peninsula climate. J. Geophys. Res. Atmos. 2016, 121, 9324–9341. [Google Scholar] [CrossRef]
- Thomas, Z.A.; Jones, R.T.; Fogwill, C.J.; Hatton, J.; Williams, A.N.; Hogg, A.; Mooney, S.; Jones, P.; Lister, D.; Mayewski, P.; et al. Evidence for increased expression of the Amundsen Sea Low over the South Atlantic during the late Holocene. Clim. Past 2018, 14, 1727–1738. [Google Scholar] [CrossRef]
- Abram, N.J.; Mulvaney, R.; Vimeux, F.; Phipps, S.J.; Turner, J.; England, M.H. Evolution of the Southern Annular Mode during the past millennium. Nat. Clim. Chang. 2014, 4, 564–569. [Google Scholar] [CrossRef]
- Dätwyler, C.; Neukom, R.; Abram, N.J.; Gallant, A.J.E.; Grosjean, M.; Jacques-Coper, M.; Karoly, D.J.; Villalba, R. Teleconnection stationarity, variability and trends of the Southern Annular Mode (SAM) during the last millennium. Clim. Dyn. 2018, 51, 2321–2339. [Google Scholar] [CrossRef]
- IAEA/WMO. The Global Network of Isotopes in Precipitation GNIP Database. Available online: https://nucleus.iaea.org/wiser (accessed on 25 June 2019).
- Arndt, J.E.; Schenke, H.W.; Jakobsson, M.; Nitsche, F.O.; Buys, G.; Goleby, B.; Rebesco, M.; Bohoyo, F.; Hong, J.; Black, J.; et al. The international bathymetric chart of the southern ocean (IBCSO) version 1.0—A new bathymetric compilation covering circum-Antarctic waters. Geophys. Res. Lett. 2013, 40, 3111–3117. [Google Scholar] [CrossRef]
- Howat, I.M.; Porter, C.; Smith, B.E.; Noh, M.-J.; Morin, P. The reference elevation model of Antarctica. Cryosphere 2019, 13, 665–674. [Google Scholar] [CrossRef]
- Mulvaney, R.; Abram, N.J.; Hindmarsh, R.C.A.; Arrowsmith, C.; Fleet, L.; Triest, J.; Sime, L.C.; Alemany, O.; Foord, S. Recent Antarctic Peninsula warming relative to Holocene climate and ice-shelf history. Nature 2012, 489, 141–144. [Google Scholar] [CrossRef] [PubMed]
- Domack, E.; Leventer, A.; Dunbar, R.; Taylor, F.; Brachfeld, S.; Sjunneskog, C. Chronology of the Palmer Deep site, Antarctic Peninsula: A Holocene palaeoenvironmental reference for the circum-Antarctic. Holocene 2001, 11, 1–9. [Google Scholar] [CrossRef]
- Shevenell, A.E.; Ingalls, A.E.; Domack, E.W.; Kelly, C. Holocene Southern Ocean surface temperature variability west of the Antarctic Peninsula. Nature 2011, 470, 250–254. [Google Scholar] [CrossRef] [PubMed]
- Christ, A.J.; Talaia-Murray, M.; Elking, N.; Domack, E.W.; Leventer, A.; Lavoie, C.; Brachfeld, S.; Yoo, K.-C.; Gilbert, R.; Jeong, S.-M.; et al. Late Holocene glacial advance and ice shelf growth in Barilari Bay, Graham Land, west Antarctic Peninsula. GSA Bull. 2015, 127, 297–315. [Google Scholar] [CrossRef]
- Kim, S.; Yoo, K.-C.; Lee, J.I.; Khim, B.-K.; Bak, Y.-S.; Lee, M.K.; Lee, J.; Domack, E.W.; Christ, A.J.; Yoon, H.I. Holocene paleoceanography of Bigo Bay, west Antarctic Peninsula: Connections between surface water productivity and nutrient utilization and its implication for surface-deep water mass exchange. Quat. Sci. Rev. 2018, 192, 59–70. [Google Scholar] [CrossRef]
- Björck, S.; Malmer, N.; Hjort, C.; Sandgren, P.; Ingólfsson, Ó.; Wallén, B.; Smith, R.I.L.; Jónsson, B.L. Stratigraphic and paleoclimatic studies of a 5500-year-old moss bank on Elephant Island, Antarctica. Arct. Alp. Res. 1991, 23, 361–374. [Google Scholar] [CrossRef]
- Royles, J.; Ogée, J.; Wingate, L.; Hodgson, D.A.; Convey, P.; Griffiths, H. Carbon isotope evidence for recent climate-related enhancement of CO2 assimilation and peat accumulation rates in Antarctica. Glob Chang. Biol. 2012, 18, 3112–3124. [Google Scholar] [CrossRef]
- Yu, Z.; Beilman, D.W.; Loisel, J. Transformations of landscape and peat-forming ecosystems in response to late Holocene climate change in the western Antarctic Peninsula. Geophys. Res. Lett. 2016, 43, 7186–7195. [Google Scholar] [CrossRef]
- Amesbury, M.J.; Roland, T.P.; Royles, J.; Hodgson, D.A.; Convey, P.; Griffiths, H.; Charman, D.J. Widespread biological response to rapid warming on the Antarctic Peninsula. Curr. Biol. 2017, 27, 1616–1622.e2. [Google Scholar] [CrossRef] [PubMed]
- Charman, D.J.; Amesbury, M.J.; Roland, T.P.; Royles, J.; Hodgson, D.A.; Convey, P.; Griffiths, H. Spatially coherent late Holocene Antarctic Peninsula surface air temperature variability. Geology 2018, 46, 1071–1074. [Google Scholar] [CrossRef]
- Kwok, R.; Comiso, J.C. Spatial patterns of variability in Antarctic surface temperature: Connections to the southern hemisphere annular mode and the Southern Oscillation. Geophys. Res. Lett. 2002, 29, 50-1–50-4. [Google Scholar] [CrossRef]
- Cook, A.J.; Holland, P.R.; Meredith, M.P.; Murray, T.; Luckman, A.; Vaughan, D.G. Ocean forcing of glacier retreat in the western Antarctic Peninsula. Science 2016, 353, 283–286. [Google Scholar] [CrossRef] [PubMed]
- Fenton, J.H.C.; Smith, R.L. Distribution, composition and general characteristics of the moss banks of the maritime Antarctic. Br. Antarct. Surv. Bull. 1982, 51, 215–236. [Google Scholar]
- Ochyra, R.; Lewis, S.; Bednarek-Ochyra, H. The Illustrated Moss Flora of Antarctica.; Cambridge University Press: Cambridge, UK, 2008; ISBN 0-521-81402-2. [Google Scholar]
- Longton, R.E. Vegetation in the maritime Antarctic. Philos. Trans. R. Soc. Lond. Ser. B Biol. Sci. 1967, 252, 213–235. [Google Scholar]
- Royles, J.; Horwath, A.B.; Griffiths, H. Interpreting bryophyte stable carbon isotope composition: Plants as temporal and spatial climate recorders. Geochem. Geophys. Geosyst. 2014, 15, 1462–1475. [Google Scholar] [CrossRef]
- Royles, J.; Griffiths, H. Invited review: Climate change impacts in polar regions: Lessons from Antarctic moss bank archives. Glob Chang. Biol. 2015, 21, 1041–1057. [Google Scholar] [CrossRef]
- Royles, J.; Amesbury, M.J.; Roland, T.P.; Jones, G.D.; Convey, P.; Griffiths, H.; Hodgson, D.A.; Charman, D.J. Moss stable isotopes (carbon-13, oxygen-18) and testate amoebae reflect environmental inputs and microclimate along a latitudinal gradient on the Antarctic Peninsula. Oecologia 2016, 181, 931–945. [Google Scholar] [CrossRef]
- Barbour, M.M. Stable oxygen isotope composition of plant tissue: A review. Funct. Plant Biol. 2007, 34, 83–94. [Google Scholar] [CrossRef]
- Sternberg, L.; Ellsworth, P.F.V. Divergent biochemical fractionation, not convergent temperature, explains cellulose oxygen isotope enrichment across latitudes. PLoS ONE 2011, 6, e28040. [Google Scholar] [CrossRef] [PubMed]
- Royles, J.; Sime, L.C.; Hodgson, D.A.; Convey, P.; Griffiths, H. Differing source water inputs, moderated by evaporative enrichment, determine the contrasting δ18OCELLULOSE signals in maritime Antarctic moss peat banks. J. Geophys. Res. 2013, 118, 184–194. [Google Scholar] [CrossRef]
- Ménot-Combes, G.; Burns, S.J.; Leuenberger, M. Variations of 18O/16O in plants from temperate peat bogs (Switzerland): Implications for paleoclimatic studies. Earth Planet. Sci. Lett. 2002, 202, 419–434. [Google Scholar] [CrossRef]
- Nichols, D.S.; Brown, J.M. Evaporation from a sphagnum moss surface. J. Hydrol. 1980, 48, 289–302. [Google Scholar] [CrossRef]
- Farquhar, G.D.; Barbour, M.M.; Henry, B.K. Interpretation of oxygen isotope composition of leaf material. In Stable Isotopes: Integration of Biological Ecological and Geochemical Processes; Griffiths, H., Ed.; Taylor & Francis, Inc.: Oxfordshire, UK, 1997. [Google Scholar]
- Bramley-Alves, J.; Wanek, W.; French, K.; Robinson, S.A. Moss δ13C: An accurate proxy for past water environments in polar regions. Glob. Chang. Biol. 2015, 21, 2454–2464. [Google Scholar] [CrossRef] [PubMed]
- Robinson, S.A.; King, D.H.; Bramley-Alves, J.; Waterman, M.J.; Ashcroft, M.B.; Wasley, J.; Turnbull, J.D.; Miller, R.E.; Ryan-Colton, E.; Benny, T.; et al. Rapid change in East Antarctic terrestrial vegetation in response to regional drying. Nat. Clim. Chang. 2018, 8, 879–884. [Google Scholar] [CrossRef]
- O’Leary, M.H. Carbon isotopes in photosynthesis. BioScience 1988, 38, 328–336. [Google Scholar] [CrossRef]
- Farquhar, G.D.; Ehleringer, J.R.; Hubick, K.T. Carbon isotope discrimination and photosynthesis. Ann. Rev. Plant Physiol. Plant Mol. Biol. 1989, 40, 503–537. [Google Scholar] [CrossRef]
- Stelling, J.M.; Yu, Z.; Loisel, J.; Beilman, D.W. Peatbank response to late Holocene temperature and hydroclimate change in the western Antarctic Peninsula. Quat. Sci. Rev. 2018, 188, 77–89. [Google Scholar] [CrossRef]
- Loader, N.J.; Robertson, I.; Barker, A.C.; Switsur, V.R.; Waterhouse, J.S. An improved technique for the batch processing of small wholewood samples to α-cellulose. Chem. Geol. 1997, 136, 313–317. [Google Scholar] [CrossRef]
- R Core Team. A Language and Environment for Statistical Computing; R Foundation for Statistical Computing: Vienna, Austria, 2015. [Google Scholar]
- Rubino, M.; Etheridge, D.M.; Trudinger, C.M.; Allison, C.E.; Battle, M.O.; Langenfelds, R.L.; Steele, L.P.; Curran, M.; Bender, M.; White, J.W.C.; et al. A revised 1000 year atmospheric δ13C-CO2 record from Law Dome and South Pole, Antarctica. J. Geophys. Res. Atmos. 2013, 118, 8482–8499. [Google Scholar] [CrossRef]
- Stenni, B.; Curran, M.A.J.; Abram, N.J.; Orsi, A.; Goursaud, S.; Masson-Delmotte, V.; Neukom, R.; Goosse, H.; Divine, D.; van Ommen, T.; et al. Antarctic climate variability on regional and continental scales over the last 2000 years. Clim. Past 2017, 13, 1609–1634. [Google Scholar] [CrossRef]
- Oppedal, L.T.; Bakke, J.; Paasche, Ø.; Werner, J.P.; van der Bilt, W.G.M. Cirque Glacier on South Georgia Shows Centennial Variability over the Last 7000 Years. Front. Earth Sci. 2018, 6, 2. [Google Scholar] [CrossRef]
- Hall, B.L.; Koffman, T.; Denton, G.H. Reduced ice extent on the western Antarctic Peninsula at 700–970 cal. yr B.P. Geology 2010, 38, 635–638. [Google Scholar] [CrossRef]
- van der Bilt, W.G.M.; Bakke, J.; Werner, J.P.; Paasche, Ø.; Rosqvist, G.; Vatle, S.S. Late Holocene glacier reconstruction reveals retreat behind present limits and two-stage Little Ice Age on subantarctic South Georgia. J. Quat. Sci. 2017, 32, 888–901. [Google Scholar] [CrossRef]
- Thomas, E.R.; van Wessem, J.M.; Roberts, J.; Isaksson, E.; Schlosser, E.; Fudge, T.J.; Vallelonga, P.; Medley, B.; Lenaerts, J.; Bertler, N.; et al. Regional Antarctic snow accumulation over the past 1000 years. Clim. Past 2017, 13, 1491–1513. [Google Scholar] [CrossRef]
- Medley, B.; Thomas, E.R. Increased snowfall over the Antarctic Ice Sheet mitigated twentieth-century sea-level rise. Nat. Clim. Chang. 2019, 9, 34. [Google Scholar] [CrossRef]


© 2019 by the authors. Licensee MDPI, Basel, Switzerland. This article is an open access article distributed under the terms and conditions of the Creative Commons Attribution (CC BY) license (http://creativecommons.org/licenses/by/4.0/).