Abstract
In 2015 and 2017 unusual ocean and atmospheric conditions produced many years’ worth of rainfall in short periods over Northern Chile’s Atacama Desert, resulting in catastrophic flooding in the town of Chañaral. However, the town is not only at risk of fluvial flooding, it is also at risk of tsunamis. Through a community mapping exercise, the authors attempted to establish the level of community awareness about tsunamis, and contrasted it with that of other types of water-related hazards facing the town (namely that of flooding due to high intensity rain). This was then compared with the results of field surveys and tsunami hazard simulations, indicating than overall the community appears to have better awareness than authorities about the threat posed by these types of events. The authors thus concluded that in cases when the community has a high level of hazard awareness (which in the case of Chile was the result of traditional knowledge being transmitted from previous generations) it would be advantageous to include them in discussions on how to improve disaster resilience.
1. Introduction
Recovering from and strengthening societal resilience towards natural hazards and the impact of anthropogenically accelerated climate change are complex processes that require extensive investments in disaster governance [1,2]. Disaster governance refers to the collection of regulatory frameworks and practices towards disaster response, recovery, reconstruction, mitigation, and preparedness from governmental, organizational, and residential stakeholders [3]. Disaster governance is a priority for action in the Sendai Framework for Disaster Risk Reduction that would enable collaboration between stakeholders to address and reduce multiple disaster risks [4,5]. Disaster governance helps in establishing effective disaster preparedness activities and anticipating building back better after a disaster. Further, disaster preparedness distinguishes itself from the rest of disaster governance practices by encompassing activities that educate and ensure the readiness of the residents of a given territory against a potential disaster; activities that are implemented in both the pre-impact and post-impact phases of an event [6].
In Chile, a country that is at significant risk of suffering from natural hazards, disaster preparedness has been given a high priority over the last few years [7], as its successful implementation can potentially minimize property damage and loss of life and reduce disruption to the local and national economy. However, despite all the efforts that are being made to improve preparedness, Chile continues to experience large scale events that can significantly affect communities.
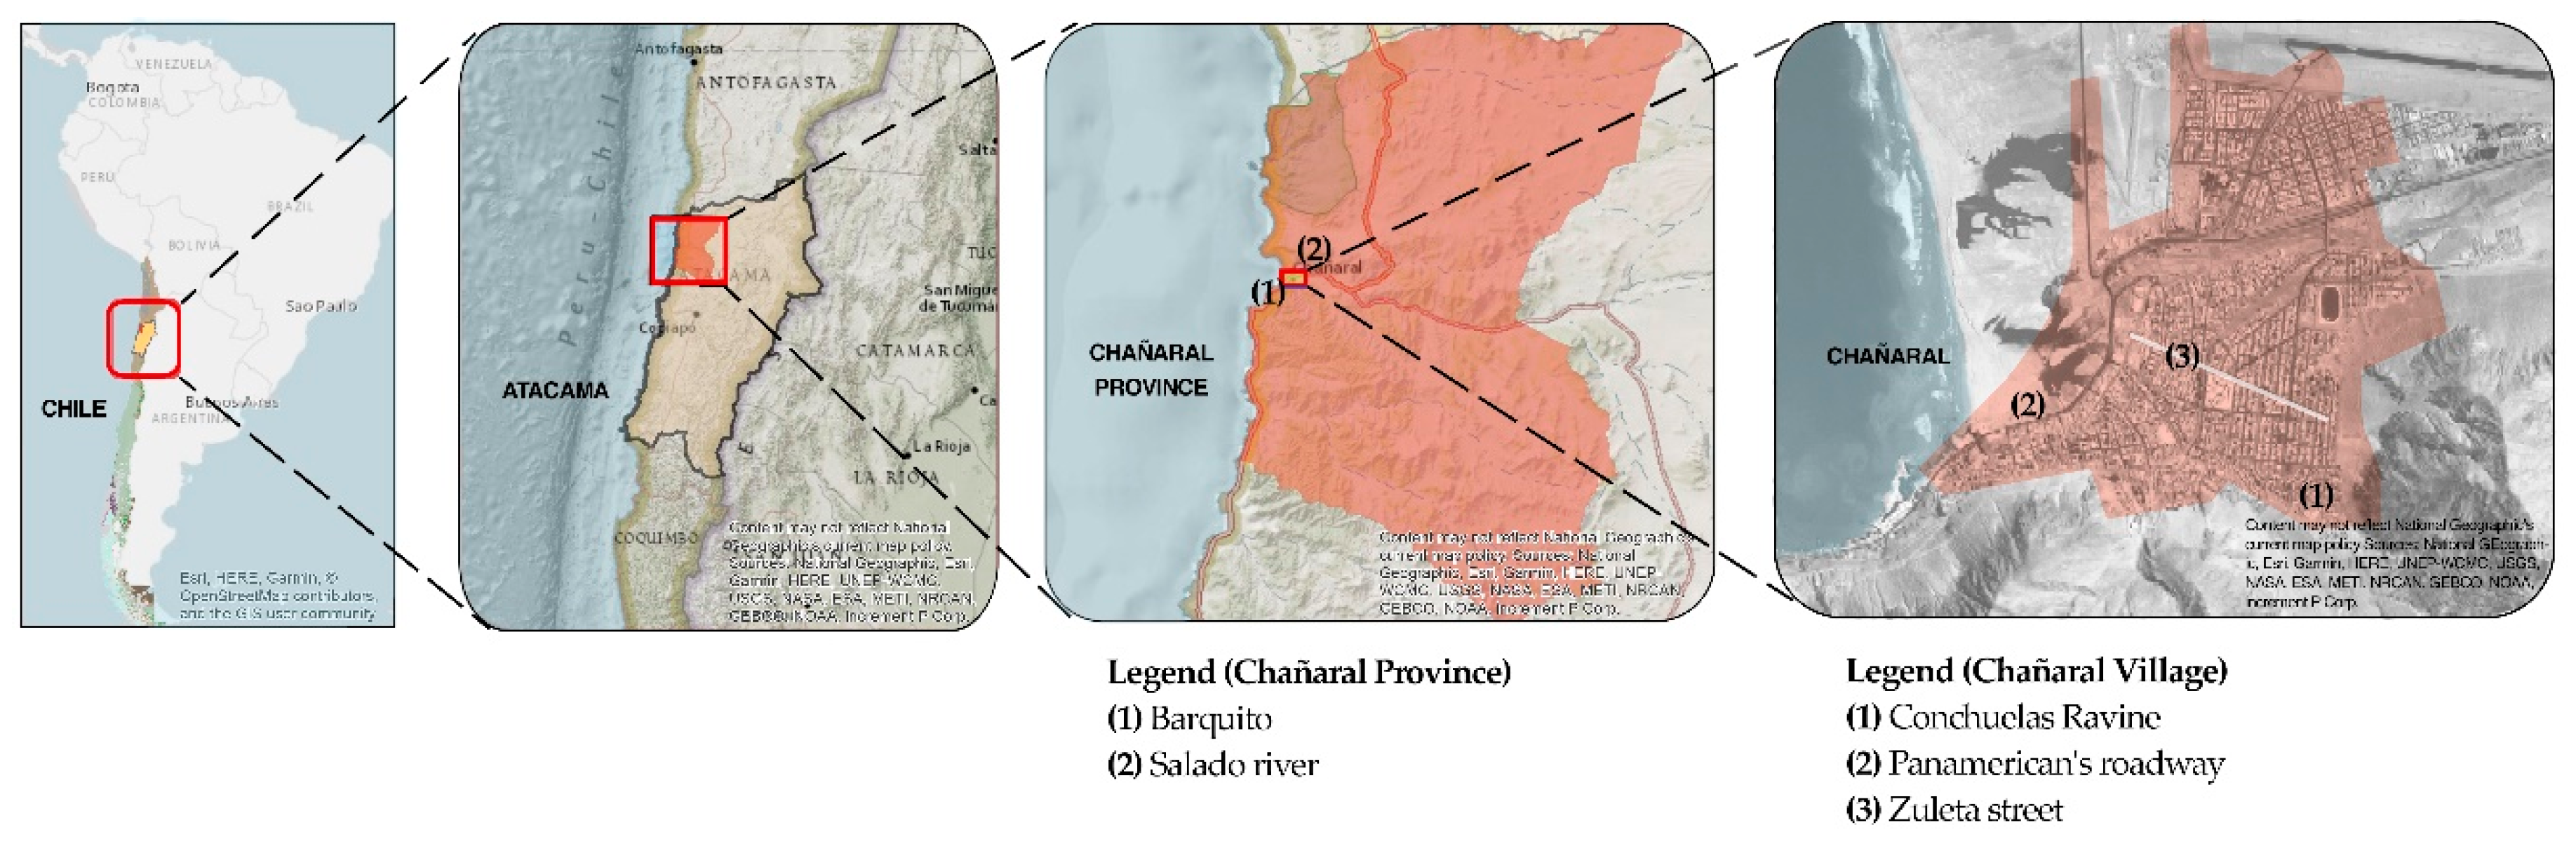
Infrequent, high magnitude precipitation and flooding events have been observed in the past in certain areas of the Atacama Desert [8]. Large rainfall on the 24–26 March 2015 in the hyper-arid Atacama Desert of Northern Chile brought a disastrous flooding to the city of Chañaral [9] (see Figure 1). The mudflow severely damaged public and private property, had detrimental effects on drinking water and electricity supply, and spread soil contaminated with heavy metals throughout this small city (with a population of just over 12,219 inhabitants [10]). These metals originated from mining activities upstream of the Salado River, which were transported by the flood [9], highlighting the human-based dimensions of the disaster. This triggered discussions regarding the way the city had been developing, which were exacerbated when on 12 May 2017 it experienced another mudflow as a consequence of flash floods upstream from the town. Prior to these events, the city had not been affected by any significant disasters for a comparatively large span of time (see Table 1 [11,12,13]).
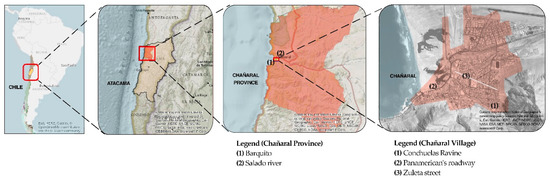
Figure 1.
Map of the study area, showing the location of Chile within South America, the Atacama Region, Chañaral Province, and Chañaral.

Table 1.
List of historical disasters in the city of Chañaral [11,12,13].
These recent events were considered unusual with respect to their frequency, magnitude, and the amount of sediment supply produced. They have also significantly increased the awareness of coastal residents against flash floods, in an area that had previously considered tsunamis as its main threat. However, it is not clear whether these recent events have resulted in a lowering of tsunami awareness amongst local residents, and whether the reconstruction patterns and adaptation measures implemented after the floods have resulted in a lower preparedness against a tsunami. Awareness about natural hazards is of paramount importance to ensure a successful evacuation, and a lack of it can lead to increased number of casualties [14,15,16,17,18,19]. In order to ascertain the level of community awareness about such issues, the authors set out to conduct community mapping exercises amongst local residents in the municipality.
Community mapping, an ethnographic tool inside human-centered design (HCD), is an interactive tool that has been developed in order to integrate the traditional knowledge and ideas of the people living within a community into the planning and development of an academic or business project [20,21]. This methodology allows a local community to describe the numerous characteristics of an area (such as risk-prone or polluted areas) through vocal and visual representations that facilitate the understanding of the socio-environmental conditions of the settlement [22,23,24]. Participatory or community mapping is not defined by the level of compliance with formal cartographic conventions, and whereas regular maps seek conformity, community maps embrace diversity in presentation and content. In essence, participants are instructed to draw a physical map of their territory, highlighting different types of socio-environmental dimensions being impacted, and are actively encouraged to share their observations and rationale with the members of the research team. In the case study of Chañaral, the participants were instructed to highlight five aspects of their settlement, namely (a) tsunami risk areas, (b) flood risk areas, (c) critical infrastructure, natural resources and cultural sites, (d) evacuation areas and evacuations routes, and (e) polluted areas.
These community mapping exercises were then contrasted with a tsunami hazard map obtained by conducting a numerical simulation of a worst-case earthquake scenario, as well as a flood map obtained from field surveys conducted in the aftermath of the 2015 event and reported in Wilcox et al. [9]. The originality of the research thus lies in the combination of social science tools that establish the community’s perception on a certain number of social issues, contrasting them with hazard maps, and allowing the authors to clearly identify the problems that underlie specific areas of the town. To the authors’ knowledge, to date the coupling of community mapping and propagation and inundation simulations has not been used in tsunami risk mitigation, and represents an important way forward to attempt to improve the resilience of coastal communities and ensure their long-term sustainability. Essentially, through the present research the authors are attempting to validate whether a group of members of the community possesses enough awareness (when acting as a group) to be able to successfully contribute to discussions on how to improve the resilience in their settlement, through the process of HCD. Also, it is interesting to note how the present research attempts to understand risk perceptions regarding a severe and probably future risk (tsunami), which is markedly different in nature to the last two disasters affecting the community (river flood). This represents another novel aspect of the paper, in that typically awareness and preparedness studies tend to focus on recent events and how to prepare against similar future events.
2. Framework
The present research represents a contribution to practice, following a participatory action research (PAR) [25,26], which employed a solution-focused method (using a participatory mapping exercise). Essentially, in the field of sustainability science it is important for researchers to take a transdisciplinary proactive approach and attempt to solve the various problems present in a community, in order to strengthen their resilience against natural disasters to ensure their long-term sustainability. It was thus hoped that by following the approach of human-centered design (HCD), the authors can understand the local risk awareness and context, and based on that propose possible mitigation measures to improve the resilience of the community. Essentially, if local people understand well the risks, then it might be reasonable to listen to their suggestions on how the community should be protected. Otherwise, if they do not understand the risks, then action would first have to be taken to improve disaster awareness.
HCD attempts to find feasible solutions to the needs and problems of people, involving a human perspective during the entire process of a project [27,28]. As part of the HCD approach, Design Thinking is a problem-solving methodology that provides new processes and toolkits that connect the creative design approach to traditional business thinking, involving multidisciplinary teams in order to visualize any innovation processes [29,30]. Many designers, such as Victor Papanek [31], companies, such as IDEO [29], and universities around the world, have explored new HCD approaches and Design Thinking methodologies. In their projects they work with and for the people, taking more in consideration their experiences and feelings, using concepts such as Emphatic Design, that tries to meet the needs of the individuals for building an understanding of their everyday lives [32,33,34]. However, outside of the design and business context, there is a general lack of HCD research literature, particularly in the field of disaster risk reduction management. Thus, in the present research the authors set out to understand the lives, feelings and experiences of the victims of disasters, using the concepts of HCD, Design Thinking, and Empathic Design to create a bridge to understand the reality of the city [32,35]. The ultimate aim is to try to improve the resilience of the community against a variety of different types of hazards, using the concept of multi-layer safety [36].
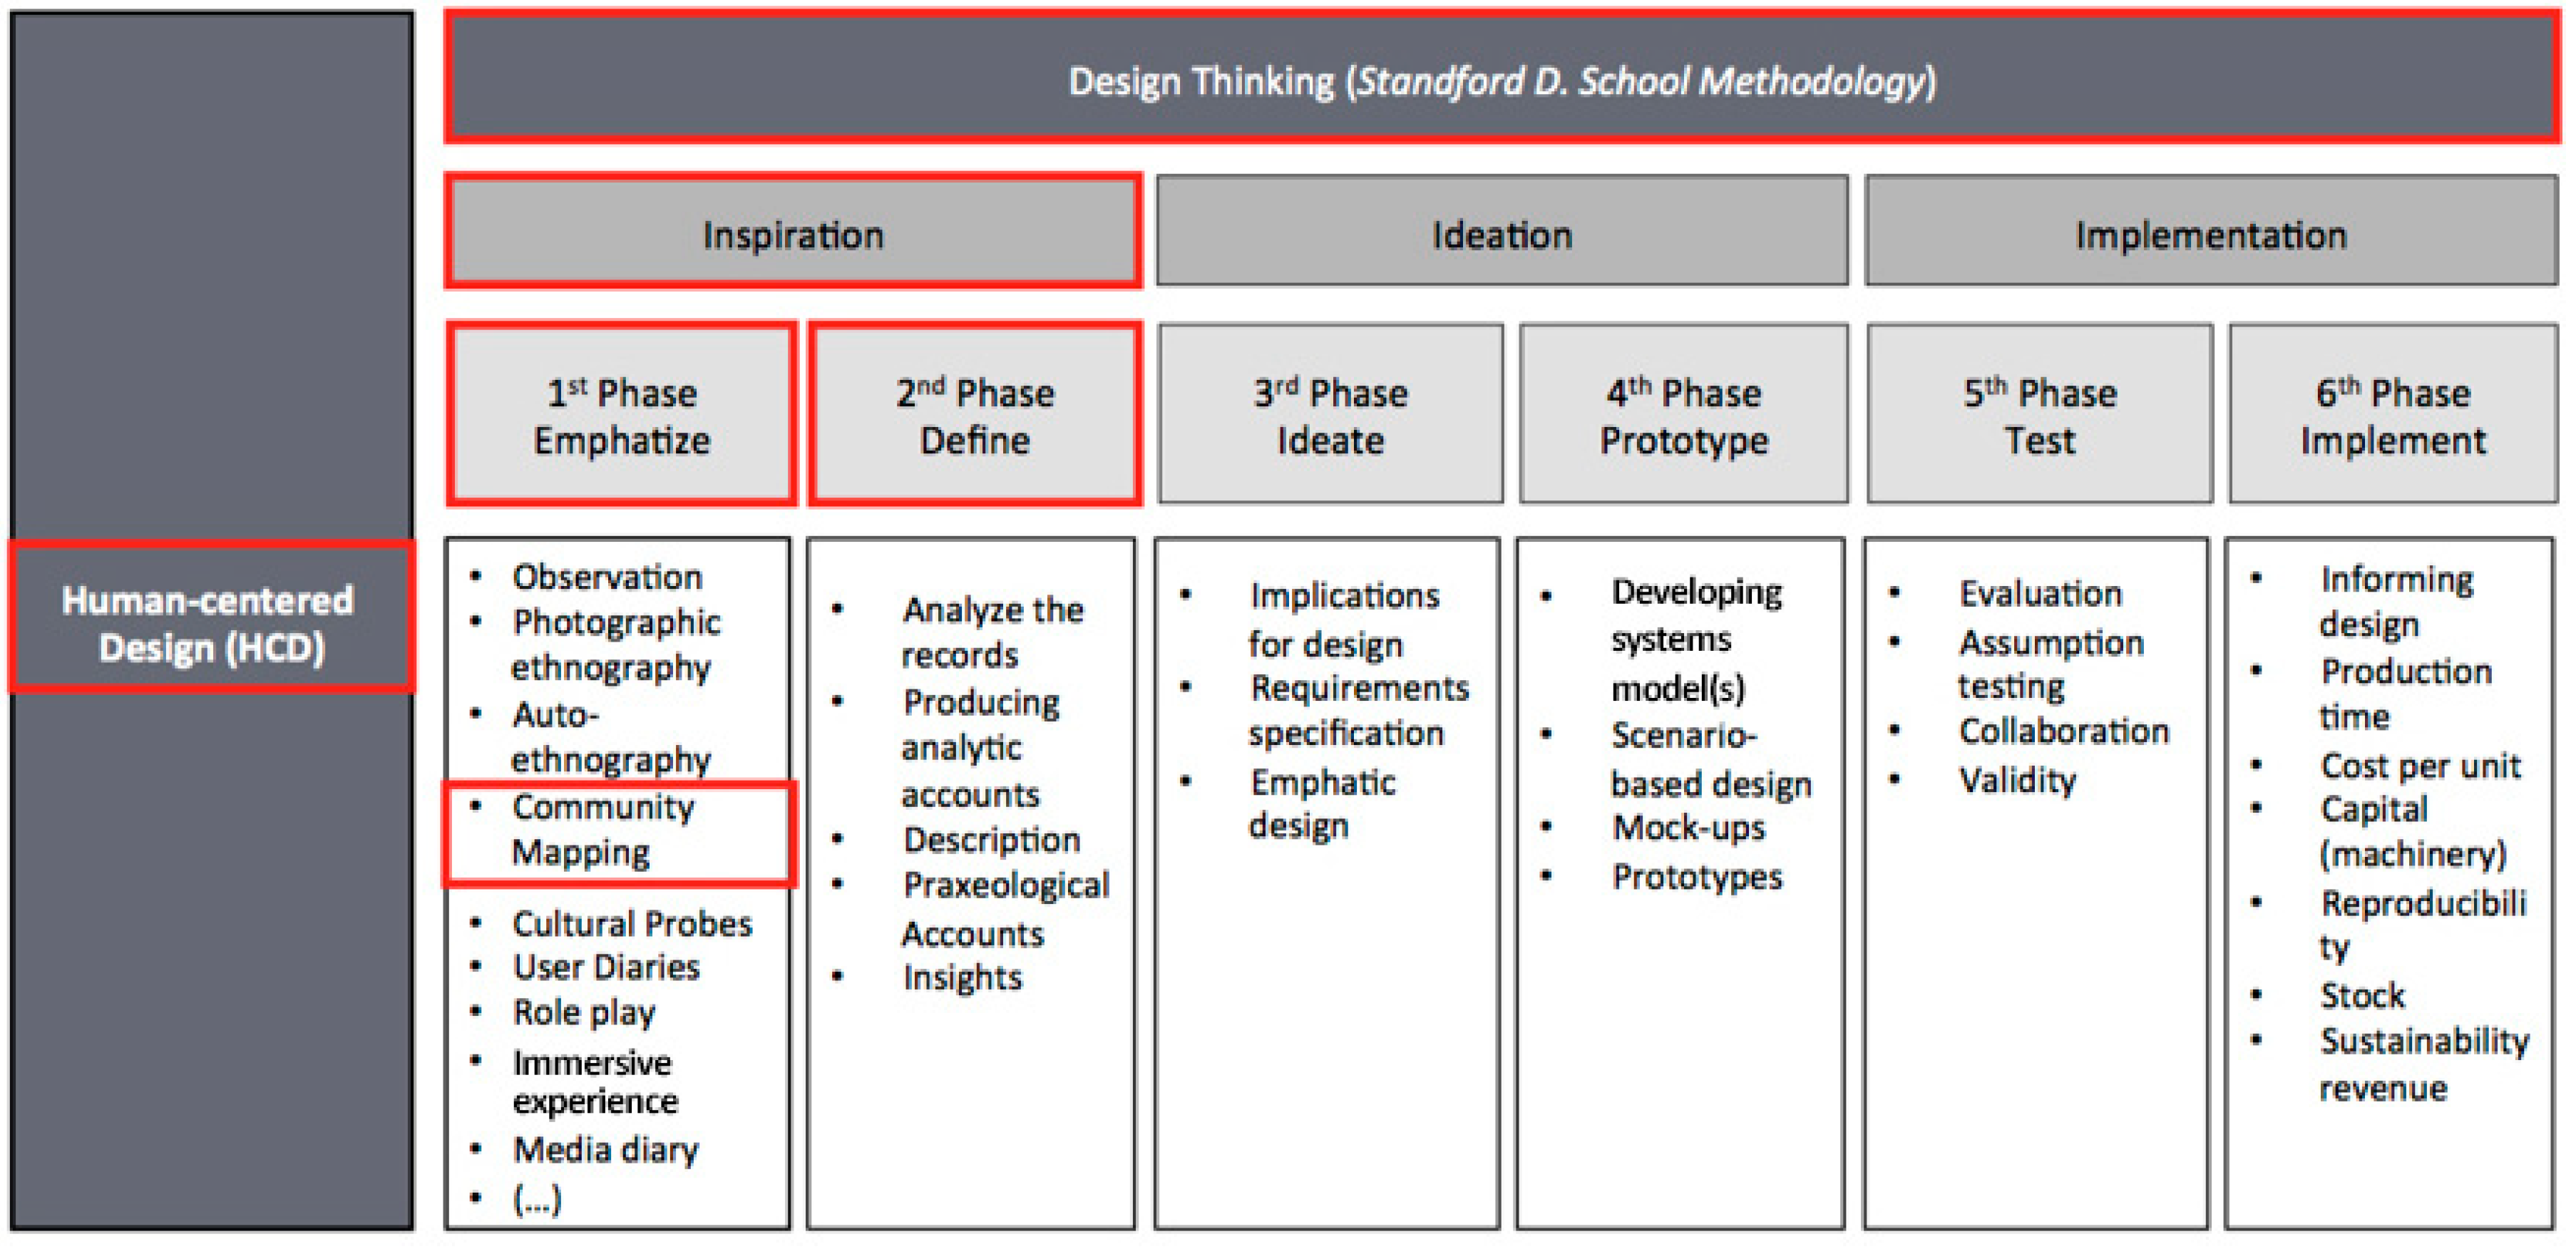
The Design Thinking methodology is divided into six phases [29], as shown in Figure 2. This research constitutes the 1st Phase: Emphatize and 2nd Phase: Define (inside the Inspiration space of the HCD approach). The other four are known as the 3rd Phase: Ideate and 4th Phase: Prototype (inside the Ideation space of the HCD); 5th Phase: Test and 6th Phase: Implement (inside the Implementation space of HCD), though these are outside of the scope of the present paper, and will be addressed by the authors in the coming years.
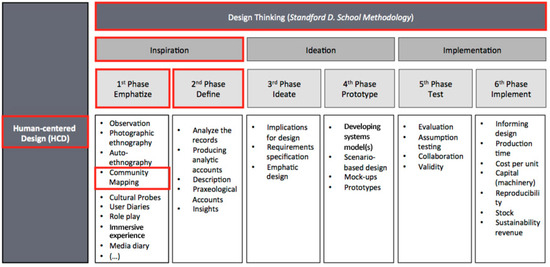
Figure 2.
Human-centered design (HCD) framework characteristics. Adapted from “The field guide to Human-Centered Design” [37], “Design Thinking as an effective Toolkit for Innovation” [38], and “Doing Design Ethnography” [39].
Amongst the different types of Emphatic and Ethnographic Design methods that are possible in the 1st Phase (see Figure 2), the authors chose to conduct a Community Mapping exercise. This type of tool can be used in disaster risk reduction management, as it allows local people to identify areas that they perceive to be dangerous and plot risk reduction strategies [40]. Table 2, adapted from Cadag and Gaillard [40], lists various types of participatory mapping methods. The goal is to integrate scientific assessment and community perception, and with this in mind the present research used a mental mapping and a scaled 2D participatory mapping methodology, where people draw over a scaled base map using marker pens and other similar marking devices [41].
Table 2.
Main characteristics of the different forms of participatory mapping used in this study. Adapted from [40,42,43].
The goal of the research was thus to understand the point at which multi-hazard perception and scientific modelling of disaster scenarios converge and diverge. It is better for coastal residents to have a perception of risk that encompasses all actual risks, based on scientific assessments. When people’s perception of risk and scientific assessments diverge, meaning that there are few overlaps between simulations and the results of a participatory mapping exercise, then there is a clear need for immediate action.
In this 1st and 2nd Phases, the authors focused on the community’s memories and the experience of the victims of the natural disasters that occurred in Chañaral on Wednesday, 25 March 2015 and on Friday, 12 May 2017. Without this emphatic and ethnography-type analysis, the authors would not be able to understand the perception of the people with respect to the disaster response at the time (i.e. what were the real reactions of the people during the event, or what was the knowledge of the community about how to act in such emergencies). Communities understand and perceive risk in a different way to how researchers record them, and thus such exercises can positively enrich the field of disaster risk management.
3. Methodology
In the present work the authors used a diversity of: field surveys, topographical surveys of the beach area (which was not well covered by existing data, given the significant changes that took place after the previous disasters), tsunami propagation and inundation simulations, a community mapping exercise, and an analysis of all data obtained using geographic information system (GIS) software. All of these methodologies are outlined below.
3.1. Identification of the Characteristics of the Study Area
A survey to identify and categorize physical infrastructure was conducted through field observations on 6 August 2017, in order to observe the consequences of the last flooding events and the current status of reconstruction process. Photographic evidence of the main flood sites and the situation of the city is shown in Figure 3. This process allowed the authors to observe ongoing rebuilding activities and the reconstruction initiatives taken by the local authorities to restore community life and prevent future flood damages.
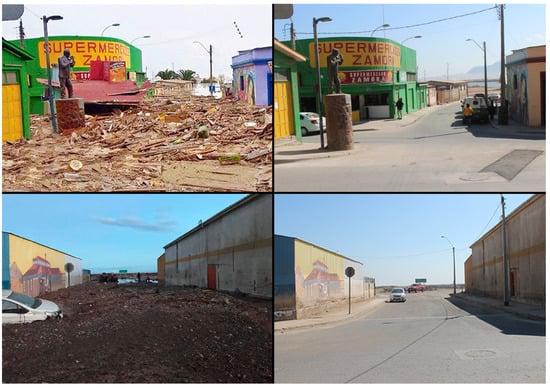
Figure 3.
Comparison between the situation after the May 2017 floods (left), ©Agencia Uno, and the current conditions in Chañaral in August 2017 (right), photos taken by the authors.
3.2. Tsunami Propagation and Simulation Assessment
The town of Chañaral has an official tsunami inundation map [44]. For the elaboration of this map, a deterministic approach with an extreme event of magnitude Mw 8.6 was considered. This was based on a combination of two past earthquakes, namely the events of 1918 and 1922. The former had an estimated magnitude of Mw 7.5 [12], though there was no report of tsunami inundation at Chañaral. The latter had a magnitude of Mw 8.3 [45], with the tsunami at Chañaral beginning one hour after the earthquake and three large waves being observed, reaching up to 10 m above mean sea level [13]. Therefore, a combination of the two events would appear to be a conservative approach to estimate the hazard.
Since the extreme river flood events in 2015 and 2017 generated significant coastal morphology changes and erosion, and the official tsunami inundation map dated from 2014, the present study included the results of tsunami numerical simulations to update the tsunami hazard map. These simulations took into account the coastal morphology changes, as presented by Aránguiz et al, (2018) [46]. The numerical simulations were run by means of the Non-hydrostatic Evolution of Ocean WAVEs model (NEOWAVE) [47,48]. The model generates the initial sea surface deformation, propagation and inundation by means of several nested grids which also include co-seismic deformations. They used 5 nested grids, with the highest grid resolution being ~10 m. The level 5 grid was derived from several bathymetry and topography sources, such as the nautical chart N° 2213, a post-2017 detailed bathymetry provided by the Ministry of Public Works, post-2015 Lidar Topography with a resolution of 1 m contour lines provided by the Municipality of Chañaral, and a topography survey carried out by the authors themselves during august 2017 along the beach [46].
The tsunami scenario was assumed to be the same as the one used for drawing the previous hazard map, i.e. an earthquake of magnitude Mw 8.6 in front of the town of Chañaral. The source parameters were a rupture length of 380 km, a rupture width of 130 km and a uniform slip of 8 m. The tide level was defined as the maximum high tide of +1.0 m. Figure 4 shows the results of the tsunami numerical simulations, namely the tsunami inundation height and tsunami waveform at a location close to the coastline. The results of Aránguiz et al. [46], show that the maximum runup can reach up to 15 m and significant parts of the coastal community can be flooded by the tsunami (Figure 4a). It was also observed that the first tsunami wave can arrive within 15 min of the earthquake and that three large waves could strike the town, with the second one being the largest (Figure 4b). The maximum inundation given by the numerical simulation is similar to the inundation given by SHOA (Hydrographic and Oceanographic Service of the Chilean Navy, in its Spanish acronym) [44], prior to the 2015 river flooding. Therefore, the morphological changes that have taken place due to the flooding do not appear to have a significant effect on potential future tsunami inundation.
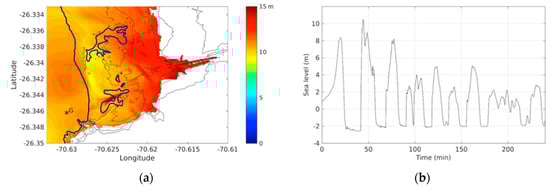
Figure 4.
Results from tsunami simulations [46]. (a) Inundation heights. Thick black line represents the coastline, with thin lines showing contour lines at every 5 m ground elevation. (b) Tsunami waveform at the virtual gauge G (See Figure 4a).
3.3. Community Mapping
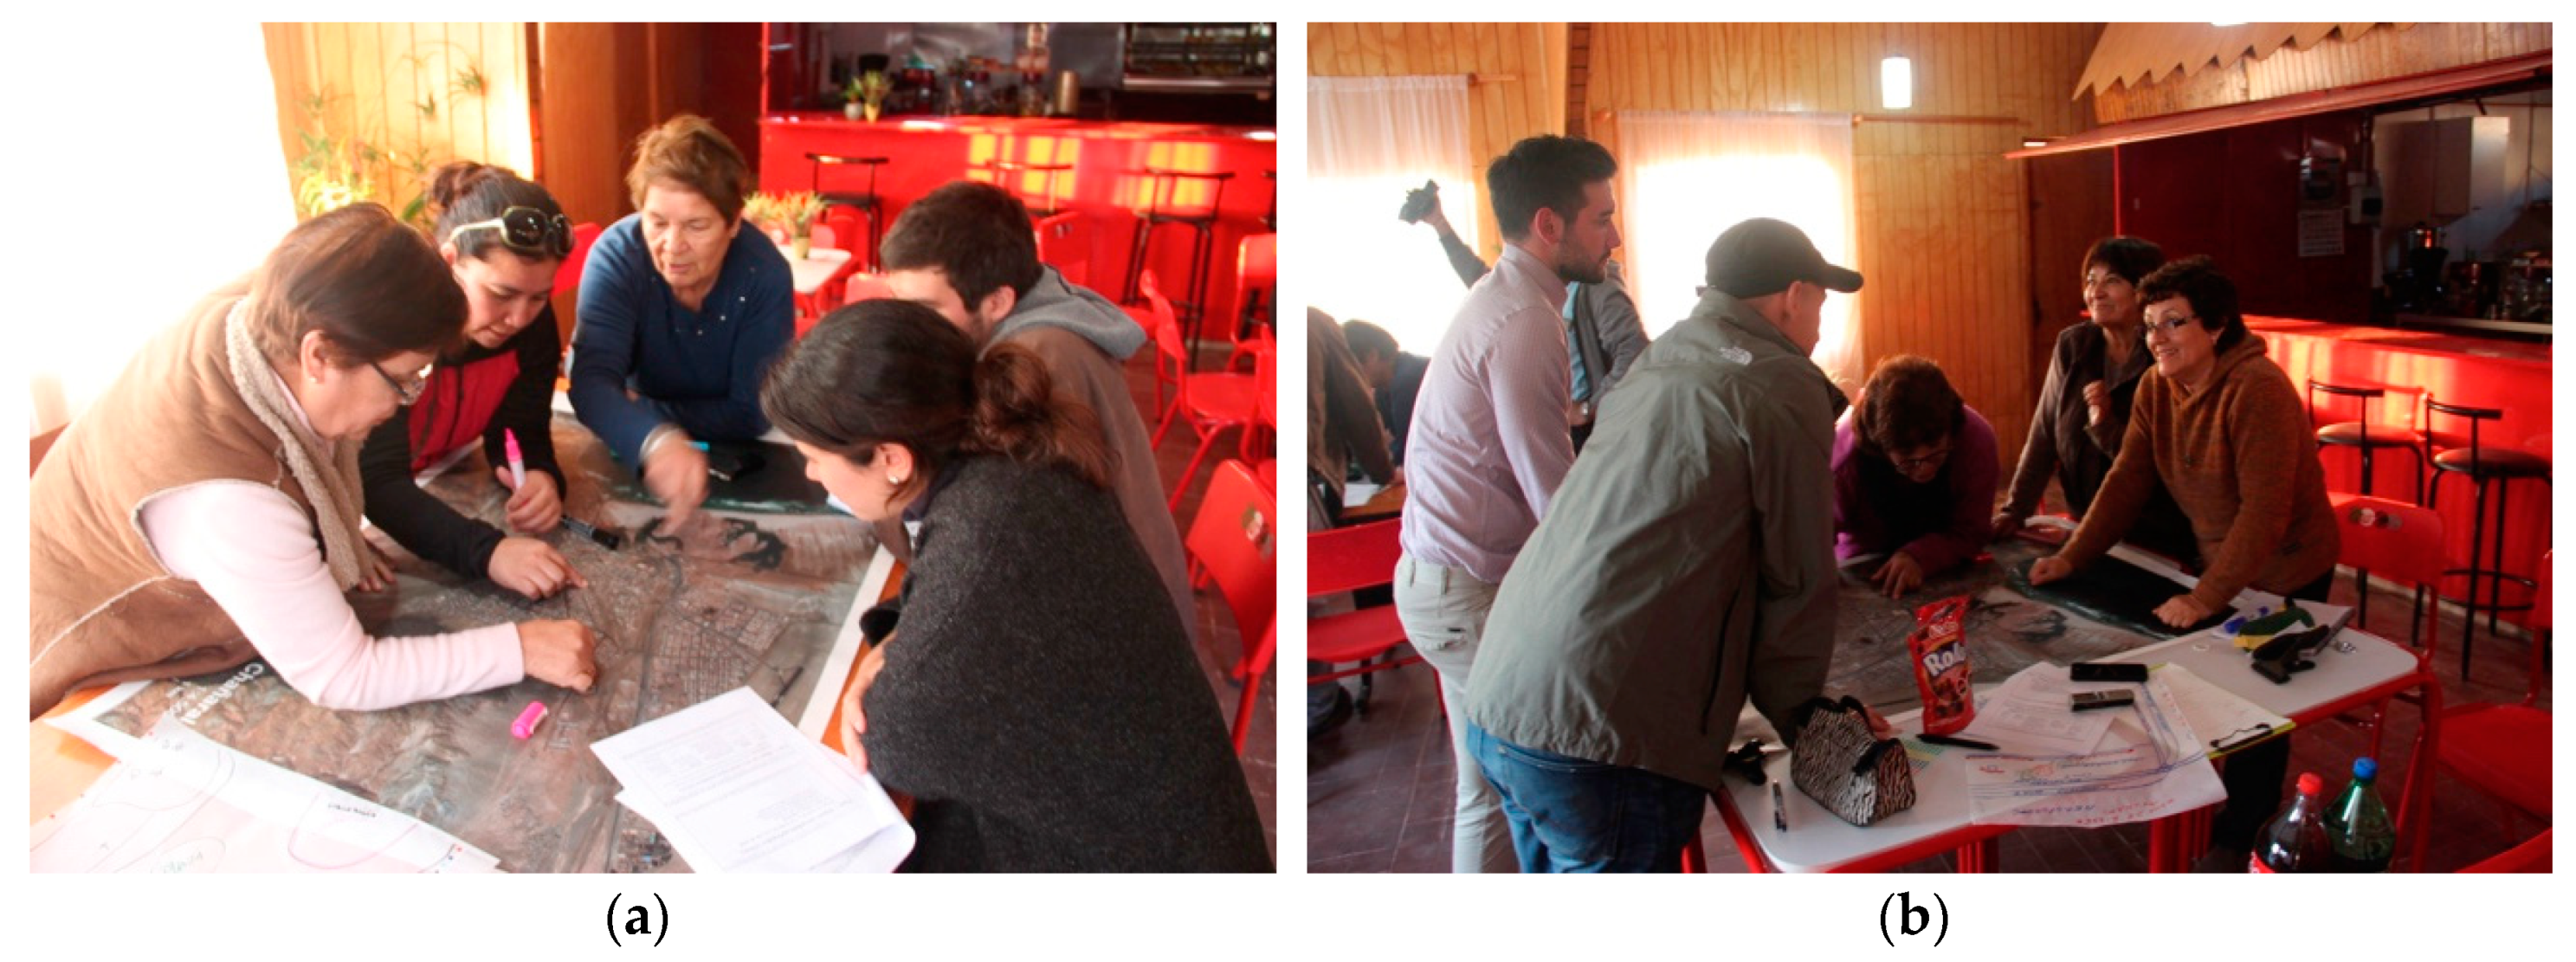
The perception of the community regarding the potential risks, disaster preparedness and risk mitigation strategies was captured through a participatory community mapping exercise. This activity was conducted on 6 August 2017, and involved 10 individuals from different socioeconomic backgrounds, all of which were residents of the sites surveyed (see Figure 5). Participants were between 35 to 72 years of age, though only one was male (it was particularly difficult to get males to attend this activity, which represents a potential limitation of the study. It is also worth noting how women appear to have a greater perception of the risks that can result from natural hazards than men [49]).
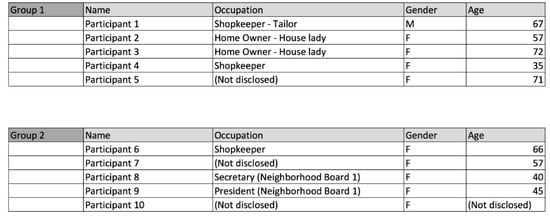
Figure 5.
Occupation and demographic characteristics of the participants of the community mapping exercise.
The 10 participants were divided into 2 groups of 5 members, and two facilitators were allocated to each group. The entire area of Chañaral is about 2.5 km × 4 km, which is small enough for community members to understand the entire layout of the city and be able to provide insights about how it works. The authors documented the entire mapping process using video and audio recorders. This information provided valuable knowledge about the victim’s experience during the workshop, allowing a deeper understanding of their needs, feelings, and experiences in these emergency situations.
At first, participants were first asked to draw a sketch map of their territory on a blank A4 sheet of paper to elucidate what they considered to be important locations in the area in a post-disaster situation, with minimum guidance or supporting maps (see Figure 6). This drawing was used to identify the participants’ subjective view of the area, in order to see what the community found significant in the aftermath of a disaster.
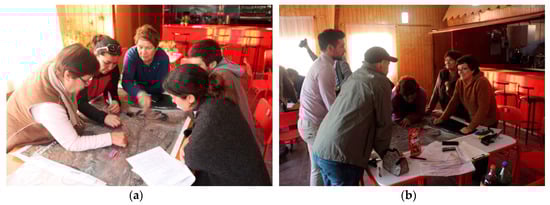
Figure 6.
Community mapping workshop. Exercise 2–Satellite Map: (a) Group 1, (b) Group 2.
In the second step, the participants were given an A0 size printed satellite map of the area, and other stationery and drawing tools. After defining the legends for each mapping exercise, participants were requested to identify and indicate five different elements associated with the natural and anthropogenic hazards the community is facing. These 5 elements were:
- Tsunami hazard areas. Participants were asked to identify areas which were at risk of suffering from a tsunami.
- Flood hazard areas. Participants were asked to identify areas that could suffer damage due to river flooding, according to their past experiences and risk perceptions.
- Critical infrastructure/cultural centers and other important buildings in the area. Infrastructure (building, roads, services etc.) which is critical to maintain the minimum requirements for the community to continue to function during and after the disaster was considered to be the critical infrastructure. The participants were also asked to indicate any other important location which can be used for helping the community recover from a disaster.
- Safe zones, evacuation centers and evacuation routes. Participants were asked to identify the location of safe zones and the routes to reach them.
- Contaminated areas. Many areas of Chañaral city and the nearby coastline were contaminated by mining residues that have been carried by the river floods, particularly during the last two flooding events in 2015 and 2017. The participants were asked to indicate the extent of the contaminated areas.
3.4. Map Analysis
The first map drawings by each of the groups (on blank pieces of paper) were carefully analyzed to understand the participants’ understanding of their community, and the perceived importance of the elements that were drawn (such as buildings and structures). Since these maps were drawn without any supporting tools, there are significant differences between their representation of their area and the real satellite image.
The perceived hazards indicated on the satellite map were converted to individual GIS shapefiles. Finally, the 5 elements of the satellite image community mapping exercise, together with the final outcomes of the tsunami and flood simulations, were overlaid and analyzed using geographic information system (GIS) software ArcMap10.4 by ESRI.
3.5. Key Informant Interview
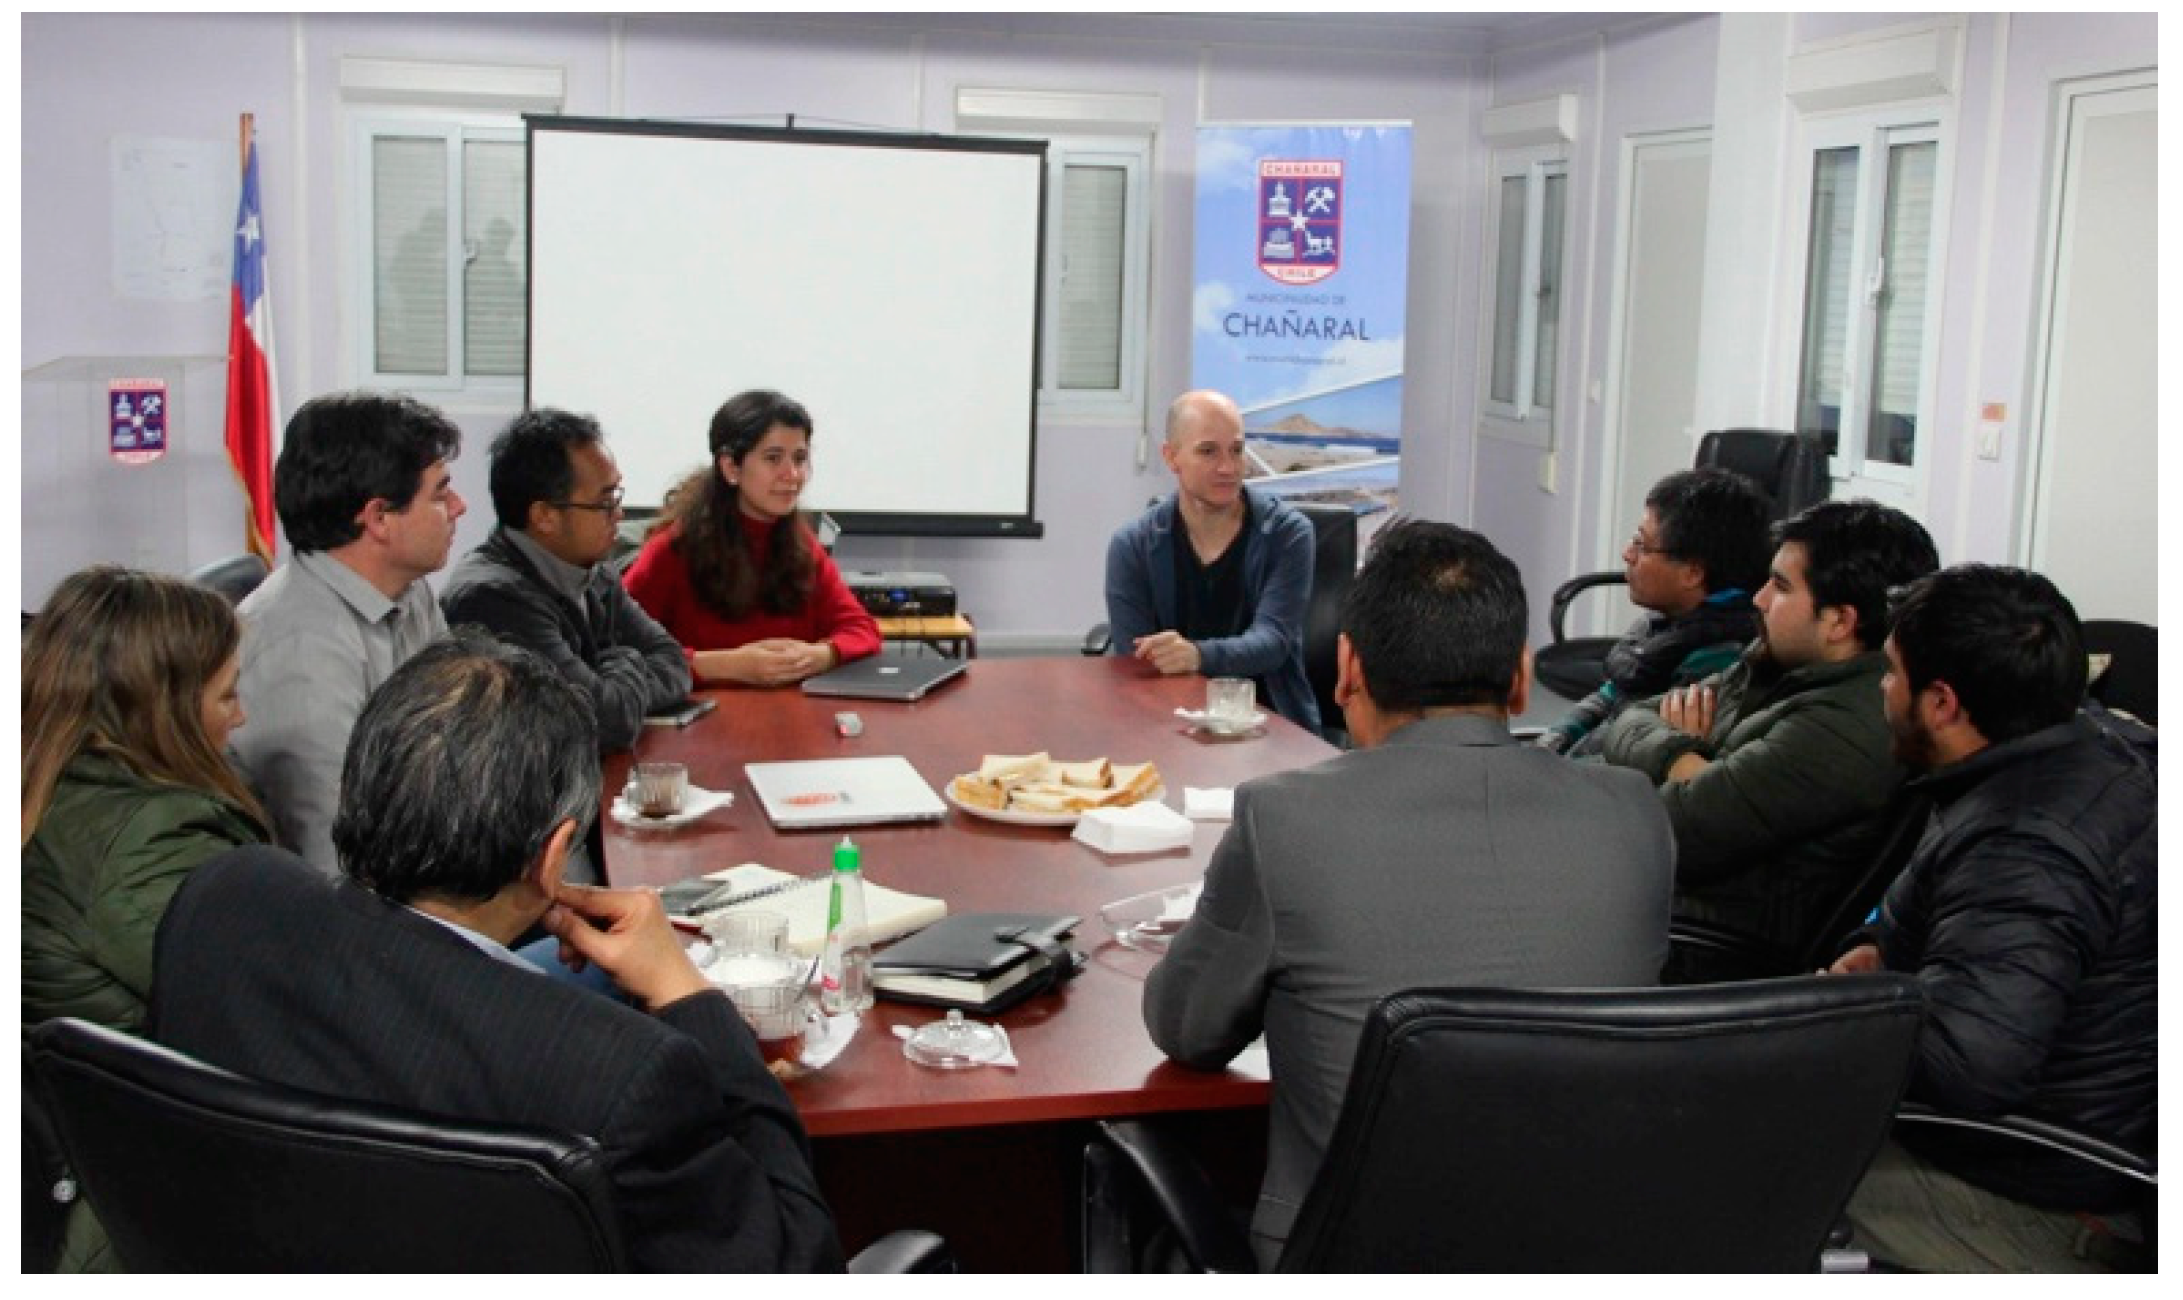
To complement the community mapping exercise, the authors also conducted key informant interviews with the city mayor and 9 other council members (including planning officers and civil servants, see Figure 7). The interviews were conducted in Spanish and lasted for just over two hours. In the interviews, the authors asked a number of questions regarding 5 different main topics [50]: Anticipatory Capacity (“How do you address threats in your community?”; “Are there any organizations or groups that help in disaster preparedness? Who and how?”; “What were the changes in how you perceive and act on threats in your community?”; “How do you rate disaster preparedness in your community? (1–5 scale*) and why?”), Adaptive Capacity (“Have businesses recovered from the disaster and how so?”; “Are people able to regain their livelihood now? Are there any changes? How?”; “How fast were people able to access basic services after the disaster?”; “How do you rate the ability of your community to build back after the disaster (1–5 scale) and what were the factors that contributed to it?”), Absorptive Capacity (“How did your community invest in post-disaster recovery? Who provided the resources?”; “Where there local and external organizations that contributed financial resources to your community?”; “How did they work with you and are they still working with you now?”; “If a disaster strikes now, do you think your community would be able to withstand and recover from it? Rate 1–5 and why?”), Transformative Capacity (“How did you design your community’s disaster recovery plan? How involved were you with it?”; “How are the different sectors in your community involved in the post-disaster recovery process?”; “What were the opportunities and challenges when engaging other sectors?”; “How participatory is your post-disaster recovery strategy? Rate 1 to 5 and what were the factors that contributed to this score?”) and Cultural Resilience (“How does the community view disasters before? Now?”; “Did cultural activities such as festivals change from the disaster? Why or why not?”; “How does your community intend to continue its cultural practices, and will there be any change to adapt to the changing environment? Why or why not? How?”; “Do you think disaster memory and resilience should be part of your cultural perspective? Why or why not?”).
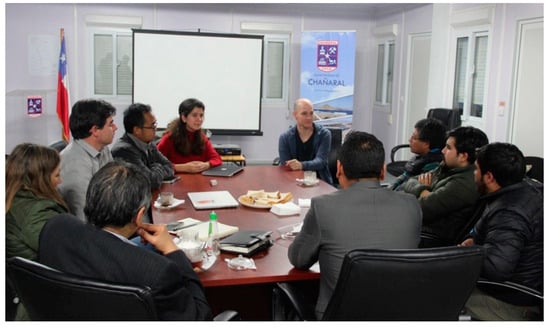
Figure 7.
Key informant interviews with planning officers and other civil servants.
4. Results
As mentioned earlier, the results involved the analysis of the sketches made and the satellite maps, which were then combined with the tsunami and flood simulations to gain an insight into the level of awareness of the inhabitants of Chañaral regarding natural disasters.
4.1. Community Mapping
4.1.1. Exercise 1–Sketch Map
As a result of the first mapping exercise two sketch maps were produced (one for each group), which provided a subjective view of the different risks and elements of interest in the town (Figure 8). On both of these maps it is clear that the mental image of residents about the layout of the town is different from reality, though these nevertheless provide an insight into their perception of the space in which they live. In them, they clearly recognize that the city is divided by the main road that passes through it (the PAN-American Highway, which is clearly a central feature of the city). From this central feature they then proceeded to describe the rest of the geography of the settlement. After placing the location of the main roads, they then started to situate elements such as the sea, the airport, the hospital and other points of interest.
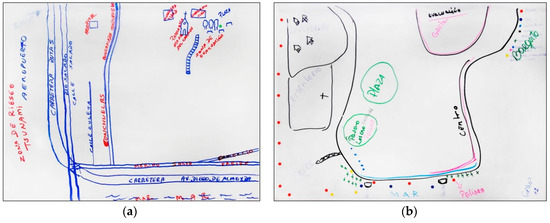
Figure 8.
Conceptual Map results: (a) Group 1, (b) Group 2.
After both groups drew the major landmarks on the paper (see Figure 8), they then proceeded to add some other important points about risk management in the area, including evacuation routes, evacuation points, danger-risk zones, and relevant disaster prevention infrastructure.
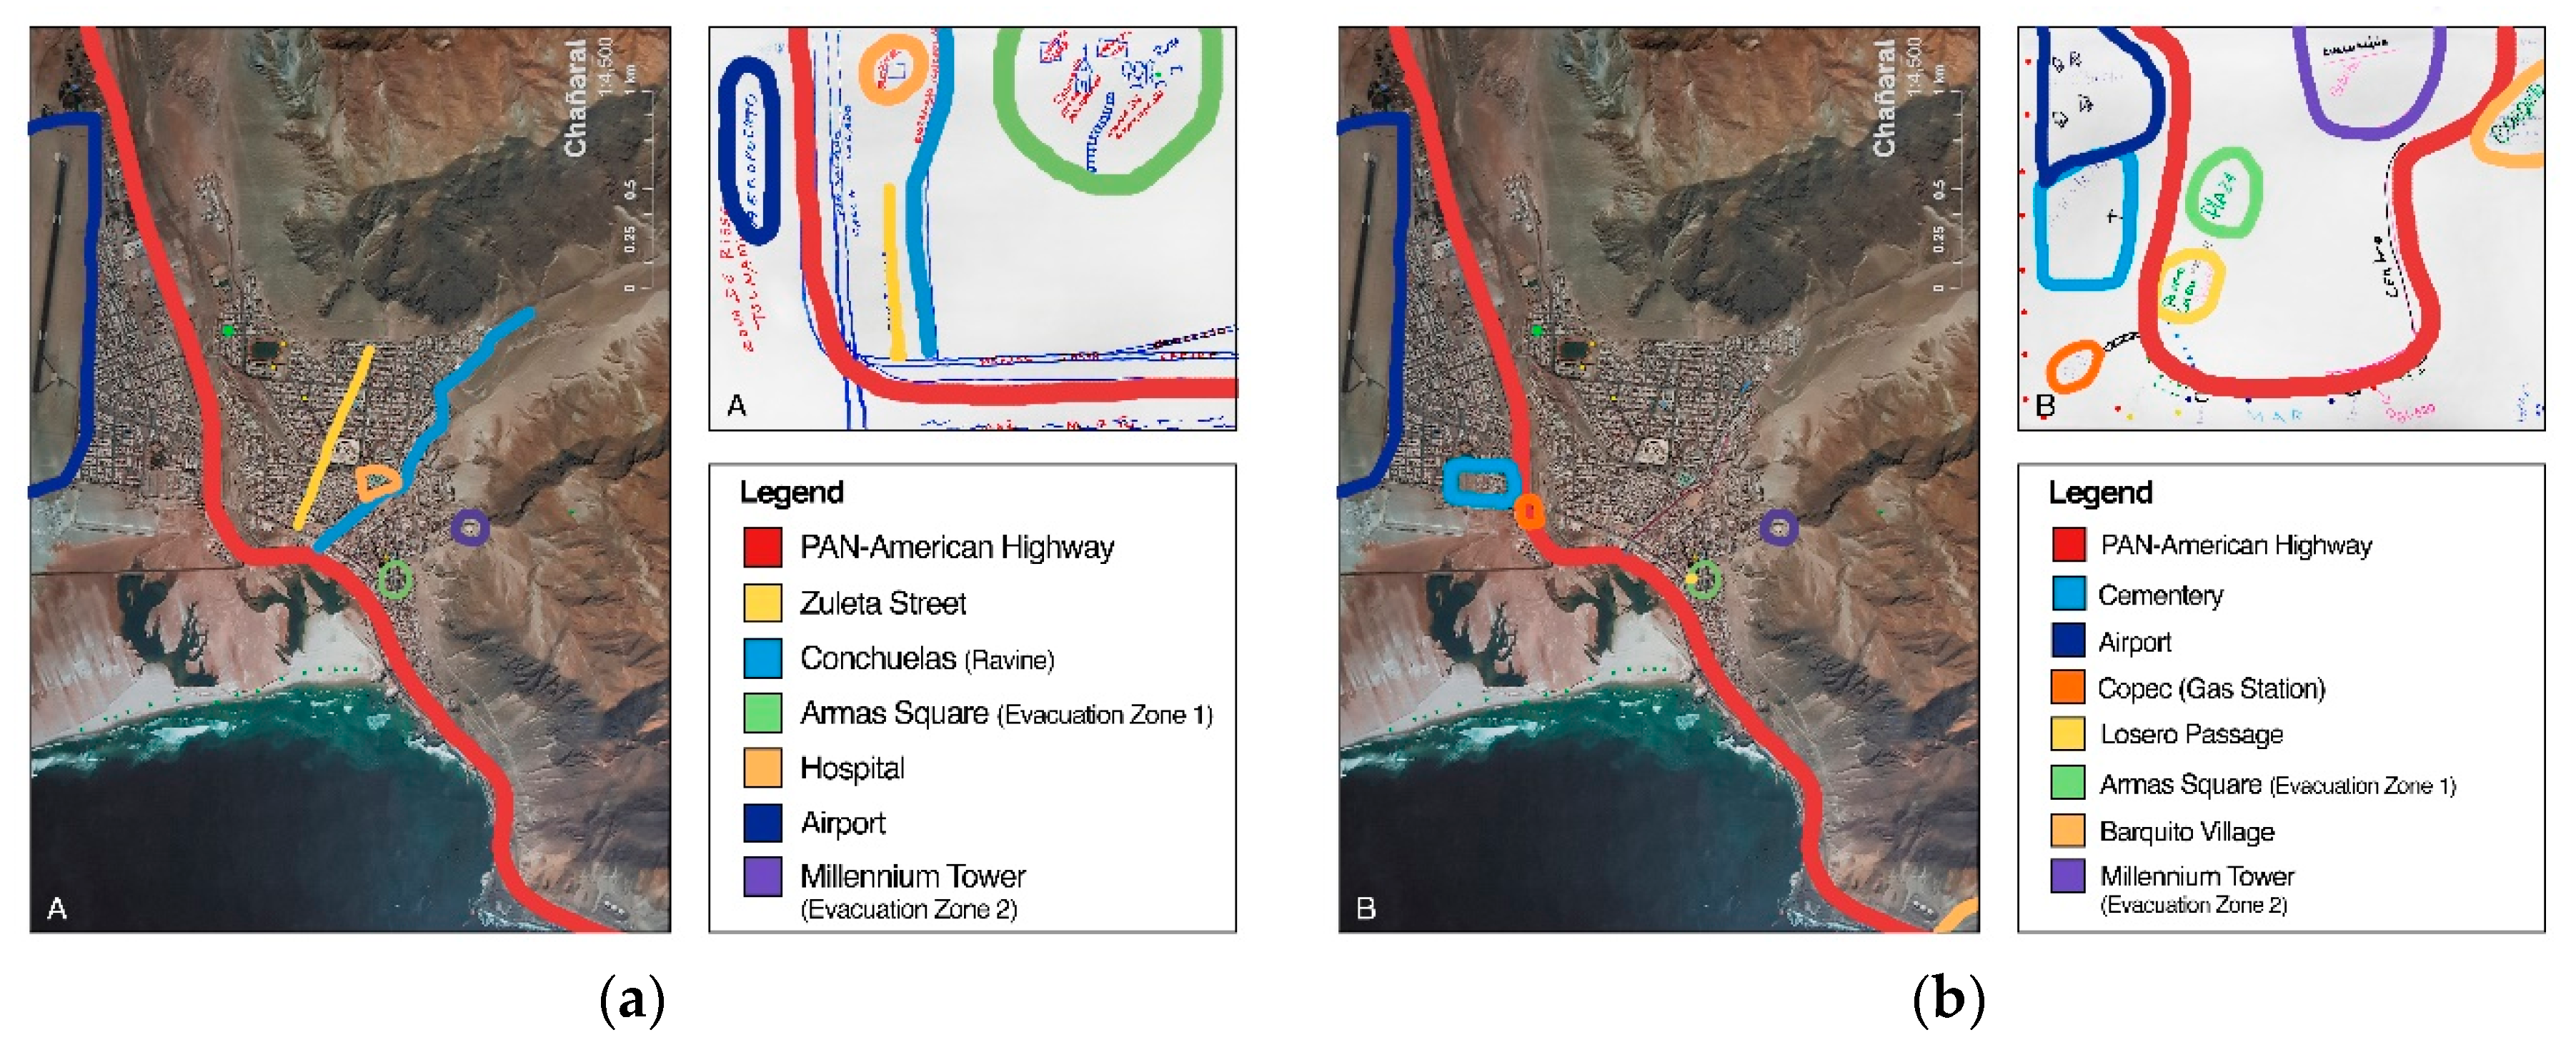
Figure 9 contrasts the sketches made with the real map of Chañaral. The first group (Figure 9a) emphasized information on the part of the city in which they lived, and that the map is almost devoid of information between Zuleta street and the Salado river. Essentially, this group mostly drew the elements they were more accustomed to interact with, within the part of the city in which they lived. They also considered that the area between the PAN-American Highway and the airport has the highest tsunami risk. In comparison, Group 2 (Figure 9b) added a number of other elements, including the cemetery, square, bridge, library and town hall, and the city center. However, the shape of the coast is distorted, and very different to reality (for example, the closest village, Barquito, is far from the community, though it is interesting how Group 1 did not even mention this settlement).
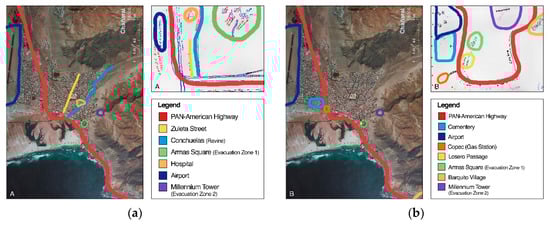
Figure 9.
The map of Chañaral (reality) vs. Sketch map (perception): (a) Group 1, (b) Group 2.
4.1.2. Exercise 2–Satellite Map
Following the completion of the first phase of the participatory mapping, the participants were then requested to once again draw on paper the five different elements that are important in disaster risk management (namely, (1) tsunami risk areas; (2) flood risk areas; (3) critical social and cultural infrastructure; (4) safe areas, evacuation centers and evacuation routes; (5) contaminated areas). However, this time they were provided with an A0 size printed satellite map of Chañaral (one for each group).
Figure 10 show the tsunami risk perception of Groups 1 and 2. Both groups highlight how the coastal areas are at risk, though Group 1 indicates that the risk extends to the airport, while Group 2 highlights that the tsunami can ascend through the river.
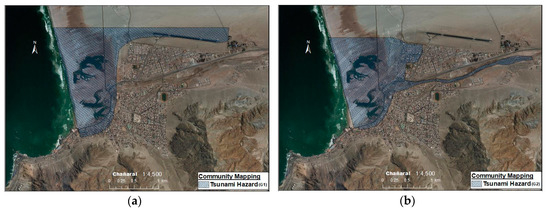
Figure 10.
Tsunami risk perception in Chañaral: (a) Group 1, (b) Group 2.
Figure 11 shows the flood risk perception. Each of the groups chose to focus on a different aspect of flooding, with Group 1 describing the floods coming from the “quebradas” (ravines) in the nearby mountains, and Group 2 those brought by the main river. One of the reasons for this difference can be found in the conceptual maps (Figure 8), where Group 1 concentrated on describing the events in the area where they lived (going into great effort to draw all the different flow paths), while some in Group 2 lived in a different side of city, and thus suffered more from the river flooding (they nevertheless also indicated flooding from the ravines, though these are difficult to appreciate in Figure 11b). Combining the results of the two maps appears to provide an accurate overall description of the flooding from both the rivers and ravines.
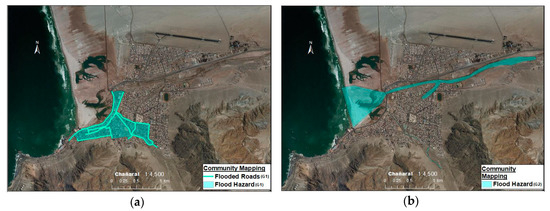
Figure 11.
Flood risk perception in Chañaral: (a) Group 1, (b) Group 2.
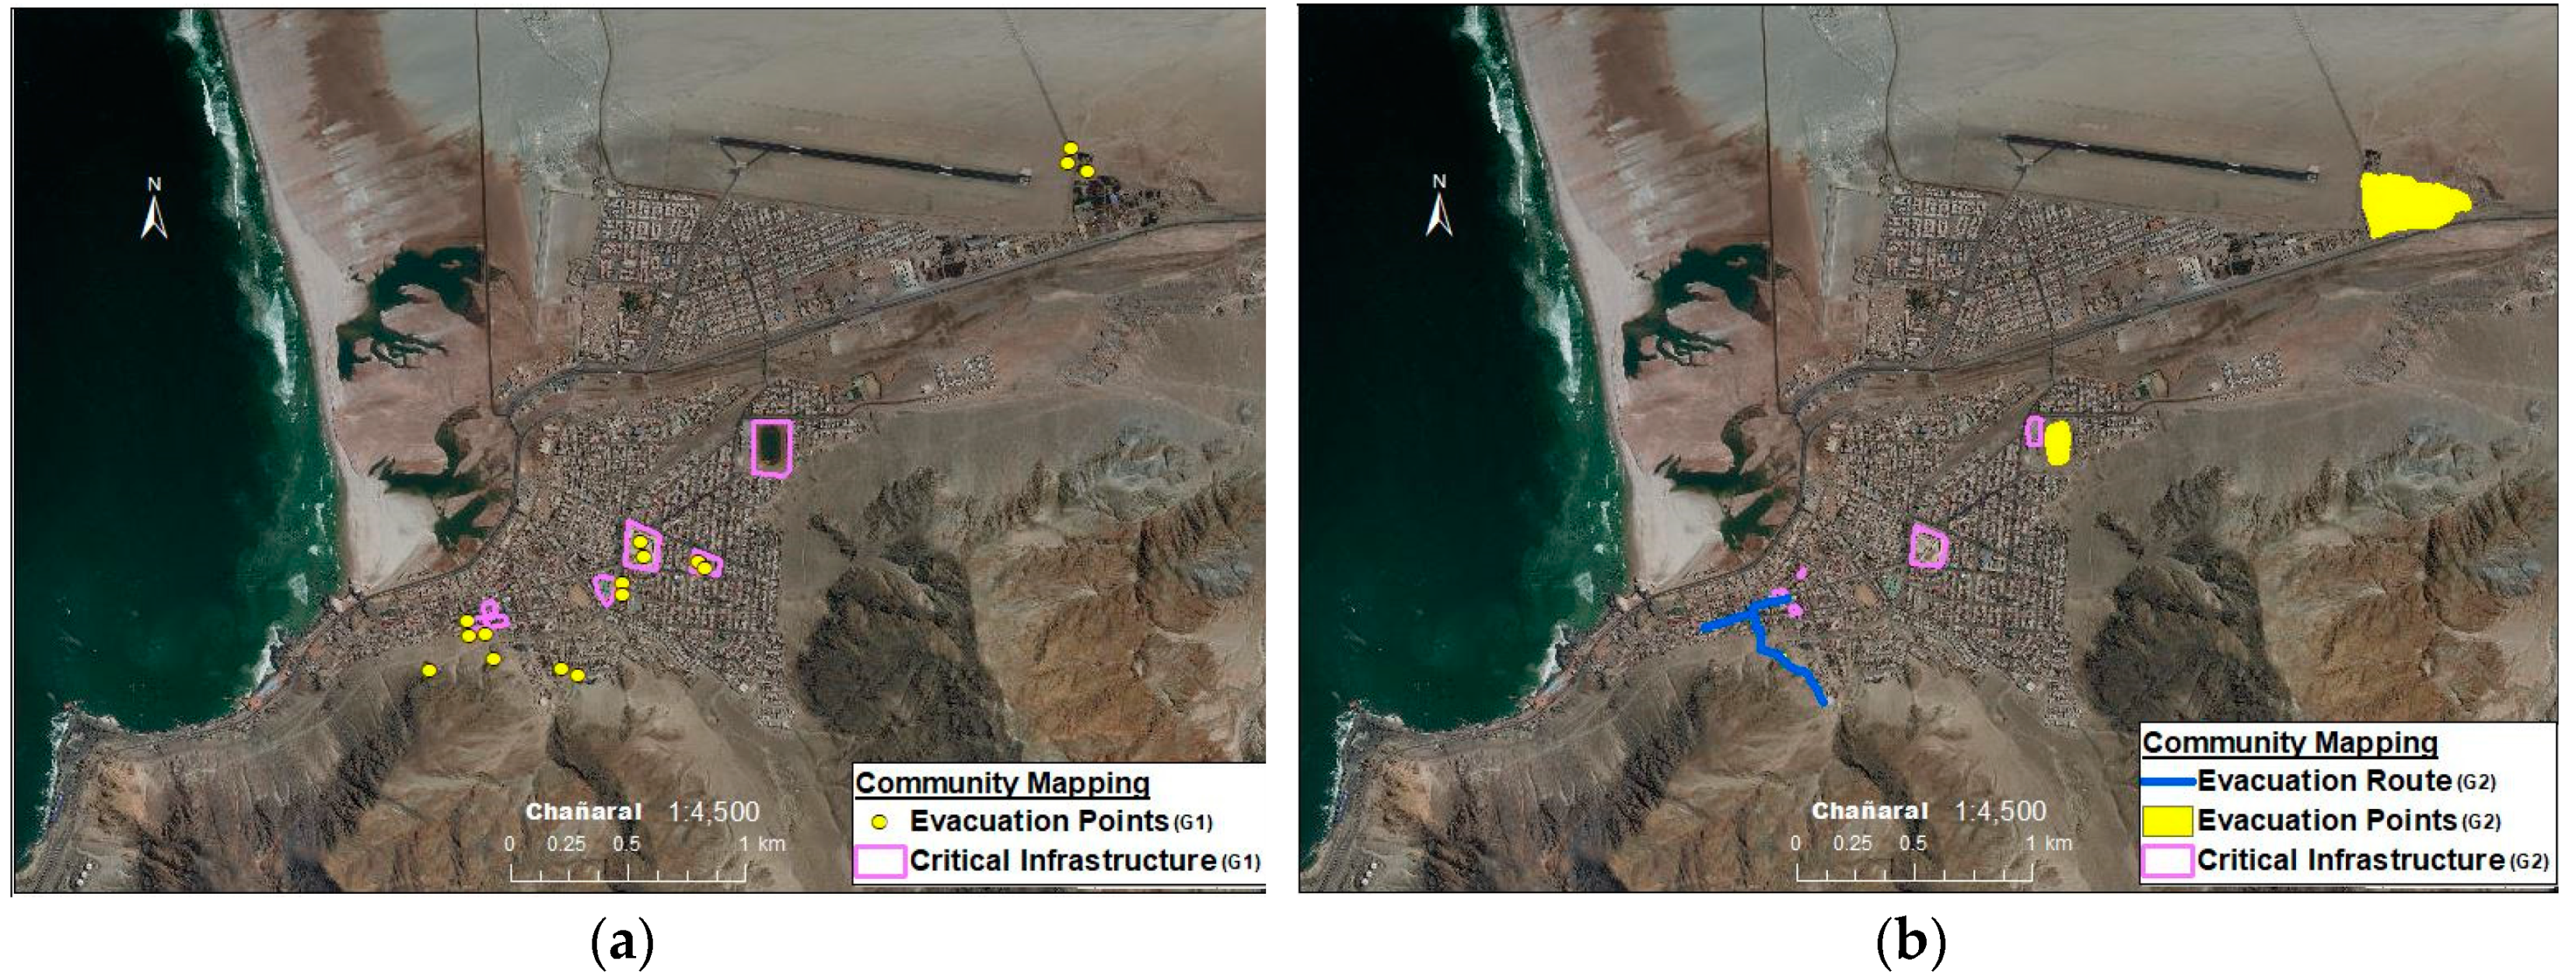
Figure 12 indicates the critical evacuation infrastructure in the town. Again, Group 1 concentrated on depicting the most important facilities in the area where they lived. However, both groups where generally in good agreement regarding town-wide important locations (highlighting high areas to evacuate to—such as the lighthouse and the far side of the airport—the hospital, and schools).

Figure 12.
Critical Evacuation Infrastructure in Chañaral: (a) Group 1, (b) Group 2.
4.2. Simulation Results
Figure 13a shows the tsunami flow depth obtained from SHOA [44], which agree well with the results of the simulations performed by the authors themselves (see Figure 4a). The flow depth is defined as the water column from the ground elevation to the water surface, and it is calculated as the inundation height (Figure 4a) minus the ground elevation. From the figure, it is possible to observe that an extreme tsunami would mostly flood the lower parts of the town and would surge up the dry riverbed. The flow depth could reach up to 6 m on urban areas, which would cause significant damage to structures. Figure 13b shows the limit of the river flood during the event of March 2015 (following the field surveys reported by Wilcox et al [9]).
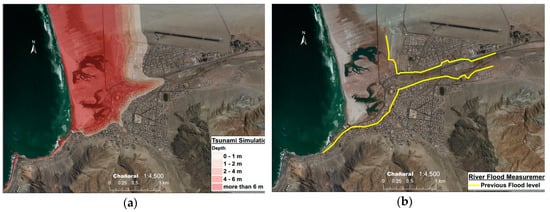
Figure 13.
(a) Tsunami Inundation map [44]. (b) Maximum extent of the river flooding according to post-disaster surveys.
4.3. Overlay
4.3.1. Tsunami Hazard
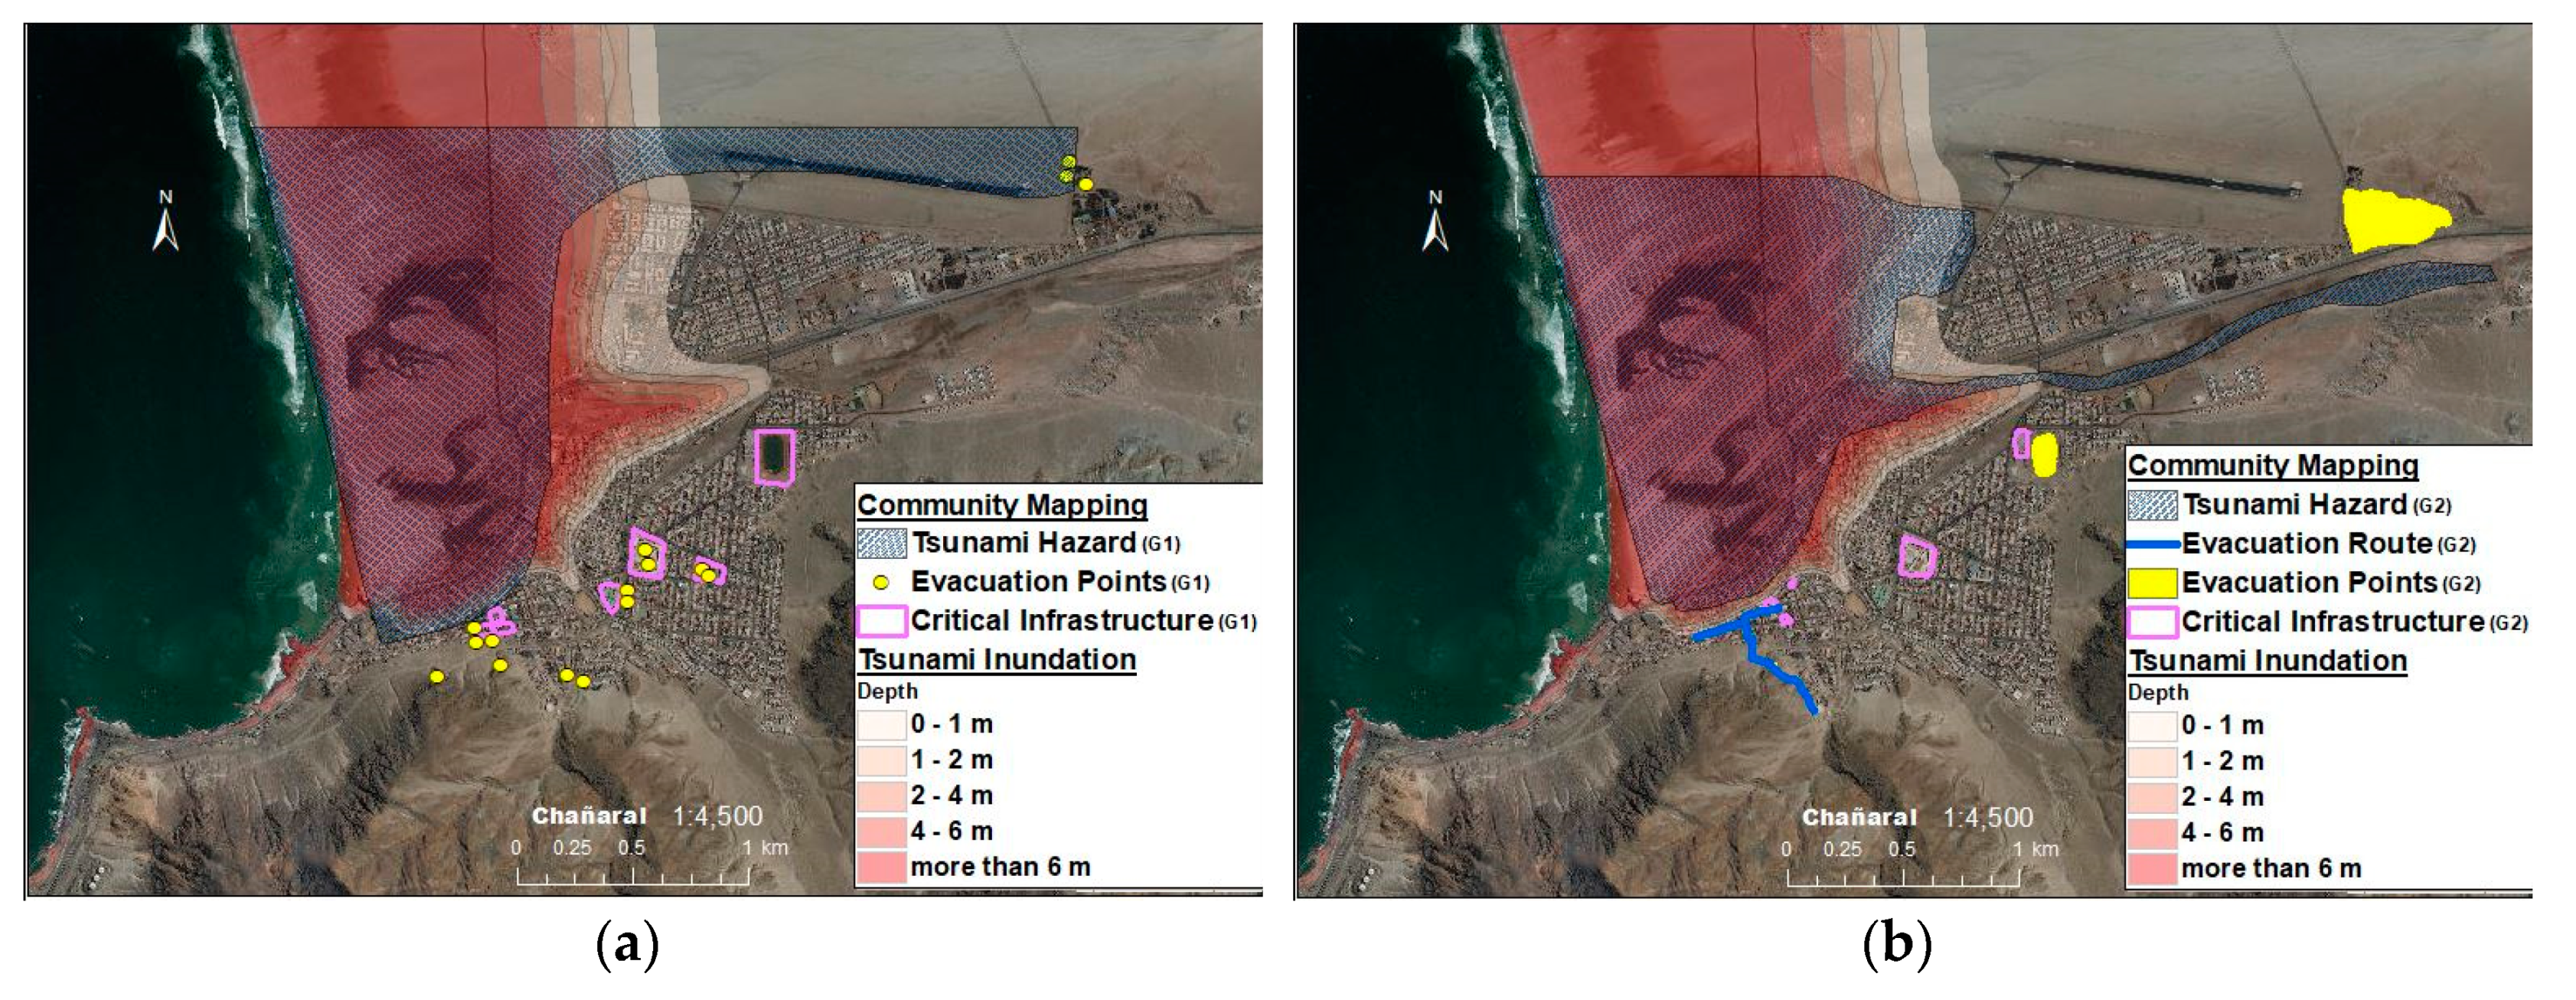
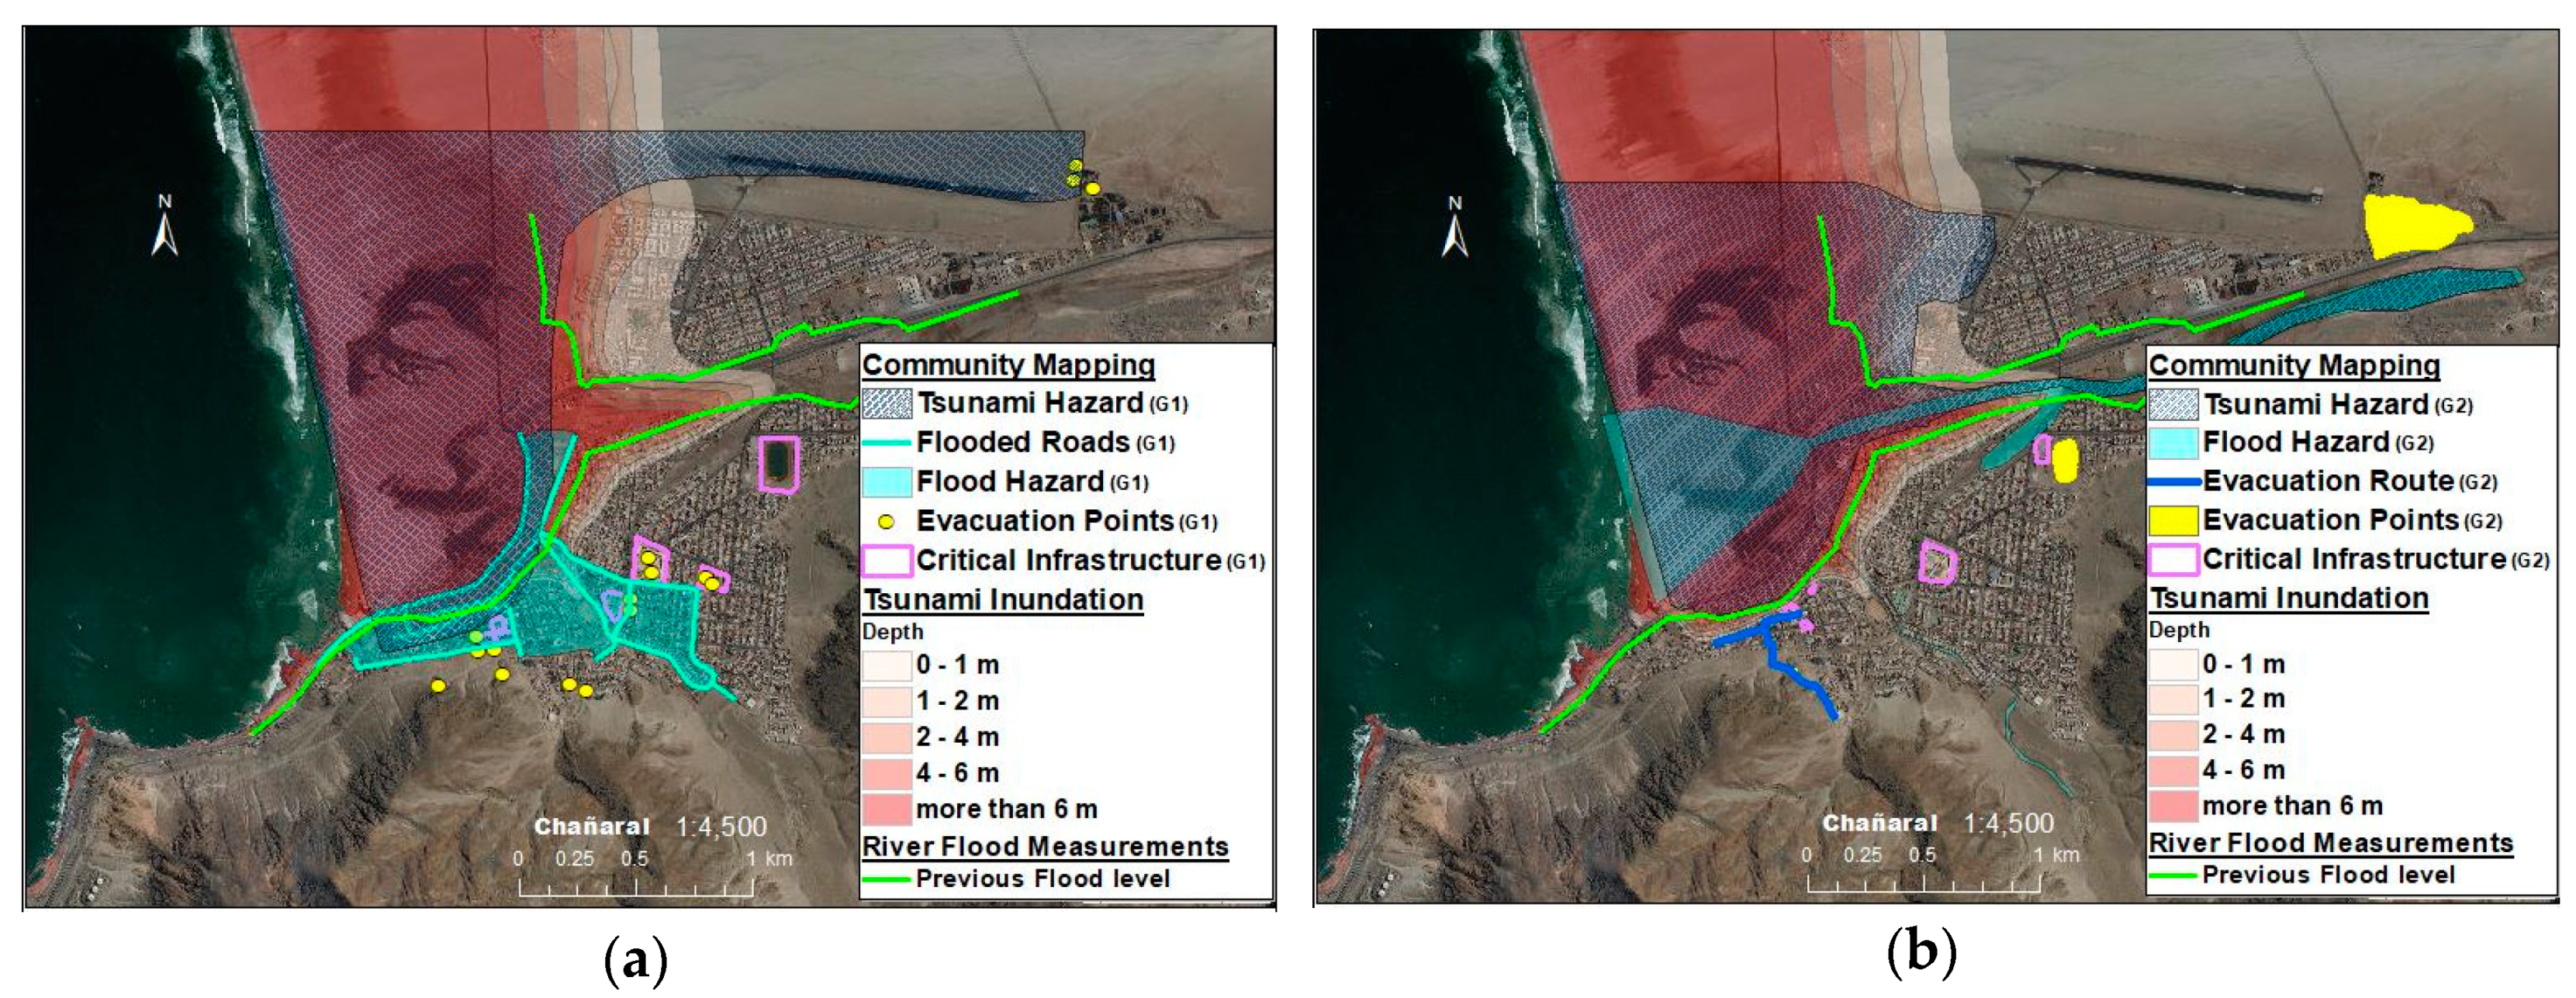
Figure 14 shows that there is a good agreement between the simulation and perception of tsunami inundation. However, it should be noted that people perceived some areas outside the simulated tsunami inundated area as still being at risk. Also, participants thought that the tsunami would run up the river further than it probably would do (according to the simulations).
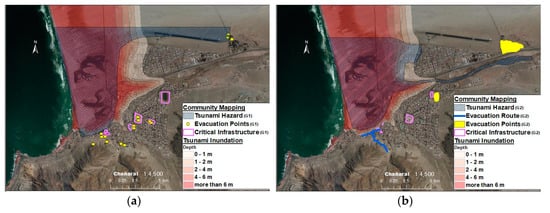
Figure 14.
Results of the tsunami inundation and perceptions of tsunami flooding risk: (a) Group 1, (b) Group 2. Note that the location of critical infrastructure is also shown.
4.3.2. Flood Hazard
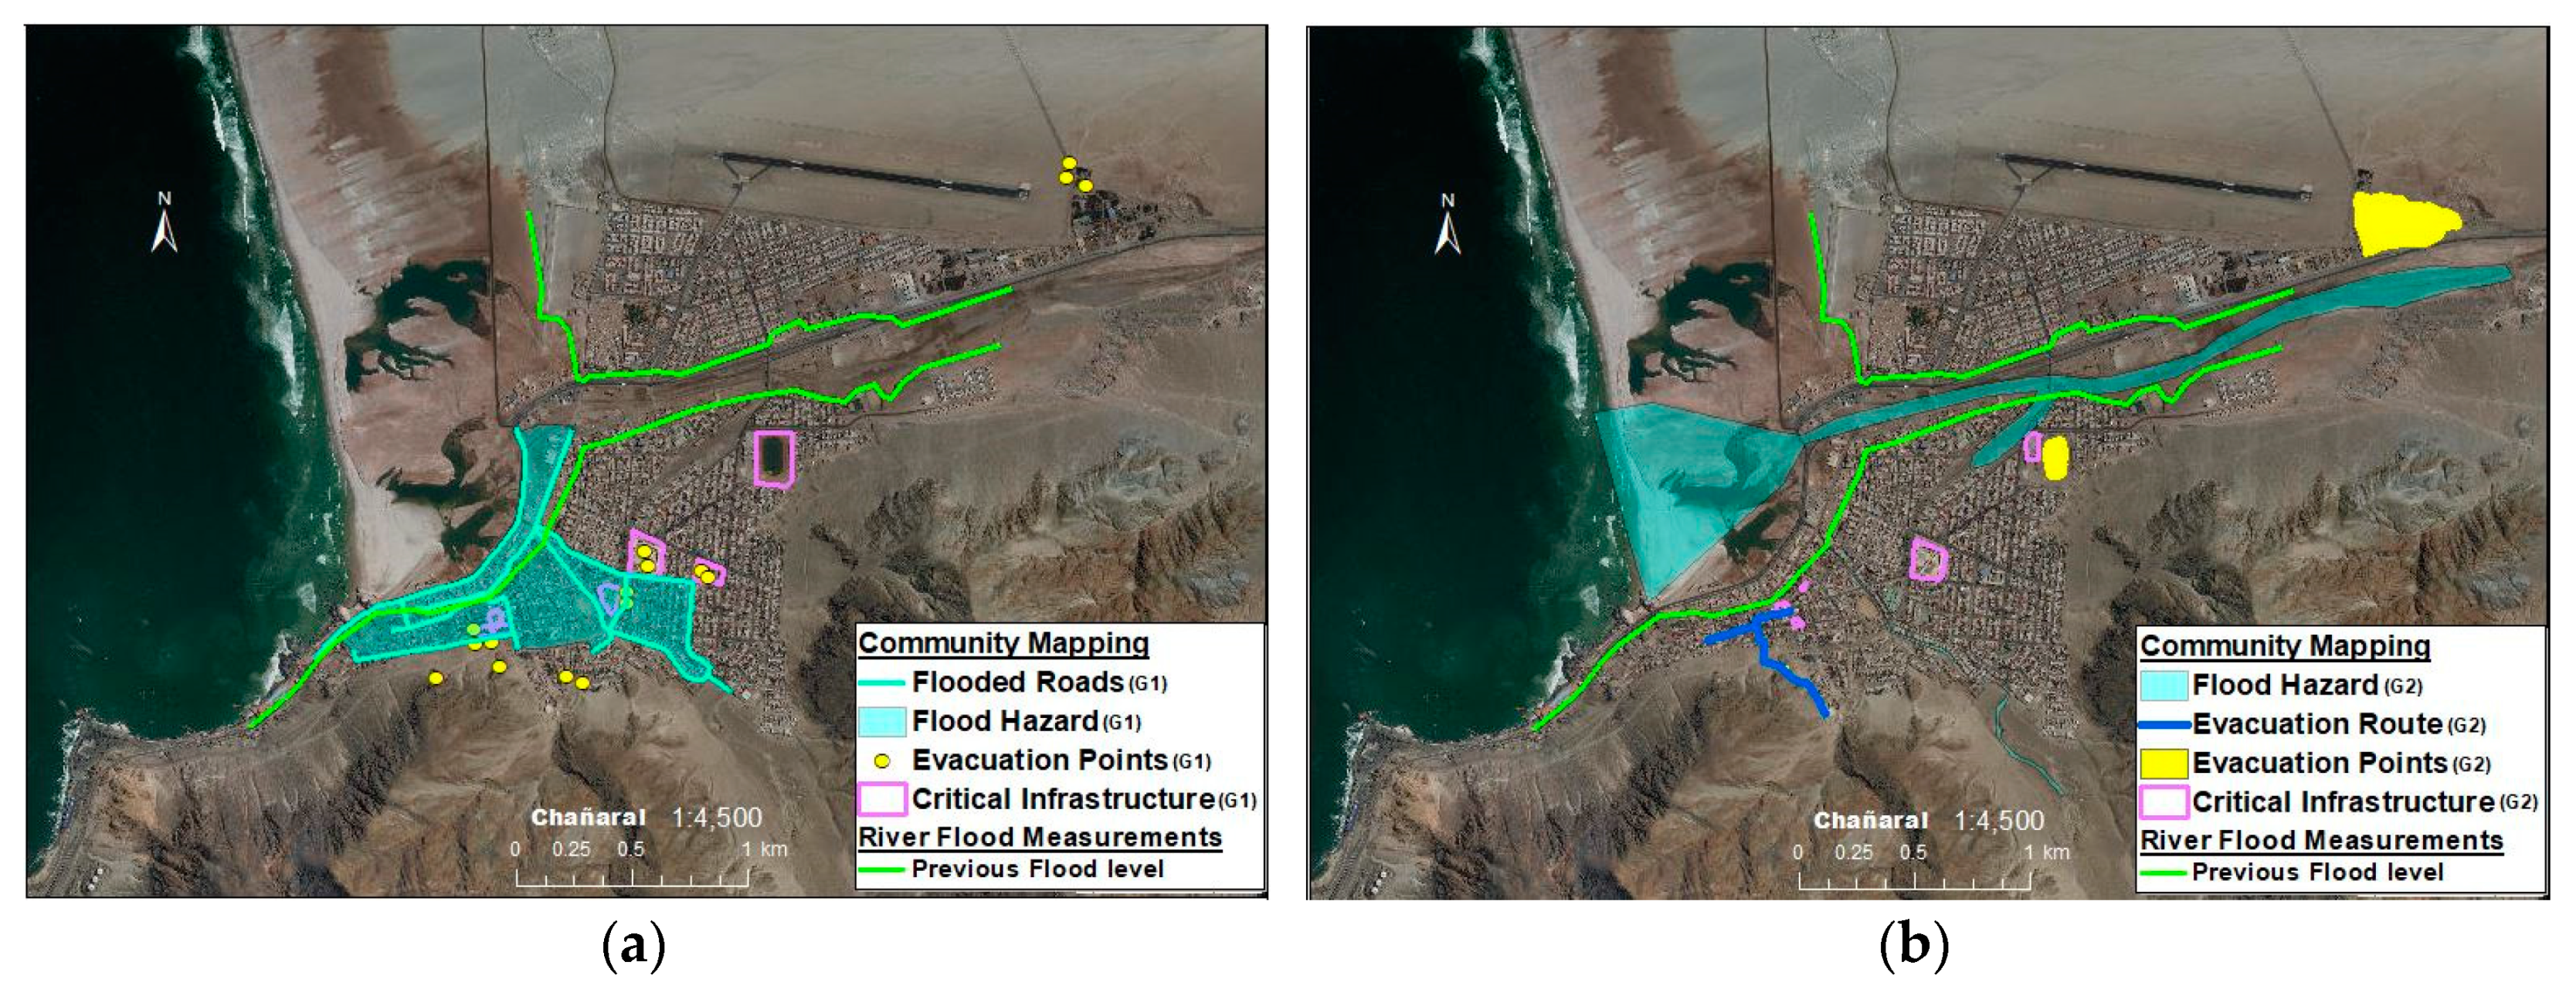
Figure 15 shows the results of the extent of the fluvial flooding (according to the field surveys by Wilcox et al., 2016) and the awareness of Groups 1 and 2. The three main evacuation areas indicated by participants appear to be safe against both fluvial and tsunami flooding.

Figure 15.
Extent of the floods and perceptions: (a) Group 1, (b) Group 2. Note that the location of critical infrastructure is also shown.
Finally, Figure 16 presents the combined simulated and perceived hazard maps for Groups 1 and 2. Generally speaking, most of the residential areas appear to be safe from tsunami threats, with the notable exception of those close to the coastline, and participants clearly recognized this. However, regarding river flooding there are more differences, with many areas being at risk, particularly from ravine flooding. The polluted beach has a high tsunami risk hazard, which could mean that contaminated soils would be washed inland in such an event.

Figure 16.
Simulated and perceived hazard maps: (a) Group 1, (b) Group 2.
4.4. Key Informant Interview
As stated earlier, key informant interviews were performed with the city mayor, who was supported by nine council members, on Friday, 4 August 2017, between 17:00–19:00. The authors asked the mayor to rate, on a scale of 1 to 5 (with 5 being the best), the various capacities of their community (see Valenzuela et al., 2019 [50], for more details regarding this). The mayor rated the overall anticipatory capacity as 2 in the year 2015, increasing to 3 in 2017. Essentially, in 2015 they had only been preparing against tsunamis, but after this they started to also monitor for flooding and conduct drills.
The adaptive capacity was rated as 4, as most local people and businesses recovered by themselves, without outside help. By 2017 they had learnt much from the events in 2015, and recovery was much faster. Absortive capacity was rated as 4, given that external and private organizations and volunteers from outside the community and private companies lent machinery and labor.
Regarding the transformative capacity, this was rated as five, as much has changed in the community. The mayor highlighted how the disasters represented an opportunity to improve things, and how the government, neighborhood associations, and other stakeholder were all involved in the reconstruction processes.
5. Discussion
Despite the relatively small number of participants compared to the overall population of the city, the previous sections appear to indicate that local residents have a good perception of the hazard risks in Chañaral. The mayor of Chañaral and his team believe that the town is safe against tsunamis and are more worried about floods, given that the frequency of these events has increased in recent years (which were rather infrequent in the past). The floods are thus perceived as a more imminent threat than tsunamis.
However, the community mapping exercise indicates that it is likely that local residents (when acting as a group) understand well the risks about tsunamis and know how to evacuate, and the inundation simulations show that a tsunami could cause widespread damage in the lower reaches of the city. Hence, it would appear that groups of residents have a more accurate perception of the risks than local authorities. This shows that the community relies more on traditional knowledge than on the information which is provided to them by the authorities.
With regards to the exercise itself, it was clear that through the use of conceptual maps participants were better prepared to afterwards tackle the identification of risk areas on the satellite map. It was interesting to note how many of those who participated had a distorted image about distances and the location of various roads and places within the town (as seen in the conceptual map), though they probably have an accurate knowledge of how long it takes to reach certain destinations in their own neighborhood. However, it is unclear what would happen if they were to be in a different part of the city when a disaster struck. Also, it is noteworthy that many people in the city work in areas close to the coastline, which are at high tsunami risk. Thus, this distorted perception of distance could influence potential casualties, and represents an interesting target for future research [51].
In term of group dynamics, during the group mapping exercise the research team could see how some of the participants were more active than others, becoming spontaneous leaders. This was to some extent counteracted by the authors, who attempted to make sure that the opinion of the quieter members was also heard. The researchers also inquired about the different experiences during recent disasters, and participants were actually eager to share their experiences during the 2015 and 2017 events. These stories are particularly important to detect uncovered problems, which might be more difficult to detect using other methodologies. Essentially, recalling a story and a continuous series of situations can enable a person to recognize difficulties or obstacles that they may encounter during a future disaster.
Regarding intended evacuation behavior, there is a noticeable difference in the intended evacuation behavior of the two groups. The first group believed it was more important to reach the man-made safe points such as the school, playground, or hospital which are also identified as critical infrastructure in the community. In contrast, the second group focused on evacuating to the mountain areas—where the lighthouse is located—which is also considered to be a safe place. This difference in intended behavior should be further examined to identify the underlying factors that influence community evacuation. Existing agent-based evacuation simulations [18,19,52] could be a good tool to simulate community behavior based on different scenarios and conditions.
Currently Chile has a tsunami alert system that is run by SHOA and ONEMI (National Office for Emergencies under the Ministry of the Interior, in its Spanish acronym), were the first institution identifies the risk of a tsunami and notifies it to ONEMI. This information is distributed to the population by policemen (carabineros), firefighters, and sometimes text messages sent to mobile phones. However, to date there are no fixed alarm systems, and thus a high level of awareness by the population, and the ability to quickly react to any evacuation trigger by the authorities, is of paramount importance to save lives.
One of the main limitations of the study is that the number of participants was limited. Also, out of 10 participants, only one was male. The youngest participant was 35 years old, so the perceptions of the younger generation were not included. Another potential limitation is the relatively small number of maps that were drawn. Nevertheless, it is worth noting how such relatively small exercises are not uncommon in community mapping exercises (see for example [23,53,54,55]) and are thus able to provide significant inputs into the HCD framework.
As stated earlier, inside HCD, the design thinking methodology has six phases, and the present research constitutes the first two of them. Thus, in future work the authors would like to attempt to devise strategies to improve the resilience of the community, continuing to collaborate with the people of Chañaral. According to the idea of the HCD methodology, the researchers plan to go back to the community to continue the next phases of Ideation (Phases 3 and 4) and Implementation (Phases 5 and 6).
6. Conclusions
The comparison exercise between the community mapping and the simulations was able to shed some light on the community level risk awareness in the city of Chañaral, Chile, and how well residents know the area in which they live. However, there are clear differences between the understanding of risks by groups of residents and the local authorities, with people relying mostly on traditional knowledge and their own experiences during recent disasters. This community-level traditional knowledge regarding tsunamis is on good agreement with the results of computer simulations and hazards assessment, highlighting the good levels of transmission of disaster information across generations in Chile.
In order to formulate a comprehensive disaster mitigation strategy for places like Chañaral it is necessary to conduct multi-hazard assessments (in this case against both river floods and tsunamis)). Looking only at one type of hazard is methodologically flawed and could even increase the overall risk.
Given that community groups in Chañaral have a good perception about the hazards they face, the elaboration of countermeasures should include their participation, rather than be dictated by the central government. In essence, after each disaster authorities could include these conceptual mapping exercises amongst community groups, and if a good level of awareness is present, then the HCD methodology could be used by transdisciplinary groups to elaborate countermeasures. This would allow such interventions to incorporate traditional knowledge that has been passed across generations, rather than proposing standard mitigation measures that might not be including all hazards.
Author Contributions
Conceptualization, C.C., A.H.T.S.K., V.P.V., N.I. and M.E.; Formal analysis, C.C., A.H.T.S.K.; Investigation, C.C., A.H.T.S.K., V.P.B.V., N.I., M.Q., R.Y. and M.E.; Methodology, C.C., V.P.B.V. and M.E.; Project administration, A.H.T.S.K., M.O. and M.E.; Software, P.H., G.B., T.M., R.C. and R.A.; Supervision, M.O., T.M. and M.E.; Validation, C.C:, M.Q. and R.Y.; Writing—original draft, C.C., A.H.T.S.K., V.P.B.V., N.I., R.A. and M.E.; Writing—review and editing, C.C., A.H.T.S.K., R.A. and M.E.
Acknowledgments
The authors would like to thank the kind contributions of different project funding and agencies to conduct the work that went into this project. Funding for students and faculty from the University of Tokyo was provided by the Science and Engineering Exchange Program with Latin America (SEELA) and the Graduate Program in Sustainability Science, Global Leadership Initiative (GPSS-GLI), both of which ultimately depend on the Japanese Ministry of Education (Mombukagakusho). Funding for the members of the Universidad Católica de la Santísima Concepcion and Tokyo City University was provided by the project FONDECYT/11140424. Funding for members of the Centro de Investigación para la Gestión Integrada del Riesgo de Desastres (CIGIDEN) team was provided by CONICYT/FONDAP/15110017. Finally, a part of the present work performed as a part of activities of Research Institute of Sustainable Future Society, Waseda Research Institute for Science and Engineering, Waseda University.
Conflicts of Interest
The authors declare no conflict of interest. The funders had no role in the design of the study; in the collection, analyses, or interpretation of data; in the writing of the manuscript, or in the decision to publish the results.
References
- Cabinet Office Government of Japan. Disaster Management in Japan; White Paper; Cabinet Office Government of Japan: Tokyo, Japan, 2016; pp. 1–48.
- Sandoval, V.; Voss, M. Disaster governance and vulnerability: The case of Chile. Polit. Gov. 2016, 4, 107–116. [Google Scholar] [CrossRef]
- Gall, M.; Cutter, S.L.; Nguyen, D.T. Governance in Disaster Risk Management (IRDR AIRDR Publication No. 3); Integrated Research on Disaster Risk: Beijing, China, 2014. [Google Scholar]
- United Nations. Disaster Preparedness for Effective Response: Guidance and Indicator Package for Implementing Priority Five of the Hyogo Framework; International Strategy for Disaster Reduction (ISDR): Geneva, Switzerland, 2015. [Google Scholar]
- United Nations. Hyogo Framework for Action 2005–2015: Building the Resilience of Nations and Communities to Disasters; International Strategy for Disaster Reduction (ISDR): Geneva, Switzerland, 2015. [Google Scholar]
- Sutton, J.; Tierney, K. Disaster Preparedness: Concepts, Guidance, and Research; University of Colorado: Denver, CO, USA, 2006. [Google Scholar]
- Center for Excellence in Disaster Management & Humanitarian Assistance. CHILE—Disaster Management Reference Handbook; Center for Excellence in Disaster Management & Humanitarian Assistance: Joint Base Pearl Harbor-Hickam, HI, USA, 2017. [Google Scholar]
- Houston, J. Variability of precipitation in the Atacama desert: Its causes and hydrological impact. Int. J. Climatol. 2006, 26, 2181–2198. [Google Scholar] [CrossRef]
- Wilcox, A.C.; Escauriaza, C.; Agredano, R.; Mignot, E.; Zuazo, V.; Otarola, S.; Castro, L.; Gironas, J.; Cienfuegos, R.; Mao, L. An integrated analysis of the march 2015 Atacama floods. Geophys. Res. Lett. 2016, 45, 8035–8043. [Google Scholar] [CrossRef]
- INE. Instituto Nacional de Estadisticas. Plantilla Censo 2017. National Institute of Statistics, 2017. Available online: http://www.censo2017.cl/descargue-aqui-resultados-de-comunas/ (accessed on 12 March 2017).
- Easton, G.V.; Caurapán, C.O. El aluvión de marzo de 2015, El Niño y los mayores episodios históricos en Chañaral de las Ánimas, Atacama. In Aluviones y Resiliencia en Atacama. Construyendo Saberes Sobre Riesgos y Desastres; Social-Ediciones: Santiago, Chile, 2018. [Google Scholar]
- Lomnitz, C. Major earthquakes and tsunamis in Chile during the period 1535 to 1955. Geol. Rundsch. 1970, 59, 938–960. [Google Scholar] [CrossRef]
- Soloviev, S.; Go, C.N. A Catalogue of Tsunamis on the Eastern Shore of the Pacific Ocean; Nauka Publishing House: Moscow, Russia, 1975. [Google Scholar]
- Esteban, M.; Valenzuela, V.P.; Namyi, Y.; Mikami, T.; Shibayama, T.; Matsumaru, R.; Takagi, H.; Thao, N.D.; de Leon, M.; Oyama, T.; et al. Typhoon Haiyan 2013 evacuation preparations and awareness. J-SustaiN J. 2015, 3, 37–45. [Google Scholar] [CrossRef]
- Esteban, M.; Valenzuela, V.P.; Matsumaru, R.; Mikami, T.; Shibayama, T.; Takagi, H.; Nguyen, D.T.; De Leon, M. Storm surge awareness in the Philippines prior to typhoon Haiyan: A comparative analysis with tsunami awareness in recent times. Coast. Eng. J. 2016, 58. [Google Scholar] [CrossRef]
- Esteban, M.; Takagi, H.; Nguyen, D.T.; Tam, T.T.; Trang, D.D.Y.; Anh, L.T.; Valenzuela, V.P. Awareness of coastal disasters: Case of an impoverished low-lying river mouth community in southern Vietnam. Int. J. Sustain. Future Hum. Secur. 2017, 5, 77–85. [Google Scholar] [CrossRef]
- San Carlos-Arce, R.; Onuki, M.; Esteban, M.; Shibayama, T. Risk awareness and intended tsunami evacuation behaviour of international tourists in Kamakura city, Japan. Int. J. Disaster Risk Reduct. 2017, 23, 178–192. [Google Scholar] [CrossRef]
- Takabatake, T.; Shibayama, T.; Esteban, M.; Ishii, H.; Hamano, G. Simulated tsunami evacuation behaviour of local residents and visitors in Kamakura, Japan. Int. J. Disaster Risk Reduct. 2017, 23, 1–14. [Google Scholar] [CrossRef]
- Takabatake, T.; Shibayama, T.; Esteban, M.; Ishii, H. Advanced casualty estimation based on tsunami evacuation intended behavior: Case study at Yuigahama Beach, Kamakura, Japan. Nat. Hazards 2018, 92, 1–26. [Google Scholar] [CrossRef]
- IFAD. Good Practices in Participatory Mapping; IFAD: Rome, Italy, 2009. [Google Scholar] [CrossRef]
- WaterAid. Community Mapping. In A Tool for Community Organising; WaterAid: London, UK, 2005. [Google Scholar]
- Cochrane, L.; Corbett, J.; Keller, P. Impact of community-based and participatory mapping. In Institute for Studies and Innovation in Community-University Engagement; University of Victoria: Victoria, BC, Canada, 2014. [Google Scholar]
- Jarzebski, M.P. Participatory mapping and problem ranking methodology in the research of sustainable communities—Workshop with indigenous people under community-based forest management program in the philippines. In Sustainability Science: Field Methods and Exercises; Springer: Cham, Switzerland, 2016. [Google Scholar]
- Jaya, N.M.P.; Nagai, M.; Reyes, G.M.; Miura, F. Improved risk assessment of tsunami inundation based on geospatial and local knowledge for sustainable development. Int. J. Sustain. Future Hum. Secur. J-SustaiN 2018, 6, 28–38. [Google Scholar] [CrossRef]
- Reason, P.; Bradbury, H. (Eds.) Handbook of Action Research: Participative Inquiry and Practice; Sage: Wuhan, China, 2001. [Google Scholar]
- Chevalier, J.M.; Buckles, D.J. Participatory Action Research: Theory and Methods for Engaged Inquiry; Routledge: Abingdon-on-Thames, UK, 2013. [Google Scholar]
- Rouse, W.B. Design for Success: A Human-Centered Approach to Designing Successful Products and Systems; Wiley-Interscience: Hoboken, NJ, USA, 1991; Volume 2. [Google Scholar]
- Brown, T. Design thinking. Harvard Bus. Rev. 2008, 86, 84–92. [Google Scholar]
- Brown, T. Change by Design. How Design Thinking Transforms Organizations and Inspires Innovation; Harper Collins Publishers: New York, NY, USA, 2009. [Google Scholar]
- Martin, R.L. The Design of Business: Why Design Thinking Is the Next Competitive Advantage; Harvard Business Press: Brighton, MA, USA, 2009. [Google Scholar]
- Papanek, V.; Fuller, R.B. Design for the Real World; Thames and Hudson: London, UK, 1972. [Google Scholar]
- Fulton Suri, J. Empathic design: Informed and inspired by other people’s experience. In Empathic Design: User Experience in Product Design; IT-Press: Helsinki, Finland, 2003; pp. 51–58. [Google Scholar]
- Koskinen, I.; Battarbee, K.; Mattelmäki, T. Empathic Design: User Experience in Product Design; IT Press: Wien, Austria, 2003. [Google Scholar]
- Sanders, E.B.-N.; Dandavate, U. Design for experiencing: New tools. In Proceedings of the First International Conference on Design and Emotion; Overbeeke, C.J., Hekkert, P., Eds.; Delft University of Technology: Delft, The Netherlands, 1999; pp. 87–91. [Google Scholar]
- Mattelmäki, T. Applying probes–from inspirational notes to collaborative insights. CoDesign 2005, 1, 83–102. [Google Scholar] [CrossRef]
- Esteban, M.; Takagi, H.; Shibayama, T. Handbook of Coastal Disaster Mitigation for Engineers and Planners; Butterworth-Heinemann (Elsevier): Oxford, UK, 2015. [Google Scholar]
- IDEO (Firm). The Field Guide to Human-centered Design: Design Kit; IDEO: Palo Alto, CA, USA, 2015. [Google Scholar]
- Tschimmel, K. Design thinking as an effective Toolkit for innovation. In Proceedings of the International Society for Professional Innovation Management (ISPIM), Seoul, Korea, 9–12 December 2012; p. 1. [Google Scholar]
- Crabtree, A.; Rouncefield, M.; Tolmie, P. Doing Design Ethnography; Springer Science & Business Media: Berlin/Heidelberg, Germany, 2012. [Google Scholar]
- Cadag, J.R.D.; Gaillard, J.C. Integrating knowledge and actions in disaster risk reduction: The contribution of participatory mapping. Area 2012, 44, 100–109. [Google Scholar] [CrossRef]
- Gaillard, J.C.; Pangilinan, M.L.C.J.D. Participatory mapping for raising disaster risk awareness among the youth. J. Conting. Crisis Manag. 2010, 18, 175–179. [Google Scholar] [CrossRef]
- Bacigalupe, G.; Ojeda, L. Tecnologías Emergentes Para la Participación Comunitaria en la Reducción del Riesgo de Desastres: El DronLab, Una Iniciativa de CIGIDEN-CINVIT-ADRA. In Emerging Technologies for Community Participation in Disaster Risk Reduction; COTA: Columbus, OH, USA, 2018. [Google Scholar]
- Ojeda, L.; Bacigalupe, G.; Pino, A. Coproduction after a disaster: The reconstruction of an informal settlement in Chile. Environ. Urban. 2018, 30. [Google Scholar] [CrossRef]
- Servicio Hidrográfico y Oceanográfico de la Armada (SHOA). Carta de Inundación por Tsunami (CITSU) Chañaral; SHOA: Valparaíso, Chile, 2014. [Google Scholar]
- Beck, S.; Barrientos, S.; Kausel, E.; Reyes, S. Source characteristics of historic earthquakes along the central Chile subduction zone. J. S. Am. Earth Sci. 1998, 11, 115–129. [Google Scholar] [CrossRef]
- Aranguiz, R.; Henríquez, P.; Esteban, M.; Mikami, T.; Cienfuegos, R.; Quiroz, M. New tsunami hazard assessment of Chañaral, Chile, after the coastal morphology changes due to the 2015 river flood. In Proceedings of the International Conference on Coastal Engineering ICCE2018, Baltimore, MD, USA, 30 July–3 August 2018. [Google Scholar] [CrossRef]
- Yamazaki, Y.; Kowalik, Z.; Cheung, K.F. Depth-integrated, non-hydrostatic model for wave breaking and run-up. Int. J. Numer. Meth. Fluids 2009, 61, 473–497. [Google Scholar] [CrossRef]
- Yamazaki, Y.; Cheung, K.F.; Kowalik, Z. Depth-integrated, non-hydrostatic model with grid nesting for tsunami generation, propagation, and run-up. Int. J. Numer. Meth. Fluids 2011, 67, 2081–2107. [Google Scholar] [CrossRef]
- Armaş, I. Earthquake risk perception in Bucharest, Romania. Risk Anal. 2006, 26, 1223–1234. [Google Scholar] [CrossRef]
- Valenzuela, V.P.B.; Samarasekara, R.S.M.; Kalarathna, A.H.T.S.; Cubelos, G.C.; Furukawa, N.; Crichton, R.N.; Quiroz, M.; Yavar, R.; Ikeda, I.; Aranguiz, R.; et al. Comparative analysis of tsunami recovery strategies in small communities in Japan and Chile. Geosciences 2019, 9, 26. [Google Scholar] [CrossRef]
- Arias, J.P.; Bronfman, N.C.; Cisternas, P.C.; Repetto, P.B. Hazard proximity and risk perception of tsunamis in coastal cities: Are people able to identify their risk. PLoS ONE 2017, 12, e0186455. [Google Scholar] [CrossRef] [PubMed]
- Mas, E.; Koshimura, S.; Imamura, F.; Suppasri, A.; Muhari, A.; Adriano, B. Recent advances in agent-based tsunami evacuation simulations: Case studies in Indonesia, Thailand, Japan and Peru. Pure Appl. Geophys. 2015, 172, 3409. [Google Scholar] [CrossRef]
- Corbett, J. Good Practices in Participatory Mapping: A Review Prepared for the International Fund for Agricultural Development; IFAD: Rome, Italy, 2009. [Google Scholar]
- Snow, L.K. The quick and simple congregational asset-mapping experience. In The Power of Asset Mapping: How Your Congregation Can Act on Its Gifts; Rowman & Littlefield: Lanham, MD, USA, 2004. [Google Scholar]
- Warner, C. Participatory mapping: A literature review of community-based research and participatory planning. In Social Hub for Community Housing, Faculty of Architecture and Town Planning Technion; Massachusetts Institute of Technology: Cambridge, MA, USA, 2015. [Google Scholar]


© 2019 by the authors. Licensee MDPI, Basel, Switzerland. This article is an open access article distributed under the terms and conditions of the Creative Commons Attribution (CC BY) license (http://creativecommons.org/licenses/by/4.0/).