Article

The Influence of Olive Orchards Copper-Based Fungicide Use, in Soils and Sediments—The Case of Aetoliko (Etoliko) Lagoon Western Greece

by
Pavlos Avramidis
1,*,
Pantelis Barouchas
2,
Thomas Dünwald
3,
Ingmar Unkel
3 and
Dionisios Panagiotaras
4
1
Department of Geology, University of Patras, 26504 Rio-Patras, Greece
2
Department of Agriculture University of Patras, Theodoropoulou Terma, Campus Amaliada, 27200 Amaliada, Greece
3
Institute for Ecosystem Research, Kiel University, Olshausenstrasse 75, 24118 Kiel, Germany
4
Department of Mechanical Engineering, University of Peloponnese, M. Alexandrou 1, 26334 Patras, Greece
*
Author to whom correspondence should be addressed.
Geosciences 2019, 9(6), 267; https://doi.org/10.3390/geosciences9060267
Submission received: 15 May 2019 / Revised: 30 May 2019 / Accepted: 13 June 2019 / Published: 19 June 2019
(This article belongs to the Section Geochemistry)

Abstract

:
In this study, soil and aquatic sediments were sampled in the Aetoliko Lagoon and its catchment area, which is exclusively dominated by olive orchards. For the first time in Greece, soil as well as sediments samples of one coherent protected aquatic ecosystem were directly compared. In order to determine the influence that the usage of copper-based fungicides have on the lagoon sediments and on the soils of the surrounding area, twenty five (25) soil samples from different olive orchards that are bordering the water body and ten (10) sediment samples from the bottom of the lagoon were taken. The samples were analyzed for total copper content (total digestion) and extractable copper (diethylenetriaminepenta acetic acid, DTPA, extraction method). Furthermore, soil/sedimentological and geochemical analyses such as pH, grain size, total organic carbon, total sulfur, total nitrogen, and calcium carbonate content were carried out. The results show that the total copper in soils ranges from 58.37 to 671.33 mg kg−1. In addition the DTPA-extractable copper in soils has an average value of 45.00 mg kg−1. The average value of total copper in soils (286.24 mg kg−1) is higher than the threshold value for the Cu concentration (100 mg kg−1) set by the EU countries. Total copper content in the lagoon sediments is lower than in soils and varies between 43.85 mg kg−1 and 71.87 mg kg−1. The DTPA-extractable copper in sediments is in low ranges from 0.14 to 0.60 mg kg−1. On average, the total copper value for the lagoon sediments (55.93 mg kg−1) exceeds the Toxicity Screening Value (25.20 mg kg−1) for Cu in freshwater sediments. From the present study, it is clear that, although the copper in soils of the surrounding lagoon area exceeds the threshold limit for ecological risk, the lagoon sediments are influenced in a smaller degree. Our study can be used as a valuable reference and baseline for future studies on the environmental monitoring of the Aetoliko lagoon, as well as for studies in similar ecosystems.

1. Introduction

The artificial entry and accumulation of copper in the environment can possibly influence the geochemical characteristics of soils and sediments in a negative way because copper works as a pollutant in high concentrations [1]. The olive tree and therefore olive orchards have been shaping cultural landscapes in many parts of Greece for thousands of years and play a vital role in the country’s culture. Even today it is still of crucial relevance to many families as a source of food and income. Nowadays, there are more than 530,000 Greek farms that produce olives on an average cultivation area of 1.6 ha [2]. The importance of today’s olive products (table olives and olive oil) for the Greek economy, especially for export, is still high. Olives accounted for 6.5% of all agricultural products in Greece and for 1.3% of the total Greek exports in 2012 [3]. The economic factor of olive farming has become even more important in recent years. In the course of the economic crisis and the following recession, olive and food exports in general increased. Food exports rose by 22.63% from 2008 to 2014 [3].
The basics of olive cultivation have not been changed very much in all this time, but certain agricultural advancements that have been discovered over the course of time had eventually made their way into the Greek olive production. There are three different agronomic management techniques in olive farming: Low-input traditional plantations, intensified traditional plantations, and intensive modern plantations [4]. Sparsely planted, old trees that were occasionally planted together with other fruit trees, growing in rather mountainous areas, are described in the low-input fraction. Their fields are rarely fertilized, irrigated, or treated with herbicides. Intensified traditional plantations normally contain younger trees planted in higher densities. The use of herbicides and fungicides is common and the yields are higher than in low-input traditional plantations [4].
The application of copper based fungicides like copper hydroxide and copper sulphate is common in modern olive production [5]. Residues of the fungicide accumulate in the soil or are washed off by rain or are misapplied by spray drift and thus transferred to other sites and enter waterways where they mainly act as pollutants [1]. Copper based fungicides are used worldwide to protect crop production from fungal diseases, and as a result, much of this trace element accumulates in the soils and/or transferred to water bodies and sediments [6,7]. Copper content in uncontaminated soils varies between 2 and 40 mg kg−1. Contaminated soils can show concentrations of more than 1000 mg kg−1 [8]. The guideline value on the basis of ecological risk is set at 150 mg kg−1 [9,10]. Greece devotes 60% of its cultivated agricultural land to something more than 127 million olive trees cultivation and contributes to the 0.6% of the national gross product. In the Western Greece region, the cultivated land with olive trees is about 82,883.88 ha, and in the prefecture of Aitoloakarnania, about 25,000 ha [11].
The objectives of the present study are to determine the total and bioavailable Cu contents in the soils around the Aetoliko lagoon and the bottom sediments of the lagoon in order to delineate whether there is a critical accumulation of this element both in the terrestrial and in the aquatic environment. By analyzing the data, the present study aims to increase the knowledge about the effects of the use of copper-based fungicides in agriculture, and furthermore, find out more about the relationship between the use of copper-based fungicides on olive trees and the soil quality in the treated plantations. The copper content of aquatic sediment samples of the neighboring Aetoliko lagoon was determined to examine whether the extensive use of the fungicides can be traced in the bottom sediment of this special water body and whether the artificially accumulated copper concentration of the soil can cause problems on the protected aquatic ecosystem.

2. Study Area

The present study focuses on the Aetoliko lagoon in Western Greece (Figure 1a–c). The area around the lagoon is covered by olive trees, and copper-based products (copper hydroxide 50%) are usually used to protect the olive orchards against fungi and related diseases such as the peacock spot Cycloconium (Spilocea oleaginum) and Gloeosporium olivarum with a rate of 2.6 kg m−3 of water, using 1.5–3 L of spray water per hectare. Usually, spray applications with fungicides are repeated 2–5 times from autumn to spring, after bloom period, pruning, or frost. The Aetoliko Lagoon is inseparably combined with the ecosystem of the Messolonghi, Klisova, and Aetoliko Lagoons complex. This delicate ecosystem consists of brackish wetlands, coastal salt marshes, dunes, and riparian forests. The lagoons are protected by the Ramsar Convention and are nature protection areas in the sense of the Natura 2000 network of the European Union [12]. The Aetoliko Lagoon is a unique landlocked lagoon with tectonic origin, hypoxic/anoxic conditions, and suffers from ecological problems [13,14,15]. The lagoon has attracted researcher’s interest over the past 70 years [15,16,17,18,19]. The geological formations of the surrounding lagoon area can be distinguished to the Pliocene to Holocene clastic sediments and to the rocky basement that consists of Triassic limestone with evaporites and Eocene limestone (Figure 1c). Furthermore, the geological evolution, depositional environments, and physicochemical conditions of the lagoon were studied by many researchers [15,20,21,22].

3. Materials and Methods

3.1. Sampling the Olive Orchards Soil and Lagoon Sediments

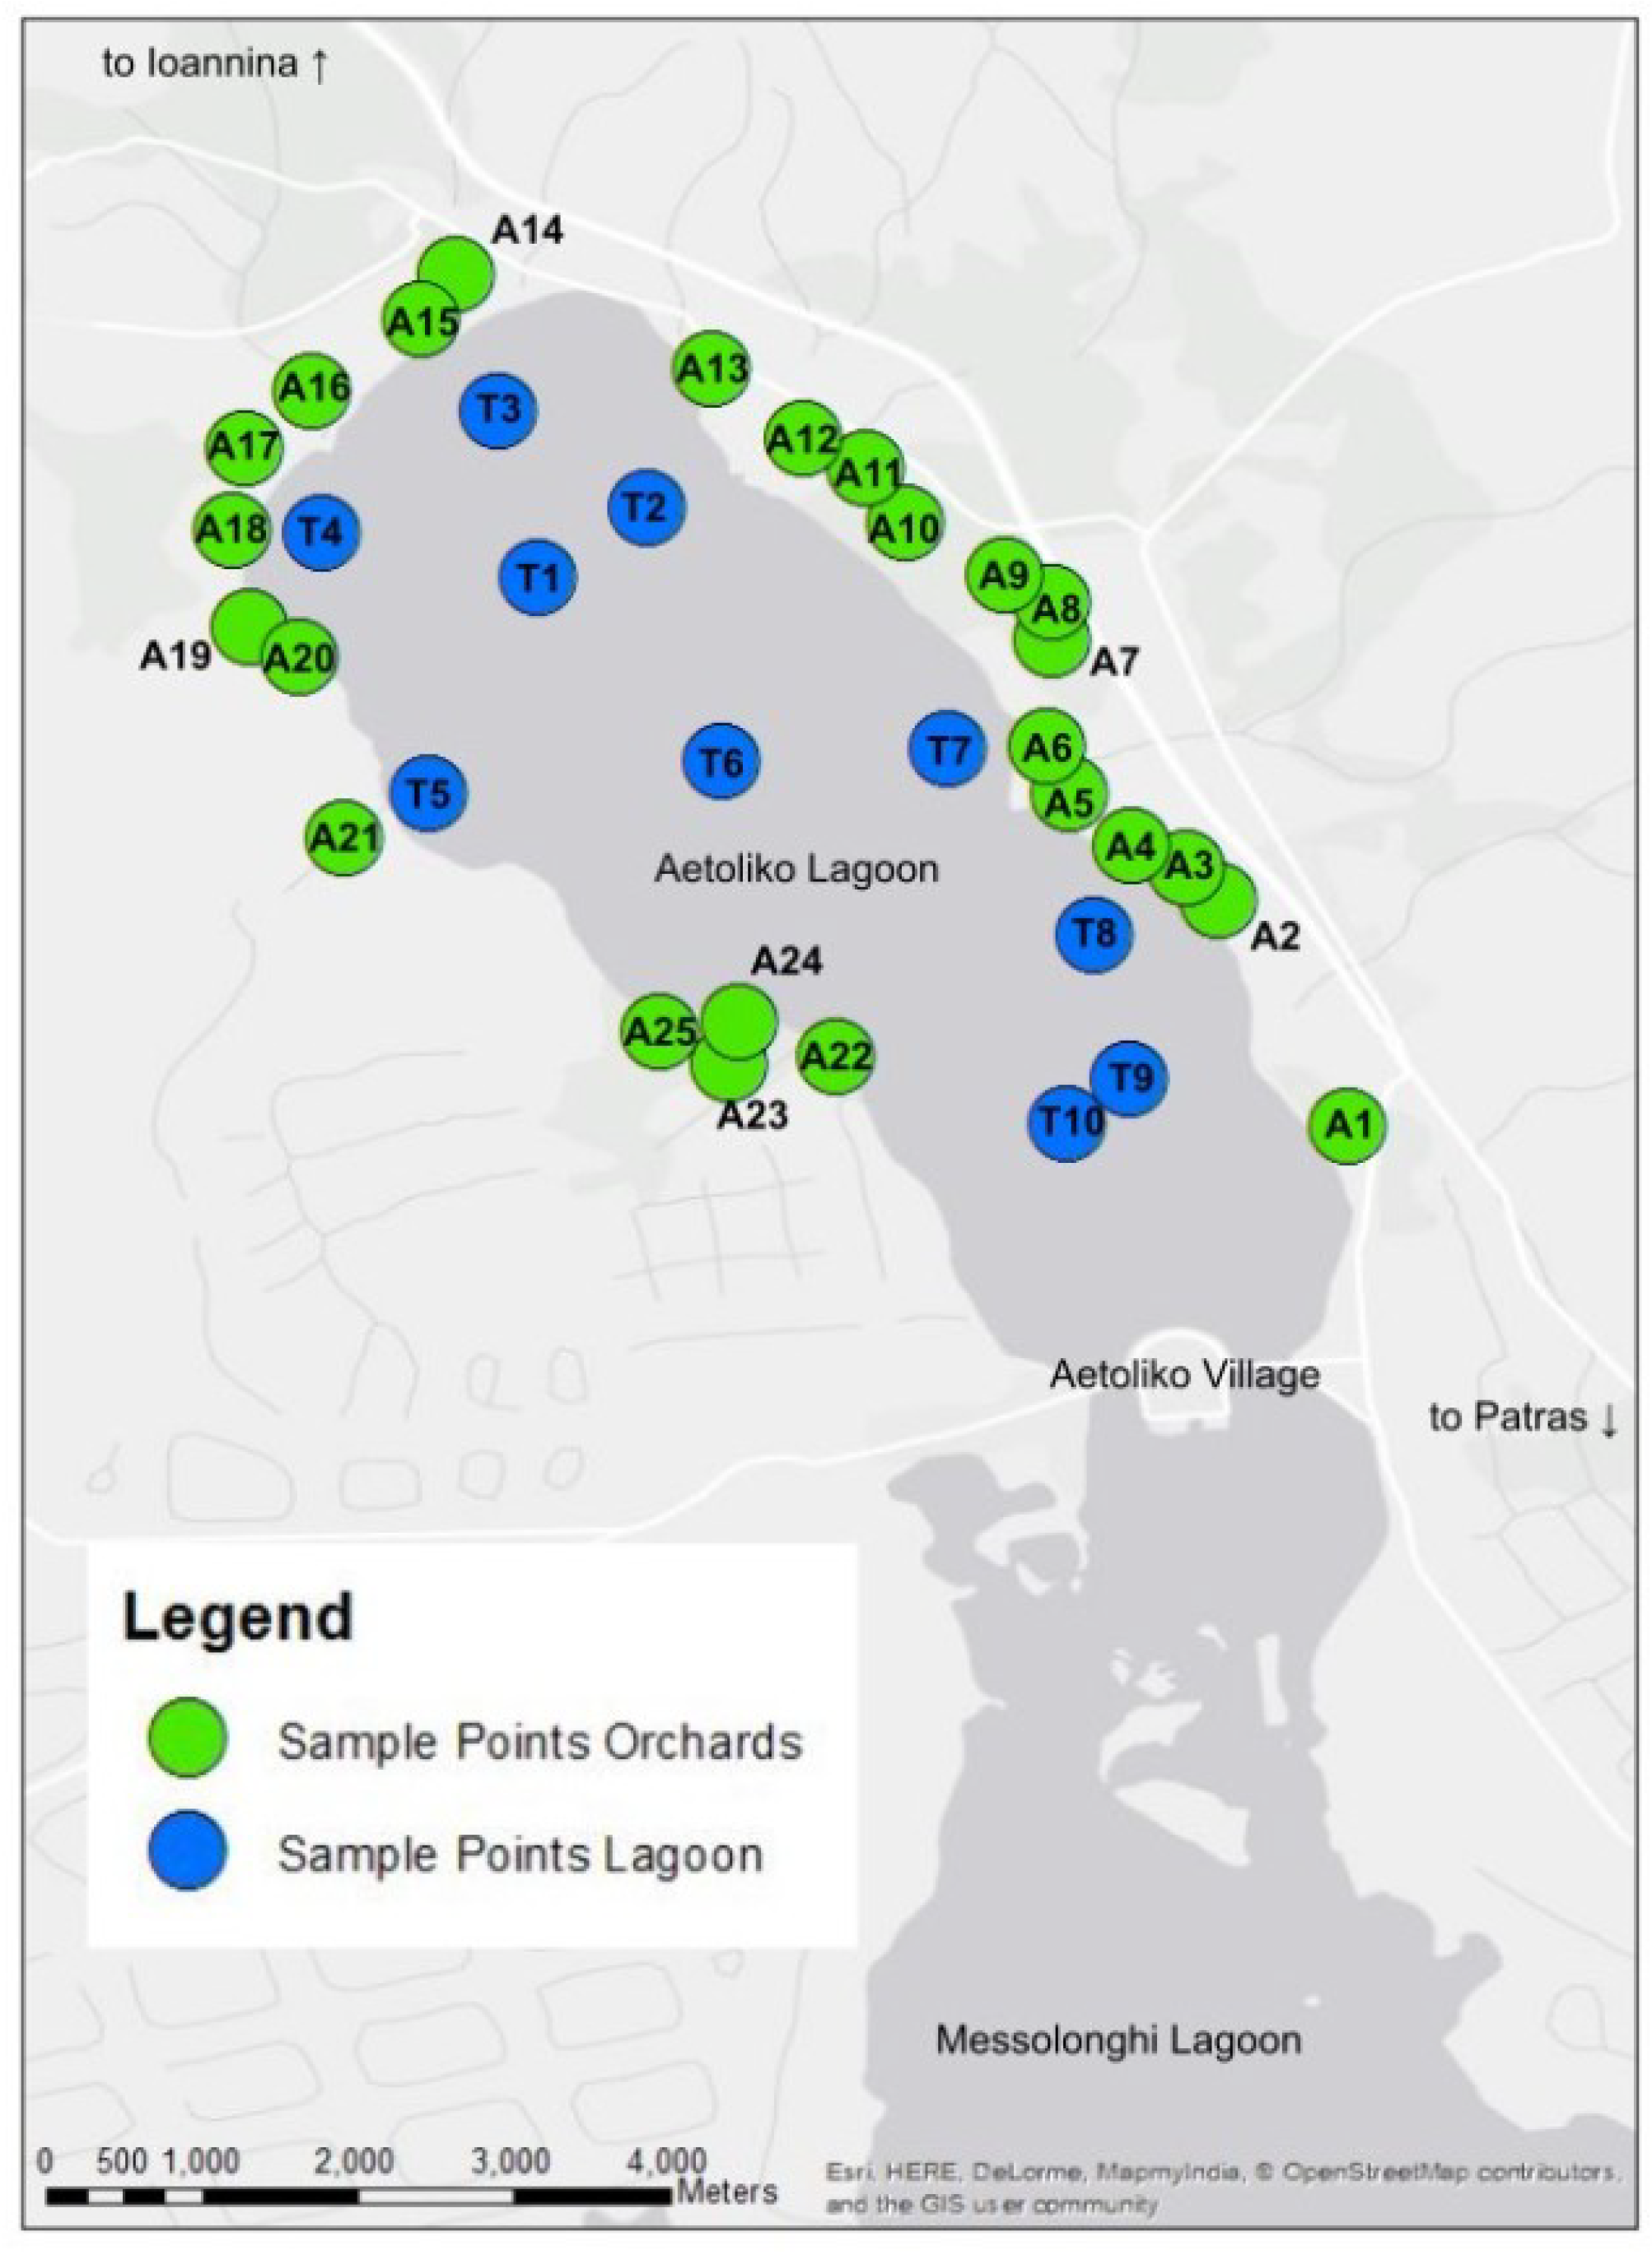
A total number of 35 samples were collected, 25 top soil samples (coding A1-A25) were taken from olive orchards around the Aetoliko lagoon and 10 samples (coding T1-T10) from the lagoon’s bottom sediments (Figure 2). The soil samples were taken using an auger to a depth of 20 cm from different orchards and to be at least 200 m apart from each other to have a clear distinction. From each sampling location four different subsamples, at about 1.5 m from the tree trunk were taken, and well mixed and homogenized according to LUCAS topsoil survey methodology [23]. When choosing the sampling sites on land, close attention was paid to stay within the small strip of land between the lagoon and a system of drainage canals that surround the water body in order to assure that the sample area is relatively hydrologically homogenous. The surface layer (approximately 5 cm) of the bottom lagoon sediment samples were taken using a van Veen grab operated from a small boat, and geographically covering the entire lagoon (Figure 2).

3.2. Analytical Procedure

Soil and sediments classification based on grain size analysis, was made using a Malvern Mastersizer 2000 and fractions of sand/silt/clay were calculated [24]. The USDA soil classification ternary diagram was used to define the texture of the soils and the sediments classification [25]. Total organic carbon (TOC) was determined using the Wakley-Black titration method, as validated and described elsewhere [26,27]. Total carbon (TC), total nitrogen (TN), and total sulfur (TS) were analyzed by a CHNS-O EA 1108 Elemental Analyzer and Calcium Carbonate content (CaCO3) was measured using a FOG II Digital soil calcimeter [28,29,30,31] based on modified methods reported by other researchers [32,33]. The copper concentrations were calculated after: (a) Total digestion method—where total copper was done with the hydrofluoric acid digestion bomb technique [34] and (b) diethylenetriaminepenta acetic acid—DTPA extraction method for bioavailable copper [35]:
For the total digestion approximately 1 ± 0.1 g of dried and powdered sample was digested with 2.35 mL of HNO3 65%, 7 mL of HCl 37% and 2 mL HF 40% in a microwave digestion system (Berghof speedwave MWS-3+). The temperature program was as follows: 5 min for temperature 145 °C, 10 min for temperature 170 °C and 15 min for temperature 170 °C. The resulting solutions were cooled for 30 min and diluted to 10 mL with distilled water.
The used DTPA extractant solution consisted of 0.005 M DTPA, 0.01 M calcium chloride (CaCl2) and 0.1 M TEA [triethanolamine, (HOCH2CH2)3N)]. For this purpose 1.97 g of DTPA, 1.47 g CaCl2.2H2O and 14.92 g TEA were dissolved separately in distilled water and then combined. The pH was adjusted to 7.3 using concentrated HCl and the volume made up to 1 L with distilled water. The DTPA extraction of the metals was carried out by shaking 10 g of each soil/sediment sample with 40 mL of DTPA extracting solution for 2 h at 200 rpm on a shaker table. After that, the slurry was centrifuged for 10 min and filtered on Whatman No. 2 filter paper and filled into test tubes for further analysis. All reagents used for both total digestion and DTPA extraction methods were of analytical grade.
The extracted solutions were analyzed by ICP-OES (Thermo Scientific iCAP 6000). The operating conditions were: Nebulizer Gas flow rates: 0.5 l/min; Auxiliary Gas Flow: 0.5 L/min; Plasma Gas Flow: 15 L/min; Pump rate: 45 rpm; ICP RF Power: 1100 W. Aliquots of an ICP multi-element standard solution (100 mg/L Merck) containing the analyzed elements, was used in the preparation of calibration solutions. Working standard solutions were prepared by dilution of the stock standard solutions to the desired concentration in 1% HNO3. The ranges of the calibration curves (6 points) were selected to match the expected concentrations for all the elements of the sample studied by ICP-OES. The correlation coefficient r obtained for all cases was 0.9999. The detection limits (LOD) were calculated as the concentrations of an element that gave the standard deviation of a series of ten consecutive measurements of blank solutions. Soil samples from BIPEA’s proficiency testing scheme A15 were used to ascertain the accuracy of the measurements, and it was found better than ±5%.
For the pH determination of the soil samples, we applied the soil suspension method using 0.01 M calcium chloride (CaCl2) [36]. A specified amount of the dried samples was sieved (<2 mm) and afterwards mixed the CaCl2 solution. The suspension was then shaken for five minutes and left to settle for at least two hours. In a final step, the pH-value was determined with a HACH-LANGE HQ40D pH-meter.

4. Results

4.1. Soil and Lagoon Sediment Characteristics

The grain size analysis of all 25 soil samples reveals fluctuations between the sampling stations. The soil of the olive tree orchards consists of very poorly sorted reddish brown to weakly red loam to sandy loam (15 samples silt loam, eight samples sandy loam, and two samples loam) (Table 1). The sand class portion is relatively low, ranging between 4.91% to 20.58%, with a mean value of 10.30%. Grain sizes mean values range from 2.64 to 6.59 Φ and sorting values ranges between 2.0 and 3.39 Φ characterizing the material as very poorly sorted (Table 1). Skewness indicates a coarse skewed to symmetrical distribution whereas the kurtosis shows a platykurtic to mesokurtic distribution. The TOC values ranges from 0.34 to 4.04% with a mean value of 2.58%, TN and TC mean values are between 0.54 and 4.59% respectively (Table 1). Calcium carbonate concentrations in the orchard samples are relatively low, were in most cases below 3% with a maximum value of 41.50%, while in 13 out of 25 samples, no CaCO3 was detected. The pH-values in the orchard soils range from 4.85 (A 21) to 7.59 (A 16). There is no clear pattern observable in a spatial distribution. However, the samples A23, A24, and A25 show relatively low pH values compared to the other samples and are moderately acid. The highest numbers are found in the samples A15 to A 20. Sulfur was not found in soil samples. These soils are classified as slightly or moderately alkaline [37].
The main lithological type of the lagoon bottom sediments is mud and sandy silt, characterized by relatively uniform distributions. The sand class portion is relatively low, ranging between 5.96 to 15.57% (Table 2). The mean grain size of Aetoliko lagoon sediments ranges from 3.90 Φ to 6.14 Φ with an average of 5.44 Φ. Total organic carbon content was also higher in the aquatic sediments with a mean value just over 2.5%. The average of the total nitrogen content in the sediment samples was significantly higher compared to the samples from the orchards (mean 0.54%). Sulfur was only found in the bottom sediment samples at values from 0.94% (T8) to 2.08% (T4).

4.2. Total and Bioavailable Copper Concentration

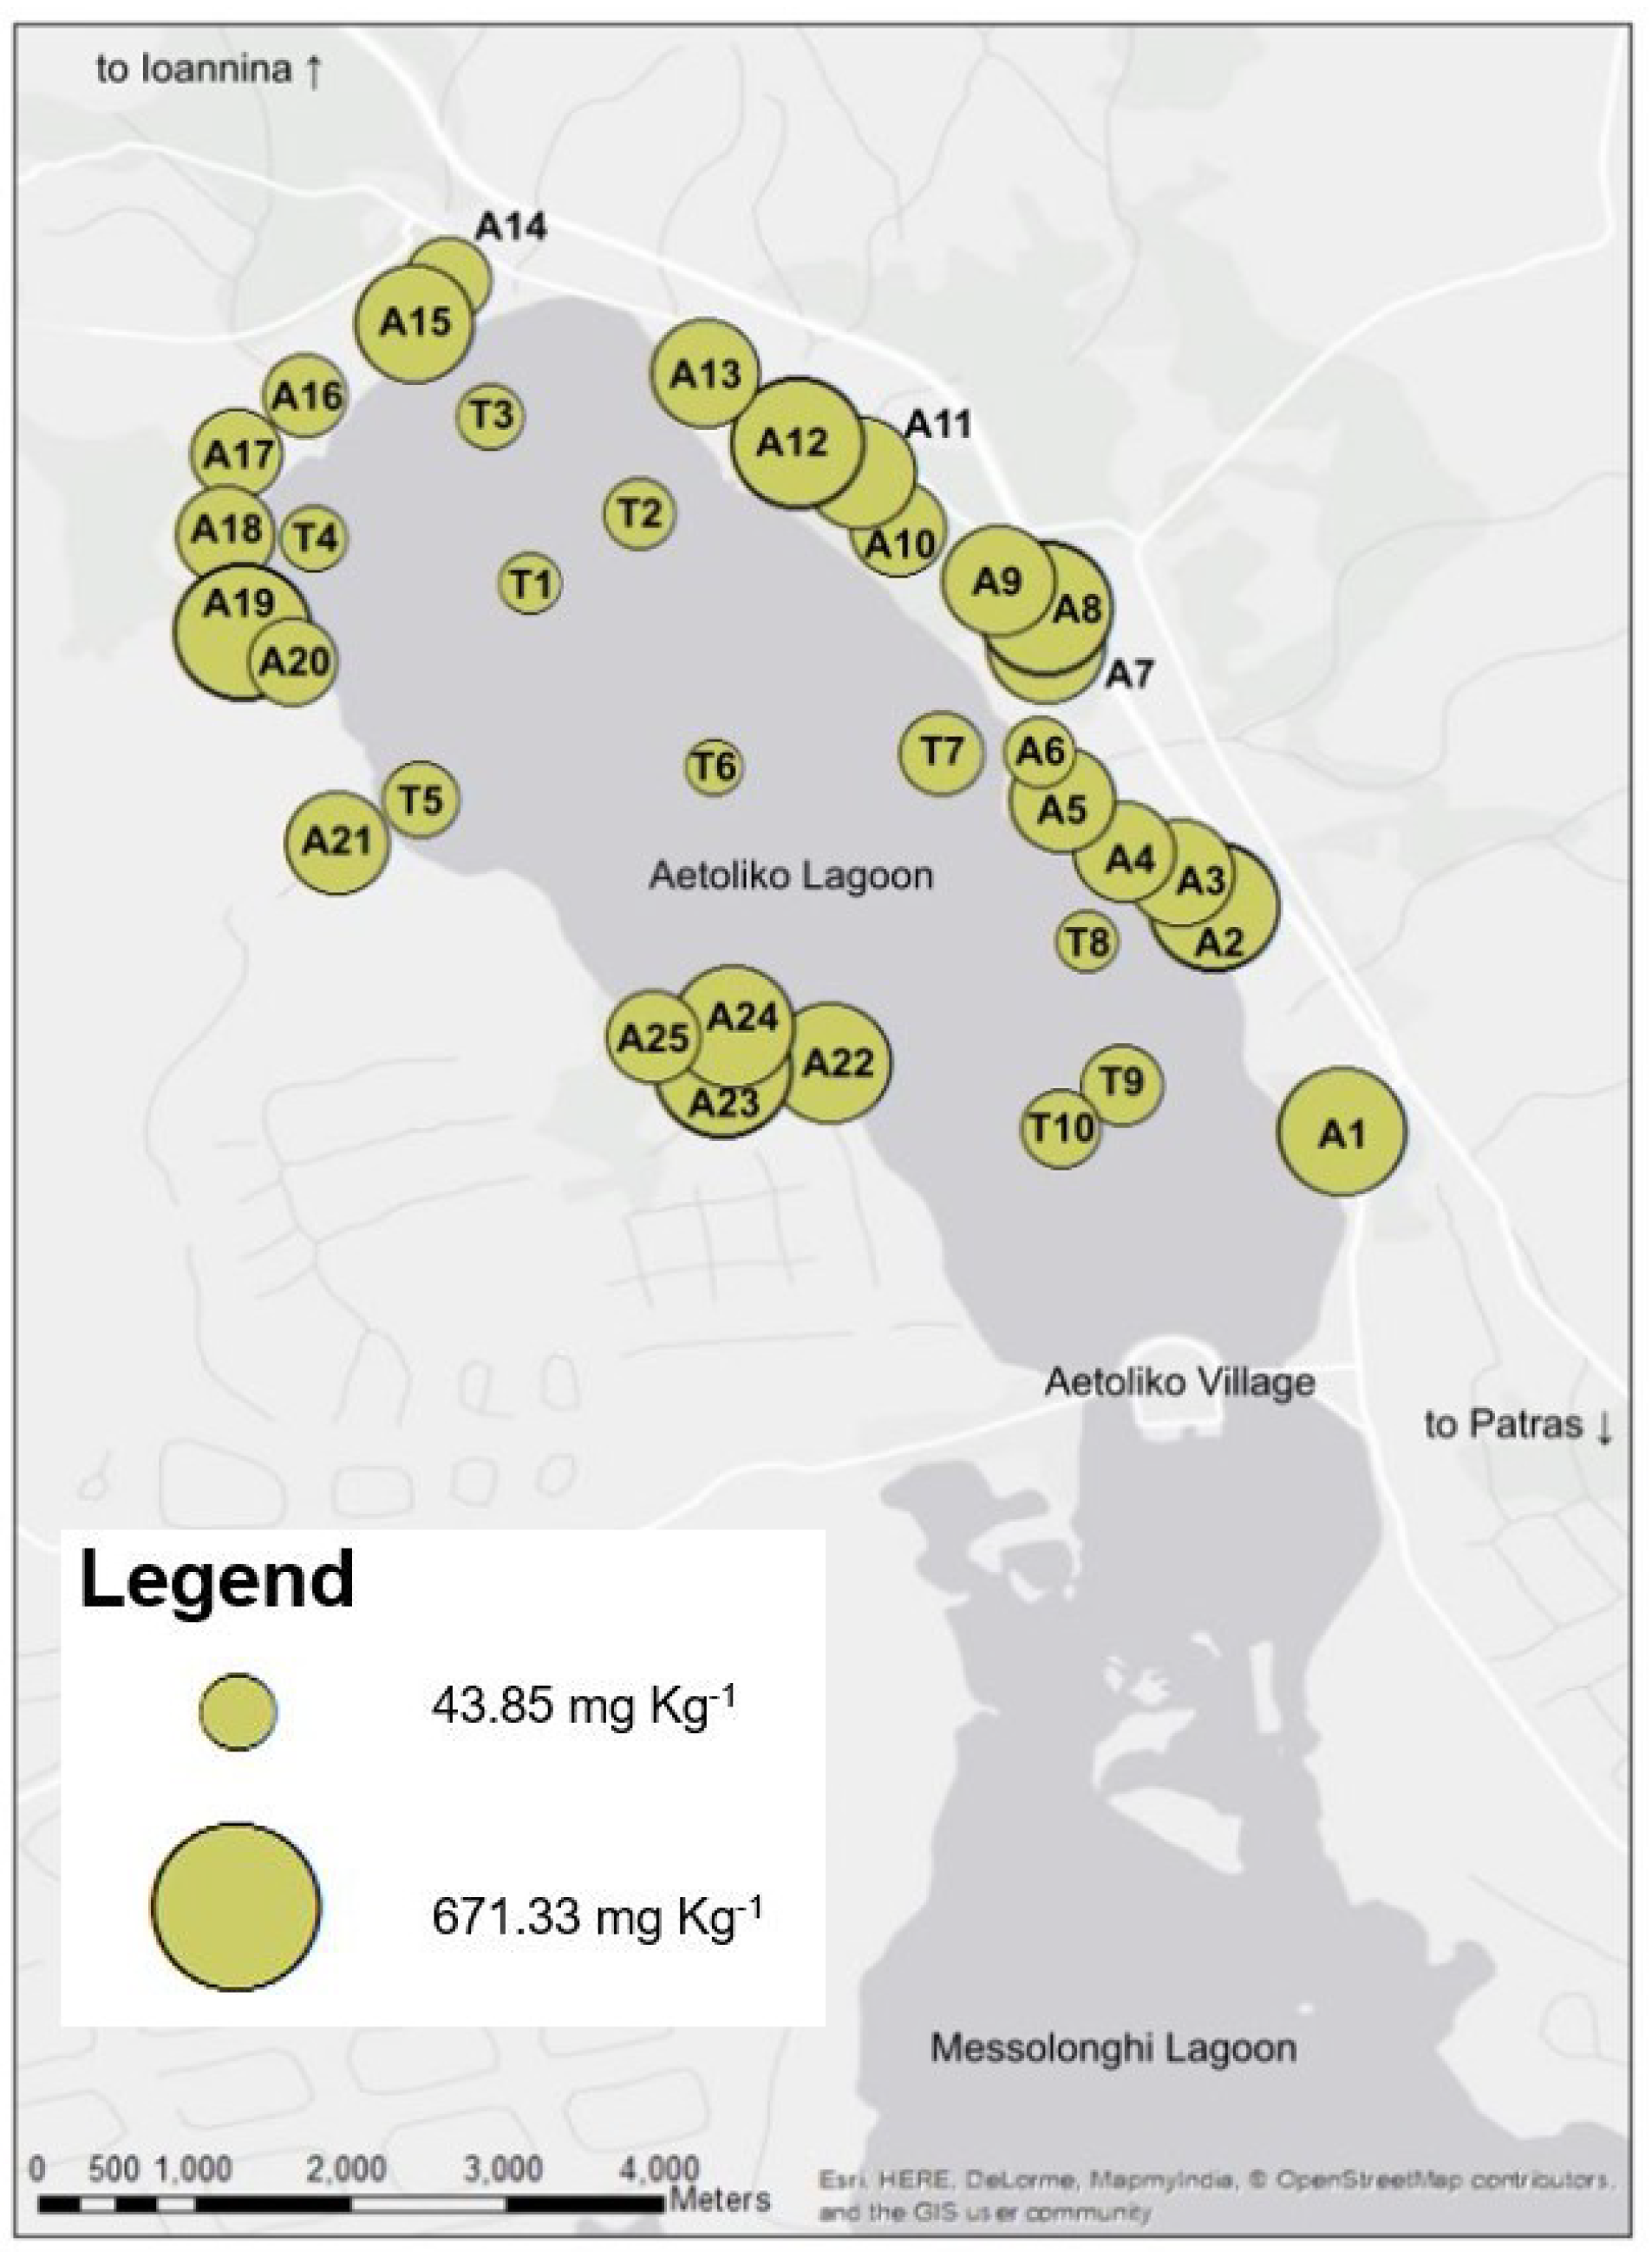
The lowest values in total copper content in the orchard samples were found in samples A6 and A16. The mean values of total copper content are 286.24 mg kg−1 and 45.00 mg kg−1 for DTPA-extractable copper in the orchard samples. The smallest amounts of total copper in the lagoonal sediment samples were measured in T1 and T6. In addition, samples T1, T3, and T6 show low values of Cu DTPA in the lagoon sediments. The concentrations of total copper found in the orchard samples are in general much higher than those for the samples from the bottom of the lagoon (Figure 3). The comparison between the total copper content of the orchard soil samples and the lagoon samples show that most soil samples have significantly higher values. The only exceptions are samples A6, A16, and to a lesser extent sample A14.
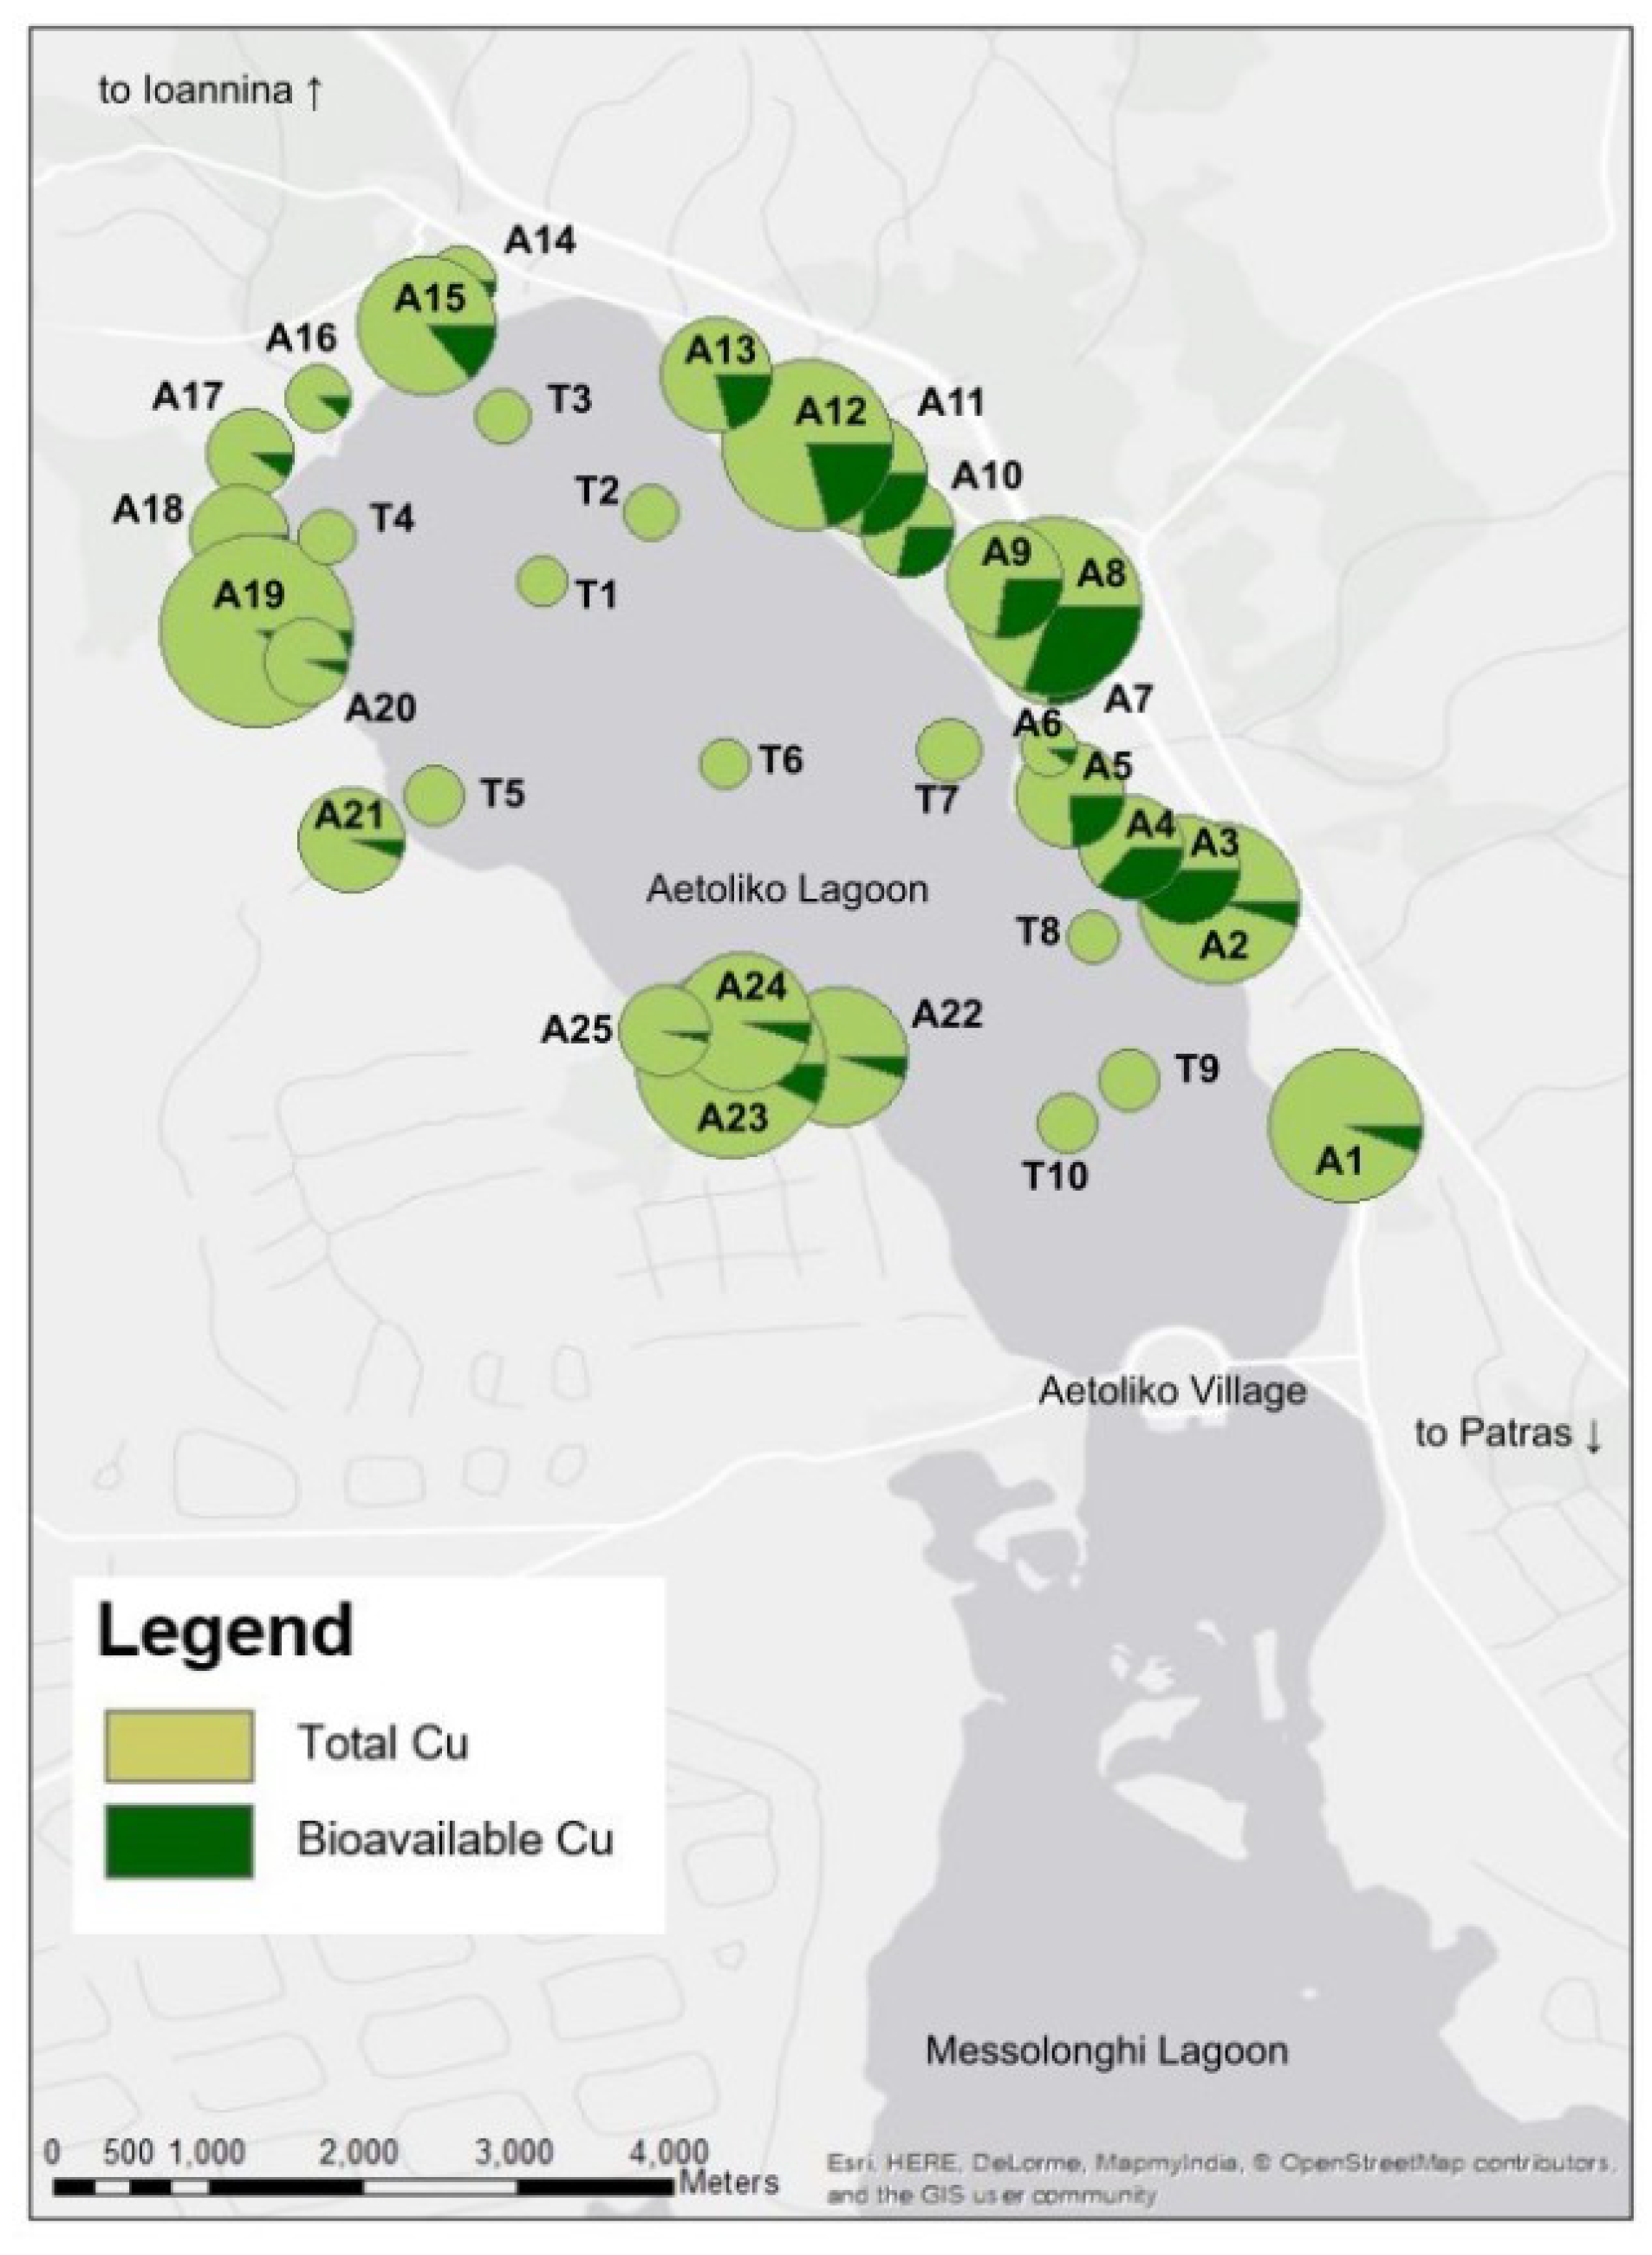
The bioavailable copper content in the lagoon is generally very low. Sample points T1 and T6 show the lowest content of bioavailable copper. The bottom sediment samples taken at T2 and T3 also show a relatively low concentration of bioavailable copper. Figure 4 shows a map of the distribution of the bioavailable copper concentration at the area of the Aetoliko lagoon as a fraction of the total copper content. The biggest shares of bioavailable copper of the total copper content were found in the orchard soil samples taken at the Eastern shore of the lagoon. The fractions of the bioavailable copper of the total copper are in the range of 3.48% (A25) and 46.06% (A3) for the orchard samples.

4.3. Statistical Analysis of Soils and Sediments Data

Correlation matrices (Pearson) of all examined chemical parameters, copper content and grain size of the 25 soil and the 10 sediment samples were calculated using the OriginPro 9.0 scientific graphing and data analysis software (Table A1 and Table A2, Appendix A). The strongest positive correlation (r = 0.87) in the soil sample results is found between the TN and the TOC content. Both total and DTPA Cu show a positive correlation with TOC and TN (r = 0.56 for Cu total and TOC, r = 0.55 for total Cu and TN, r = 0.51 for Cu DTPA and TOC, r = 0.52 for Cu DTPA and TN).
A positive but relatively weaker correlation can be observed at the values for the total copper content and the bioavailable copper content (r = 0.49). To examine whether the grain size might play a role in the accumulation of any of the chemical parameters or affect the copper content in the samples the corresponding numbers were also added to the statistical analysis. The overall weak correlations with huge spans of the 95% confidence intervals show no potential relation of grain size and any of the studied parameters. These findings of no statistical correlation between soil grain size and copper concentration confirm results of other researchers [38]. They found that copper movement in soils is limited and independent of the type of soil due to copper’s strong affiliation with soil colloids [38]. Organic carbon and total copper content show a positive correlation (r = 0.56). This confirms that organic matter is one of the materials that are responsible for retaining copper in the soil [39].
The correlation of the Cu values from the bottom sediment samples show that there is a stronger positive correlation (r = 0.79) between the total Cu and the DTPA Cu values. This reveals that the majority of the Cu content in sediments is related to the copper used for the olive trees treatment in the studied area. The strong correlation between TN and TOC is also found in the sediment samples and is consistent with the results of other researchers [15]. There is a negative correlation of Cu DTPA, TOC and TN (r = −0.53 and r = −0.64 respectively). Weak, but also negative correlations are found between total Cu, TOC, and TN (r = −0.35 and r = −0.26, respectively).

5. Discussion

In the study area, farmers keep their olive trees healthy and manage pathogens with strategically timed disease control programs by the application of copper sprays to protect the foliage and fruit from infection. Successful disease control depends on even distribution and good retention of the copper over all of the plant surfaces before the disease develops. Copper is not a systemic chemical and cannot be carried internally through the plant to kill the pathogen. Thus, farmers apply copper sprays to protect the trees 2–4 times per year with a high-pressure sprayer in good working order mixing the correct concentration, and getting good coverage.
In an extensive study, the mean values for total copper content and DTPA-extractable copper content for agricultural soils calculated from Western Greece and other Greek regions like Fthiotida and several regions on the Peloponnesus peninsula, Samos or Voiotia [40]. The mean values for Western Greece are 105 mg kg−1 (total copper) and 30.2 mg kg−1 (DTPA-extractable copper). The respective numbers for the whole country are 138.28 mg kg−1 and 30.65 mg kg−1 [40].
Countries in Europe have defined risk levels with different concentrations of Cu, which have been widely accepted and applied internationally for agricultural soils [9,10,41,42]. Based on these guidelines, the threshold value for Cu in soils is 100 mg kg−1, the lower value defined on the basis of ecological risks is 150 mg kg−1 and the higher value is 200 mg kg−1. In addition, the Toxicity Screening Value (TSV) for copper in freshwater sediments is 25.2 mg kg−1, while the TSV for Cu in marine estuarine sediments is 28.7 mg kg−1 [43].
The present study shows that the copper content in the orchard soils reached a critical point. The highest concentration of total copper in the analyzed samples was 671.33 mg kg−1 and only five samples do not exceed the 150 mg kg−1 limit for ecological risk [9,10]. All samples show a higher copper concentration than untreated soils. The lowest total copper content was measured in samples A6 and A16. These samples were taken in an orchard with very young trees compared to the other orchards sampled in this study. The age of the plantation was estimated with 5 to 15 years. That means the soil could not come in contact with the fungicide for a long period and younger trees have a smaller crown and therefore less fungicide has to be used with each application of the fungicide. Apart from the soil sample points A6 and A16, no other copper content values can be explained as easily. The variations can be a result of different farmers using different products of fungicide with lower or higher copper concentration or simply apply less fungicide. Two other factors play a role in the copper concentration in the soil. One is the respective age of the olive trees. After a certain point it is hard to tell how old a tree is if it is not a very young tree. Older plantations have been treated more often with fungicides during the years. The other factor is the time when the treatment of the trees started. It is possible that treatment in one place started only 30 years ago when the plantation already existed for 100 years and other farmers started treatment some 50 years ago with trees of 60 years of age.
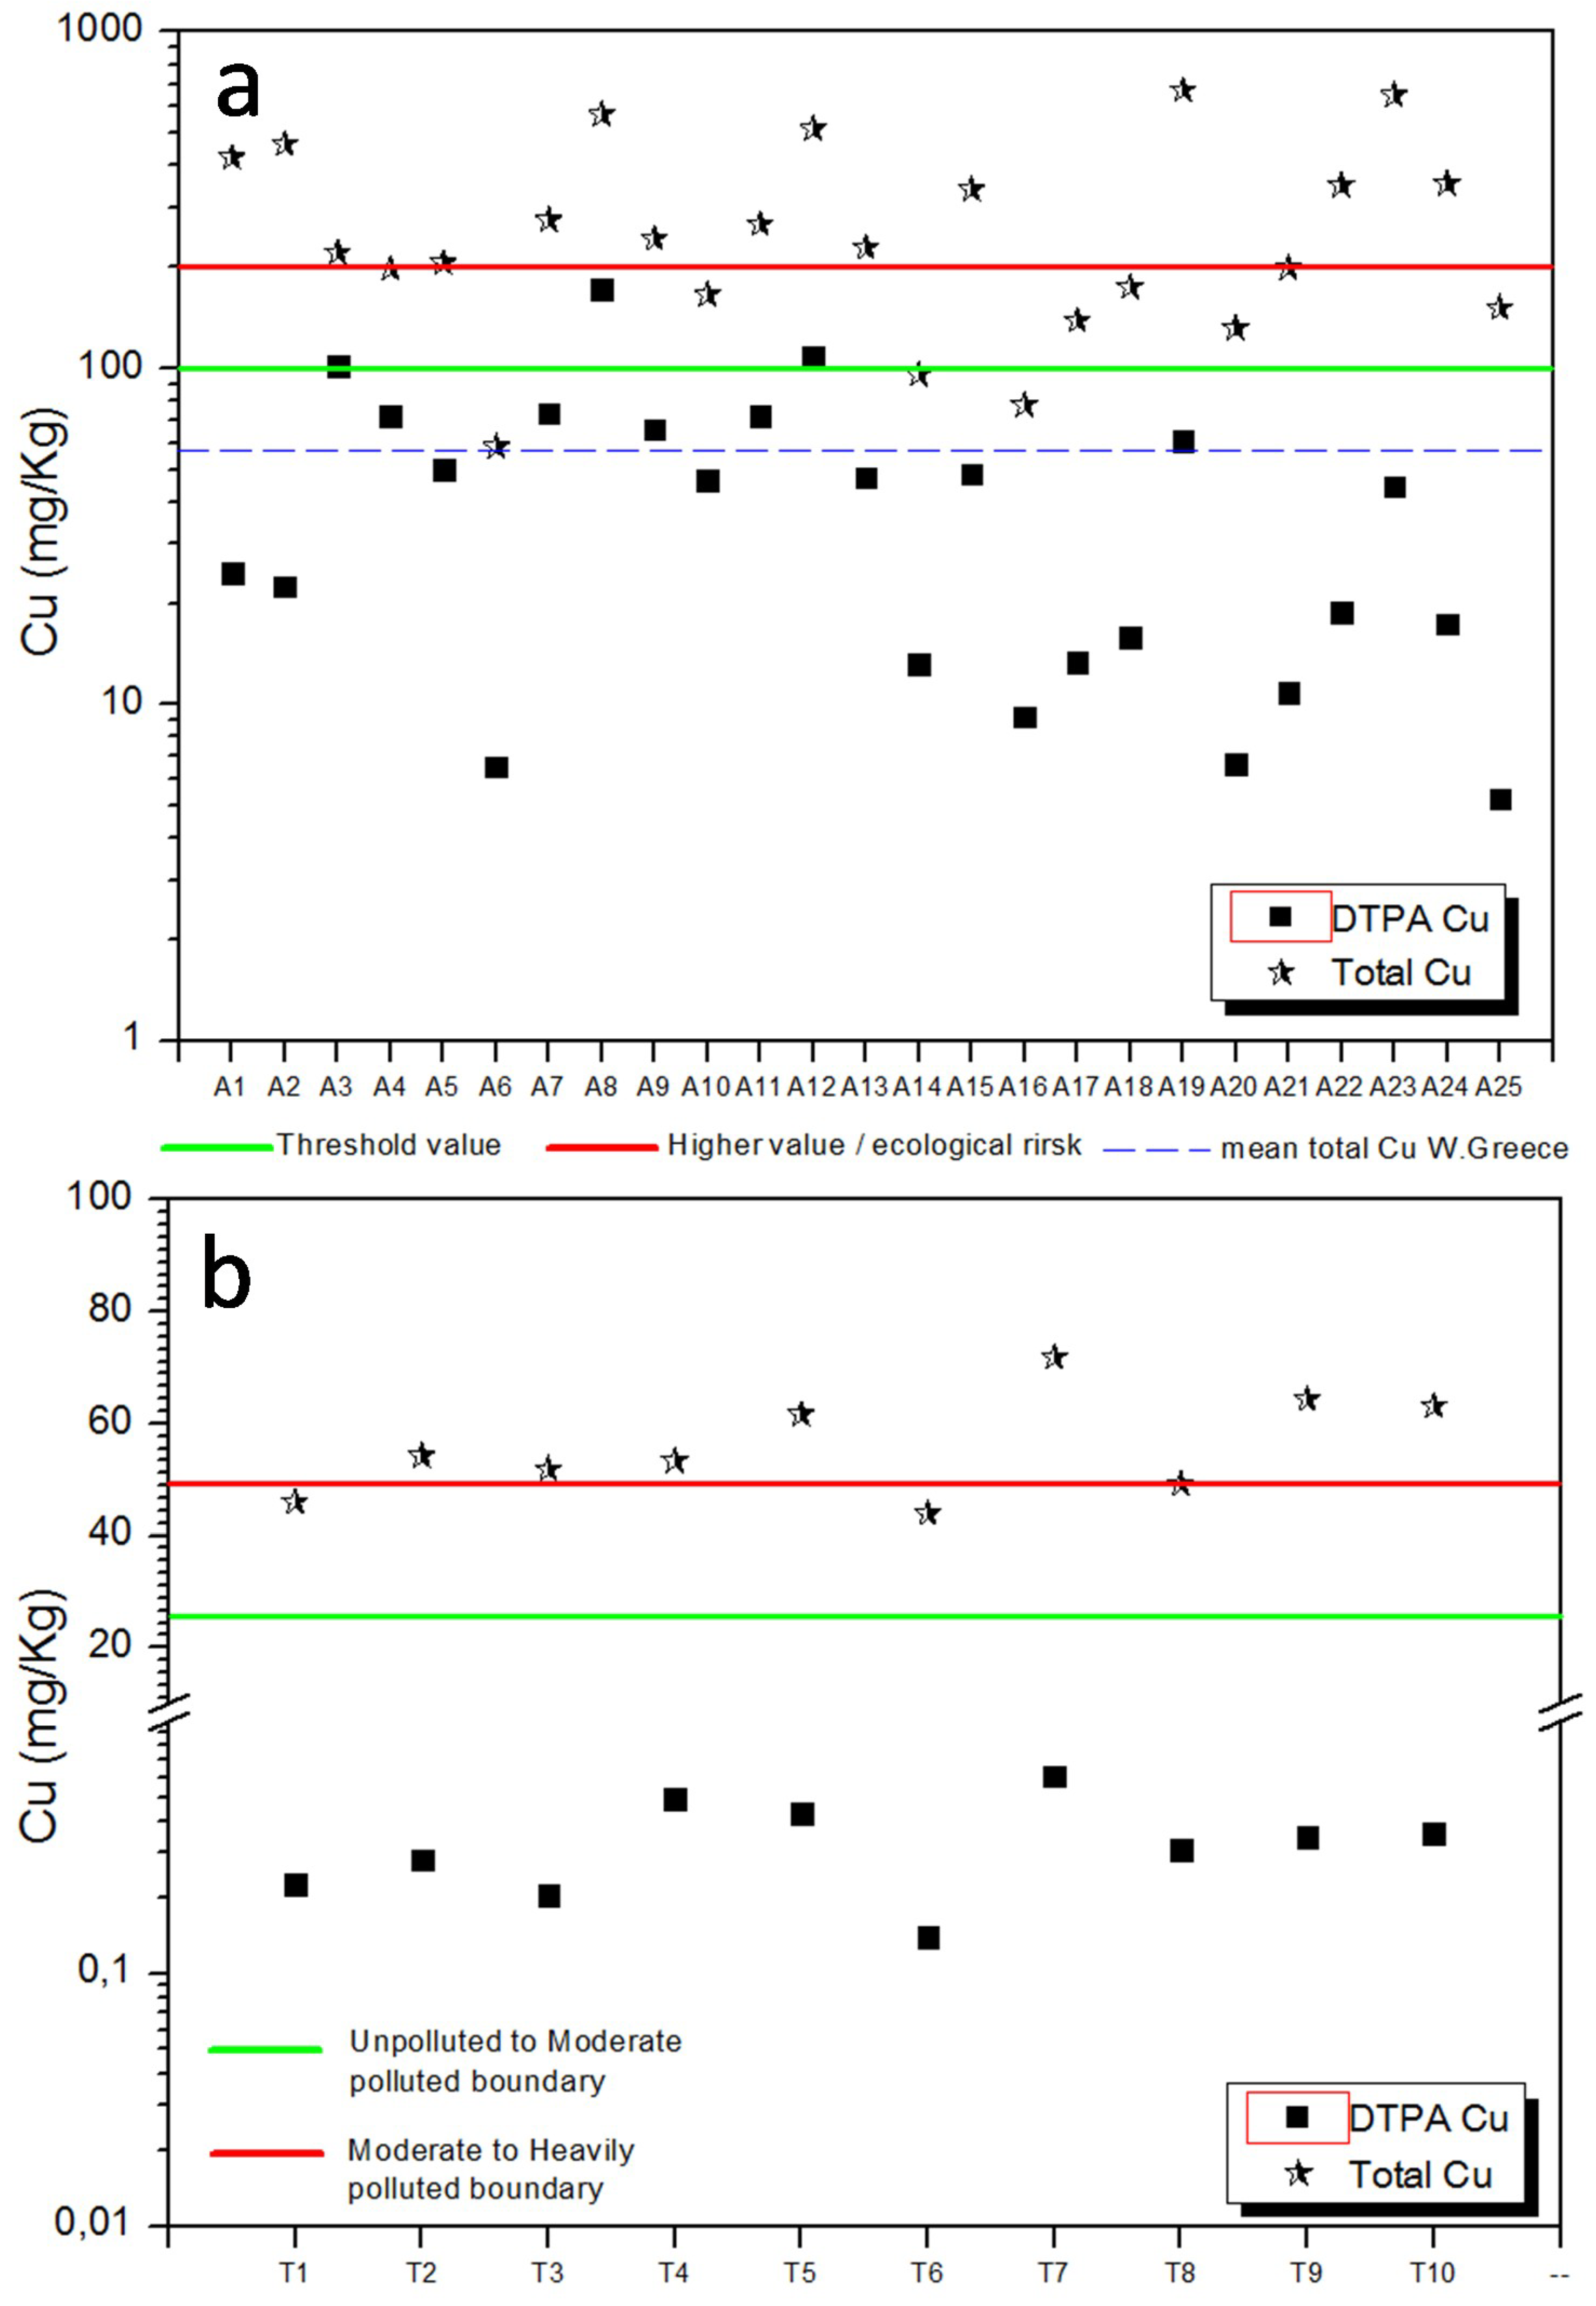
The mean values of 286.24 mg kg−1 total copper content and 45.00 mg kg−1 DTPA-extractable copper content in our study are higher than the 105 mg kg−1 and 30.2 mg kg−1, respectively, reported for Western Greece soil samples [40]. These numbers suggest that the influence of copper-based fungicide use in soils is higher in the Aetoliko region than in the rest of Western Greece. The majority of the samples show total Cu concentration in soils is above the threshold, the lower and the higher ecological risk value [9,10]. In contrast, the concentration for extractable copper for soils is well below these values (Figure 5a).
In the lagoon sediments, the samples from the locations T1 and T6 show the lowest copper content. These two points are in the center of the lagoon at its deepest point. However, the lowest total Cu values for the lagoon sediments (43.85 mg kg−1) exceeds the TSV for copper in freshwater sediments (25.2 mg kg−1) [43]. Taking into consideration the Sediment Quality Guideline of US EPA [44], the majority of the lagoon sediments are characterized, moderated to heavily polluted because total Cu concentrations exceeds the limit of 50 mg kg−1 [45], however the DTPA Cu values are well below the unpolluted to moderated polluted boundary (Figure 5b).
This means that due to copper’s characteristic to accumulate in soils there is a potential that a substantial amount of copper contaminated material makes its way into the lagoon with normal surface runoff, accelerated through heavy rainfall events, or as windblown dust during dry seasons.
The pH-value of the soil plays an important role for the availability of copper, especially when it is under the critical value of pH 5 [46]. With a pH value of 4.85, only sample A21 was in that critical range. This is a factor that should be monitored closely as soil pH-levels play an important role of copper accumulation on plants.
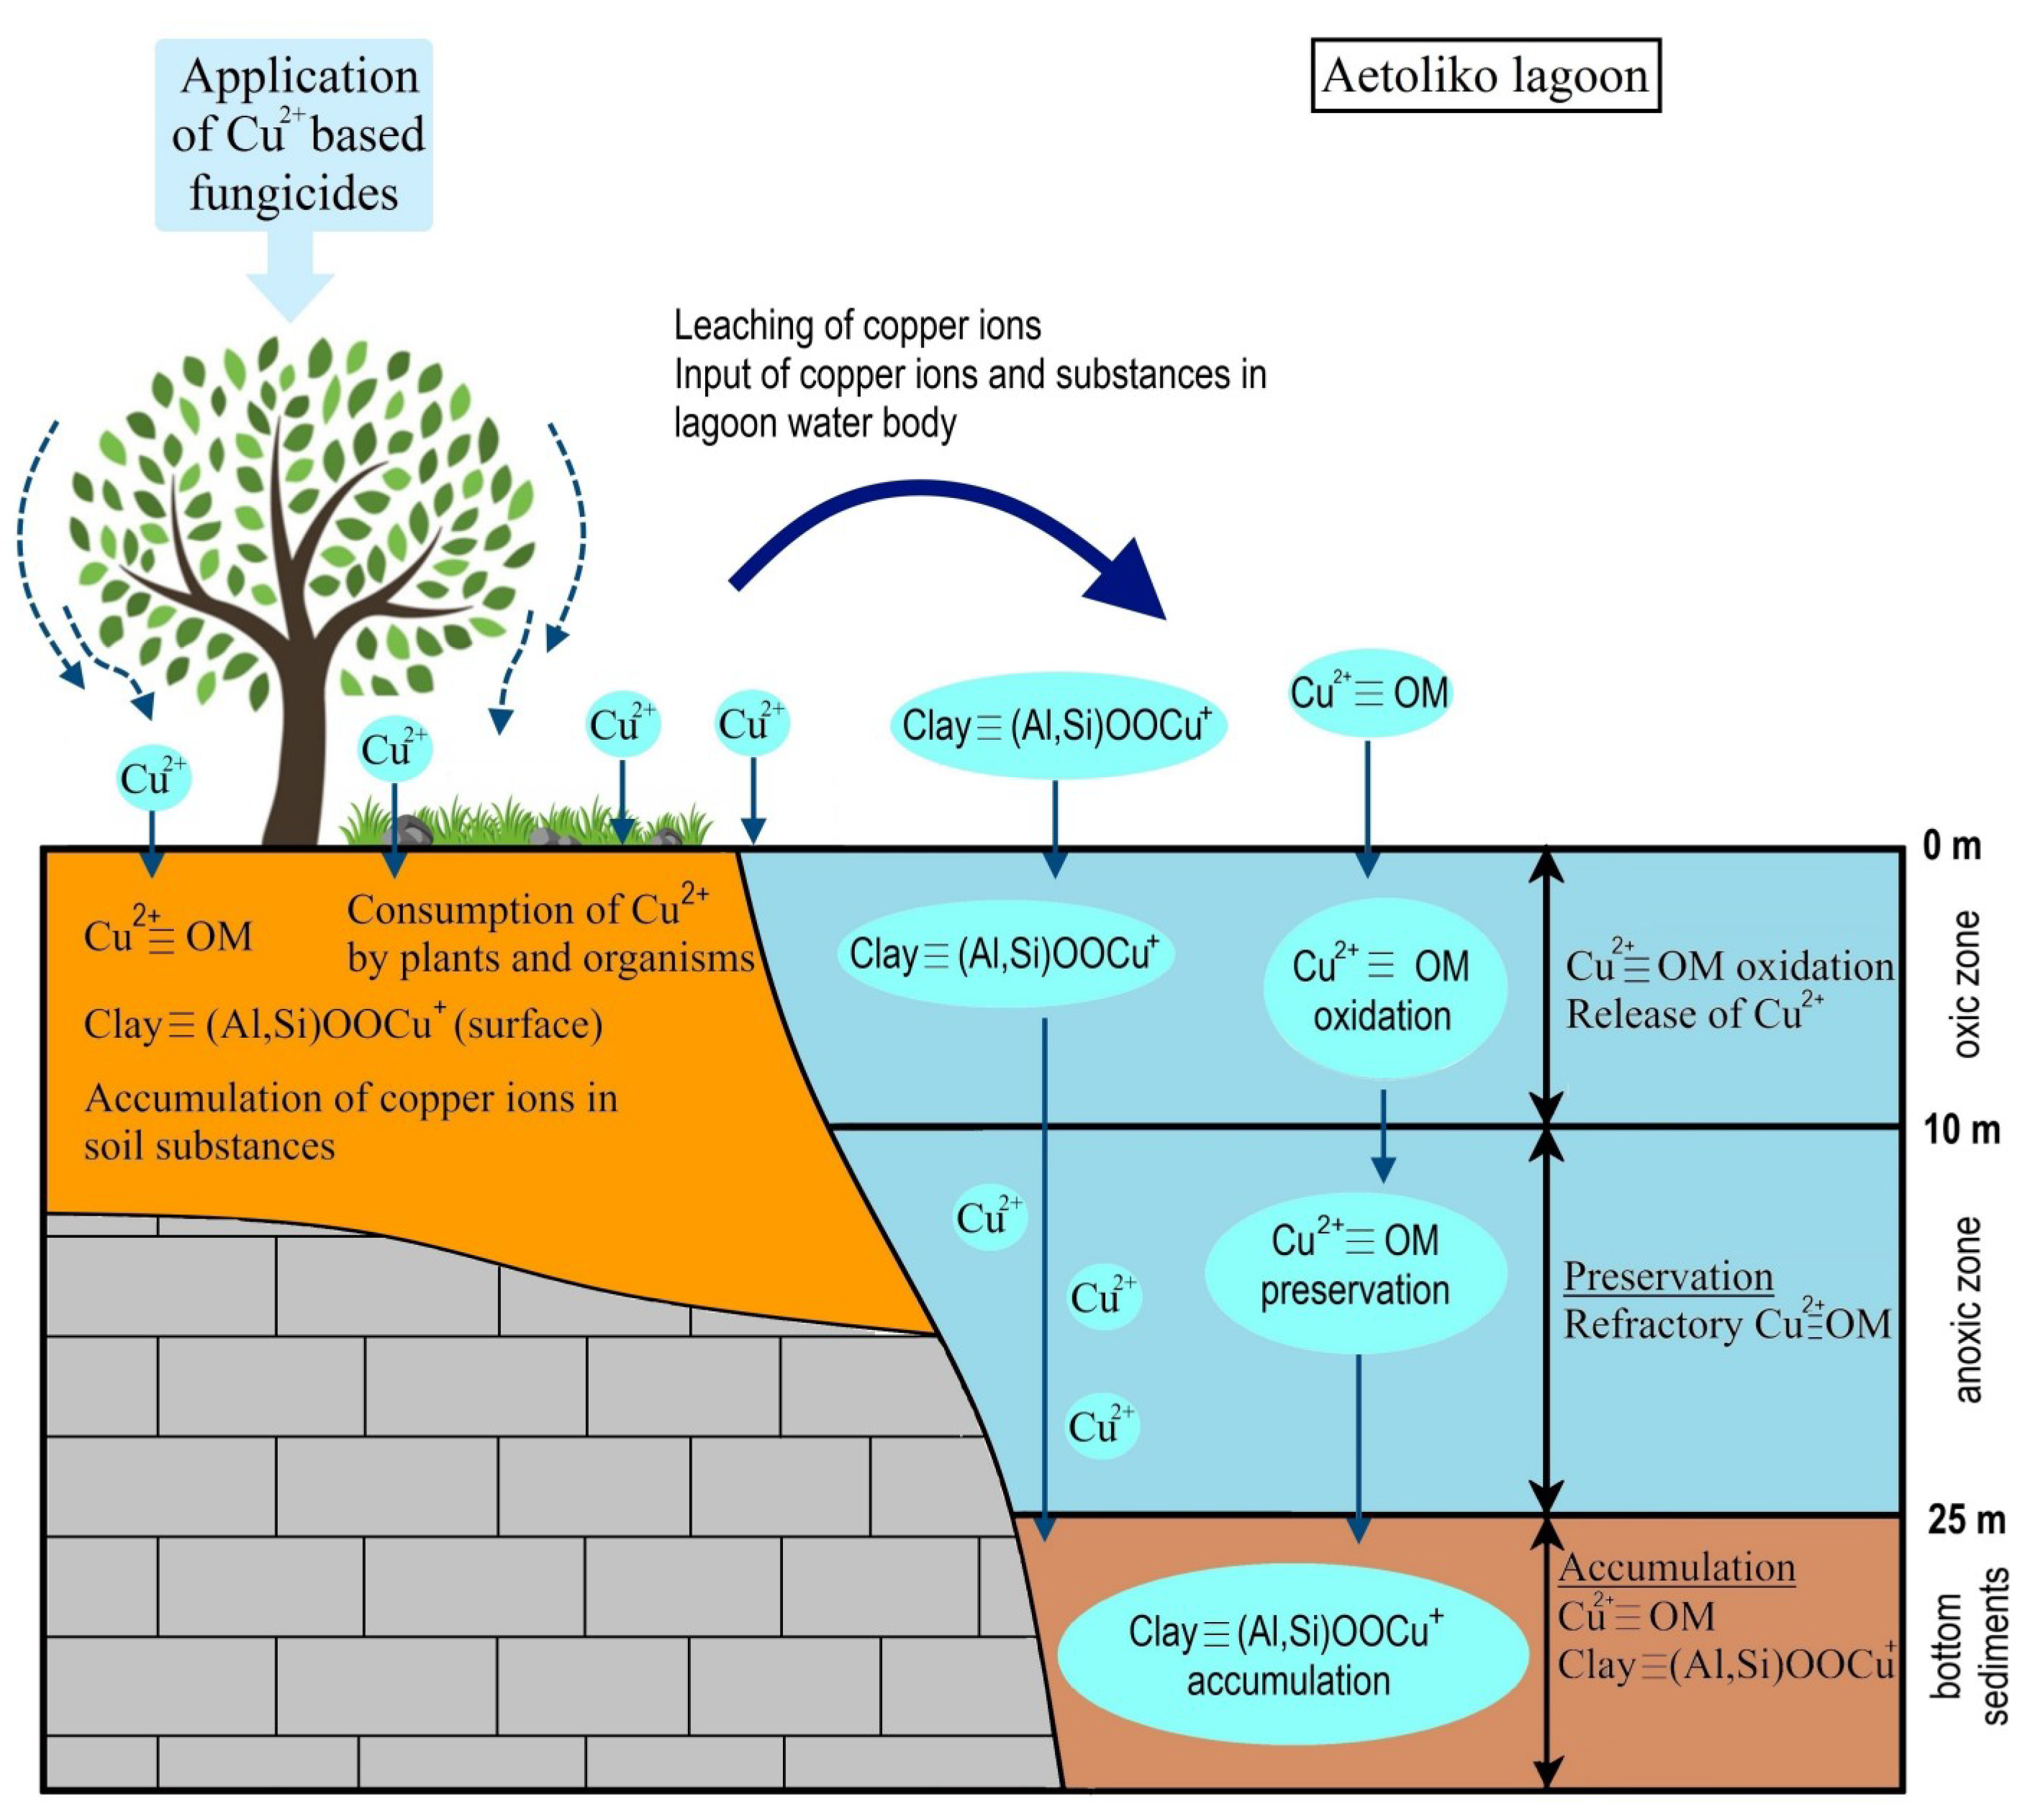
The major processes regulating the provenance of copper in soils and sediments in the studied area are: (a) Accumulation of copper ions in soils during the application of copper based fungicides, (b) consumption of copper ions by plants and organisms, (c) leaching of copper ions from plants and soils, (d) input of copper ions in the lagoon water body, and (e) accumulation of copper substances in the bottom sediments (Figure 6).
In soils, copper is subject to sorption onto colloid compounds, interaction with humic substances and organic matter, precipitation, adsorption on clays and carbonate minerals etc. In our study, the positive correlation of both total Cu and extractable Cu with TOC and TN in soils shows this association of copper ions with the organic fraction of the samples analyzed. This is further supported by the negative association of total Cu and DTPA Cu in the samples with the carbonate phases and the very weak positive loadings with the clay fraction of the soils. The adsorption of Cu2+ ions onto organic matter can be described by the following equation:
Cu2+ + OM = Cu2+ ≡ OM
However, another portion of copper ions can be associated with other soil substances like FeOx, MnOx, and AlOx and/or can be leached from soils by the rainfall [47,48]. This association is affected by the pH of the soils, because H+ and OH influence the surface potential and surface charge of oxides [49]. The above substances enter the lagoon mainly by runoff and the Cu2+ ions are participating in bio-geochemical processes within the water column and the sediments.
The correlation analysis of the lagoon sediment samples reveals that there is an opposite geochemical behavior of total Cu and extractable Cu than in the soils. In the lagoon sediments, both total Cu and DTPA Cu show a negative correlation with TOC and TN. Additionally, total Cu shows positive correlation with the clay fraction while DTPA Cu shows only a weak positive association with clays.
On average, total Cu in soils is 286.24 mg kg−1, which is about 5-times higher than the average of 55.93 mg kg−1 in the lagoon sediments. This indicates that the majority of the copper in the study area has not been accumulating in the lagoon bottom sediment so far. This conclusion is consistent with the anoxic conditions below 10–11 m in the lagoon environment and the increase of dissolved copper in the water column of the lagoon [15,16]. Anoxic conditions do not facilitate the precipitation of copper solid phases and thus cupric ions remain in solution. Additionally, the pH profiles of the uppermost 10 m of the lagoon water body can explain the selective adsorption of Cu2+ ions onto the clays surface [15]. Under alkaline conditions, the OH ions influence the surface charge and potential of clay minerals resulting in a negative surface charge, thus facilitating Cu2+ adsorption. A general equation for the adsorption of Cu2+ ions onto the clay minerals [Clay ≡ (Al, Si)OOH] surface can be introduced. This process is well documented by the studies of many researchers [49,50,51,52,53,54]:
Clay ≡ (Al, Si)OOH + OH + Cu2+ = Clay ≡ (Al, Si)OOCu+ (surface) + H2O
This equation is consistent with the positive association of total Cu with clays in the sediments analyzed, however precipitation of copper sulphide solid phases cannot be excluded [16].
The results of the grain size analysis show (with the exception of STA1) that the grain sizes of the bottom sediment of the Aetoliko lagoon are distributed relatively homogeneously [15]. This pattern can be found in all parameters for the samples taken from the lagoon. Both total and bioavailable copper as well as total nitrogen, total carbon, and total sulfur content do not differ much between the different sediment samples.

6. Conclusions

The total amount of copper that can be found in the soils of the olive orchards surrounding the Aetoliko lagoon is high and exceeds in most cases the critical limit as set by the European Union. This inherits the requirements for unwanted consequences for plant, animal and human life. The high values of copper in the soil are due to the application of copper-based fungicides. These fungicides also influence soil quality. The total Cu values in the Aetoliko lagoon sediments are lower than the total copper values in soils. However, the average value of total Cu in sediments is higher than the Toxicity Screening Values for copper in freshwater and marine or estuarine sediments. The geochemical behavior of Cu in soils is related with the organic fraction of the orchard samples. However, total copper in the lagoon bottom sediments is associated with the clay fraction of the studied samples.
A better picture of the whole impact of the added copper on this particular lagoon environment can, lastly, only be evaluated if further studies can be carried out that take additional factors into account. These studies can be focused on e.g., water quality with special regard to the copper content. In addition to that the collaboration and exact data of the local farmers would be of great importance. Otherwise there is no exact information about the used amount of fungicide on the respective orchards and the time span of the usage of the products in question. Further research on that matter and especially on alternatives to copper-based fungicides is highly recommended.

Author Contributions

P.A. conceived and designed the study, led the field work and laboratory analyses, made the interpretations and wrote the paper. P.B. participated in the soil field campaign collecting soil samples and performed the copper analysis. T.D. participated in the field campaign, he characterized, prepared the samples, analyzed them and prepared some of the figures. I.U. participated in the field campaign and contributed in the interpretations. D.P. contributed to the interpretations, made the statistical analysis of geochemical parameters and contributed to the writing of the paper.

Funding

This research received no external funding.

Conflicts of Interest

The authors declare no conflict of interest.

Appendix A

Table A1. Correlation matrix (Pearson) of the Aetoliko olive orchard soils data.
SandSiltClayTCTOCTNCaCO3pHCu-DTPACu-Total
Sand1−0.99045 *−0.81793 *−0.1005−0.0717−0.17978−0.18977−0.09099−0.22792−0.05966
Silt 10.73081 *0.078750.053860.17950.182380.113570.236070.04824
Clay 10.168970.130220.141050.17852−0.023430.143350.09406
TC 10.59605 *0.67265 *0.5263 *0.47702 *0.062070.16341
TOC 10.86597 *−0.17336−0.00620.51283 *0.55847 *
TN 1−0.106290.166410.52482 *0.54797 *
CaCO3 10.50533 *−0.28592−0.23362
pH 1−0.0839−0.14546
Cu-DTPA 10.48889 *
Cu-Total 1
* Correlation is significant at the 0.05 level.
Table A2. Correlation matrix (Pearson) of the Aetoliko lagoon sediments data.
SandSiltClayTCTOCTNTSCaCO3Cu-DTPACu-Total
Sand10.65887 *−0.76889 *0.22134−0.66149 *−0.59118−0.251120.26440.02156−0.28028
Silt 1−0.98758 *0.21212−0.12936−0.31550.316420.57585−0.20466−0.5398
Clay 1−0.226530.248120.39165−0.21649−0.544680.169450.51735
TC 10.053110.079320.08571−0.522680.14493−0.1055
TOC 10.83865 *0.67199 *−8.36 × 10⁻⁴−0.5327−0.35097
TN 10.31596−0.00878−0.64473 *−0.26396
TS 10.19281−0.22402−0.4549
CaCO3 1−0.55568−0.56165
Cu-DTPA 10.79088 *
Cu-Total 1
* Correlation is significant at the 0.05 level.

References

  1. Wightwick, A.; Walters, R.; Allinson, G.; Reichman, S.; Menzies, N. Environmental Risks of Fungicides Used in Horticultural Production Systems. In Fungicides; Carisse, O., Ed.; InTech: London, UK, 2010; Chapter 14; pp. 273–304. ISBN 978-953-307-266-1. Available online: http://www.intechopen.com/books/fungicides/environmental-risks-of-fungicides-used-in-horticulturalproduction-systems (accessed on 19 June 2019).
  2. European Commission Economic Analysis of the Olive Sector. Directorate-General for Agriculture and Rural Development. 2012, pp. 1–10. Available online: http://ec.europa.eu/agriculture/olive-oil/economic-analysis_en.pdf (accessed on 19 June 2019).
  3. Gjekanoviky, A.; Bizmpiroulas, A.; Rotsios, K. Export Success Factors for Table Olives: The Perception of Greek Exporting Firms. Procedia Econ. Finance 2015, 33, 584–594. Available online: http://linkinghub.elsevier.com/retrieve/pii/S2212567115017402 (accessed on 19 June 2019).[Green Version]
  4. Weissteiner, C.J.; Strobl, P.; Sommer, S. Assessment of Status and Trends of Olive Farming Intensity in EU-Mediterranean Countries Using Remote Sensing Time Series and Land Cover Data. Ecol. Indic. 2011, 11, 601–610. [Google Scholar] [CrossRef]
  5. Roca, L.F.; Moral, J.; Viruega, J.R.; Avila, A.; Oliveira, R.; Trapero, A. Copper Fungicides in the Control of Olive Diseases. Olea 2007, 26, 48–50. Available online: http://olivediseases.com/media/vera_spain_cooper.pdf (accessed on 19 June 2019).
  6. Fan, J.; He, Z.; Lena, Q.M.; Stoffella, P.J. Accumulation and availability of copper in citrus grove soils as affected by fungicide application. J. Soils Sedim. 2011, 11, 639–648. [Google Scholar] [CrossRef]
  7. Steinmetz, Z.; Kenngott, K.G.J.; Azeroual, M.; Schafer, R.B.; Schaumann, G.E. Fractionation of copper and uranium in organic and conventional vineyard soils and adjacent stream sediments studied by sequential extraction. J. Soils Sedim. 2017, 17, 1092–1100. [Google Scholar] [CrossRef]
  8. Scheffer, F.; Schachtschabel, P. Lehrbuch der Bodenkunde; Spektrum Akademischer Verlag: Heidelberg, Germany, 2010; p. 573. [Google Scholar]
  9. Ministry of Environment of Finland—MEF. Government Decree on the Assessment of Soil Contamination and Remediation Needs. 2007, Volume 214, pp. 1–6. Available online: http://www.finlex.fi/en/laki/kaannokset/2007/en20070214.pdf (accessed on 19 June 2019).
  10. Tóth, G.; Hermann, T.; Da Silva, M.R.; Montanarella, L. Heavy metals in agricultural soils of the European Union with implications for food safety. Environ. Int. 2016, 88, 299–309. [Google Scholar] [CrossRef] [PubMed]
  11. Hellenic Statistical Authority. Areas of Compact Plantations, by Region and Regional Unities. 2016. Tables 5a, 9, 18. Available online: http://www.statistics.gr/ (accessed on 19 June 2019).
  12. Dafis, S.; Papastergiadou, S.; Georghiou, K.; Babalonas, D.; Georgiadis, T.; Papageorgiou, M.; Lazaridou, E.; Tsiaoussi, V. Directive 92/43/EEC the Greek “Habitat” Project NATURA 2000: An Overview, English ed.; Commission of the European Communities DG XI, the Goulandris Natural History Museum—Greek Biotope/Wetland Centre: Athens, Greece, 1997. [Google Scholar]
  13. Gianni, A.; Zacharias, I. Modeling the hydrodynamic interactions of deep anoxic lagoons with their source basins. Estuar. Coast. Shelf Sci. 2012, 110, 157–167. [Google Scholar] [CrossRef]
  14. Gianni, A.; Zamparas, M.; Papadas, I.T.; Kehayas, G.; Deligiannakis, Y.; Zacharias, I. Monitoring and Modeling of Metal Concentration Distributions in Anoxic Basins: Aitoliko Lagoon, Greece. Aquat. Geochem. 2013, 19, 77–95. [Google Scholar] [CrossRef]
  15. Avramidis, P.; Bekiar, V.; Christodoulou, D.; Papatheodorou, G. Sedimentology and water column stratification in a permanent anoxic Mediterranean lagoon environment, Aetoliko Lagoon, western Greece. Environ. Earth Sci. 2015, 73, 5687–5701. [Google Scholar] [CrossRef]
  16. Dassenakis, M.; Krasakopoulou, E.; Matzara, B. Chemical Characteristics of Aetoliko lagoon, Greece, after an ecological shock. Mar. Pollut. Bull. 1994, 28, 427–433. [Google Scholar] [CrossRef]
  17. Leonardos, I.; Sinis, A.I. Fish Mass mortality in the Etolikon lagoon Greece: The role of local Geology. Cybium 1997, 21, 201–206. [Google Scholar]
  18. Papadas, I.T.; Katerinopoulos, L.; Gianni, A.; Zacharias, I.; Deligiannakis, Y. A theoretical and experimental physicochemical study of sulfur species in the anoxic lagoon of Aitoliko-Greece. Chemosphere 2009, 74, 1011–1017. [Google Scholar] [CrossRef] [PubMed]
  19. Chamalaki, A.; Gianni, A.; Kehayias, G.; Zacharias, I.; Tsiamis, G.; Bourtzis, K. Bacterial diversity and hydrography of Etoliko, an anoxic semi-enclosed coastal basin in Western Greece. Ann. Microb. 2014, 64, 661–670. [Google Scholar] [CrossRef]
  20. Vött, A.; Schriever, A.; Handl, M.; Brückneret, H. Holocene Palaeogeographies of the Eastern Acheloos River Delta and the Lagoon of Etoliko (NW Greece). J. Coast. Res. 2007, 234, 1042–1066. [Google Scholar] [CrossRef]
  21. Haenssler, E.; Nadeau, M.J.; Vött, A.; Unkel, I. Natural and human induced environmental changes preserved in a Holocene sediment sequence from the Etoliko Lagoon, Greece: New evidence from geochemical proxies. Quat. Int. 2013, 308–309, 89–104. [Google Scholar] [CrossRef]
  22. Koutsodendris, A.; Brauer, A.; Zacharias, I.; Putyrskaya, V.; Klemt, E.; Sangiorgi, F.; Pross, J. Ecosystem response to human- and climate-induced environmental stress on an anoxic coastal lagoon (Etoliko, Greece) since 1930 AD. J. Paleolimnol. 2015, 53, 255–270. [Google Scholar] [CrossRef]
  23. Tóth, G.; Jones, A.; Montanarella, L. (Eds.) LUCAS Topsoil Survey Methodology, Data and Results. In European Commission Joint Research Centre; Report EUR 26102 EN; Joint Research Centre: Ispra, Italy, 2013; pp. 1–154. Available online: https://esdac.jrc.ec.europa.eu/ESDB_Archive/eusoils_docs/other/EUR26102EN.pdf (accessed on 19 June 2019).
  24. Benennung und Beschreibung von Boden und Fels; DIN 4022-1; Beuth Verlag: Berlin, Germany, 1987.
  25. Folk, R.L.; Ward, W.C. A Study in the Significance of Grain-Size Parameters. J. Sediment. Petrol. 1957, 27, 3–26. [Google Scholar] [CrossRef]
  26. Gaudette, H.; Flight, W.; Toner, L.; Folger, D. An inexpensive titration method for the determination of organic carbon in recent sediments. J. Sediment. Petrol. 1974, 44, 249–253. [Google Scholar]
  27. Avramidis, P.; Nikolaou, K.; Bekiari, V. Total Organic Carbon and Total Nitrogen in Sediments and Soils: A Comparison of the Wet Oxidation—Titration Method with the Combustion-infrared Method. Agric. Agric. Sci. Procedia 2015, 4, 425–430. [Google Scholar] [CrossRef]
  28. Barouchas, P. Automatic Portable and Digital Calcium Carbonate Measuring Instrument Practicable for Soil Samples—A Device Characterized by Incorporated Temperature—Counter Balancing Means, Potential Communication and Location of the Geographical Position of the Measurement, Greek Industrial Property Organization (OBI). Patent No. GR1008089 (B)―2014-01-21; Int. Cl. G01N33/24; G01N7/18 (valid until 20 October 2032), 2014. [Google Scholar]
  29. Barouchas, P. Automatic Portable and Digital Soil Calcimeter. World Intellectual Property Organization, WIPO Publication No. WO2014060782 A1, 24 April 2014. [Google Scholar]
  30. Barouchas, P. FOG II—A New Innovative Portable Instrument for the Total Calcium Carbonate Soil Testing. In Proceedings of the 20th World Congress of Soil Science, Jeju, Korea, 8–13 June 2014; pp. 4–106, AF2494. [Google Scholar]
  31. Love, S. Field Methods for the Analysis of Mud Brick Architecture. J. Field Arch. 2017, 42, 1–13. [Google Scholar] [CrossRef]
  32. Müller, G.; Gastner, M. The ‘Karbonat e bombe’, a simple device for the determination of carbonate content in sediments, soils and other materials. Neues Jahrbuch für Mineralogie 1971, 10, 466–469. [Google Scholar]
  33. Jones, G.A.; Kaiteris, P. A vacuum-gasometric technique for rapid and precise analysis of calcium carbonate in sediments and soils. J. Sediment. Petrol. 1983, 53, 655–660. [Google Scholar] [CrossRef]
  34. Bernas, B. A new method for decomposition and comprehensive analysis of silicates by atomic absorption spectrometry. Anal. Chem. 1968, 40, 1682–1686. [Google Scholar] [CrossRef]
  35. Lindsay, W.L.; Norvell, W.A. Development of a DTPA Soil Test for Zinc, Iron, Manganese, and Copper. Soil Sci. Am. J. 1978, 42, 421–428. [Google Scholar] [CrossRef]
  36. Soil Quality—Determination of pH; DIN ISO 10390; International Organization for Standardization: Geneva, Switzerland, 2005.
  37. USDA. Natural Resources Conservation Service. Soil Quality Indicators: pH. U.S. Department of Agriculture, 1998. Available online: https://www.nrcs.usda.gov/Internet/FSE_DOCUMENTS/nrcs142p2_052208.pdf (accessed on 19 June 2019).
  38. Tiller, K.G.; Merry, R.H. Copper Pollution of Agricultural Soils. In Proceedings of the Golden Jubilee International Symposium on Copper in Soils and Plants, Murdoch University, Perth, Western Australia, 7–9 May 1981; Academic Press: Sydney, Australia, 1981; p. 119. [Google Scholar]
  39. McBride, M.B. Forms and Distribution of Copper in Solid and Solution Phases of Soil. In Proceedings of the Golden Jubilee International Symposium on Copper in Soils and Plants, Murdoch University, Perth, Western Australia, 7–9 May 1981; Loneragan, J., Robson, A., Graham, R., Eds.; Academic Press: Sydney, Australia, 1981; pp. 25–45. [Google Scholar]
  40. Vavoulidou, E.; Avramides, E.J.; Papadopoulos, P.; Dimirkou, A.; Charoulis, A.; Konstantinidou-Doltsinis, S. Copper Content in Agricultural Soils Related to Cropping Systems in Different Regions of Greece. Comm. Soil Sci. Plant Anal. 2005, 36, 759–773. [Google Scholar] [CrossRef]
  41. Carlon, C. Derivation Methods of Soil Screening Values in Europe; EUR 22805-EN; A Review and Evaluation of National Procedures Towards Harmonization; European Commission, Joint Research Centre: Ispra, Italy, 2007; 306p, Available online: https://esdac.jrc.ec.europa.eu/ESDB_Archive/eusoils_docs/other/EUR22805.pdf (accessed on 19 June 2019).
  42. Van der Voet, E.; Salminen, R.; Eckelman, M.; Mudd, G.; Norgate, T.; Hischier, R. Environmental Risks and Challenges of Anthropogenic Metals Flows and Cycles; A Report of the Working Group on the Global Metal Flows to the International Resource Panel; UNEP: Nairobi, Kenya, 2013; p. 231. [Google Scholar]
  43. MacDonald, D.D.; Ingersoll, C.G. Tools for Assessing Contaminated Sediments in Freshwater, Estuarine, and Marine Ecosystems. In Sedimentology for Aqueous Systems; Chapter 7; Poleto, C., Charlesworth, S., Eds.; Wiley-Blackwell: Hoboken, NJ, USA, 2010; 210p. [Google Scholar]
  44. Perin, G.; Bonardi, M.; Fabris, R.; Simoncini, B.; Manente, S.; Tosi, L.; Scotto, S. Heavy metal pollution in central Venice Lagoon bottom sediments: Evaluation of the metal bioavailability by geochemical speciation procedure. Environ. Technol. 1997, 18, 593–604. [Google Scholar] [CrossRef]
  45. Pekey, H.; Karakas, D.; Ayberk, S.; Tolun, L.; Bakoglu, M. Ecological risk assessment using trace elements from surface sediments of Izmit Bay (Northeastern Marmara Sea) Turkey. Mar. Pollut. Bull. 2004, 48, 946–953. [Google Scholar] [CrossRef] [PubMed]
  46. McLaughlin, M.J. Ageing of Metals in Soils Changes Bioavailability; Fact Sheet on Environmental Risk Assessment No. 5; International Council on Mining and Metals: London, UK, 2001. [Google Scholar]
  47. Mountouris, A.; Voutsas, E.; Tassios, D. Bioconcentration of heavy metals in aquatic environments: The importance of bioavailability. Mar. Pollut. Bull. 2002, 44, 1136–1141. [Google Scholar] [CrossRef]
  48. Bryan, G.W.; Langston, W.J. Bioavailability, accumulation and effects of heavy metals in sediments with special reference to United Kingdom estuaries: A review. Environ. Pollut. 1992, 76, 89–131. [Google Scholar] [CrossRef]
  49. Stumm, W.; Morgan, J.J. Aquatic Chemistry: An Introduction Emphasizing Chemical Equilibria in Natural Waters, 2nd ed.; John Wiley & Sons Ltd.: New York, NY, USA, 1981. [Google Scholar]
  50. Dutta, J.; Mishra, A.K. Influence of the presence of heavy metals on the behaviour of bentonites. Environ. Earth Sci. 2016, 75. [Google Scholar] [CrossRef]
  51. Lukman, S.; Essa, M.H.; Nuthu, D.; Muazu, N.; Bukhari, A.; Basheer, C. Adsorption and desorption of heavy metals onto natural clay material: Influence of initial pH. J. Environ. Sci. Technol. 2013, 6, 1–15. [Google Scholar] [CrossRef]
  52. Sipos, P.; Kis, V.K.; Baldzs, R.; Toth, A.; Kovacs, I.; Nemeth, T. Contribution of individual pure or mixed-phase mineral particles to metal sorption in soils. Geoderma 2018, 324, 1–8. [Google Scholar] [CrossRef] [Green Version]
  53. Medhi, H.; Bhattacharyya, K.G. Kinetic and mechanistic studies on adsorption of Cu(II) in aqueous medium onto montmorillonite K10 and its modified derivative. New J. Chem. 2017, 41, 13533–13552. [Google Scholar] [CrossRef]
  54. El Ass, K. Adsorption of cadmium and copper onto natural clay: Isotherm, kinetic and thermodynamic studies. Glob. NEST J. 2018, 20, 198–207. [Google Scholar]
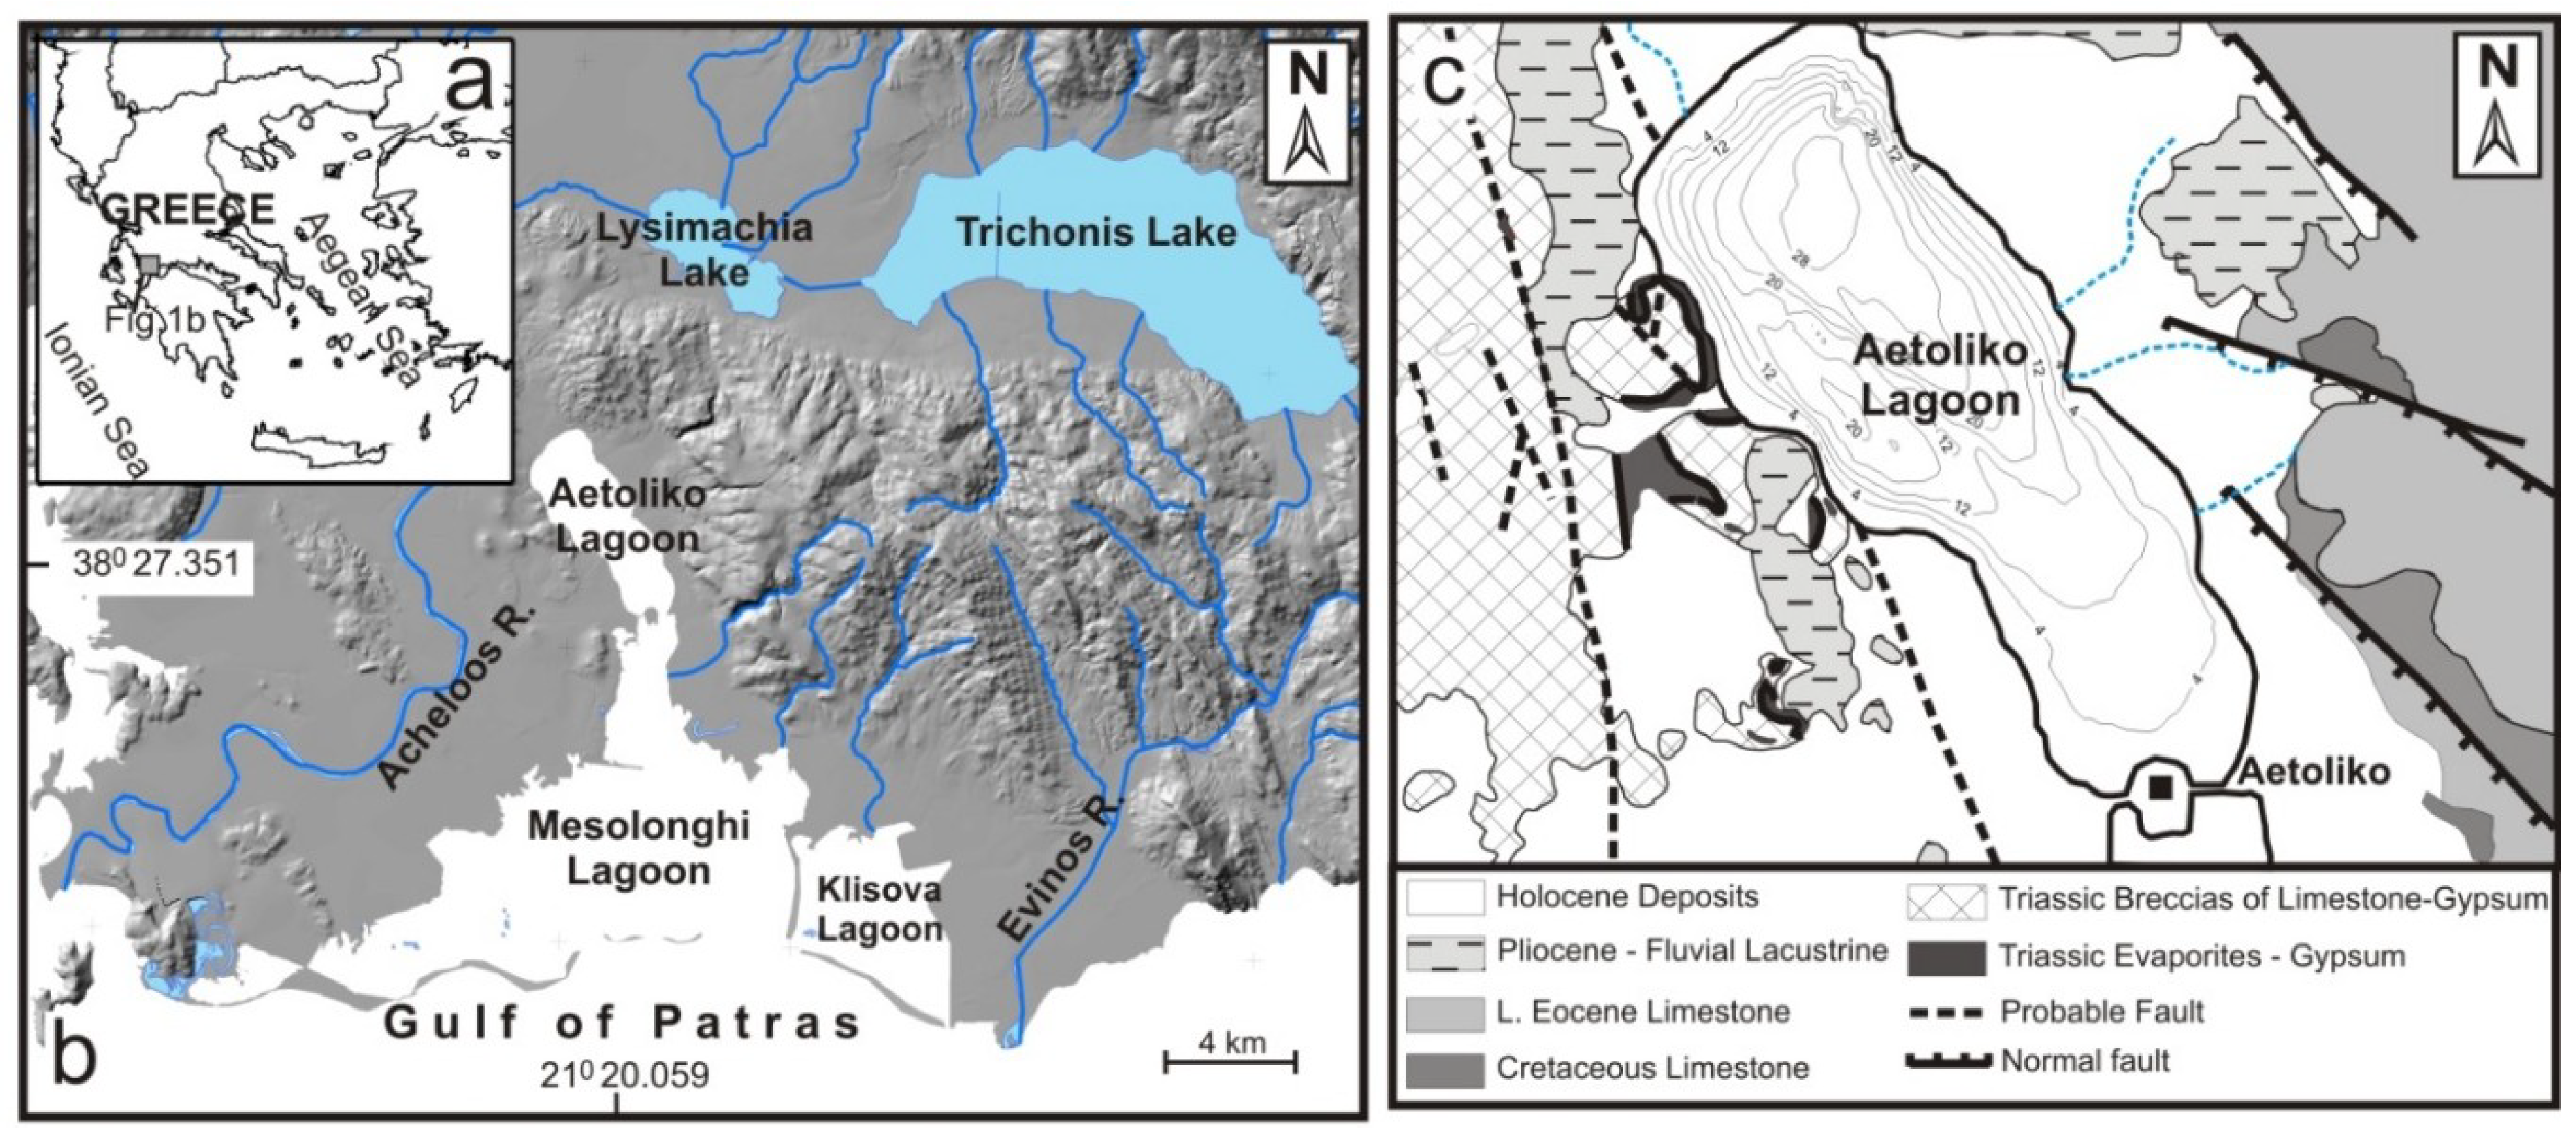
Figure 1. (a) General map of Greece and the location of the Aetoliko lagoon; (b) topographic map of the surrounding area of Aetoliko lagoon and the wetlands of Mesolonghi, Aetoliko, and Klisova lagoons complex; and (c) simplified geological map of the studied area.
Geosciences 09 00267 g001
Figure 2. Overview of the spatial distribution of the samples points. Green dots stand for soil sample points in the orchards and blue points are bottom sediment lagoon samples.
Geosciences 09 00267 g002
Figure 3. Total copper content of all samples.
Geosciences 09 00267 g003
Figure 4. Total and bioavailable copper concentration.
Geosciences 09 00267 g004
Figure 5. (a) Total and DTPA Cu values for the Aetoliko olive orchard soil samples in relation with the threshold, the higher ecological risk and the mean value reported for Western Greece and (b) total and DTPA Cu values for the Aetoliko lagoon sediment samples in relation to the Sediment Quality Guideline values of US EPA.
Geosciences 09 00267 g005
Figure 6. Schematic representation of the major geochemical processes of copper ions in the studied area.
Geosciences 09 00267 g006
Table 1. Sedimentological and geochemical analyses of the Aetoliko olive orchard soil sample.
Sampling StationsCoordinatesGrain Size AnalysisStatistical Parameters (Φ)TC (%)TOC (%)TN (%)CaCO3 (%)pHCu-DTPA (mg/Kg)Cu-Total (mg/Kg)
LongitudeLatitudeSandSiltClayMeanSortingSkewnessKurtosis
A138°27.08521°21.80912.0477.6810.295.902.000.181.025.242.830.742.407.2524.60422.50
A238°27.86821°21.36232.5757.999.445.242.490.100.835.013.090.630.005.4822.45463.44
A338°27.98221°21.24831.5958.879.535.272.500.060.863.602.800.550.006.35101.50220.38
A438°28.05921°21.05925.8964.0610.045.492.48−0.010.923.842.870.490.005.9472.05197.04
A538°28.24421°20.84522.6166.6210.775.732.340.020.873.842.960.531.206.5449.86205.63
A638°28.40521°20.77013.5373.8112.666.142.260.041.061.610.340.257.107.386.5258.37
A738°28.77421°20.78722.9864.3612.665.722.73−0.081.033.892.980.540.006.6773.36275.50
A838°28.90521°20.78019.1865.2515.576.072.76−0.101.085.103.300.750.006.22171.20567.04
A938°28.99721°20.61635.1155.629.285.022.660.070.903.012.270.480.006.3665.83242.35
A1038°29.17721°20.27654.1839.855.963.902.690.241.012.882.130.410.006.2646.52165.31
A1138°29.36521°20.13554.3837.128.503.923.100.270.844.402.830.530.506.7372.22267.60
A1238°29.46821°19.92633.4657.539.014.952.82−0.040.956.974.040.871.306.88107.60514.46
A1338°29.71321°19.60758.2534.637.123.503.100.290.846.503.590.722.707.0747.19228.39
A1438°30.03721°18.71428.8358.0313.145.422.91−0.030.952.161.590.390.006.3813.1895.65
A1538°29.88421°18.59851.1540.208.653.893.240.160.796.093.120.711.907.3148.41339.78
A1638°29.63321°18.21952.3540.347.313.812.980.190.863.190.660.3611.607.599.1977.67
A1738°29.43521°17.98323.2362.9813.785.762.86−0.041.118.912.500.5241.507.4113.32138.37
A1838°29.15521°17.93933.4656.4010.135.062.95−0.060.967.412.240.5131.507.5315.80174.28
A1938°28.81621°18.00413.3168.5818.116.592.75−0.141.385.713.390.608.207.4360.70671.33
A2038°28.71021°18.17351.2738.6410.093.933.390.200.708.633.220.640.007.386.68131.24
A2138°28.08321°18.33212.6466.7820.586.442.450.110.813.942.580.520.004.8510.81198.20
A2238°27.32721°20.03563.7228.767.523.373.010.500.864.003.400.522.306.8018.78349.40
A2338°27.30321°19.66059.0234.706.283.562.600.321.063.462.320.460.005.7044.54647.61
A2438°27.44821°19.69973.6521.444.912.642.540.501.202.631.900.390.005.8517.35353.73
A2538°27.41421°19.42663.5730.246.193.252.820.361.002.621.560.380.005.595.25150.68
Min 12.0421.444.912.642.00−0.140.701.610.340.250.004.855.2558.37
Max 73.6577.6820.586.593.390.501.388.914.040.8741.507.59171.20671.33
Table 2. Sedimentological and geochemical analyses of the Aetoliko lagoon sediment samples.
Sampling StationsCoordinatesGrain Size Analysis (%)Statistical Parameters (Φ)TC (%)TOC (%)TN (%)TS (%)CaCO3 (%)Cu-DTPA (mg/Kg) Cu-Total (mg/Kg)
LongitudeLatitudeSandSiltClayMeanSortingSkewnessKurtosis
T138.451329° 21.363612°10.2977.6812.045.902.000.181.025.244.510.771.732.400.2345.96
T238.464482° 21.356034°9.4457.9932.575.242.490.100.835.014.870.901.930.000.2854.20
T338.466344° 21.354113°9.5358.8731.595.272.500.060.863.604.720.801.810.000.2151.80
T438.467748° 21.350825°10.0464.0625.895.492.48−0.010.923.844.050.602.080.000.4953.35
T538.470667° 21.347412°10.7766.6222.615.732.340.020.873.843.900.661.581.200.4361.61
T638.473452° 21.346091°12.6673.8113.536.142.260.041.061.613.710.701.657.100.1443.85
T738.479552° 21.346429°12.6664.3622.985.722.73−0.081.033.892.420.551.160.000.6071.87
T838.481763° 21.346259°15.5765.2519.186.072.76−0.101.085.102.780.620.940.000.3149.17
T938.483272° 21.343522°9.2855.6235.115.022.660.070.903.014.180.751.130.000.3564.30
T1038.486290° 21.337759°5.9639.8554.183.902.690.241.012.883.980.781.150.000.3663.15
Min 5.9639.8512.043.902.00−0.100.831.612.420.550.940.000.1443.85
Max 15.5777.6854.186.142.760.241.085.244.870.902.087.100.6071.87
Average 10.6262.4126.975.452.490.050.963.803.910.711.521.070.3455.93