Assessing the Multiple Impacts of Extreme Hurricanes in Southern New England, USA

 ,
, 
 and
and 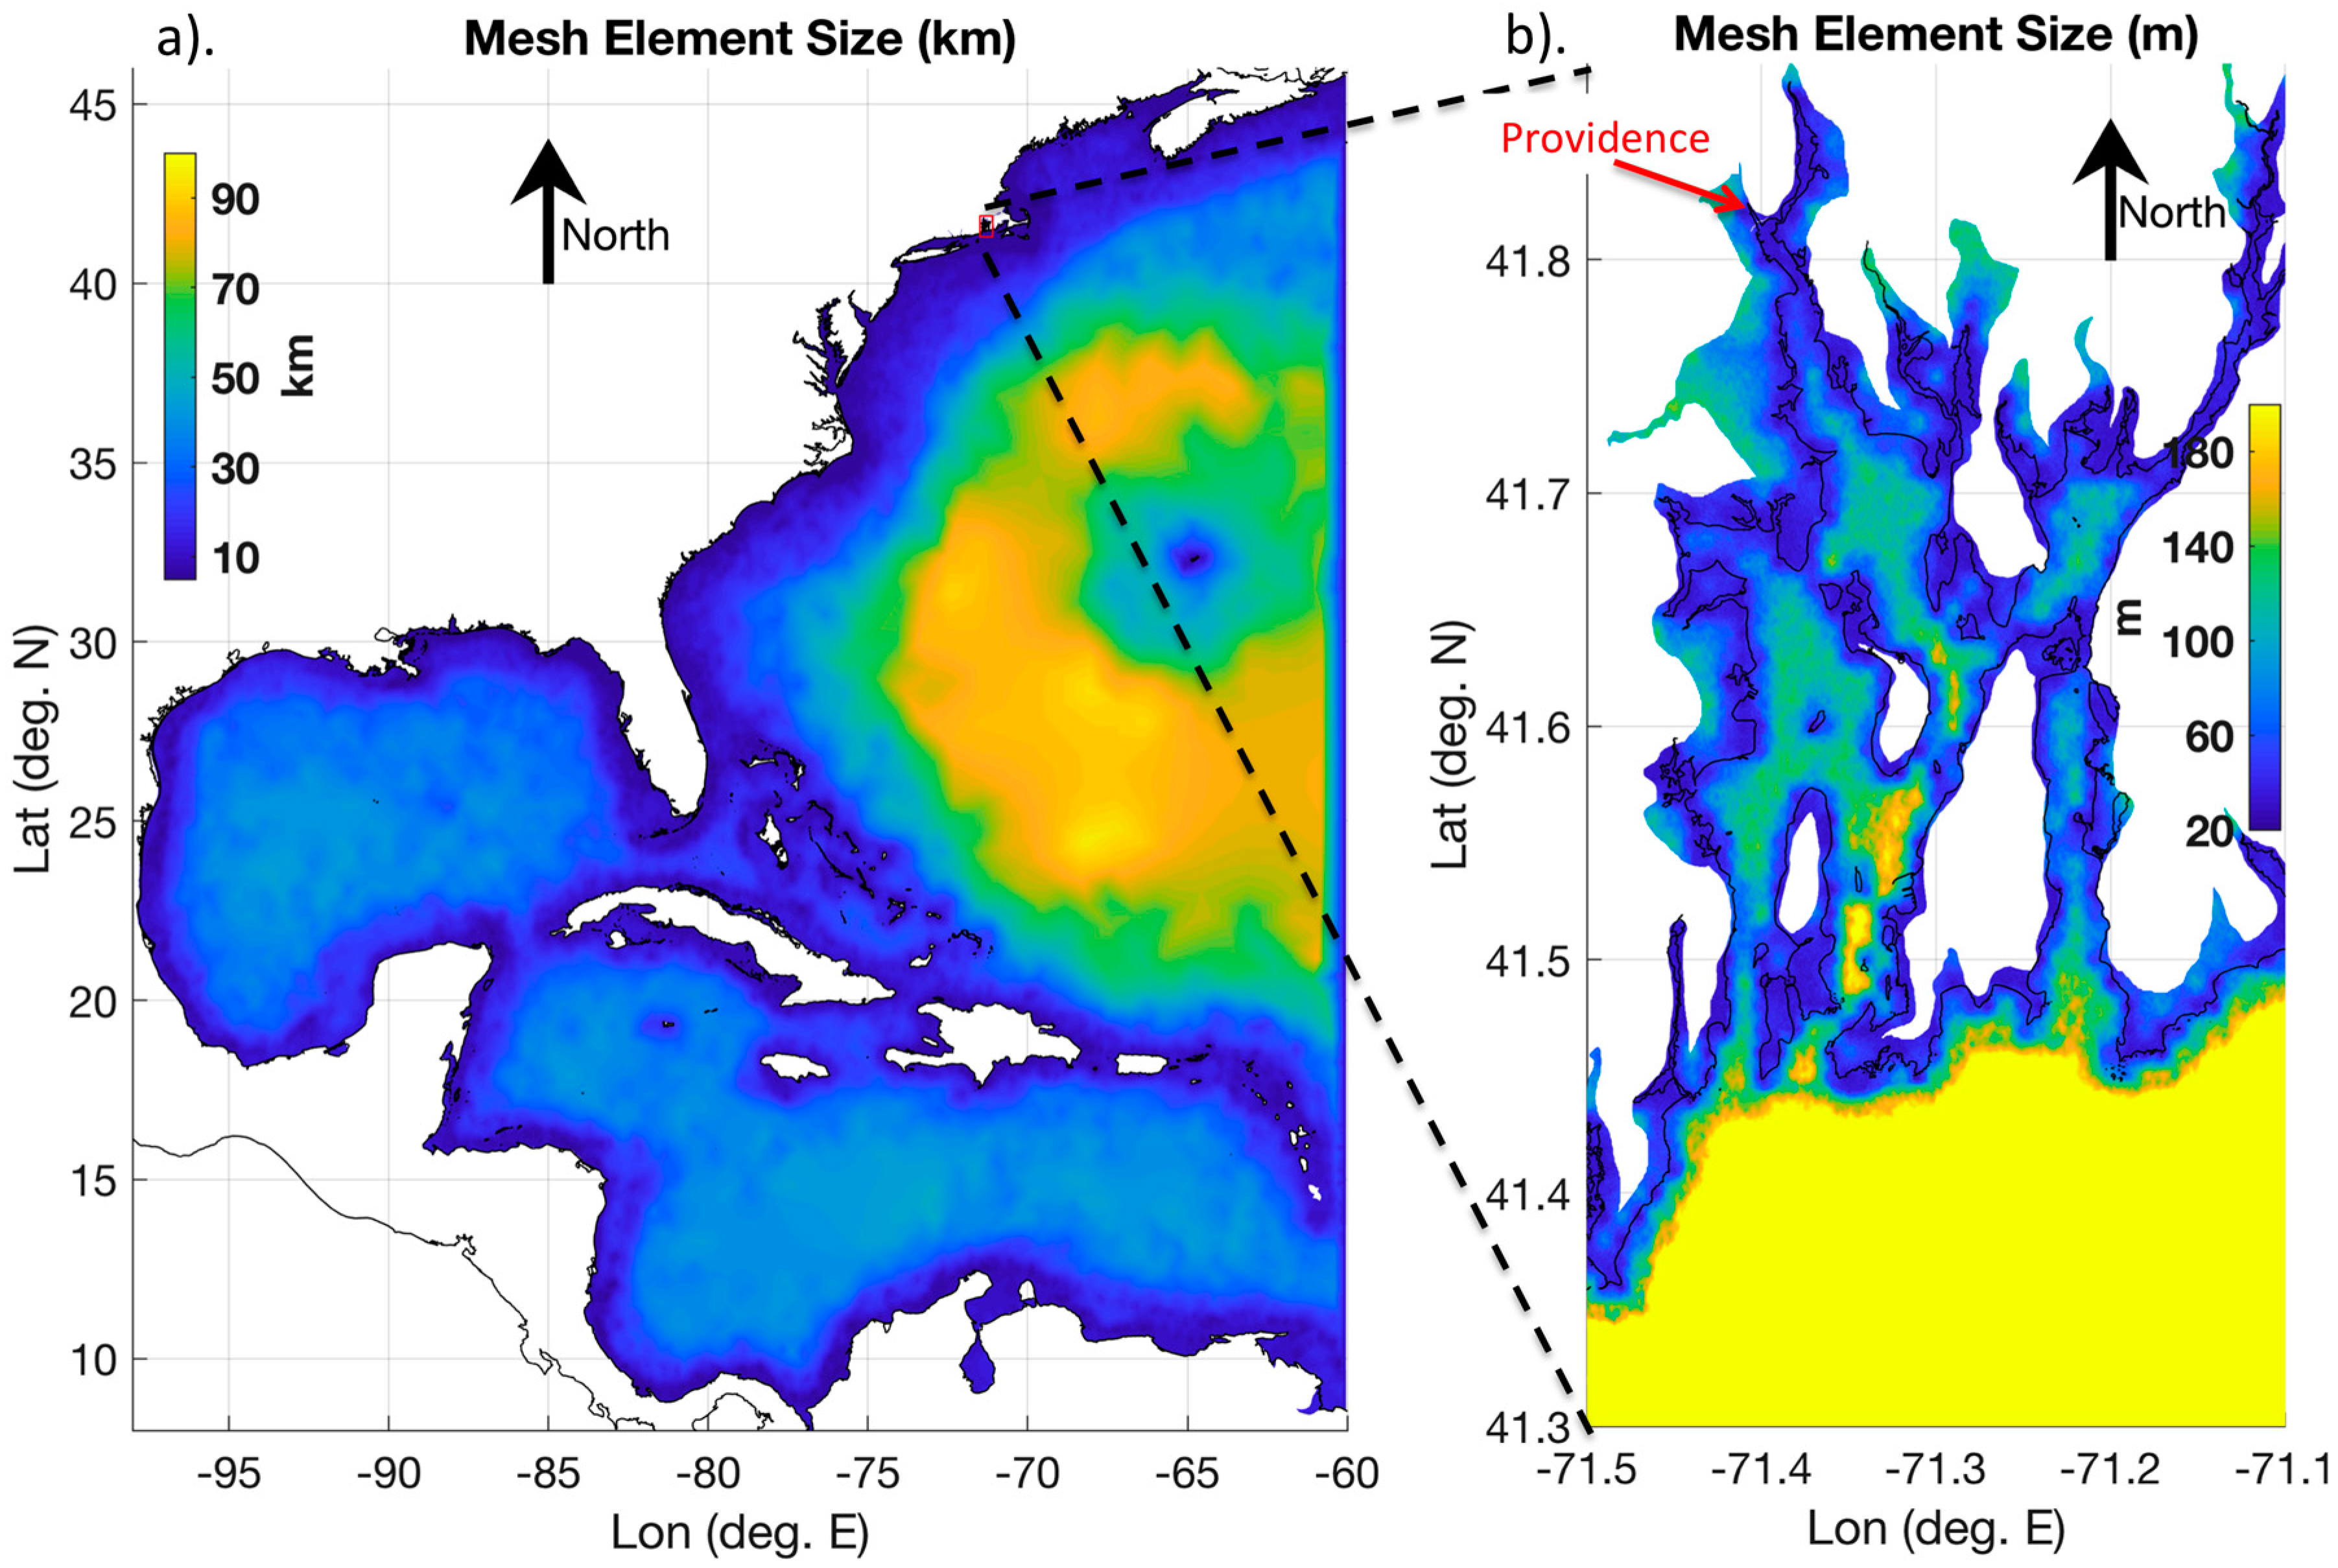
Abstract
1. Introduction
2. Materials and Methods
2.1. Storm Surge Model
2.2. Wave Model
2.3. River Runoff Model
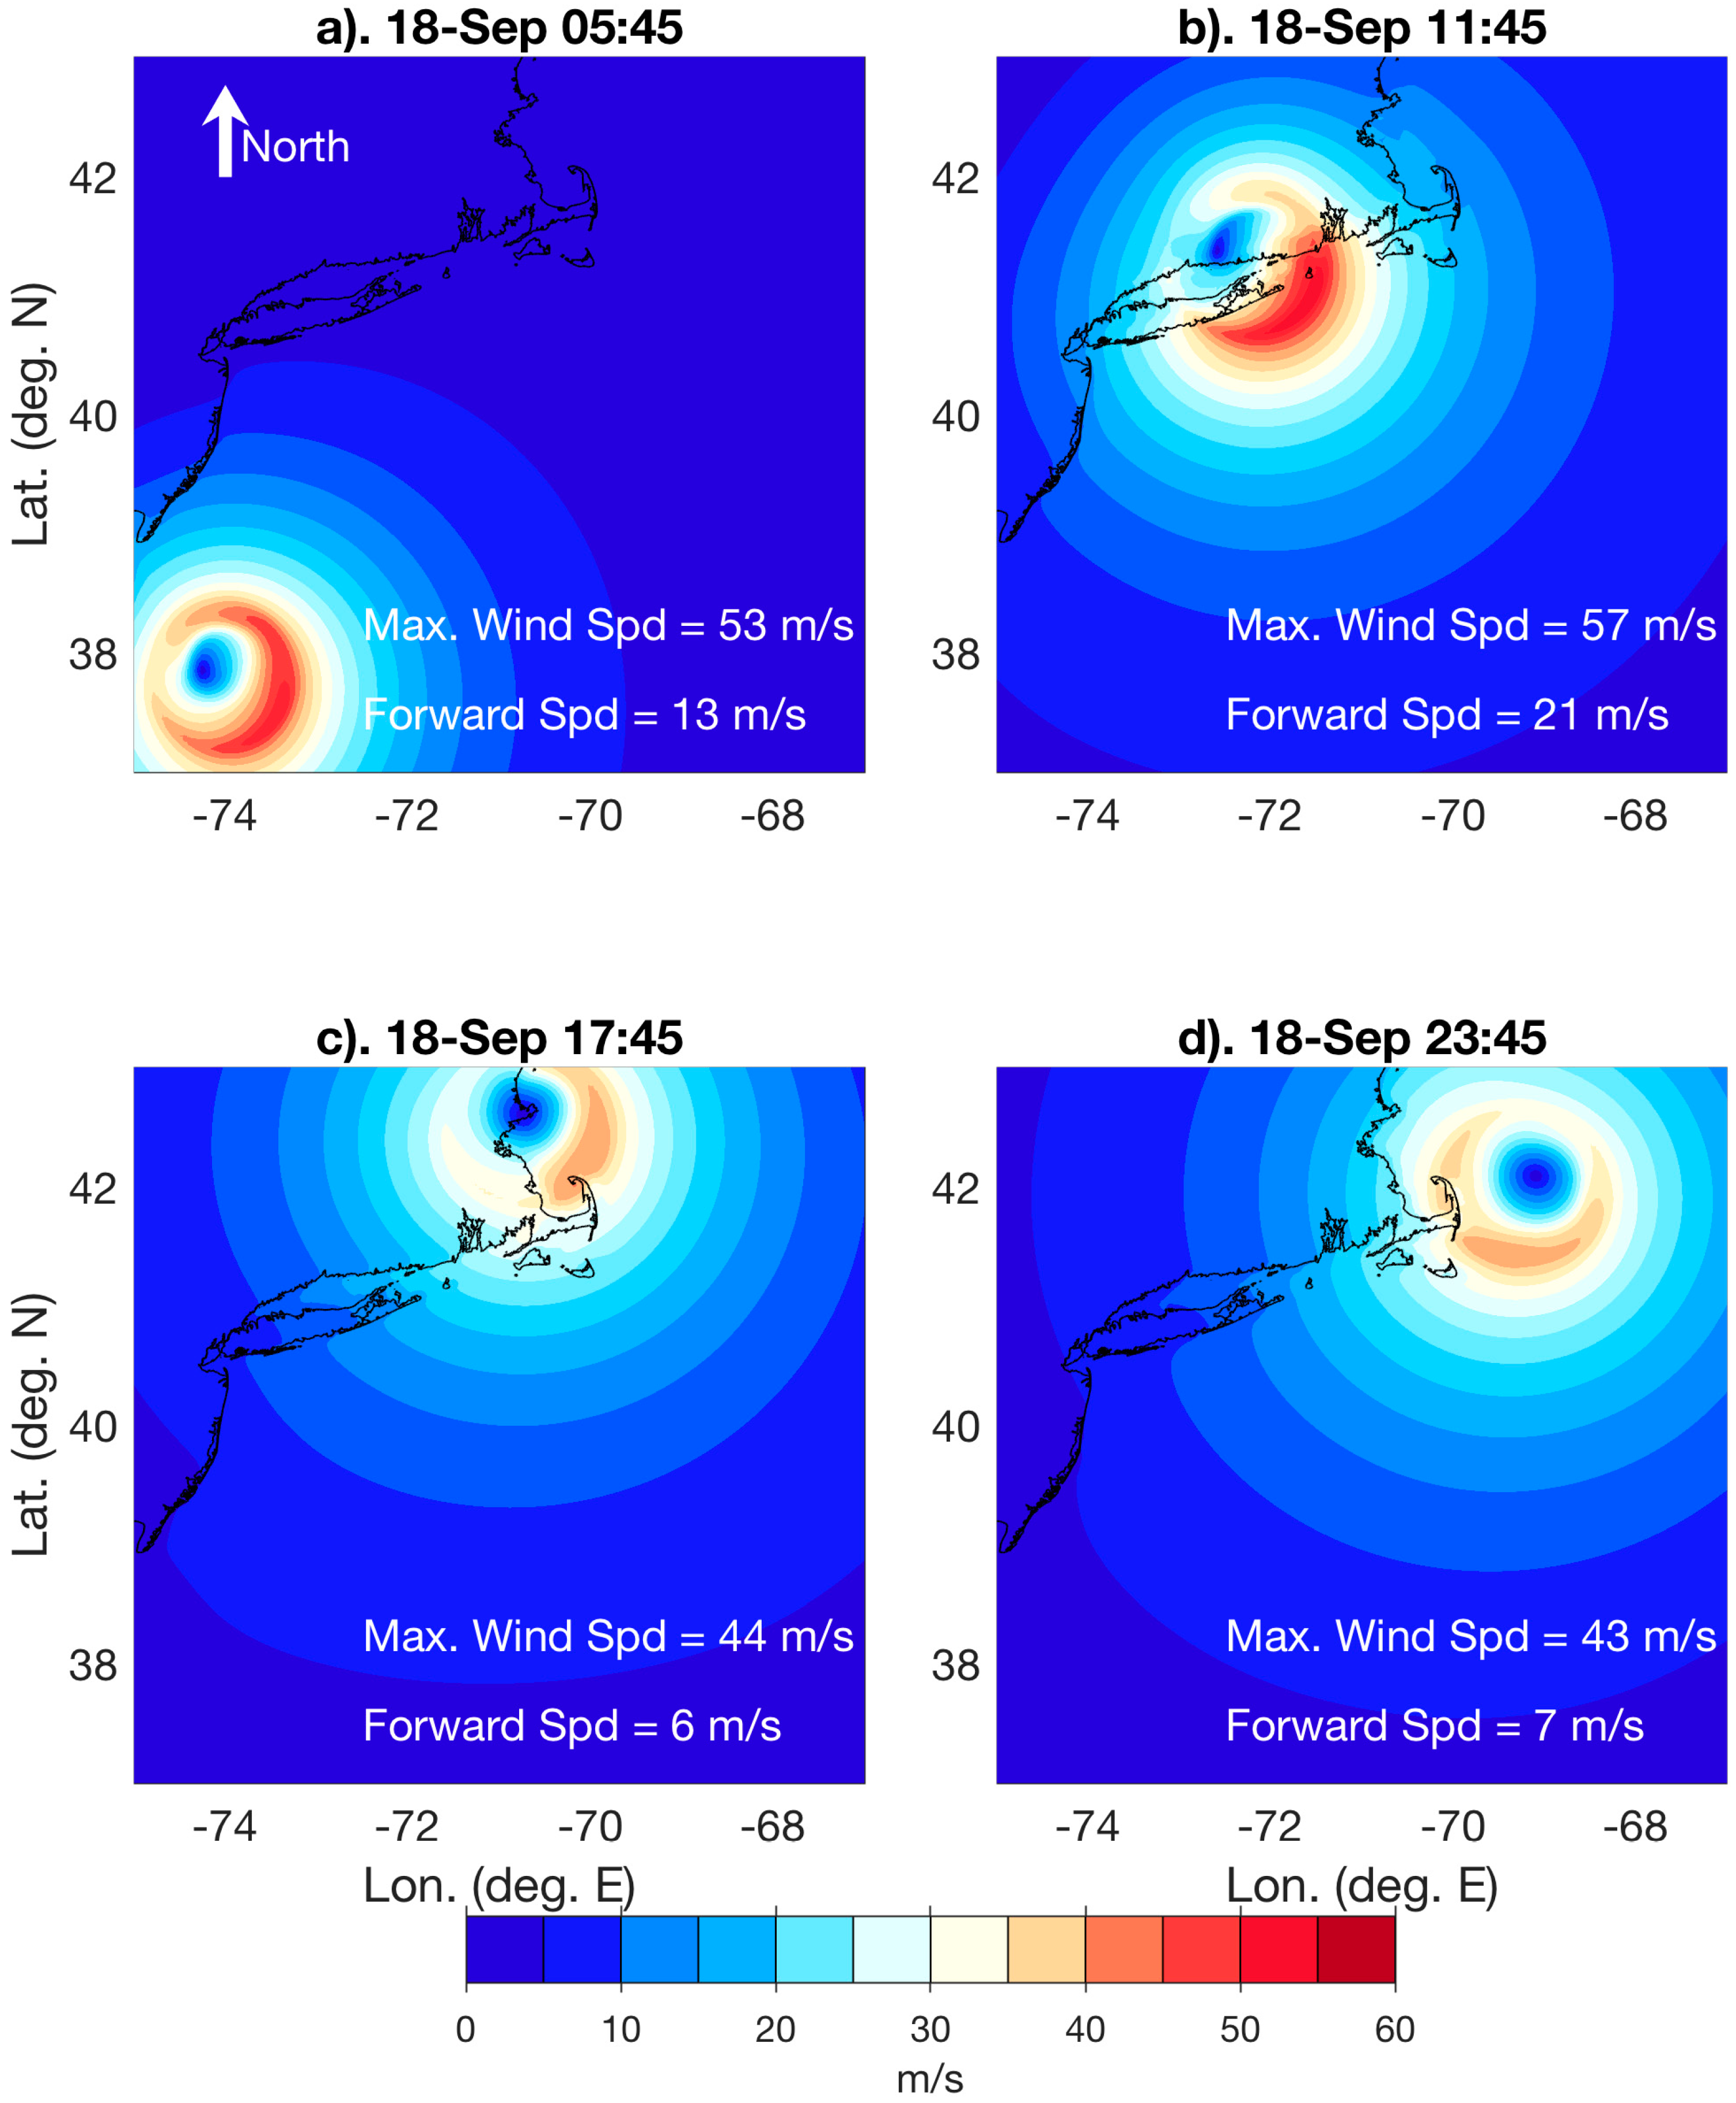
2.4. Hurricane Wind and Rainfall Models
2.5. Hurricane Rhody
3. Results
3.1. Simulation of a Historical Hurricane
3.2. Hurricane Rhody Simulations
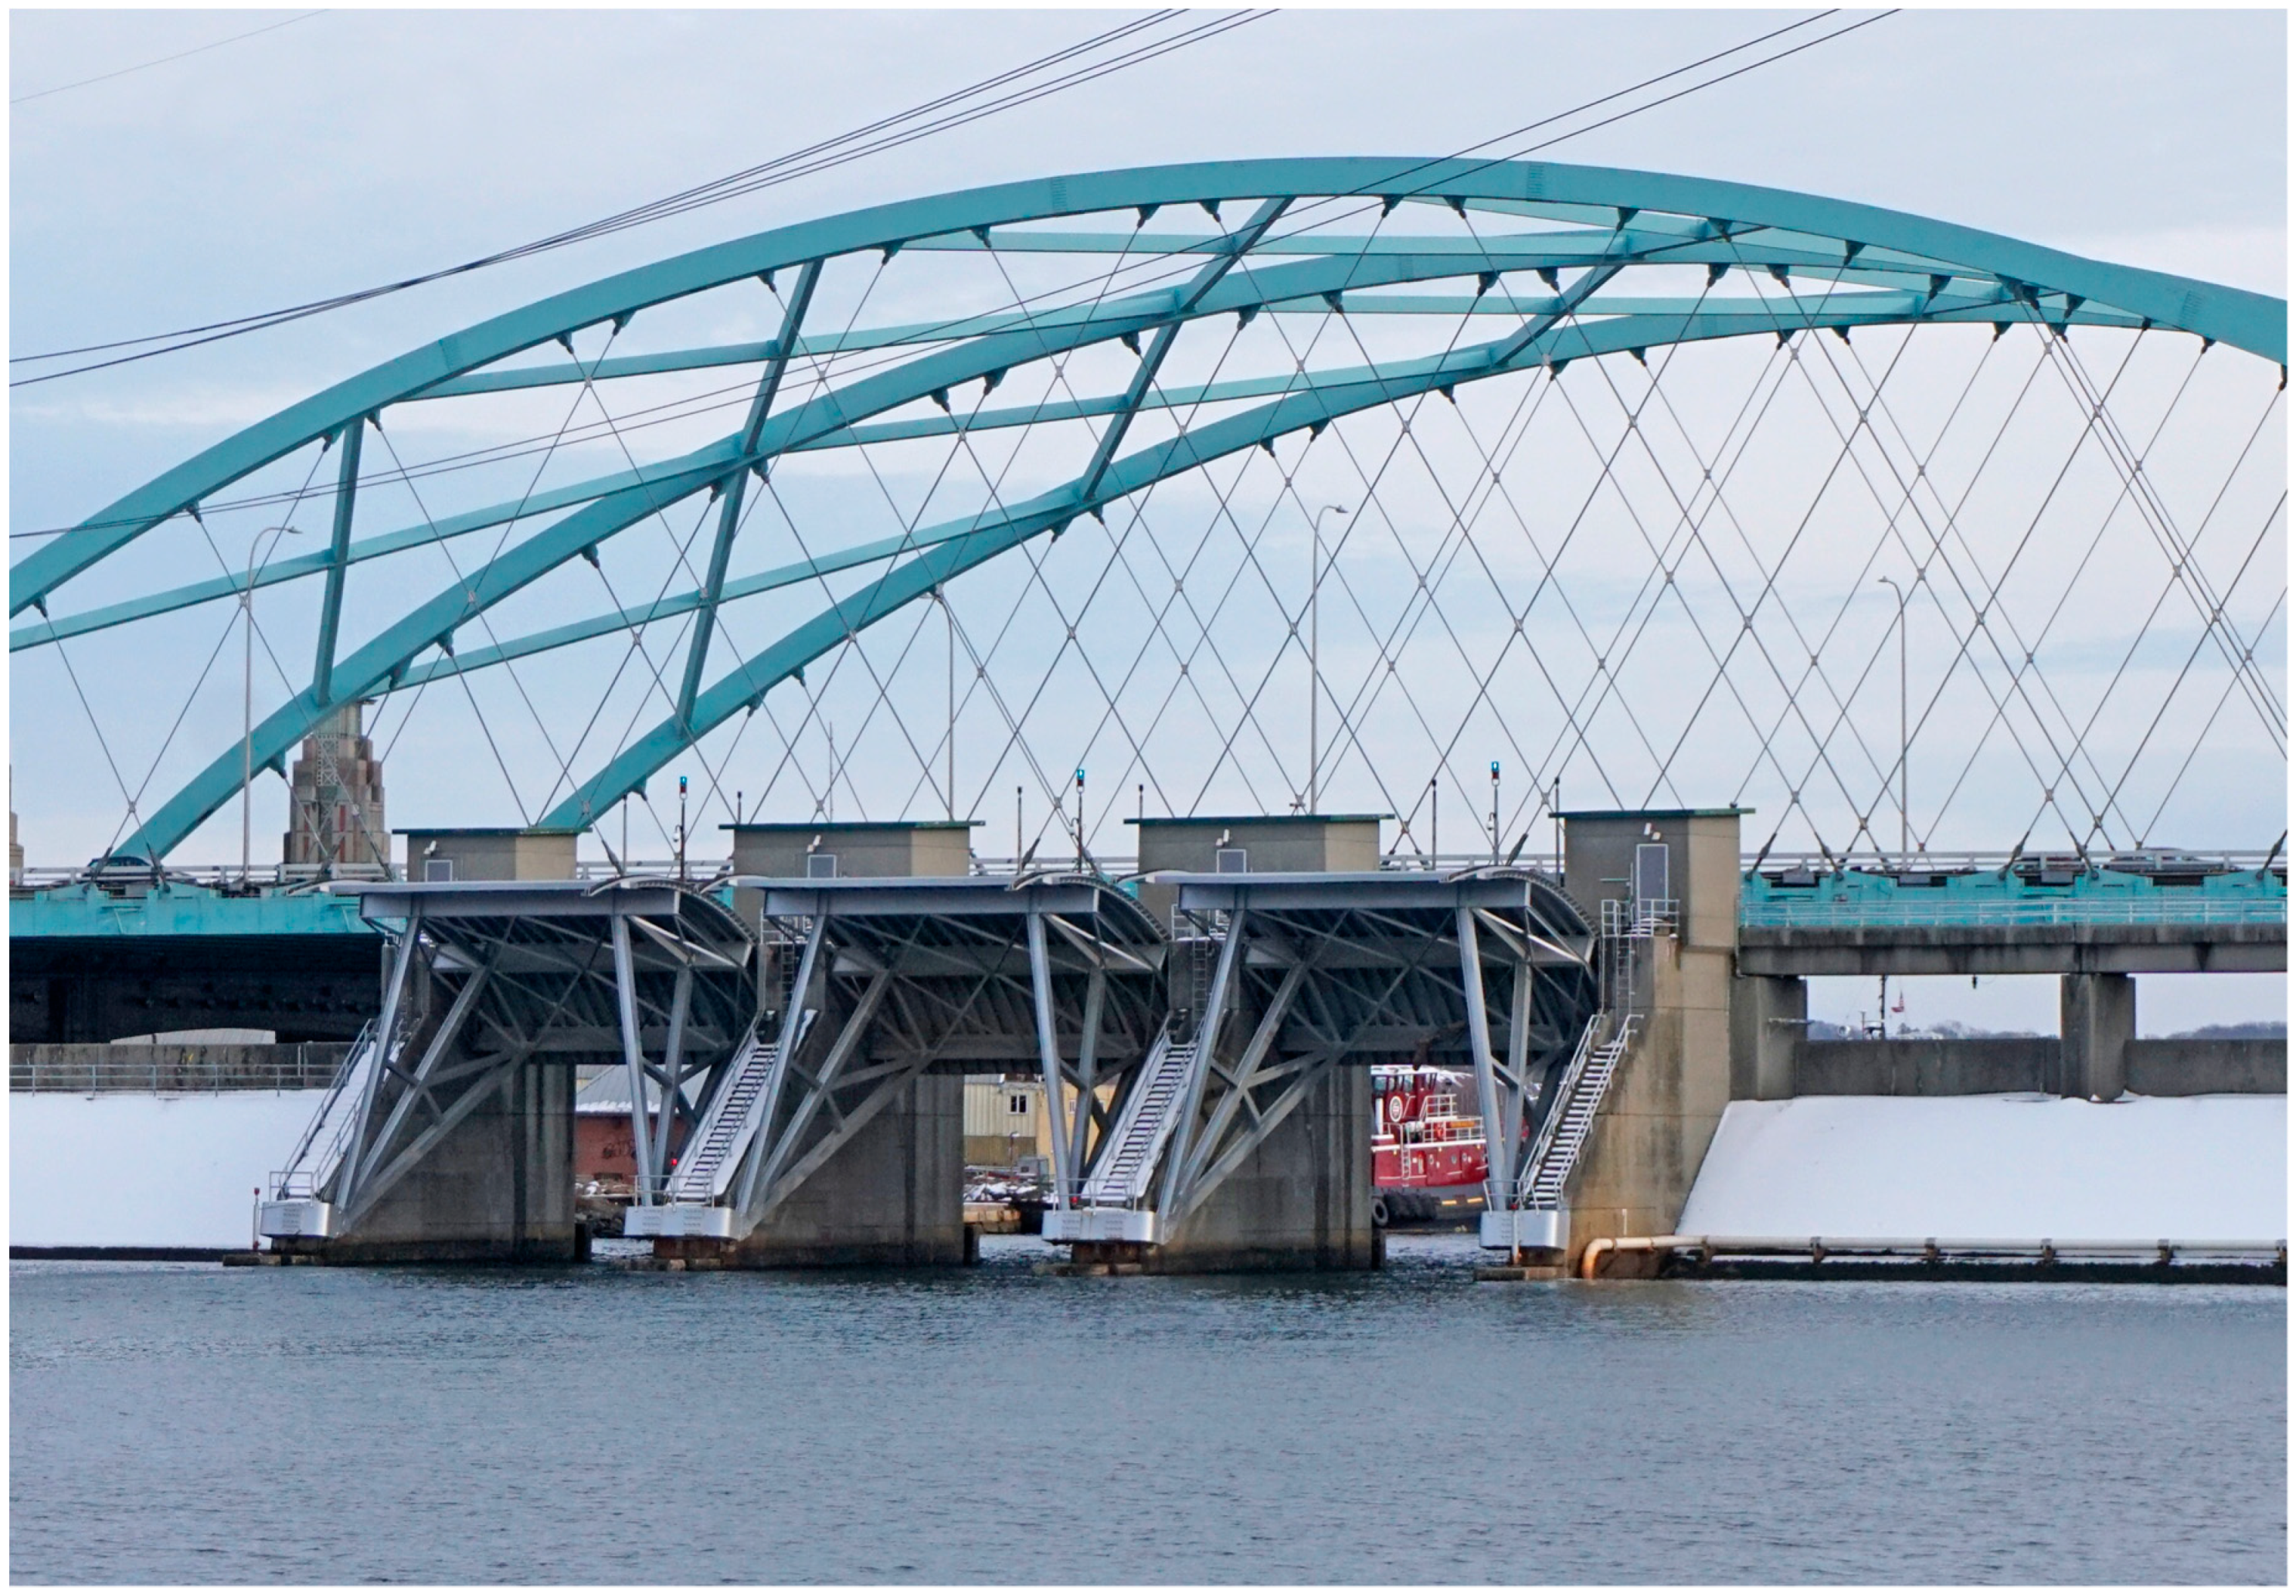
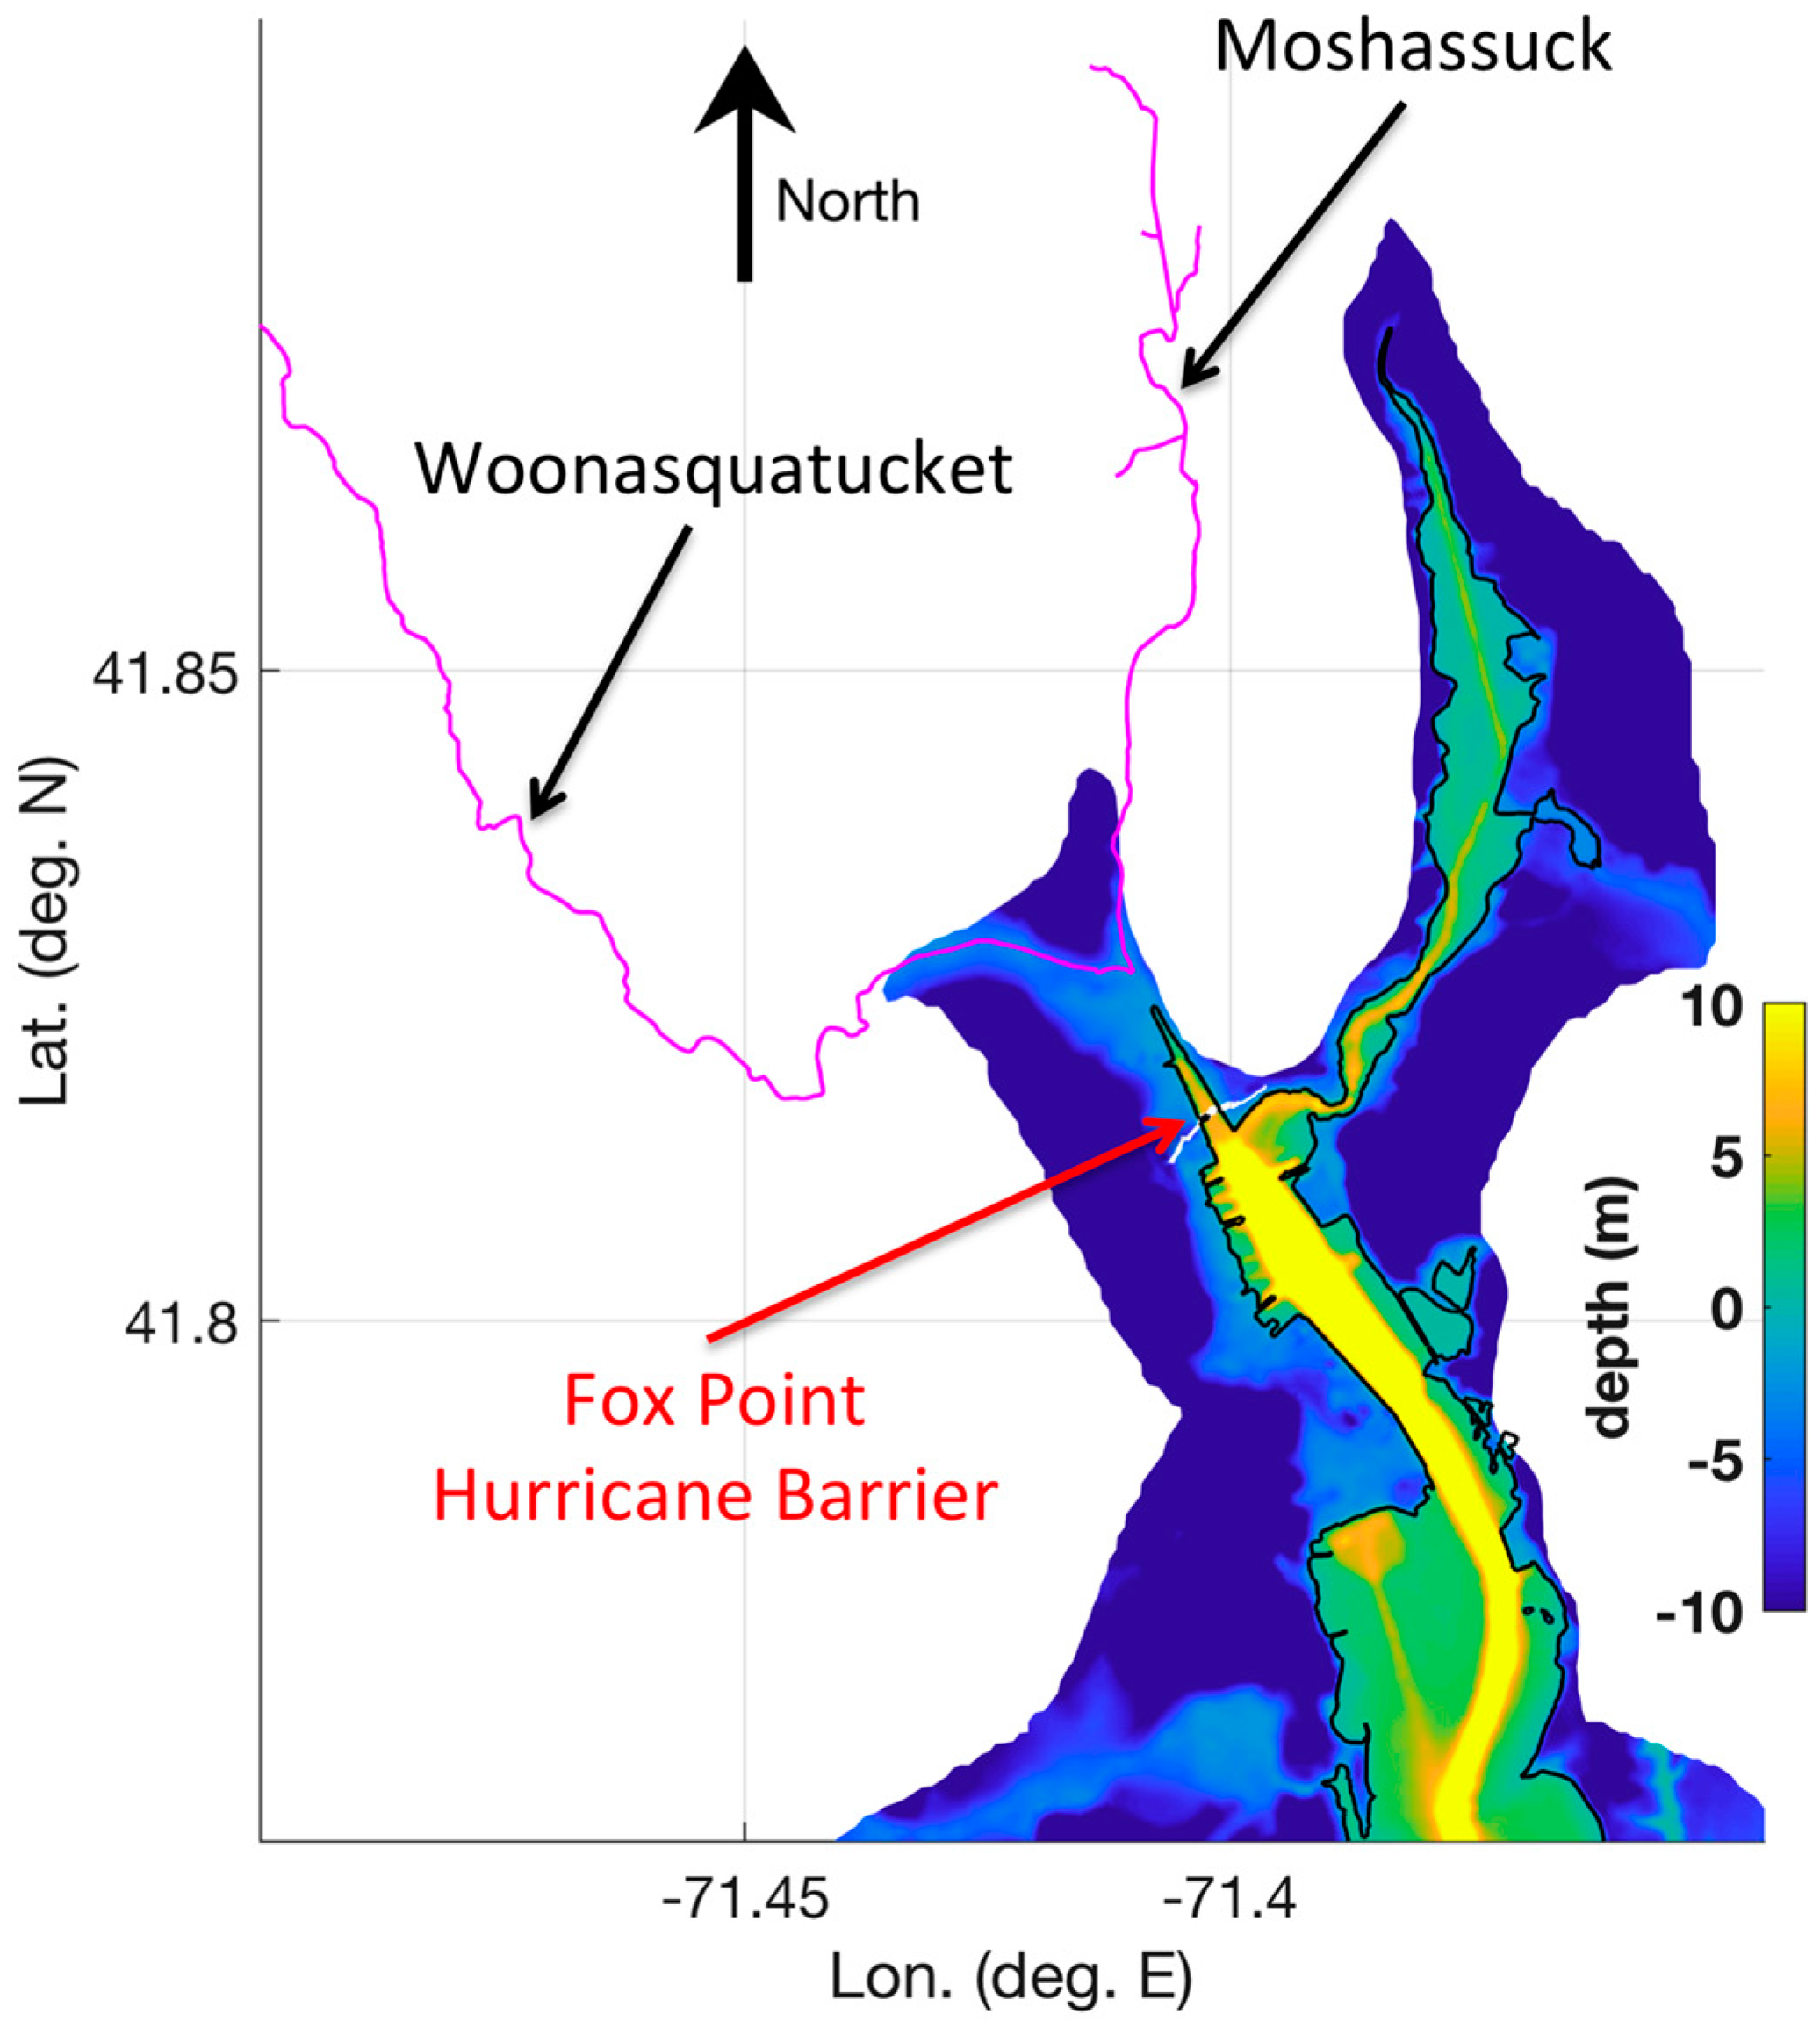
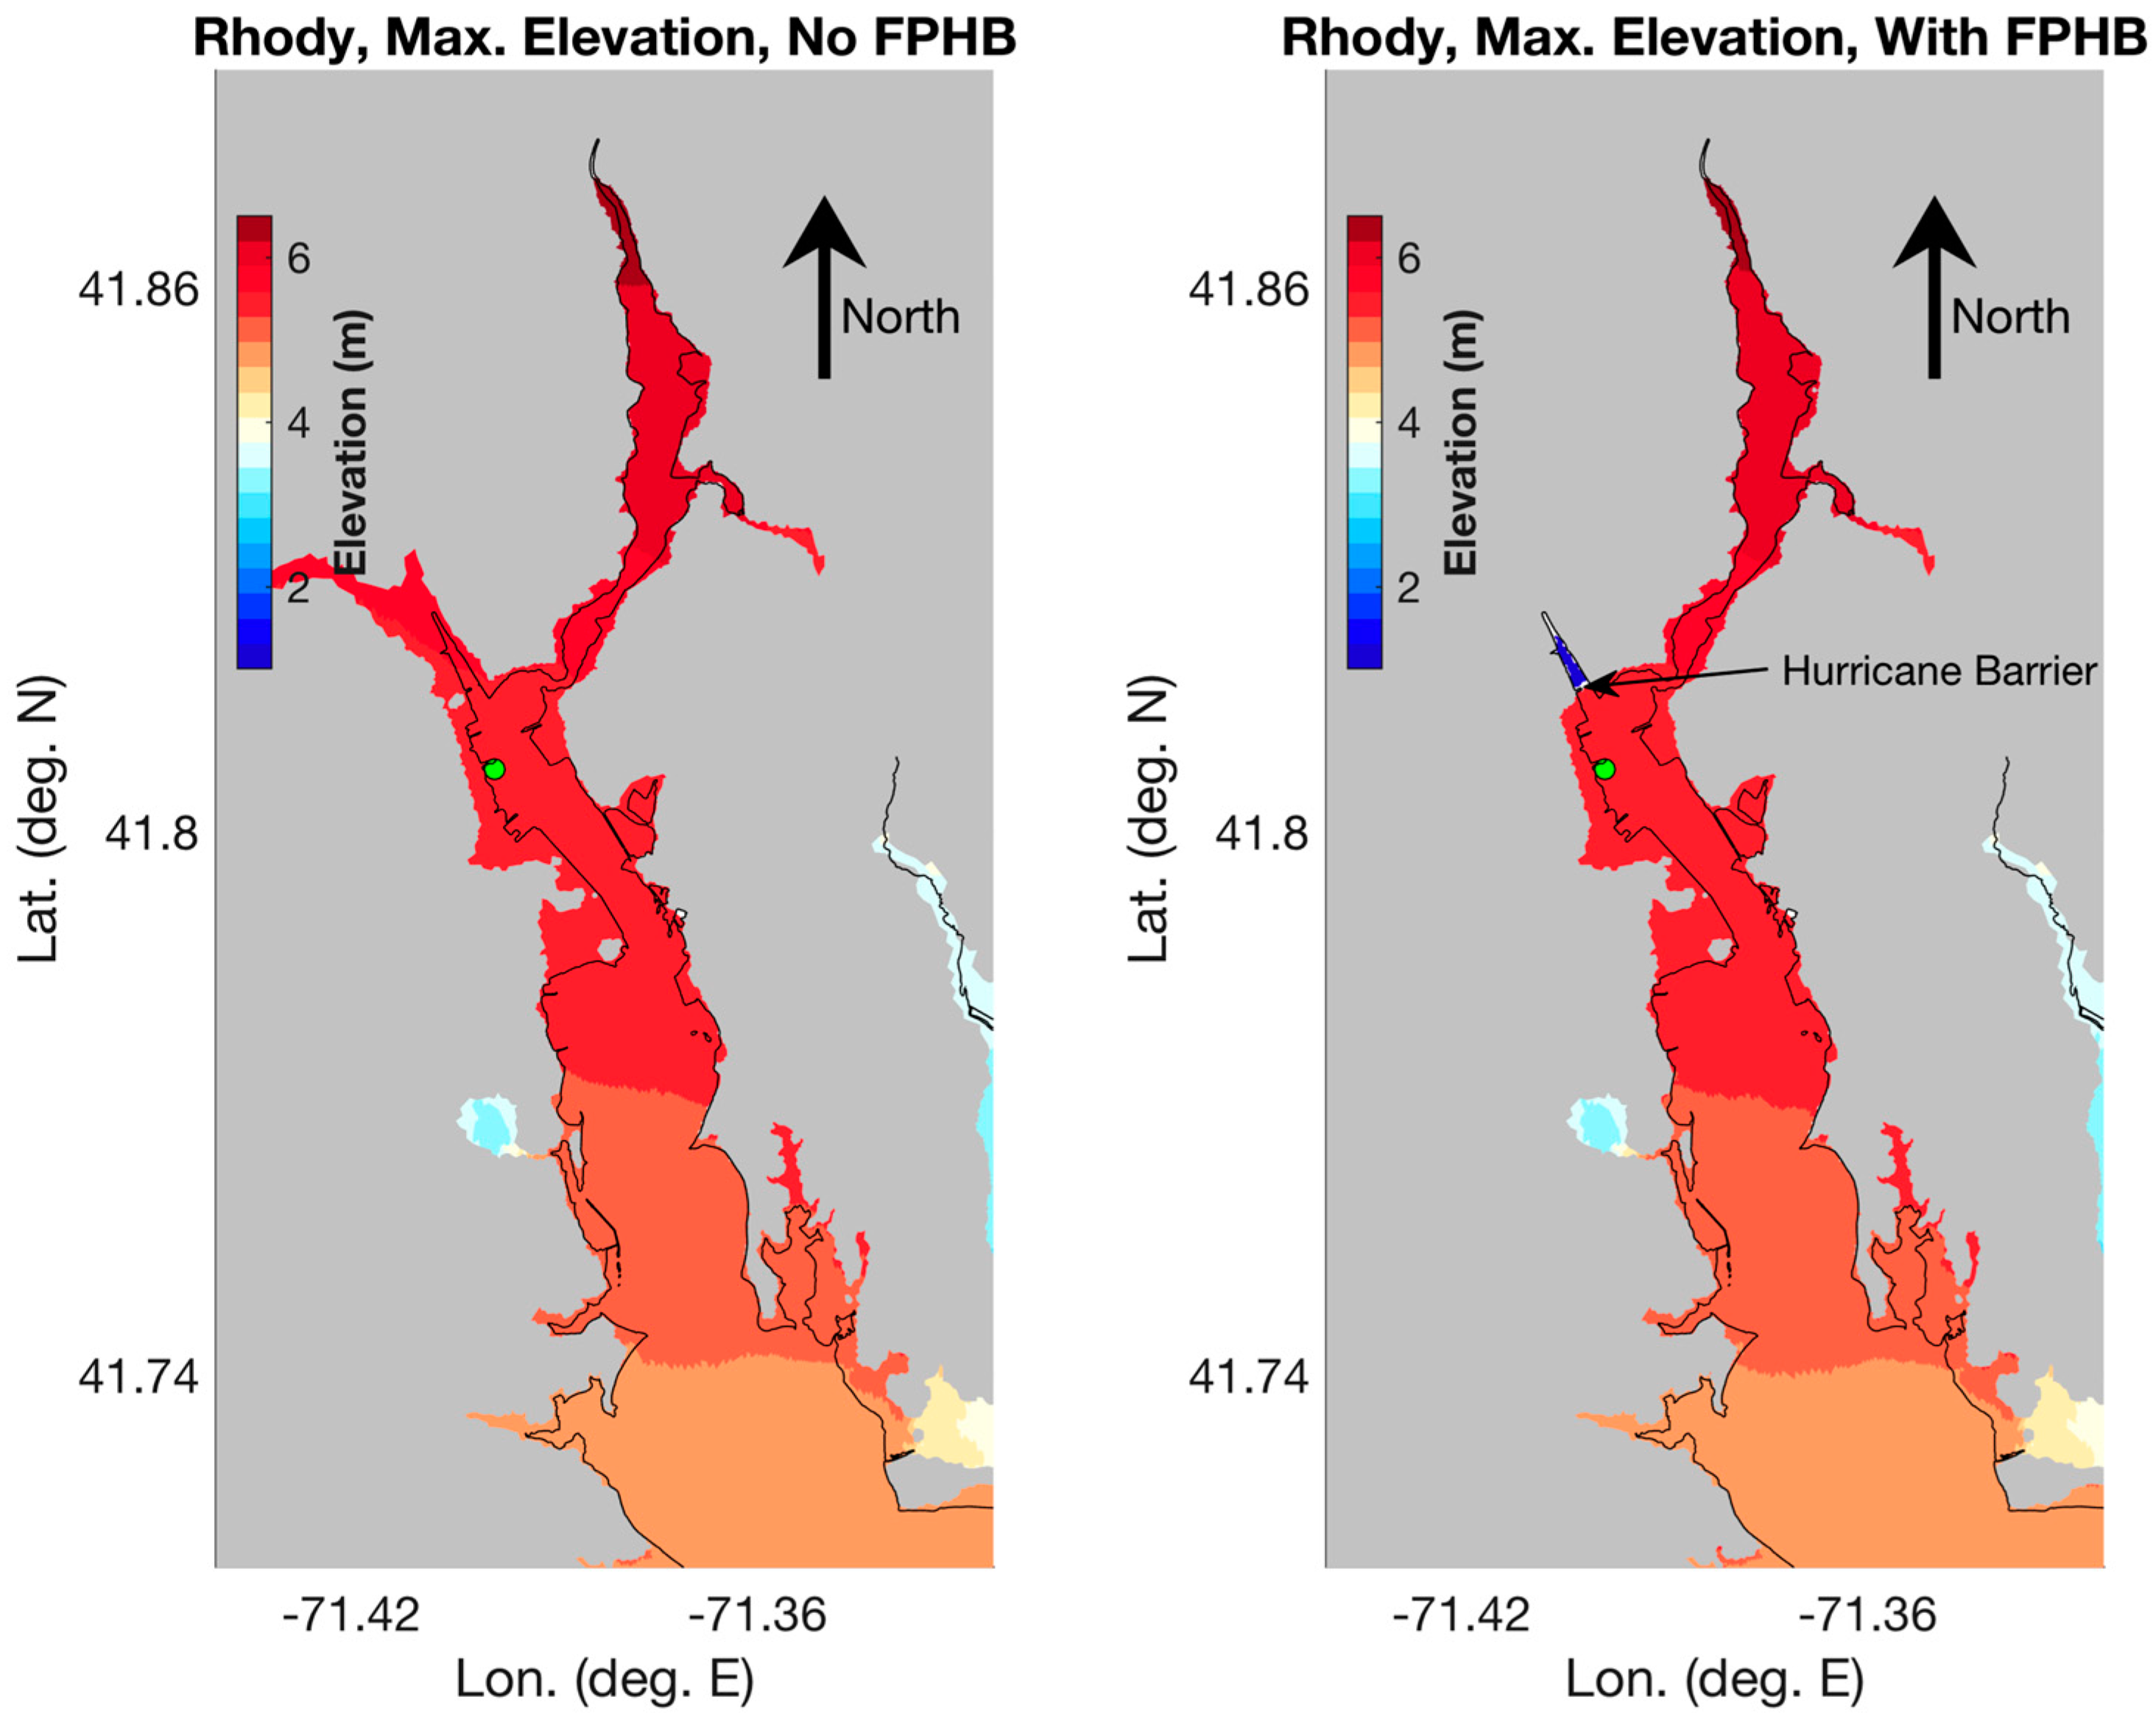
3.2.1. Effect of Hurricane Barrier
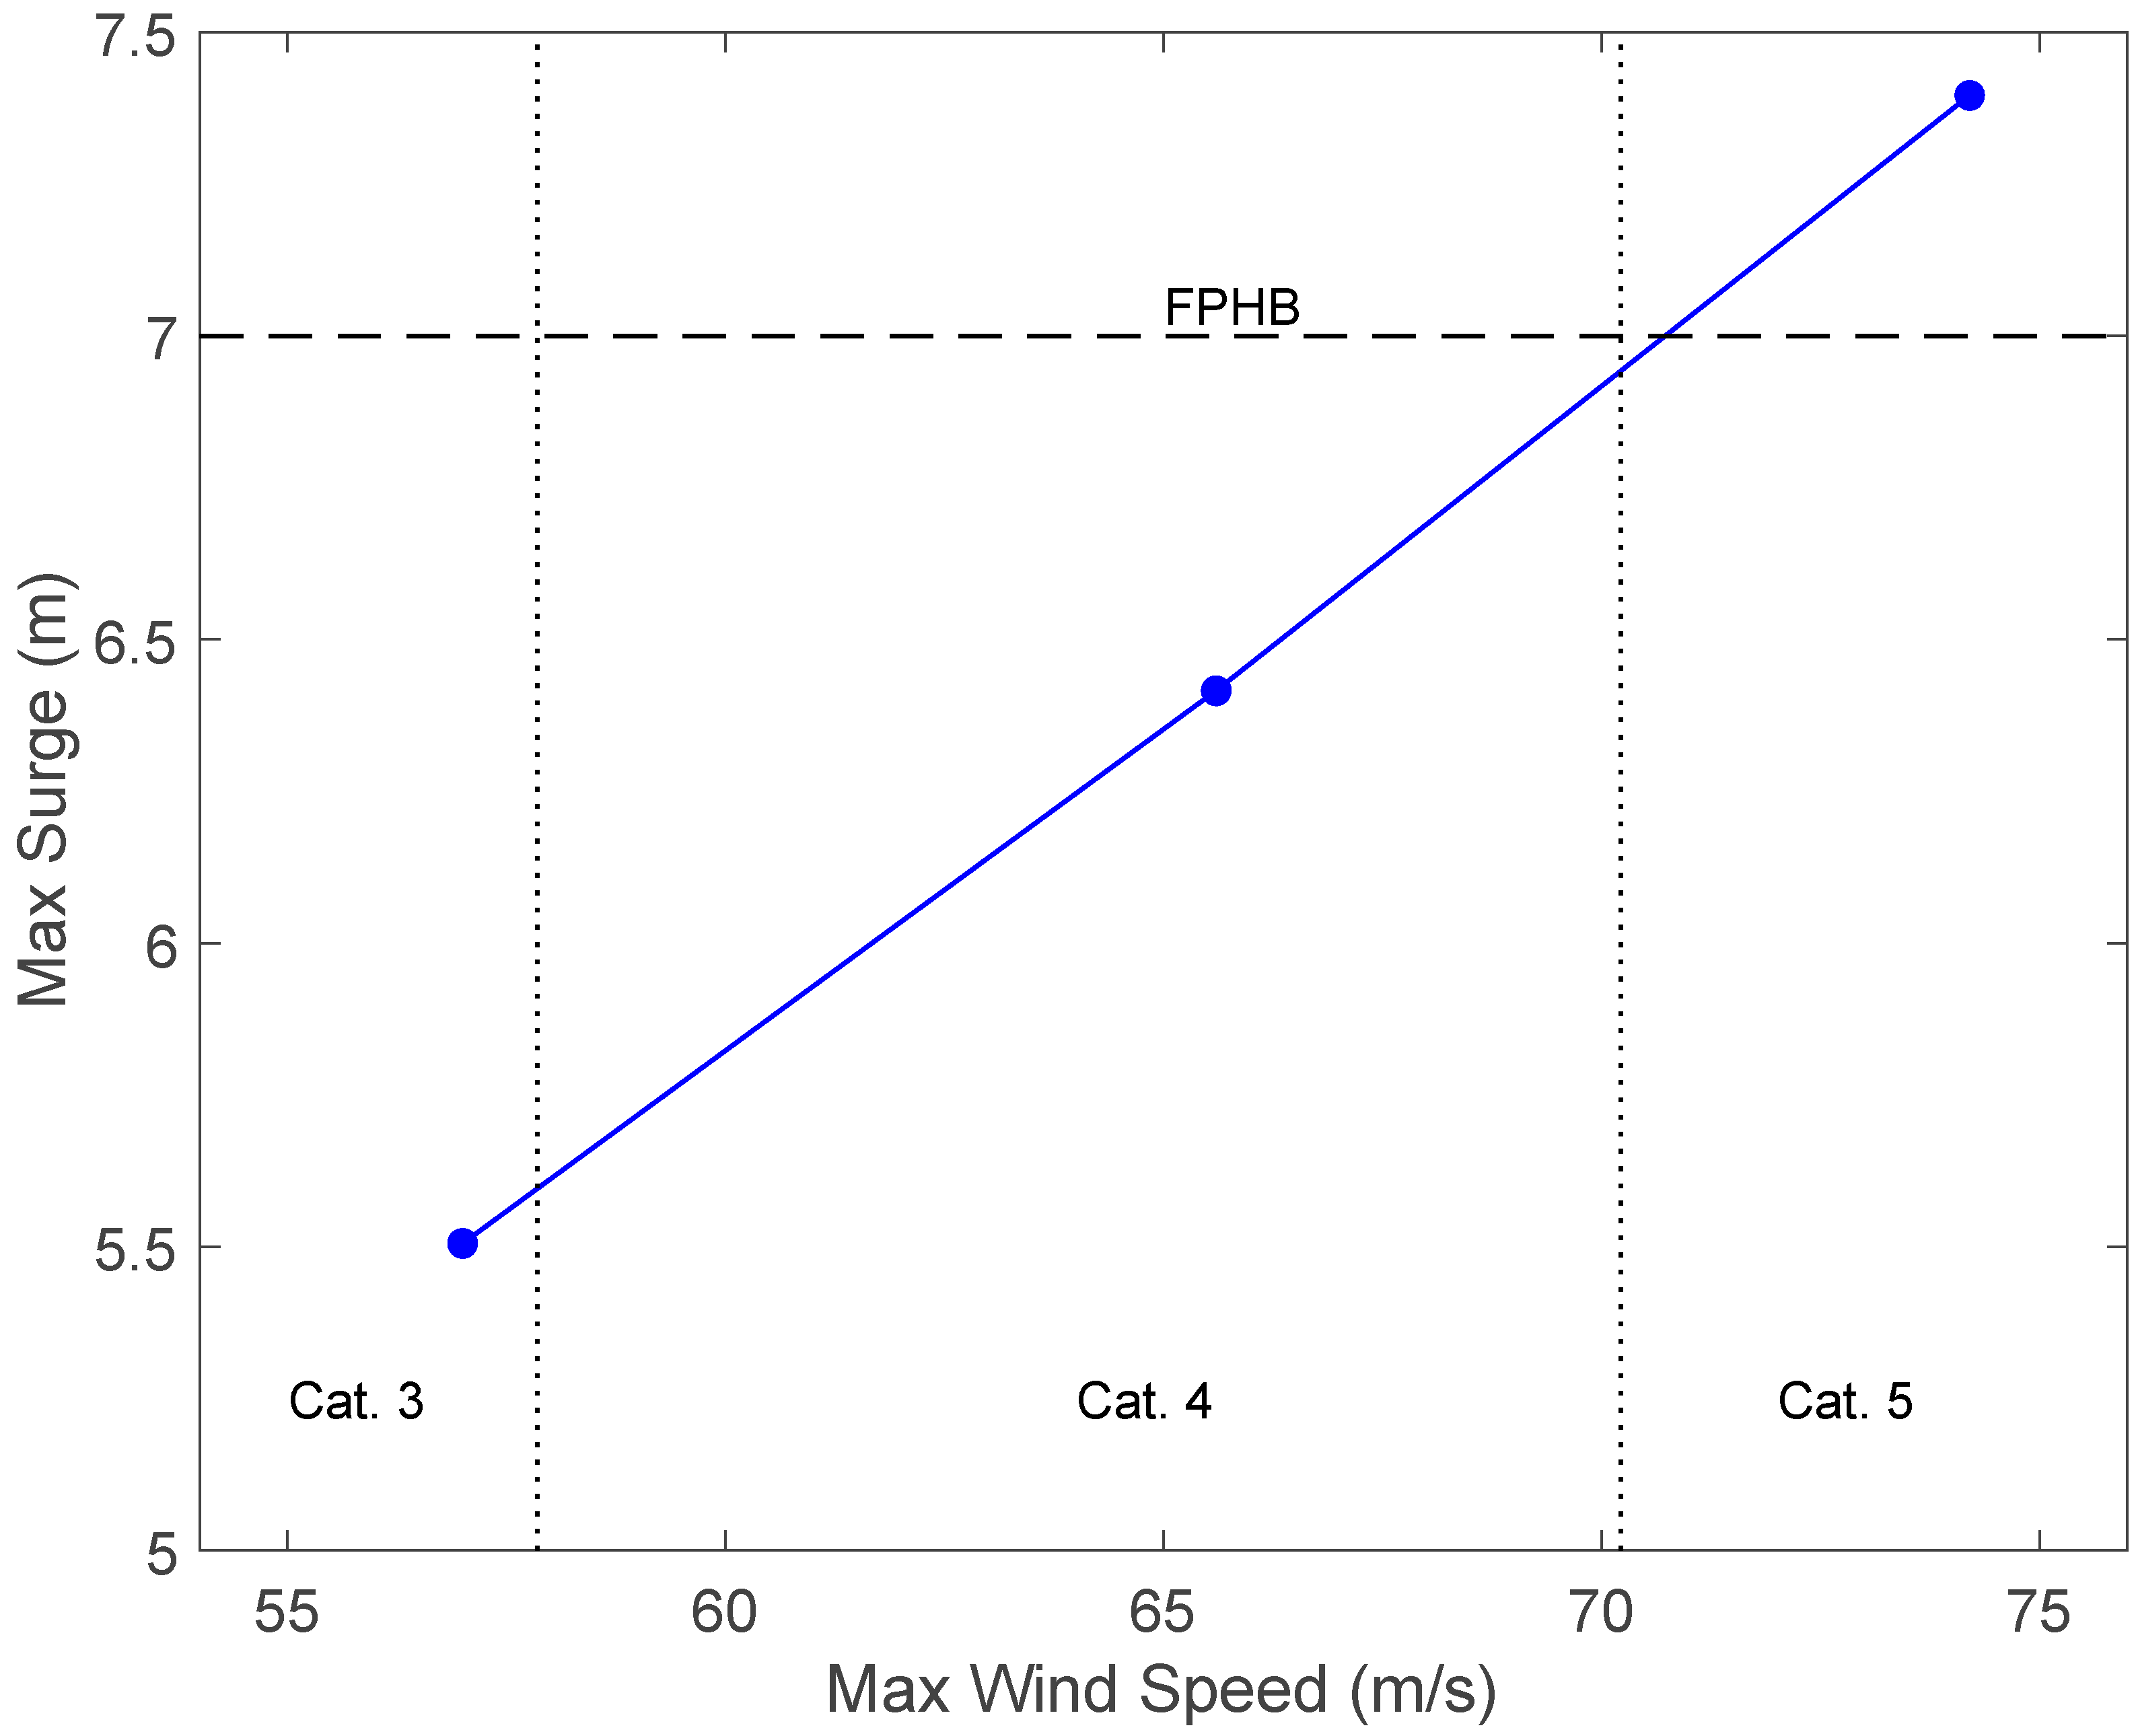
3.2.2. How Robust is the Fox Point Hurricane Barrier?
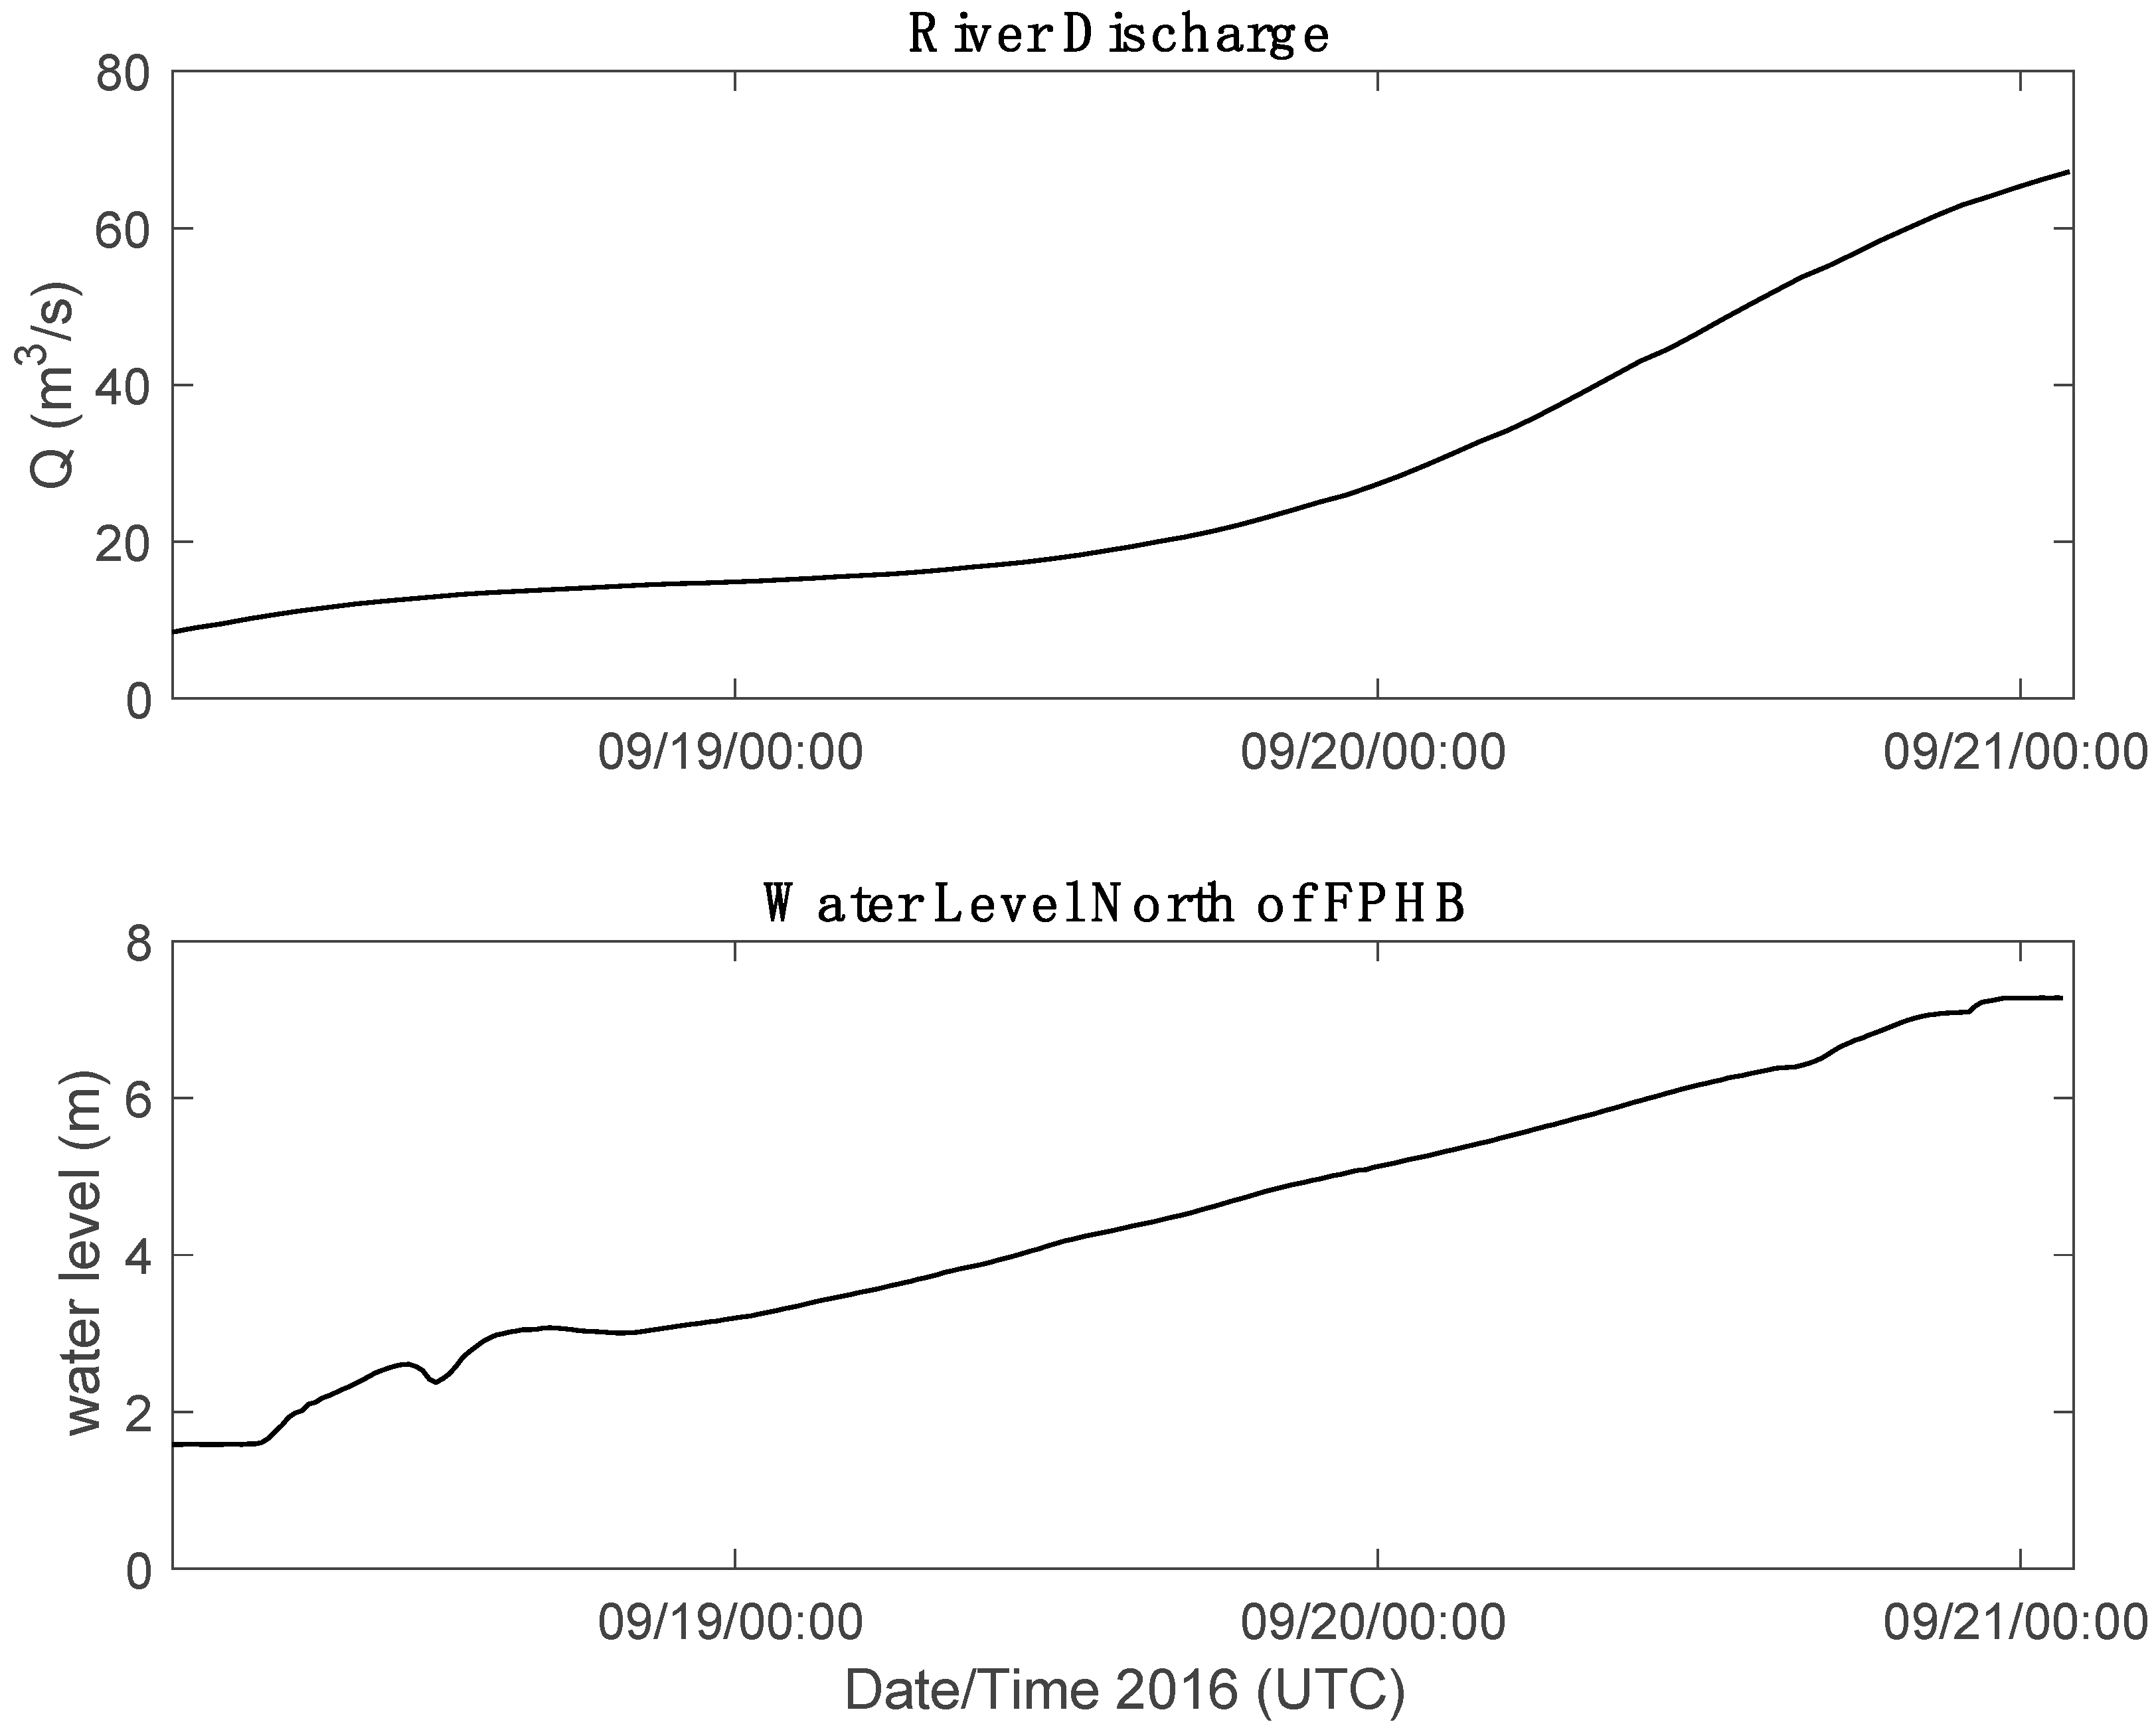
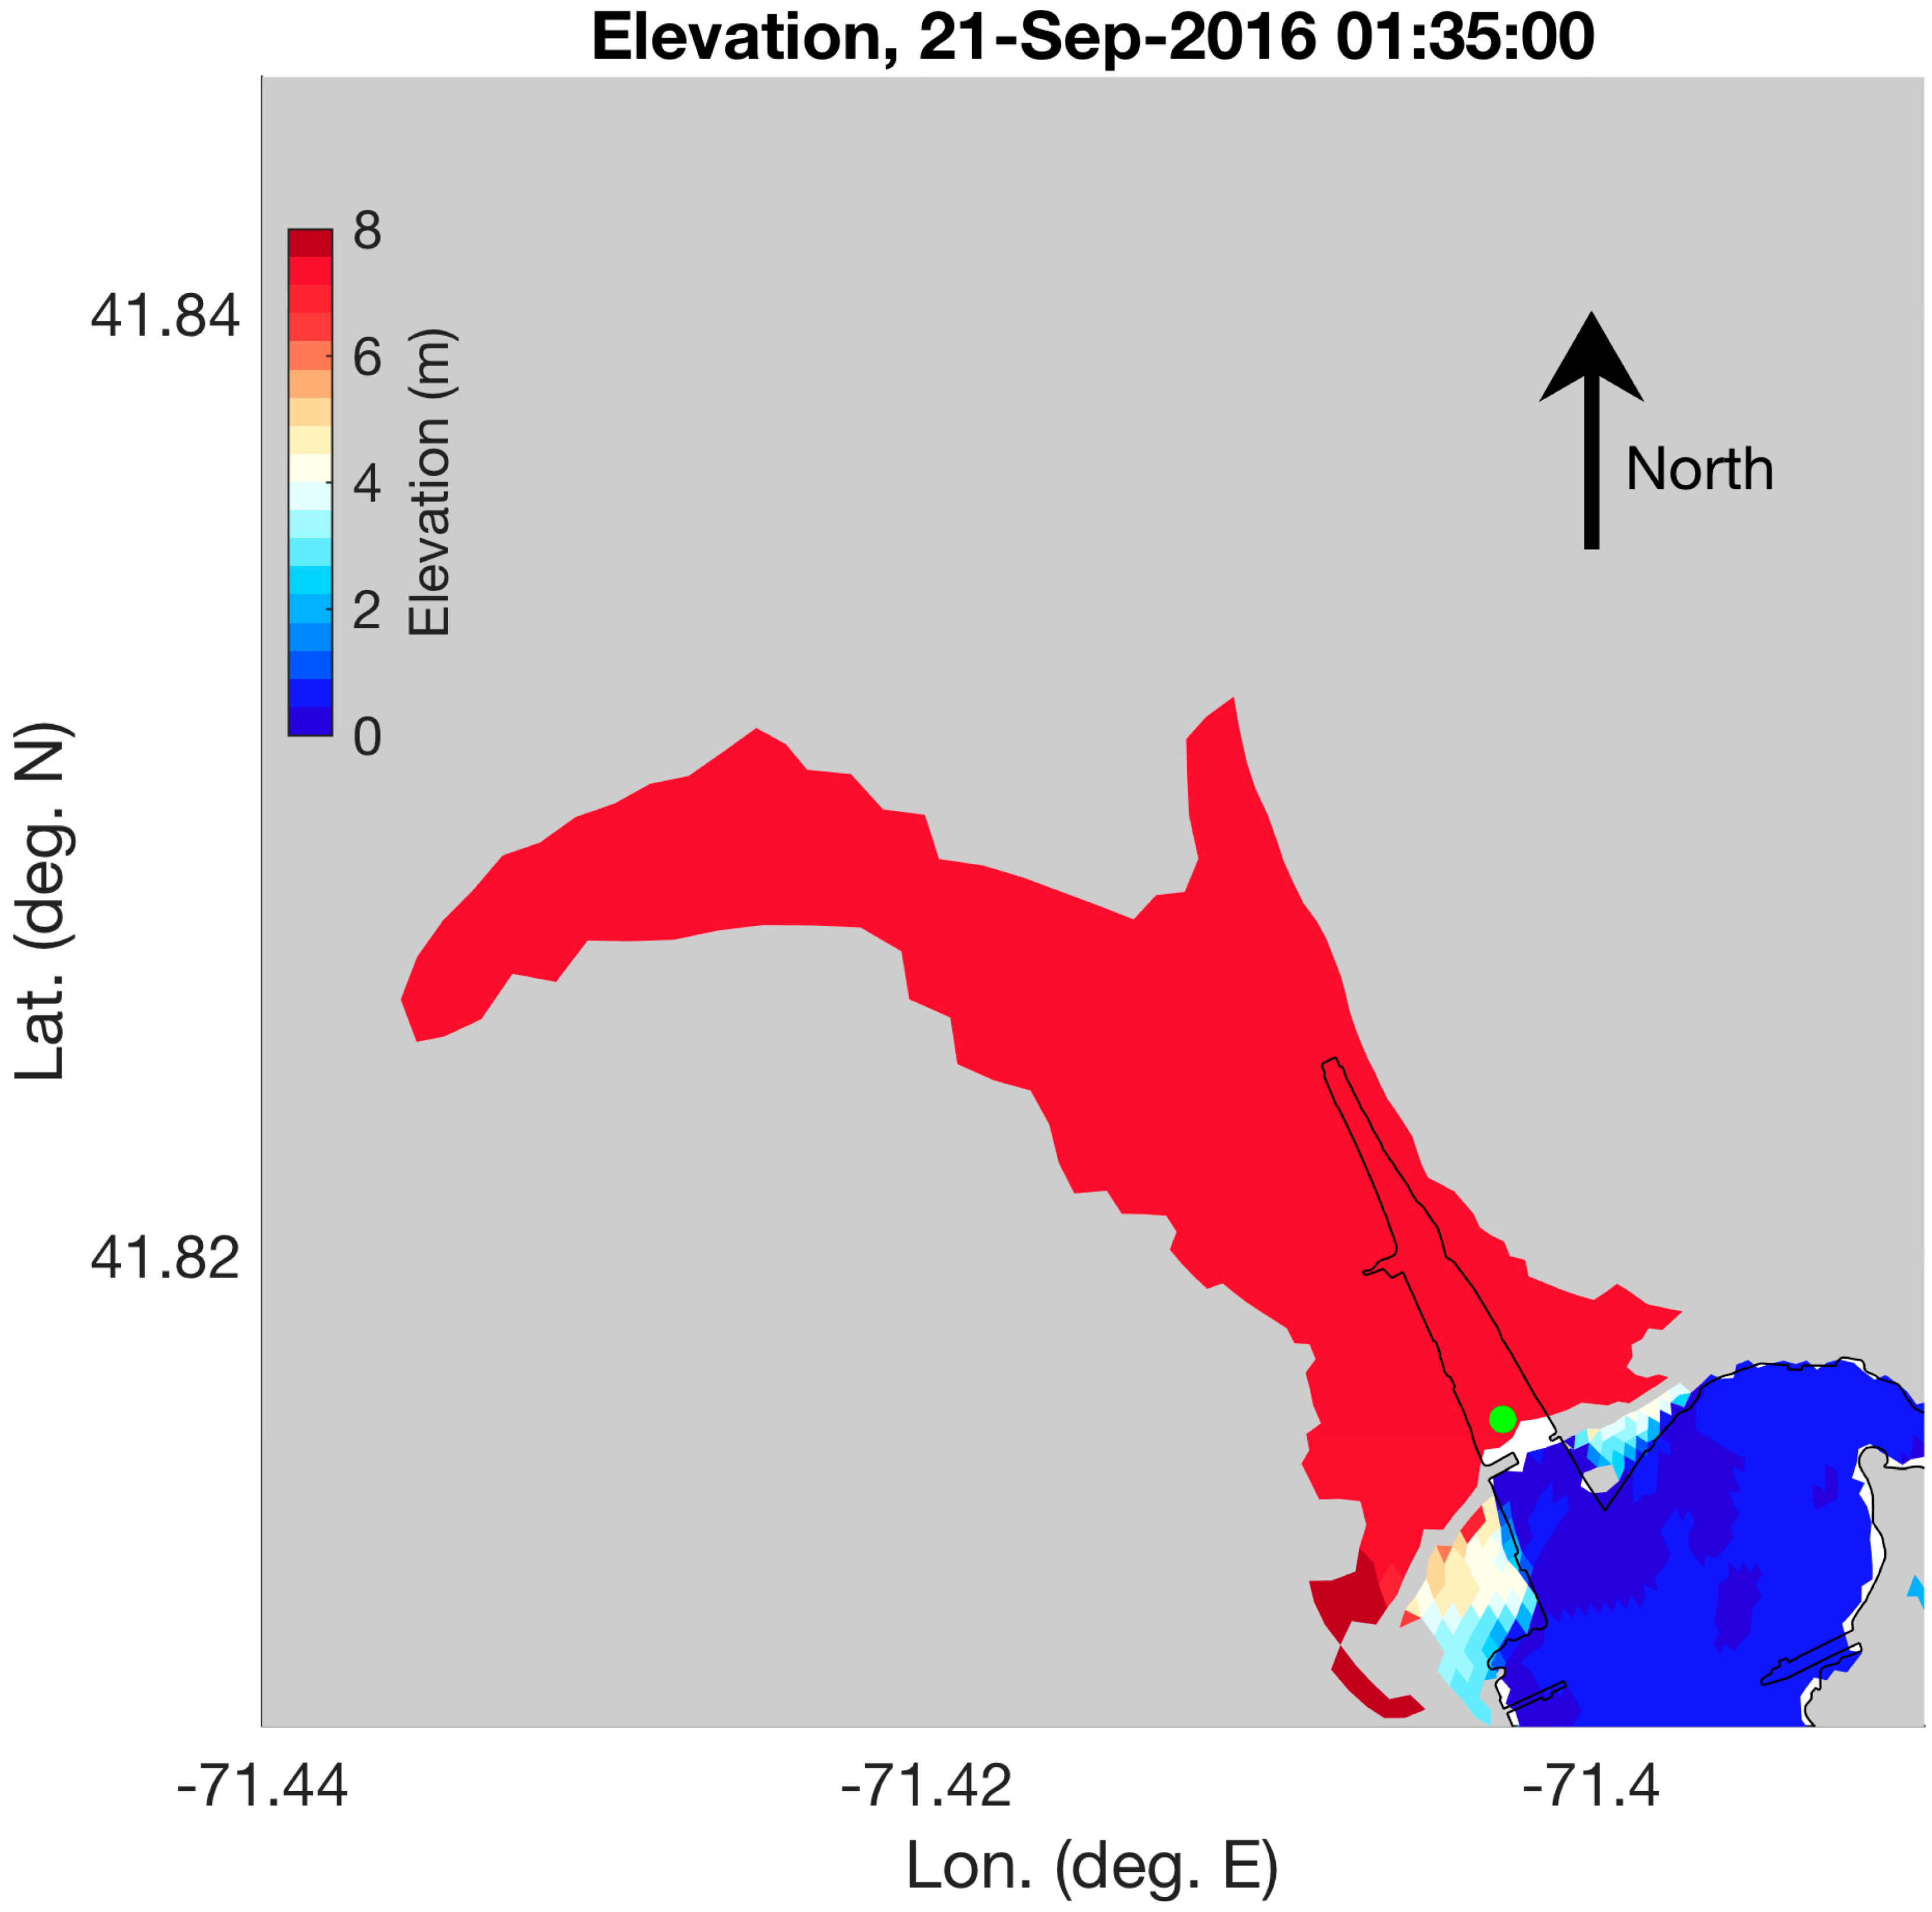
3.2.3. Effect of River Inflow
3.2.4. Utilizing Hurricane Rhody Modeling for Improving Hurricane Preparedness
4. Discussion
5. Conclusions
Author Contributions
Funding
Acknowledgments
Conflicts of Interest
References
- Morang, A. Hurricane Barriers in New England and New Jersey: History and Status after Five Decades. J. Coast. Res. 2016, 32, 181–205. [Google Scholar] [CrossRef]
- Van den Brink, H.W.; de Goederen, S. Recurrence intervals for the closure of the Dutch Maeslant surge barrier. Ocean Sci. 2017, 13, 691–701. [Google Scholar] [CrossRef]
- Cavallaro, L.; Iuppa, C.; Foti, E. EEffect of partial use of Venice flood barriers. J. Mar. Sci. Eng. 2017, 5, 58. [Google Scholar] [CrossRef]
- Norgaard, J.Q.H.; Bentzen, T.R.; Larsen, T.; Andersen, T.L.; Kvejborg, S. Influence of closing storm surge barrier on extreme water levels and water exchange; the Limfjord, Denmark. Coast. Eng. J. 2014, 56, 1–16. [Google Scholar] [CrossRef]
- Van Ledden, M.; Lansen, J.; de Ridder, H.; Edge, B. Reconnaissance level study Mississippi storm surge barrier. Coast. Eng. Proc. 2012, 1. [Google Scholar] [CrossRef]
- Bennett, V.C.C.; Mulligan, R.P.; Hapke, C.J. A numerical model investigation of the impacts of Hurricane Sandy on water level variability in Great South Bay, New York. Cont. Shelf Res. 2018, 161, 1–11. [Google Scholar] [CrossRef]
- Miselis, J.L.; Andrews, B.D.; Nicholson, R.S.; Defne, Z.; Ganju, N.K.; Navoy, A. Evolution of Mid-Atlantic coastal and back-barrier estuary environments in response to a hurricane: Implications for barrier-estuary connectivity. Estuar. Coasts 2016, 39, 916. [Google Scholar] [CrossRef]
- Luettich, R.; Westerink, J., Jr.; Scheffner, N.W. ADCIRC: An Advanced Three-Dimensional Circulation Model for Shelves, Coasts, and Estuaries. Report 1. Theory and Methodology of ADCIRC-2DDI and ADCIRC-3DL; Dredging Research Program Technical Report DRP-92-6; U.S. Army Engineers Waterways Experiment Station: Vicksburg, MS, USA, 1992; 137p. [Google Scholar]
- Booij, N.; Ris, R.; Holthuijsen, L. A third generation wave model for coastal regions. I. model description and validation. J. Geophys. Res. 1999, 104, 7649–7666. [Google Scholar] [CrossRef]
- Dietrich, J.; Zijlema, M.; Westerink, J.; Holthuijsen, L.; Dawson, C.; Luettich, R.A., Jr.; Jensen, R.; Smith, J.; Stelling, G.; Stone, G. Modeling hurricane waves and storm surge using integrally-coupled, scalable computations. Coast. Eng. 2011, 58, 45–65. [Google Scholar] [CrossRef]
- Dietrich, J.C.; Kolar, R.L.; Luettich, R.A. Assessment of ADCIRC’s wetting and drying algorithm. Dev. Water Sci. 2004, 55, 1767–1778. [Google Scholar] [CrossRef]
- Westerink, J.J.; Luettich, R.A.; Feyen, J.C.; Atkinson, J.H.; Dawson, C.; Roberts, H.J.; Powell, M.D.; Dunion, J.P.; Kubatko, E.J.; Pourtaheri, H. A basin-to channel-scale unstructured grid hurricane storm surge model applied to southern Louisiana. Mon. Weather Rev. 2008, 136, 833–864. [Google Scholar] [CrossRef]
- Bunya, S.; Dietrich, J.C.; Westerink, J.J.; Ebersole, B.A.; Smith, J.M.; Atkinson, J.H.; Jensen, R.; Resio, D.T.; Luettich, R.A.; Dawson, C.; et al. A high-resolution coupled riverine flow, tide, wind, wind wave, and storm surge model for southern Louisiana and Mississippi. Part I: Model development and validation. Mon. Weather Rev. 2010, 138, 345–377. [Google Scholar] [CrossRef]
- Kerr, P.C.; Martyr, R.C.; Donahue, A.S.; Hope, M.E.; Westerink, J.J.; Luettich, R.A., Jr.; Kennedy, A.B.; Dietrich, J.C.; Dawson, C.; Westerink, H.J. U.S. IOOS coastal and ocean modeling testbed: Evaluation of tide, wave, and hurricane surge response sensitivities to mesh resolution and friction in the Gulf of Mexico. J. Geophys. Res. 2013, 118, 4633–4661. [Google Scholar] [CrossRef]
- Garratt, J.R. Review of drag coefficients over oceans and continents. Mon. Weather Rev. 1977, 105, 915–929. [Google Scholar] [CrossRef]
- Bryant, K.M.; Akbar, M. An exploration of wind stress calculation techniques in hurricane storm surge modeling. J. Mar. Sci. Eng. 2016, 4, 58. [Google Scholar] [CrossRef]
- Egbert, G.D.; Bennett, A.F.; Foreman, M.G.G. TOPEX/POSEIDON tides estimated using a global inverse model. J. Geophys. Res. 1994, 99, 24821–24852. [Google Scholar] [CrossRef]
- Egbert, G.D.; Erofeeva, S.Y. Efficient inverse modeling of barotropic ocean tides. J. Atmos. Ocean. Technol. 2002, 19, 183–204. [Google Scholar] [CrossRef]
- Henderson, F.M. Open Channel Flow; MacMillan Company: Toronto, ON, Canada, 1966. [Google Scholar]
- Zijlema, M. Computation of wind-wave spectra in coastal waters with SWAN on unstructured grids. Coast. Eng. 2009, 57, 267–277. [Google Scholar] [CrossRef]
- Hope, M.E.; Westerink, J.J.; Kennedy, A.B.; Kerr, P.C.; Dietrich, J.C.; Dawson, C.; Bender, C.J.; Smith, J.M.; Jensen, R.E.; Zijlema, M.; et al. Hindcast and validation of Hurricane Ike (2008) waves, forerunner, and storm surge. J. Geophys. Res. 2013, 118, 4424–4460. [Google Scholar] [CrossRef]
- Rogers, W.E.; Hwang, P.A.; Wang, D.W. Investigation of wave growth and decay in the SWAN model: Three regional-scale applications. J. Phys. Oceanogr. 2003, 33, 366–389. [Google Scholar] [CrossRef]
- Komen, G.J.; Hasselmann, S.; Hasselmann, K. On the existence of a fully developed wind-sea spectrum. J. Phys. Oceanogr. 1984, 14, 1271–1285. [Google Scholar] [CrossRef]
- Madsen, O.S.; Poon, Y.-K.; Graber, H.C. Spectral wave attenuation by bottom friction: Theory. Coast. Eng. 1988, 1988, 492–504. [Google Scholar] [CrossRef]
- Dietrich, J.C.; Westerink, J.J.; Kennedy, A.B.; Smith, J.M.; Jensen, R.E.; Zijlema, M.; Holthuijsen, L.H.; Dawson, C.; Luettich, R.A.; Powell, M.D.; et al. Hurricane Gustav (2008) waves and storm surge: Hindcast, synoptic analysis, and validation in southern Louisiana. Mon. Weather Rev. 2011, 139, 2488–2522. [Google Scholar] [CrossRef]
- Battjes, J.A.; Janssen, J.P.F.M. Energy loss and set-up due to breaking of random waves. Coast. Eng. 1978, 1978, 569–587. [Google Scholar]
- Markstrom, S.L.; Regan, R.S.; Hay, L.E.; Viger, R.J.; Webb, R.M.T.; Payn, R.A.; LaFontaine, J.H. PRMS-IV, the Precipitation-Runoff Modeling System, Version 4; U.S. Geological Survey Techniques and Methods: Reston, VA, USA, 2015; Book 6, Chap B7; 158p. Available online: https://pubs.usgs.gov/tm/6b7/ (accessed on 2 November 2017).
- Teng, F.; Huang, W.; Ginis, I. Hydrological modeling of storm-induced runoff and snowmelt in Taunton River Basin. J. Nat. Hazards 2018, 91, 179–199. [Google Scholar] [CrossRef]
- Teng, F.; Huang, W.; Ginis, I.; Cai, Y. Characteristics of River Flood and Storm Surge Interactions in a Tidal River in Rhode Island, USA. Procedia IUTAM 2017, 25, 60–64. [Google Scholar] [CrossRef]
- Gao, K.; Ginis, I. On the equilibrium-state roll vortices and their effects in the hurricane boundary layer. J. Atmos. Sci. 2016, 73, 1205–1221. [Google Scholar] [CrossRef]
- Zhang, J.A.; Drennan, W.M. An observational study of vertical eddy diffusivity in the hurricane boundary layer. J. Atmos. Sci. 2012, 69, 3223–3236. [Google Scholar] [CrossRef]
- Blackadar, A.K. The vertical distribution of wind and turbulent exchange in a neutral atmosphere. J. Geophys. Res. 1962, 67, 3095–3102. [Google Scholar] [CrossRef]
- Moon, I.-J.; Ginis, I.; Hara, T.; Thomas, B. A physics-based parameterization of air-sea momentum flux at high wind speeds and its impact on hurricane intensity predictions. Mon. Weather Rev. 2007, 135, 2869–2878. [Google Scholar] [CrossRef]
- Trahan, S.; Sparling, L. An analysis of NCEP tropical cyclone vitals and potential effects on forecasting models. Weather Forecast. 2012, 27, 744–756. [Google Scholar] [CrossRef]
- Yablonsky, R.M.; Ginis, I.; Thomas, B.; Tallapragada, V.; Sheinin, D.; Bernardet, L. Description and analysis of the ocean component of NOAA’s operational Hurricane Weather Research and Forecasting (HWRF) Model. J. Atmos. Oceanic Technol. 2015, 32, 144–163. [Google Scholar] [CrossRef]
- Tuleya, R.E.; DeMaria, M.; Kuligowski, R.J. Evaluation of GFDL and simple statistical model rainfall forecasts for U. S. landfalling tropical storms. Weather Forecast. 2007, 22, 56–70. [Google Scholar] [CrossRef]
- Vallee, D.R. Rhode Island Hurricanes and Tropical Storms, a Fifty-Six Year Summary, 1936–1991; NOAA Technical Memorandum NWS ER-86; National Weather Service Office: Providence, RI, USA, 1993; 62p. [Google Scholar]
- Harris, D.L. Characteristics of the Hurricane Storm Surge; No. 48; United States Weather Bureau Technical Paper: Washington, DC, USA, 1963; 139p. [Google Scholar]
- Kennedy, A.B.; Gravois, U.; Zachry, B.C.; Westerink, J.J.; Hope, M.E.; Dietrich, J.C.; Powell, M.D.; Cox, A.T.; Luettich, R.A., Jr.; Dean, R.G. Origin of the Hurricane Ike forerunner surge. Geophys. Res. Lett. 2011, 38, L08608. [Google Scholar] [CrossRef]
- Houghton, R.W.; Schlitz, R.; Beardsley, R.C.; Butman, B.; Chamberlin, J.L. The Middle Atlantic Bight cold pool: Evolution of the temperature structure during summer 1979. J. Phys. Oceanogr. 1982, 12, 1019–1029. [Google Scholar] [CrossRef]
- Glenn, S.M.; Miles, T.N.; Seroka, G.N.; Xu, Y.; Forney, R.K.; Yu, F.; Roarty, H.; Schofield, O.; Kohut, J. Stratified coastal ocean interactions with tropical cyclones. Nat. Commun. 2016, 7, 1–10. [Google Scholar] [CrossRef] [PubMed]


© 2019 by the authors. Licensee MDPI, Basel, Switzerland. This article is an open access article distributed under the terms and conditions of the Creative Commons Attribution (CC BY) license (http://creativecommons.org/licenses/by/4.0/).
Share and Cite
Ullman, D.S.; Ginis, I.; Huang, W.; Nowakowski, C.; Chen, X.; Stempel, P. Assessing the Multiple Impacts of Extreme Hurricanes in Southern New England, USA. Geosciences 2019, 9, 265. https://doi.org/10.3390/geosciences9060265
Ullman DS, Ginis I, Huang W, Nowakowski C, Chen X, Stempel P. Assessing the Multiple Impacts of Extreme Hurricanes in Southern New England, USA. Geosciences. 2019; 9(6):265. https://doi.org/10.3390/geosciences9060265
Chicago/Turabian StyleUllman, David S., Isaac Ginis, Wenrui Huang, Catherine Nowakowski, Xuanyu Chen, and Peter Stempel. 2019. "Assessing the Multiple Impacts of Extreme Hurricanes in Southern New England, USA" Geosciences 9, no. 6: 265. https://doi.org/10.3390/geosciences9060265
APA StyleUllman, D. S., Ginis, I., Huang, W., Nowakowski, C., Chen, X., & Stempel, P. (2019). Assessing the Multiple Impacts of Extreme Hurricanes in Southern New England, USA. Geosciences, 9(6), 265. https://doi.org/10.3390/geosciences9060265