Abstract
Local scour is a dynamic process evolving during the lifetime of bridges as a result of the changes in hydrologic and hydraulic conditions. Current approaches for scour risk assessment are generally based on the evaluation of the equilibrium scour depth for a flood event with a prefixed return period. The temporal evolution of the bridge-pier scour process is usually disregarded, by assuming that equilibrium conditions are always attained, regardless of the flood properties. However, recent studies have highlighted the importance of accounting for the contribution of multiple flood events and their exact hydrograph shape. This study aims at quantifying the epistemic uncertainty related to the modelling of the temporal evolution of scour under multiple consecutive flood events in clear-water conditions. A simple numerical case study is considered, using a Markovian framework to describe probabilistically the progression of scour. Well-known time-dependent scour models are used to estimate the temporal evolution of the scour-depth under each flood hydrograph, and the scour estimates are compared with those obtained using widely employed equilibrium scour formulas. Results show that the expected scour depth is influenced by the parameters used to describe the flood hydrograph and that the probability distribution of the scour depth is highly sensitive to the choice of the time-dependent scour model. The uncertainty in the scour estimation stemming from the formula adopted in this study for describing the temporal evolution of the scour depth can be higher than those related to the formula adopted for equilibrium scour.
1. Introduction
Scour is among the leading causes of bridge collapse over the globe [1,2,3,4,5,6,7], and the assessment of bridge scour hazard is of paramount importance for transport agencies in charge of bridge hydraulic risk assessment, management, and mitigation. Current scour risk assessment procedures are mostly deterministic and based on the evaluation of the final scour depth [8,9,10], produced by a single flood event characterised by a fixed return period, whose value differs from code to code. Equilibrium scour formulas are usually employed, by assuming that peak river discharge acts over a theoretical infinite duration [8,9,11,12,13]. This is a very strong assumption, often leading to biased estimates of the scour at a bridge site. In fact, flood events do not always manifest with the same hydraulic conditions, and peak discharge, hydrograph shape and duration are expected to change from flood to flood.
Short duration floods may not lead to the development of the equilibrium scour depth, but they may cause only partial erosion. Thus, the scour depth at a bridge pier may be the result of the action of a sequence of multiple floods, with different intensity and hydrograph shape, acting during the bridge lifetime. This is the case for floods of minor intensity, inducing clear-water conditions, such that no refilling of the scour hole occurs. Under these conditions, the scour depth can only monotonously increase. On the other hand, under extreme flood events, live-bed and suspension of sediment take place, resulting in the possibility of refilling mechanisms of the scour hole. Consequently, the scour depth at a bridge pier may increase or even decrease during each event [14]. Nevertheless, the prediction of the scour depth at underwater bridge foundations should be carried out by employing probabilistic approaches, given the random nature of the variables affecting the hydrologic and hydraulic properties of river flow [15,16,17,18].
The importance of employing non-deterministic approaches for evaluating the scour depth at bridge foundations has been acknowledged since the early studies of Barbe et al. [19] and Johnson [20]. Probabilistic methodologies have been developed during the years to incorporate the effect of the many uncertainties relevant to the phenomena [19,21,22,23,24,25,26]. In this regard, major focus has been on those characterising the parameters associated with the hydraulic/hydrological conditions (e.g., discharge, flow depth, and flow velocity) and the epistemic uncertainties affecting the scour predictions in the scour depth evaluation [27].
Few probabilistic frameworks have been proposed to describe the stochastic evolution of the scour depth at a pier under multiple flood events. Johnson et al. [20] presented a method for estimating the probability of bridge failure due to pier-scour, explicitly considering the bridge lifetime. This approach made possible the consideration of the short- and long-term progression of the time-dependent scour depth. Hydrologic input was performed through a Poisson process and exponential distribution for the numbers of generated events and their magnitude, respectively. Brandimarte et al. [21] and Briaud et al. [1] developed a probabilistic framework for the scour temporal evolution based on Monte Carlo replicates of discharge regimes for the service life of the bridge. The fractional integrated autoregressive moving average (ARFIMA) process was fitted to the historic streamflow record and used to generate synthetic hydrologic time-series with the same statistical properties as the observed ones. Recently, Tubaldi et al. [28] developed a Markovian framework for describing the probabilistic evolution of clear water scour at bridge piers accounting for memory effects. According to the Markovian process assumption, the change of the scour depth during one flood event depends on the scour depth reached before the occurrence of the event itself, rather than on the entire hydrologic and scour history. The application of these probabilistic frameworks requires, in general, the use of a model for describing the temporal evolution of scour. Brandimarte et al. [21] and Briaud et al. [1] used the Scour Rate In COhesive Soils (SRICOS) model to calculate the scour depth associated with each streamflow synthetic simulation. This model has been developed specifically for cohesive soils. Many other models have been established for non-cohesive soils; for instance, the models developed by Oliveto and Hager [29], Hager and Unger [30], Melville and Chiew [31], Link et al. [32], and Pizarro et al. [33]. Remarkably, Link et al.’s [32] and Pizarro et al.’s [33] models make use of the dimensionless effective flow work (W*) [34] as their core, and they, therefore, are not constrained to steady hydraulic conditions.
This paper aims to evaluate the effect of several sources of epistemic uncertainty relevant to the prediction of the progression of clear-water scour under multiple flood events, namely i) the one related to the flood hydrograph shape, ii) the one related to the equilibrium scour depth, iii) the one related to the description of the temporal evolution of scour. For this purpose, a simplified numerical case study is considered to quantify the epistemic uncertainty under controlled conditions. The numerical case study consists of a simple-geometry bridge with one submerged cylindrical pier. The occurrence of floods is modelled through a homogeneous Poisson process. The flood peaks are assumed to follow an exponential distribution and the flood hydrographs are assumed to be single-peaked flood waves with an exponential shape. The effects of the epistemic uncertainties are quantified by evaluating the probabilistic distribution of scour, obtained by considering different models for the temporal evolution of scour and different parameters values for the hydrograph shape, as well as different formulas for equilibrium scour. A comparison is also made between the estimates of the scour depth after 100 years and at equilibrium.
The rest of the paper is organised as follows: Section 2 presents the proposed framework for describing the probabilistic evolution of scour under clear-water conditions, and its steps, namely hydrologic, hydraulic, and scour analysis; Section 3 illustrates the case study and the application of the framework; Section 4 analyses the influence of the choice of the hydrograph shape and time-dependent scour model on the scour progression throughout the years, while Section 5 provides a comparison with the scour estimates obtained with well-established equilibrium equations.
2. Probabilistic Framework for Scour Progression
2.1. Markov Process for Describing Scour Progression
The scour progression process under clear-water conditions is modelled via a discrete-time and discrete-state Markovian process, originally developed in Tubaldi et al. [28]. The Markovian assumption essentially implies that the change (increment) of the scour depth during a certain flood event depends on the scour depth reached when the flood occurs, rather than on the entire hydrologic and scour history. Therefore, the probability to be in the scour level j, given the k-th flood event occurrence, can be expressed as follows:
where denotes the probability to be in the scour level j at the end of the considered flood event, given the initial state i at the beginning. denotes the probability to be in the scour level i, given the k−1 flood event occurrence, i.e., the probability that the scour state is i at the beginning of the k-th flood occurrence.
Assuming a time-homogeneous Markov process, Equation (1) leads to:
where is the conditional probability of having a scour depth given floods, starting from the initial state . The transition operator containing the various is the result of the hydrologic, hydraulic, and scour analyses, which are briefly described in the next subsections.
Once the transition operator is known, it is possible to compute the unconditional probability of having a scour depth through the following equation:
where represents the probability of having n floods in t years, which is controlled by the occurrence rate of the floods. Further details about the framework can be found in Tubaldi et al. [28].
2.2. Hydrologic and Hydraulic Analysis
The hydrologic analysis aims to describe the magnitude of future floods and their occurrence rate. For modelling purposes, the rate of occurrence of floods with discharge Q exceeding a minimum threshold q0 can be represented by an independent and stationary increment process, i.e., a homogeneous Poisson process. A probability distribution must be specified for the flood magnitudes. For example, these can be modelled assuming an exponential distribution.
The hydraulic analysis allows evaluating the flow properties at the bridge site, given the hydrological properties of the flood. The Gauckler-Manning-Strickler formula can be considered for the analysis under the simplified assumption of uniform flow conditions [35]:
where is the flood discharge at peak conditions (m3/s), is the Manning’s roughness coefficient (s/m1/3), is the hydraulic radius (m), is the bed slope (m/m), and the cross-section area (m2).
Since the temporal evolution of scour is of interest, account must be made of the hydrograph shape. This shape is usually not known a priori and depends on a series of factors, the most important of which are rainfall, antecedent soil moisture, and other catchment processes [36,37]. Although different models exist for describing the hydrograph shape, in this study an exponential function is considered, following the approximation of single-peaked flood waves proposed by Hager and Unger [30]:
where Q is the discharge (m3/s), t is the time (s), is time to peak of the flood hydrograph (s), and is the hydrograph shape parameter. Figure 1 shows the influence of the hydrograph shape parameter k, for k = 2, 5, 10, and 50. and assuming (hours).

Figure 1.
Equation (5) for different values of k (= 2, 5, 10, 50). Peak discharge 200 (m3/s) and time to peak 30 (hours).
2.3. Scour Analysis
Different time-dependent scour models have been proposed in the literature to describe the temporal evolution of scour. In this study, only three of them are considered, namely the Melville and Chiew [31], the Hager and Unger [30], and the Pizarro et al. [33] models. The first two models are among the most widely known and employed, and they rely on the representation of the hydrograph as a sequence of steady discharge steps [38,39]. The model of Melville and Chiew’s [31] depends on flow characteristics such as mean flow velocity (u) and flow depth (h), and the sediment coarseness defined as the ratio between the pier diameter (D) and the sediment size (d50). The model developed by Hager and Unger [30] extended the Oliveto and Hager [29]’s equation, for the temporal scour evolution under steady hydraulic conditions, in order to account for more realistic flood hydrograph shapes. According to them, the final scour depth after the hydrograph essentially depends on the peak flow velocity. Pizarro et al. [33]’s model is also considered in this study because it is among the first ones allowing evaluation of the temporal evolution of scour under complex flood scenarios, without requiring the assumption of the hydrograph as a sequence of steady discharge steps. It relies on the concepts of effective flow work parameter W* [34] and on the principle of maximum entropy.
The estimates of the scour depths at different times are also compared with the values of the scour depth obtained by using equilibrium scour formulas and a peak of flood event corresponding to a return period of 100 years. In particular, five different formulas are considered, as proposed by Froehlich [40], Melville [41], Sheppard et al. [42], Richardson and Davis [10], and Gao et al. [43]. These equilibrium-scour formulas have been selected for their widespread use worldwide and also because they rank as the best scour equations in Sheppard et al. [44]. For instance, the HEC-18 and FDOT equations (Richardson and Davis [10] and Sheppard et al. [42], respectively) are widely used in the USA, whereas the equation proposed by Gao et al. [43] is very diffused in China.
Table 1 presents the time-dependent scour formulas, while Table 2 the equilibrium-scour prediction formulas considered for benchmarking analyses.

Table 1.
Time-dependent scour prediction formulas.

Table 2.
Equilibrium-scour prediction formulas considered for benchmarking analyses.
3. Case Study
A simplified numerical case study is considered to evaluate how the choice of the formula for the temporal evolution of scour affects the bridge scour predictions. This case study consists of a two-span bridge with one submerged pier. The bridge-pier shape is cylindrical with a diameter of 1.5 (m) and the river cross-section with an average width of 22 (m). The channel slope is assumed having a value of 0.0001 (m/m), and the riverbed is considered as uniform sand with a grain-size diameter of 2.0 (mm). Therefore, the corresponding Manning coefficient value is . Figure 2 shows a sketch of the numerical case study considered for scour analysis.
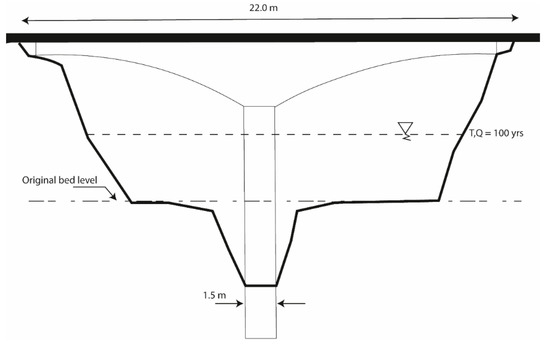
Figure 2.
Illustration of the numerical case study considered for scour analyses. Image not to scale. Dashed lines indicate (i) water-level related to a discharge with a return period of 100 years, and (ii) the original bed level.
The mean annual frequency of flood events occurrence is set to for , while the river discharge at peak conditions is modelled following an exponential distribution with scale parameter The simulated flow discharge values always ensure clear-water conditions in terms of scour. Five different hydrograph shape parameters are considered within the probabilistic framework (k = 2, 5, 10, 25, 50). Monte Carlo simulations, with a set of samples of , are carried out to estimate the transition probability matrix. Figure 3A presents the probability mass function of the number of flood occurrences with , while Figure 3B the empirical cumulative probability function of peak discharges for flood events with a magnitude .
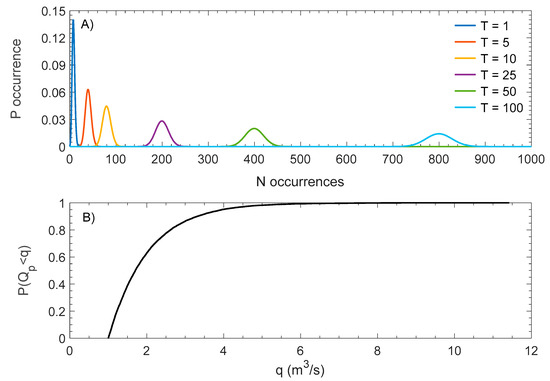
Figure 3.
(A) Probability mass function of the number N of flood event occurrences with . (B) Empirical cumulative probability function of peak discharges for flood events with a magnitude .
The water stage , associated with a given discharge value, is computed assuming a rectangular and wide channel as follows
whereas the flow velocity is evaluated as
All the analyses are performed in MATLAB [46], and the scour depth is evaluated using the formulas presented in Table 1 and Table 2. To better illustrate the framework applied on the numerical case study, Figure 4A shows the probability mass function (PMF) of the scour depth computed with Pizarro et al.’s [33] formula. The initial scour depth state is treated deterministically and it is assumed equal to 0 (m), whereas the considered bridge lifetime ranges from 1 to 100 years. There is a trend in observing single-peak PMFs, where larger bridge lifetimes produce higher values of z. Figure 4B shows the probability of exceedance of z under the same conditions.
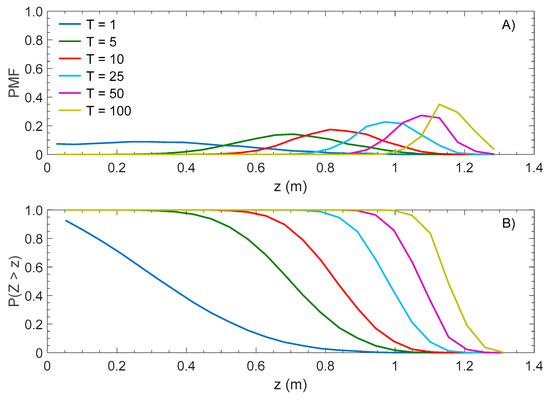
Figure 4.
(A) probability mass function (PMF) of z in function of the considered bridge lifetime (T from 1 to 100 years). (B) Probability of exceedance of z in function of the considered time.
4. Influence of Hydrograph Shape and Model for Describing the Temporal Evolution of Scour
The effect of the epistemic uncertainty on the scour hazard estimate is evaluated by applying the Markovian framework with the different scour predictive models, assuming a bridge lifetime of 100 years and an initial scour depth of 0 (m). The expected scour depths and empirical probability distributions obtained with the different models are compared to each other, by also considering different values of the parameters k and tp describing the hydrograph shape.
In order to illustrate the various models, Figure 5 plots the estimates of the temporal variation of the scour depth under a single hydrograph scenario characterized by a very severe flood, corresponding to Qp = 8.7 (m3/s) (maximum generated value of discharge), k = 2, time to peak of 147 (min), and obtained by starting from a scour depth of 0 (m) (Figure 5A) and 1.0 (m) (Figure 5B).

Figure 5.
Temporal evolution of the scour depth under a single flood scenario corresponding to Qp = 8.7 (m3/s), k = 2, tp = 147 (min), and total flood duration of 294 (min). (A) Initial scour depth z = 0 (m). (B) Initial scour depth z = 1.0 (m).
The obtained results, referring to a single flood scenario, are helpful to illustrate the differences between the various models and how they may affect the estimates of the scour hazard. It is observed that scour estimates computed by Hager and Unger [30] always give the highest values of z with both scour-depth initial conditions (z = 0 (m) and z = 1.0 (m)). Figure 5B shows a horizontal curve for the computed scour depth recovered by Melville and Chiew [31]. This is due to the fact that the initial scour depth, z = 1.0 (m), is already higher than the equilibrium value that can be reached under the assumed flood event, and therefore the flood event does not cause extra erosion around the bridge pier. Pizarro et al.’s [33] estimates are between those computed by Hager and Unger [30] and Melville and Chiew [31].
Figure 6 shows the expected scour depths according to the different temporal evolution models vs the hydrograph shape parameter k. The expected scour depth (E[z]) generally decreases by increasing k. The rate of decrease also reduces with k, until the rate of variation is almost zero for k = 50. Hager and Unger [30]’s formula provides the highest estimates for all the values of k considered, while Melville and Chiew [31]’s scour depths gives the lowest estimates. The ratio of the expected value of the scour depth for k = 50 with respect to the value for k = 2 is equal to 31%, 26%, and 11% for Hager and Unger [30], Pizarro et al. [33], and Melville and Chiew [31], respectively. Therefore, the trend of variation of E[z] is not the same for all the models.
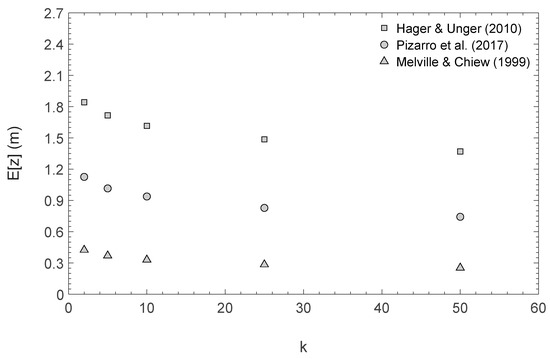
Figure 6.
Expected scour depth in function of the hydrograph shape parameter k (= 2, 5, 10, 25, 50) and employed scour model. Considered bridge lifetime: T = 100 years.
The scatter between the various scour estimates is highest for k = 2. In particular, the relative difference between the values obtained with the Hager and Unger [30] and Melville and Chiew [31] formula are of the order of 1.42 (m), which is 94.7% of the pier diameter.
In order to better highlight the differences between the various models, Table 3 reports the expected values of the scour depth normalised by the value evaluated with the Hager and Unger [30] formula for k = 2. The normalisation factor has been chosen based on the observation that the scour depth estimated by Hager and Unger [30] for k = 2, gives the highest scour depth value within the framework. The results reported in the table shows how the relative differences between the results according to the various models change with k.

Table 3.
Normalised scour depth estimates computed with the three different considered time-dependent scour models. Maximum relative differences between Hager and Unger [30] and Melville and Chiew [31] scour estimates for different values of k.
Figure 7 shows E[z] in function of the ratio between time-to-peak and total flood duration, defined as the percental time-to-peak (PTP). The total flood duration is computed deterministically by the relation days [28,47]. PTP ranges between 0.2 and 0.5 in this study. The value of k is assumed equal to 2, which, based on previous results, corresponds to the most unfavourable condition. It can be observed in Figure 7 that E[z] generally increases with the PTP, reaching a maximum value at PTP = 0.5. The maximum difference between the results obtained with the Hager and Unger [30] and Melville and Chiew [31] models is found at PTP = 0.5, and it is of the order of 1.55 (m), which is 103.6% of the pier diameter. The mean value and the coefficient of variation of the average scour estimates for T = 100 years, k = 2 and PTP = 0.5 are equal to respectively 1.30 (m) and 0.59.
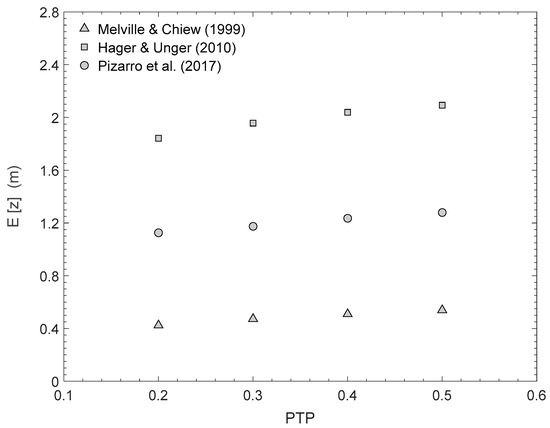
Figure 7.
Expected scour depth E[z] (m) in function of the percental time to peak (PTP) according to the various scour models, for T = 100 years and k = 2.
Figure 8A shows the PMF and Figure 8B shows the exceedance probabilities of the scour depth z for the various models, obtained assuming k = 2, PTP = 0.5, and T = 100 years. Melville and Chiew [31]’s and Pizarro et al.’s [33] models result in single peaked PMFs, while Hager and Unger’s [30] model results in PMFs with two peaks at z = 1.90 and 2.25 (m). The PMFs according to the various models are very different. For instance, the exceedance probability of the scour depth z = 1.32 (m) is 0% for Melville and Chiew [31], 50% for Pizarro et al. [33], and a 100% for Hager and Unger [30].
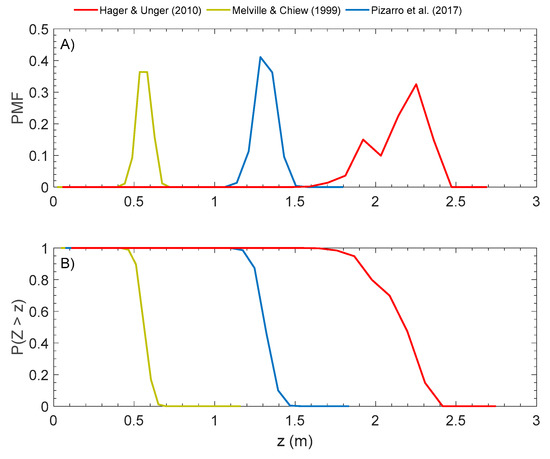
Figure 8.
PMF (A) and empirical exceedance probability (B) of z for k = 2, T = 100 years, and PTP = 0.5. Scour models benchmarking in terms of probabilities.
5. Comparisons with Estimates Based on Equilibrium Scour
Equilibrium scour depths are computed considering five well-known and wide-spread scour equations considering a flood with a peak corresponding to a return period TR = 100 years, and a hydrograph shape with k = 2 and PTP = 0.5. Figure 9 compares these equilibrium scour depths with the scour estimates according to the three time-dependent scour formulas considered in the previous section (assuming k = 2 and PTP = 0.5), at T = 1, 5, 10, 25, 50, 100 years.
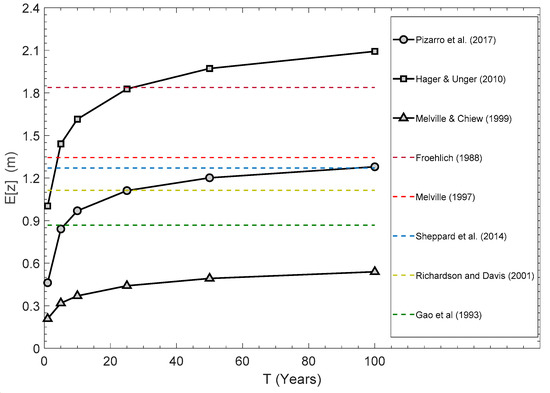
Figure 9.
Comparison among expected scour values for three different time-dependent scour models and Equilibrium formulas. QTR=100 = 5.6 m3/s.
First of all, it can be observed that the scour estimates according to the time-dependent scour formulas do not reach a peak at T = 100 years and would continue to increase by increasing the time, albeit at a reduced rate. This is because by increasing the exposure time T, it is more likely that a very intense flood will occur, resulting in a further increase of the scour depth. At T = 100 years, the average of the expected values of the scour depth according to the three time-dependent models is 1.30 (m), and the coefficient of variation is 0.59.
Overall, it is found that the estimates of the equilibrium scour depths are less scattered compared to those obtained considering the temporal evolution of scour and T = 100 years. They have a mean value of 1.29 (m) and a coefficient of variation of 0.28. It is also worth noting that there is a relative difference of about 100% between the maximum and the minimum equilibrium scour values (corresponding respectively to Froelich’s [40] and Gao et al.’s [43] formulas). Obviously, the obtained values strongly depend on the models chosen for evaluating the equilibrium scour depth and the temporal evolution of scour. At this regard, using different models may result in different results in terms of average values and scatter of the scour estimates.
It can be observed that the scour depth according to Melville and Chiew [31]’s time-dependent scour equation is below all the computed equilibrium scour depths for the whole range of time. In turn, Hager and Unger’s [30] equation for T = 1 year reported a higher value than Gao et al. [43] for E[zeq]. Pizarro et al. [33] provided a scour depth value equal to Sheppard et al. [42], for T = 100 years, while Hager and Unger [30] computed the same scour value of Froehlich [40] for T = 25 years.
Table 4 reports the equilibrium scour depths considering different formulas. In the same table, the corresponding values of the exceedance probabilities according to the three different time-dependent models are reported. Again, the values of the exceedance probability are significantly different for the different models, corresponding to a substantial scatter in the scour hazard estimates.

Table 4.
Benchmarking of different scour models in terms of the exceedance probability of z. T = 100 years, k = 2, and PTP = 0.5.
6. Conclusions
The epistemic uncertainty associated with various bridge scour formula is analysed, considering a Markov process to describe the temporal evolution of scour under multiple consecutive floods. For this purpose, synthetic flood waves with exponential shape are generated, considering different values of the shape parameter (k) and percental time-to-peak (PTP). Three different models are used for describing the temporal evolution of scour during a single flood, leading to different estimates of the probability of scour depth exceedance during the years. These estimates are also compared to the equilibrium scour estimates obtained using five different widespread scour formulas.
With reference to the effect of the hydrograph shape on the scour hazard, it is shown that the choice of k and PTP has some influence on the expected value of the scour depth. Decreasing k from 50 to 2, for PTP = 0.2, results in a maximum increase of the scour depth of 0.47 (m). Moreover, increasing the PTP from 0.2 to 0.5, for k = 2, results in a maximum increase of the scour depth of 0.25 (m). Furthermore, the probabilistic distribution of scour is highly sensitive to the choice of the time-dependent scour model. The probability of exceeding a given scour depth may be equal to 0% for one model, and 100% for another. Moreover, even after 100 years, the expected scour depth continues to increase, even though at a very slow rate.
The scour depths obtained with the different equilibrium scour formulas considering a peak flood with return period TR = 100 years are compared with the estimates obtained using time-dependent scour models and considering a bridge lifetime of T = 100 years. The comparison shows that the effect of the epistemic uncertainty associated with the equilibrium scour models is lower than that of associated with the time-dependent models. Although this result may depend by the choice of the models for the equilibrium scour and temporal scour evolution, it unequivocally shows that there is a huge need for more laboratory experiments and field data to further validate and enhance current models for the temporal evolution of scour.
It is noteworthy that the obtained results refer to a single case study that, although realistic, is not representative of any real bridge. Further investigations considering a larger set of both idealized and real case studies and scour formulas should be carried out to generalize the obtained results.
Author Contributions
A.P. and E.T. equally contributed to all phases of the manuscript.
Funding
This research received no external funding.
Conflicts of Interest
The authors declare no conflict of interest.
References
- Briaud, J.L.; Brandimarte, L.; Wang, J.; D’Odorico, P. Probability of scour depth exceedance owing to hydrologic uncertainty. Georisk 2007, 1, 77–88. [Google Scholar] [CrossRef]
- Cook, W. Bridge failure rates, consequences, and predictive trends. Ph.D. Thesis, Utah State University, Logan, UT, USA, May 2014. [Google Scholar]
- Imam, B.M.; Marios, K. Causes and consequences of metallic bridge failures. Struct. Eng. Int. 2012, 22, 93–98. [Google Scholar] [CrossRef]
- Kattell, J.; Eriksson, M. Bridge Scour Evaluation: Screening, Analysis, & Countermeasures; USDA Forest Service, San Dimas Technology and Development Center: San Dimas, CA, USA, 1998. [Google Scholar]
- Smith, D.W. Bridge failures. In Proceedings of the Institution of Civil Engineers, London, UK, August 1976; Volume 60, pp. 367–382. [Google Scholar]
- Wardhana, K.; Hadipriono, F.C. Analysis of recent bridge failures in the United States. J. Perform. Constr. Facil. 2003, 17, 144–150. [Google Scholar] [CrossRef]
- Proske, D. Bridge Collapse Frequencies Versus Failure Probabilities; Springer: Berlin, Germany, 2018; ISBN 3319738321. [Google Scholar]
- Kirby, A.; Roca, M.; Kitchen, A.; Escarameia, M.; Chesterton, O. Manual on Scour at Bridges and Other Hydraulic Structures; CIRIA: London, UK, 2015; ISBN 0860177475. [Google Scholar]
- MOP Highways design manual 2000. Available online: http://www.vialidad.cl/areasdevialidad/manualdecarreteras/Paginas/default.aspx (accessed on 17 October 2019).
- Richardson, E.V.; Davis, S.R. Evaluating Scour at Bridges. Hydraulic Engineering Circular (HEC) No. 18; U.S. Department of Transportation Federal Highway Administration: Washington, DC, USA, 2001.
- Arneson, L.A.; Zevenbergen, L.W.; Lagasse, P.F.; Clopper, P.E. Evaluating Scour at Bridges (Hydraulic Engineering Circular No. 18); US DOT: Washington, DC, USA, April 2012. [Google Scholar]
- Melville, B.W.; Coleman, S.E. Bridge Scour; Water Resources Publication: Highlands Ranch, CO, USA, 2000; ISBN 1887201181. [Google Scholar]
- TSO UK Design Manual for Roads and Bridges UK Roads Liaison Group: Background Briefing on Highway Bridges; Chartered Institution of Highways & Transportation: London, UK, 2009.
- Hamill, L. Bridge Hydraulics; CRC Press: Boca raton, FL, USA, 2014; ISBN 148227163X. [Google Scholar]
- Koutsoyiannis, D.; Montanari, A. Statistical analysis of hydroclimatic time series: Uncertainty and insights. Water Resour. Res. 2007, 43. [Google Scholar] [CrossRef]
- Dimitriadis, P. Hurst-Kolmogorov dynamics in Hydrometeorological processes and in the microscale of turbulence. Ph.D. Thesis, National Technical University of Athens, Athens, Greece, December 2017. [Google Scholar]
- Markonis, Y.; Moustakis, Y.; Nasika, C.; Sychova, P.; Dimitriadis, P.; Hanel, M.; Máca, P.; Papalexiou, S.M. Global estimation of long-term persistence in annual river runoff. Adv. Water Resour. 2018, 113, 1–12. [Google Scholar] [CrossRef]
- Koutsoyiannis, D. HESS Opinions “A random walk on water.”. Hydrol. Earth Syst. Sci. 2010. [Google Scholar] [CrossRef]
- Barbe, D.E.; Cruise, J.F.; Singh, V.P. Probabilistic approach to local bridge pier scour. Transp. Res. Rec. 1992. Available online: http://hdl.handle.net/1969.1/164643 (accessed on 17 October 2019).
- Johnson, P.A. Reliability-based pier scour engineering. J. Hydraul. Eng. 1992, 118, 1344–1358. [Google Scholar] [CrossRef]
- Brandimarte, L.; Montanari, A.; Briaud, J.-L.; D’Odorico, P. Stochastic flow analysis for predicting river scour of cohesive soils. J. Hydraul. Eng. 2006, 132, 493–500. [Google Scholar] [CrossRef]
- Kwak, K.; Briaud, J.L.; Chen, H.C. SRICOS: Computer program for bridge pier scour. Proceedings of The International Conference on Soil Mechanics and Geotechnical Engineering; Aa Balkema Publishers: Rotterdam, The Netherlands, 2001; Volume 3, pp. 2235–2238. [Google Scholar]
- Johnson, P.A.; Ayyub, B.M. Assessing time—variant bridge reliability due to pier scour. J. Hydraul. Eng. 1992, 118, 887–903. [Google Scholar] [CrossRef]
- Johnson, P.A.; Hell, T.M. Bridge Scour—A Probabilistic Approach. Infrastructure 1996, 1, 24–30. [Google Scholar]
- Yanmaz, A.M.; Üstün, I. Generalized reliability model for local scour around bridge piers of various shapes. Turkish J. Eng. Environ. Sci. 2001, 25, 687–698. [Google Scholar]
- Manfreda, S.; Link, O.; Pizarro, A. A theoretically derived probability distribution of scour. Water 2018, 11, 520. [Google Scholar] [CrossRef]
- Lagasse, P.F.; Ghosn, M.; Johnson, P.A.; Zevenbergen, L.W.; Clopper, P.E. Risk-Based Approach for Bridge Scour Prediction; National Cooperative Highway Research Program Transportation Research Board National Research Council: Washington, DC, USA, 20 October 2013. [Google Scholar]
- Tubaldi, E.; Macorini, L.; Izzuddin, B.A.; Manes, C.; Laio, F. A framework for probabilistic assessment of clear-water scour around bridge piers. Struct. Saf. 2017, 69, 11–22. [Google Scholar] [CrossRef]
- Oliveto, G.; Hager, W.H. Temporal evolution of clear-water pier and abutment scour. J. Hydraul. Eng. 2002, 128, 811–820. [Google Scholar] [CrossRef]
- Hager, W.H.; Unger, J. Bridge pier scour under flood waves. J. Hydraul. Eng. 2010, 136, 842–847. [Google Scholar] [CrossRef]
- Melville, B.W.; Chiew, Y.-M. Time scale for local scour at bridge piers. J. Hydraul. Eng. 1999, 125, 59–65. [Google Scholar] [CrossRef]
- Link, O.; Castillo, C.; Pizarro, A.; Rojas, A.; Ettmer, B.; Escauriaza, C.; Manfreda, S. A model of bridge pier scour during flood waves. J. Hydraul. Res. 2017, 55. [Google Scholar] [CrossRef]
- Pizarro, A.; Samela, C.; Fiorentino, M.; Link, O.; Manfreda, S. BRISENT: An Entropy-Based Model for Bridge-Pier Scour Estimation under Complex Hydraulic Scenarios. Water 2017, 11, 889. [Google Scholar] [CrossRef]
- Pizarro, A.; Ettmer, B.; Manfreda, S.; Rojas, A.; Link, O. Dimensionless Effective Flow Work for Estimation of Pier Scour Caused by Flood Waves. J. Hydraul. Eng. 2017. [Google Scholar] [CrossRef]
- Manning, R. On the Flow of Water in Open Channels and Pipes. Trans. Inst. Civ. Eng. Irel. 1891, 20, 161–207. [Google Scholar]
- Salas, J.D.; Maidment, D. Handbook of Hydrology. In Analysis and Modeling of Hydrologic Time Series; McGraw-Hill Book Co.: New York, NY, USA, 1993. [Google Scholar]
- Rogger, M.; Kohl, B.; Pirkl, H.; Viglione, A.; Komma, J.; Kirnbauer, R.; Merz, R.; Blöschl, G. Runoff models and flood frequency statistics for design flood estimation in Austria–Do they tell a consistent story? J. Hydrol. 2012, 456, 30–43. [Google Scholar] [CrossRef]
- Kothyari, U.C.; Garde, R.C.J.; Ranga Raju, K.G. Temporal variation of scour around circular bridge piers. J. Hydraul. Eng. 1992, 118, 1091–1106. [Google Scholar] [CrossRef]
- Chang, W.-Y.; Lai, J.-S.; Yen, C.-L. Evolution of scour depth at circular bridge piers. J. Hydraul. Eng. 2004, 130, 905–913. [Google Scholar] [CrossRef]
- Froehlich, D.C. Analysis of onsite measurements of scour at piers. In Hydraulic Engineering: Proceedings of the 1988 National Conference on Hydraulic Engineering, New York, NY, USA, 8–12 August 1988; ASCE: New York, NY, USA, 1988; pp. 534–539. [Google Scholar]
- Melville, B.W. Pier and abutment scour: Integrated approach. J. Hydraul. Eng. 1997, 123, 125–136. [Google Scholar] [CrossRef]
- Sheppard, D.M.; Melville, B.; Demir, H. Evaluation of existing equations for local scour at bridge piers. J. Hydraul. Eng. 2014, 140, 14–23. [Google Scholar] [CrossRef]
- Gao, D.; Pasada, L.; Nordin, C.F. Pier Scour Equations Used in the Peoples Republic of China; FHWA-SA-93-076; US Department of Transportation: Washington, DC, USA, 1993.
- Sheppard, D.M.; Melville, B. Scour at wide Piers and Long Skewed Piers. In Scour at wide Piers and Long Skewed Piers; NCHRP Report 682; Transp. Res. Board Natl. Acad.: Washington, DC, USA, March 2011. [Google Scholar]
- Johnson, P.A.; Torrico, E.F. Scour Around Wide Piers in Shallow Water. Transp. Res. Rec. 1994, 1471, 66–70. [Google Scholar]
- MATLAB, R2019a; MathWorks: Netik, MA, USA, 2019; [Computer software].
- Cunderlik, J.M.; Ouarda, T.B.M.J. Regional flood-duration—Frequency modeling in the changing environment. J. Hydrol. 2006, 318, 276–291. [Google Scholar] [CrossRef]
© 2019 by the authors. Licensee MDPI, Basel, Switzerland. This article is an open access article distributed under the terms and conditions of the Creative Commons Attribution (CC BY) license (http://creativecommons.org/licenses/by/4.0/).