Abstract
The expression “follow the water” is used to recognize inside the universe, life as it exists on Earth. It is shown here that the expression “follow the high subcritical water” can be used to recognize the components of life that formed prior to the emergence of life. It is also shown that this particular water leaves signatures inside rocks that are produced during high subcritical water–rock interactions. These signatures are ferric minerals, which are currently explained by the presence of microorganisms. The consideration of water in the high subcritical domain may lead to postpone the date of the existence of FeII-oxidizing and O2-producing microorganisms, and consequently the date of the appearance of oxygen in the atmosphere. Alkaline water at pH ~9.5 to 14 and in the specific domain of temperature ~300–350 °C, pressure ~10–25 MPa, and density ~700–600 kg/m3, allows us to understand the formation of silica and ferric minerals, and the synformation of components of life in anoxic geological terrains such as the banded iron formations on early Earth and extraterrestrial objects such as Enceladus. The high subcritical water lets appear the continuity between rocks and life, which is conceptualized by the word “geobiotropy”.
1. Introduction
Liquid water is an essential component of living organisms and of their environment, and the strategy for the search for life in the universe is currently summarized in the expression “follow the water”, which was chosen by NASA circa 2000 as the new scientific approach for Mars exploration [1]. Since 2013, it has been shown that the specific conditions of water, called high subcritical, permit the oxidation of ferrous iron into ferric iron in alkaline anoxic conditions and the synformation of molecules of life in a chemical process called geobiotropy [2,3,4,5,6,7,8]. Recently, it has been demonstrated that the properties of high subcritical (hsubc) water enable the formation of ferric compounds in geological terrains, such as banded iron formations (BIFs), and of components of life inside cavities and inclusions hosted by rocks [7]. The action of this particular domain of water can be recognized during the observation of minerals. In the present article, it is shown that a search for the components of life can be specified in the expression “follow the high subcritical water“ which addresses a specific aspect of the global expression “follow the water”. “Follow the high subcritical water” concerns the search in geological terrains that contain ferrous silicates in anoxic environments such as planetary objects, comets, asteroids, and meteorites, where water can be in the liquid state, and not the search in cold areas without ferrous silicates, or in molecular clouds where molecules are in the gaseous state. The case of ferrous silicates without sulfides is presented, with its application to BIFs and Enceladus. The case of ferrous silicates with the presence of sulfides was presented in 2017 [5,6] and will be further detailed in a future article.
In the last 50 years, many hypotheses have been developed to explain the observation of ferric iron in iron geological formations. A comprehensive review published in 2017 by Konhauser et al. [9] describes the state of knowledge on iron formations deposited between 2.80 and 1.85 Ga in the Neoarchean to Paleoproterozoic periods. In their Section 2.4 on “available oxidants in seawater for Fe(II) oxidation” they write that “some oxidation of Fe(II) was necessary for precipitation, yet which mechanism(s) were dominant remains uncertain.” First they describe the 1978 Cairns-Smith proposition of oxidation of Fe2+ by UV light and conclude that “this mechanism seems unlikely to have provided the major source of Fe(III) for the deposition of large IFs.” Then they described the two main models that consider photoferrotrophy and O2 produced by photosynthetic bacteria. Czaja et al. reported in 2018 [10] on the hematite–magnetite–pyrite Algoma-type iron formation of the 2.75 Ga Wilgie Mia Formation in the Weld Range of the Yilgarn craton, Australia. They suggest in their Section 4.1. that “the hydrothermally-sourced Fe(II)aq …could have been oxidized by either free oxygen (presumably produced by oxygenic photosynthesis), or by anoxygenic Fe-oxidizing microorganisms.”
Photosynthesis is the conversion of light energy to chemical energy. This mechanism is used by microorganisms. During the oxygenic photosynthesis process in green plants, algae, and O2-producing cyanobacteria, called O2-photosynthetic bacteria, O2 is produced through the oxidation of water. Other bacteria, called Fe(II)-oxidizing bacteria, which belong to the group of phototrophic bacteria (e.g., [11,12]), do not produce O2. They oxidize Fe(II) using diverse electron donors such as carbon species, in a process called anoxygenic photosynthesis. The oxygenic process requires chlorophyll molecules, which are present in plants, algae, and cyanobacteria. The anoxygenic process requires bacteriochlorophyll molecules, which are present in anoxygenic phototrophs. The chlorophyll molecules are pigments that absorb light. They are attached to proteins to form photosynthetic reaction systems which are complex macromolecular pigment-protein structures located inside lipidic membranes (e.g., [13]). Such systems require a level of complexity that may not have been developed in the Archean era.
Therefore, it seems worthwhile to propose another path for the formation of ferric iron. The chemical oxidation of ferrous iron in water at temperatures and pressures approaching the critical point and in alkaline conditions has been newly proposed since 2013 [2,3,4,5,6,7,8]. It is this process that is summarized and extended in the present article. It has been shown that water, which is called high subcritical, can be at the origin of the formation of ferric minerals and the concomitant plausible formation of geobiotropic molecules inside inclusions in minerals or inside cavities of porous rocks.
The present work is part of a research started in 1997. Envisioning that water with specific conditions of temperature and pressure could be an appropriate medium to conduct chemical reactions that finally lead to biological molecules, I considered the structure of water under pressure and in the supercritical state [14,15,16] and the dissolution of apolar molecules in supercritical water [16]. Visualizing rocks as reactants and not only as catalysts [16], experiments with the rock peridotite or its constituents olivine and pyroxene were proposed in hydrothermal conditions [17]. Since 2013, it has been shown that high subcritical water leads to new paths for the synthesis of ferric minerals in anoxic alkaline conditions and for the concomitant chemistry of macromolecules of life [2,3,4,5,6,7,8]. The chemical decomposition of the serpentinization process in 13 elementary equations, which are detailed in [5,6], associated with the calculation of their thermodynamic functions, allows to understand the origin of heat. The associated studies of Eh-pH diagrams for the Fe–H2O system and solubility diagrams for SiO2, show that the formation of H2 requires pH ~9.5–14 and the conditions of water in the high subcritical domain, ~300–350 °C, ~10–25 MPa, density ρ of ~700–600 kg/m3; that, in these alkaline conditions of T, P, and ρ, the oxides, ferric trihydroxide, goethite/lepidocrocite, and hematite form instead of magnetite; and that, also in these conditions, silica and the ferric silicates greenalite and minnesotaite form in crystalline and amorphous structures, and magnetite forms as a product of the iron carbonate siderite. Serpentinization was proposed by Russell et al. in 2010 [18] as a source of energy at the origin of life. The detailed study of the serpentinization process shows that the carbonation reactions are the important source of heat, that the anoxic oxidation of ferrous iron is an endothermic process that requires alkaline high subcritical water to form H2, ferric oxides and crystalline and amorphous ferric silicates, and that anoxic alkaline high subcritical water is also the source of crystalline and amorphous silica [2,3,4,5,6,7,8]. The results demonstrate the necessity of alkaline pH for the formation of H2, the essential molecule for the synthesis of molecules of life, and the synformation of ferric iron and thus of ferric minerals. The conditions for the water–rock interaction are those of the subcritical domain of water, which shows much lower densities than liquid water density.
The present article highlights the results published in earlier articles and progresses with the presentation of seven new figures and three new tables, a development on the formation of magnetite, a proposition for a magmatic reaction chamber on early Earth, where the interaction of hsubc water with ferrous silicates may have proceeded, and a proposition of a water cycle in Enceladus that follows the same kind of hsubc water–ferrous silicates interaction. At the request of readers, the methods of studies are detailed in the text, and in Figure 1 that illustrates the movement of electrons during the process of oxidation, and Figure 2 that shows approximately redrawn parts of the diagrams that are analyzed in the present research and that were drawn and published by other authors. Figure 3 presents the pressure-temperature, P-T, domain of water named high subcritical. Figure 4a,b describe the concept of geobiotropy, which was first presented in 2016 [4]. Figure 4a concerns the formation of the minerals and Figure 4b concerns the synformation of the molecules of life. Figure 5 is improved from Figure 1 in [7] and presents the formation of ferric minerals in anoxic conditions with application to the minerals of the banded iron formations. It was proposed in earlier articles that magnetite is not a primary product of the ferrous iron oxidation of ferrous silicates by high subcritical water. It is described in the present article that magnetite can be considered as a primary mineral when siderite is present since it can form from siderite in carbonated hsubc water. This is specified in Figure 4 and Figure 5. Table 1 is associated to Figure 4b and shows enthalpies and free enthalpies for syntheses of acetylene and hexene. Figure 6 presents a schematic illustration of the depth of the proposed magmatic reaction chamber in the early Earth’s crust. The associated Table 2 shows the different densities of water and minerals. Figure 7 is an illustration of the water cycle proposed for Enceladus and is associated with Table 3.
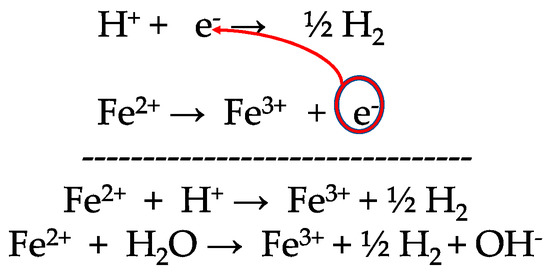
Figure 1.
Process of oxidation of the redox couple Fe3+/Fe2+ by the redox couple (H+/H2).
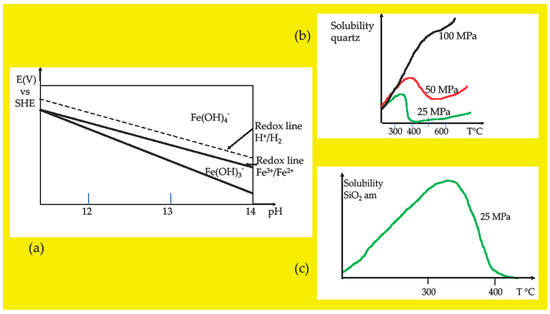
Figure 2.
Schematic diagrams to aid the comprehension of the studies on fayalite dissolution and oxidation [2,3,4,5,6,7,8]. Only small parts of the original diagrams are approximately reproduced. (a) Pourbaix diagram for the water–iron system at 350 °C, 25 MPa, 10−6 mol/kg of dissolved product species; the original was drawn and published in 2012 by Cook and Olive [21]; SHE, standard hydrogen electrode. (b) Solubility diagram of quartz (SiO2) in water; the original was drawn and published in 2011 by Smith and Fang [22]. (c) Solubility diagram of amorphous silica (SiO2 am); the original was drawn and published in 2013 by Karasek et al. [23].
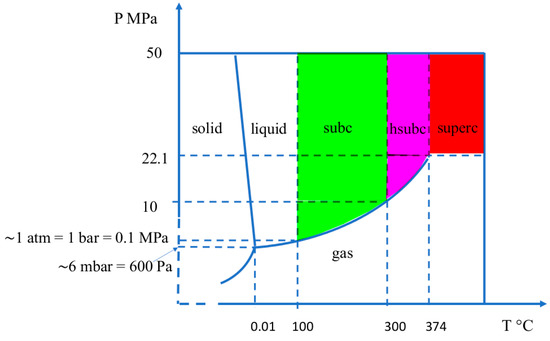
Figure 3.
Approximate diagram of pressure and temperature for water, highlighting subcritical water. subc = subcritical water; hsubc= high subcritical water; superc = supercritical water.
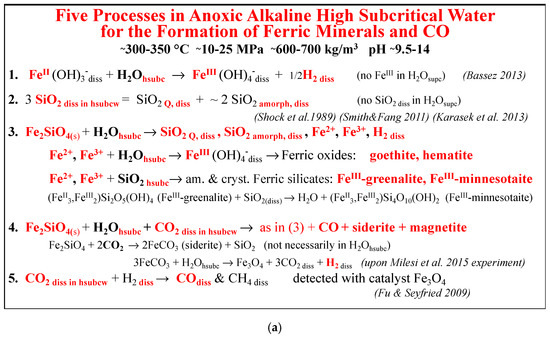
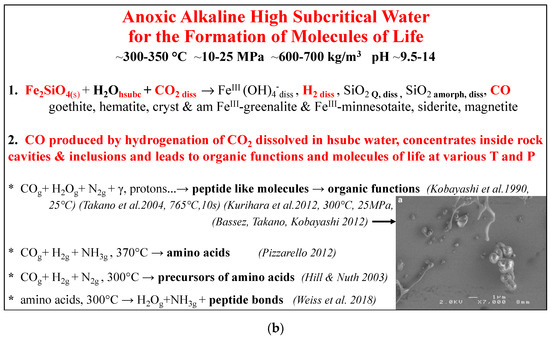
Figure 4.
The concept of geobiotropy, which represents the transformation in anoxic alkaline high subcritical water, of rocks that contain ferrous silicates, for the production of ferric minerals and macromolecules of life. (a) describes the five processes in high subcritical water, that lead to the formation of ferric minerals and CO. (b) describes experiments on the synthesis of molecules of life either at low T with irradiation or at higher T. The equations show the products but are not all chemically equilibrated. diss = dissolved; hsubc = high subcritical; supc = supercritical; hsubcw = high subcritical water; Q = quartz; amorph = amorphous; s = solid; am = amorphous; cryst = crystalline; g = gas; γ = gamma rays.
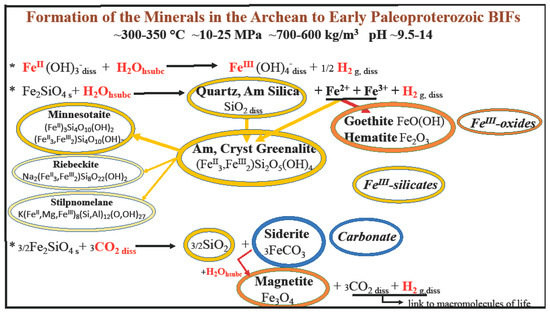
Figure 5.
A possible formation of ferric minerals in the absence of UV light, oxygen, and microorganisms. The specific case of banded iron formations (BIFs) is illustrated. Synthesized minerals are as follows; in brown: quartz and amorphous silica and the ferric silicate greenalite and its dehydration product minnesotaite; in light brown: riebeckite and stilpnomelane, which may possibly be considered as dehydration products of greenalite; in rusty red: the ferric oxides goethite and hematite, and magnetite arising from siderite; in blue: the carbonate siderite. This is an extended version of Figure 1 in Bassez 2018 [7]; it includes the action of CO2 on fayalite and the formation of magnetite from siderite.

Table 1.
Thermodynamic enthalpies for the synthesis of acetylene at 227 °C, considering the hydrogenation of CO with various ratios of H2/CO, the hydrogenation of CO2 and the hydrolysis of CO. The synthesis of 1-hexene at 427 °C is considered through the hydrogenation of CO. Values are adapted from chapter 2 in Anderson [30] and are reported here in kJ/mol of acetylene and 1-hexene.
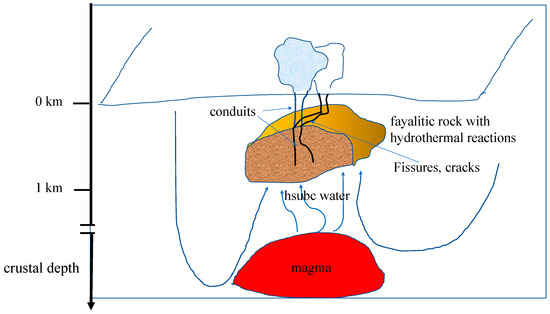
Figure 6.
A schematic illustration of a kind of magmatic hydrothermal reaction chamber located within a depth of 1 km of the upper crust, on Earth, and containing fayalite and/or ferrosilite in interaction with high subcritical water that has been heated near magma. The hsubc water is anoxic. Quartz and amorphous silica, the ferric oxides goethite and hematite, amorphous ferric silicates, and the crystalline ferric silicates greenalite and minnesotaite form, possibly with the dehydration products riebeckite and stilpnomelane. When the water is carbonated, siderite forms and produces magnetite after hydrolysis in hsubc water. The released H2 can be captured inside inclusions, together with CO2 and N2, to form components of life [7] and the fifth process described in the Section 3.1.
Table 2.
Density (volumic mass or mass per unit volume) of minerals (values are those of the handbook of mineralogy) and of hsubc water educed from Figure 2 in [21].
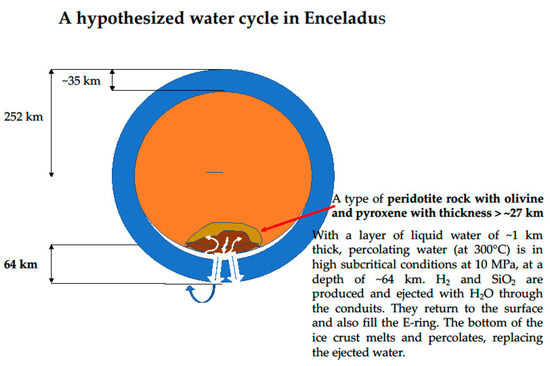
Figure 7.
Schematic illustration of a possible water cycle on Enceladus. Water percolates through peridotite rock. With 35 km ice crust and 1 km water, pressure is 10 MPa at a depth of ~28 km inside the core.
Table 3.
Enceladus parameters.
The structure of the text is as follows; after a presentation of the methods, the results show, first, the five processes in high subcritical water and their action in the anoxic formation of ferric minerals and molecules of life during the process of geobiotropy, as illustrated in Figure 4, and second, the proposed process of interaction between hsubc water and Fe–silicate rocks, in geological terrains with application to early Earth and banded iron formations; third, the plausible interaction of hsubc water with Fe,Mg-silicate rocks inside the core of the Saturn’s moon Enceladus, to explain the observed heat, pH, H2, and organic molecules. The emphasis is set on the importance of alkaline water in high subcritical conditions of temperature, pressure, and density, in the search for the components of life in the universe, and on early Earth, extraterrestrial objects, and habitable planets.
2. Methods
The method comprehends thermodynamic calculations on hydrolysis and carbonations of the olivine and pyroxene endmembers [2,3,4,5,6] and spectroscopic studies of Raman spectra [7] conducted for the present work, supplemented by a logical association of theoretical studies of diagrams and experimental results published by other scientists. From this composition of results, new conclusions and hypotheses are proposed. As requested, I detail below, in a simple way, the method of studies.
The calculations of the thermodynamic functions are described in [2,3,4,5,6].
The potential–pH diagrams are studied as follows. Electrochemical systems, with exchanges of electrons between ionic species, occur everywhere in the universe. The study of such systems starts with the simple definition that one species is said to be oxidized when it loses electrons. For instance, ferrous iron is oxidized into ferric iron during the process of oxidation. An oxidation process is a loss of electrons from a species of an element with a specific oxidation number, for instance Fe2+ or Red, the reduced species of the element iron with the oxidation number II, to form Fe3+ or Ox, the oxidized species with the oxidation number III. The equation of the electrochemical system is written as ν1Red1 → ν’1Ox1 + ne−. The symbol ν represents the stoichiometric coefficient and n the number of electrons exchanged. For instance, in the following equations, named half-redox equations, Fe2+ → Fe3+ + e- for the electrochemical system 1 also named redox couple 1, Fe3+/Fe2+, the stoichiometric coefficients ν1 and ν’1 are 1 and the number of electrons exchanged is 1. In the equation H2 → 2H+ + 2e−, for redox couple 2, H+/H2, the stoichiometric coefficient ν2 is 1, ν’2 is 2, and the number of electrons exchanged is two. The equations represent the processes of oxidation and, inversely reduction, for the two species Fe2+, Fe3+, which form the redox couple Fe3+/Fe2+, with the oxidized species written first by convention. The same kind of equations applies to the redox couple H+/H2.
The redox potential of an electrochemical system, also named the potential of the redox couple, E, expressed in volts (i.e., joules/coulomb), is an electric potential energy per unit charge. It is different from the electrochemical potential, which is expressed in joules/mole. The redox potential is a function of the activities (concentrations) of the oxidized aox and reduced species ared, and it is given by the Nernst equation: EH = E° + (RT/nF).ln(aox/ared). E° is the standard potential and F is the Faraday constant. An electric potential is always defined with respect to infinity, where it has the value 0. As for the gravitational field, it is the difference in potential energy, which counts since it equals the kinetic energy. Thus, in an electrochemical system in equilibrium, redox potential is usually expressed relative to the standard hydrogen electrode (SHE), with the potential set by choice to 0 volts. The symbol of a redox potential is either E, EH, EH, Eh, or E(V) vs. SHE, as per the E-pH Pourbaix diagrams in Figure 2a. The standard reduction potential for the reduction half-reaction O2(g) + 4H+(aq) + 4e− → 2H2O (l) is +1.23 volts, and the standard reduction potential E°(H+/H2) for the reduction half-reaction 2H+(aq) + 2e− → H2(g) is 0 volt by choice. More information can be found in documents on electrostatic potential energy, electric potential, electrochemistry, or electrochemical systems such as the book published in 2004 by Chivot in honor of Marcel Pourbaix [19] or the article on the relationship between electric and redox potential published in 2001 by Timm and Möller [20]. The latter studied the natural redox potential of rock fluids in relation to the self-potential.
A gravitational system evolves spontaneously toward a decreasing potential energy, for instance, a marble sliding down a slope. In electricity, positive charges move from high electric potential to low electric potential, and negatives charges, such as electrons, move from low electric potential to high electric potential. By analogy, I propose that an electrochemical system that undergoes chemical reactions evolves spontaneously in the direction of decreasing potentials, with electrons moving towards higher potentials (Figure 1). This spontaneous change is now applied to Figure 2a. The redox line E°(H+/H2) = f(pH), in the range of high pH values, is located above the redox line E° (Fe3+/Fe2+) = f(pH). Thus, the redox couple (H+/H2) oxidizes the redox couple (Fe3+/Fe2+) and the electron released from ferrous iron moves toward higher potential. The equations can be written as shown in Figure 1.
Solubility diagrams have been drawn for many years for quartz and amorphous silica as a function of temperature and pressure [24]. The diagrams analyzed in [7] are redrawn in an approximate way and presented in Figure 2b,c. From the observation of these diagrams, we can conclude that at 25 MPa, both crystalline and amorphous silica dissolve with increasing temperature up to the critical point of water and precipitate above this point. We can then educe that fayalite will dissolve in high subcritical water to give Fe2+ and silica. This is partially confirmed by experiments conducted on fayalite dissolution in supercritical CO2 by Qafoku et al. in 2012 [25]. We can also educe that fayalite will not dissolve in the supercritical state next to the critical point, such as 400 °C, 25 MPa, because there is no dissolution of silica in these T and P conditions [22,23,24].
The study of the Raman spectra is detailed for a sample of the BARB3 drill core in the ~3.4 Ga old Buck Reef Chert of the Barberton Greenstone Belt, South Africa in the section on "Experimental Preliminary Results" [7].
3. Results
3.1. Five Processes in High Subcritical Water for the Anoxic Formation of Ferric Minerals and Molecules of Life
Five combined processes that occur in anoxic high subcritical water can produce both the ferric minerals that are observed in Archean rocks and the associated geobiotropic molecules of life. They are described below and in Figure 4.
First, the oxidation of ferrous iron into ferric iron can occur at an alkaline pH of ~9.5 to 14 when water reaches temperatures ~300–350 °C and pressures of ~10–25 MPa. Under these conditions, the density of water is ~700–600 kg/m3. These values of T, P, and densities are obtained through the careful observations of E-pH and density diagrams, published for the system Fe–H2O at 10−6, 10−8, and 10−11 mol/kg concentrations of dissolved species by Cook and Olive in 2012 [21]. These combined T and P values belong to the domain of water called high subcritical, as shown in Figure 3 of the present article. They are below the critical point of water, which has the values 374 °C and 22.1 MPa for pure water. Figure 2a shows a redrawn part of the Cook and Olive diagram drawn at 350 °C and 25 MPa. Considering the redox line H+/ H2 and not the redox line O2/H2O, we can observe that the Fe3+/Fe2+ redox line which separates the ferric tetrahydroxide and ferrous trihydroxide anions is located below the redox line H+/ H2 and out of the range of stability of water with respect to the formation of H2. Consequently, in alkaline high subcritical water, the H+/H2 couple oxidizes the Fe3+/Fe2+ couple and ferrous iron is oxidized into ferric iron. The proton H+ of water is reduced to H2; in other words, and by extrapolation, it is possible to say that water is reduced. This Fe3+/Fe2+ redox line does not appear in the diagrams drawn for water above the critical point, at 400 °C, 25 MPa, and 10−6, 10−8, and 10−11 mol/kg of dissolved species [21]. It can be seen that the calculations of the thermodynamic parameters used for the E-pH Pourbaix diagrams are based on the revised Helgeson–Kirkham–Flowers (R-HKF) model extended to water density as low as 200 kg/m3 and that supercritical water at 400 °C and 25 MPa has a density of 167 kg/m3 which is “outside of the validated range of the revised HKF model”( [21]. and refs herein). Until ferrous oxidation can be shown to proceed in supercritical water either with a model other than R-HKF or with experimental work, it is possible to write that ferric iron cannot be produced from fayalite just above the critical point, called low supercritical state, but can be produced in high subcritical water.
Concomitant to the oxidation of iron in high subcritical water, molecular hydrogen is released. The chemical equation that is proposed in this work since 2013 [2] for the reduction of H+ and the oxidation of Fe2+ in anoxic alkaline high subcritical water is written in (1). In other words, the production of ferric iron in high subcritical water and not above does not require oxygen consumption, instead, hydrogen is produced.
FeII(OH)3−diss + H2Ohsubc → FeIII(OH)4−diss + ½ H2 diss
Second, the solubility of SiO2 increases with T and shows a turnover at the critical point of water, as shown in Figure 2b,c for quartz and amorphous silica. Calculations based on the Fournier and Potter equation of 1982 show that at 23 MPa “the SiO2 solubility increases to a value of 0.087 wt% at 350 °C and drastically decreases to 0.0081 wt% at 450 °C” as described by Smith and Fang in 2011 ([22] and refs herein). This abrupt change was also observed in earlier diagrams drawn for the solubility of quartz in water, with experimental data and the R-HKF equations of state ([24] and refs herein). The turnover is also observed for the solubility of amorphous silica, as shown in Figure 2c, which is an approximately redrawn small part of the diagram drawn and published by Karasek et al. in 2013 [23]. In addition, high subcritical water controls the content in amorphous silica versus quartz as shown in Figure 4 of [23]. Indeed, at 23 MPa, the solubility of both amorphous and crystalline silica increases with T, with an abrupt decrease at the critical point. At the critical point, the solubility of amorphous silica appears to approximately double the solubility of quartz, while at 25 °C, the ratio of amorphous silica to quartz seems to be ~18.
The third process to consider is the interaction of anoxic alkaline high subcritical water with rocks that contain ferrous silicates. This interaction combines the two above processes, the oxidation of ferrous iron into ferric iron with release of H2 and the high solubility of SiO2. The example of fayalite (Fe2SiO4) is shown in Figure 4a. Ferrosilite (FeSiO3) interacts with hsubc water in the same way. The dissolution of fayalite in hsubc water is enhanced by the fact that SiO2 dissolves much more in hsubc water than under and above the hsubc domain. The interaction of fayalite with hsubc water is thus driven towards the formation of SiO2 and consequently H2 and ferric iron. Therefore, rocks that contain ferrous silicates evolve in alkaline high subcritical anoxic water and produce ferric minerals: ferric trihydroxide, which by dehydration leads to the ferric oxide hydroxides goethite and lepidocrocite and the ferric oxide hematite, and amorphous and crystalline ferric silicates such as greenalite, which by dehydration in a solution supersaturated in silica produces ferric minnesotaite. Indeed, high subcritical water, which dissolves silica easily, can become saturated in silica and induce the dehydration of greenalite. Tosca et al. in 2016 showed experimentally that a solution of ferrous ions and SiO2 at 25 °C leads to a ferrous silica gel that transforms into FeII-greenalite [26]. This experiment, conducted in high subcritical water, should lead to amorphous ferrous-ferric silica gel and ferric silicate FeIII-greenalite. FeIII-minnesotaite, which is the iron analog of talc, should form by dehydration of FeIII-greenalite in a solution supersaturated in silica, as talc forms from Mg-serpentine chrysotile. FeIII-riebeckite and FeIII-stilpnomelane, which contain much less (–OH) groups than minnesotaite, should also form through further dehydration of greenalite.
Therefore, high subcritical water appears to be an adequate medium to produce ferric oxide hydroxides, ferric oxides, amorphous and crystalline ferric silicates, and amorphous silica and quartz with a ratio of amorphous silica/quartz up to 2, as described in the second process on the solubility of SiO2. The concomitant production of H2 can be used to form CO and components of life as described in the fifth process.
The fourth process occurs when high subcritical water is carbonated either with dissolved CO2 or with NaHCO3. Quartz and the carbonate siderite form through the action of carbon dioxide on fayalite. The reaction is exothermic [2,3,4,5,6] and does not depend on the conditions for the formation of ferric iron. Thus, the formation of siderite does not require the conditions of high subcritical water and huge amounts of quartz and siderite can form without being associated with ferric minerals. When NaHCO3 is present in water instead of CO2, it decomposes entirely into Na2CO3, CO2, and H2O at 270 °C, as it is known in the chemistry laboratory. Thus, siderite can form in conditions outside the domain of hsubc water. However, when siderite forms in high subcritical water, there can be equilibrium between formation and decomposition through hydrolysis. Indeed, experiments published in 2015 show that magnetite can form from the hydrolysis of siderite with the release of H2 at 300 °C and 50 MPa [27]. The experiment was conducted with 50 mg of siderite loaded with 100 µL of MilliQ water in sealed gold capsules, leaving a headspace of air less than 1/5 of the capsule volume. In their Table 1, Milesi et al. describe that at 200 °C there is no release of H2. At 300 °C, H2 is released at its maximum after 3 h and a regular decrease is consecutively observed until about seven days. The experiment conducted at 300 °C with dry siderite yielded no detectable H2 and no solid product. The authors concluded with equation (2) which is written below with the subscripts diss and hsubc in order to highlight high subcritical water. The Milesi et al. experiments show that the oxidation of ferrous iron occurs at 300 °C very rapidly and that siderite needs water to be transformed.
3FeCO3(s)+ H2Ohsubc → Fe3O4 + 3CO2diss + H2diss
Therefore, when anoxic carbonated alkaline high subcritical water interacts with fayalite and/or ferrosilite, H2 is produced and the primary minerals goethite, lepidocrocite, hematite, quartz, amorphous silica, and siderite form. Magnetite is produced coevally with the formation of siderite also in high subcritical water. It can thus be observed nowadays in association with siderite.
The fifth process concerns the hydrogenation of CO2 by molecular hydrogen, producing carbon monoxide (CO) and/or methane (CH4). This hydrogenation was first demonstrated in the gas phase in 1902 by Sabatier and Senderens [28,29], as described in [7]. They reported the hydrogenation with the catalyst Ni, of CO2 at 300–350 °C, and CO at 250–300 °C, both forming methane in exothermic reactions. In 1910, Mittasch, Bosch, and Haber developed Fe catalysts for the synthesis of NH3. In 1923, Fischer and Tropsch reported the hydrogenation of CO on Fe with production of the molecule 1,2-dimethoxybenzene (C8H10O2) named synthol, which is liquid at 25 °C, and in 1925 they synthesized, at atmospheric pressure on Co and Ni, methane and higher hydrocarbons. It was the start of the so-called Fischer–Tropsch synthesis (FTS), which is defined as “the hydrogenation of oxides of carbon producing higher hydrocarbons and/or alcohols, the carbon chains of the molecules being predominantly straight in the range C4 to C10. The FTS is a practical way of converting coal to gasoline, diesel oil, wax, and alcohols. Coal is gasified to furnish the hydrogen plus carbon monoxide” [30]. In 1937, Fischer and Pichler discovered that synthesis on Fe was greatly improved by operating at 5–20 atm. In 1953, Anderson and Schultz found that Fe nitrides, used as catalysts in the FTS, lead to large yields of alcohols, and in 1984 the book “the Fischer–Tropsch Synthesis” by Anderson was published [30]. Experiments using different catalysts and various ratios of H2/CO and H2/CO2 and conditions of T and P were conducted. The hydrogenation of carbon oxides is usually strongly exothermic, as described in chapter 2 of [30]. Table 1 of the present article shows the enthalpies for the synthesis of acetylene at 227 °C. The free enthalpies ΔrG° are all positive. The hydrogenation of CO2 is not favored at all, with a highly positive value for ΔrG°. The hydrogenation of CO is not favored either; however, the heat produced can be high. As mentioned in 1984 by Anderson, “acetylene has never been produced in FTS, (Fischer Tropsch Synthesis)”. On the contrary, C6H12 is produced spontaneously and with high heat during the hydrogenation of CO with a ratio H2/CO of 1/2. The ratio H2/CO of 2 is much less favored. The hydrogenation of CO with various ratios leads to oxygenated molecules, such as formaldehyde (HCHO), methanol (CH3OH), acetic acid (CH3COOH), and higher aldehydes, ketones, esters, and naphthenes at elevated pressures. Thus, a vast variety of molecules can be produced in FTS reactions. Since Sabatier and Senderens, in 1902, were the first to study the effect of various ratios of H2, CO, CO2, and various catalysts to obtain CO and CH4, and were thus the pioneers in the hydrogenation of carbon oxides, the expression “Sabatier–Senderens/Fischer–Tropsch and Haber–Bosch reactions” as written in Bassez 2018 [7] could improve the term Fischer–Tropsch type (FTT) reactions. A review article from 2008 cites 210 references on the iron-based Fischer–Tropsch synthesis [31] and shows the complexity of the iron-carbon-oxygen chemistry system. In their article, de Smit and Weckhuysen describe the oxides that are important in FTS (hematite, magnetite, maghemite, wüstite, and goethite) and also various iron carbides. They also report the reaction mechanisms, which are still under debate.
The hydrogenation of CO2 in the liquid phase was reported in 2009 by Fu and Seyfried [32] to produce dissolved CO at 250–300 °C and 25 MPa on Fe3O4. It is notable that the conditions of water are those of the high subcritical domain.
Carbon monoxide (CO) is necessary in the synthesis of macromolecules of amino acids in anoxic conditions, as observed by Schlesinger and Miller in 1983 [33] and by Kobayashi et al. in 1990 [34]. In the continuation of Kobayashi experiments, in 2004, Takano irradiated, with 3 MeV protons at room temperature, a gas mixture of 350 torr CO, 350 torr N2 and 20 torr H2O provided by an under layer of liquid water [35]. A transmission electron microscopy (TEM) image of the dried irradiated products, scaled at 0.5 μm, shows aggregated particles (Figure 2 in [35]). “Following irradiation, products were recovered in 5 mL of pure water and subsequently freeze dried.” The approximately 0.3 mg of yellow-brown residue was pyrolyzed in helium at 765 °C for 10 s and then analyzed with gas chromatography–mass spectrometry (GC-MS) and selected ion-mass chromatography, (SIM). The most intense peaks of the gas chromatogram correspond to urea ((NH2)2CO), acetamide (CH3CONH2), 2-butanamine (C2H5CH(NH2)CH3), guanidine ((NH2)2C = NH), and to the branched cyclic compounds dimethylpyrazine (C6H8N2), imidazole or pyrrazole (C3H4N2), 2-furanone (C4H4O2), pyridinecarbonitrile (C6H4N2), ethenylpyridine (C7H7N), 1H-pyrrole-3-carbonitrile (C5H4N2), methylpyrimidine (C5H6N2), aniline (C6H7N), benzonitrile (C6H5CN), styrene (C8H8), etc. A list of 36 identified compounds is given by Takano et al. [35].
The same irradiation experiment was conducted in 2012 by Kurihara et al. [36]. An aqueous solution of the irradiated products was injected in a flow reactor at temperatures of 150, 200, 250, 300, 350, and 400 °C and 25 MPa and quenched in cold water at 0 °C. Amorphous aggregates 10 μm in size started to form at 200 °C and were mainly observed at 250 °C and above, with larger-sized aggregates at 300 °C and above. For the 300 °C products, the carbon X-ray absorption near-edge structure (XANES) and the nitrogen XANES spectra, recorded at the Lawrence Berkeley National Laboratory, show peaks of aromatic carbon and imine that did not appear in the room temperature products. Both 300 °C and room temperature spectra show the peaks of nitrile, carbonyl in amide, carbonyl in ester, amide, or amino groups. After acid hydrolysis high performance liquid chromatography, (HPLC) was conducted for amino acid observation. Glycine was the predominant amino acid. It is notable that in the above experiment the irradiated products formed insoluble aggregates when located in flowing water with temperature and pressure within the domain of high subcritical water.
In 2012, Takano observed the dried yellow-brown irradiated products, with scanning electron microscopy (SEM) and atomic force microscopy (AFM). The SEM image, scaled at 1 μm, shows micro- and sub-microstructures including filaments and compacted spheres. Chemical analyses were conducted on the acid hydrolyzed fraction obtained at ambient temperature. They show a great variety of amino acids and a racemic mixture of D,L-alanine, which proves the absence of biotic contamination. The analyses are introduced and discussed by Bassez in [37].
Carbon monoxide was also used in 2012 by Pizzarello in an air evacuated mixture of CO, NH3, and H2 at 370 °C to synthesize amino acids [38] and in 2003 by Hill and Nuth in a mixture of CO, N2, and H2 at 300 °C to synthesize precursors of amino acids [39], as described in [7]. In these two experiments, the excitation source is not of the cosmic type, such as particles of matter or interaction. They were conducted at 300 °C and 370 °C and followed the Sabatier–Senderens/Fischer–Tropsch and Haber–Bosch reactions.
An article published by Weiss et al. in 2018 reports thermal stability of amino acids through experiments on their decomposition under inert atmosphere up to 320 °C [40]. Eight amino acids (glycine, cysteine, aspartic acid, asparagine, glutamic acid, glutamine, arginine, and histidine) decomposed with the formation of gases, mainly H2O, less NH3, almost no CO2, and residues rich in peptide bonds. The “liquid or solid residues are lactams and heterocyclic compounds with 5- or 6- membered non- (or only partially) aromatic rings, containing one or two nitrogen atoms (pyrrolidines, piperidines, pyrazolidines, piperazines)”.
Consequently, as demonstrated by the above-described experiments, organic functional groups that are necessary for the chemistry of the components of life can form in gas mixtures of CO, N2/NH3, and H2/H2O in anoxic high subcritical conditions and in the same gas mixtures irradiated at ambient temperature by cosmic type radiations such as gamma rays. The synthesized products are peptide-like molecules that form amino acids after acid hydrolysis. Since fluid inclusions inside rocks are closed thermodynamic systems that permit concentration of the molecules H2O, H2, CO2, and N2, a hypothesis for the synthesis of the components of life based on the above experiments has been proposed [7]. When water is enclosed in cavities or inclusions at high subcritical conditions, CO can be synthesized. Macromolecules essential for the components of life can form afterwards, as described above, either with heat or through excitation with gamma rays from rocks that contain radioactive elements and are located in the vicinity of the inclusions.
Therefore, considering the five processes described above, water that is basic (pH ~9.5–14) and high subcritical (T ~300–350 °C, P ~10–25 MPa, density ~700–600 kg/m3) appears to permit the transformation of rocks that contain ferrous silicates to form ferric minerals and associated biological molecules in the process of geobiotropy. Biological molecules form when CO, N2/NH3, and H2/H2O are present. If Precambrian molecules can still be observable today, and if the 2015 Milesi experiment showing the hydrolysis of siderite into magnetite is confirmed, biological molecules can be found in geological terrains with ferric iron (for production of H2), siderite (which forms in the presence of CO2), and magnetite (a product of the hydrolysis of siderite) inside the amorphous and crystalline minerals, quartz, ferric silicates, ferric oxides, and siderite.
The search for molecules of life in the universe is transferred to a search for the association of the following minerals; amorphous silica and quartz, amorphous and crystalline ferric silicates, and ferric oxides including goethite, hematite, and magnetite associated with siderite. Minerals without siderite are a proof that carbon dioxide was not present. They should not show inclusions with organic matter. Anoxic alkaline high subcritical water seems to be an essential component for the synthesis of ferric minerals in anoxic conditions and the concomitant synthesis of components of life inside cavities and inclusions located within rocks. It is important to note that this process occurs in the absence of oxygen. The above-described five chemical processes are summarized in the concept of geobiotropy which is visualized in Figure 4 and leads to the expression “Follow the high subcritical water”. Indeed, liquid water has to be followed in order to recognize in the universe life as it exists on Earth, and high subcritical water has to be followed in order to recognize the components of life that formed prior to the emergence of life.
3.2. Formation of Ferric Minerals in Geological Terrains and on Early Earth: A Proposed Alkaline High Subcritical Water–Ferrous Silicate Rock Interaction for the Banded Iron Formations
The formation of ferric iron in high subcritical water was never evoked for the understanding of any kind of geological terrains until 2013 [2]. To my knowledge, no other article has reported that water in geological terrains behaves with the conditions called high subcritical. However, in many cases of the geological world, water can be in high subcritical conditions of temperature, pressure, and density, and induce the formation of ferric compounds. Such a plausible process is proposed below for rocks containing silicates without sulfides and located in anoxic environments. This section of the article is partly presented at the 2019, WRI-16 conference on water–rock interaction [8].
As illustrated in Figure 6, circulating water, rich in carbon dioxide and undersaturated in silica, is heated near magma chambers, rises, encounters rocks hosting ferrous iron, such as lherzolite peridotite containing fayalite, KOH, and NaOH, and becomes alkaline. When the fayalitic massif is located near the surface of the Earth, within a depth of approximately 1 km in the upper crust, the lithostatic pressure can be in the range of 10 to 25 MPa. Indeed, a rock column of about 850 m with an average density of 3 g/cm3 produces a lithostatic pressure (ρgh) of 25 MPa. If the rising water encountering fayalite has a temperature of about 300–350 °C, ferrous iron is oxidized into ferric iron, as seen above. Dissolution of the silicates fayalite and ferrosilite is enhanced because amorphous and crystalline silica dissolve well up to the critical point of water and not above, and also because silica adsorbs onto hematite ([7] and refs herein), thus lowering the silica content in the solution and inducing further dissolution of fayalite and ferrosilite to produce dissolved silica until saturation.
Thus, a kind of magmatic hydrothermal system, where form the minerals described above, can be generated with a shallow reaction chamber containing fayalite, ferrosilite, and anoxic alkaline hsubc water. Figure 5 gives an illustration of the minerals that can form in such a reaction chamber and that are nowadays observed in the Archean to early Paleoproterozoic banded iron formations. The carbonated water stagnates inside pores and spaces of the fayalitic rock, dissolving the rock and leading to minerals with increased volume. It is known that hydration and carbonation of Mg olivine result in ~44% increase in solid molar volume ([41] and refs herein). This large volume change generates stresses and strains creating cracks that increase the porosity of the rock and its permeability and consequently its reaction with hsubc water. Repeated volume-expanding reactions can thus be at the origin of episodic fracturing of the rock. “Forces generated by the volume increase should be enough to fracture peridotite” [41]. Stresses and cracks are also generated by the different rates of expansion following the different precipitation rates of the products [41,42]. Therefore, it is plausible that high subcritical water flows from linear fractures of the shallow reaction chamber into several conduits, and finally escapes on the ocean floor out of venting arcs and/or fissure eruptions, entraining minerals that are the products of the hydrolysis and carbonation of fayalite. The ejection is favored by the increase in pressure consecutive to the continuous release of H2 and by the increase in heat released as a consequence of exothermic reactions [2,3,4,5,6]. Beukes and Gutzmer, in 2008, showed stratigraphic and sedimentology similarities and drew a correlation diagram between late Neoarchean and early Paleoproterozoic strata in the South African Transvaal and Australian Hamersley basins. They proposed that a combined Transvaal-Hamersley basin existed circa 2.5 Ga ago [43]. The separation through tectonic movement occurred with a divergent move that increased the process of thinning the Earth’s crust and certainly helped the conduits proposed above to traverse more easily. Deposits of ferric oxides and ferric silicates, crystalline and amorphous silica, and siderite can accumulate on the ocean floor. Sedimentation and compaction can then lead to banded layers, as proposed in the literature.
In the case the interacting high subcritical water does not contain carbon dioxide, no siderite forms and consecutively no magnetite. Therefore, when ferric oxides without magnetite are observed in geological terrains, one conclusion can be that the magma underlying the reaction chamber did not release CO2. However, magnetite is known to form in laboratory experiments at temperatures above 400 °C [44]. Thus, the magma may not degaze CO2 and the observed magnetite originated from thermal transformation of goethite at temperatures ~400–685 °C and is not a primary product.
The above hypothesis to explain the formation of ferric iron in a kind of magmatic hydrothermal system with high subcritical water interacting with fayalite/ferrosilite can be applied to the genesis of banded iron formations and reinforces the idea of hydrothermal activity suggested by Barley et al. in 1997 [45]. “A large igneous province, comprising >30,000 km3 of dolorite, basalt, rhyolite, accompanied deposition of a Hamersley Province BIF 2449 ± 3 million years ago. This observation indicates that Hamersley BIFs formed during a major tectono-magmatic event…Thus, the largest Paleoproterozoic BIFs, rather than simply reflecting a gradual increase in the oxygen content of the oceans during a period of tectonic quiescence, are more likely to have formed as a result of an increased supply of suboxic iron- and silica-rich sea water upwelling onto continental shelves during a pulse (or pulses) of increased submarine magmatic and hydrothermal activity.“
As shown in Table 1, the density, also called volumic mass or mass per unit volume, of the products of hydrolysis and carbonation of ferrous rocks is very different, and consequently induces inhomogeneous flows inside the conduits. It is noticeable how the relative density of hsubc water differs from liquid water at 25 °C. The value of 0.7–0.6 g/cm3 is educed from the Cook and Olive diagram on density as a function of T and P (Figure 2 in [21]). Thus, different densities of the ascending compounds, and also the length and shape of the conduits and the properties of water, may produce inside the ascending fluid, self-ordered convective flow structures, called dissipative structures, which continuously dissipate and redevelop. Intertwined columnar flows can most probably form, each filled with hsubc water containing minerals with specific densities. Banded and circular textures may thus arise inside the conduits. In the future, it would be interesting to model such flows. The crystallized and amorphous minerals described above are ejected from the conduits, fall on the ocean floor, and form layers, as in Figure 2a in [7], where micromillimeter-size strata of quartz and siderite were observed in a thin sample of the 899 m long BARB3 ICDP drill core. Figure 3 and Figure 4 in Haugaard et al. 2016 show the same kind of microbands for the Joffre banded iron formation [46]. Figure 3 shows layers of magnetite, chert (silica), hematite, and riebeckite. Figure 4 shows ankerite, which is a carbonate with the formula Ca(Fe2+,Mg)(CO3)2, mixed with chert and magnetite, layers of chert and magnetite, and layers of magnetite. In order to propose the formation of magnetite from the hsubc water hydrolysis of ankerite, it would be interesting to proceed to laboratory experiments analogous to the hydrolysis of siderite [27]. The ~2.45 Ga old Joffre BIF is a member of the Brockman iron formation in the Hamersley group of the Mount Bruce Supergroup in the Hamersley basin of the Pilbara craton in Western Australia [43]. The ~3.4 Ga old Buck Reef Chert overlies the volcanic rocks of the Hooggenoeg Formation in the Barberton Greenstone Belt, South Africa [47].
Therefore, the ferric minerals observed today in geological terrains, may have originated from rocks containing ferrous silicates and can be explained by the interaction between the ferrous silicate rock and the water, which is anoxic, alkaline, and high subcritical.
3.3. The Case of Enceladus
Enceladus, one of Saturn’s moons, has been proposed by the NASA Roadmap to Ocean Worlds, (ROW) as a high-priority body in search-for-life missions [48]. In 2019, the roadmap states: “Observations by the Cassini spacecraft have demonstrated that …(Enceladus) emits more energy than theoretical models predicted.” (§ 3.1 in [48]). A plausible source of energy is described below in Section 3.3.2, and was suggested in 2017 without development (section on geobiotropic signatures in [5]): “This scenario that I proposed earlier can apply to different kind of geological sites: meteorites, hydrothermal vents, the surface of the Jupiter’s moon Europa and the surface of the Saturn’s moon Enceladus, underneath their ocean, and also perhaps Pluto…”.
3.3.1. Composition of the Plume and Structure of Enceladus
The Cassini spacecraft was launched on 15 October 1997, arrived in the Saturn system on 30 June 2004, and finished its journey on 15 September 2017. Many articles have reported observations of the plumes and the interior structure of Enceladus, including a very recent one by Sekine et al. [49], which was published in February 2019 with around 50 references. A review conference on the search for life in the universe given in January 2013, with 61 references, cites some articles and the references therein for descriptions of the plumes (pp.66–68 in [50]). The composition was proposed by Waite et al. in 2009 to be dominated by water vapor with abundances of CO2, CH4, C2H2, NH3, and H2CO resembling those in comets, elevated abundances of CH3CHO and HCN compared to comets, and lower amounts of H2S and CH3OH than those in comets. C3H6, C4H2, C4H4, C4H8, C6H6, probably 40Ar, and a species of mass 28 were also described [51]. In 2011, an Oort cometary D/H of 3x10⁻⁴ was reported [52]. A small amount of H2 and CO was suggested to be produced through an interaction with the titanium of the ion neutral mass spectrometer (INMS) chamber [51,52], while in 2017, during the final Cassini flyby of Enceladus (E21), Waite et al. used the open source neutral beaming (OSNB) mode of the INMS, which permitted the detection of H2 from Enceladus above the background noise [53]. Sodium salts were identified by Postberg et al. in 2009 in Saturn’s E-ring grains, NaCl, NaHCO3, and Na2CO3, together with a small amount of K+ [54]. This is consistent with the 2007 Zolotov prediction of “an early ocean (which) was an alkaline Na+ -Cl− -HCO3− solution” [55].
In 2015, Glein et al. reported a pH of ~11–12 for the ocean using a thermodynamic model of carbonate speciation [56]. Hsu et al. [57] and Sekine et al. [58] reported analyses of nanometer-sized Saturnian dust particles, the “so-called stream particles”, with 32 selected mass spectra from Cassini’s cosmic dust analyzer (CDA). The ions O+ and Si+ ions produced signals of almost equal intensity, followed by the Na+/Mg+ line. They concluded that the particle composition agreed best with silica, and they “interpret these grains as…SiO2 (silica) particles, initially embedded in icy grains emitted from Enceladus’ subsurface waters and released by sputter erosion in Saturn’s E ring”. Laboratory experiments were conducted, mixing orthopyroxene MgSiO3 and powdered olivine Mg1.8Fe0.2SiO4 with a ratio of 7:3 by weight in an aqueous solution of NH3 (1.1 mol/kg H2O) and NaHCO3 (360 mmol/kg H2O). Pressure was 400 bar, and temperature was 300 °C and from 120 °C to 200 °C. They observed silica nanoparticle formation by cooling the fluid samples collected in the experiments at 300°C [57,58]. In 2018, Postberg et al. [59] published observations of organic macromolecules including hydrocarbons and aromatic molecules, water cluster cations of the form H3O(H2O)n+, and sodium-water clusters Na(H2O)n+: “CO is the dominant fragment species at 28u and a N-bearing fragment (C2H3N) might be present”. In 2019, Combe et al. presented the first map of CO2 at the surface of Enceladus, using the 4.26 µm band. They write: “CO2 is reliably detected mostly in the South Polar Region…is consistent with an endogenic origin controlled by tectonics” [60]. Guzman et al. developed “two scenarios to predict the concentration of amino acids in the plume” considering glycine, serine, α-alanine, α-aminobutyric acid, and isovaline, an abiotic model assuming the composition of a comet and a biotic one assuming the composition of the deep ocean water on Earth [61].
Reports on heat flow, gravity field, tidal forces, and a global or regional ocean are also abundant. For instance, using the data on thermal emission obtained with the Cassini composite infrared spectrometer (CIRS), the heat flow from Enceladus’ s south polar region was first estimated to be 5.8 ± 1.9 GW by Spencer et al. in 2006 [62]. In 2011, Howett et al. reported that “Higher resolution FP3 (600–1100 c−1) observations in 2008 showed that thermal emission is concentrated along the length of all four tiger stripes” and that the 2008 observations with the 10–600 cm−1 (FP1) detector led to the higher heat flow estimate of 15.8 ± 3.1 GW. “The increase (is) attributed to the presence of a low-temperature component radiating at FP1 wavelengths but not significantly at FP3 wavelengths” [63]. In 2013, Spencer et al. calculated the total power radiated from Enceladus’s tiger stripes to be 4.2 GW (2.7 GW and 1.5 GW from the high and low temperature components) “to which should be added 0.5 GW of plume latent hat and possible interstripe emission” [64].
In 2013, Hedman described that the brightness of the plume was greater at the apocenter of Enceladus with respect to Saturn than at the pericenter and was related to the tidal forces, which induce tension of the fissures at the apocenter and compression at the pericenter, thus changing the width of the conduits [65]. Studies of the gravity field of Enceladus and its asymmetry were reported by Iess et al. in 2014 using Doppler data from the spacecraft flybys. Their results “indicate the presence of a negative mass anomaly in the south-polar region, largely compensated by a positive subsurface anomaly compatible with the presence of a regional subsurface sea at depths of 30 to 40 km and extending up to south latitudes of about 50°” [66]. In 2015, McKinnon proposed a global ice shell of ~50 km that thins to ~30 km at the South Pole [67]. In 2016, constraining the unknown core and shell densities within the ranges of 2000 to 3300 kg/m3 for the core and 700 to 930 kg/m3 for the ice shell, and considering the measured physical libration of Enceladus, Thomas et al. concluded that “the subsurface liquid feeding the south polar jets is part of a global subsurface ocean” [68]. Cadek et al. reported a core radius of ~180–185 km, an ocean density at least of 1030 kg/m3, and an ice shell of 18–22 km, with less than 5 km at the South Pole [69]. The models vary in results and propositions, showing the need for an ocean worlds program as proposed by Lunine in 2017: “there is strong evidence that ocean material has been directly sampled by mass spectrometry in a plume of gas and ice emanating from fractures in the south polar region of that moon (Enceladus)” [70].
3.3.2. A Plausible High Subcritical Water-Ferromagnesian Silicate Rock Interaction on Enceladus
Enceladus emits high levels of energy and the exact heating processes are currently under debate. As described in Section 3.3.1., the total power radiating from the tiger stripes appears to be 4.2 GW. It should be noted that high levels of energy are also produced by hydrothermal vents on Earth. In 2004, Jean-Baptiste et al. wrote: “The 3He/4He ratio and helium concentration have been measured in the vent fluids and the dispersing plume of the Rainbow hydrothermal site, on the Mid-Atlantic Ridge (MAR)…The scaling of the heat flux emitted by the Rainbow site to that of 3He, using the 3He/heat ratio measured in the hydrothermal fluids (9.3 ± 2 × 10⁻¹⁸ mol/J) indicates a heat output of 1320 MW” [71]. Earlier estimates of 1000 MW to 5000 MW were reported in 2001 by Thurnherr and Richards [72]. In 2016, Mügler et al. noted that: “This high heat output is in the same range as those of the Lucky Strike site: 3800 ± 1200 MW (Jean-Baptiste et al. 1998) and of the TAG site: 1810 ± 693 MW) (Wichers et al. 2005), both on the MAR” ([73] and refs herein). Therefore, a heat source analog to the heat produced in hydrothermal vents on Earth can be envisioned for Enceladus.
In a study by Bassez in 2017 [5,6], the thermodynamic functions for 13 anoxic elementary reactions of oxidation and carbonation of ferromagnesian silicates, which compose the global serpentinization process and have been proposed since 2013 [2] were reported in detail and applied to geological terrains including hydrothermal vents. The enthalpy of serpentinization of (Fe0.5Mg0.5)2SiO4 olivine is calculated by summing the enthalpies of the elementary reactions, to be ΔrH° = −90.3 kJ/ mol of (Fe0.5Mg0.5)2SiO4 olivine, which corresponds to ΔrH° = −524.35 kJ/kg of (Fe0.5Mg0.5)2SiO4 olivine and the following global equation.
The enthalpy of serpentinization of (Fe0.5Mg0.5)SiO3 pyroxene is calculated to be ΔrH° = −43.98 kJ/mol of (Fe0.5Mg0.5)SiO3 pyroxene, which corresponds to ΔrH° = −378.61 kJ/kg of (Fe0.5Mg0.5)SiO3 pyroxene, and the following global equation.
The high values for the heat of serpentinization arise from the carbonation reactions, which are highly exothermic, and from the exothermic hydrolysis reactions of the Mg-endmembers. These exothermic reactions can induce the endothermic hydrolysis of the Fe-endmembers, fayalite, and ferrosilite, which can be called the redox reaction for the formation of H2 and ferric iron. The redox equation does not produce heat and is not the driving reaction for the serpentinization process. The thermodynamic functions in [5,6] are calculated for an equilibrium state, as it is the case for the experiments in 2015 cited in Section 3.3.1 [57,58] and Enceladus’ s ocean, which is trapped between the core and the ice crust. H2 is produced during the hydrolysis of the Fe-endmembers and the carbonate siderite and requires high subcritical water, ~300–350 °C, ~10–25 MPa, and ~700–600 kg/m3 density, as demonstrated in Section 3.1 and illustrated in Figure 4a and Figure 5. Quartz and amorphous silica are produced during the carbonation of the Mg-endmembers and the hydrolysis of the Fe-endmembers and are produced in higher quantities in hsubc water because of their higher dissolution in this domain. The difference in hsubc water–rock interaction on Enceladus and on early Earth for the formation of the BIFs is that only ferrous silicates and no magnesian silicates are observed in the BIFs. Thus, the interaction concerns only ferrous silicates for the BIFs but may concern ferromagnesian silicates on Enceladus. Carbonation and hydrolysis of magnesian silicates being more exothermic, more heat can be produced (Table 1 in [5,6]).
The serpentinization process, which has been decomposed into 13 elementary reactions and studied with thermodynamic functions, redox equations, and the solubility of SiO2, led to the conclusion about the importance of considering water in the high subcritical domain and explains why silica particles were not observed in the 2015 experiments [57,58] at either 120 °C or 200 °C. Since these temperatures are below the hsubc domain, SiO2 dissolves less and consequently drives fewer Fe++ ions from the fayalite and ferrosilite into solution than in hsubc water. H2 is not released, since the anoxic oxidation of ferrous iron requires hsubc water. Furthermore, it is known in the chemistry laboratory that NaHCO3 decomposes entirely into Na2CO3, CO2, and H2O at 270 °C. Thus, no CO2 dissolved in the solutions at 120 °C and 200 °C and there was no carbonation. As a consequence, the experiments reported by Hsu et al. [57] and Sekine at al. [58] demonstrated that SiO2 nanoparticles require 300 °C at 40 MPa to form. These are the conditions of high subcritical water. The other ranges of T and P, at 120 °C and 40 MPa, and 200 °C and 40 MPa, are outside the range of hsubc water (Figure 3 in the present article). These experiments validate the conclusion theoretically proposed since 2013 and confirmed in 2018 with the study of SiO2 solubility, that ferrous iron oxidizes into ferric iron in anoxic alkaline high subcritical water, with production of H2 and SiO2 [2,3,4,5,6,7,8]. The specific domain of water called high subcritical, with much lower densities, appears to be required for the formation of ferric minerals in anoxic conditions and the synformation of molecules of life as conceptualized in the term geobiotropy.
Therefore, I propose that in the Enceladus regional ocean at 300 °C, the dissolved CO2, which may have originated from NaHCO3 or another source, reacts with the ferromagnesian silicates olivine and pyroxene inside the core rock to form siderite and magnesite with the release of SiO2 and high heat. Hydrolysis of the Mg-silicates also proceeds to form serpentine. There is enough heat to induce endothermic hydrolyses of the Fe-endmembers, which leads to H2 and SiO2. The conditions of water being high subcritical, the CO2 is hydrogenated by H2 and forms CO, as described in Section 3.1. Both carbon dioxide and carbon monoxide react with H2 to form saturated and unsaturated hydrocarbons, aromatic molecules, and oxygenated organic molecules in reactions that may be strongly exothermic [30,31] during FTT synthesis or Sabatier–Senderens/Fischer–Tropsch and Haber–Bosch reactions. These exothermic reactions for the synthesis of organic molecules supplement the heat available from the serpentinization process. It is worth noting that acetylene (C2H2) is observed in the plume of Enceladus [51] and that it has never been synthesized during FTS [30,31], nor during the gaseous mixture of CO, N2, and H2O irradiated by gamma rays or protons [33,34,35,36,37]. However, it is known in the chemistry laboratory that the ionic carbide, calcium carbide, has a strong exothermic reaction with water, for instance in tubes that are evacuated to highly suboxic conditions, such as a pressure of ~0.01 atm. Acetylene is produced. It is known that CaC2 also reacts with Mg in highly exothermic reactions. The covalent carbide, silicon carbide (SiC) is observed in presolar grains inside meteorites and is considered a remnant from the early times of the solar system ([74] and refs herein). Consequently, it is possible to hypothesize that some calcium carbide may be present inside Enceladus, contributing to the production of heat and acetylene.
The south polar region of Enceladus can thus be a crucible of highly exothermic reactions producing high heat, H2, SiO2, saturated and unsaturated hydrocarbons, and the organic oxygen and nitrogen molecules such as C2H3N, which is observed in the plume [59] and may correspond to CH3CN, the precursor of amino acids detected in Hill and Nuth’s experiment [39]. The high pH of ~9.5–14 where oxidation occurs as described in Section 3.1., fits the reported pH of 11–12 [56] that was calculated with a model based on the carbonate species CO2, HCO3−, CO32−, dissolved in liquid water of 1000 kg/m3 density. That pH value may change if the carbonate species are considered dissolved in liquid hsubc water with a density of ~650 kg/m3 and a different structure than liquid water at 4 °C. However, pH is alkaline.
In order to trigger the exothermic reactions of carbonation and the hydrolysis of the Fe-endmembers, water needs to be in the liquid state and heat is required. Short-lived radionuclides have important consequences for planetesimal heating. Their origin is highly debated and was reworked in 2008 by Gounelle and Meibom [75]. In 2013, Malamud and Prialnik [76] proposed that the heat produced by radionuclides can be high enough to set water in the liquid state. Figures 2 and 6 in [76] show that, within calculations uncertainties, temperatures just above 0 °C can be reached with a model using the short-lived 26Al and 60Fe and the long-term 40K, 238U, 235U, and 232Th radionuclides, and 150 °C with the addition of ammonia in water. It is to be noticed that phase diagrams show that water is in the liquid state just above 0 °C for pressures between ~1 kPa and ~500 MPa and between ~500 kPa and 3 GPa at 150 °C. Considering the following energy decay values, in units of x 1013 J/kg:1.11 for 26Al, 1.91 for 235U, 1.82 for 238U, 1.68 for 232Th, 0.166 for 40K, and 0.516 for 60Fe (Table 1 in [76]), Travis and Schubert showed in 2015 that the temperature in the core could have reached a peak value of 900 °C during the first ~100 My of Enceladus history and then decreased abruptly (Figure 2 in [77]). Therefore, water may have been set in the liquid state with radiogenic heating during early Enceladus, and then started to interact with the ferrous silicate rocks during reactions that were exothermic and produced H2, which in turn reacted with CO2 to form CO, which in turn reacted with H2 in highly exothermic reactions to produce diverse organic molecules as a function of the CO/H2 ratio and the Fe or Cu or Ni environment.
As described in Section 3.1, water–rock interactions for the anoxic production of H2 should proceed at T ~300–350 °C and P ~10–25 MPa. With the parameters listed in Table 3, the depth where water at 300 °C can be under the high subcritical pressure of 10 MPa is calculated below. As noticed by Travis et al. [77] “the low density of Enceladus (~1608 kg/m3) suggests that a considerable fraction of Enceladus’ mass consists of H2O”. Using this value 1608 kg/m3 for the mean density of Enceladus and 35 km for the thickness of the ice shell, the core density is calculated to be ~2000 kg/m3, which is less than half the density of fayalite, 4400 kg/m3 (Table 2). The present method of calculation reproduces the values for core density of 1700 kg/m3 with an ice crust of thickness ~10 km computed in [78]. The core is porous and water can percolate easily. It was proposed that “deep hydrothermal circulation (is) driven by remnant heat of the early stages of Enceladus’ evolution stored in the deep core” (text and Figure 4 in [58]). With the calculated value of ~2000 kg/m3 for the core density, the parameters listed in Table 3, and a pressure of 10 MPa expressed by g (ρice hice + ρw hw + ρcore hcore), the depth where hsubc water of ~700 kg/m3 density is submitted to the pressure of 10 MPa is calculated to be ~28 km. Thus, high subcritical conditions of 300 °C and 10 MPa can be reached in Enceladus. It is therefore suggested in the present article, that a water cycle can form as illustrated in Figure 7. A chosen ~1 km thick layer of hsubc water interacts with the rock and is ejected within conduits, drugging the products and forming ice in the plume. Most of the ice falls on the surface of Enceladus. The bottom of the ice crust becomes heated and enters into interaction with the rock. The water that is lost from the plume leaves Enceladus to form the Saturn’s E-ring. The cycle may have started years ago and may continue for years until all water enters the E-ring or all Fe,Mg-silicates are carbonated or hydrolyzed.
Another important specificity of high subcritical water is the production of magnetite and H2 through the hydrolysis in hsubc water of the carbonate siderite, as described in the above Figure 4a and Figure 5. The quantity of H2 emitted from siderite hydrolysis supplements the production of H2 through the oxidation of ferrous iron. The molecular hydrogen detected in Enceladus’s plume can thus find its origin in the reactions of hydrolysis by high subcritical water of ferrous silicates and ferrous carbonate.
The deposit of magnetite on the surface of the rocky core, where the hydrothermal reactions proceed, may have consequences on the rotation of Enceladus. Indeed, magnetite has a high density, 5.18 g/cm3, higher than fayalite (4.4 kg/m3) and siderite (3.96 kg/m3) from which it originates (Table 1). It would be interesting to calculate the amount of magnetite that can change the center of gravity of Enceladus and bring a noticeable correction to the calculated rotation. Furthermore, the Saturn’s magnetic field was recently described by Dougherty et al. [79]. Magnetite may probably align within the lines of the magnetic field forming linear zones at the origins of magnetic anomalies. Within the frame of data that are accessible to my studies, it appears that the tiger stripes are aligned along the magnetic field lines of Saturn. More observational data and theoretical models are required to measure the magnetic field of the South Pole and predict the plausible diverse contributions from continuous magnetite deposits.
4. Conclusions
Up to now, the main proof that living microorganisms existed on early Earth, has been based on their actions on ferrous iron, through their direct oxidation of FeII or their production of oxygen, which allows indirect oxidation, leaving signatures such as oxygen and ferric minerals. It is specified in the present article that ferric minerals can form during the evolution of ferrous silicates rocks while interacting with high subcritical water and consequently during the evolution of planetary objects. The demonstration that ferric minerals form during high subcritical water–ferrous silicate rocks interaction does not require the presence of microorganisms, meaning that the date of the appearance of oxygen in the atmosphere and the emergence of the O2-producing and FeII-oxidizing microorganisms may be postponed.
The endothermic anoxic oxidation of ferrous silicates in alkaline high subcritical water proposed in the present research is most probably the process that produced the crystalline and amorphous silica and ferric minerals in the subsurface of early Earth and extraterrestrial objects as it possibly currently occurs on Enceladus. The interaction between hsubc water and Fe–silicate rocks helps to understand the origin of the minerals currently observed on Earth in the Archean to early Paleoproterozoic banded iron formations and the associated molecules of life that may be discovered inside inclusions hosted in amorphous silica and quartz, amorphous and crystalline silicates, hematite, siderite, and magnetite. The BIFs currently observed and mineralogically analyzed, do not contain the products of carbonation neither hydrolysis of magnesian silicates. Instead, the interaction between hsubc water and Fe, Mg-silicate rocks helps to understand the origin of the observed heat, pH, H2, SiO2, and organic molecules on Enceladus. Currently, no observation on Enceladus can predict the absence of magnesian silicates, and no observation can predict the presence of magma like on Earth. As a consequence, the high heat produced by the carbonations of the magnesian silicates may be necessary to set the water in the hsubc domain.
Therefore, the possible presence of high subcritical water in the subsurface of Earth and extraterrestrial objects allows to constrain the temperature, pressure, density, and pH required for H2, SiO2, ferric minerals, and organic molecules production, together with the depth inside the rocky cores where the alkaline hydrothermal interaction occurs. As a consequence, the physicochemical properties of alkaline high subcritical water, T ~300–350 °C, P ~10–25 MPa, ρ ~700–600 kg/m3, and pH ~9.5–14, have to be considered in the next models that will be developed for early Earth, Enceladus and other extraterrestrial objects such as ocean worlds and icy moons.
The detailing of the serpentinization process into 13 elementary reactions associated with the studies of the thermodynamic functions for each reaction, the Eh-pH diagrams for the Fe–H2O system, the solubility diagrams of SiO2, and the results of published laboratory experiments, show the importance of considering water in the high subcritical domain and lead to the following seven new advancements; (1) the production of ferric iron and ferric silicates in anoxic alkaline high subcritical conditions of water; (2) the production of H2 from the hydrolysis of ferrous silicates in anoxic alkaline hsubc water and from the ferrous carbonate siderite in hsubc water; (3) the production of amorphous and crystalline SiO2 in each reaction of carbonation of the Fe- and Mg- endmembers of olivine and pyroxene and during the hydrolysis of the Fe-endmembers (amorphous silica dissolving more in hsubc water than quartz, with a ratio of ~2); (4) the production of the ferric oxide hydroxides goethite/lepidocrocite and the oxide hematite, and not magnetite, as primary minerals of the hydrolysis of the ferrous silicates in anoxic alkaline hsubc water; (5) the production of magnetite in hsubc water, when CO2 and thus siderite are present; (6) the production of amorphous and crystalline ferric silicates, such as greenalite and minnesotaite, in anoxic alkaline hsubc water; and (7) the awareness that the production of CO, a necessary molecule for the formation of molecules of life, proceeds by the action of hsubc water on CO2. These advancements can be finalized in the expression “follow the high subcritical water”, which shows the importance of considering water at high pH ~9.5–14, and in the domain located near the supercritical state and called high subcritical, ~300–350 °C, ~10–22 MPa, and ~700–600 kg/m3 density, for the formation of ferric amorphous and crystalline minerals and the synformation of molecules of life.
Therefore, the expression “follow the high subcritical water” seems appropriate for the search in the universe for minerals that are the products of alkaline hsubc water–rock interactions and the synformation of the components of life, while the expression “follow the water” is appropriate for the search for life and the action of life on minerals. The observation of ferric minerals in geological terrains does not necessary lead to the conclusion that life existed, but can lead to the conclusion that hsubc water was present at those locations. The specific conditions of waters that are called high subcritical leave signatures inside minerals that are produced during high subcritical water–rock interactions. In other words, the interaction of anoxic alkaline high subcritical water with rocks that contain ferrous silicates composes a mineralogical and biological oeuvre for the synthesis of ferric minerals and components of life. From the numbers emerges the form. Observations of these mineral signatures inside rocks lead to the conclusion that components of life may have formed at those locations, thus preceding the emergence of life. We can find in the high subcritical water–ferrous silicate rock interactions the continuity hypothesized by Stéphane Le Duc in 1910 [80], “La doctrine de l’évolution qui s’est donnée pour mission de reconstituer tous les anneaux de la chaîne des êtres…ne peut pas laisser la chaîne brisée entre le monde vivant et le monde minéral; là encore la chaîne est continue, le passage est graduel…”(p.193 in [79]), words that M. Russell remembered in 2010, “the chain of life is…a continuous one, from the mineral at one end to the most complicated organism at the other” [18]. The present article is an attempt to demonstrate that anoxic alkaline water in the high subcritical domain constructs the continuity from rocks to life in the process of geobiotropy, which means the evolution from rocks to life.
Funding
This research received funding facilities from the Frontier Research in Chemistry Foundation, University of Strasbourg, France.
Acknowledgments
This article is issued from the oral presentation I had the opportunity to give at the EANA, European Astrobiology Network Association, Conference in Berlin on 24–28 September 2018. I sincerely like to express my kind recognition to the attentive and passionate researcher Lena Noack, Free University of Berlin, Germany and to the scientific organizing committee. I am also grateful to the skilled and highly knowledgeable researcher Alan Schwartz, editor-in-chief of the journal Origins of Life and Evolution of Biospheres, for his advises concerning Figure 5, and to the anonymous reviewers who helped the improvement of the article. My sincere gratitude is also offered to the members of the governance, the dynamic team, the talented researchers, and Their Excellencies, of the Frontier Research in Chemistry Foundation at the University of Strasbourg, France, for their positive consideration of my results and for offering funding possibilities.
Conflicts of Interest
The author declares no conflicts of interest.
References
- Hubbard, S.G.; Naderi, F.M.; Garvin, J.B. Following the water, the new program for Mars exploration. Acta Astronaut. 2002, 51, 337–350. [Google Scholar] [CrossRef]
- Bassez, M.-P. Geochemical origin of biological molecules. EGU’2013, PS8.1, Oral 9 April 2013, Vienna, Austria. Geophys. Res. Abstr. 2013, 15, EGU2013-22. [Google Scholar]
- Bassez, M.-P. Water, Air, Earth and Cosmic Radiation. Orig. Life Evol. Biosph. 2015, 45, 5–13. [Google Scholar] [CrossRef] [PubMed]
- Bassez, M.-P. Geobiotropy. In Proceedings of the 47th Lunar Planetary Science Conference 2016, Abstract. 1853. LPSC’2016, Session 804, The Woodlands, TX, USA, 21–25 March 2016. [Google Scholar]
- Bassez, M.-P. Anoxic and oxic oxidation of rocks containing Fe(II)Mg-silicates and Fe(II)-monosulfidesas source of Fe(III)-minerals and hydrogen. Geobiotropy. Orig. Life Evol. Biosph. 2017, 47, 453–480. [Google Scholar] [CrossRef] [PubMed]
- Bassez, M.-P. Ferromagnesian silicate and ferrosulfide rocks as a source of magnetite and hydrogen. Procedia Earth Planet. Sci. 2017, 17, 492–495. [Google Scholar] [CrossRef]
- Bassez, M.-P. Water near its supercritical point and at alkaline pH for the production of ferric oxides and silicates in anoxic conditions. A new hypothesis for the synthesis of minerals observed in Banded Iron Formations and for the related geobiotropic chemistry inside fluid inclusions. Orig. Life Evol. Biosph. 2018, 48, 289–320. [Google Scholar] [CrossRef] [PubMed]
- Bassez, M.-P. High subcritical water–rock interaction for the formation of ferric minerals, in the absence of oxygen, UV light and microorganisms. In Proceedings of the EDP-Science, E3S Web of Conference, WRI16 2019, Tomsk, Russia, 21–26 July 2019. In press. [Google Scholar]
- Konhauser, K.O.; Planavsky, N.J.; Hardisty, D.S.; Robbins, L.J.; Warchola, T.J.; Haugaard, R.; Lalonde, S.V.; Partin, C.A.; Oonk, P.B.H.; Tsikos, H.; et al. Iron formations: A global record of Neoarchaean to Palaeoproterozoic environmental history. Earth Sci. Rev. 2017, 172, 140–177. [Google Scholar] [CrossRef]
- Czaja, D.A.; van Kranendonk, J.M.; Beard, L.B.; Johnson, M.C. A multistage origin for Neoarchean layered hematite-magnetite iron formation from the Weld Range, Yilgarn Craton, Western Australia. Chem. Geol. 2018, 488, 125–137. [Google Scholar] [CrossRef]
- Hegler, F.; Posth, R.N.; Jiang, J.; Kappler, A. Physiology of phototrophic iron(II)-oxidizing bacteria: Implications for modern and ancient environments. FEMS Microbiol. Ecol. 2008, 66, 250–260. [Google Scholar] [CrossRef]
- Madigan, T.M. Anoxygenic phototrophic bacteria from extreme environments. Photosynth. Res. 2003, 76, 157–171. [Google Scholar] [CrossRef]
- Scholes, D.G.; Fleming, R.G.; Olaya-Castro, A.; van Grondelle, R. Lessons from nature about solar light harvesting. Nat. Chem. 2011, 3, 763–774. [Google Scholar] [CrossRef] [PubMed]
- Witzel, T.; Bassez, M.-P. Etude bibliographique de l’eau supercritique. In Report-1rst Year, IUT-Chemistry; Université Robert Schuman: Strasbourg, France, 1997. [Google Scholar]
- Bassez, M.-P. La structure de l’eau supercritique et l’origine de la vie. In Sciences et Technologies: Regards croisés; sciences pour l’ingénieur, informatique, mathématiques, biologie, biochimie, chimie; L’Harmattan: Paris, France, 1999; pp. 583–591. ISBN 2-7384-7367-9. [Google Scholar]
- Bassez, M.-P. Is high-pressure water the cradle of life? J. Phys. Condens Matter 2003, 15, L353–L361. [Google Scholar] [CrossRef]
- Bassez, M.-P. Prebiotic synthesis under hydrothermal conditions. C. R. Chimi. Acad. Des. Sci. Paris 2009, 12, 801–807. [Google Scholar] [CrossRef]
- Russell, M.J.; Hall, A.J.; Martin, W. Serpentinization as a source at the origin of life. Geobiology 2010, 8, 355–371. [Google Scholar] [CrossRef] [PubMed]
- Chivot, J. Thermodynamique Des Produits De Corrosion; Andra: Châtenay-Malabry, France, 2004. [Google Scholar]
- Timm, F.; Möller, P. The relation between electric and redox potential: Evidence from laboratory and field measurements. J. Geochem. Explor. 2001, 72, 115–128. [Google Scholar] [CrossRef]
- Cook, G.W.; Olive, P.R. Pourbaix diagrams for the iron-water system extended to high & low supercritical conditions. Corros. Sci. 2012, 55, 326–331. [Google Scholar] [CrossRef]
- Smith, R.L., Jr.; Fang, Z. Properties and phase equilibria of fluid mixtures as the basis for developing green chemical processes. Fluid Phase Equilib. 2011, 302, 65–73. [Google Scholar] [CrossRef]
- Karasek, P.; Stavikova, L.; Planeta, J.; Hohnova, B.; Roth, M. Solubility of fused silica in sub- and supercritical water: Estimation from a thermodynamic model. J. Supercrit. Fluids 2013, 83, 72–77. [Google Scholar] [CrossRef]
- Shock, E.L.; Helgeson, H.C.; Sverjensky, D.A. Calculation of the thermodynamic and transport properties of aqueous species at high pressures and temperatures: Standard partial molal properties of inorganic neutral species. Geochim. Cosmochim. Acta 1989, 53, 2157–2183. [Google Scholar] [CrossRef]
- Qafoku, O.; Kovarik, L.; Kukkadapu, K.R.; Ilton, S.E.; Arey, W.B.; Tucek, J.; Felmy, R.A. Fayalite dissolution and siderite formation in water-saturated supercritical CO2. Chem. Geol. 2012, 332–333, 124–135. [Google Scholar] [CrossRef]
- Tosca, N.J.; Guggenheim, S.; Pufahl, P.K. An authigenic origin for Precambrian greenalite: Implications for iron formation and the chemistry of ancient seawater. GSA Bull. 2016, 128, 511–530. [Google Scholar] [CrossRef]
- Milesi, V.; Guyot, F.; Brunet, F.; Richard, L.; Recham, N.; Benedetti, M.; Dairou, J.; Prinzhofer, A. Formation of CO2, H2 and condensed carbon from siderite dissolution in the 200–300 °C range and at 50 MPa. Geochim. Cosmochim. Acta 2015, 154, 201–211. [Google Scholar] [CrossRef]
- Sabatier, P.; Senderens, J.B. Nouvelles synthèses du méthane. Comptes Rendus des Séances de l’académie des Sciences 1902, 134, 514–516. [Google Scholar]
- Sabatier, P.; Senderens, J.B. Hydrogénation directe des oxydes du carbone en présence de divers métaux divisés. Comptes Rendus des Séances de l’académie des Sciences 1902, 134, 689–691. [Google Scholar]
- Anderson, R.B. The Fischer–Tropsch Synthesis; Academic Press, Inc.: Orlando, FL, USA, 1984; p. 301. [Google Scholar]
- de Smit, E.; Weckhuyse, B.M. The renaissance of iron-based Fischer–Tropsch synthesis: On the multifaceted catalyst deactivation behaviour. Chem. Soc. Rev. 2008, 37, 2758–2781. [Google Scholar] [CrossRef] [PubMed]
- Fu, Q.; Seyfried, W.E., Jr. Experimental study of abiotic synthesis processes in a hydrothermal flow system. In Proceedings of the 40th Lunar Planetary Science Conference 2009, Abstract 2504, LPSC’2009, Session 104, The Woodlands, TX, USA, 23 March 2009. [Google Scholar]
- Schlesinger, G.; Miller, S.L. Prebiotic synthesis in atmospheres containing CH4, CO, and CO2. J. Mol. Evol. 1983, 19, 376–382. [Google Scholar] [CrossRef] [PubMed]
- Kobayashi, K.; Tsuchiya, M.; Oshima, T.; Yanagawa, H. Abiotic synthesis of amino acids and imidazole by proton irradiation of simulated primitive earth atmospheres. Orig. Life Evol. Biosph. 1990, 20, 99–109. [Google Scholar] [CrossRef]
- Takano, Y.; Marumo, K.; Yabashi, S.; Kaneko, T.; Kobayashi, K. Pyrolysis of complex organics following high-energy proton irradiation of a simple inorganic gas mixture. Appl. Phys. Lett. 2004, 85, 1633–1635. [Google Scholar] [CrossRef]
- Kurihara, H.; Yabuta, H.; Kaneko, T.; Obayashi, Y.; Takano, Y.; Kobayashi, K. Characterization of organic aggregates formed by heating products of simulated primitive Earth atmosphere experiments. Chem. Lett. 2012, 41, 441–443. [Google Scholar] [CrossRef]
- Bassez, M.-P.; Takano, Y.; Kobayashi, K. Prebiotic organic microstructures. Orig. Life Evol. Biosph. 2012, 42, 307–316. [Google Scholar] [CrossRef]
- Pizzarello, S. Catalytic syntheses of amino acids and their significance for nebular and planetary chemistry. Meteorit. Planet. Sci. 2012, 47, 1291–1296. [Google Scholar] [CrossRef]
- Hill, H.G.M.; Nuth, J. The catalytic potential of cosmic dust: Implications for prebiotic chemistry in the solar nebula and other protoplanetary systems. Astrobiology 2003, 3, 291–304. [Google Scholar] [CrossRef] [PubMed]
- Weiss, M.I.; Muth, C.; Drumm, R.; Kirchner, K.O. Thermal decomposition of the amino acids glycine, cysteine, aspartic acid, asparagine, glutamic acid, glutamine, arginine and histidine. BMC Biophys. 2018, 11, 2–15. [Google Scholar] [CrossRef]
- Xing, T.; Zhu, W.; Fusseis, F.; Lisabeth, H. Generating porosity during olivine carbonation via dissolutionchannels and expansion cracks. Solid Earth 2018, 9, 879–896. [Google Scholar] [CrossRef]
- Zhu, W.; Fusseis, F.; Lisabeth, H.P.; Xing, T.; Xiao, X.; De Andrade, V.; Karato, S.I. Experimental evidence of reaction-induced fracturing during olivine carbonation. Geophys. Res. Lett. 2016, 43, 9535–9543. [Google Scholar] [CrossRef]
- Beukes, J.N.; Gutzmer, J. Origin and Paleoenvironmental significance of major iron formations at the Archean-Paleoproterozoic boundary. Soc. Econ. Geol. Rev. 2008, 15, 5–47. [Google Scholar]
- Dekkers, M.J. Magnetic properties of natural goethite: III. Magnetic behaviour and properties of minerals originating from goethite dehydration during thermal demagnetization. Geoph. J. Int. 1990, 103, 233–250. [Google Scholar] [CrossRef]
- Barley, E.M.; Pickard, L.A.; Sylvester, J.P. Emplacement of a large igneous province as a possible cause of banded iron formation 2.45 billion years ago. Nature 1997, 385, 55–58. [Google Scholar] [CrossRef]
- Haugaard, R.; Pecoits, E.; Lalonde, S.; Rouxel, O.; Konhauser, K. The Joffre banded iron formation, Hamersley group, Western Australia: Assessing the paleoenvironment through detailed petrology and chemostratigraphy. Precambrian Res. 2016, 273, 12–37. [Google Scholar] [CrossRef]
- Hofmann, A.; Karykowski, B.; Mason, P.; Chunnet, G.; Arndt, N. Barberton drilling project-Buck Reef Chert core BARB3. In Proceedings of the EGU’2013, Vienna, Austria, 7–12 April 2013; Volume 15. EGU2013-EG12227. [Google Scholar]
- Hendrix, A.R.; Hurford, T.A.; Barge, L.M.; Bland, M.T.; Bowman, J.S.; Brinkckerhoff, W.; Buratti, B.J.; Cable, M.L.; Castillo-Rogez, J.; Collims, G.C.; et al. The NASA Roadmap to Ocean Worlds. Astrobiology 2019, 19, 1–27. [Google Scholar] [CrossRef] [PubMed]
- Sekine, Y.; Shibuya, T.; Kamata, S. E Enceladus: Evidence and unsolved questions for an Ice-Covered Habitable world. In Astrobiology. from the Origins of Life to the Search of Extraterrestrial Intelligence; Yamagishi, A., Kakegawa, T., Usui, T., Eds.; Springer Nature: Singapore, 2019; pp. 1189–1220. [Google Scholar]
- Bassez, M.-P. La recherche de vie dans l’univers. In Regard vers l’Univers Conference; University of Strasbourg: Strasbourg, France, Available online: https://pod.unistra.fr/video/8916-la-recherche-de-vie-dans-lunivers and http://chemphys.u-strasbg.fr/mpb/teach/originevie.html; (accessed on 31 January 2013).
- Waite, J.H., Jr.; Lewis, W.S.; Magee, B.A.; Lunine, J.I.; McKinnon, W.B.; Glein, C.R.; Mousis, O.; Young, D.T.; Brockwell, T.; Westlake, J.; et al. Liquid Water on Enceladus from observations of ammonia and 40Ar in the plume. Nat. Lett. 2009, 460, 487–491. [Google Scholar] [CrossRef]
- Waite, J.H.; Magee, B.; Brockwell, T.; Zolotov, M.Y.; Teolis, B.; Lewis, W.S.; The INMS Team. Enceladus’ Plume Composition. EPSC Abstr. 2011, 6, EPSC-DPS2011-61-4. [Google Scholar]
- Waite, J.H.; Glein, C.R.; Perryman, R.S.; Teolis, B.D.; Magee, B.A.; Miller, G.; Grimes, J.; Perry, M.E.; Miller, K.E.; Bouquet, A.; et al. Cassini finds molecular hydrogen in the Enceladus plume: Evidence for hydrothermal processes. Science 2017, 356, 155–159. [Google Scholar] [CrossRef] [PubMed]
- Postberg, F.; Kempf, S.; Schmidt, J.; Brilliantov, N.; Beinsen, A.; Abel, B.; Buck, U.; Srama, R. Sodium salts in E-ring ice grains from an ocean below the surface of Enceladus. Nature 2009, 459, 1098–1101. [Google Scholar] [CrossRef] [PubMed]
- Zolotov, M.Y. An oceanic composition on early and today’s Enceladus. Geophys. Res. Lett. 2007, 34, L23203. [Google Scholar] [CrossRef]
- Glein, C.R.; Baross, J.A.; Waite, J.H., Jr. The pH of Enceladus’ ocean. Geochim. Cosmochim. Acta 2015, 162, 202–219. [Google Scholar] [CrossRef]
- Hsu, H.-W.; Postberg, F.; Sekine, Y.; Shibuya, T.; Kempf, S.; Horanyi, M.; Juhasz, A.; Altobelli, N.; Suzuki, K.; Masaki, Y.; et al. Ongoing hydrothermal activities within Enceladus. Nature 2015, 519, 207–210. [Google Scholar] [CrossRef]
- Sekine, Y.; Shibuya, T.; Postberg, F.; Hsu, H.W.; Suzuki, K.; Masaki, Y.; Kuwatani, T.; Mori, M.; Hong, P.K.; Yoshieaki, M.; et al. High-temperature water–rock interactions and hydrothermal environments in the chondrite-like core of Enceladus. Nat. Commun. 2015, 6, 1–8. [Google Scholar] [CrossRef]
- Postberg, F.; Khawaja, N.; Abel, B.; Choblet, G.; Glein, C.R.; Gudipati, M.S.; Henderson, B.L.; Hsu, H.-W.; Kempf, S.; Klenner, F.; et al. Macromolecular organic compounds from the depths of Enceladus. Nature 2018, 528, 564–568. [Google Scholar] [CrossRef]
- Combe, J.-P.; McCord, T.B.; Matson, D.L.; Johnson, T.V.; Davies, A.G.; Scipioni, F.; Tosi, F. Nature, distribution and origin of CO2 on Enceladus. Icarus 2019, 317, 491–508. [Google Scholar] [CrossRef]
- Guzman, M.; Lorenz, R.; Hurley, D.; Farrell, W.; Spencer, J.; Hansen, C.; Hurford, T.; Ibea, J.; Carlson, P.; McKay, C.P. Collecting amino acids in the Enceladus plume. Int. J. Astrobiol. 2019, 18, 47–59. [Google Scholar] [CrossRef]
- Spencer, J.R.; Pearl, J.C.; Segura, M.; Flasar, F.M.; Mamoutkine, A.; Romani, P.; Buratti, B.; Hendrix, A.; Spilker, L.J.; Lopes, R.M.C. Cassini encounters Enceladus: Background and the discovery of a south polar hot spot. Science 2006, 311, 1401–1405. [Google Scholar] [CrossRef] [PubMed]
- Howett, C.J.A.; Spencer, J.R.; Pearl, J.; Segura, M. High heat flow from Enceladus’ south polar regionmeasured using 10–600 cm−1 Cassini/CIRS data. J. Geophys. Res. 2011, 116, 1–15. [Google Scholar] [CrossRef]
- Spencer, J.R.; Howett, C.J.A.; Verbiscer, A.; Hurford, T.A.; Segura, M.; Spencer, D.C. Enceladus heat flow from high spatial resolution thermal emission observations. EPSC Abstr. 2013, 8, EPSC2013-840-1. [Google Scholar]
- Hedman, M.M.; Gosmeyer, C.M.; Nicholson, P.D.; Sotin, C.; Brown, R.H.; Clark, R.N.; Baines, K.H.; Buratti, B.J.; Showalter, M.R. An observed correlation between plume activity and tidal stresses on Enceladus. Nature 2013, 500, 182–184. [Google Scholar] [CrossRef]
- Iess, L.; Stevenson, D.J.; Parisi, M.; Hemingway, D.; Jacobson, J.I.; Lunine, J.I.; Nimmo, F.; Armstrong, J.W.; Asmar, S.W.; Ducci, M.; et al. The gravity field and interior structure of Enceladus. Science 2014, 344, 78–80. [Google Scholar] [CrossRef]
- McKinnon, W.B. Effects of Enceladus’s rapid synchronous spin on interpretation of Cassini gravity. Geophys. Res. Lett. 2015, 42, 2137–2143. [Google Scholar] [CrossRef]
- Thomas, P.C.; Tajeddine, R.; Tiscareno, M.S.; Burns, J.A.; Joseph, J.; Loredo, T.J.; Helfenstein, P.; Porco, C. Enceladus’s measured physical libration requires a global surface ocean. Icarus 2016, 264, 37–47. [Google Scholar] [CrossRef]
- Cadek, O.; Tobie, G.; Van Hoolst, T.; Massé, M.; Choblet, G.; Lefèvre, A.; Mitri, G.; Baland, R.-M.; Behounkova, M.; Bourgeois, O.; et al. Enceladus’s internal ocean and ice shell constrained from Cassinigravity, shape, and libration data. Geophys. Res. Lett. 2016, 43, 5653–5660. [Google Scholar] [CrossRef]
- Lunine, J.I. Ocean worlds exploration. Acta Astronaut. 2017, 131, 123–130. [Google Scholar] [CrossRef]
- Jean-Baptiste, P.; Fourré, E.; Charlou, J.-L.; German, C.R.; Radford-Knoery, J. Helium isotopes at the Rainbow hydrothermal site (Mid-Atlantic Ridge, 36°14’N). Earth Planet. Sci. Lett. 2004, 221, 325–335. [Google Scholar] [CrossRef]
- Thurnherr, A.M.; Richards, K.J. Hydrography and high-temperature heat flux of the Rainbow hydrothermal site (36°14N, Mid-Atlantic Ridge). J. Geophys. Res. 2001, 106, 9411–9426. [Google Scholar] [CrossRef]
- Mügler, C.; Jean-Baptiste, P.; Florian, P.; Charlou, J.-L. Modeling of hydrogen production by serpentinization in ultramafic-hosted hydrothermal systems: Application to the Rainbow field. Geofluids 2016, 16, 476–489. [Google Scholar] [CrossRef]
- Lodders, K.; Amari, S. Presolar grains from meteorites: Remnants from the early times of the solar system. Chem. Erde 2005, 65, 93–166. [Google Scholar] [CrossRef]
- Gounelle, M.; Meibom, A. The origin of short-lived radionuclides and the astrophysical environment of solar system formation. Astrophys. J. 2008, 680, 781–792. [Google Scholar] [CrossRef][Green Version]
- Malamud, U.; Prialnik, D. Modeling serpentinization: Applied to the early evolution of Enceladus and Mimas. Icarus 2013, 225, 763–774. [Google Scholar] [CrossRef]
- Travis, B.J.; Schubert, G. Keeping Enceladus warm. Icarus 2015, 250, 32–42. [Google Scholar] [CrossRef]
- Porco, C.C.; Helfenstein, P.; Thomas, P.C.; Ingersoll, A.P.; Wisdom, J.; West, R.; Neukum, G.; Denk, T.; Wagner, R.; Roatsch, T.; et al. Cassini observes the active south pole of Enceladus. Science 2006, 311, 1393–1401. [Google Scholar] [CrossRef]
- Dougherty, M.K.; Cao, H.; Khurana, K.K.; Hunt, G.J.; Provan, G.; Kellock, S.; Burton, M.E.; Burk, T.A.; Bunce, E.J.; Cowley, S.W.H.; et al. Saturn’s magnetic field revealed by the Cassini Grande Finale. Science 2018, 362, 1–8. [Google Scholar] [CrossRef]
- Le Duc, S. Théorie Physico-Chimique de La vie et Générations Spontanées; A. Poinat: Paris, France, 1910; p. 202. [Google Scholar]


© 2019 by the author. Licensee MDPI, Basel, Switzerland. This article is an open access article distributed under the terms and conditions of the Creative Commons Attribution (CC BY) license (http://creativecommons.org/licenses/by/4.0/).