1. Introduction
Long monitoring datasets are crucial to understanding a specific landslide dynamic [
1,
2,
3]. The necessity of a long-term dataset is due to the large number of unknowns present in a landslide system, such as soil/rock properties, distribution of the stratigraphic layers and geo-hydrological patterns, which make difficult to understand how a particular landslide moves under different triggering conditions without the actual registration of a long series of events [
4,
5,
6]. Moreover, due to climate change effects, more intense precipitation events followed by long-term draughts that disrupt the usual season cycle are observed [
7]. Thus, it is of little use considering just a year of continuative monitoring activity as able to capture a significant series of possible triggering events.
For most slow- or very slow-moving landslides [
8], if a monitoring system is deployed, it commonly in function of the definition of a hazard map that describes the state of activity of the slope [
9] or to design a mitigation strategy, rather than to identify prior-to-collapse precursors. The design of countermeasure works and the assessment of their efficiency needs to be supported by a reliable model that has been calibrated and validated on monitoring data [
10]. The model does not need to reach a specific level of detail to be functional to the definition of a mitigation strategy (i.e., tri-dimensional geotechnical model), but needs to be able to predict the landslide movements under different level of stress and to identify the most important triggering factors. Additionally, a monitoring campaign should always be considered prior to the intervention, when possible, to allow a better targeting of the landslide mitigation strategy and eventually to reduce structural mitigation costs.
A grey box model is an algorithm that processes inputs to produce an output with limited knowledge of the intrinsic process that produces the relation. It is distinguished by having a black box model [
11], where the model is completely independent and opaque with respect to the physical phenomena [
12]. From a mechanical viewpoint, i.e, for the landslide dynamics, models sometimes do not account for hypotheses related to the rheology of the materials involved, but rather identify some triggering factors that influence the cinematic of the mass movement. Data are viewed as phenomenological entities, and the purpose of the model is to reproduce them as a function of selected inputs that are hypotized to have a causal relationship with the outputs. These types of models have been widely used for landslide mapping, such as for susceptibility mapping [
13,
14] and for hazard assessment [
15], and to determine rainfall thresholds [
16].
Grey box modelling also applies well to the study of time-series of landslide displacements. The model may be designed once the correlation of the two signals has been established and once a possible causal relation between the two variables has been hypotized [
17]. In this case, the system identification process consists of the design of a predictive function, with linear-regression or more advanced machine learning techniques, using a portion of the data for calibration and a part for validation purposes [
18,
19]. Once the model has been validated, it may be used for prediction, functioning as the input [
20]. This would support the definition of mitigation strategies acting directly on the reduction of the input forcing.
2. Study Area
The Italian region of Friuli Venezia Giulia, in North East Italy, is characterized by the presence of several geohazards, especially in mountain regions, such as landslides [
21,
22] and sinkholes [
23]. Here, along the Tagliamento River valley, lies a narrow gorge called Passo della Morte (46°23′49″ N, 12°42′51″ E) located in the NW part of Friuli Venezia Giulia Region. The Tagliamento Valley is an important intramontane valley oriented E–W and following the Upper Tagliamento fault. In the Passo della Morte study area, the Sauris fault can also be recognized, and the presence of these tectonic stresses induces a general weakness of the rock bodies, therefore predisposing to slope instabilities.
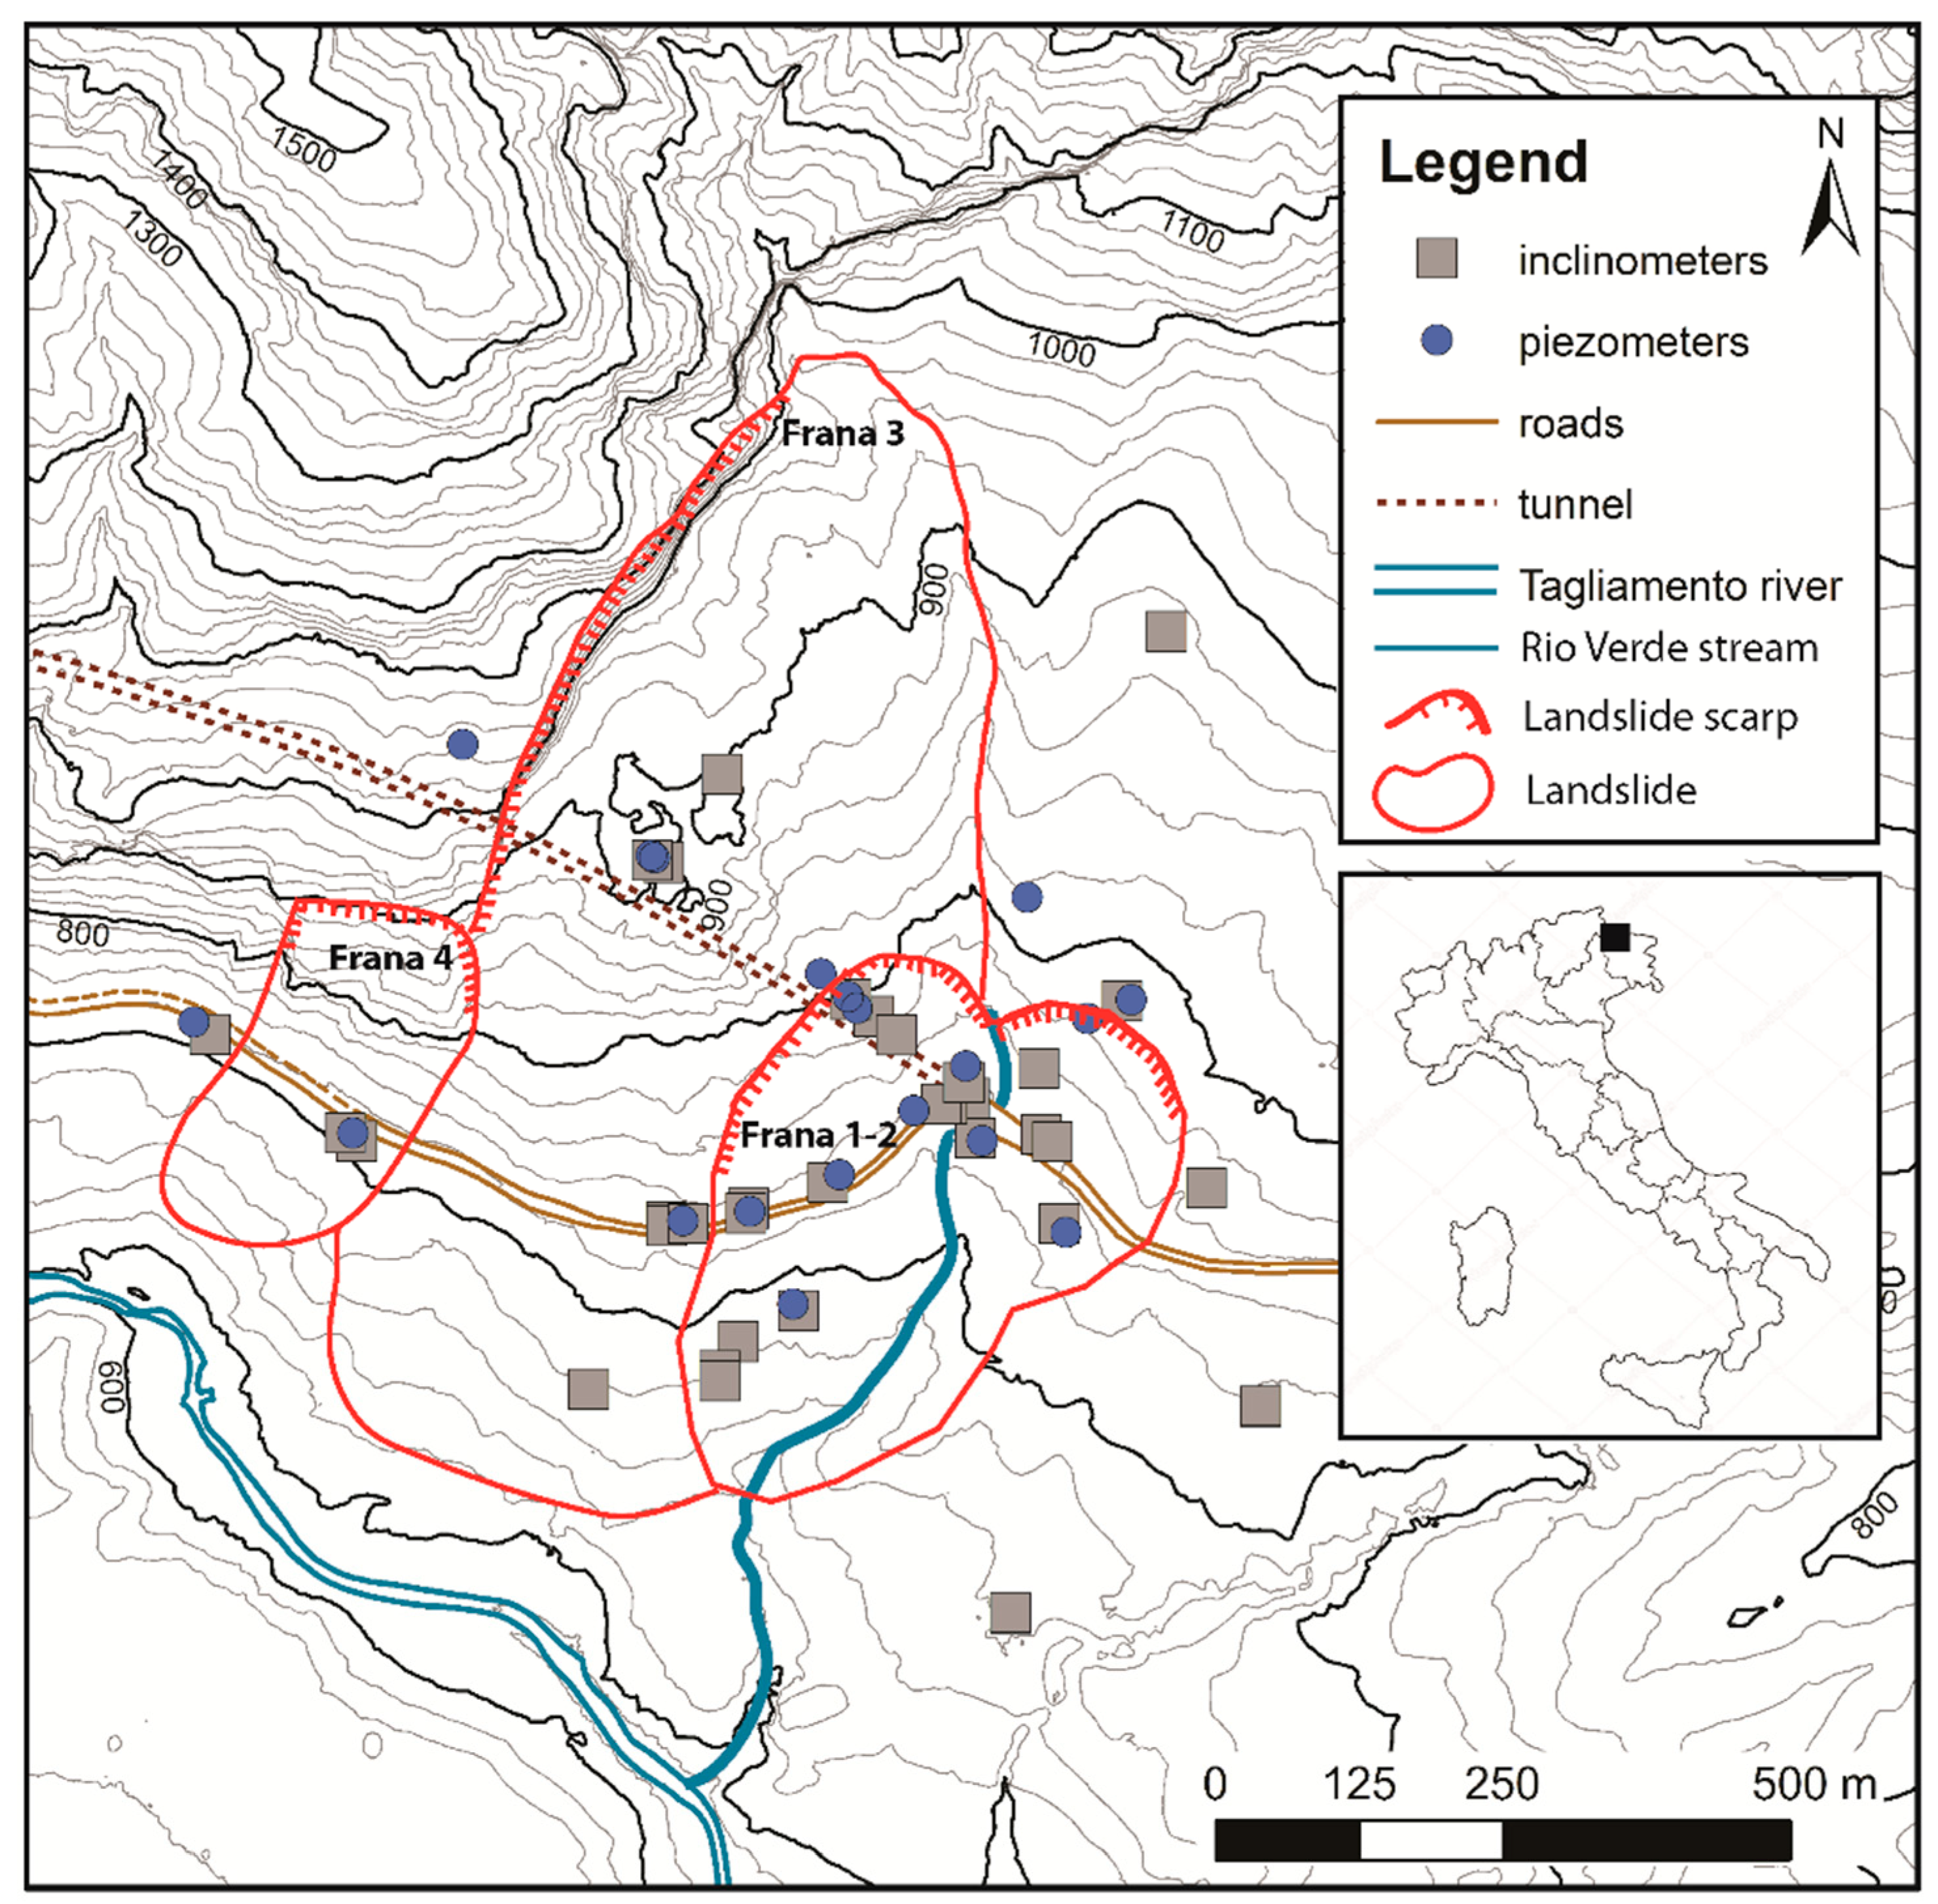
The confined morphology embodies an area where there is high potential energy, inducing widespread landslides and snow-avalanches [
24,
25,
26] (
Figure 1). Unfortunately, the Tagliamento valley connects the upper plains of the Friuli Venezia Giulia Region with the industrial areas of the Cadore (Veneto Region), and thus a major national road needs to pass through the Passo della Morte. The road is therefore necessarily located in a very hazardous area and, over the years, several risk mitigation strategies have been adopted, both structural and non-structural. Tunnels and half tunnels were designed, retaining walls were constructed, and rockfall barriers deployed. Since 2002 a monitoring system has monitored the ground water level and the surface and deep displacements of the major landslides [
27]. In Passo della Morte some structures, including a 43-million-euro tunnel, are showing signs of damage, and the residual risk is still high. The damage to the road tunnel is inflicted by a large 24 × 10
6 m
3 block slide (“Frana 3”) [
28] that cuts the tunnel at about 300 m from the eastern entrance [
29]. Additionally, a heart-shaped secondary slope instability of 2.1 × 10
6 m
3 (“Frana 1-2” landslide unit [
30]) affected the tunnel portal and 200 m of National Road.
The Friuli Venezia Giulia Region is known to be one of the most rainy areas of Europe; the Passo della Morte area is characterized by a mean annual accumulated precipitation (calculated in the interval 1961–2000, Ampezzo station, located 6 km away from the study area)) of 1721 mm [
31]. However, the yearly variability is high, with a minimum of 1229 and a maximum of 2370 mm. During the years characterized by intense rainfall and snowfall events, an increase in landslide activity was observed, especially for Frana 3.
The Frana 1-2 landslide unit is a complex slide with rotational movement at the crown and translational behavior at the toe. It consists of two distinct scarps with converging toes; the two scarps are divided by the Rio Verde torrent, a small stream that flows just before the eastern tunnel entrance. The tunnel and the old national road cross the Rio Verde above a concrete box culvert. The slow, unremitting movements of Frana 1-2 damage the culvert, the retaining walls along the road and the road pavement. During intense meteorological events, the displacement of Frana 1-2 shows a recrudescence with larger displacements and greater damage. The monitoring data that has been collected over the years in the area now support and guide a data-driven countermeasure works to mitigate the Frana 1-2 displacements.
3. Monitoring Network and Data
Data from a helicopter-borne laser scanner covering the area are available, allowing the definition of a 1 m cell Digital Terrain Model (DTM). The study area is in fact densely forested; therefore, to gain reliable topographic information, it was necessary to use LiDAR. The DTM was then used to support the geomorphological investigation and to perform some hydrological analysis.
Landslides in Passo della Morte have been monitored since 2002. Over the years, several instruments have been deployed, such as quasi-real time piezometers, inclinometers (periodic and in-place), GNSS surveys, a thin plate weir to measure continuously the discharge of the Rio Verde, a rain gauge and temperature sensors (meteo station). Along, some crackmeters and clinometers were deployed in the road tunnel to monitor crack displacements [
29].
The monitoring network serves multiple purposes: it controls the movements of the landslides, and thus it supports the definition of numerical models that reconstruct the slope kinematics through back analysis. On the other hand, it provides data about how effective the implemented structural mitigation works are, based on which it is possible to design additional countermeasures if the already executed ones were not adequate.
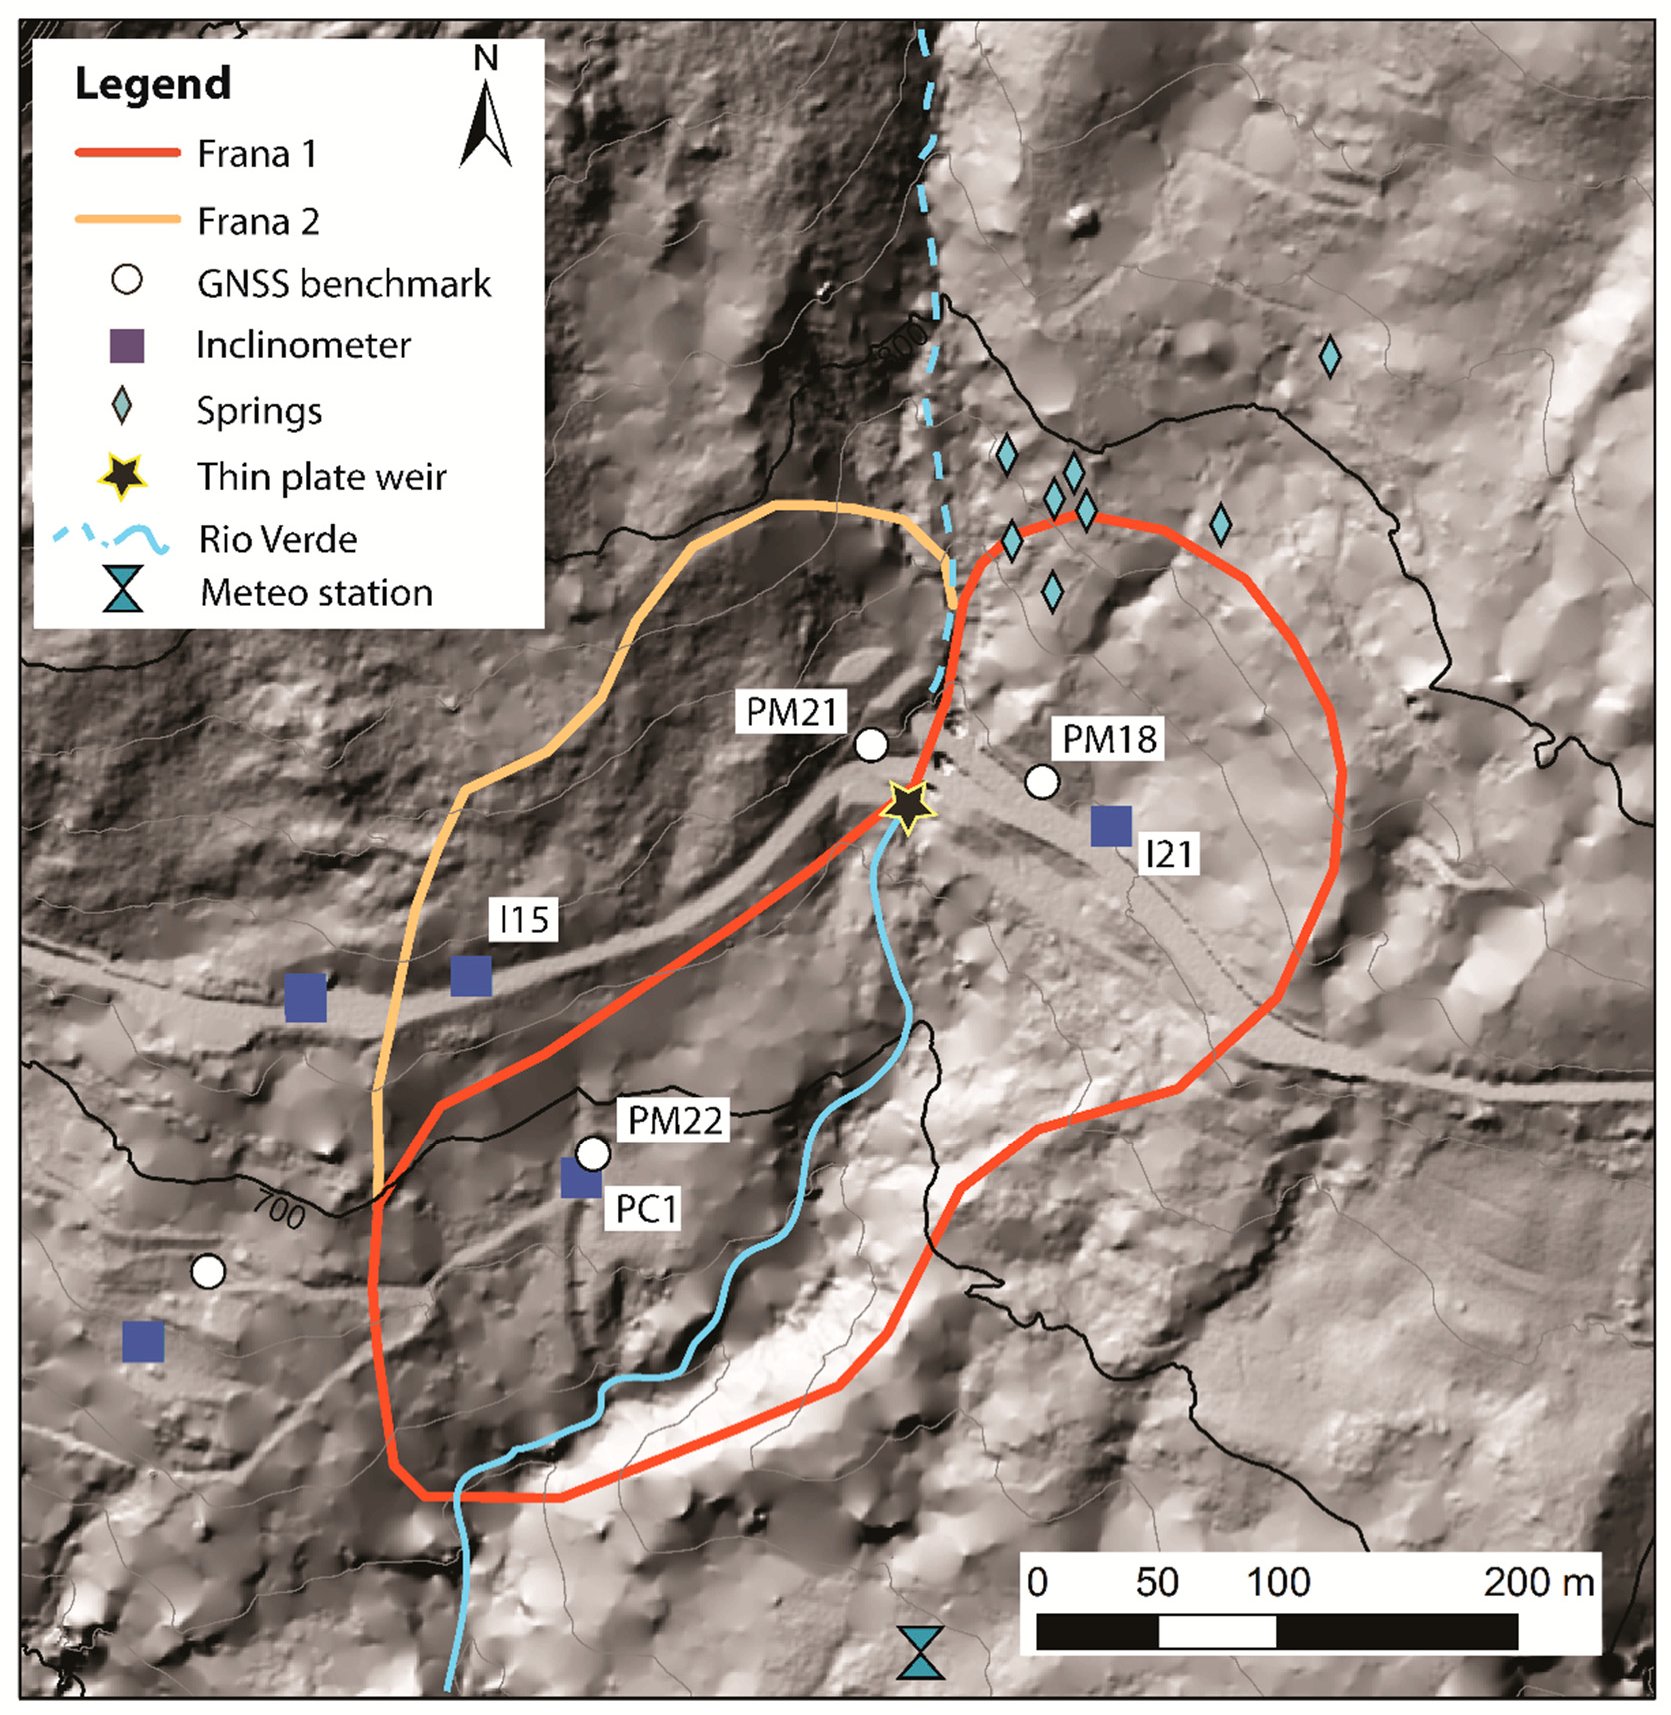
The Periodical Global Navigation Satellite System (GNSS) survey provides information about surface displacements. These measurements are acquired yearly and show an average superficial displacement of Frana 1-2 of 4.2 cm/year in benchmark PM18, located in the upper part of the Frana 1 side of the landslide unit, of 3.7 cm/year in PM22 located at the toe of the landslide unit and 1.2 cm/year in PM21, deployed on Frana 2 (
Figure 2).
Several inclinometers have been installed in the area to define the tri-dimensional shape of the slip surface [
32]. The survey protocol adopted by CNR-IRPI called for the deployment of in-place inclinometers once the location of the slip surface was defined through periodic inclinometric surveys. Moreover, when a borehole reaches full scale, another one is drilled nearby to follow the evolution of the landslides for several years in order to obtain a large, continuous dataset. Presently, three in-place inclinometers monitor Frana 1-2 (
Figure 2).
The inclinometer I21 series follows the eastern crown displacements along the slip surface at 23 m below ground surface since August 2010 with inclinometer I21bis; the associated in-place probe was deployed in December 2010. Inclinometer I21ter was installed just a few meters apart from I21bis in July 2015, and the deployment of the in-place inclinometer took place in January 2016. This sensor malfunctioned between 22 July 2017 and 15 August and between 24 December 2017 and 2 January 2018; it is still operating today. On the upper western side are inclinometers I15 and I15bis, both equipped with in-place probes, both acquiring data since 2012. The slip surface displacements at the toe of Frana 1-2 (−23 m below ground surface) are followed by the PC1 inclinometric series. Inclinometer PC1 was drilled in April 2003, the in-place probe was deployed in November 2003 and was broken in July 2007. PC1bis in-place inclinometer was installed in August 2007 in a borehole that was already prepared to replace PC1 in case of malfunctioning. PC1bis stopped acquiring data in August 2011. In June 2012, inclinometer PC1ter was deployed, and the in-place probe started acquiring in January 2013 and is still operating now.
Almost every borehole was also equipped with piezometers acquiring in quasi real time. The water table measured in the piezometers on Frana 1-2 has never reached the slip surface in all the monitoring years.
In 2012, a sharp crested thin plate weir was installed to assess the water discharge of the Rio Verde torrent (
Figure 2). The weir is deployed in a regular 6 × 5 m concrete culvert that acts as a bridge for the National Road over the Rio Verde. The sensor malfunctioned between May and November 2016 and it is still acquiring and the time being.
4. Hydrological Analysis
4.1. Hydrogeological Setting
The Rio Verde stream, a tributary on the left bank of the Tagliamento river, cuts across the Frana 1-2 landslide unit. Near the crown of the landslide, on the hydrographical left side of the Rio Verde, a series of springs have been identified at about 800 m a.s.l.. Discharge from the springs is perennial; one of the springs is exploited for drinking purposes by the local municipality as an emergency source in dry years, since it is a small but reliable source of freshwater. Landslide movements also periodically damage the aqueduct, which in the last 10 years has been reconstructed twice.
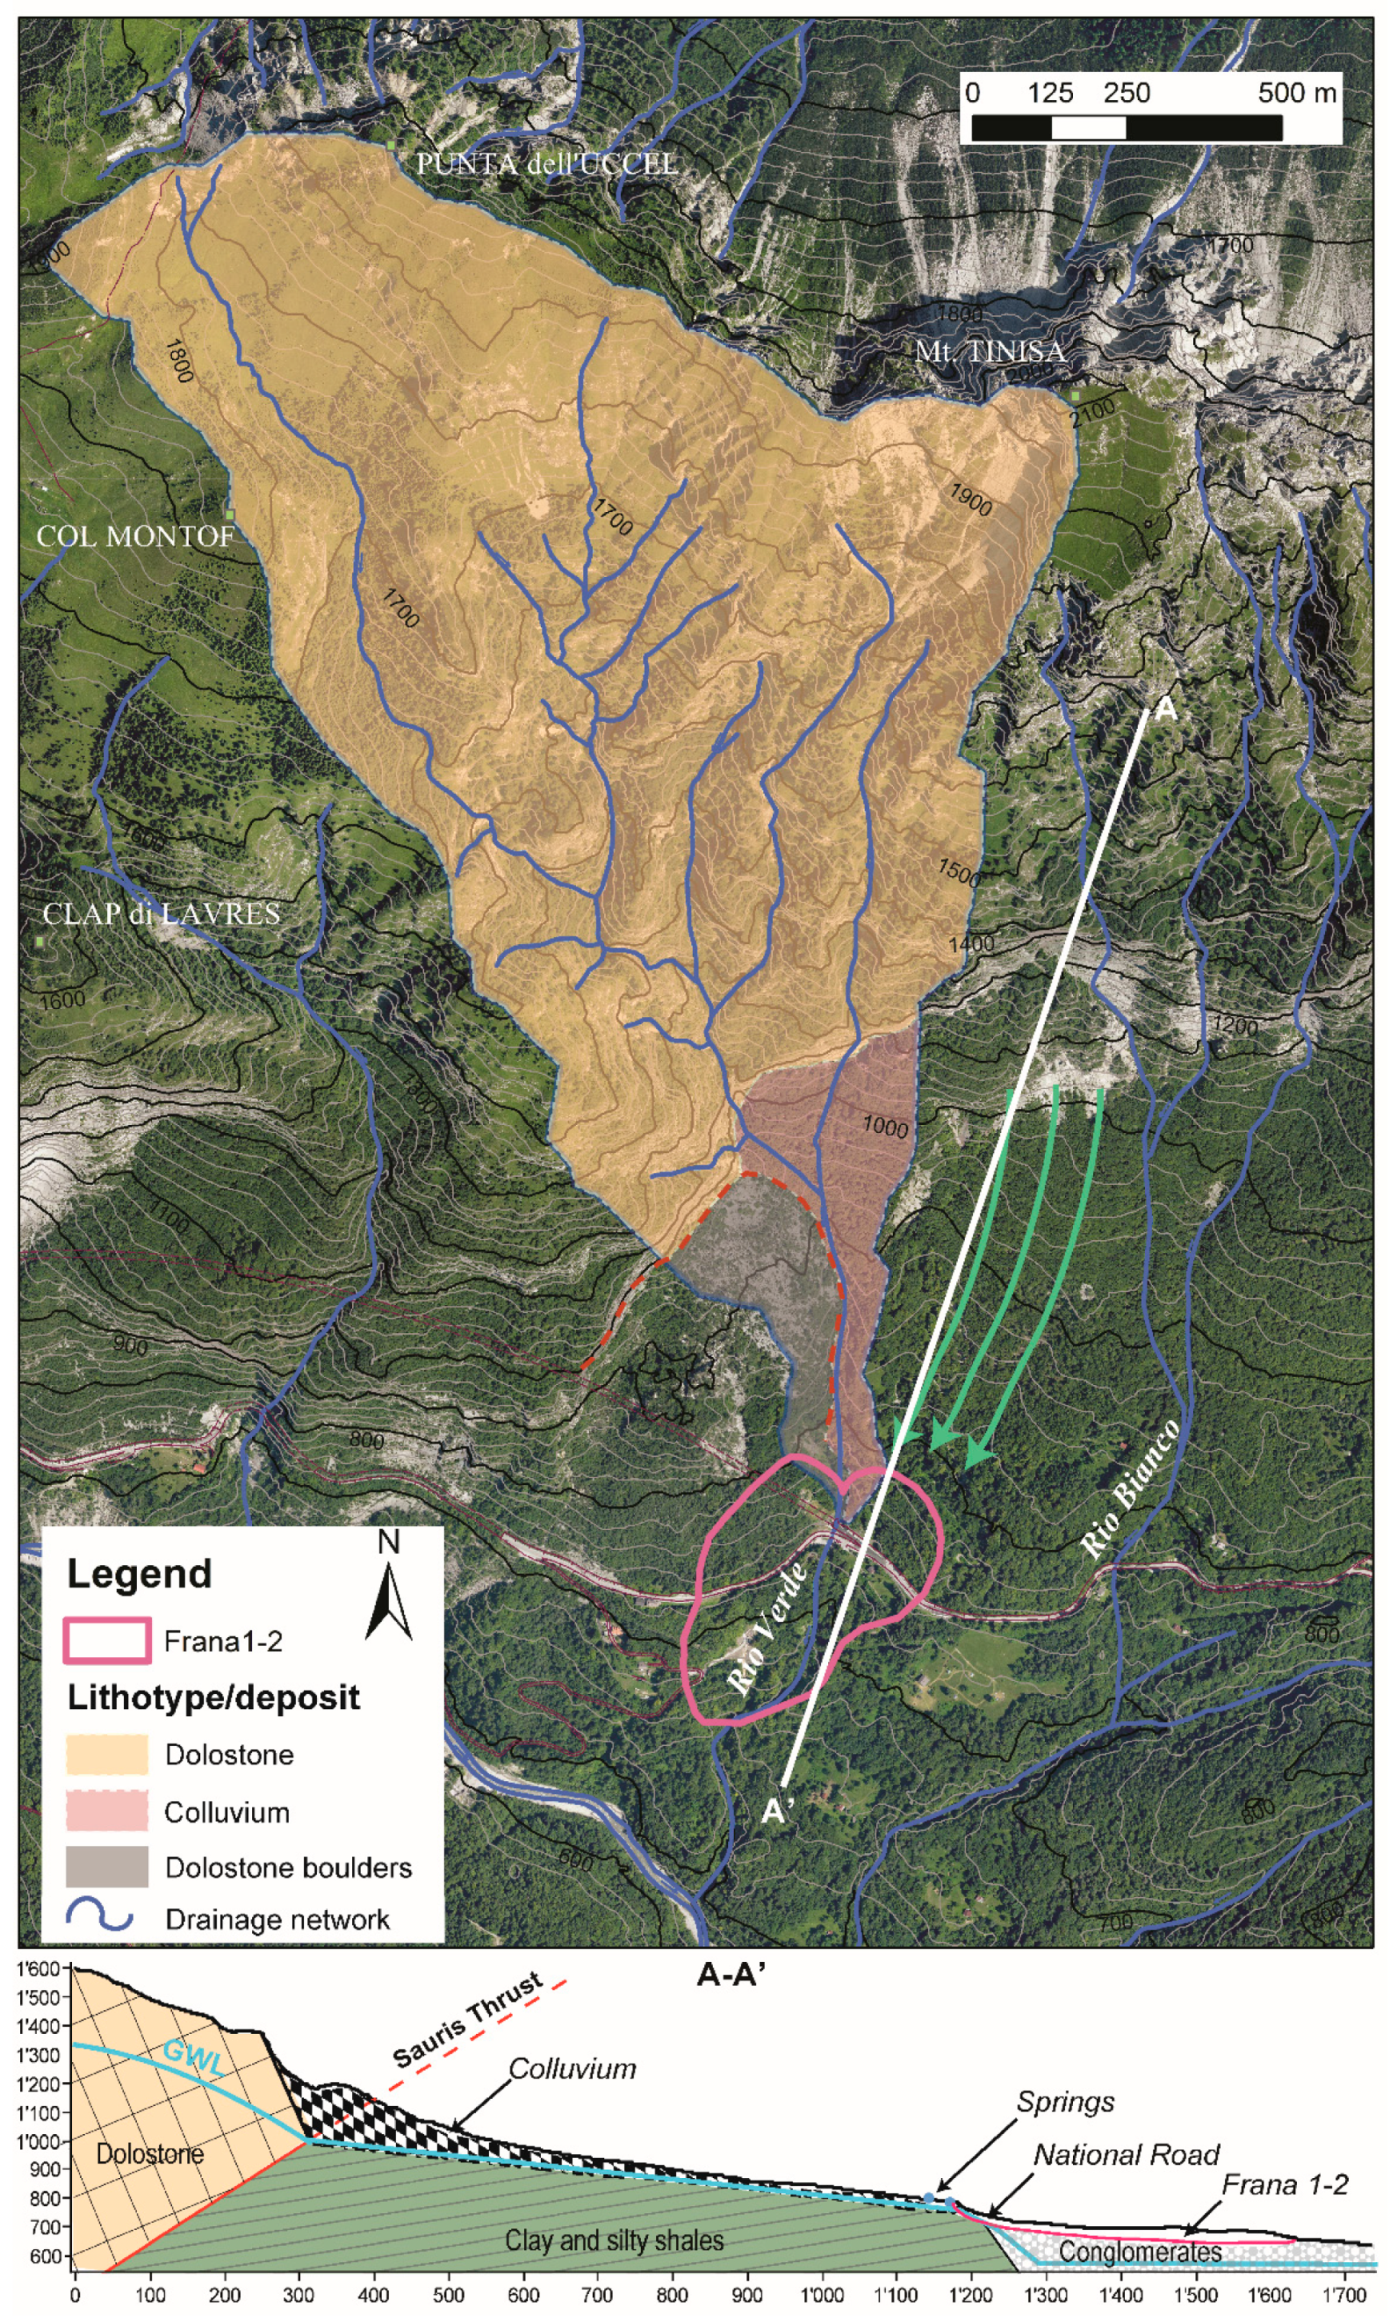
The occurrence of the springs is induced by the presence of a conjugated structure of the Sauris fault, which makes a structural contact of dolostone (M. Tiarfin Formation—Ladinian) overlapping clay and silty shales (Raibl Formation—Carnian) [
33]. This geological setting creates an impervious layer over which the carbonate aquifer flows. Thus, the water table is located near the contact between the clay and silty shales and the more pervious colluvium that covers the slope, originated by slope processes (
Figure 3).
The recharge area of the abovementioned springs only partially corresponds with the surface watershed of the Rio Verde stream. Part of the groundwater arrives from the southern slope of Mt. Tinisia (
Figure 3), on the eastern side of the Rio Verde stream, hosting an aquifer with travel times estimated in years [
34] (
Figure 3). Below the spring line, in correspondence with Frana 1-2, no groundwater was detected in all the boreholes that have been drilled over the years, nor was any detected in the equipped real-time piezometers that have been deployed for several years.
From the surface hydrology perspective, the tract of the Rio Verde upstream of the springs (dashed line in
Figure 2) is always dry, and discharge is present only during intense (<150 mm/day) rainfall events (few days over the year). Thus, the discharge that flows in the Rio Verde downstream of the springs is almost exclusively given by the spring’s outflow.
4.2. Surface Hydrology
The surface hydrology of the run-off basin has been analyzed with GIS tools on the available LiDAR DTM. In particular, the basin extraction was performed using ArcGIS® Hydrology toolbox. The Rio Verde basin covers an area of 1.68 km2, comprising a difference in height between the 735 m a.s.l. of the closing section placed, for this analysis, under the road crossing where the hydrometer is deployed and the 2122 m of the summit of Mt. Tinisa.
From the rock lithotypes and deposits viewpoint the upper basin’s area (about 1.52 km
2) is characterized by the presence of tectonized dolomitic limestone of Monte Tiarfin Formation affected by karst phenomena. Downstream, the Frana 3 landslide back scarp deposit consisting of dolomitic boulders follows along with colluvium on the other side of the stream, on the hydrographic left (
Figure 3). These two lithologies cover an extension of 0.096 and 0.065 km
2 respectively. The three domains show different soil permeability: high for the landslide deposit, intermediate for the colluvium and low for the dolomitic limestone that is nevertheless highly fractured. The portion of the basin set on dolomitic limestone constitutes 95% of the total area, and it is separated from the lower portion of debris and colluvial deposits from a vertical rocky threshold that generates a 50 m high fall during rainfall events. The water coming from the upper part of the basin after the fall enters the large landslide boulders and is thereby dispersed, feeding the underground circulation of the right bank of the Rio Verde, into Frana 3, and almost not participating to the streamflow of the lower tract of the Rio Verde [
35].
4.3. Springs Discharge
For the study of the spring flow characteristics, the few peaks linked to surface run-off during very intense rainfall events were removed to obtain a significant hydrograph, representing only the flow rate of the springs.
The flow pouring from the springs may be divided in two components: (i) “quickflow” [
36] responding to rainfall events linked to infiltration in the high-permeability debris at the base of the of the Tinisa massif; (ii) “dry baseflow” connected to deep circulations with long residence time set in the dolomitic limestones, coming from the massif itself [
34].
From the analysis of the discharge dataset since 2012, it was possible to establish an average annual flow rate of about 40 l/s, so according to Meinzer classification [
37] is a spring of class III (28.3–283 l/s). This means that even in dry periods, there is a constant and reliable baseflow coming from the springs. Along the spring, the recession curve for the spring discharge was analyzed. The exponential term α
i of the quickflow recession curve [
38,
39] calculated for several events occurred in the monitoring period is equal to 0.014 [day
−1].
5. Modelling and Results
5.1. Correlations between Velocities of the Landslide and Discharge in the Rio Verde
The quasi real-time inclinometric measurements showed periods of acceleration and decelleration. To assess whether there was correlation between displacements and triggering factors of Frana 1-2, such as precipitations or discharge in the Rio Verde, initially, data of inclinometer I21bis were analyzed. The displacements recorded by the I21bis inclinometer are continuous, with no quiescent phases, but only with decreases or increments of speed.
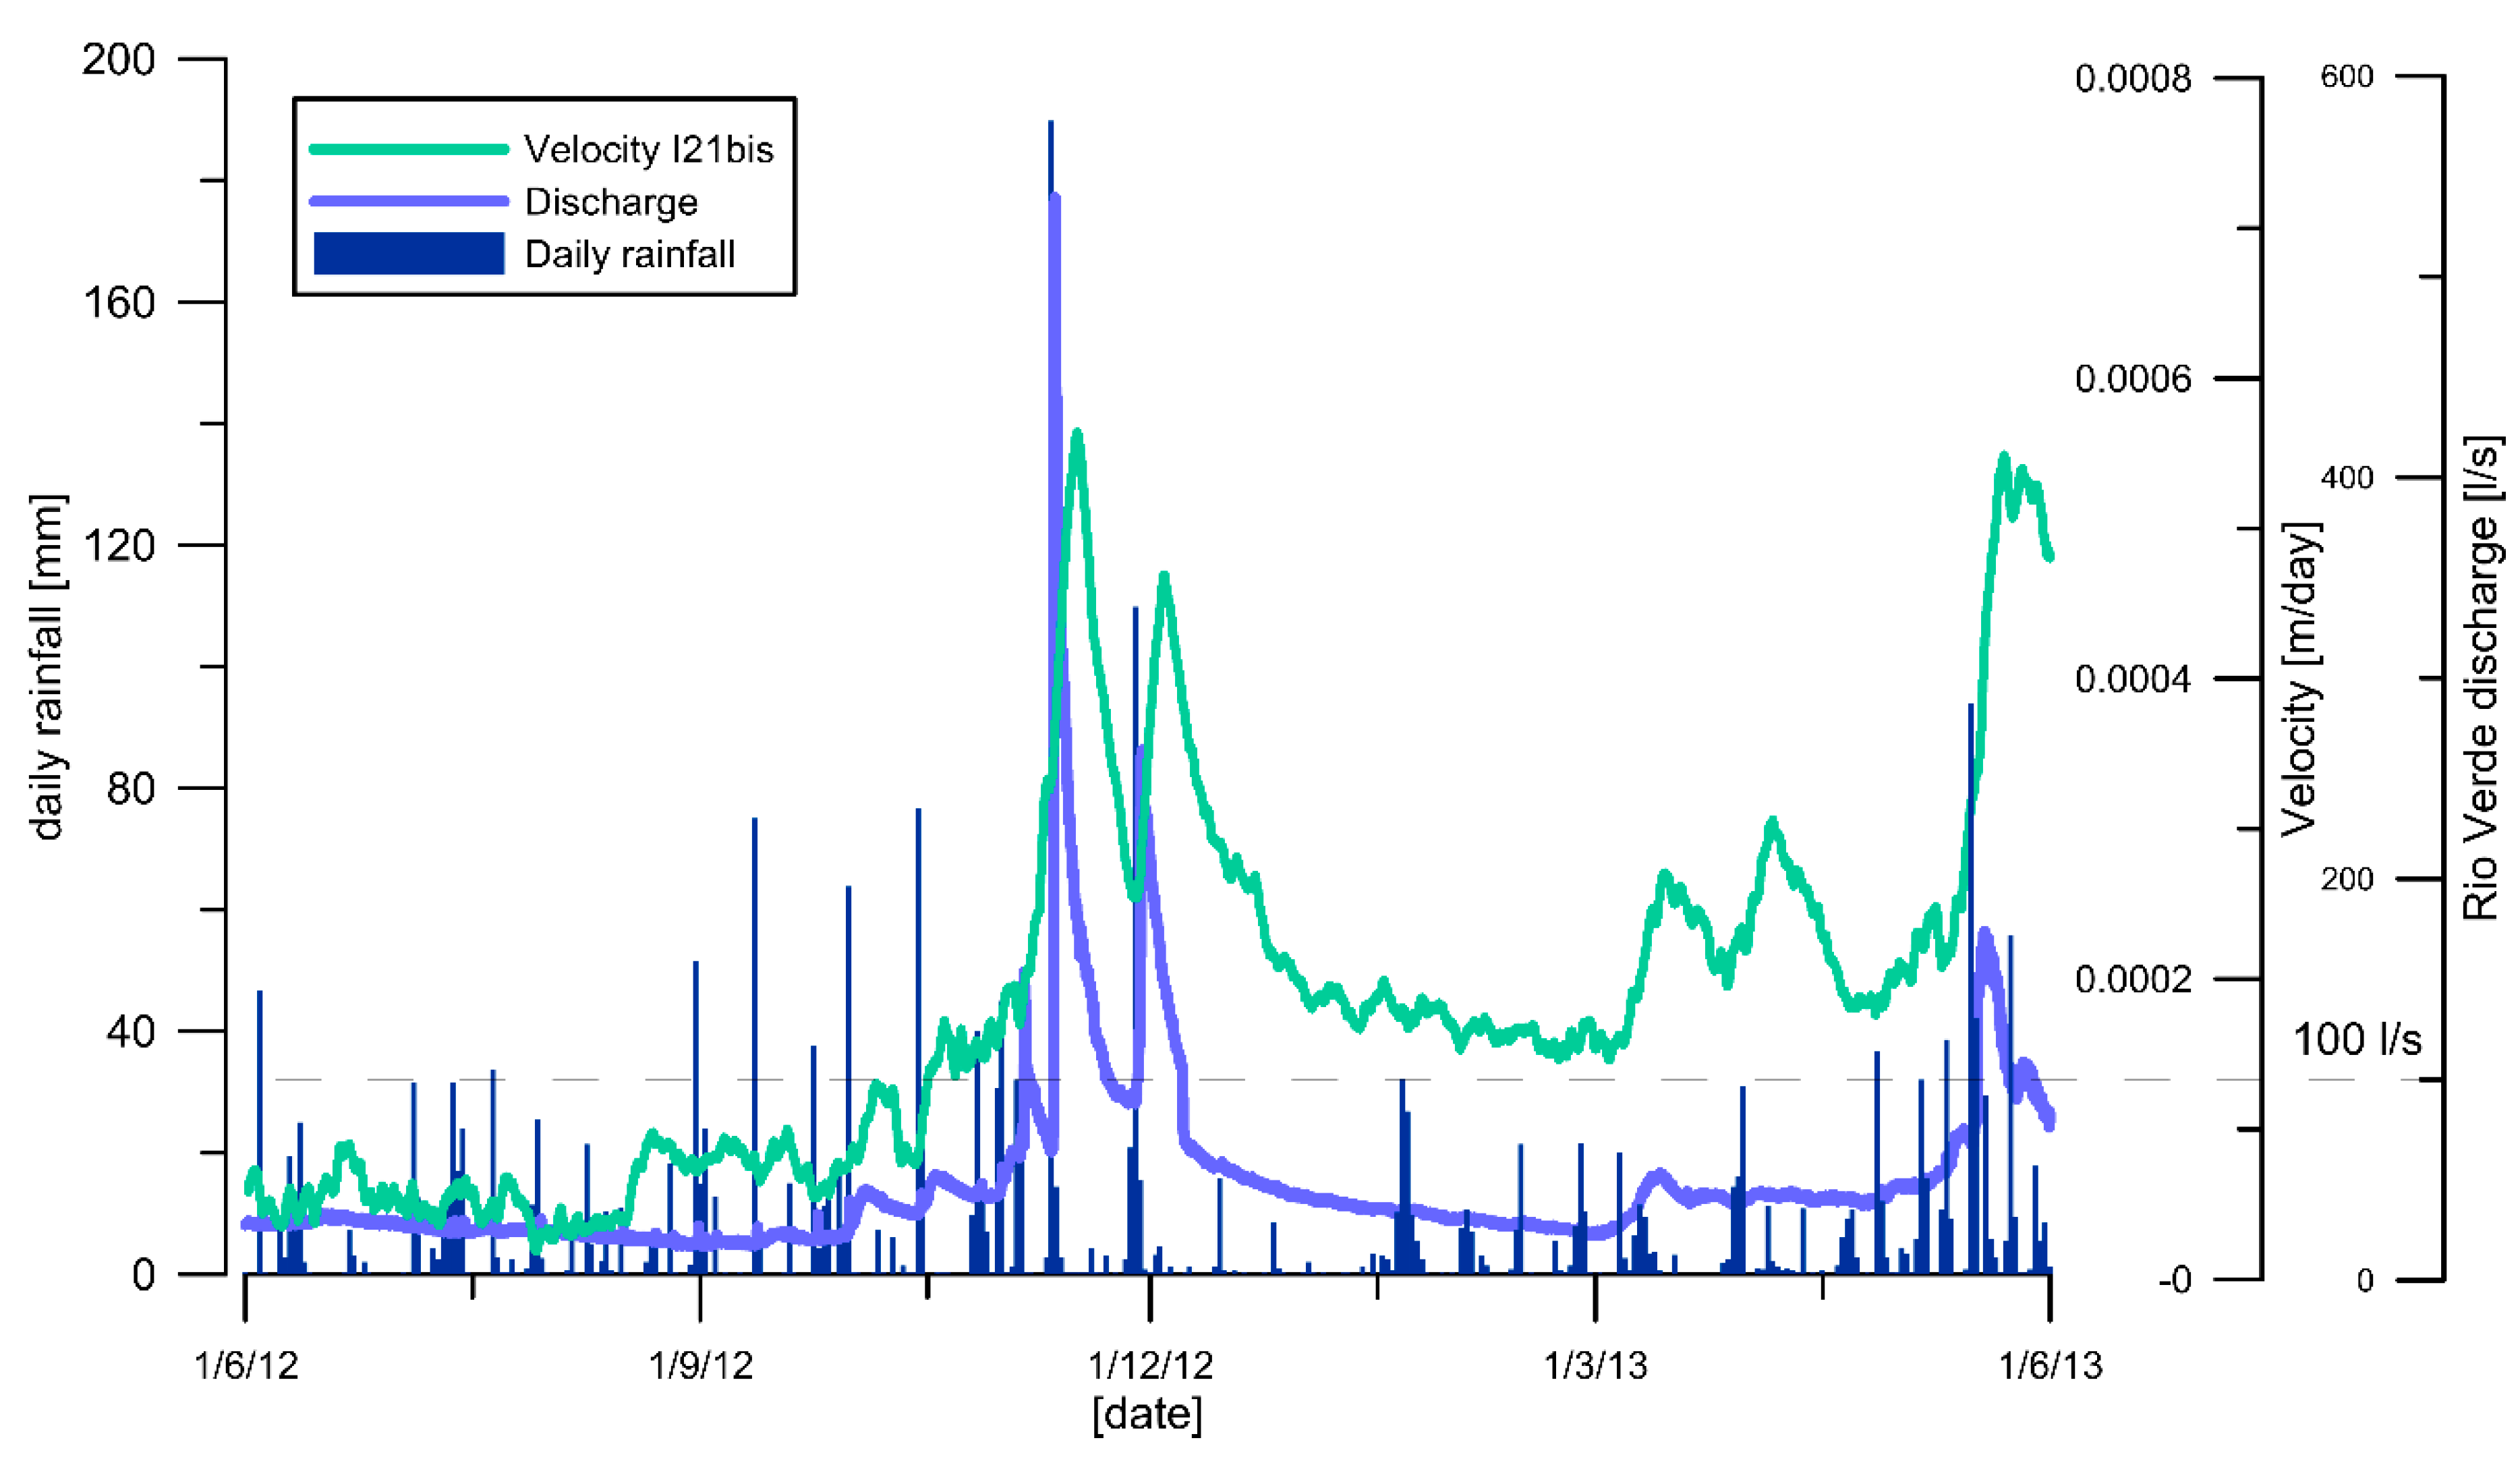
Correlation between the velocities of the landslides (calculated on windows of 1, 2, 3, 5 and 10 days) and rainfall, including hourly rainfall and accumulated rainfall (12 h, 24 h, 2 days 3 days, 5 days, 10 days), was tested with Pearson Product-Moment Correlation Coefficient (PPMCC); no significant correlation was found. On the other hand, a correlation between velocities of displacement of the landslide along the slip surface and discharge in the Rio Verde stream was found (
Figure 4).
The PPMCC shows a correlation with high values (0.85) between velocity in a 10-day time-lag and discharge. The PPMCC fell in the range between −1 and 1, where values close to | 1 | are maximum correlation and values close to 0 indicate no correlation. Considering the chaotic nature of the process observed, values of correlation above 0.8 are very significant. Moreover, it has to be noted that data were not filtered and outliers were not removed, so as to test the robustness of the assumption and to not hinder the reliability of the analysis.
Data collected in the I21ter inclinometer were analyzed to confirm the correlation. In fact, checking that results are consistent with those collected in another time period by a different instrument makes it possible to test the robustness of the analysis and to confirm the hypothesis of correlation.
The PPMCC between velocities measured on a 10-day time-lag in the I21ter and the flow of the Rio Verde was 0.81 for the first 4 months of 2016. In the following months of 2016, some problems in the discharge sensor generated unreliable measurements. For the time period 2017–2018, the PPMCC value between discharge in the Rio Verde stream and velocity in a 10-day time-lag in inclinometer I21ter was 0.82.
The fact that two instruments, inclinometers I21bis and I21ter, in two different time windows, show high correlations between two signals (discharge and velocity) is evidence of strong influence between the two quantities. The underlying mechanism that links the two variables may be the imbibition of the argillitic foot of the landslide by the water flowing in the Rio Verde.
5.2. Modelling Displacements in Function of the Rio Verde Discharge
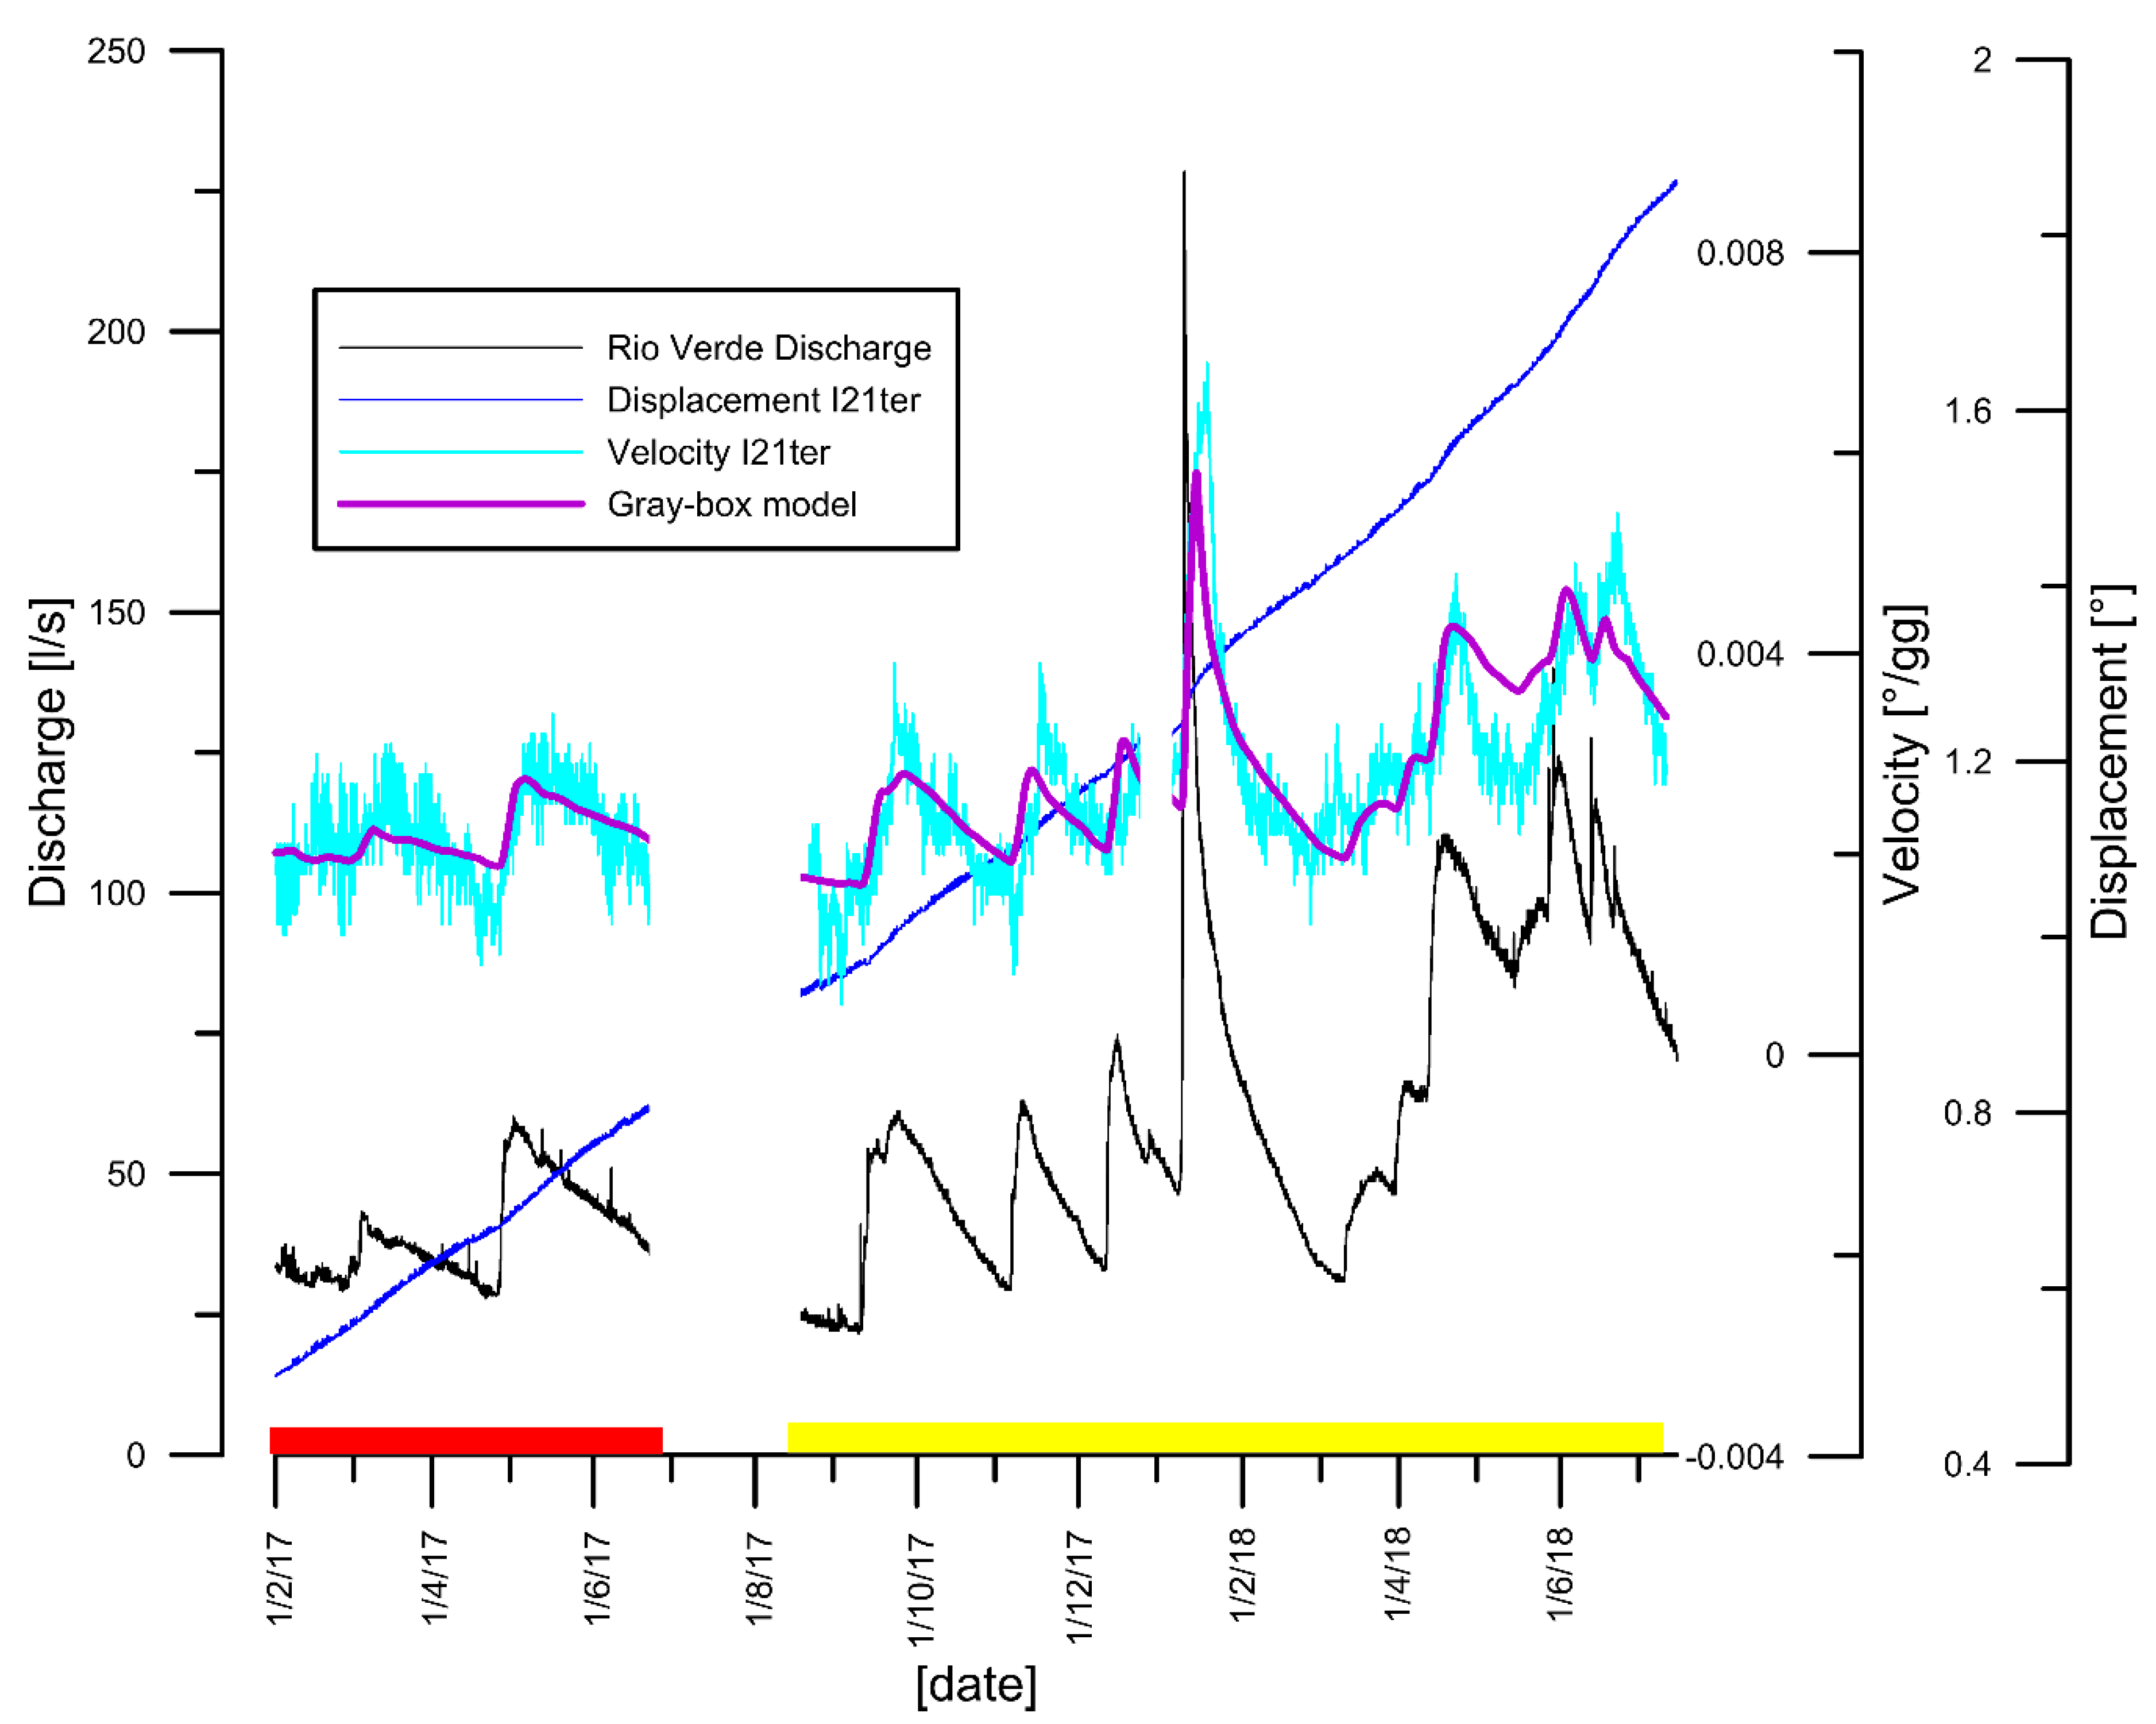
To design the model, the I21ter inclinometer measurements were divided into two separate datasets. One was used for calibration (from August 15th 2017 to July 15th 2018, 11 months) and one for validation (from 1 January 2017 to 22 June 2017, almost 6 months). The fact that a calibration dataset was preserved and that the calibration datasets fall in a period of lower discharge is a guarantee of the model’s reliability, and that there is no numerical overfitting on the validation dataset.
The coefficient of determination R
2 of the linear regression between discharge and velocities is only 0.68; therefore, a different equation considering time-lags was needed to link the two quantities. It was observed that there was a very elastic system response in the area of flow rates of 100 l/s, while for larger or smaller values the effects were slightly dissipated. Therefore, the following equation is obtained:
where (
) is the average flow calculated over the previous 5 days,
is the average velocity calculated over 10 days, 0.75 represents a dumping factor, and 0.0004 and −0.0007 are linear coefficients. The relationship is linear, derived by simple linear regression; it has been expressed in Equation (1) in that form to make it more readable. The equation is not congruent dimension-wise as it is a gray-box model and not a rheological law. The graphic results of the fitting can be seen in
Figure 5; the general trend of speed is well reconstructed.
To confirm the reliability of the equation obtained, we used the validation dataset. The fitting is still very good. The R
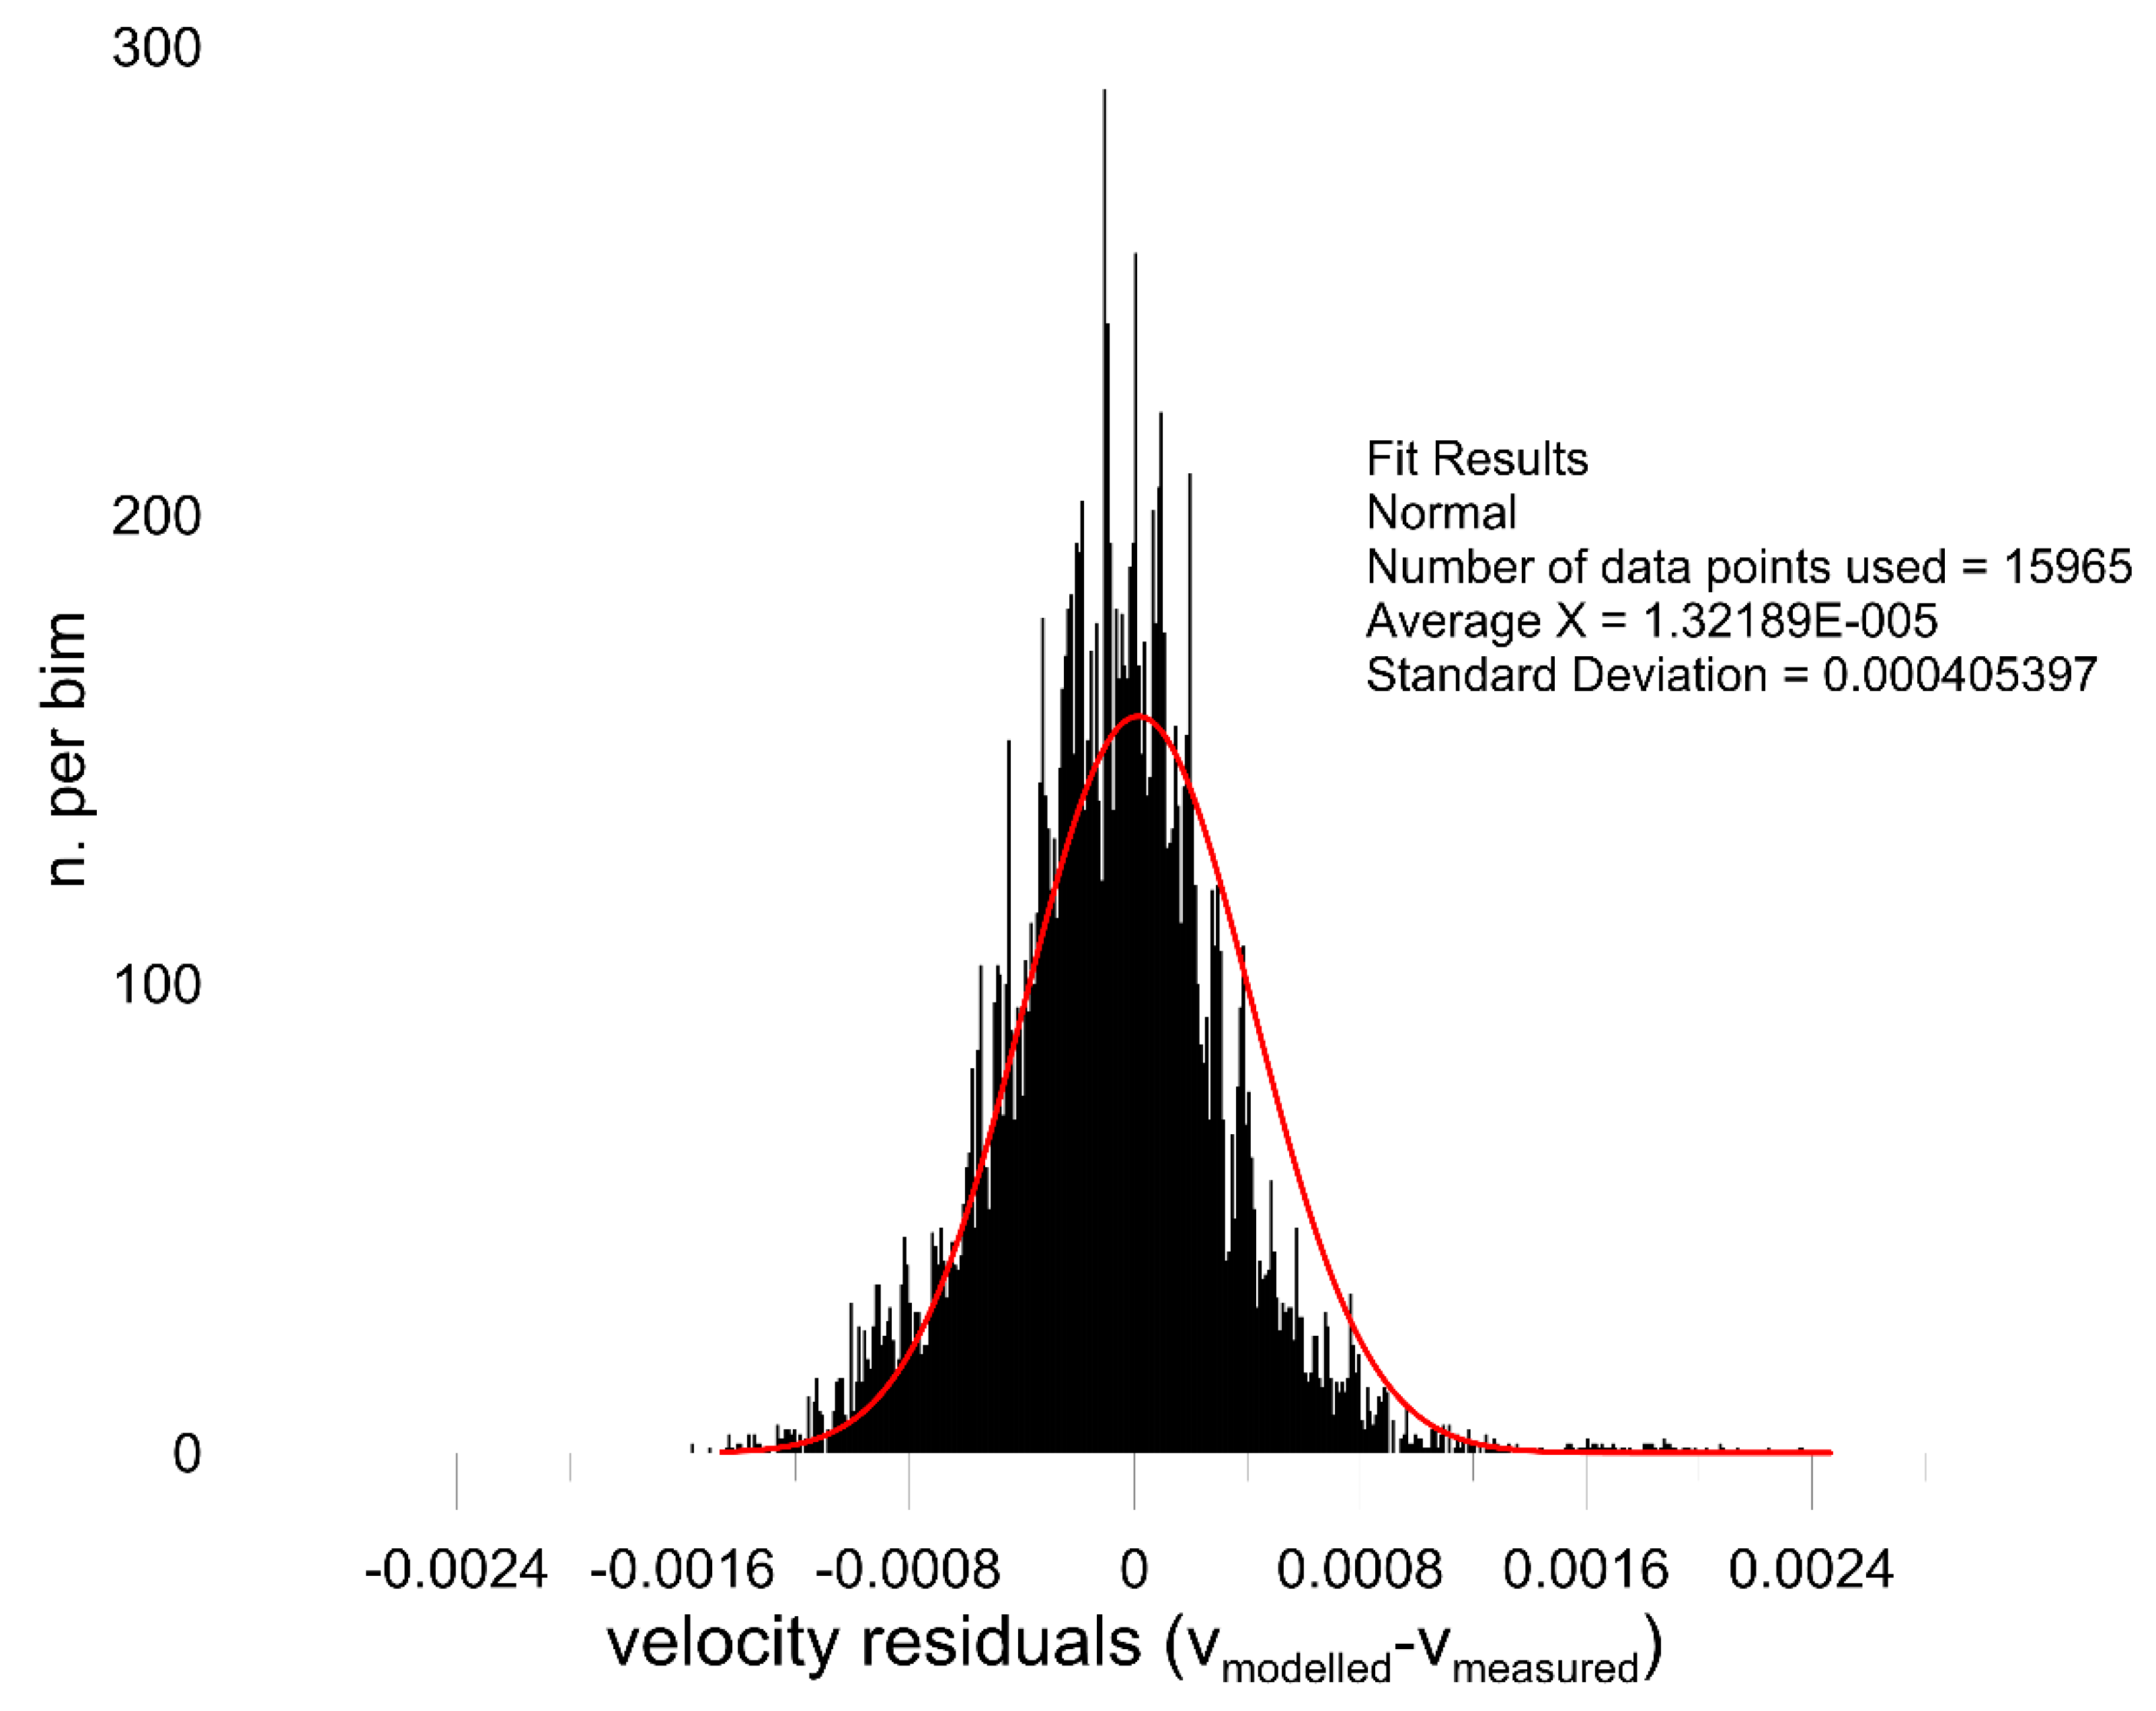
2 obtained by comparing modeled velocities and measured velocities is equal to 0.77, the mean absolute percentage error (MAPE) is 14% and the root-mean-square error (RMSE) is equal to 0.00043. There is, therefore, a good performance of the model, considering also its straightforwardness. Moreover, the distribution of the errors between modeled and measured velocities was tested (
Figure 6), and their distribution is normal, meaning that the model is able to reproduce the full range of the variable. Additionally, the average of the residuals is almost equal to zero, thus the systematic error is negligible, and the standard deviation of the fitting normal is low (0.0004), with 73.4% of the residuals falling into the 1σ range. Thus, the model is adequately reliable for assessing and quantifying the efficacy of mitigation measures.
6. The Mitigation Strategy
On the basis of the strong evidence of relation between velocities of the landslide and discharge in the Rio Verde stream, a mitigation measure that acts on the sequestration of the flowing water to reduce displacements has been proposed. In this working hypothesis, the water discharge would be intercepted at the section where the hydrometer is located and channeled into a pipeline outside the landslide body, on the hydrographic left.
The intercepting structure would be placed next to the existing check dam, under the Rio Verde road bridge. This design solution entails the installation of a concrete tank with an overflow spillway in the section of the artificial riverbed. The function of the tank is to adjust the hydraulic load, avoid cavitation, and allow the settlement of medium-coarse particles.
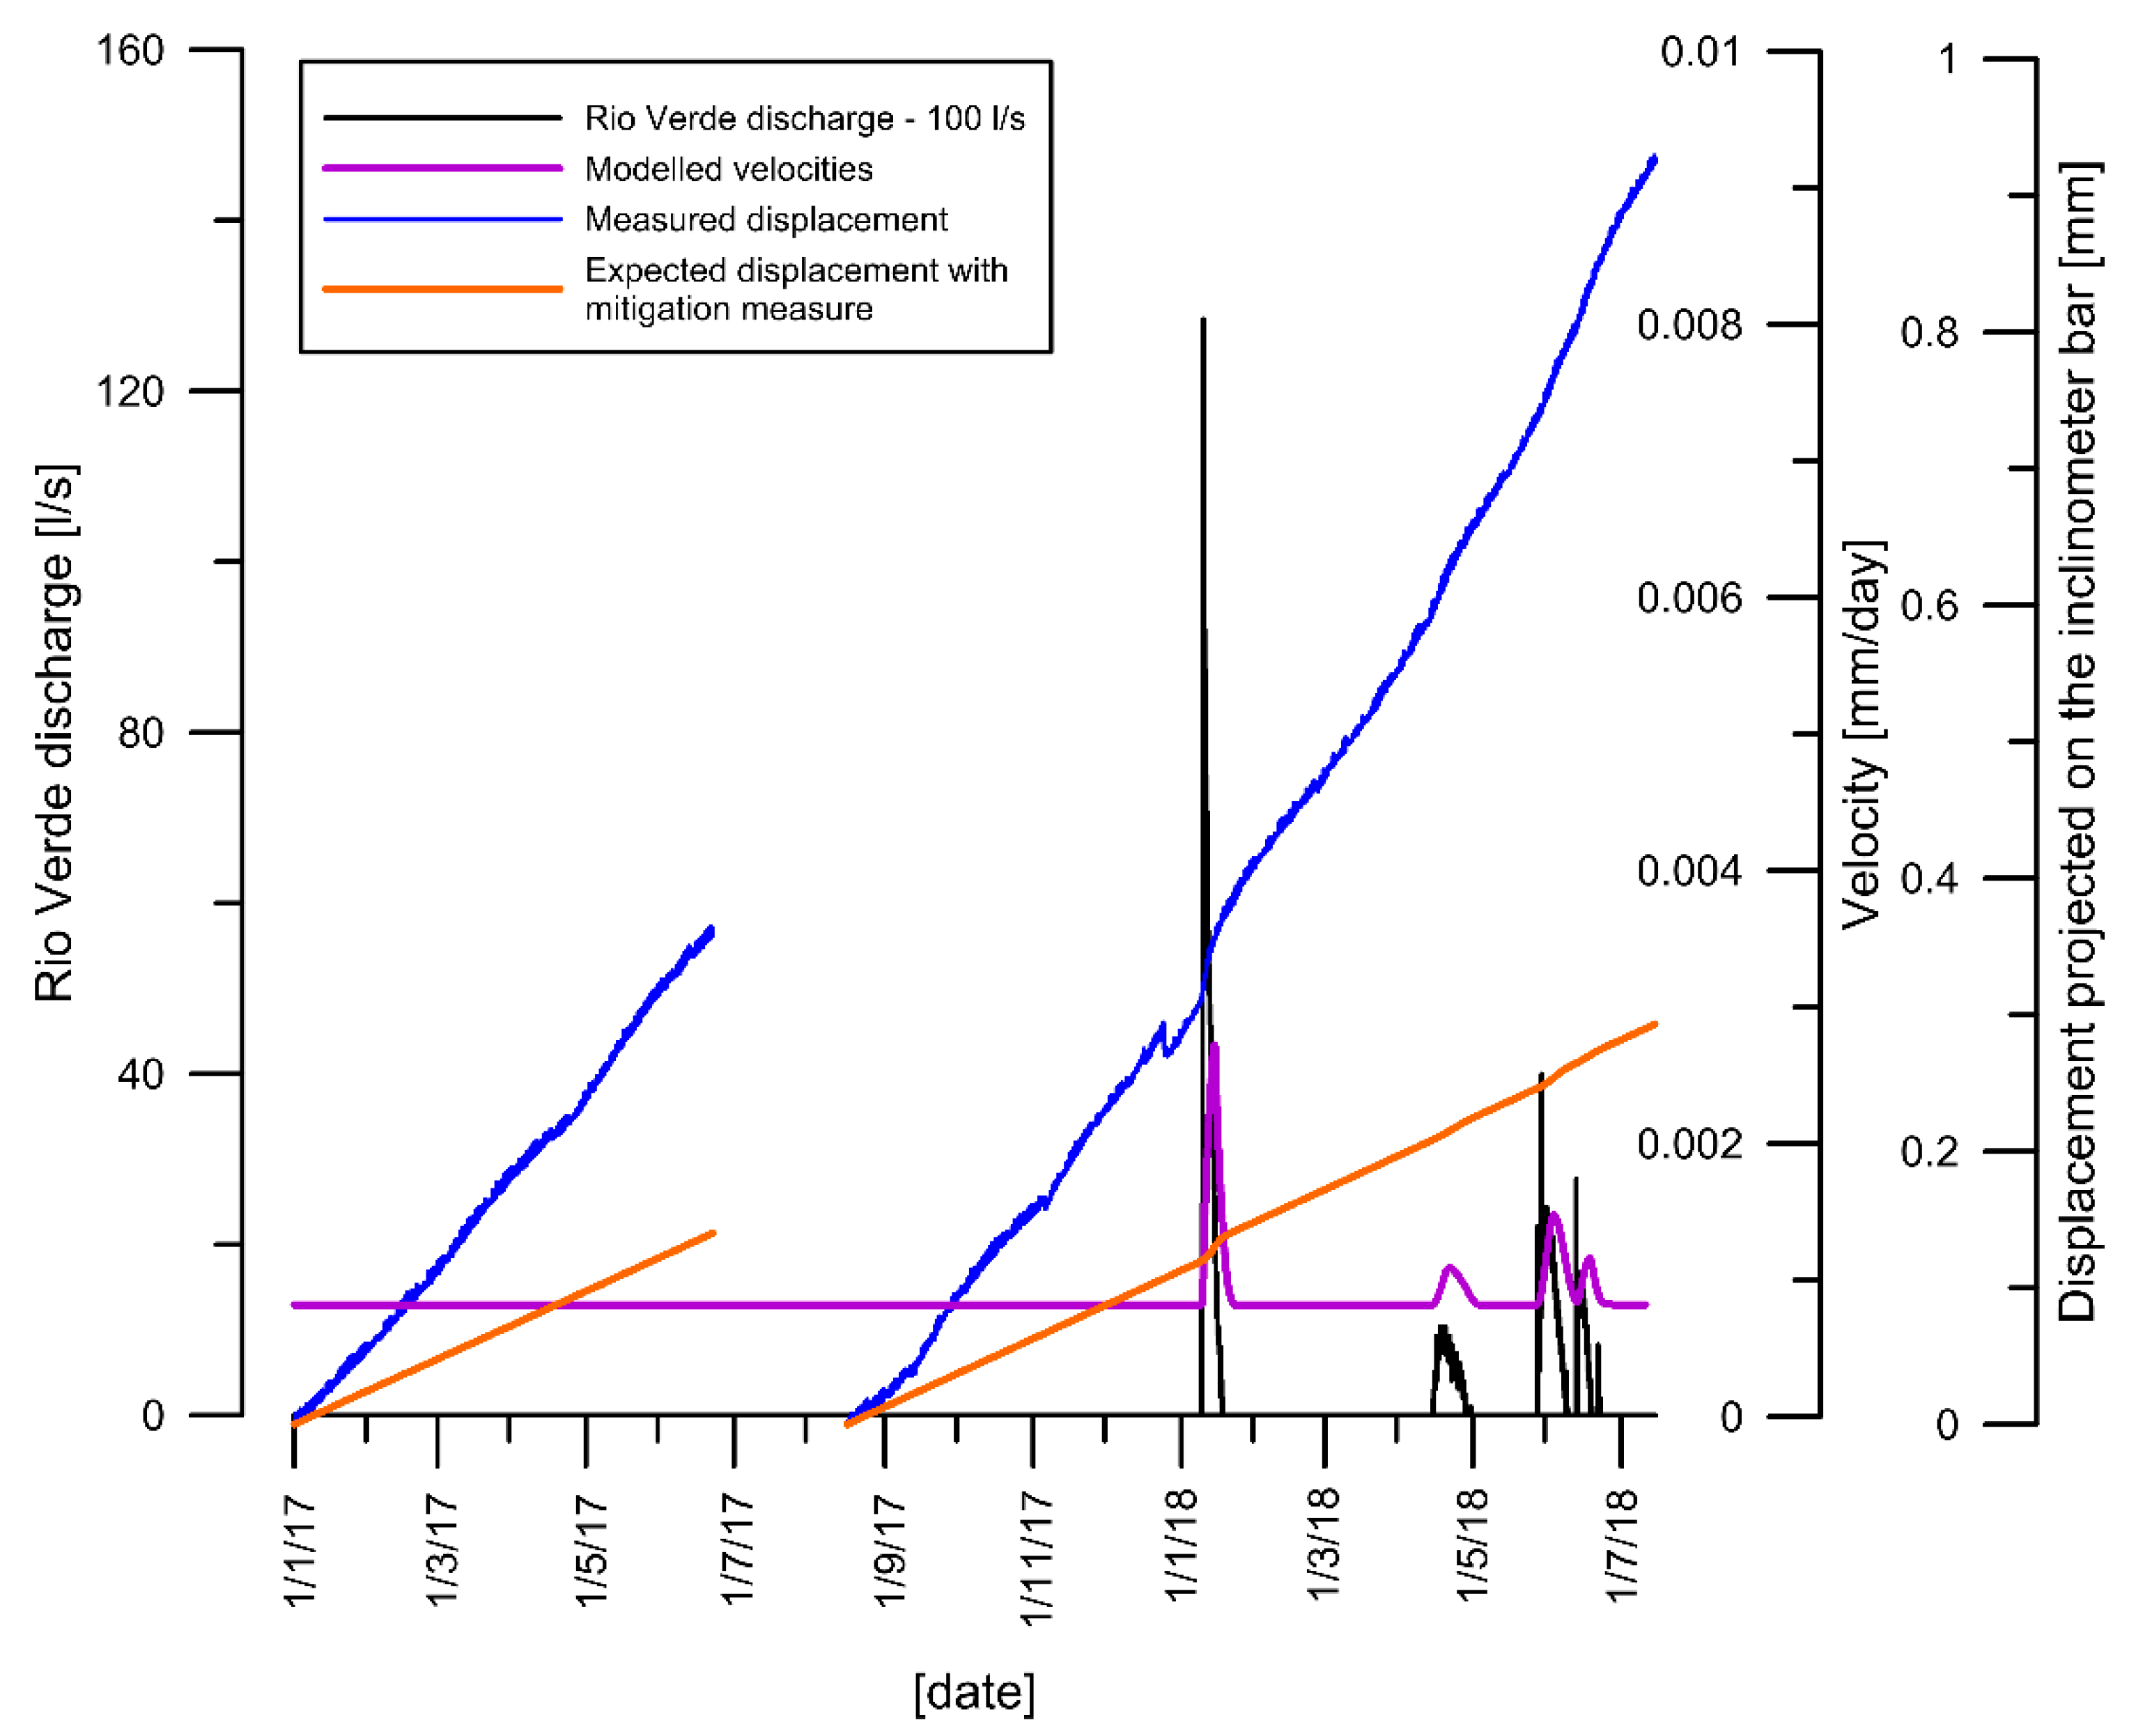
It is possible to calculate the expected deformations using Equation (1), supposing the total interception of the discharge for values lower than 100 l/s. The equation provides a minimum velocity even with flow rates equal to 0 l/s. The result of the simulation according to the flood for the years 2017/2018 compared with the measured displacement is shown in
Figure 7.
The expected improvement has been assessed considering two periods of actual recordings, one between January 2017 and June 2017, in which the flow never exceeded 100 l/s, and a second from August 2017 to July 2018, in which there where periods of discharge exceeding the 100 l/s threshold. The reduction of displacements induced by the presence of the interception mitigation measure is equal to 61% in the first period of analysis and 68% in the second period. Assuming a linear trend of the movements in the interval of the I21ter malfunction, the overall improvement increases to 79%.
The proposed mitigation strategy is low-impact and low-cost compared with other structural countermeasure works such as re-profiling with the deployment of infill at the foot of the landslide [
40]. In any case, the sequestration of most of the discharge from the Rio Verde would be needed to allow the deployment of earth embankment at the toe of the landslide, since the area is at the moment crossed by the stream. Furthermore, downstream of the weir, the Rio Verde riverbed is spotted with local erosion and small instabilities due to the presence of the clayey landslide material. The construction of stable earthworks would be possible once the movements of the landslide were reduced with water sequestration.
7. Conclusions
This work describes how long-term monitoring of a landslide may highlight specific dynamic patterns of a slope instability phenomenon and point to new, “tailor made” mitigation strategies. It may also induce other researchers to evaluate the feasibility of the installation of weirs to measure river discharges in unstable slopes with similar morphology. Our experience shows that it is possible to produce a data-driven landslide structural mitigation strategy even if no formal characterization of the governing rheology has been identified. At the moment, in fact, we do not have geotechnical laboratory tests that unequivocally link the landslide mechanism with the soil properties. In this framework, gathering several years of monitoring data is fundamental to untangle and properly characterize the interaction between the landslide and the potential triggering factors.
The prosecution of the monitoring activity in Frana 1-2 after the construction of the water intercepting structure will allow to control if the expected mitigation of the displacement is validated. In fact, through discharge control, there will be an active feedback in the landslide cinematic and a feed-forward response. In this case, the site will become an experiment where, through the control of the input (water discharge), the hypothesis regarding the causal effect can be re-tested.
