1. Introduction
The prediction of shear-wave velocity (Vs) is critical for site response analysis in areas prone to destructive earthquakes. For example, in 2004, Aceh Province in Indonesia was hit by one of the biggest earthquakes of the last several decades worldwide, and it caused massive loss of life and property. To mitigate the loss of life and damages from devastating earthquakes in the future, many researchers [
1,
2] around the world have studied the site effect of ground motion. The authors of [
3] also performed an investigation of the Vs structure at a depth of greater than 30 m to derive site effects after the Tohuko earthquake.
Furthermore, some researchers [
4,
5,
6] have also studied the properties of shallow subsurface material by inverting the phase shear-wave velocity from microtremor surveys. The phase shear-wave velocity derived from microtremors versus frequency demonstrates the characteristics of near-subsurface ground [
7]. Thus, having the Vs structure can be useful and is widely applied for generating the amplification factor, from which the microzonation map can be established [
8].
The identical research has also been performed [
9] by identifying near-surface soil using Poisson’s ratio analysis in an area hit by a destructive earthquake (i.e., Pidie Jaya Regency, Aceh Province, Indonesia). The study involved Vs measurements using the multi-channel analysis of surface wave (MASW) survey. However, the shear-wave velocity (Vs) structure in Banda Aceh and Aceh Besar Regency has not been intensively studied. Previous studies [
10] have only analyzed the average shear-wave velocity (Vs
30), and a geotechnical study [
11] applied the cone penetration test (CPT) to investigate the level of vulnerability to liquefaction and the bearing capacity in Banda Aceh. Their results show that there is a high susceptibility to liquefaction in Kuta Alam and Syiah Kuala Subdistrict, with a moderate liquefaction degree in Banda Raya. The earlier studies neither investigated the shear-wave velocity (Vs) below a depth of 30 m, nor conducted a Vs structure analysis that approximately covers the Krueng Aceh Basin.
The comprehension of near-surface strata profiling is crucial for understanding the complex underground features of the 2004 tsunami flood in the Krueng Aceh vicinity [
10]. This understanding is very important for viewing the Vs structure of the Krueng Aceh Basin. The output of the Vs structure could be critical for generating a microzonation map in other forthcoming studies. The relationships between shear-wave velocity (Vs) and the geological unit may prove to be valuable when producing and developing microzonation maps [
12]. A similar application, microtremor measurements, for generating Vs was utilized to produce a microzonation perspective in Haiti [
13], where creating a seismic microzonation map was a vital part of precise site grouping related to code-based seismic design and production of the best possible seismic plan.
Recently, Banda Aceh City has become a densely populated urban area. It is geologically located on a basin flanked by two active fault segments: The Seulimeum and Aceh Segments [
15]. This tectonic setting should be of considerable attention for researchers. These active faults could potentially generate a devastating earthquake and possibly amplify the shaking of the young sediments of the Krueng Aceh Basin. A previous study [
14] showed that these active faults flank the graben-type structure where the Krueng Aceh Basin was formed. The graben was filled to more than 179 m in depth [
14,
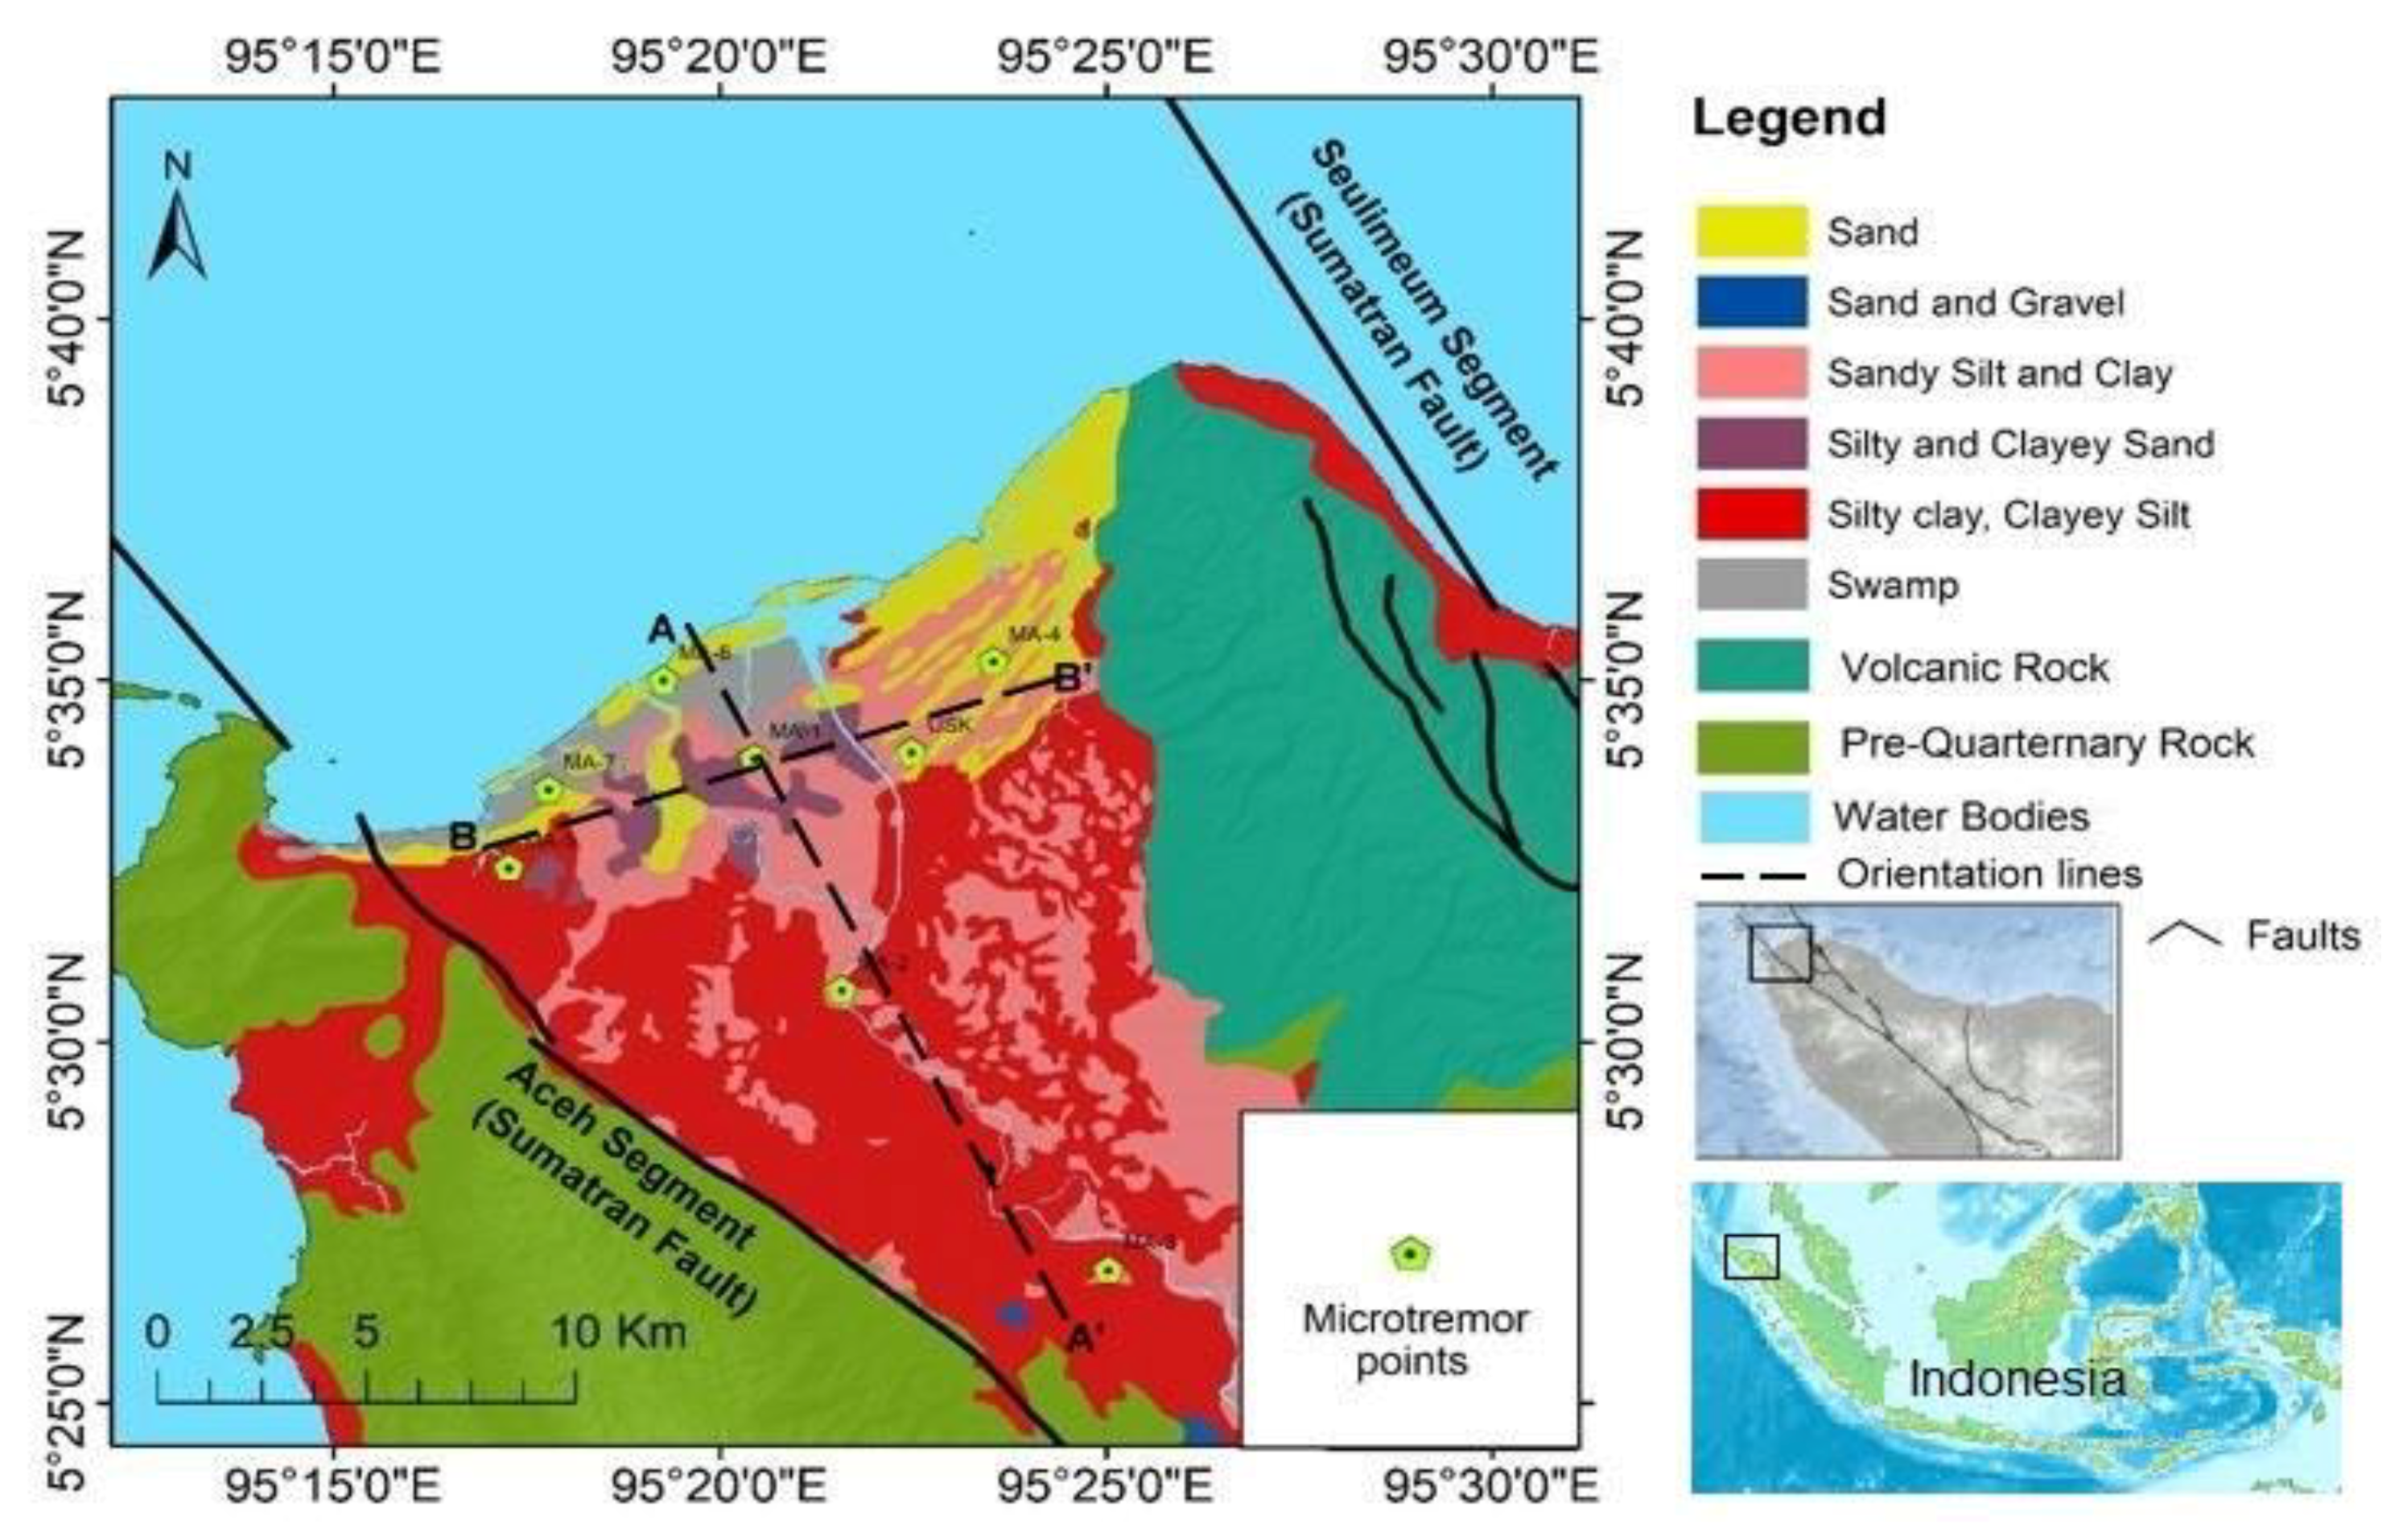
16] by different lithological deposits, such as silty clays, clayey silt, sandy silt and clay, silty and clayey sand, and gravel. These deposits are from the Quaternary period, as shown in
Figure 1.
Among the potential geophysical methods, the microtremor survey method (MSM), rather than conventional seismic methods such as seismic refraction and reflection, was applied in urban areas and effectively contributed to geotechnical matters that allowed the Vs structure to be generated [
17]. The method was previously implemented [
18,
19] in the Kanto Plains of Japan to serve the deeper structure of Vs. Applying the microtremor measurement is very helpful because it is rapid, easily applicable to a town or city, and cost-effective [
20].
On the basis of the previous global and local studies mentioned above, combined with the importance of the Vs structure to the geological and tectonic perspective of the Krueng Aceh Basin and the limited local studies of the Vs structure in Banda Aceh, it is imperative to estimate the Vs structure in the Krueng Aceh Basin vicinity (Banda Aceh and its suburbs). To provide the Vs structure, a microtremor investigation was performed at eight points that were distributed to approximately cover the Krueng Aceh Basin area, as seen in
Figure 1. This research aims to (1) estimate the shear-wave velocity (Vs) structure of several points in Banda Aceh and its suburbs (Aceh Besar) at a depth reaching more than 30 m, (2) illustrate the appearance of the sediment structure of the Krueng Aceh Basin, and (3) provide information about the sediment structure by revealing the strata characteristics and the approximate timing of the strata’s formation.
2. Materials and Methods
The equipment deployed in the field for the microtremor survey is listed in
Table 1. The equipment consisted of four seismometers, six connecting cables connected to the seismometers and data logger, a PC for data processing and monitoring, and a battery.
The seismometers used in this study were made by the Sato commercial company, model MTK-1V, and have the following specifications: output sensitivity of 13 V/cm/s (natural period 1 s), 0.25 V/cm/s (natural period 7 s); frequency range of 1–50 Hz (natural period 1 s), 0.13–50 Hz (natural period 7 s); measuring direction of up and down; conversion system of velocity-type (conduction-type); range of ±2 mm; and operating temperature range of −20 to +50 ℃. The seismometers were deployed to record the ambient noise generated from an environment whose frequency band is 1–15 Hz. The ambient vibrations originate from various sources, such as human work (traffic and machinery) and natural phenomena (winds and ocean waves) [
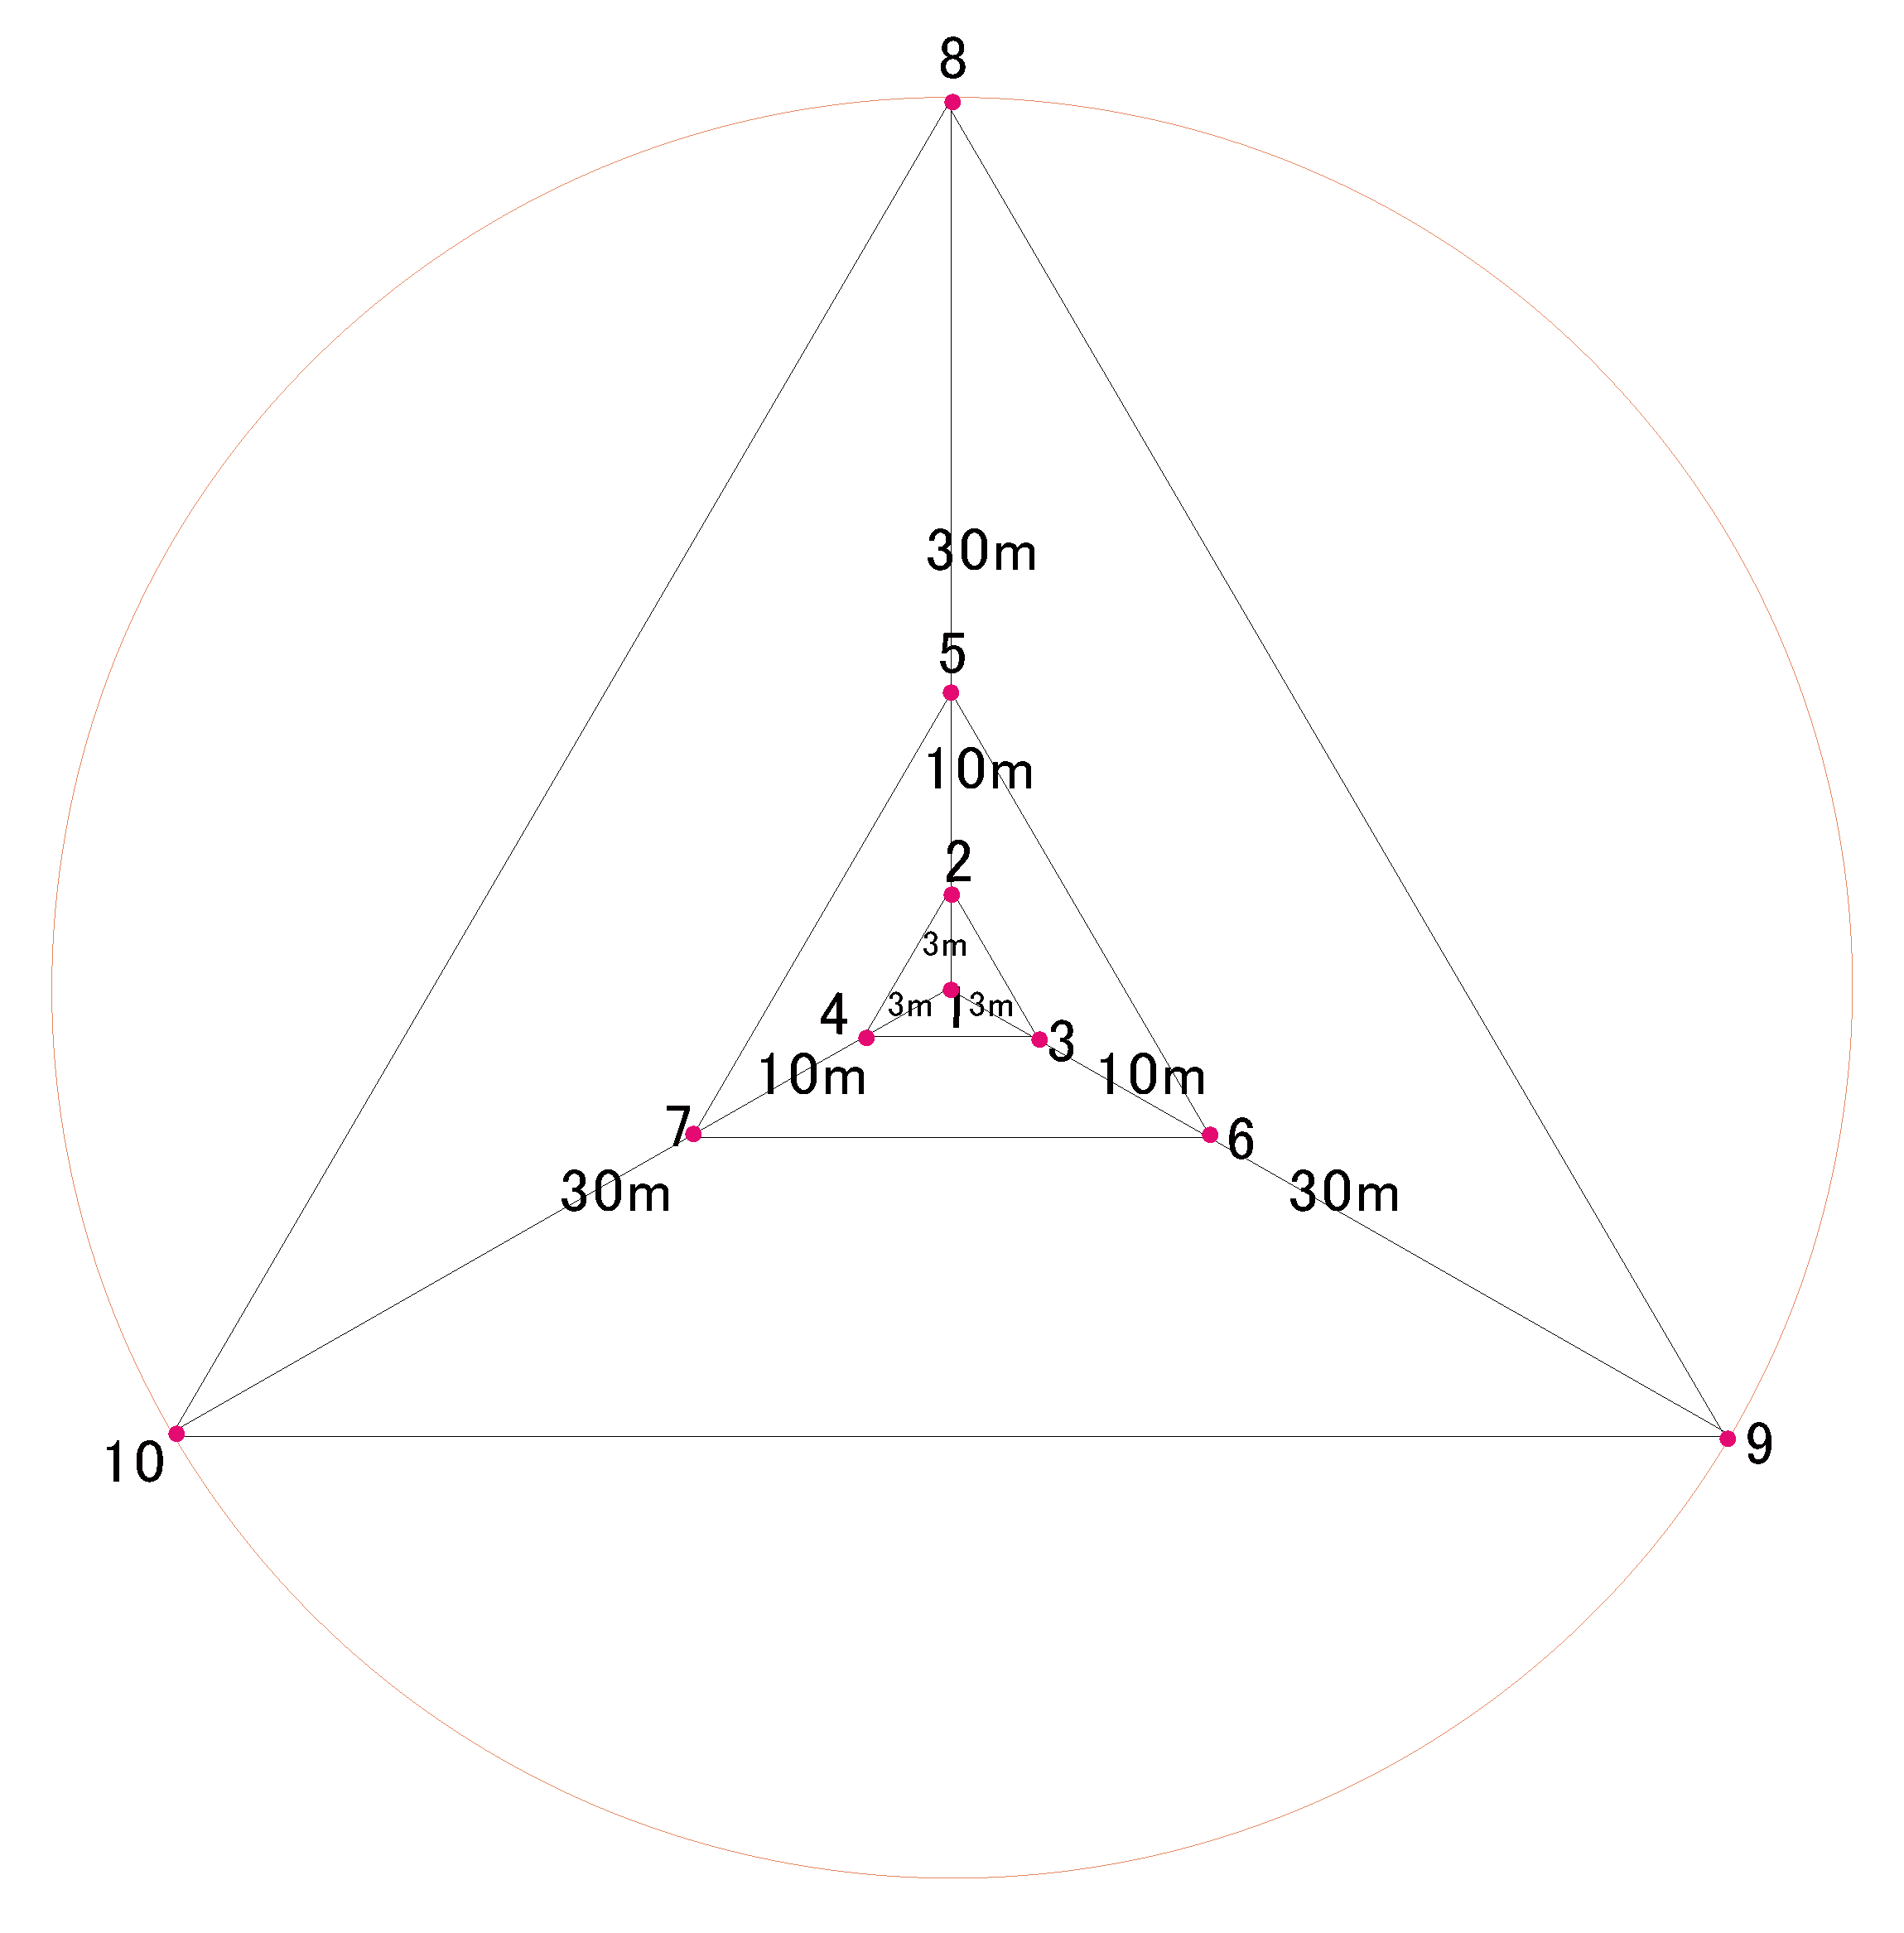
21]. The seismometers were laid out in a triangular array, which is also called the M-station circle array [
22], as seen in
Figure 2.
Four seismometer stations were set up so that each point for determining Vs was measured for the three different array sizes. Three seismometers were placed at each corner of the triangle and one seismometer was put at its center. The first, second, and third sizes of the triangles started from the smallest, followed by mid-sized, and then the largest of the array radii, with sizes of 3, 10, and 30 m, respectively. As seen in
Figure 2, the first triangle is the smallest array size and is marked by the numbers 2-3-4. Then, the medium-sized and largest triangles are numbered 5-6-7 and 8-9-10, respectively. The duration of the recording time was from 15 to 30 min; a consequence of using a large-sized array is that longer time is needed. Different array radii were designed to investigate different depths of strata. The geometry and the radius sizes of the microtremor array are pictured in
Figure 2.
A previous study [
22] also proved that placing three stations or seismometers at the circumference yields the most efficient results compared with using more than three seismometers in a circular configuration, provided that the spatial autocorrelation (SPAC) coefficient is kept at its first minimum number. The data were processed by utilizing the SPAC technique as proposed in many previous studies [
23], and widely used by many researchers [
24]. The SPAC method is very convenient, as it can produce wave scalar velocity for a multidirectional or omnidirectional wave field, and it expresses the relationship of the waveform between each point and each circle’s center point of the array as the coherence complex function (the real part). The average of the entire circumference (average orientation) is referred to as the spatial autocorrelation coefficient. This value is transformed into a Bessel function (first kind: zero-order), including the theoretical phase velocity equation to calculate the phase velocity from its inverse function [
25].
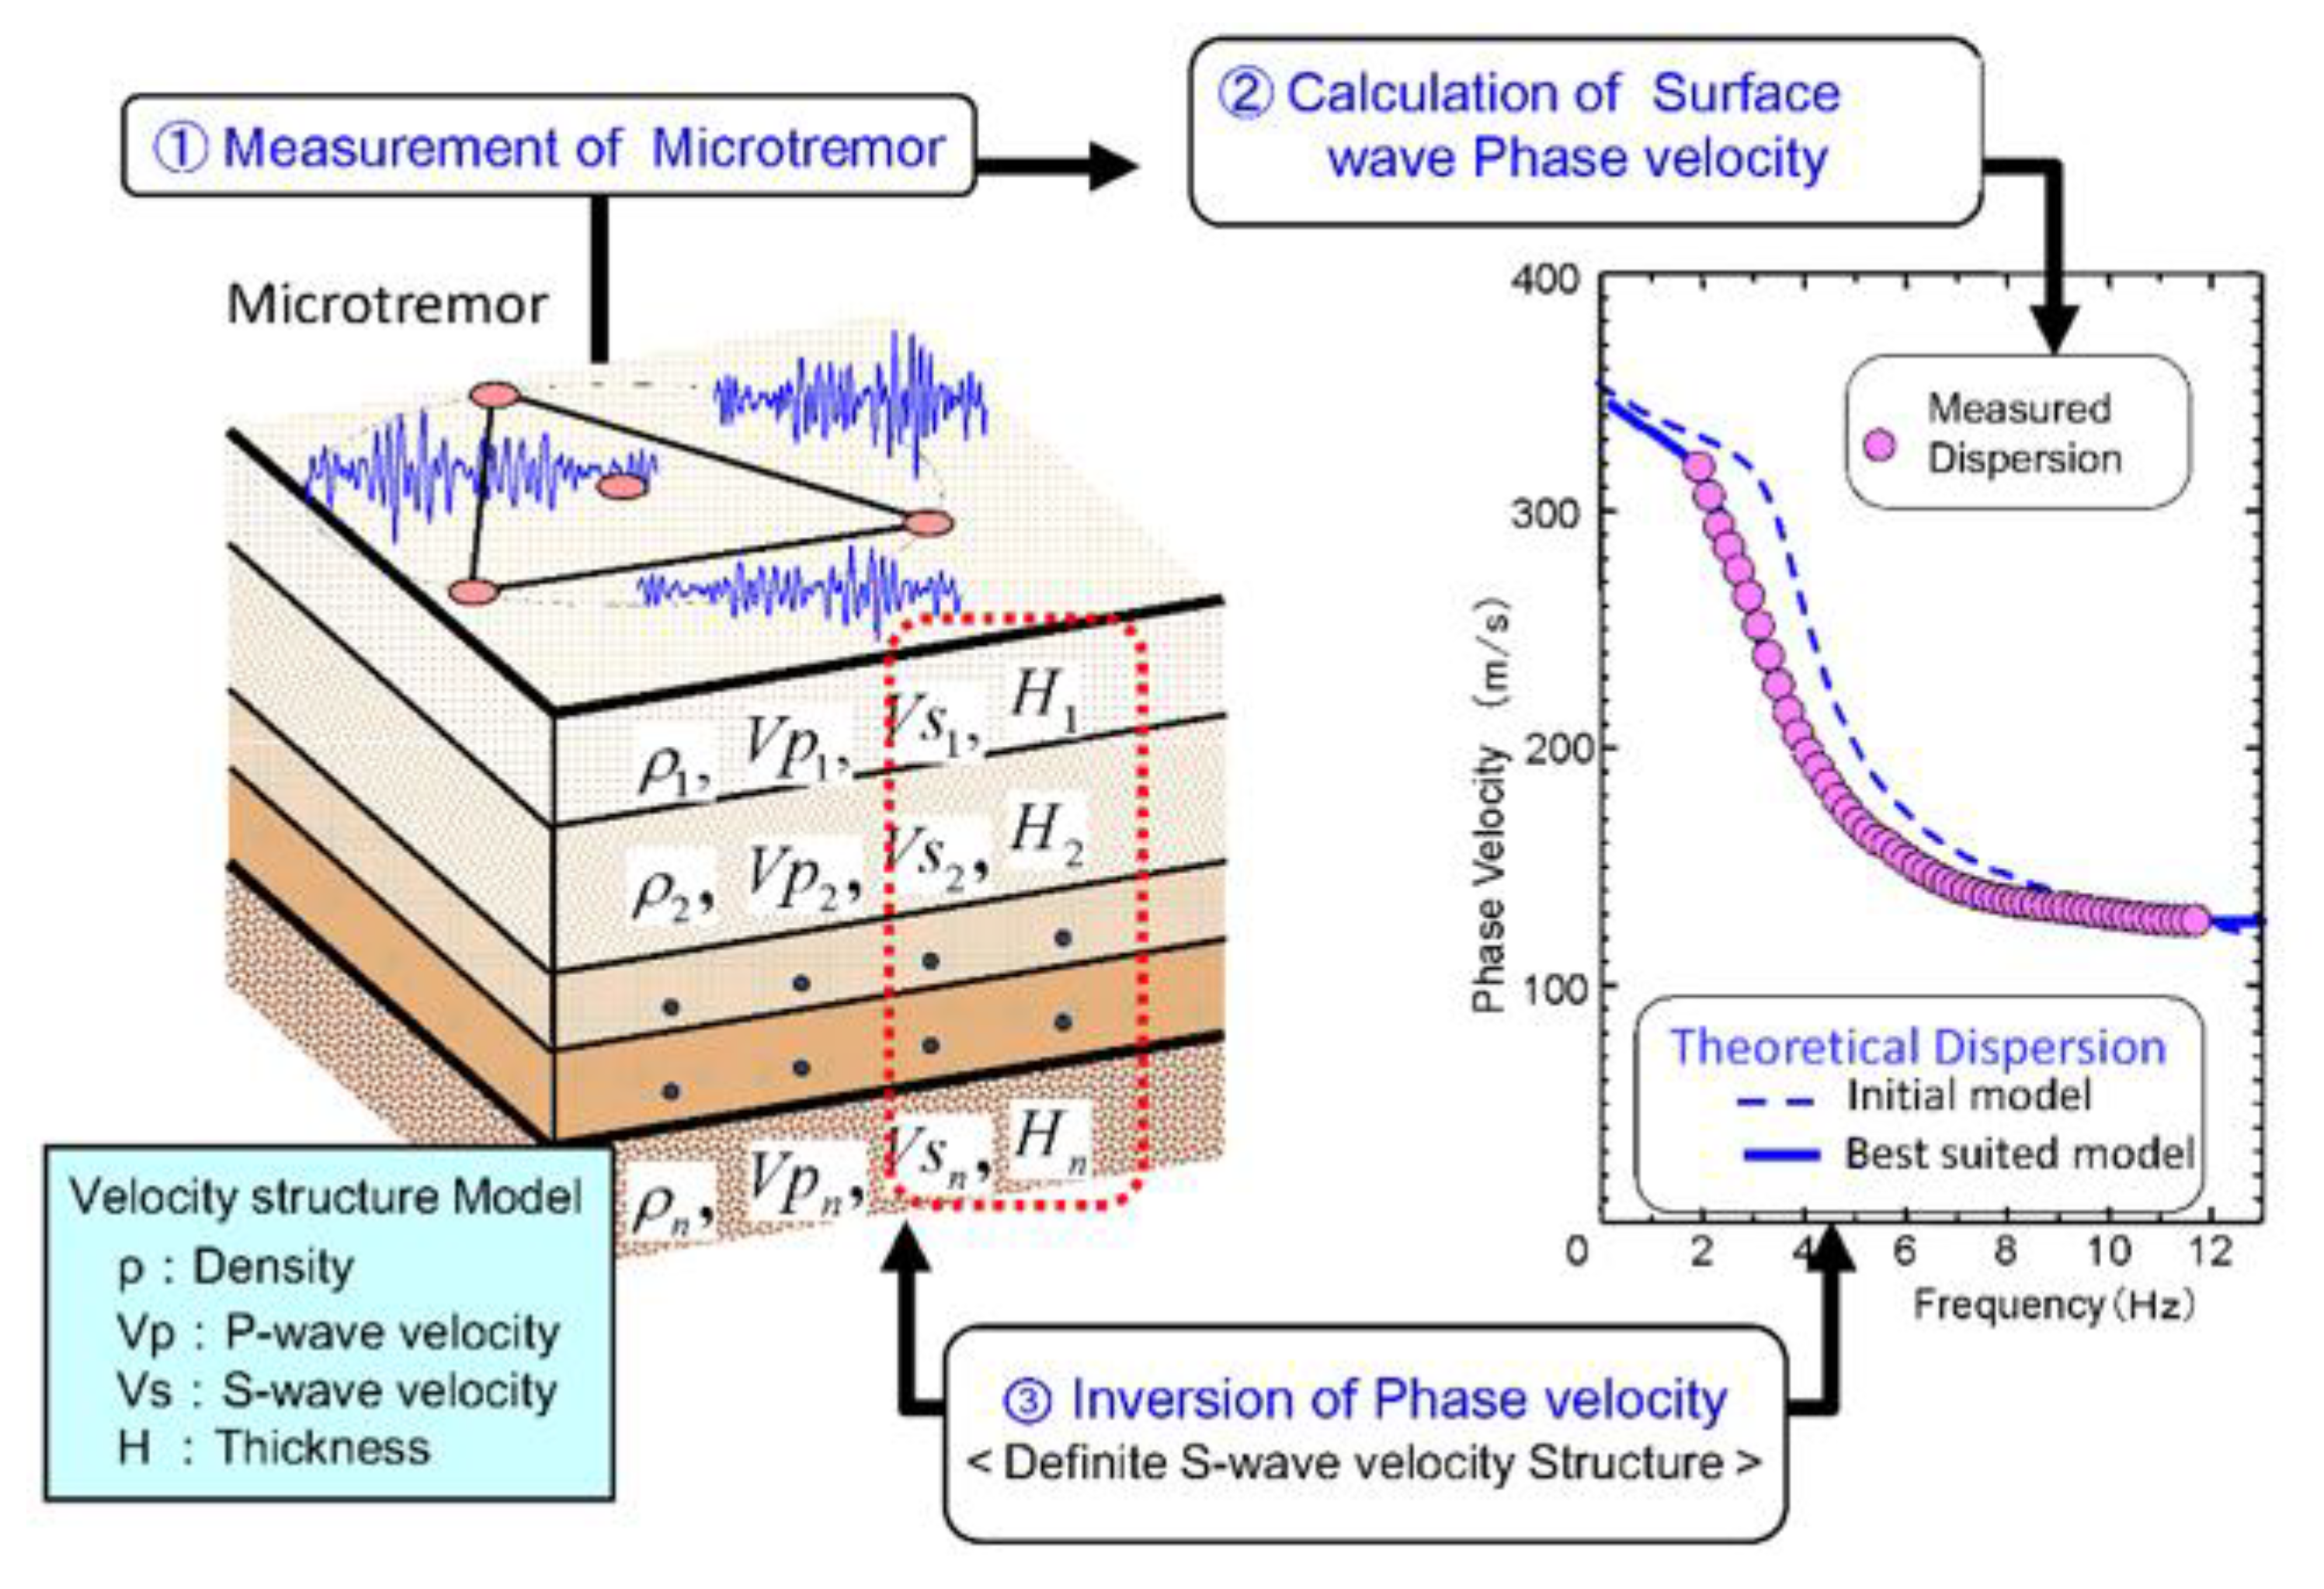
The shear-wave velocity (Vs) model was generated in several steps. The process was started by taking the microtremor measurement from the multipoint simultaneous probing. From that, the surface wave phase velocity was then computed to produce the dispersion curve. The final step was to invert the phase velocity, and the shear-wave velocity (Vs) models were thus obtained. The summarized data-processing methodology is the quantification of the S-wave velocity structure model, which is highly related to a geological structure because the S-wave and layer thickness have the strongest correspondence to the phase velocity (high sensitivity) in the variable number of the velocity structure model. The typical data processing steps are displayed in
Figure 3.
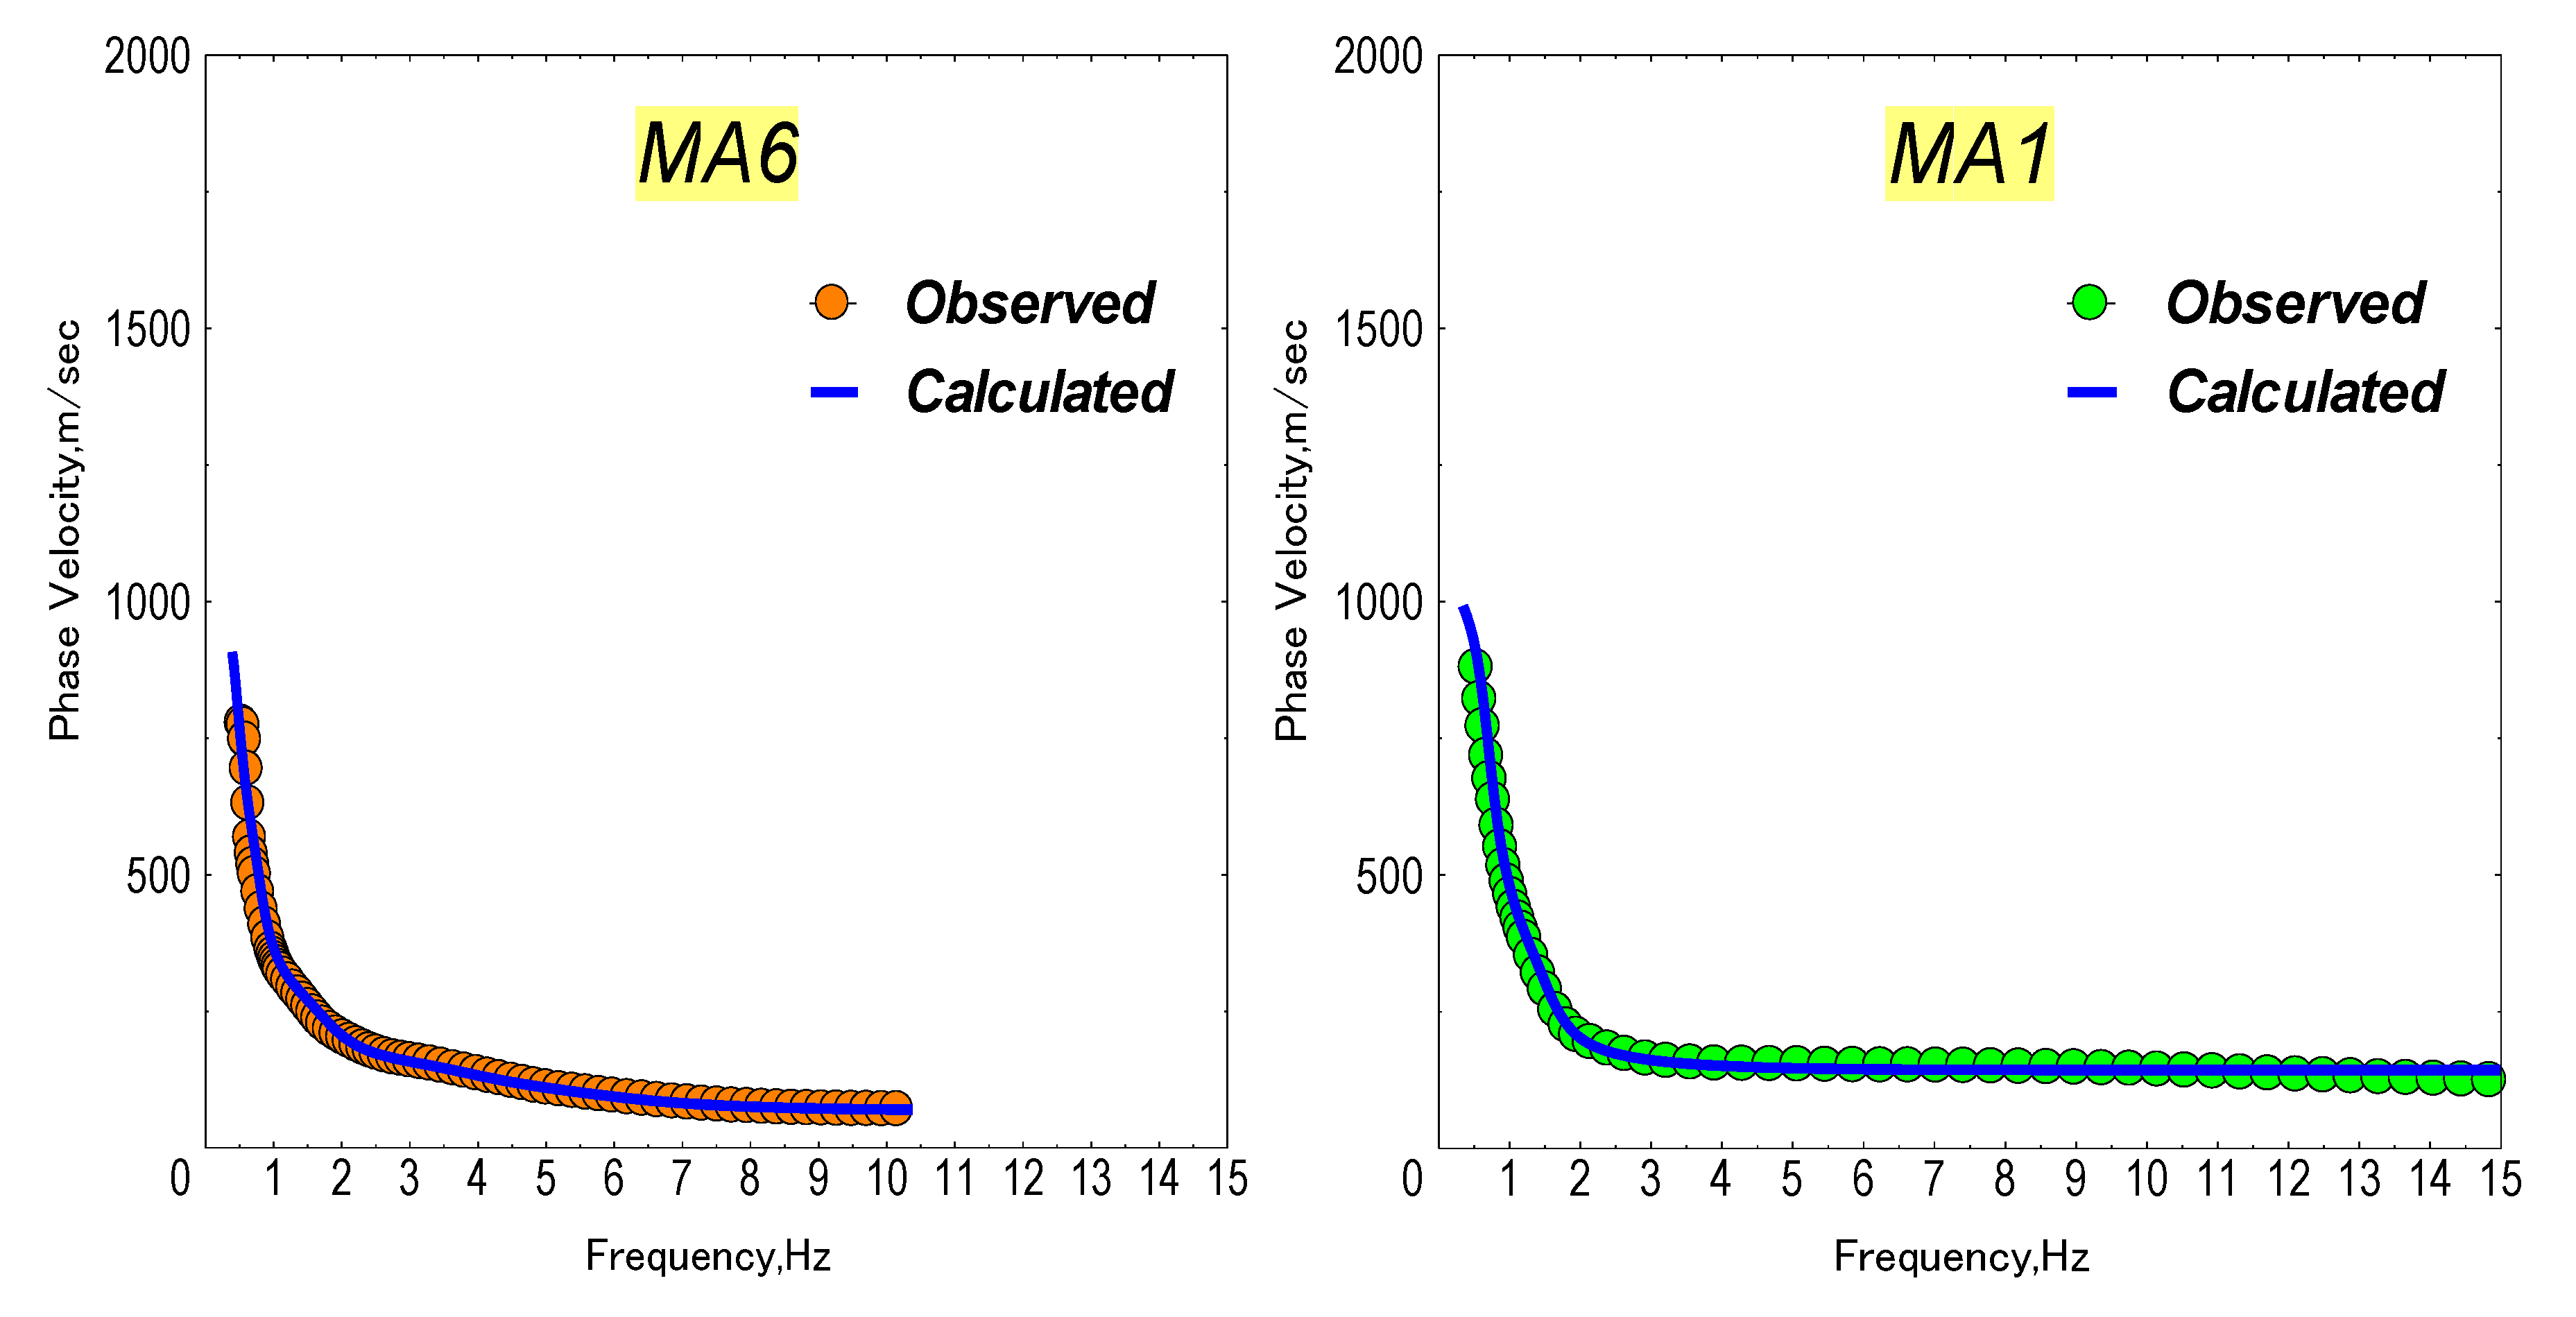
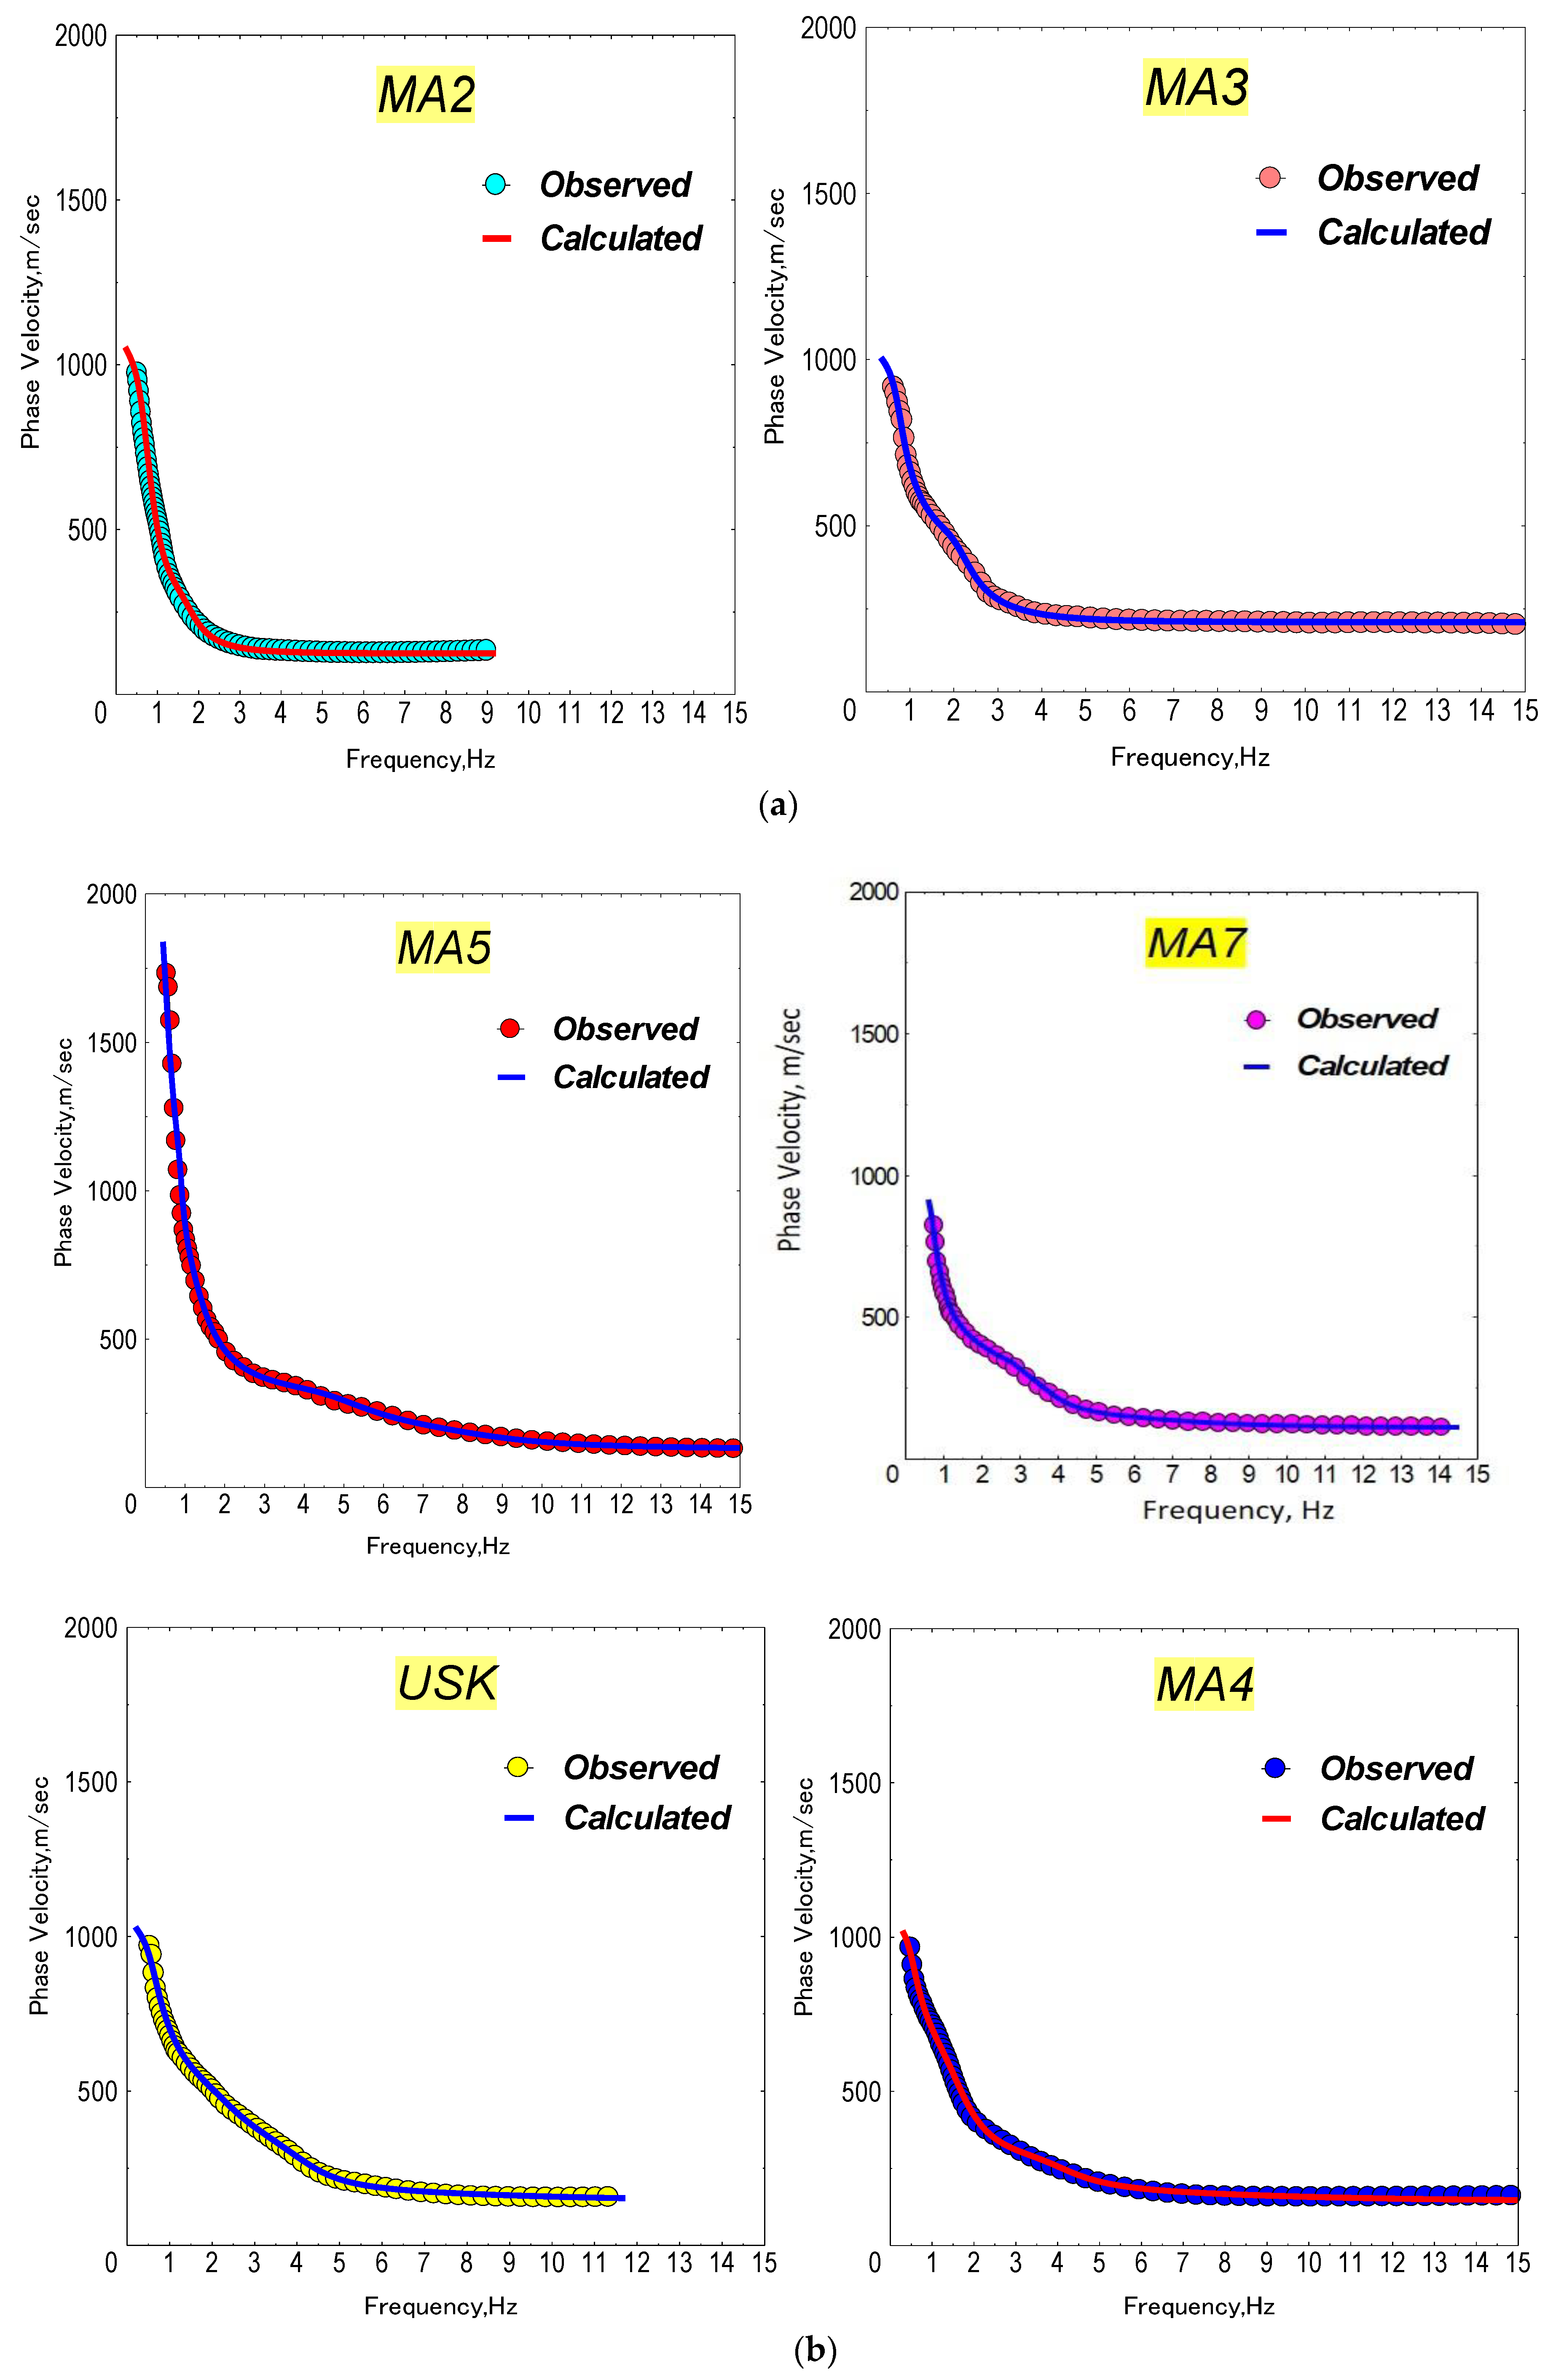
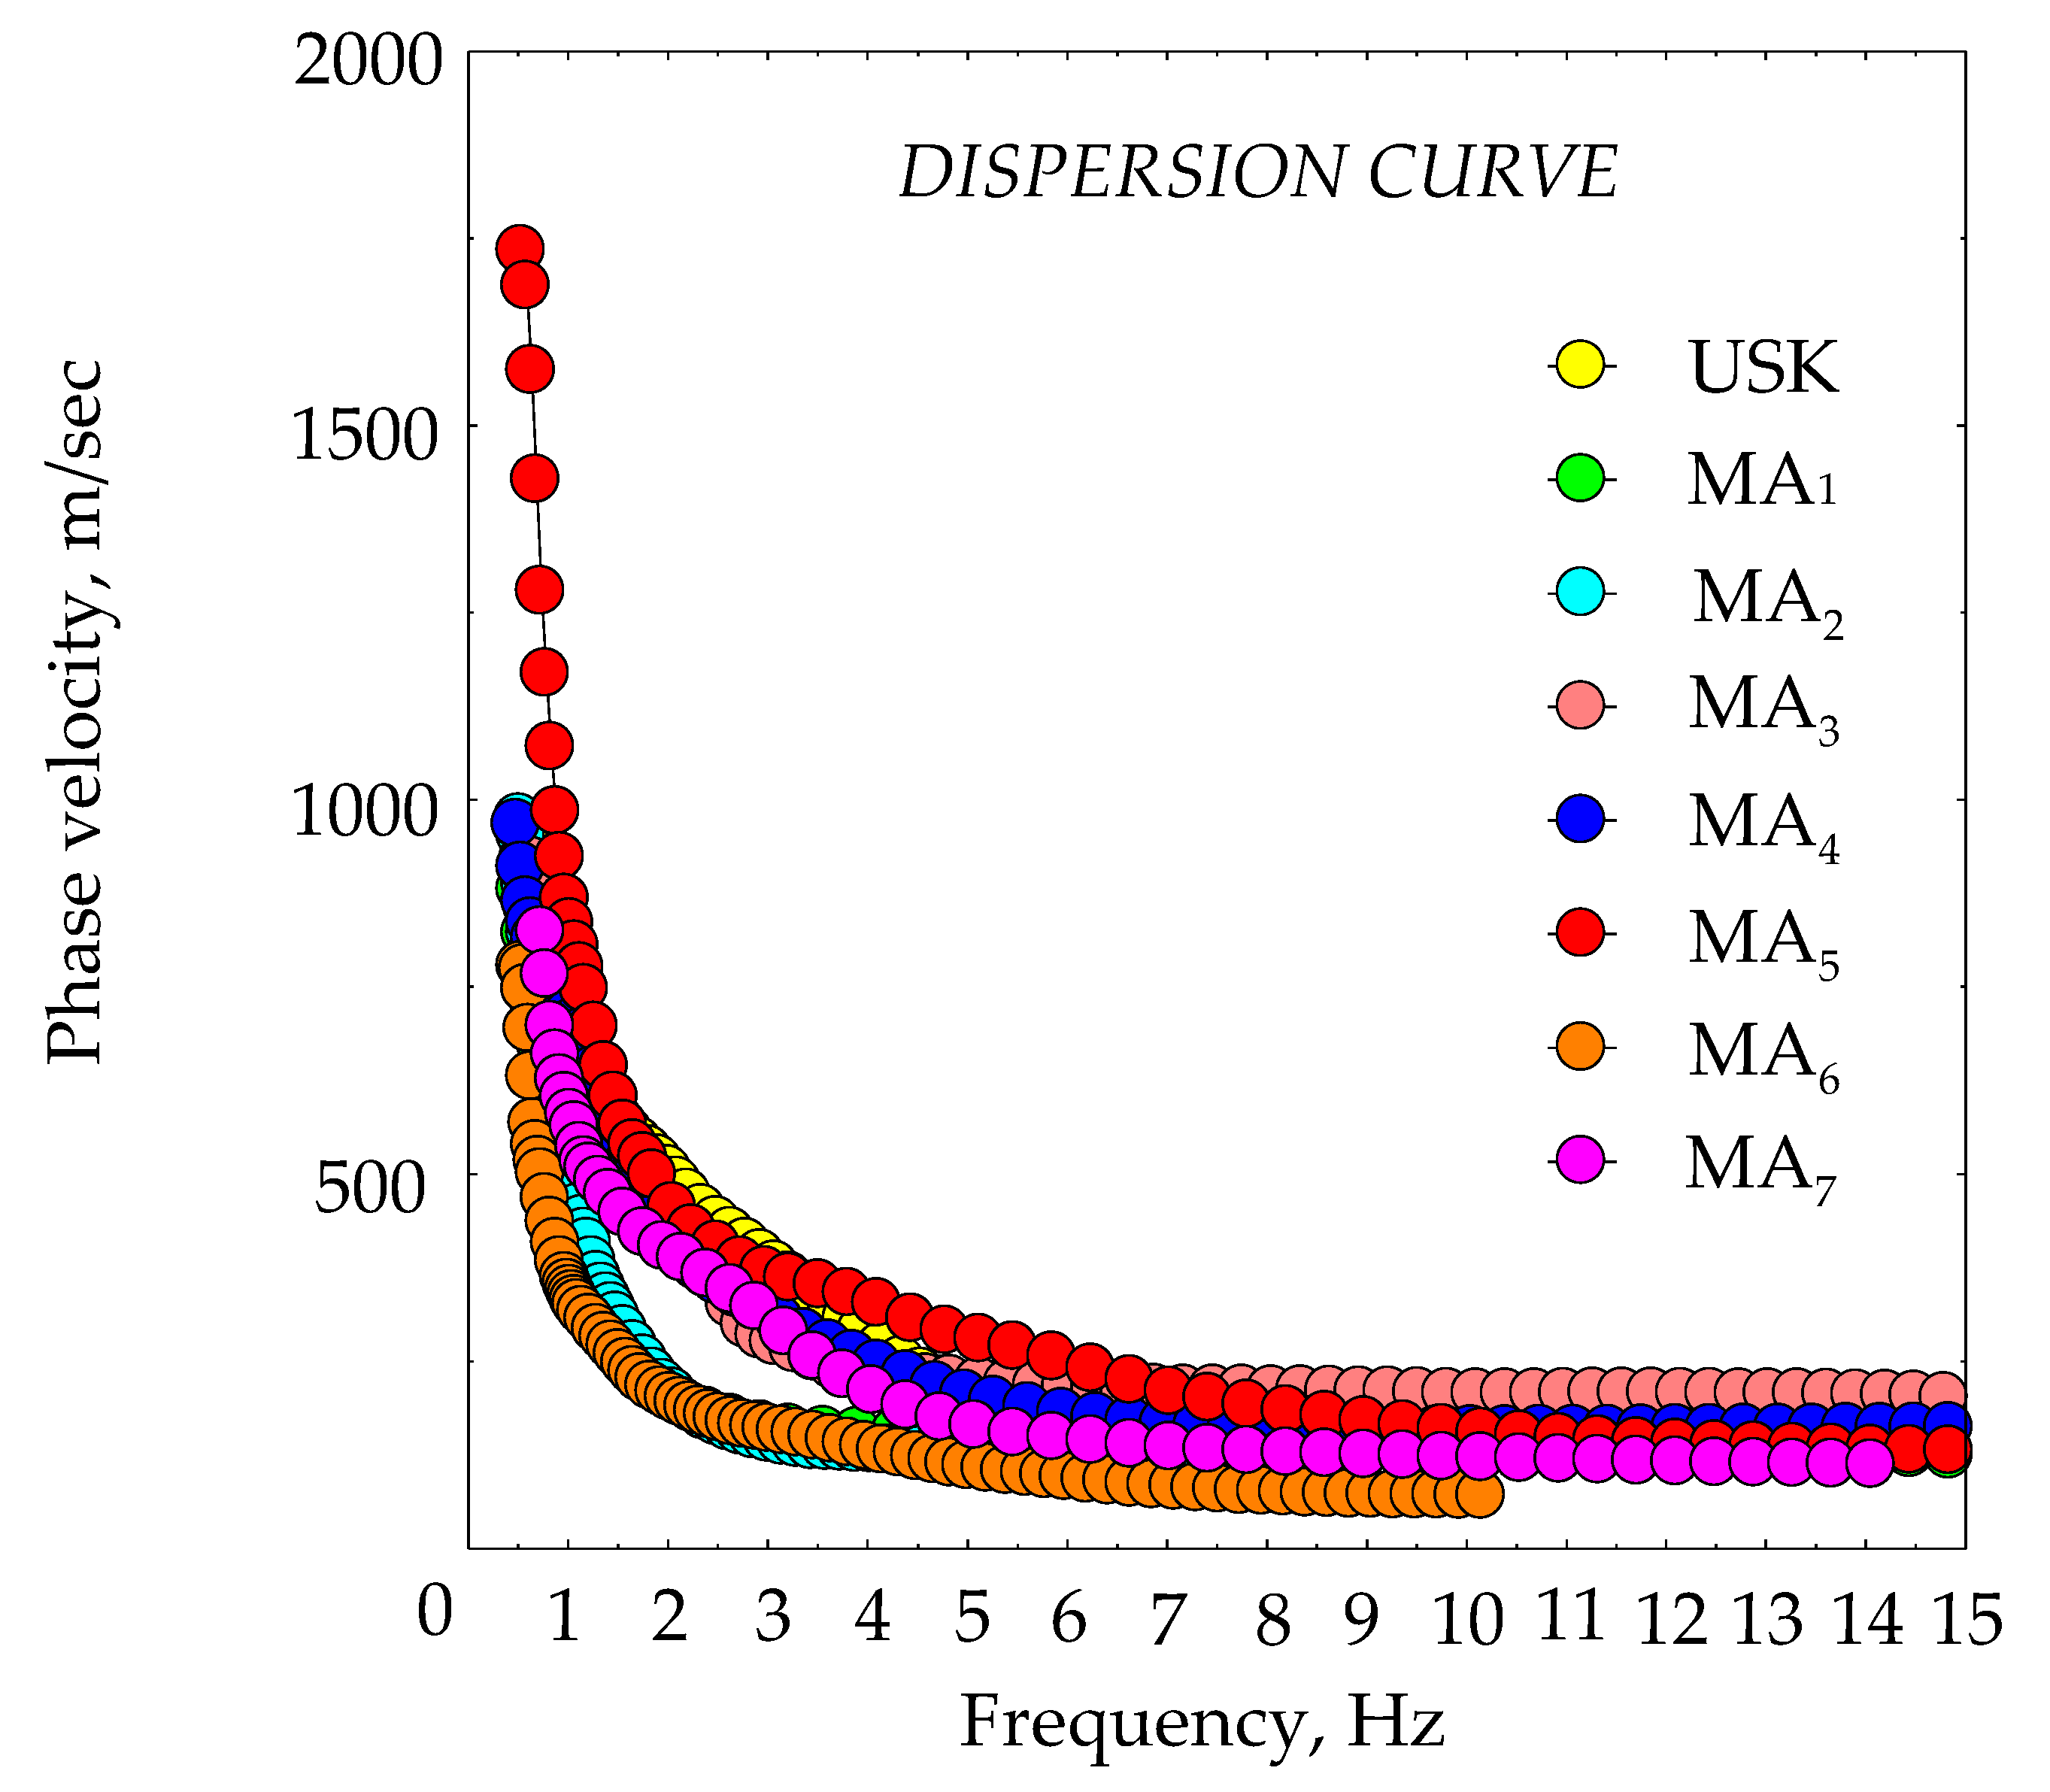
Finally, the above data-processing stages resulted in each of the dispersion curves, as can be seen in
Figure 4.
The dispersion curves in
Figure 4 could indicate that the phase shear-wave velocities (Vs) are higher than approximately 300 m/s, which is included in the higher mode [
25], in a frequency interval of 1–3 Hz. It is inferred that these shear wave velocities originate from the deeper strata. On the other hand, phase velocities lower than 300 m/s, as the fundamental mode [
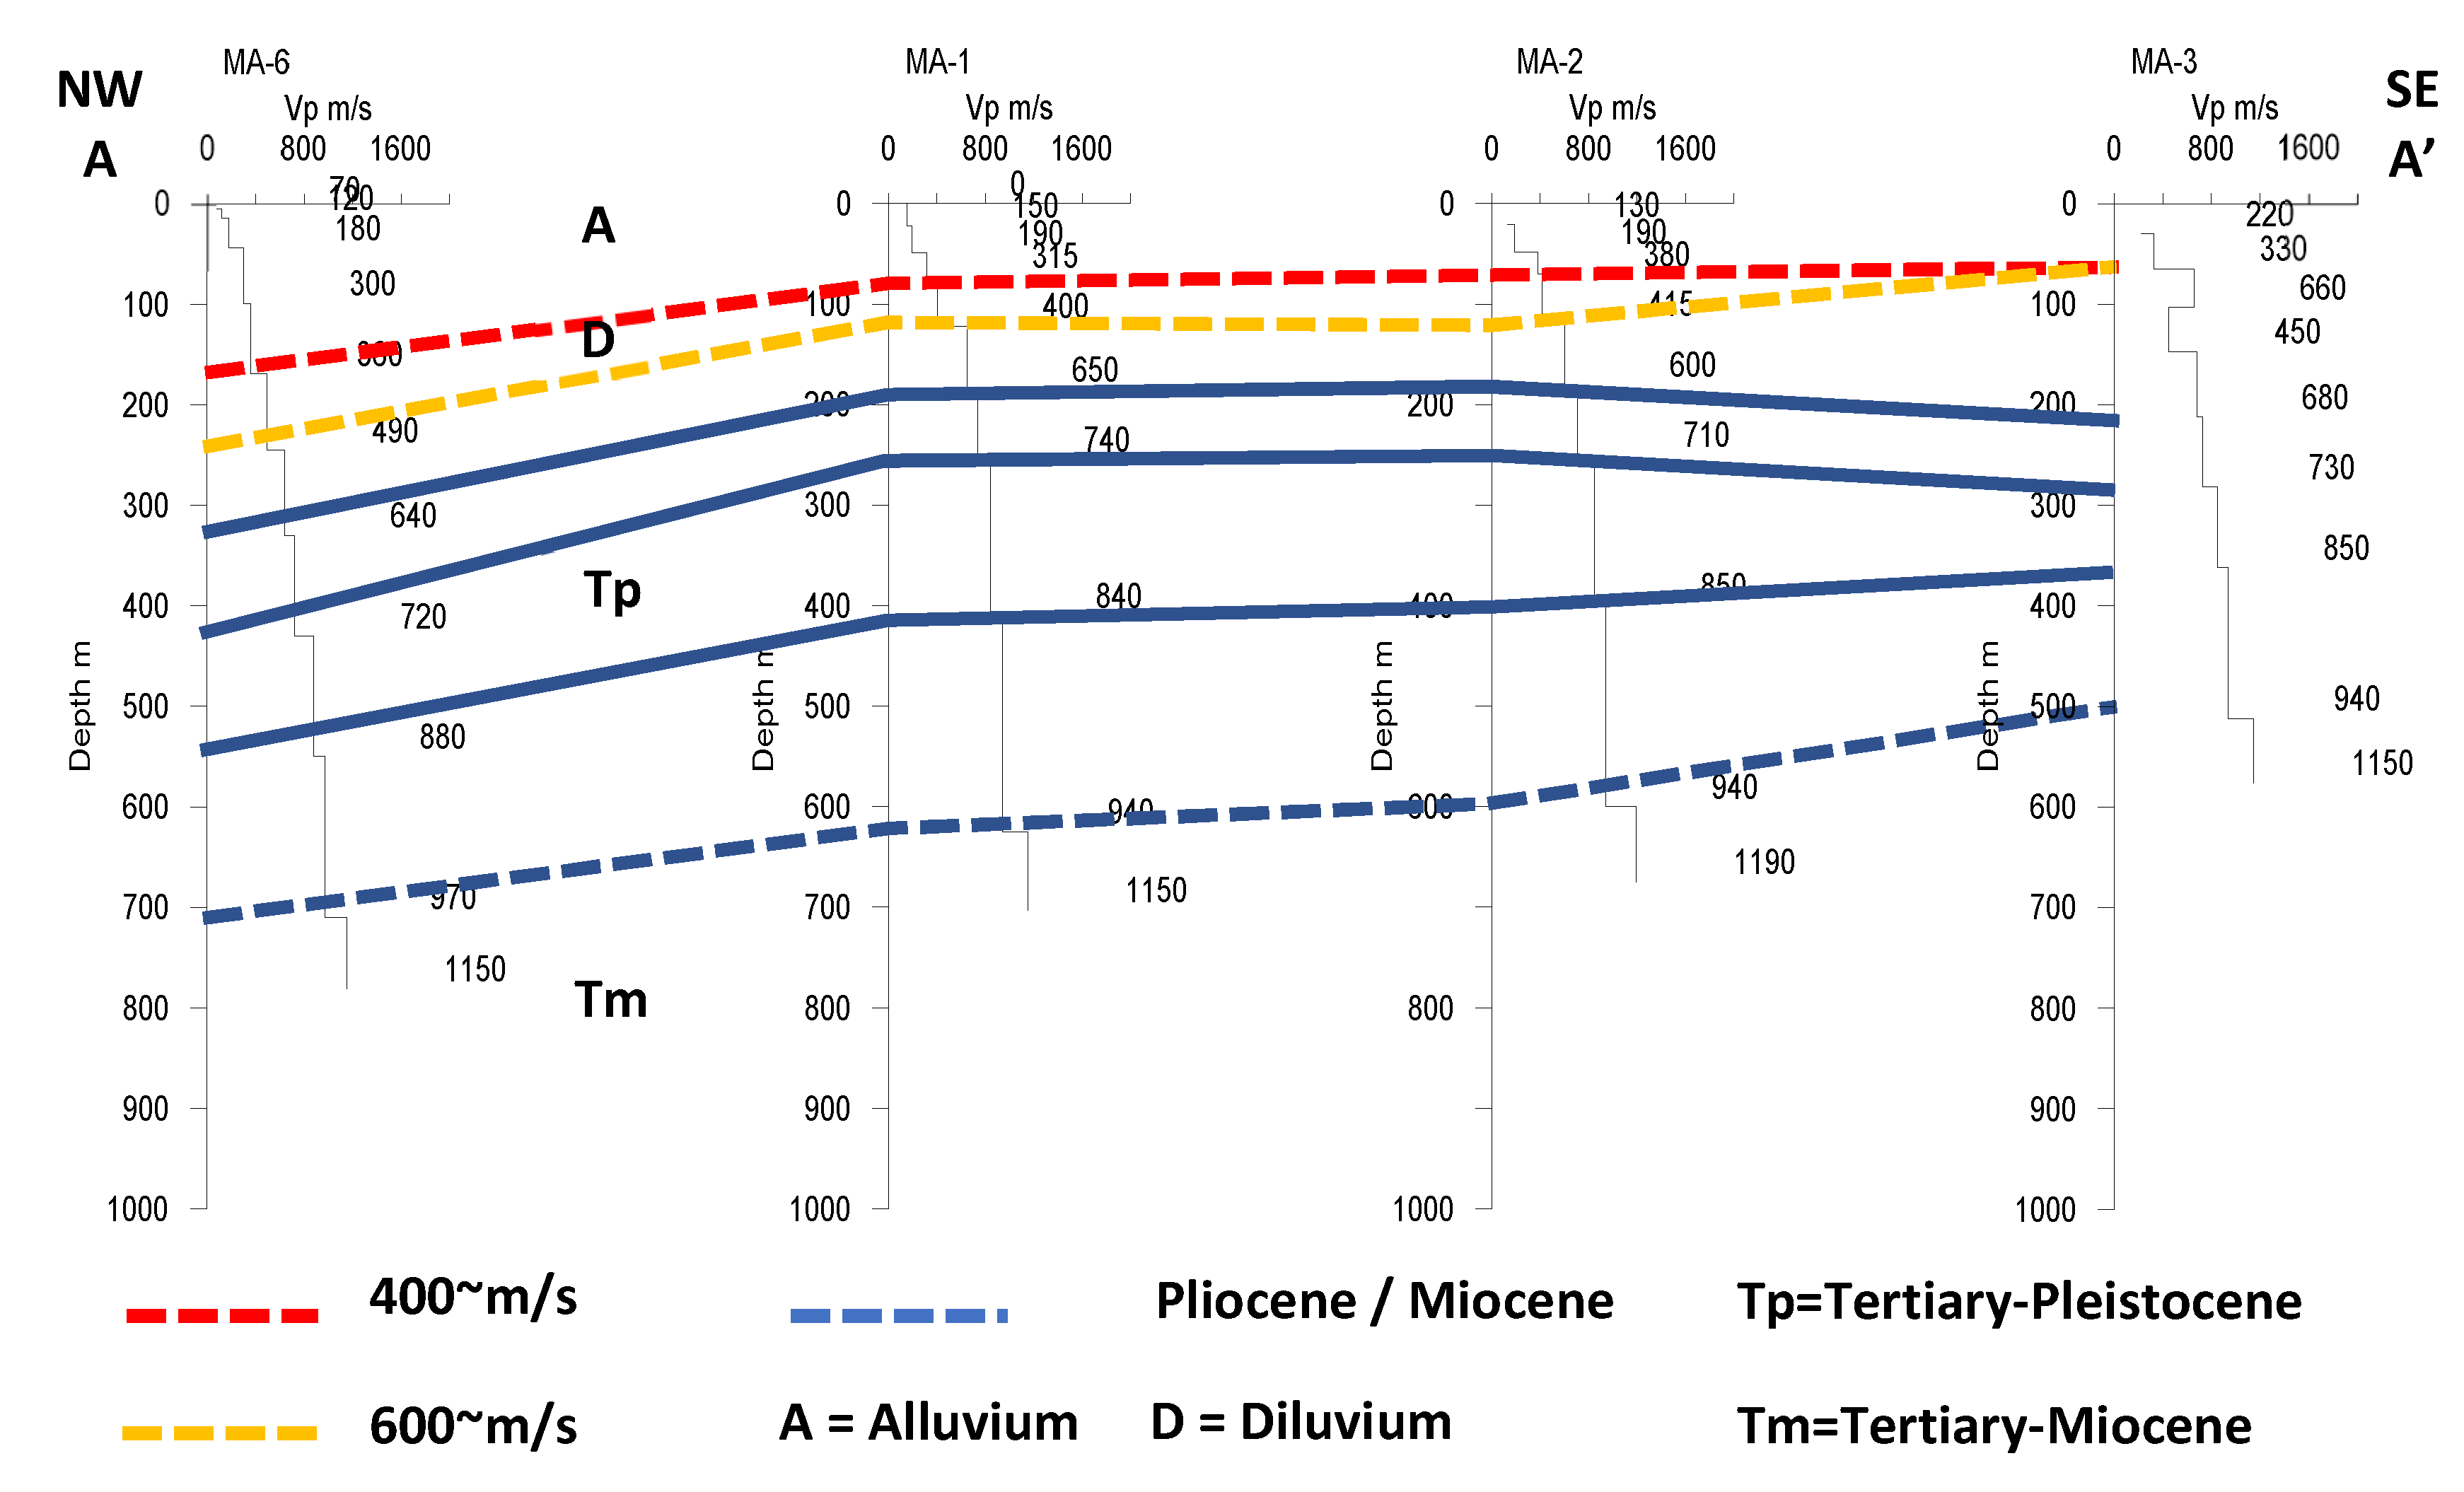
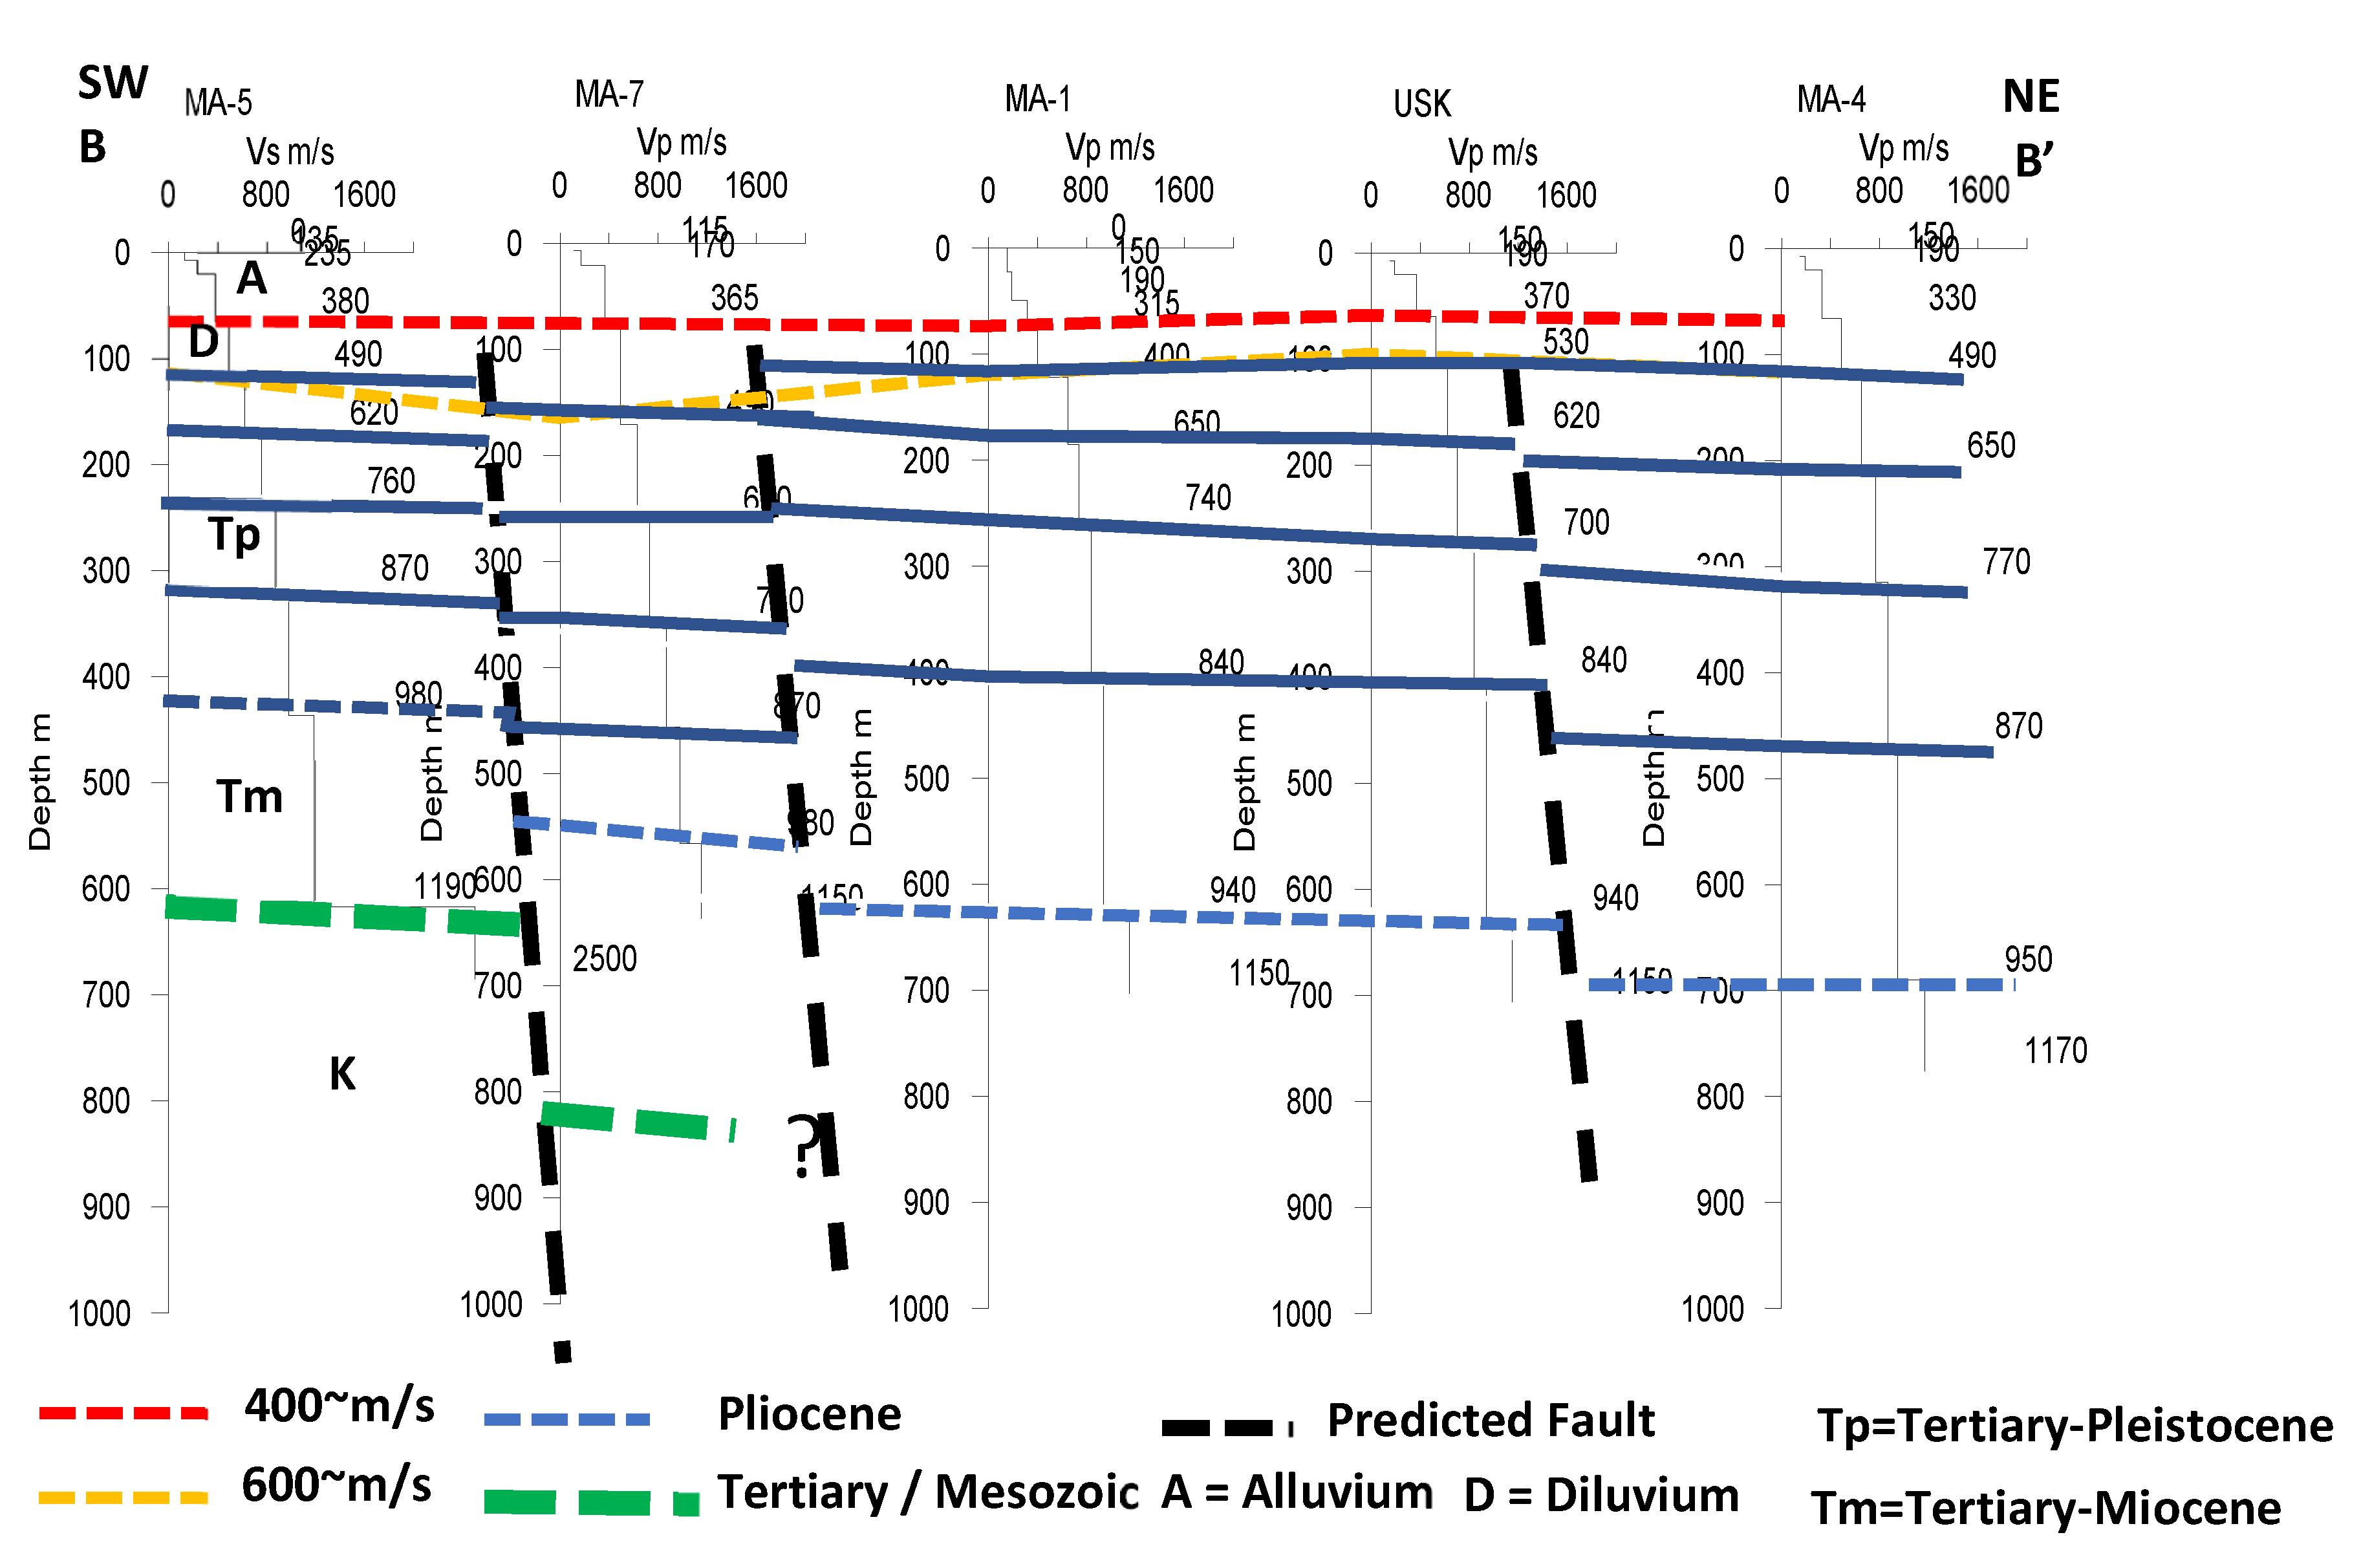
7], in a frequency range of 3–15 Hz come from shallower layers. Then, these dispersion curves were converted through inversion processing to estimate the shear-wave velocity (Vs) profiles versus depth, as shown in
Figure 5 and
Figure 6 [
26]. The inversion was performed by applying the genetic algorithm (GA) [
24] to calculate the given initial model of phase velocity until reaching the best fit or minimum error between calculated and observed data representing the approximate Vs structure of the strata. The detail of the inverted dispersion curves can be seen in
Figure A1. Finally, the Vs strata were drawn on the basis of the Vs values and grouped into two orientation settings of the measurement (NW–SE and SW–NE).
4. Discussion
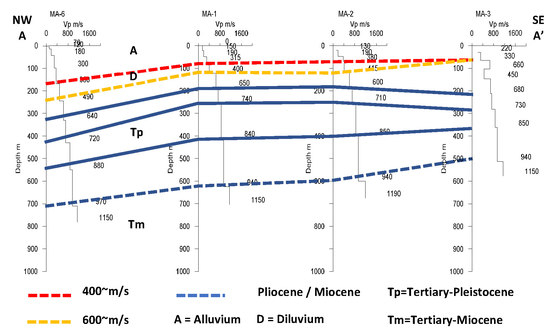
The Vs structure information in
Figure 5 implies that the strata generally dips down from SE to NW. This dipping may have followed the sedimentation process in the past, originating mainly from upstream and sloping downstream, and it is parallel to the long side of the Krueng Aceh Basin or graben. Although each layer is seemingly flat from MA
1 to MA
2, they descend moderately to their left side (downstream) and ascend to their right side (upstream). There are formations of a sub-strata trend on the right side of MA
1 and MA
2, with a Vs interval from 642 m/s to 855 m/s that tends to be convergent or appear to pinch out in the SE direction. This phenomenon might be affected by tectonic processes or concealed faults (black dashed line in
Figure 6). The MA
3 point of the Vs measurement is relatively close to the Aceh Segment Fault (ASF) that extends about 6 km away. Thus, the subparallel layer may be related to ASF activities. This prediction should be validated by other geophysical methods to obtain a more accurate understanding. This estimation is in line with the results of the Aceh and Seulimeum Fault investigation [
28], which explained that the Seulimeum Fault had not released energy greater than M 7.0 since 1936. Overall, the types of lithology consist of alluvium (A) in the top layer, which then changes to diluvium (D) as the depth increases.
For the SW–NE (BB’) orientation, it could be inferred that the lithology, velocity, and age of the uppermost layer are similar to those of the top layer of the first orientation (AA’), but the thickness of the first layer of the BB’ orientation, that is close to the coastal area, is thinner by about 30 m. From this form of layer, it can be roughly estimated that during the time of deposition, there were more sediments supplied from the upstream to the downstream compared with the sediment supplied in the reverse direction. In other words, it can be roughly stated that this top layer was deposited when the mean sea level was at the minimum or at low stand system tract (LST).
The sublayers below a 120-m depth in the BB’ orientation are likely to be disturbed by tectonic activities.
Figure 6 shows how the architecture of the second layer on the left side of MA
1 heading toward SW (below MA
7 and MA
5 points) is lower than the right side of MA
1. The direction to the SW is an orientation crossing or relatively near to the ASF. This highly seated sub-layer could be lifted by the ASF tectonic mechanism. However, the strata generally dip down from the SW to the NE direction. The concealed drawn faults (black dashed line) clearly show that the strata are laterally discontinuous as a result of the nearly vertical elevation of some strata. This view was also revealed in a previous study [
10], where the study site was Lampasi Engking at the Great Sumatran Faults (GSF) border, which is comparatively close to MA
5, implying moderately good conformity. The previous study [
10] expressed that the seated sediment, approximately 30 m deep, was uplifted by GSF transform contact.
In addition to the thickness of each layer in the NW–SE (AA’) orientation, it varies starting from 100, 120, and 200 m for the top, middle, and lowest layers, respectively. On the contrary, the thickness of the two consecutive strata from the surface in the SW–NE (BB’) direction which are about 70 and 40 m is thinner than the uppermost and middle layers of the first Vs profile. However, the third layer of the second Vs profile is thicker by 100 m compared to the last layer of the first Vs cross section. So, the Vs structures both in the AA’ and BB’ orientation are in irregular form. The thickness and lithological types of every layer potentially contribute to site effect of the structure motion as the result of quake vibration. This prediction of ground motion would probably produce high amplification for the areas close to the Aceh segment and Seulimeum segment, which should eventually become the basis for further research, such as HVRS method.
To imagine the relative model of the Kreung Aceh Basin strata, the analyzed Vs structure from both profiles above indicates that the Vs structure declines from SE to NW (about 17.6 km in distance) and dips down from the SW to the NE orientation (approximately 12.6 km in spacing). These architectural structures would gradually and periodically change when driven by fault activities. Eventually, this will cause settlement and lead to a collapsing ground surface when experiencing an earthquake and other disasters.
5. Conclusions
It can be concluded that the analyzed Vs structure from both profiles (NW–SE and SW–NE orientations) indicates that the strata declines from SE to NW (17.6 km in distance) and dips down from the SW to NE orientation (12.6 km). The combination of these Vs structures tend to be oblique from the SW to NE direction. This form may be affected by the Aceh Segment Fault, which is more active than the Seulimeum Segment Fault. Their activity would gradually change the architectural Vs structure of the Krueng Aceh Basin; the fault activity may cause settlement and lead to a collapsing ground surface as a result of site effect response when experiencing earthquakes and other disasters.
Additional information about the Vs structure of the Krueng Aceh Basin can be deduced; its lithologies are composed of alluvium (A) in the uppermost layer, and the thickness is greater in the upstream area than downstream area. Furthermore, the underlying layer consists of diluvium (D). All of the delineated strata have ages that are dominantly from the Pleistocene to Tertiary Pleistocene (Tp). The shear-wave velocities of the strata gradually change from lower to higher as the depth increases. The average maximum penetration depth and Vs are 603 m and 947.5 m/s in the SE–NW orientation, and 650 m and 958 m/s in the SW–NE direction.
