Article

Identification and Analysis of Sets Variables for of Municipal Waste Management Modelling

Faculty of Production and Power Engineering, University of Agriculture in Krakow, 30-149 Kraków, Poland
*
Author to whom correspondence should be addressed.
Geosciences 2019, 9(11), 458; https://doi.org/10.3390/geosciences9110458
Submission received: 9 September 2019 / Revised: 18 October 2019 / Accepted: 22 October 2019 / Published: 25 October 2019
(This article belongs to the Special Issue Waste Management and Environmental Remediation)

Abstract

:
Due to the large quantities of municipal waste generated, their harmful effects on the environment should be minimized. The rationalization of waste management is therefore necessary to achieve a more sustainable development system. In order to support the decision-making process for municipal waste management, this document focuses on developing models for practical use by local authorities in forecasting and managing the size of waste stream in their area. This action, because of its specificity, is a difficult task, especially because of the systemic changes made and the territorial differentiation and changes in the living level of the population. The work presents studies conducted in 2479 municipalities for which mass accumulation index forecasts were developed, using selected methods based on readily available input variables that have not yet been used (structure municipalities and typology of municipalities by scope of influence). The studies confirmed the hypothesis that the amount of municipal waste collected from households depends both on the administrative type of the municipality and on the factors related to the location and socioeconomic function of the area. The inclusion of localization and socioeconomic factors, which so far were not used to model the municipal waste stream, allowed for the reduction of the prediction error of this indicator. Relevant waste stream forecasts will allow local governments to achieve more effectively the objective of sustainable waste management and thus reduce their environmental impact. The achievement of this objective will be possible not only through the preparation of infrastructure to serve the projected waste volumes; it will also identify the waste management areas where the municipal waste reception process is inadequate. Thus, it will help to eliminate illegal processing and the landfill of waste.

1. Introduction

Waste management is considered to be one of the most crucial issues in the policy of environmental protection. Municipal waste is defined as waste produced by households and other facilities, devoid of hazardous substances, which, due to their properties or composition, resemble household waste. It is to be noted that the municipal waste not only comes from households, but, in relation to the surrounding type, also include waste from small businesses, services, and institutions, such as offices, schools, and urban green areas. The municipal waste has particular properties which depend on many factors, such as the type of buildings, the scope of commercial buildings and other nonresidential buildings in a given area, and the technical and sanitary public facilities. The definition of "household waste" used in this article was extended to other wastes collected with the household waste because it is difficult to use them separately. Not only is the terminology an issue to some extent, but also a duty imposed on the local government authorities within the period of considerable system changes, resulting from waste management. In order to optimize activities resulting from waste management, it is necessary that local government authorities make some plans. Within this context of the waste management plan development, one cannot limit oneself only to prognostic tools which are available in other economy fields.
Municipal waste management planning requires the obtainment of reliable data on waste generation, factors affecting the amount of waste generated, and reliable forecasts of the amount of accumulated waste.
To date, numerous studies have been carried out to identify factors and determine their strength and relation to the amount of municipal solid waste generated. The data used to predict the amount of waste most often rely on publicly available statistical data or are based on information provided by municipalities [1,2,3,4,5,6,7,8,9]. The most commonly considered factors affecting the amount of waste generated can generally be classified as the following [2,5,6]:
(a)
Socioeconomic factors, including the level of economic development and income of residents;
(b)
The size of the municipality, the structure of use, the level of urbanization, and the density of population;
(c)
The type of waste collection system and the level of ecological awareness of the local community.
Research on the forecasts of the amount of generated solid waste was carried out for the planning of municipal waste management at various levels, such as national [10,11,12], regional [13], and in households in rural areas and in cities [14].
In research aimed at determining the direction and strength of the impact of various municipalities (or regions) on the mass and composition of the waste generated therein, the following input data shown in Table 1 are most commonly used.
The approaches to analyzing the rate of mass accumulation of waste, presented in the chosen literature, use mainly statistical methods in the form of linear regression models [17,18,24], multiple regression [5,19,25,26], Rough Set Theory [22], multivariate grey models [20], and artificial neural networks [1,27].
Provisions of the Act of 2013 [28], which imposed on municipalities the duty to organize waste collection from all property owners and social and economic infrastructure units, facilitated determination of the real amount of municipal waste generated on their territories. The size of waste is the most frequently described by the mass waste accumulation indicator expressed in kg∙(per∙year)−1.
The indicator of mass municipal waste accumulation is strongly correlated with the place of its generation. Literature sources [17,29] provide, however, various values of the waste accumulation coefficient, which is presented below in Table 2. The above data prepared before the act on waste of 2013 entered into force show that, on average, a city dweller annually produced approximately 200 kg more waste than a country dweller. Such a difference in the level of waste production results from higher consumption and a higher living standard for city dwellers. Moreover, in rural areas, many food products come from people’s own farms, while a city dweller buys all such products, which therefore require the use of packaging and the generation of packaging waste.
Moreover, a considerable part of rural organic waste is managed by the rural citizens themselves. According to the Central Statistical Office [30], participation of the municipal waste that is formed from rural areas is approximately 20%. The municipal waste from rural areas is mainly generated in households, which produce 76% of mixed municipal waste (in the cities, this participation is ca. 70%). A stream of mixed municipal waste produced by an average household in Poland in 2013–2016 was approximately 120 kg·(per·year)−1. The size of this index in the case of rural areas was 98 kg·(per·year)−1 and in the cities it was 195 kg·(per·year)−1. After the introduction of a new waste management system, a difference in the stream of generated waste between city and country dwellers decreased to approximately 100 kg. This situation results mainly from segregation and reception of all waste on the territory of the entire country. In the previous period (before 2012), there was no common obligation to collect waste. Thus, some types of waste, particularly from rural areas, were not collected.
Given the fact that the differences between urban and rural municipalities are currently blurred and the factors describing the volume of waste generated are changing, it is necessary to look for additional variables describing the investigated phenomenon. Therefore, the aim was to draw the optimum set of variables into a model predicting the stream generated by municipal waste from households in different types of municipalities. Variable sets were chosen in such a way that they were a compromise between the effort to acquire them and the quality of the forecast. The forecast was built on a set of five methods: artificial neural networks (ANN), random forest for regression (RFR), classification and regression trees (CART), exhaustive (CHAID) and multivariate adaptive regression splines (MARS). These methods are widely used to build predictive models. The work was preceded by an analysis of the spatial diversity of household waste generated in all municipalities within Poland.
Understanding the factors influencing the amount of municipal waste generated is a prerequisite for assessing and reorganizing collection systems.
We hypothesize that the amount of municipal waste collected from households depends both on the administrative type of the municipality and on the factors related to the location and socioeconomic function of the area. We believe that the inclusion of localization and socioeconomic factors will allow for the construction of a model which, despite considerable territorial volatility, will allow the determination of the value of this benchmark and thus contribute to the more efficient planning and management of waste.

2. Materials and Methods

The initial selection of independent input variables for the construction of the model of the annual total production of household waste was established on the basis of a literature review. As potential independent variables, the following were selected:
  • C1—municipality administrative type (where: 1—municipality, 2—commune, and 3—rural municipality);
  • C2—functional structure of communes (where: 1—urban, 2—urbanized area, 3—multi-functional transition area, 4—mainly agricultural area, 5—area with prevailing agricultural function, 6—area with tourist and recreational functions, 7—forest functions area, and 8—mixed functions area);
  • C3—population density per·km−2;
  • C4—building age rate defined as a weighted average of the age of all buildings in the municipality;
  • C5—indicator household size, as persons per household (per building−1);
  • C6—average agricultural area ha;
  • C7—percentage of buildings heated with natural gas;
  • C8—participation of farms which earn income from agricultural activity;
  • C9—indicator of the municipality income as participation in taxes from natural persons per one citizen of the municipality (PLN·per−1);
  • C10—typology of municipalities according to the scope of impact (where: 1—zone of the strongest real impact (real suburbs zone); 2—zone of the strongest possible impact (possible suburbs zone); 3—weakly available zone of strong impact; 4—zone of weak possible impact (possible internal zone); 5—outskirts zone; and 6—urban centers cores);
  • w—voivodeship.
Data (C1, C3 to C9, w) describing the set of properties of the analyzed phenomena were collected from the Local Data Bank of the Central Statistical Office [30] and (C2, C10) studies concerning typology of municipalities in Poland [31]. The novelty of the undertaken research is an attempt to develop a universal model describing the mass accumulation index of waste and using nonstandard variables for this purpose, such as the functional structure of municipalities (C2) and typology of municipalities according to the scope of impact (C10). These variables, unlike the indicators presented, for example, in [2,4,13,21], are relatively easily available at the commune level based on the methodology described in Bański’s [31]. In his work [31], Bański assigned municipalities to sets of predefined classes (subsets) based on selected criteria. The authors of this study used this methodology go a step further and create universal forecasting models that can be used in local waste management. The added value to the current state of knowledge is the fact that the study was conducted on a very large population of 2479 municipalities. Among the examined objects were municipalities with a very large spread in terms of the amount of generated waste. Thanks to this, it was possible to check the quality of obtained waste stream forecasts in conditions of significant differentiation of its level.
Among the indicated indexes for further analysis of the generated waste stream, only those features which met the following criteria were selected:
  • Universal character—features should have a recognized significance and meaning;
  • Variabilities—properties should not be similar to each other with regard to information on facilities (high ability of discrimination is in case of features with great variability);
  • Importance—important properties are those which achieve high values with difficulties.
For evaluation of the spatial variability of properties, coefficient of variability ε was used, and it was required that properties had higher variability than the arbitrarily assumed value ε = 10% [32].
Assessment of the validity of attributes was made based on the distribution function convexity. Algorithm of indication of the empirical distribution function convexity is as follows [32]:
(a)
Properties xij are transformed according to the following formula:
The property, thus, assumes values from the range [0,1].
x X i j m i n X i j m a x X i j m i n X i j ,   i = 1 , 2 , , n ;   j = 1 , 2 , , m , i j
where Xij is the j-th feature of the i-th commune, n is the number of communes, and m is the number of features.
(b)
Transformed property values are ordered increasingly, and the median Mej, is determined;
(c)
The indicator tj is determined by the following:
t j = 1 i :   x i j 0.5 w i j
where j equals 1, 2, …, m. The w ij is calculated as follows:
w i j = 1 n
A classification was carried out based on the value tj where validity of the feature rises along with the reduction of the indicator value. A threshold value of this indicator was assumed at the level of 0.5.
Only C4 indicator was not qualified to the set of properties which describe the mass stream of generated waste using the above-mentioned universality, variability and validity criteria.
For construction of prognostic models, a data-mining working space available in the Statistica® program was used, where usefulness of annual waste stream, artificial neural networks (ANN), random forest for regression (RFR), classification and regression trees (CART), and exhaustive (CHAID) and multivariate adaptive regression splines (MARS) for prediction were verified [33,34,35,36,37,38,39]. In the first stage, models for randomly selected five voivodeships with 869 municipalities were constructed. During the tests, the impact of the selection of input variables on the quality of the obtained predictions was analyzed. Then, for the selected sets of input variables, analyses for all municipalities in Poland (2479 municipalities) were made.
At the beginning of tests, facilities were divided into particular sets, and this division was valid throughout all analyses. The training set constituted 80% of observation, and for the needs of training of artificial neural networks, an additional 20% of observations which formed the test set were separated therefrom. The remaining observations were included in the validation set which did not take part in the process of construction of particular models.
The following restrictions were used during the research. Only usefulness of feedforward networks of MLP type was tested in the neural networks. An automatic network designer was used for the construction of the model. It searched for the best network architecture with simultaneous limitation of the number of neurons in the hidden layer within 4 and 13. Five hundred networks were tested during the research, and, for further analyses, 5 of the best quality were selected. For regression trees, it was assumed that the minimum number in the node would be 5 observations and the maximum number of nodes 1000. For the MARS method, the maximum number of base functions was assumed with the value 21, only for the first row of interaction, and the value of penalty for adding another base function to the model was agreed at the level 2.
Analyses that aimed at obtaining models which would allow effective prediction of the mass waste accumulation indicator were anticipated with an initial treatment of the collected indicators. It consisted of a replacement of the lacking data in a given year with the average value from neighboring observations. Analogous transformation was made for outlying data which were incorrectly entered values in the Local Data Bank of the Central Statistical Office.
As part of the evaluation of the developed model’s quality, they were evaluated according to their admissibility. The absolute percentage error (APE) and mean absolute percentage error (MAPE) were used to assess the accuracy of expired forecasts [40,41]:
A P E = | O r z O p r | O r z × 100
M A P E = 1 n g m = 1 n s | O r z O p r | O r z × 100
where Orz is the value of the total unit indicator of waste accumulation from households determined on the basis of data Local Data Bank of the Central Statistical Office; Opr is the predicted value of the total unit indicator of waste accumulation from households; and ng is the number of municipalities covered by the research.
Built forecasting models can generate very good quality forecasts on a set of data that was used to build them. Using it for new data that is not involved in the construction generates forecasts with significantly larger errors. To avoid this situation in the work, the set of input variables is divided into two subsets (learning set and test set). On the first one, the model was built, and the second was verified in terms of predictivity. Based on the analysis of APE and MAPE errors for the learning set and test set, the decision was made to choose the final character.
Moreover, in the paper, it was verified whether division of municipalities into uniform groups based on the set of variables which meet the criteria of universality, variability, and validity will allow obtaining predictions of the mass waste accumulation indicator burdened with smaller errors. Thus, for further analysis and construction of models, the set of input variables was extended with "s" variable, which identifies belonging of a municipality to a given group. A novelty of the undertaken research is an attempt to develop a universal model describing the mass index of waste accumulation and using, for this purpose, nonstandard variables, such as functional structure of communes (C2) and typology of municipalities according to the scope of impact (C10).

3. Results and Discussion

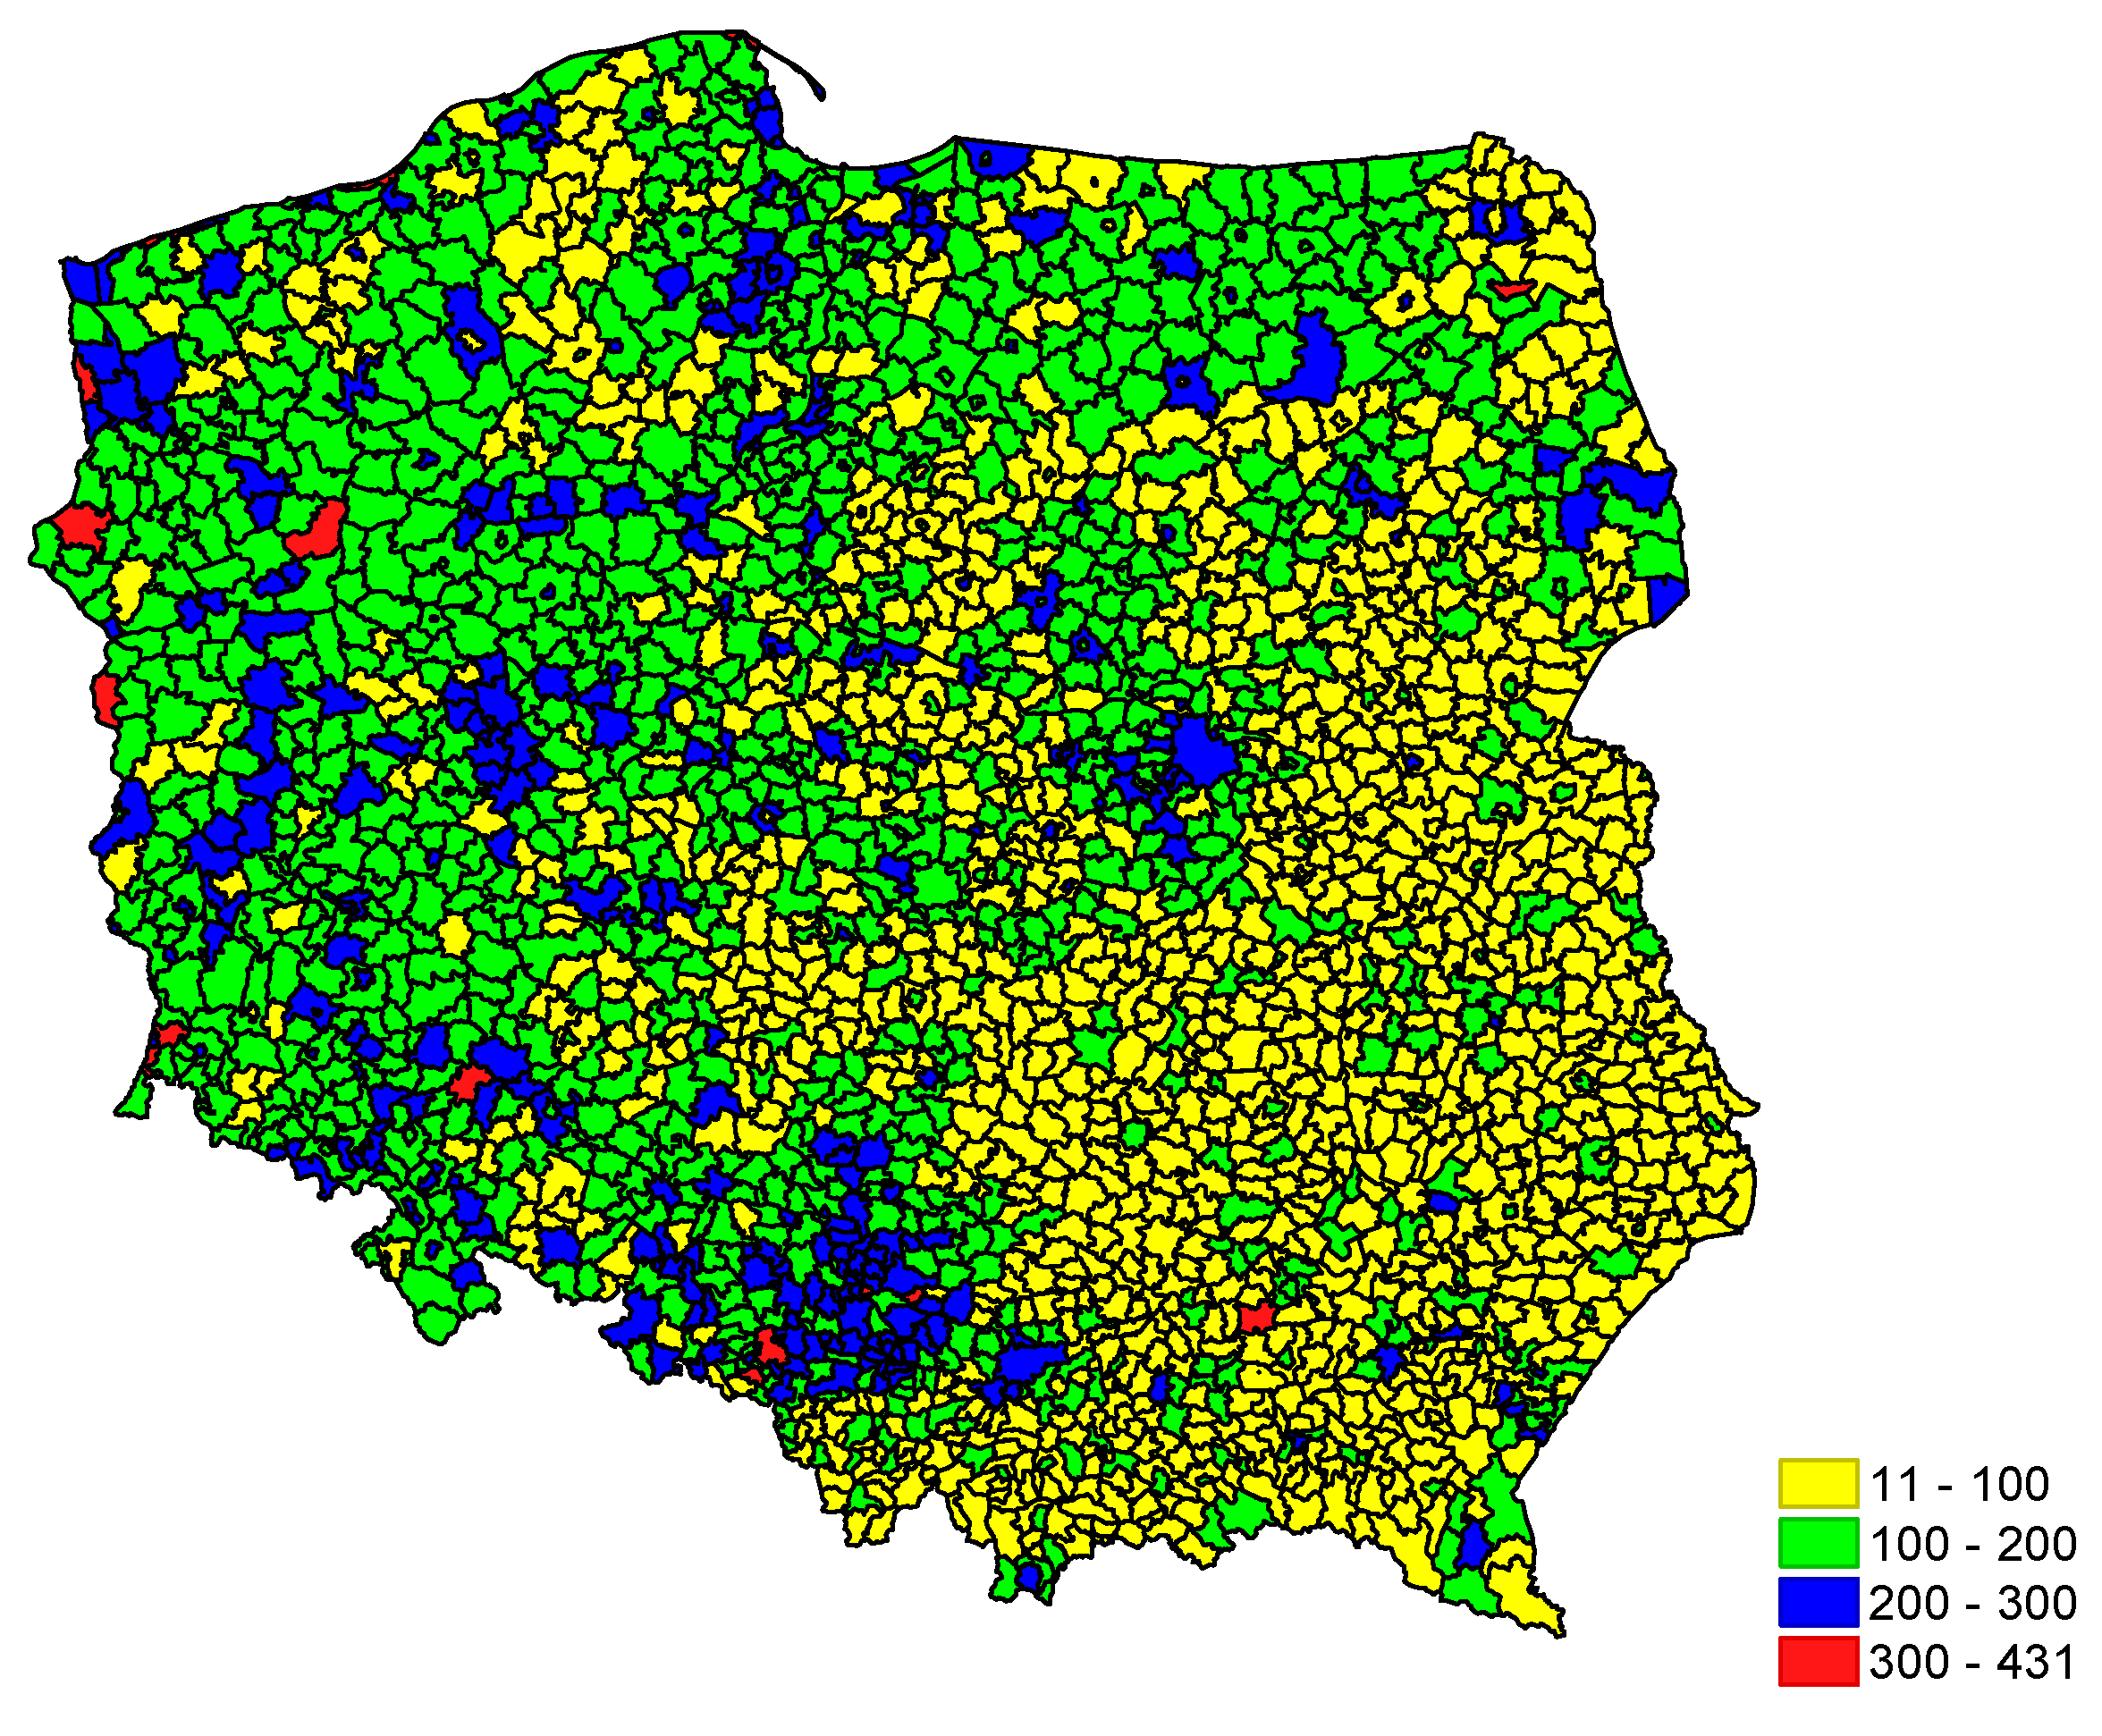
3.1. Description of Variability of the Produced Waste Amount

The indicator of the total waste mass accumulation per one person and its value only for households on the territory of particular municipalities in Poland is characterized by high variability.
The collected material allowed development of a map of the averaged amount of generated total waste and for households in all municipalities in Poland in 2013–2016 (Figure 1 and Figure 2).
The impact on the amount of generated waste has many variables. The most popular in the literature are administrative type of a municipality, population density, and the structure of use of energy carriers to satisfy the recipients’ needs. Also, the waste management system, which is defined by the act on maintaining cleanliness and order in municipalities, is not without meaning. Information obtained from the Local Data Bank [30] show that the introduction of the new law concerning waste management [31] triggered the increase of the total averaged amount of collected waste on the territory of municipalities from 144 kg·(per·year)−1 in the years 2005–2012 to 162 kg·(per·year)−1 in 2013–2016 (Table 3). An even higher average increase of the amount of collected waste (by almost 23 kg·(per·year)−1) occurred then in households. In both cases, the analyzed indicators had a very high distribution, which was respectively 800 kg for the total waste and 400 kg for households. Taking into consideration the present legal state in Poland, results concerning waste accumulation since 2013 are presented later in the paper.
The administrative municipality type is considered a basic variable that determines the value of the unit waste accumulation indicator. The research which was carried out shows that, unfortunately, the administrative type is not a factor that well differentiates all types of municipalities. For municipalities, it allowed determination of a relatively uniform group (coefficient of variability below 30%), where the average annual total amount of generated waste is at the level of 266 kg·(per·year)−1 and almost 200 kg·(per·year)−1 for households. These are twofold higher values than in rural areas.
Unfortunately, this variable did not enable the sectioning out of a uniform group of administrative-type communes. This group included communes which generated approximately 30 kg of waste in total per one person and over 950 kg·(per·year)−1. An analogous situation also occurred in case of the analysis of the amount of waste generated in households (Table 4).
In the following stage, it was checked whether a division of administrative communes (Figure 3) and rural municipalities will enable their better division with regard to the value of the mass waste accumulation indicator.
Based on the graphical analysis (Figure 3 and Figure 4), such voivodeships as Swietokrzyskie, where a very low variability of the total amount of generated waste took place, may be pointed out. However, for majority of communes and rural municipalities, information on the location on the territory of a particular voivodeship may be insufficient for determination of the amount of generated waste. Thus, it is necessary to search for other variables than the administrative-type commune or its location in order to determine the size of waste accumulation indicators.

3.2. Modelling the Waste Accumulation Index

In the first part of construction of the prognostic model of the mass waste accumulation indicator, it was decided to use as input variables indicators suggested by other authors who investigated this phenomenon, i.e., administrative type of a commune, population density, building population rate, percentage of building heated with natural gas, participation of farms which earn income from agricultural activity, and the commune income indicator. Artificial neural networks (ANN), multivariate adaptive regression splines (MARS), classification and regression tree (CART), chi-square automatic interaction detector (CHAID), support regression trees (SRT), and support vectors (SV) available in Statistica® program were used for construction of models in Data Miner working space (Figure 5). Models were built for five randomly selected voivodeships in Poland.
The analyses prove that the best quality models may be obtained with the use of the following input variables: municipality administrative type (C1), population density (C3), building population rate (C4), average agricultural area (C6), percentage of buildings heated with natural gas (C7), participation of households which earn from agricultural activity (C8), commune income indicator (C9), and information on the location of the commune in a particular voivodeship (w). The above-mentioned variables were also supplemented with information on the functional type of a commune and typology of communes (C2, C10), according to the scope of the impact based on the methodology presented in Bański’s paper [31]. Since the tests which were carried out did not unanimously indicate which of the analyzed methods enables the obtainment of the most effective forecasts, the below diagrams (in Figure 6 and Figure 7) present the results for combined predictions which constitute an average value for the results obtained with particular methods.
Since the developed models, both for the amount of the total waste, as well as for households, were burdened with an error of 25%, attempts were made to correct their quality through the change of input variables. Unfortunately, the majority of universally available information that affects the size of generated waste was already used. At the early stage of research, when the territorial characteristic of variability of waste accumulation was carried out, it was observed that communes from various voivodeships and those of administrative types have a similar size of generated waste. Thus, it was decided to carry out for the cluster analysis for the communes and to extend the scope of input variables by information on belonging to a particular cluster.
The cluster analysis was made in the Statistica® program with the k-mean method. For determination of the optimal number of clusters, a v-fold-cross validation algorithm implemented in the program was applied. The following were used as input data in the analysis: administrative commune, functional scope of the commune population density, building population rate, average agricultural area, percentage of buildings heated with natural gas, participation of households which earn from agricultural activity, commune income indicator, and information on the location of the commune in a particular voivodeship. Table 5 presents a description of the number of the total generated waste and for households.
The construction of separate models for particular uniform groups determined based on the cluster analysis based on previously selected sets of explanatory variables enabled the reduction of the prediction error of the waste accumulation indicator to the level of 21%–22% for the test set (Figure 8 and Figure 9). The effect of this action was to reduce the forecast error of waste generated by 3% to 4%.
To better present the size of the obtained errors of combined predictions of the mass waste accumulation indicator in relation to the selected set of explanatory variables, error distribution functions were developed and presented in the diagram (Figure 10 and Figure 11).
The analysis shows that the construction of separate models for developed clusters which form uniform municipalities groups enabled the increase of the quality of made predictions of the mass waste accumulation indicator (Figure 10 and Figure 11). It is particularly visible for the total waste accumulation indicator for which the level of APE errors with values up to 30% is 53%, respectively, for the set of determined variables (C1, C2, C10, w), 60% for the determined set of input variables (C1, C3, C5 to C9, w), (C1 to C3, C5 to C10, w), and (C1, C2, C10, w, s), and over 70% for the determined set of variables (C1, C3, C5 to C9, w, s) and (C1 to C3, C5 to C10, w, s). Moreover, for majority of cases including the information on belonging of the municipalities to a particular cluster enables reduction of the maximum error values APE to ca. 70%.
When comparing the results obtained for the analyzed variable group, it can be concluded that they are better than the results obtained in the studies presented in [1,5,9,11,24], where the quality of the matched models developed was 26% to 35%. We believe that this may be due to the use in our model of a benchmark characterizing a functional type of municipality.

4. Conclusions

A consolidated law concerning the waste management duty which was imposed on the local government authorities has applied in Poland since 2012. Although the new law has been applied for five years, we still observe a considerable territorial variability of the mass waste accumulation indicator, which makes it impossible to predict this indicator and plan waste management.
The following conclusions can be made on the basis of analysis of the mass waste accumulation indicator:
  • The developed model is a versatile solution that may apply to the analysis of regions in Poland and other countries. The use of a new indicator (a functional type of a commune) is important, which confirmed its use in all input data to models. In our further research, we are using developed models on data from other regions.
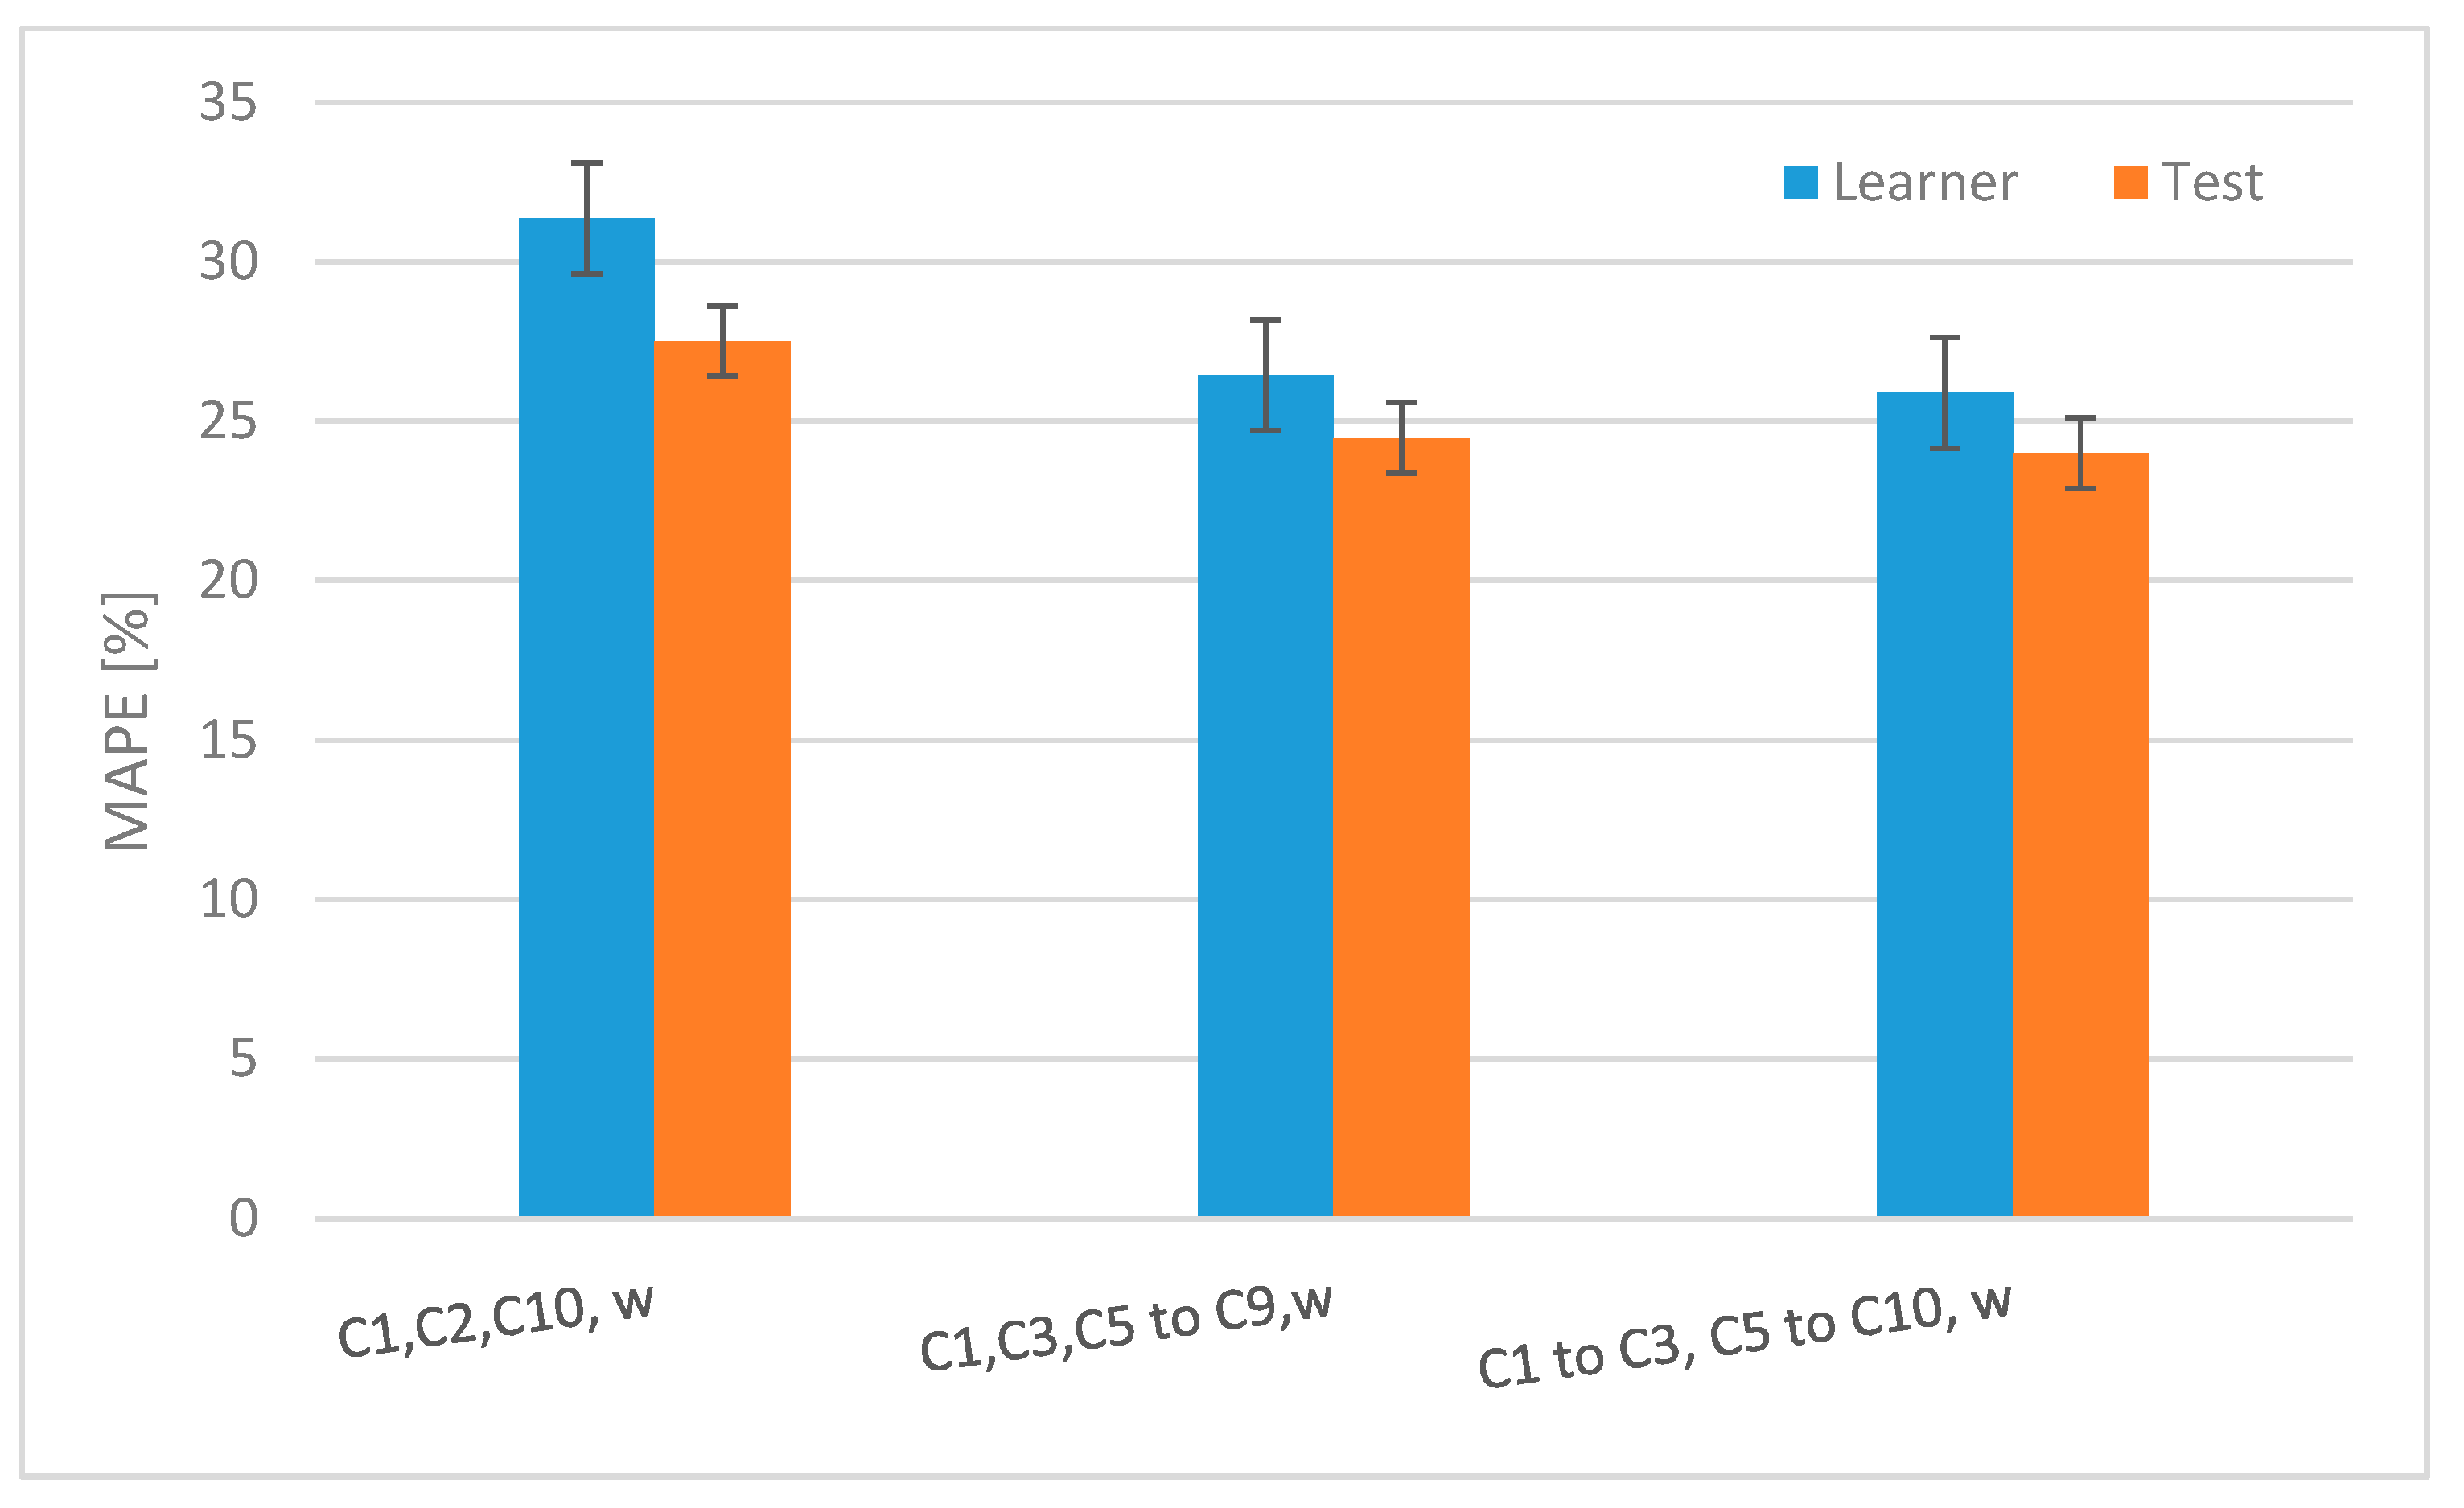
  • Based on the selected independent variables which met the criteria of universality, variability, and significance, prognostic models of the mass waste accumulation indicator were constructed with the use of artificial neural networks (ANN), multivariate adaptive regression splines (MARS), classification and regression tree (CART), chi-square automatic interaction detector (CHAID), support regression trees (SRT), and support vectors (SV). Prediction errors of the mass waste accumulation indicator did not indicate which of the analyzed methods enables the obtainment of predictions of the best quality, since the value of the error MAPE was at the level of 25%, regardless the applied method.
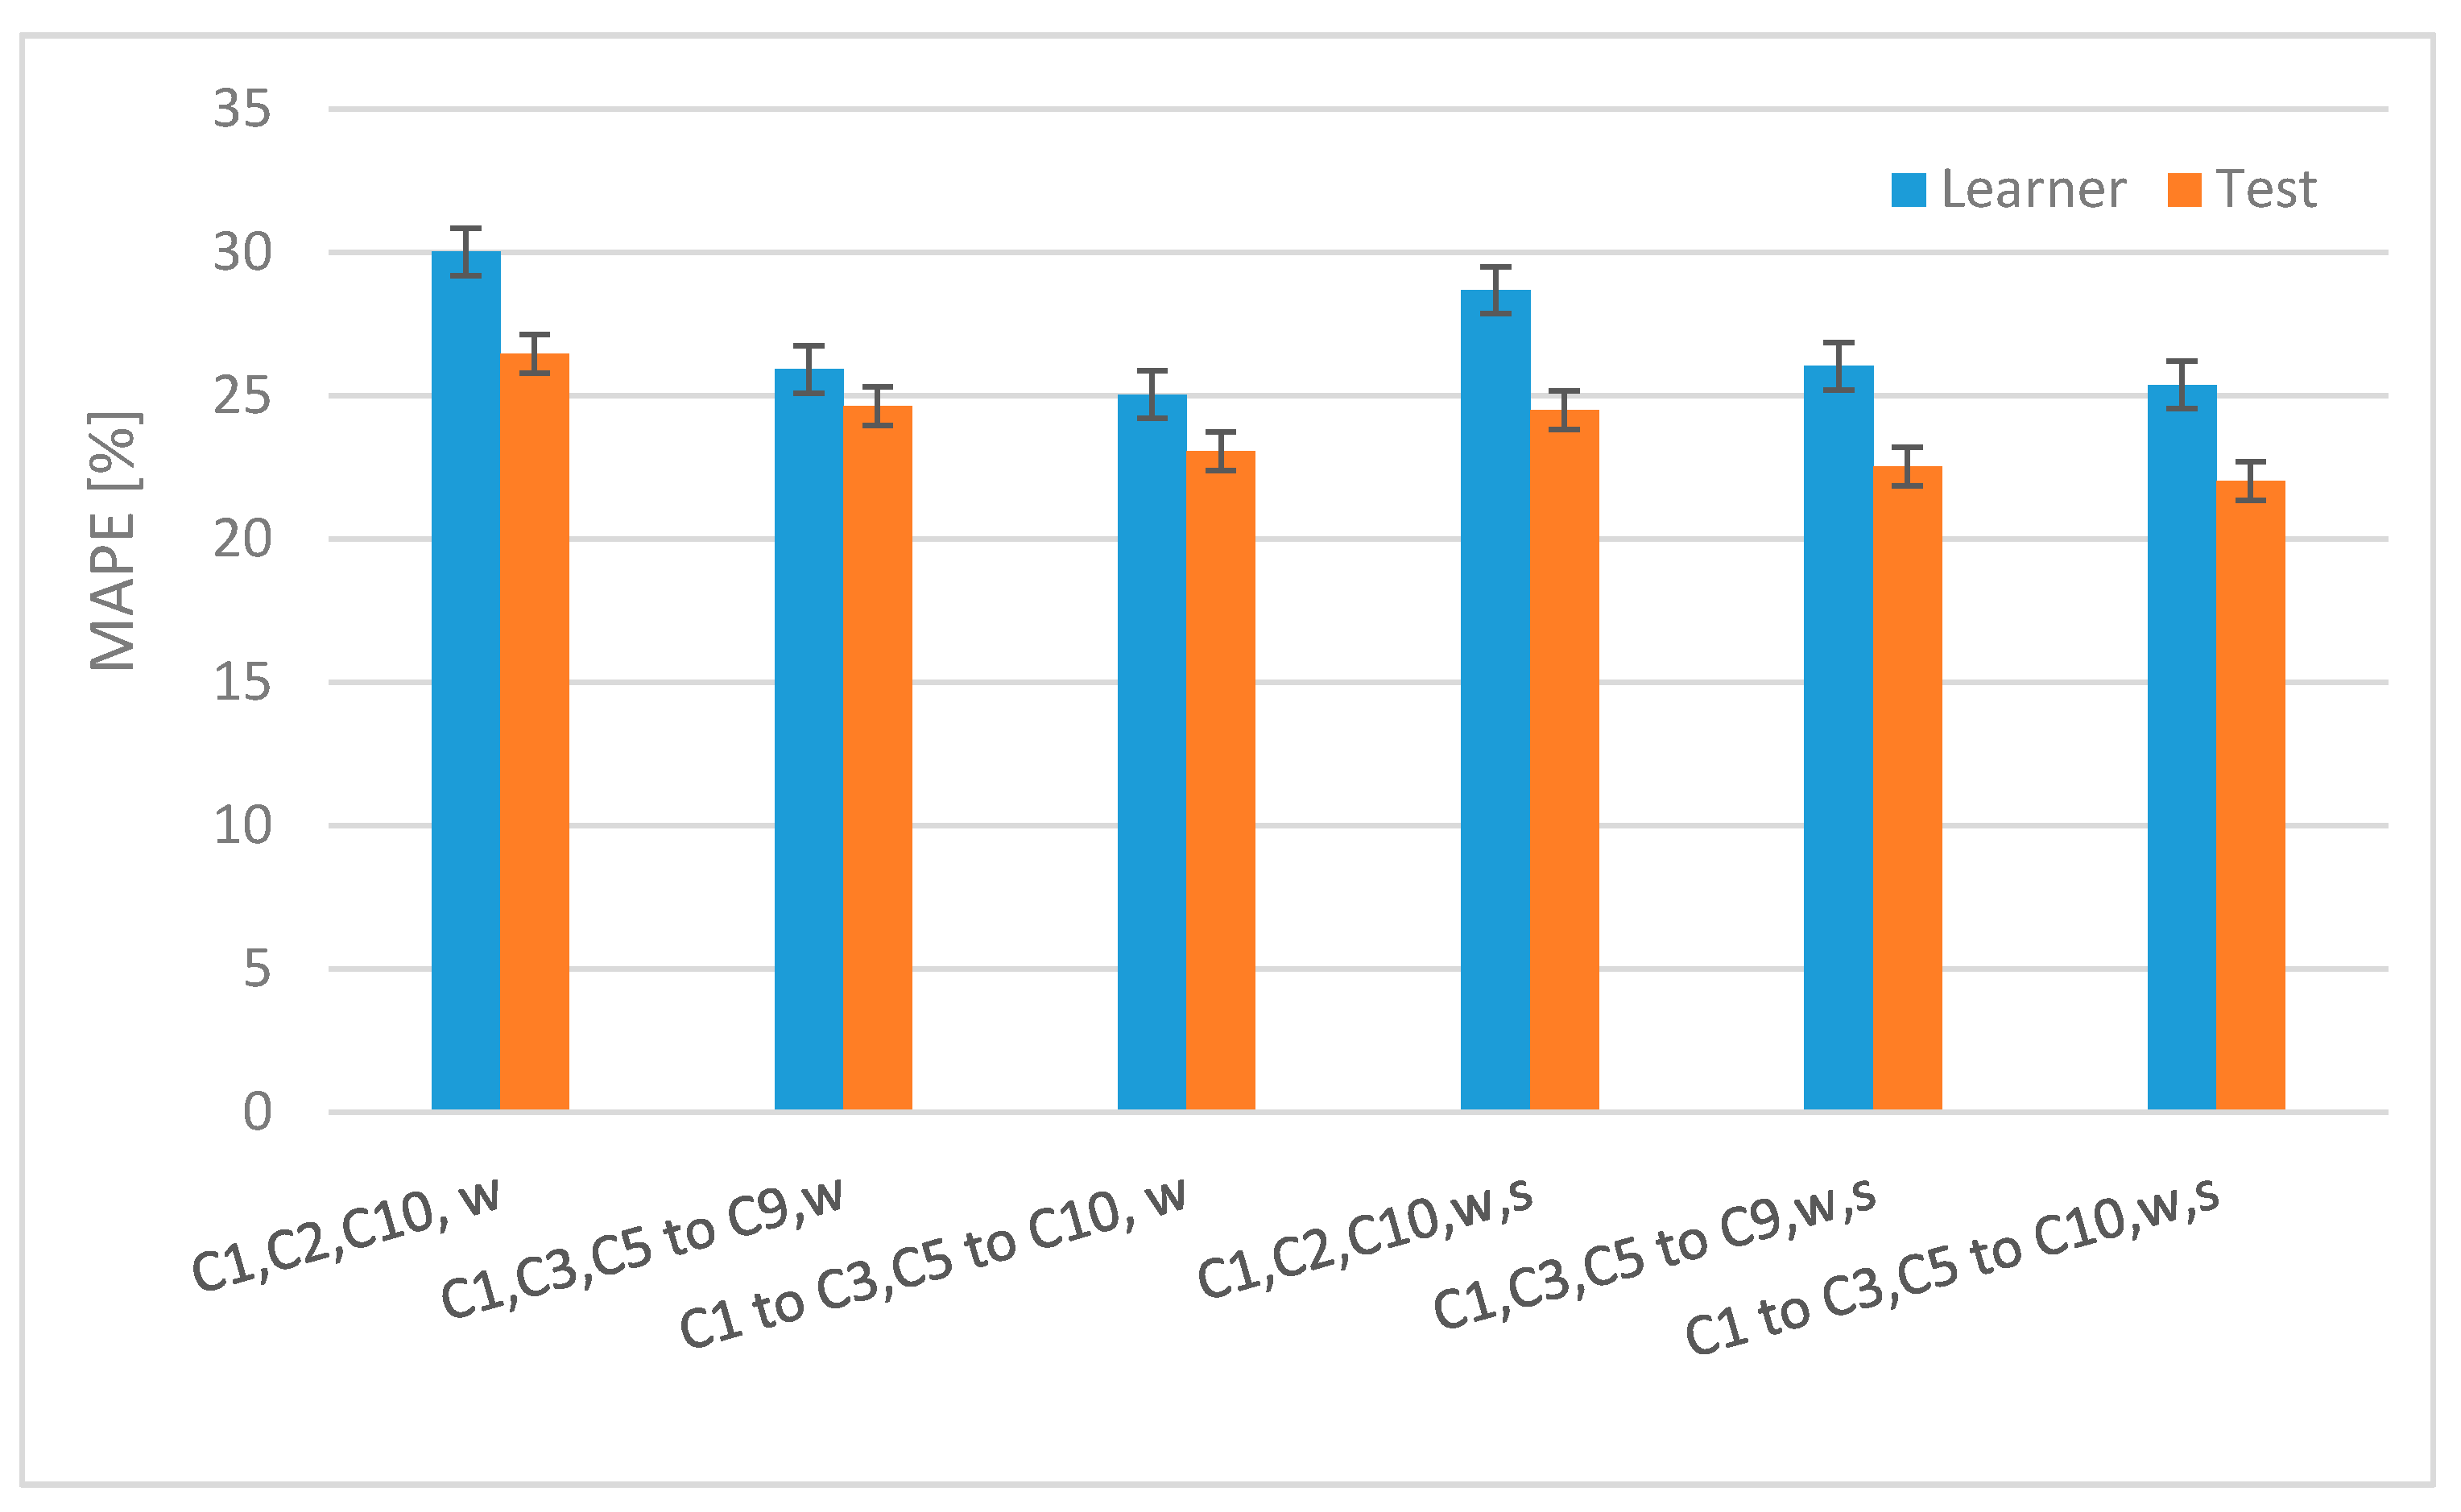
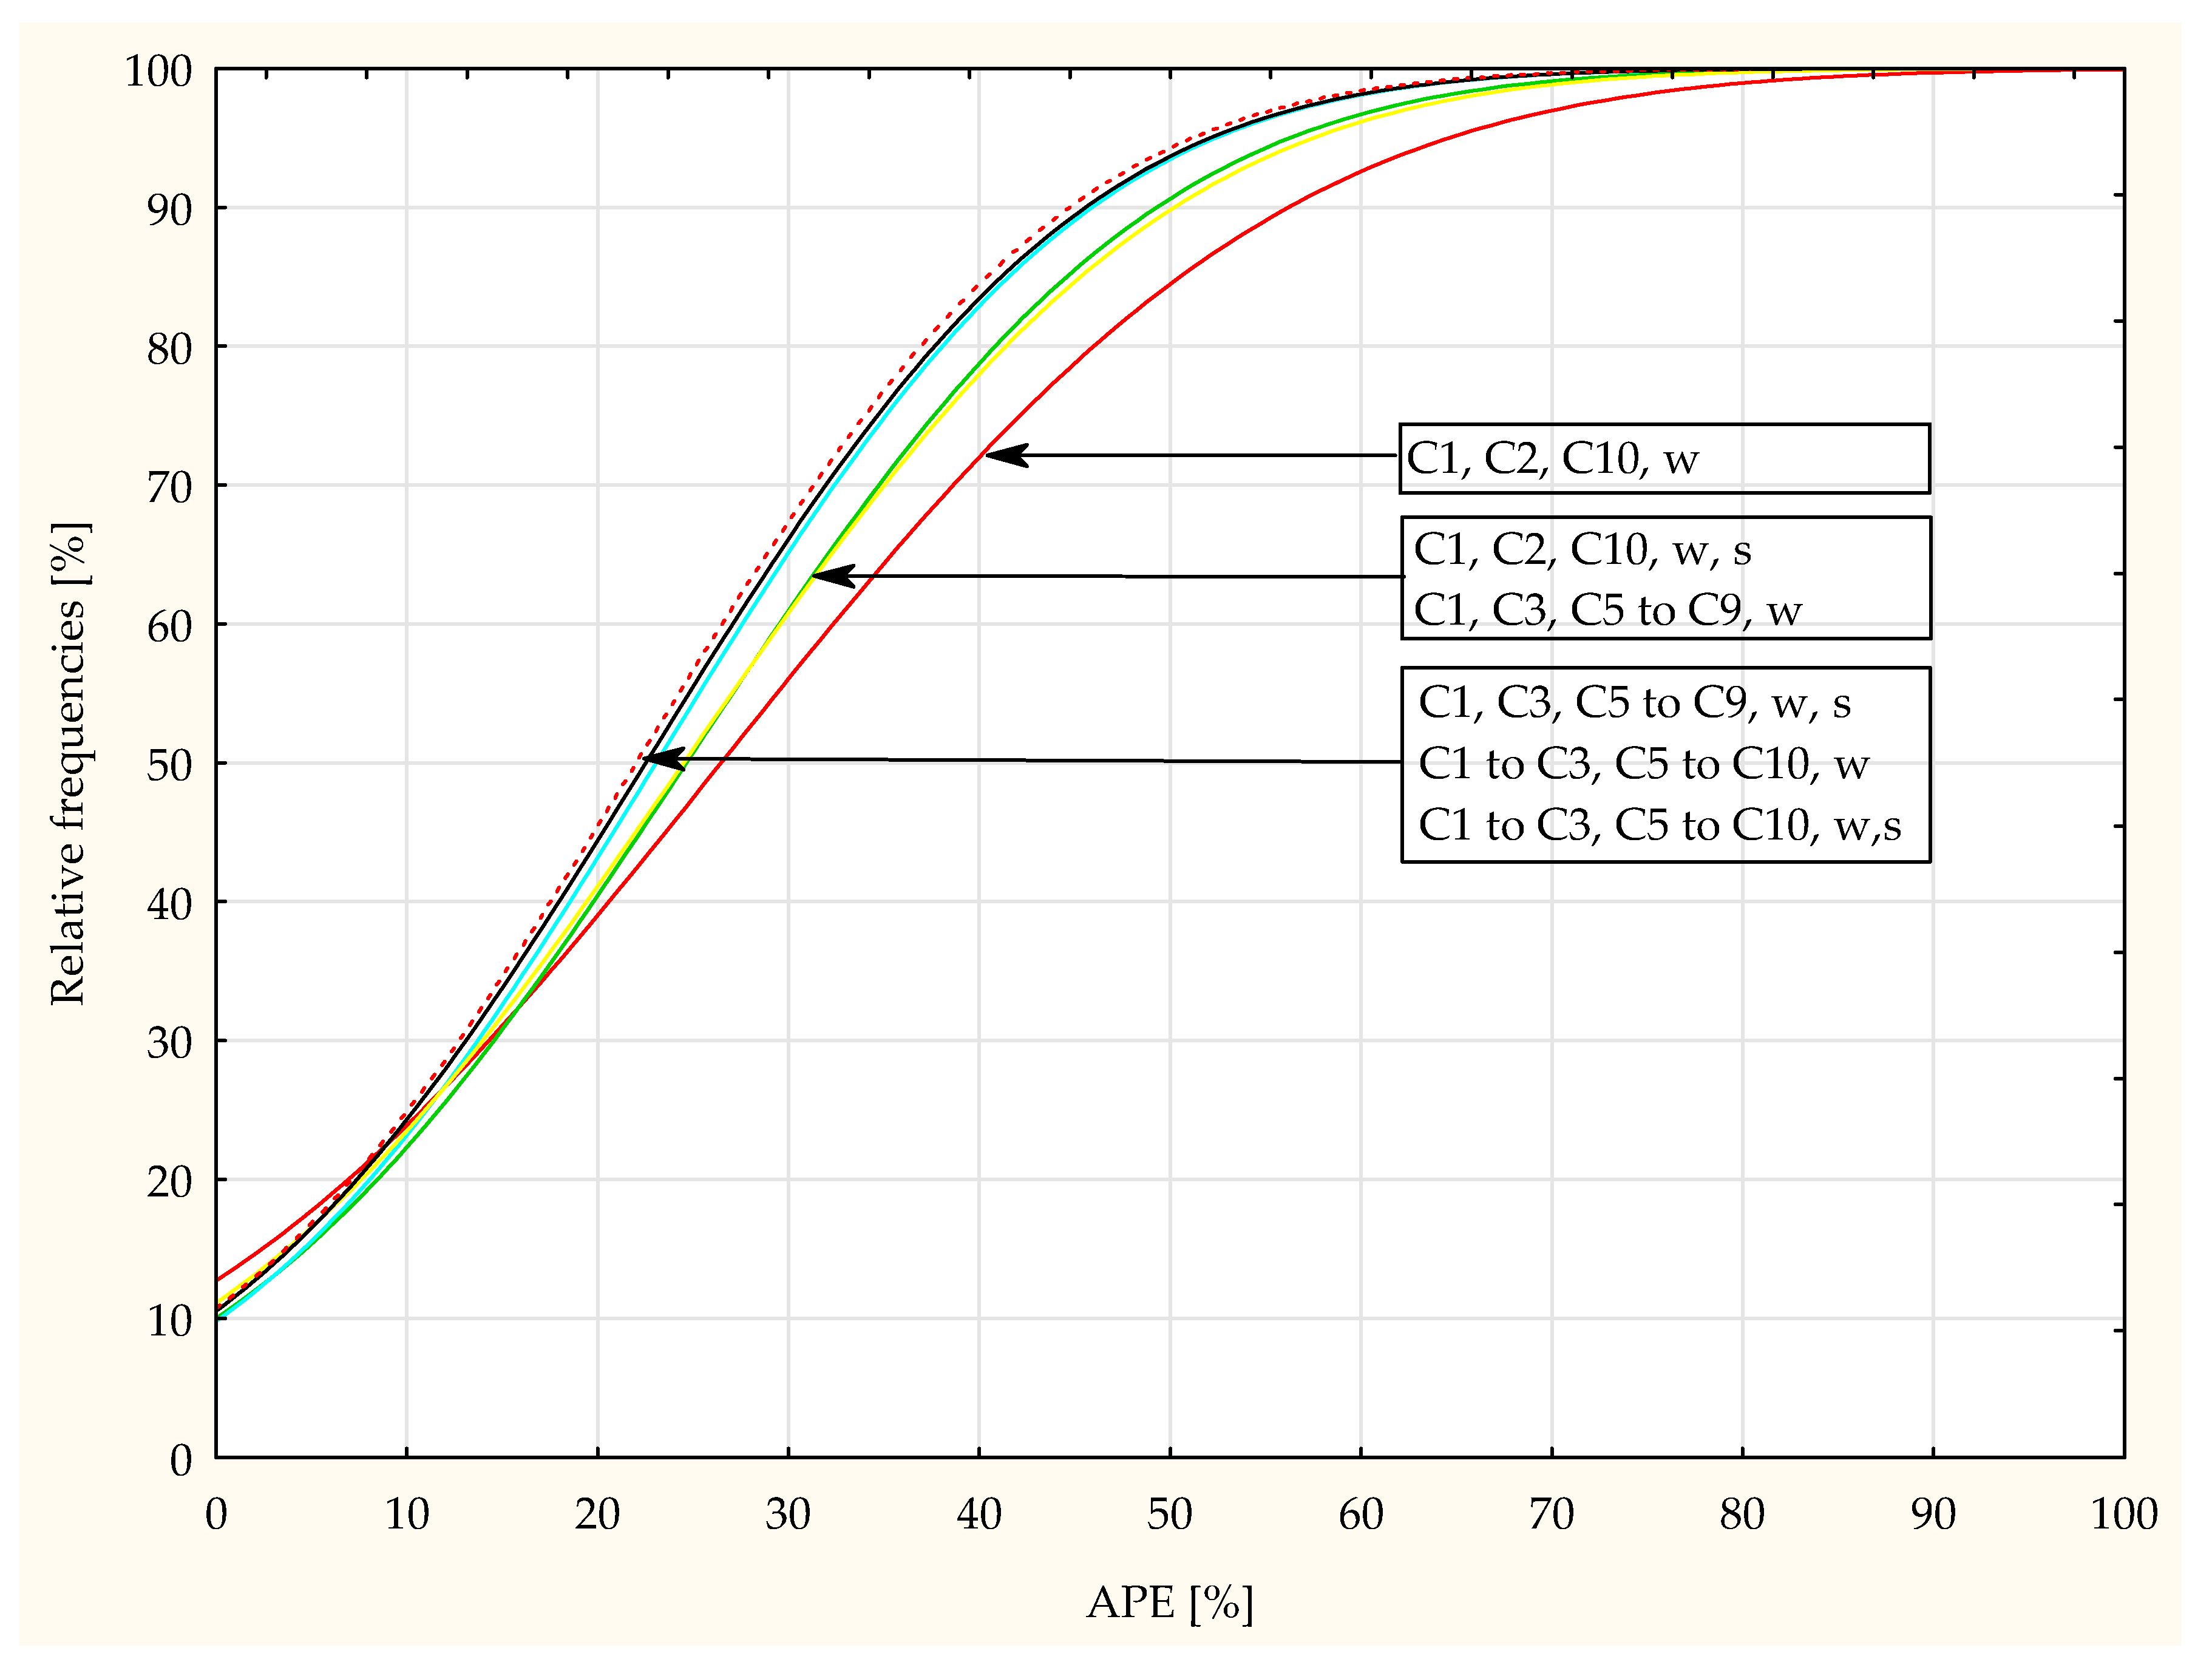
  • The development of a new model for homogeneous groups determined on the basis of cluster analysis from the adopted explanatory variables helped improve the forecast. The effect of this action was to reduce the forecast error to 21%–22% for the test set.

Author Contributions

Conceptualization, K.N., T.S., and J.K.; software, K.N.; data curation, K.N. and T.S.; investigation, K.N., T.S., and J.K.; methodology, K.N., T.S., and J.K.; project administration, K.N.; supervision, J.K.; writing—original draft, K.N. and T.S.; writing—reviewing and editing, K.N. and T.S.

Funding

This research was financed by the Ministry of Science and Higher Education of the Republic of Poland.

Acknowledgments

We are grateful to Sławomir Kurpaska and Mateusz Malinowski from the University of Agriculture in Krakow, Poland, Faculty of Production and Power Engineering, for their valuable support during this research.

Conflicts of Interest

The authors declare no conflict of interest.

References

  1. Bach, H.; Mild, A.; Natter, M.; Weber, A. Combining socio-demographic and logistic factors to explain the generation and collection of waste paper. Resour. Conserv. Recycl. 2004, 41, 65–73. [Google Scholar] [CrossRef]
  2. Beigl, P.; Lebersorger, S.; Salhofer, S. Modelling municipal solid waste generation: A review. Waste Manag. 2008, 28, 200–214. [Google Scholar] [CrossRef] [PubMed]
  3. Hage, O.; Söderholm, P. An econometric analysis of regional differences in household waste collection: The case of plastic packaging waste in Sweden. Waste Manag. 2008, 28, 1720–1731. [Google Scholar] [CrossRef] [PubMed]
  4. Hockett, D.; Lober, D.J.; Pilgrim, K. Determinants of Per Capita Municipal Solid Waste Generation in the Southeastern United States. J. Environ. Manag. 1995, 45, 205–217. [Google Scholar] [CrossRef] [Green Version]
  5. Lebersorger, S.; Beigl, P. Municipal solid waste generation in municipalities: Quantifying impacts of household structure, commercial waste and domestic fuel. Waste Manag. 2011, 31, 1907–1915. [Google Scholar] [CrossRef] [PubMed]
  6. Miller, I.; Lauzon, A.; Wattle, B.; Ritter, M.; Hood, J. Determinants of Municipal Solid Waste Generation and Recycling in Western New York Communities. J. Solid Waste Technol. Manag. 2009, 35, 209–236. [Google Scholar] [CrossRef]
  7. Passarini, F.; Vassura, I.; Monti, F.; Morselli, L.; Villani, B. Indicators of waste management efficiency related to different territorial conditions. Waste Manag. 2011, 31, 785–792. [Google Scholar] [CrossRef]
  8. Szul, T.; Nęcka, K. Methods of Estimating Waste Accumulation Rate in Rural Areas of the Lubelskie Voivodship. Barom. Reg. 2016, 14, 165–171. [Google Scholar]
  9. Purcell, M.; Magette, W. Prediction of household and commercial BMW generation according to socio-economic and other factors for the Dublin region. Waste Manag. 2009, 29, 1237–1250. [Google Scholar] [CrossRef]
  10. Agnieszka, B.B.; Maja, R.; Dana, A.; Jan, Z.; Magdalena, D.V. Assessment Strategies for Municipal Selective Waste Collection—Regional Waste Management. J. Ecol. Eng. 2018, 19, 33–41. [Google Scholar]
  11. Daskalopoulos, E.; Badr, O.; Probert, S. Municipal solid waste: a prediction methodology for the generation rate and composition in the European Union countries and the United States of America. Resour. Conserv. Recycl. 1998, 24, 155–166. [Google Scholar] [CrossRef]
  12. Massimiliano, M.; Roberto, Z. Waste generation, waste disposal and policy effectiveness: Evidence on decoupling from the European Union. Resour Conserv Recycl. 2008, 52, 1221–1234. [Google Scholar]
  13. Vieira, V.H.A.D.M.; Matheus, D.R. The impact of socioeconomic factors on municipal solid waste generation in São Paulo, Brazil. Waste Manag. Res. 2017, 36, 79–85. [Google Scholar] [CrossRef] [PubMed]
  14. Adamcova, D.; Vaverková, M.; Stejskal, B.; Břoušková, E. Household Solid Waste Composition Focusing on Hazardous Waste. Pol. J. Environ. Stud. 2016, 25, 487–493. [Google Scholar] [CrossRef]
  15. Suthar, S.; Singh, P. Household solid waste generation and composition in different family size and socio-economic groups: A case study. Sustain. Cities Soc. 2015, 14, 56–63. [Google Scholar] [CrossRef]
  16. Khan, D.; Kumar, A.; Samadder, S. Impact of socioeconomic status on municipal solid waste generation rate. Waste Manag. 2016, 49, 15–25. [Google Scholar] [CrossRef]
  17. KPGO Krajowy Plan Gospodarki Odpadami na lata 2006–2010. Available online: https://www.prawo.pl/akty/m-p-2006-90-946,17320015.html (accessed on 24 October 2019).
  18. KPGO Krajowy Plan Gospodarki Odpadami 2022. Available online: https://bip.mos.gov.pl/strategie-plany-programy/krajowy-plan-gospodarki-odpadami/krajowy-plan-gospodarki-odpadami-2022/ (accessed on 24 October 2019).
  19. Talalaj, I.A.; Walery, M. The effect of gender and age structure on municipal waste generation in Poland. Waste Manag. 2015, 40, 3–8. [Google Scholar] [CrossRef]
  20. Intharathirat, R.; Salam, P.A.; Kumar, S.; Untong, A. Forecasting of municipal solid waste quantity in a developing country using multivariate grey models. Waste Manag. 2015, 39, 3–14. [Google Scholar] [CrossRef]
  21. Keser, S.; Duzgun, S.; Aksoy, A. Application of spatial and non-spatial data analysis in determination of the factors that impact municipal solid waste generation rates in Turkey. Waste Manag. 2012, 32, 359–371. [Google Scholar] [CrossRef]
  22. Szul, T.; Knaga, J.; Nęcka, K. Application of Rough Set Theory to Establish the Amount of Waste in Households in Rural Areas. Ecol. Chem. Eng. S 2017, 24, 311–325. [Google Scholar] [CrossRef] [Green Version]
  23. Emery, A.D.; Griffiths, A.J.; Williams, K.P. An in depth study of the effects of socio-economic conditions on household waste recycling practices. Waste Manag. Res. 2003, 21, 180–190. [Google Scholar] [CrossRef] [PubMed]
  24. Boer, E.D.; Jędrczak, A.; Kowalski, Z.; Kulczycka, J.; Szpadt, R. A review of municipal solid waste composition and quantities in Poland. Waste Manag. 2010, 30, 369–377. [Google Scholar] [CrossRef] [PubMed]
  25. A Handbook for Researchers and Practitioners. Available online: https://marketing.wharton.upenn.edu/files/?whdmsaction=public: main.file&fileID=794 (accessed on 28 June 2018).
  26. Azadi, S.; Karimi-Jashni, A. Verifying the performance of artificial neural network and multiple linear regression in predicting the mean seasonal municipal solid waste generation rate: A case study of Fars province, Iran. Waste Manag. 2016, 48, 14–23. [Google Scholar] [CrossRef] [PubMed]
  27. Maryam, A.; Ali, E.H. Forecasting municipal solid waste generation using artificial intelligence modelling approaches. Waste Manag. 2017, 56, 13–22. [Google Scholar]
  28. Ustawa z dnia 14 grudnia 2012 r. o odpadach. Dz.U. 2013 poz. 21. Available online: http://prawo.sejm.gov.pl/isap.nsf/DocDetails.xsp?id=wdu20130000021 (accessed on 10 December 2018).
  29. D’Obyrn, K.; Szalińska, E. Odpady Komunalne: Zbiórka, Recykling, Unieszkodliwianie Odpadów Komunalnych I Komunalnopodobnych: Podręcznik Dla Studentów Wyższych Szkół Technicznych; Politechniki Krakowskiej: Kraków, Poland, 2005. [Google Scholar]
  30. Statistics Poland. Central Statistical Office. Local Data Bank. 2017. Available online: https://bdl.stat.gov.pl/BDL/start (accessed on 15 May 2018).
  31. Współczesne typologie obszarów wiejskich w Polsce–przegląd podejść metodologicznych. Available online: http://www.rcin.org.pl/Content/51257/WA51_70537_r2014-t86-z4_Przeg-Geogr-Banski.pdf (accessed on 24 October 2019).
  32. Statystyczne Metody Analizy Danych. Available online: http://zsi.tech.us.edu.pl/~nowak/smad/index.html (accessed on 24 October 2019).
  33. Breiman, L.; Friedman, J.H.; Olshen, R.A.; Stone, C.J. Classification and Regression Trees; Chapman & Hall/Crc: London, UK; New York, NY, USA; Washington, DC, USA, 1984. [Google Scholar]
  34. Brain, D.R. Pattern Recognition and Neural Networks; Cambridge University Press: Cambridge, UK, 1996. [Google Scholar]
  35. Greedy Function Approximation, A Gradient Boosting Machine. Available online: https://www.google.com.hk/url?sa=t&rct=j&q=&esrc=s&source=web&cd=2&ved=2ahUKEwi1s7mO4bHlAhVqF6YKHVDPAYgQFjABegQIAhAC&url=https\%3A\%2F\%2Fstatweb.stanford.edu\%2F~jhf\%2Fftp\%2Ftrebst.pdf&usg=AOvVaw0rq6xVnWvQoQvX2dyZNOkP (accessed on 24 October 2019).
  36. Stochastic Gradient Boosting. Available online: https://www.google.com.hk/url?sa=t&rct=j&q=&esrc=s&source=web&cd=2&ved=2ahUKEwiAlou_4rHlAhXMUN4KHSZ8Af4QFjABegQIABAC&url=https%3A%2F%2Fstatweb.stanford.edu%2F~jhf%2Fftp%2Fstobst.pdf&usg=AOvVaw2pYbdrR1pH_WjsRPMM0sOy (accessed on 24 October 2019).
  37. Jerome, H.F. Multivariate adaptive regression splines (with discussion). Ann. Stat. 1991, 19, 1–141. [Google Scholar]
  38. Trevor, H.; Robert, T.; Jerome, F. The Elements of Statistical Learning: Data Mining, Inference, and Prediction; Springer: Berlin, Germany, 2001. [Google Scholar]
  39. McCulloch, W.S.; Pitts, W. A logical calculus of the ideas immanent in nervous activity. Bull. Math. Boil. 1943, 5, 115–133. [Google Scholar] [CrossRef]
  40. Paweł, D. Prognozowanie w Przedsiębiorstwie; Wolters Kluwer Polska Sp. Z o.o.: Kraków, Poland, 2008. [Google Scholar]
  41. Cieślak, M. Prognozowanie Gospodarcze; Wydawnictwo Naukowe PWN: Warszawa, Poland, 1999. [Google Scholar]
Figure 1. Total amount of generated waste in kg·(per·year)−1 on the territory of municipalities in Poland in 2013–2016.
Geosciences 09 00458 g001
Figure 2. Amount of generated waste from households in kg·(per·year)−1 on the territory of municipalities in Poland in 2013–2016.
Geosciences 09 00458 g002
Figure 3. Mass waste accumulation for administrative communes.
Geosciences 09 00458 g003
Figure 4. Mass waste accumulation for administrative rural municipalities.
Geosciences 09 00458 g004
Figure 5. View of Data Miner working space.
Geosciences 09 00458 g005
Figure 6. Assessment of the quality of the developed models of the total waste accumulation indicator based on studied set of input variables (C1 to C10). C1—municipality administrative type; C2—functional structure of communes; C3—population density per·km−2; C5—indicator household size per·building−1; C6—average agricultural area ha; C7—percentage of buildings heated with natural gas; C8—participation of farms which earn income from agricultural activity; C9—indicator of the municipality income PLN·per−1; C10—typology of municipalities according to the scope of impact; and w—voivodeship.
Geosciences 09 00458 g006
Figure 7. Assessment of the quality of the developed models of the total waste accumulation indicator based on studied set of input variables (C1 to C10).
Geosciences 09 00458 g007
Figure 8. Assessment of the quality of the developed models of the total waste accumulation indicator for determined clusters in a varied system of input variables.
Geosciences 09 00458 g008
Figure 9. Assessment of the quality of the developed models of the total waste accumulation indicator from households for determined clusters in a varied system of input variables.
Geosciences 09 00458 g009
Figure 10. Distribution function of prediction errors of the total mass waste accumulation indicator.
Geosciences 09 00458 g010
Figure 11. Distribution function of prediction errors of the mass waste accumulation from household indicator.
Geosciences 09 00458 g011
Table 1. Indicators affecting the amount of waste generated.
Independent Variables:Reference:
administrative, functional, and economic type of the municipality[2]
affluence (“standard of living”) and inhabitants’ lifestyle[15,16]
average size of a household[5]
buildings type and heating system[2,5,12]
climate factors (the temperature and precipitation) and the season of the year[7,12,17,18]
eating habits and health indicators, such as lifespan and infant mortality, as well as the age structure of population[17,19]
fees for waste collection and disposal calculated per one inhabitant or per one ton and the frequency of waste collection[7,12]
household size[2,5,15,20]
level of contamination in selectively collected waste[7,12]
municipality’s income from taxes calculated per one inhabitant[13,21,22]
other technical and sanitary equipment of buildings[5]
participation in taxes comprising national budget income personal income tax[5]
participation of ashes and/or biodegradable waste in the mixed municipal waste stream[7,12]
participation of households composting organic waste[7,12]
participation of households equipped with furnace for solid fuels[5]
participation of waste collected selectively[7,12]
participation of waste from infrastructural facilities in the total weight of municipal waste[7,12]
percentage of municipality’s/city’s inhabitants covered under waste collection system[7,12]
population density[5,6,20,23]
saturation of technical infrastructure facilities[2]
social factors[2,5,6,13,19,23]
the number and capacity of containers calculated per one household—furnishing houses with small capacity containers motivates the inhabitants to collect waste selectively[7,12]
the number of unemployed people, the level and structure of employment[5,19,20]
tourism—the number of accommodation places, hotels, guesthouses, etc.[17]
tradition and people’s habits[6,17]
urbanization level[2,4,20,23]
Table 2. Mass waste accumulation indicators in relation to the place of its generation in Poland.
SpecificationAccording to [29]
[kg∙(per∙year)−1]
According to [17]
[kg∙(per∙year)−1]
big cities (>100 thousand citizens)220–400385.9
small and average cities (10–50 thousand citizens)180–330346.2
rural areas90–110233.9
Table 3. Description of the unit indicator of waste accumulation.
WasteValue:
AverageMin.Max.Variability Coefficient [%]
[kg·(per·year)−1]
total 2005–2012144.44.1829.227.4
total 2013–2016162.130.9950.553.0
from households 2005–2012105.51.6438.330.0
from households 2013–2016128.426.1430.147.6
Table 4. Impact of the administrative-type commune on the value of unit waste accumulation indicator.
Waste:Administrative Type of Commune/MunicipalityAverage
ValueMinMaxVariability Coefficient [%]
[kg·(per·year)−1]
totalmunicipal266.0104.4880.528.6
commune130.930.9950.556.3
rural municipality184.754.3466.536.1
from householdsMunicipal197.882.9385.224.6
Rural106.726.1430.149.6
rural municipality145.543.0373.436.2
Table 5. Description of the waste accumulation indicator for individual clusters.
VariableCluster (s)Average Value of the Waste Accumulation Indicator (kg·(per·year)−1)Coefficient of Variability (%)
waste total183 ± 547
2100 ± 952
3139 ± 1245
4232 ± 1525
waste from households169 ± 344
280 ± 752
3111 ± 947
4170 ± 1329

