Article

Analysis of the Space–Temporal Trends of Wet Conditions in the Different Rainy Seasons of Brazilian Northeast by Quantile Regression and Bootstrap Test

by
Rodrigo Lins da Rocha Júnior
1,
Fabrício Daniel dos Santos Silva
1,*,
Rafaela Lisboa Costa
1,
Heliofábio Barros Gomes
1,
Dirceu Luis Herdies
2,
Vicente de Paulo Rodrigues da Silva
3 and
Alexandre Candido Xavier
4
1
Institute of Atmospheric Sciences, Federal University of Alagoas, Maceió, Alagoas 57072-900, Brazil
2
National Institute for Space Research, Cachoeira Paulista, São Paulo 12630-000, Brazil
3
Academic Unit of Atmospheric Sciences, Federal University of Campina Grande, Paraíba 58429-900, Brazil
4
Department of Rural Engineering, Federal University of Espírito Santo, Alegre, Espírito Santo 29500-000, Brazil
*
Author to whom correspondence should be addressed.
Geosciences 2019, 9(11), 457; https://doi.org/10.3390/geosciences9110457
Submission received: 23 August 2019 / Revised: 18 October 2019 / Accepted: 21 October 2019 / Published: 24 October 2019
(This article belongs to the Section Natural Hazards)

Abstract

:
Drought causes serious social and environmental problems that have great impact on the lives of thousands of people all around the world. The purpose of this research was to investigate the trends in humid conditions in the northeast of Brazil (NEB) in the highest climatic precipitation quarters, November–December–January (NDJ), February–March–April (FMA), and May–June–July (MJJ), through the standardized precipitation and evapotranspiration index (SPEI), considering an alternative statistical approach. Precipitation and potential evapotranspiration (PET) time series for the calculation of the SPEI were extracted for the 1794 NEB municipalities between 1980 and 2015 from a grid dataset with a resolution of 0.25° × 0.25° using the bilinear interpolation method. The trends and statistical significance of the SPEI were estimated by quantile regression (QR) and the bootstrap test. In NDJ, opposite trends were seen in the eastern NEB (~0.5 SPEI/decade) and in the south (~−0.6 SPEI/decade). In FMA, most of NEB presented negative trends in the 0.50 and 0.95 quantiles (~−0.3 SPEI/decade), while in MJJ, most of NEB presented positive trends in all quantiles studied (~0.4 SPEI/decade). The results are consistent with observational analyses of extreme rainfall.

Graphical Abstract

1. Introduction

NEB is approximately 1.6 × 10⁶ km2 in area, with nine states: Maranhão (MA), Piauí (PI), Ceará (CE), Rio Grande do Norte (RN), Paraiba (PB), Pernambuco (PE), Alagoas (AL), Sergipe (SE), and Bahia (BA). The natural disaster that causes the most damage to the northeast region of Brazil (NEB) is drought, which is much more frequent than flood [1,2,3,4,5,6]. NEB has a biome with unique characteristics in its semiarid portion, the caatinga. Droughts are natural phenomena in NEB, however studies indicate that the intensity and magnitude of recent events have shown an increase in severity, which may be associated with accelerated deforestation in the semiarid interior where caatinga predominates [7].
Rainfall shows a marked spatial, seasonal, and interannual variability [8,9]. According to rainfall concentration, three areas differ in NEB: the north with annual averages ranging from 1000 to 1800 mm/year from the interior of the states of CE and PI to the wettest portion in the Amazon area of MA; 600 mm to 1200 mm in the midwest; and east with approximately 1200 to 1400 mm/year [10].
The midwest includes BA with the exception of the north coast, southern MA and PI, south central PE, and extreme west AL and SE, with rainfall concentrated in the November–December–January (NDJ) quarter. Rainfall occurs due to the influence of southern hemisphere frontal systems and the of the South Atlantic convergence zone as well as the action of high level cyclonic vortices [11,12,13,14]. The north includes the north-central MA, PI, and PE, all the CE, and west of RN and PB, with concentrated rainfall in February–March–April (FMA), influenced by the intertropical convergence zone [15,16,17], strongly modulated by sea surface temperature in the equatorial Atlantic Ocean [18]. The east is composed of the coastal strip of the RN, PB, PE, AL, SE, and north of the coast of BA, with the main rainy period in the months of May–June–July (MJJ), as a consequence of the east wave disturbances [19,20,21].
Other modes of variability modulate rainfall in the NEB, with low temporal frequency such as the North Atlantic Oscillation, Pacific Decadal Oscillation, Atlantic Multidecadal Oscillation, and Madden-Julian Oscillation [22,23,24,25].
Given the complexity of the objective quantification of drought, several indices have been developed to provide reliable deterministic methods for drought monitoring and analysis. The Palmer drought severity index (PDSI) is the pioneer method in this field and was of great importance in drought monitoring, incorporating the PET. Thereafter, there was the emergence of the self-calibrated PDSI, which solved the problem of classic PDSI fixed parameters [26]. The authors in [27] developed the standardized precipitation index (SPI), which adopted rainfall as the only relevant variable for drought. The method had the advantage of characterizing drought on multiple time scales, unlike previous indices. More recently, [28,29,30] proposed an index that joins the multi-temporal characteristic of SPI with the temperature sensitivity of PDSI. The standardized precipitation evapotranspiration index (SPEI) considers, moreover, that PET has relevance in the characterization of drought in the context of climate change [31,32,33,34].
In order to propose strategic actions to mitigate the negative effect of droughts, many studies have focused on analyzing the frequency and trend of the phenomenon using different indices [35,36,37]. Due to its quality and simplicity, the SPI is the most utilized index in these analyses [38,39]. In addition, for their simplicity, the methods of linear regression and Mann–Kendall are widely used to detect significant drought trends [40,41,42,43].
The main purpose of this research was to detect trends in the SPEI historical series for the NEB, similar to what was done by [30] for Spain. Trend estimation was performed by quantile regression (QR), utilizing the bootstrap technique. Unlike traditional trend inference methods, QR does not assume any probability distribution for estimating parameters, and allows inference over all quantile levels. The basis of the bootstrap is to obtain a “new” dataset, resampling the original dataset [44,45]. This new distribution, conditioned to the original data, provides an approximation to the actual distribution of the statistics of interest, in a way that the properties of this distribution are estimated by the respective characteristics in the bootstrap distribution, namely, the variance of a given estimate is achieved from the variance of the bootstrap distribution of the statistics of interest. An advantage of the bootstrap technique is to achieve good estimations of standard errors in distribution, generated by parameter estimates in the resampling iterations [46].

2. Materials and Methods

2.1. Data and Field of Study

In this study, we used the precipitation and PET time series for 1794 NEB municipalities (Figure 1b), spatially distributed over pluviometrically homogeneous states and regions [11,12,13,14,15,16,17,18,19,20,21,22,23,24,25,26,27,28,29,30,31,32,33,34,35,36,37,38,39,40,41,42,43,44,45,46,47] (Figure 1a). The series were extracted from version 1 of the public domain grid analysis made available and described by [48], using the basis of the bilinear interpolation theory [49]. This grid analysis had a spatial resolution of 0.25° × 0.25° of several weather variables for all of Brazil, for the period of 1980 to 2015. In addition, as described in [48], PET was calculated using the Penman–Monteith (PM) method [50,51], based on the data of maximum and minimum temperatures, solar radiation, relative humidity, and wind speed.
As the grid analysis of rainfall and PET data will always provide four grid points around one point of interest, time series were extracted for each NEB municipality using the simple bilinear interpolation method. This method calculates a value of the variable in a specific point of the grid, assigning characteristic weights to each of the four grid points in relation to the point of interest, with a greater weight the closer the grid point of the point of interest [50].
The data made available by [48] have already been put to use in recent studies. The authors in [52] used precipitation data to evaluate the performance of rainfall estimates derived from soil moisture products via microwave-based satellites, and [53] analyzed indices of climate extremes of precipitation in the Amazon and NEB.

2.2. Standardized Precipitation-Evapotranspiration Index (SPEI)

SPEI, proposed by [28], was chosen to quantify the dryness/humidity conditions of the NEB. SPEI is characterized as the standardized water balance (Equation (1)) between precipitation ( P i ) and potential evapotranspiration ( P E T i ).
D i = P i P E T i
The Log–Logistic function, expressed by Equation (2), was used as the probability density function to model the D series, where α ,   β ,   and   γ are the scale, form, and origin parameters, respectively, for D values in the ( γ > D < ) range. This probability distribution is recommended by [28] because it better models the D series when compared to similar distributions. The parameters were obtained by the L-moments method, as this is the easiest and most robust approach [54].
f ( D ) = β α ( D γ α ) β 1 ( 1 + ( D γ α ) β ) 2
Equation (3) provides the probability density function for the D series, according to the log–logistic distribution. SPEI is easily obtained as standardized values of F(D).
F ( D ) = [ 1 + ( α D γ ) β ] 1

2.3. Quantile Regression (QR)

NEB is characterized by three large pluviometrically homogeneous areas, the midwest, north, and east. SPEI trends were analyzed by QR for the NDJ quarter relating to the rainiest period of the midwest of the NEB; FMA relating to the rainy season of the north of NEB; and MJJ, which is the rainiest quarter of the east of the NEB [48]. Thus, the analyzed SPEI timescale was the SPEI-3, derived from precipitation and PET from the NDJ, FMA, and MJJ quarters. SPEI-3 represents the quarterly value of this variable, based on the three-month cumulative rainfall and the average PET of these three months. This time scale was chosen because it is where weather drought is generally observed.
For each of the rainfall homogeneous regions of the NEB (Figure 1a), the north, east, and midwest, in addition to studying the variability and trends of the SPEI spatially, the trends for a significant municipality in each of these areas were studied: Barreiras, in the state of Bahia in the midwest (Latitude: −12.2°; Longitude: −45°; Altitude: 439 m.a.s.l); João Pessoa, in the state of Paraíba in the eastern region (Latitude: −7.1°; Longitude: −34.9°; Altitude: 7 m.a.s.l); and Fortaleza, in the state of Ceará in the northern region (Latitude: −3.8°; Longitude: −38.6°; Altitude: 26 m.a.s.l).
According to [55], most climate trend analyses have focused on estimating the trend of the average by ordinary regression or the trend of extremes by methods that take on some probability distribution or condition of exceedance. Such methods need to be adjusted to take into account the serial correlation of the series and do not consider that climate data do not necessarily follow a normal distribution. The advantage of using QR is that the method is independent of probability distributions, and the serial correlation of the series does not the influence parameter estimation. The method allows the calculation of the trend at all quantile levels of the series, so it is possible to measure the change in data distribution over time. We analyzed the trend of the lower quantile (Q5), the mean quantile (Q50), and the upper quantile (Q95). Its methodological basis is explained as follows.
Y is a series of SPEI at a quantile level τ. Then, the quantile τ t h of Y , denoted by Q y ( τ ) is given by P [ Y Q y ( τ ) ] = τ , where τ [ 0 , 1 ] . The conditional linear function can be written as:
Q y ( τ | X i ) = X i β ( τ )
where β ( τ ) = ( β 1 ( τ ) , ,   β m ( τ ) ) are the regression coefficients for the quantile level τ . Linear QR is estimated by minimizing the function (6), similar to the method of least squares estimates.
i = 1 n ρ τ ( y i X i T β )
where ρ τ is the absolute value function; X is the original series of SPEI; and Y is the value of SPEI at the quantile level τ. We assumed that the quantile is a linear function in time and is given by:
Q ( τ | t ) = β 0 ( τ ) + t β 1 ( τ )
where β 0 ( τ ) is the intercept; β 1 ( τ ) is the regression coefficient or the trend coefficient; and t is time in years.
The statistical significance of the line slope parameters was calculated by non-parametric bootstrap sampling. This approach allows for a more accurate estimation of parameter confidence intervals [56]. The parameters to be interpreted were considered statistically significant if the probability of the parameter assuming a zero value is less than 5% (p-value = 0.05). The geographical location of the localities that reached statistical significance is highlighted on the map by a dot. For details on trend analysis by QR, we recommend reading [57,58,59].

3. Results and Discussion

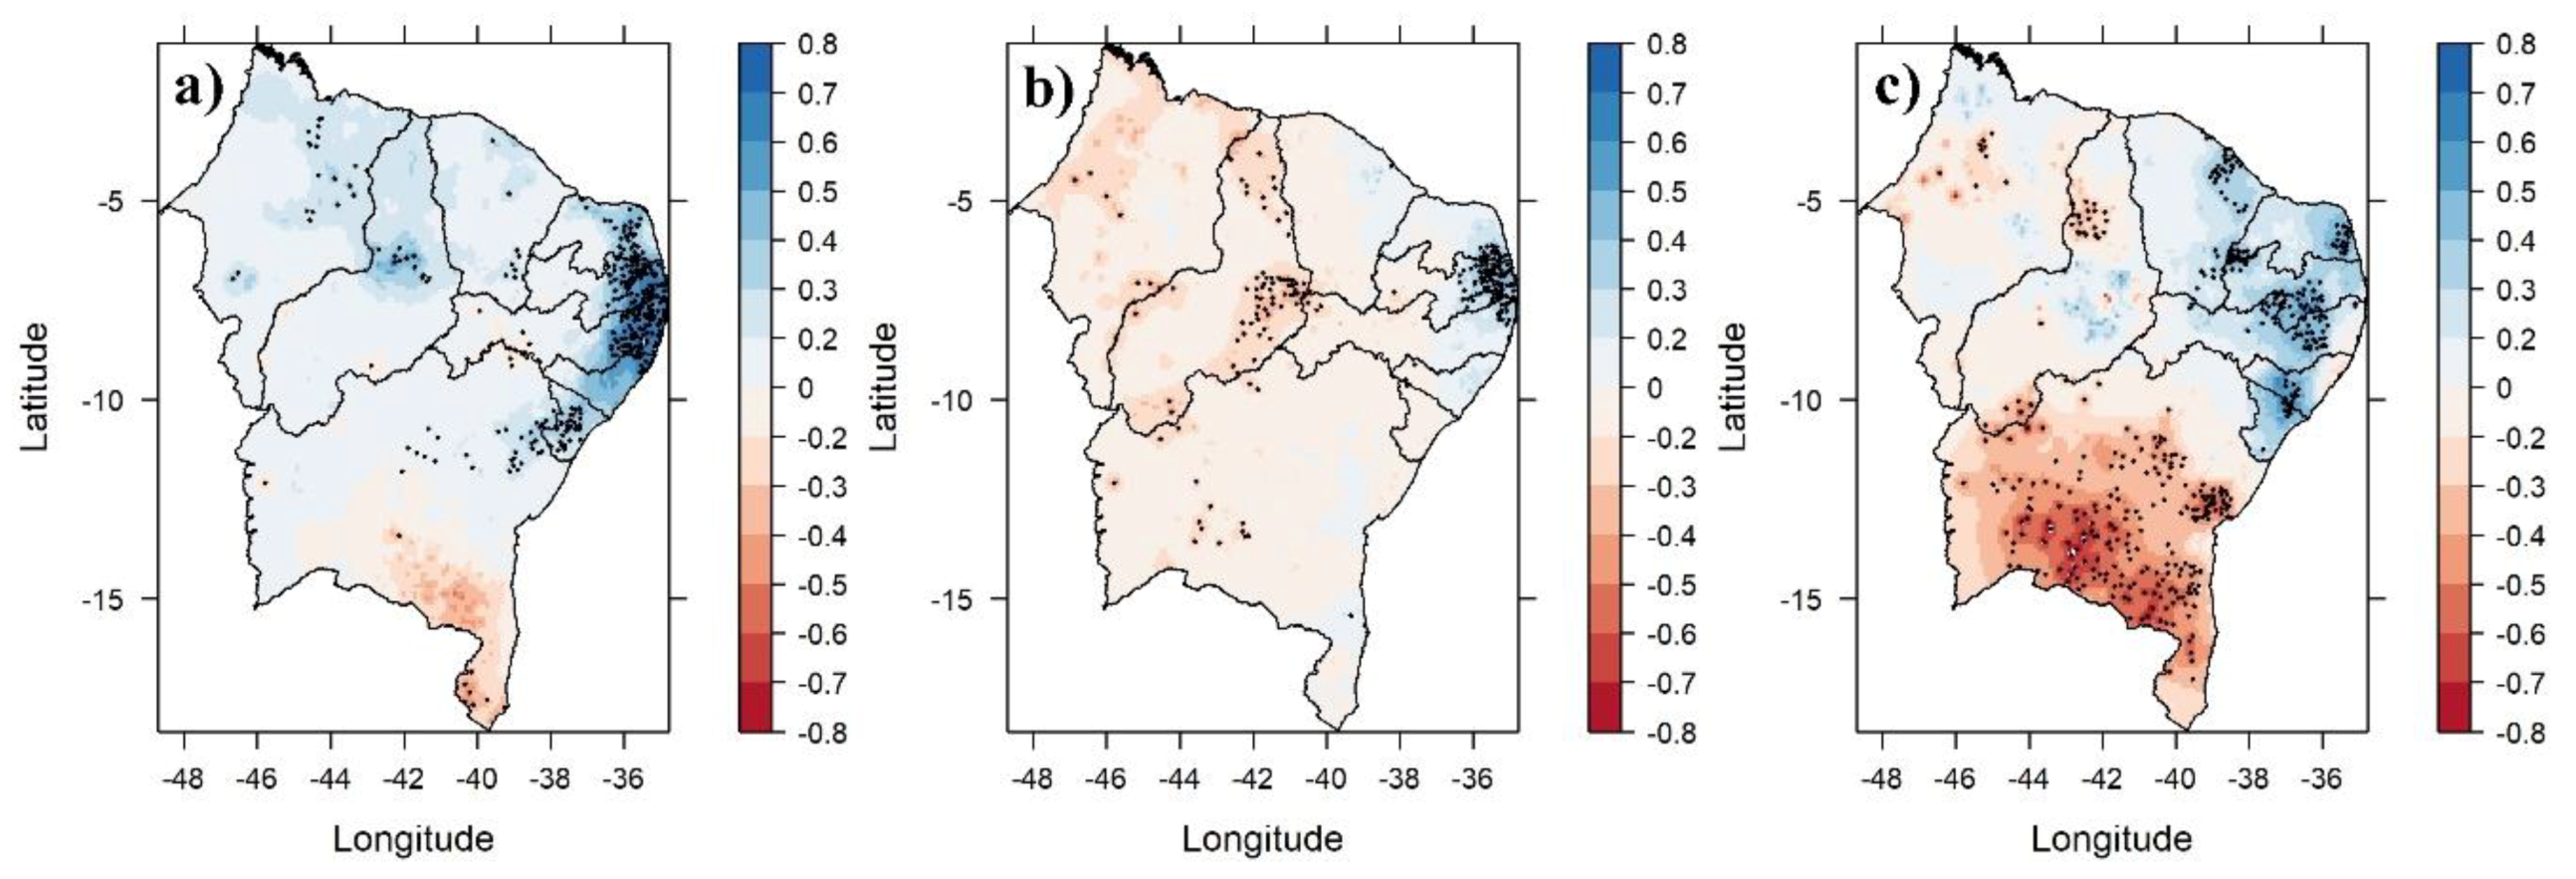
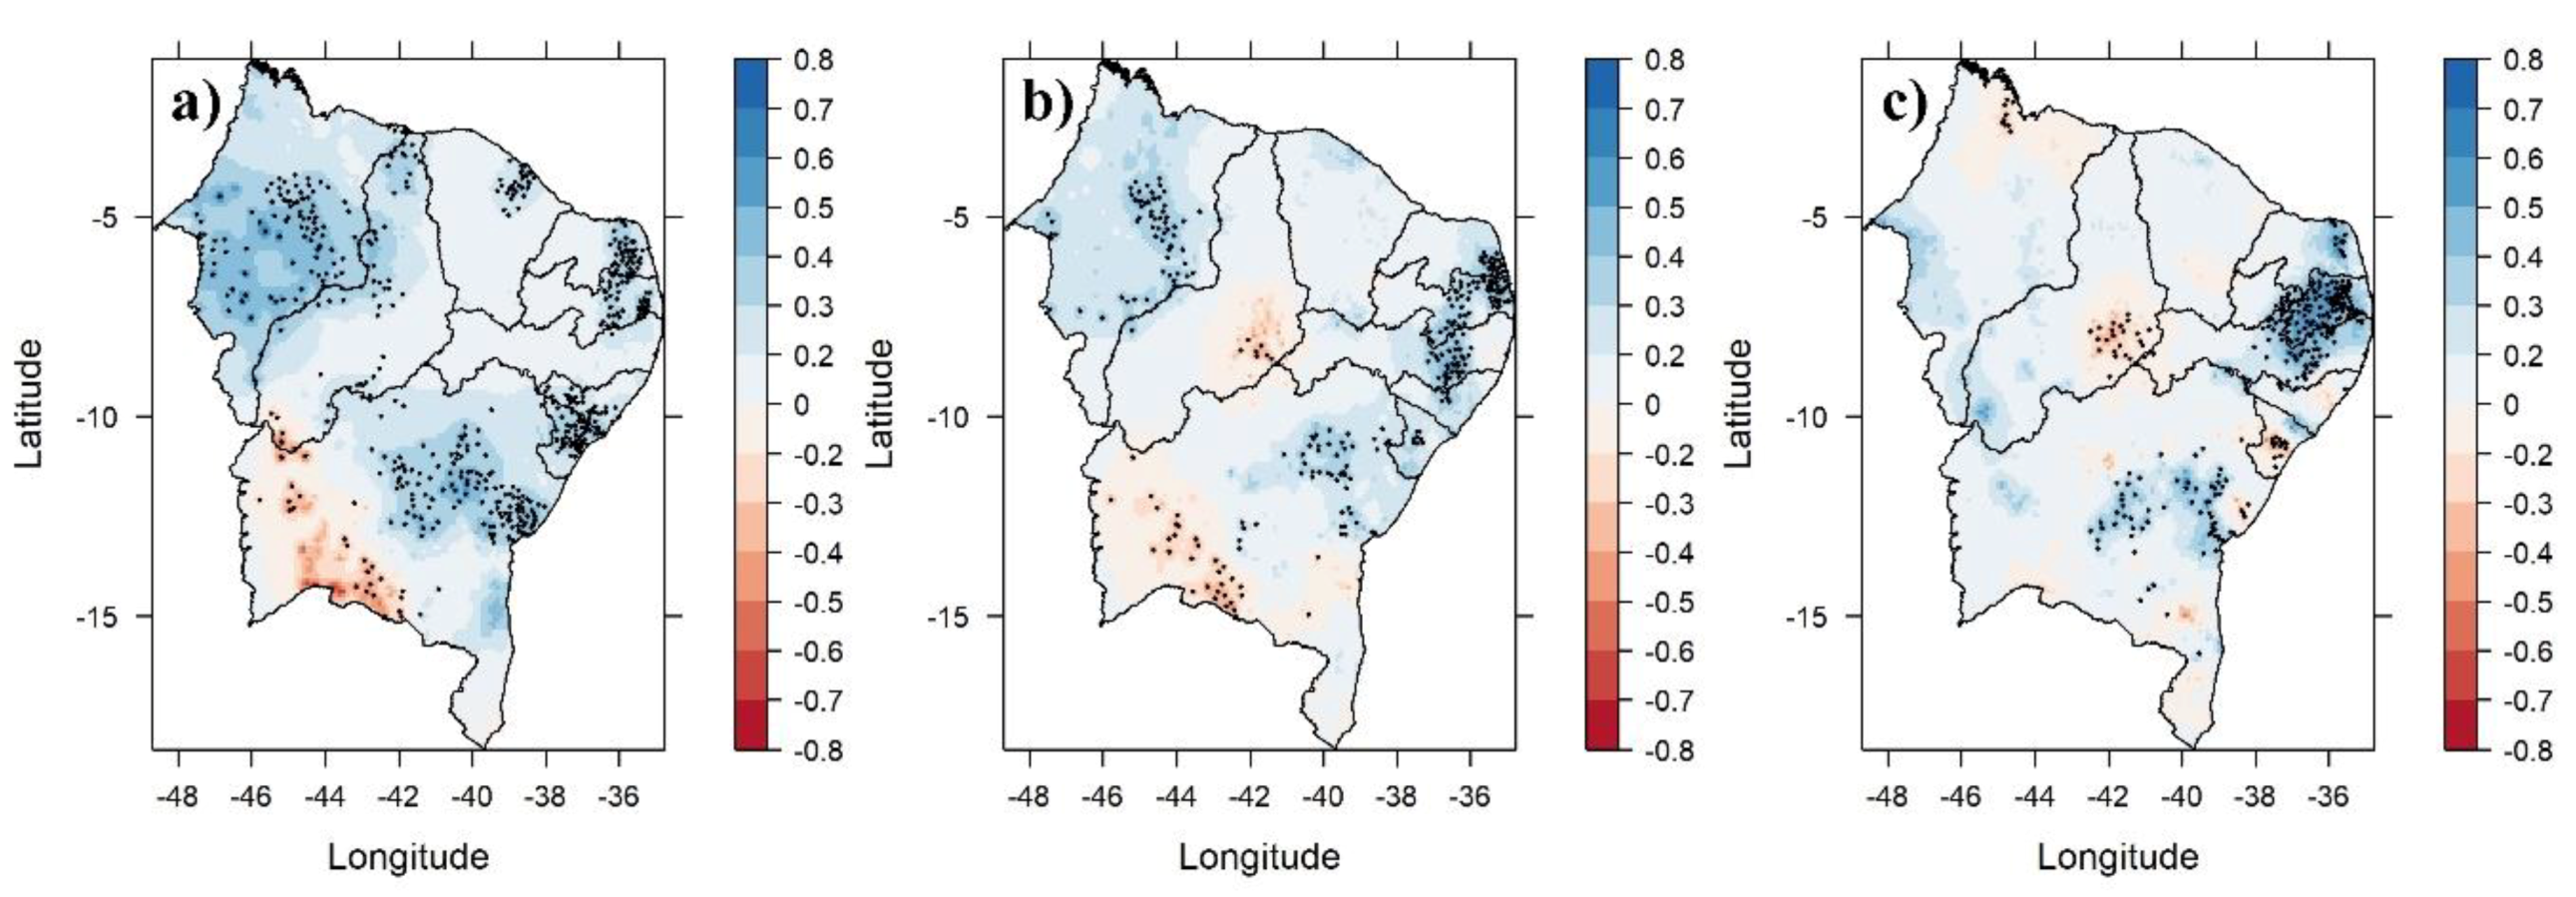
East of the NEB presented significant trends of humidity between 0.2 and 0.7 SPEI/decade at all quantile levels in the NDJ quarter (Figure 2). The positive trend at all three levels indicates a change in the frequency distribution of the sector. Studies by [60] and [61] found increasing trends in precipitation in this same area when analyzing extreme daily precipitation indices. This result corroborates the positive precipitation trends for the months of December to February in the State of Paraíba, detected by [62]. In the lower quantile, some stations presented weak trends of humidity in the north sector of the NEB (Figure 2a). The midwest of the NEB presented weak trends of dryness (−0.2 SPEI/decade) in the mean quantile (Figure 2b). This quarter was the rainiest period in the midwest sector of NEB, which presented a strong trend of dryness in the upper quantile (Figure 2c). The outlook is for the occurrence of more extreme drought events in this period.
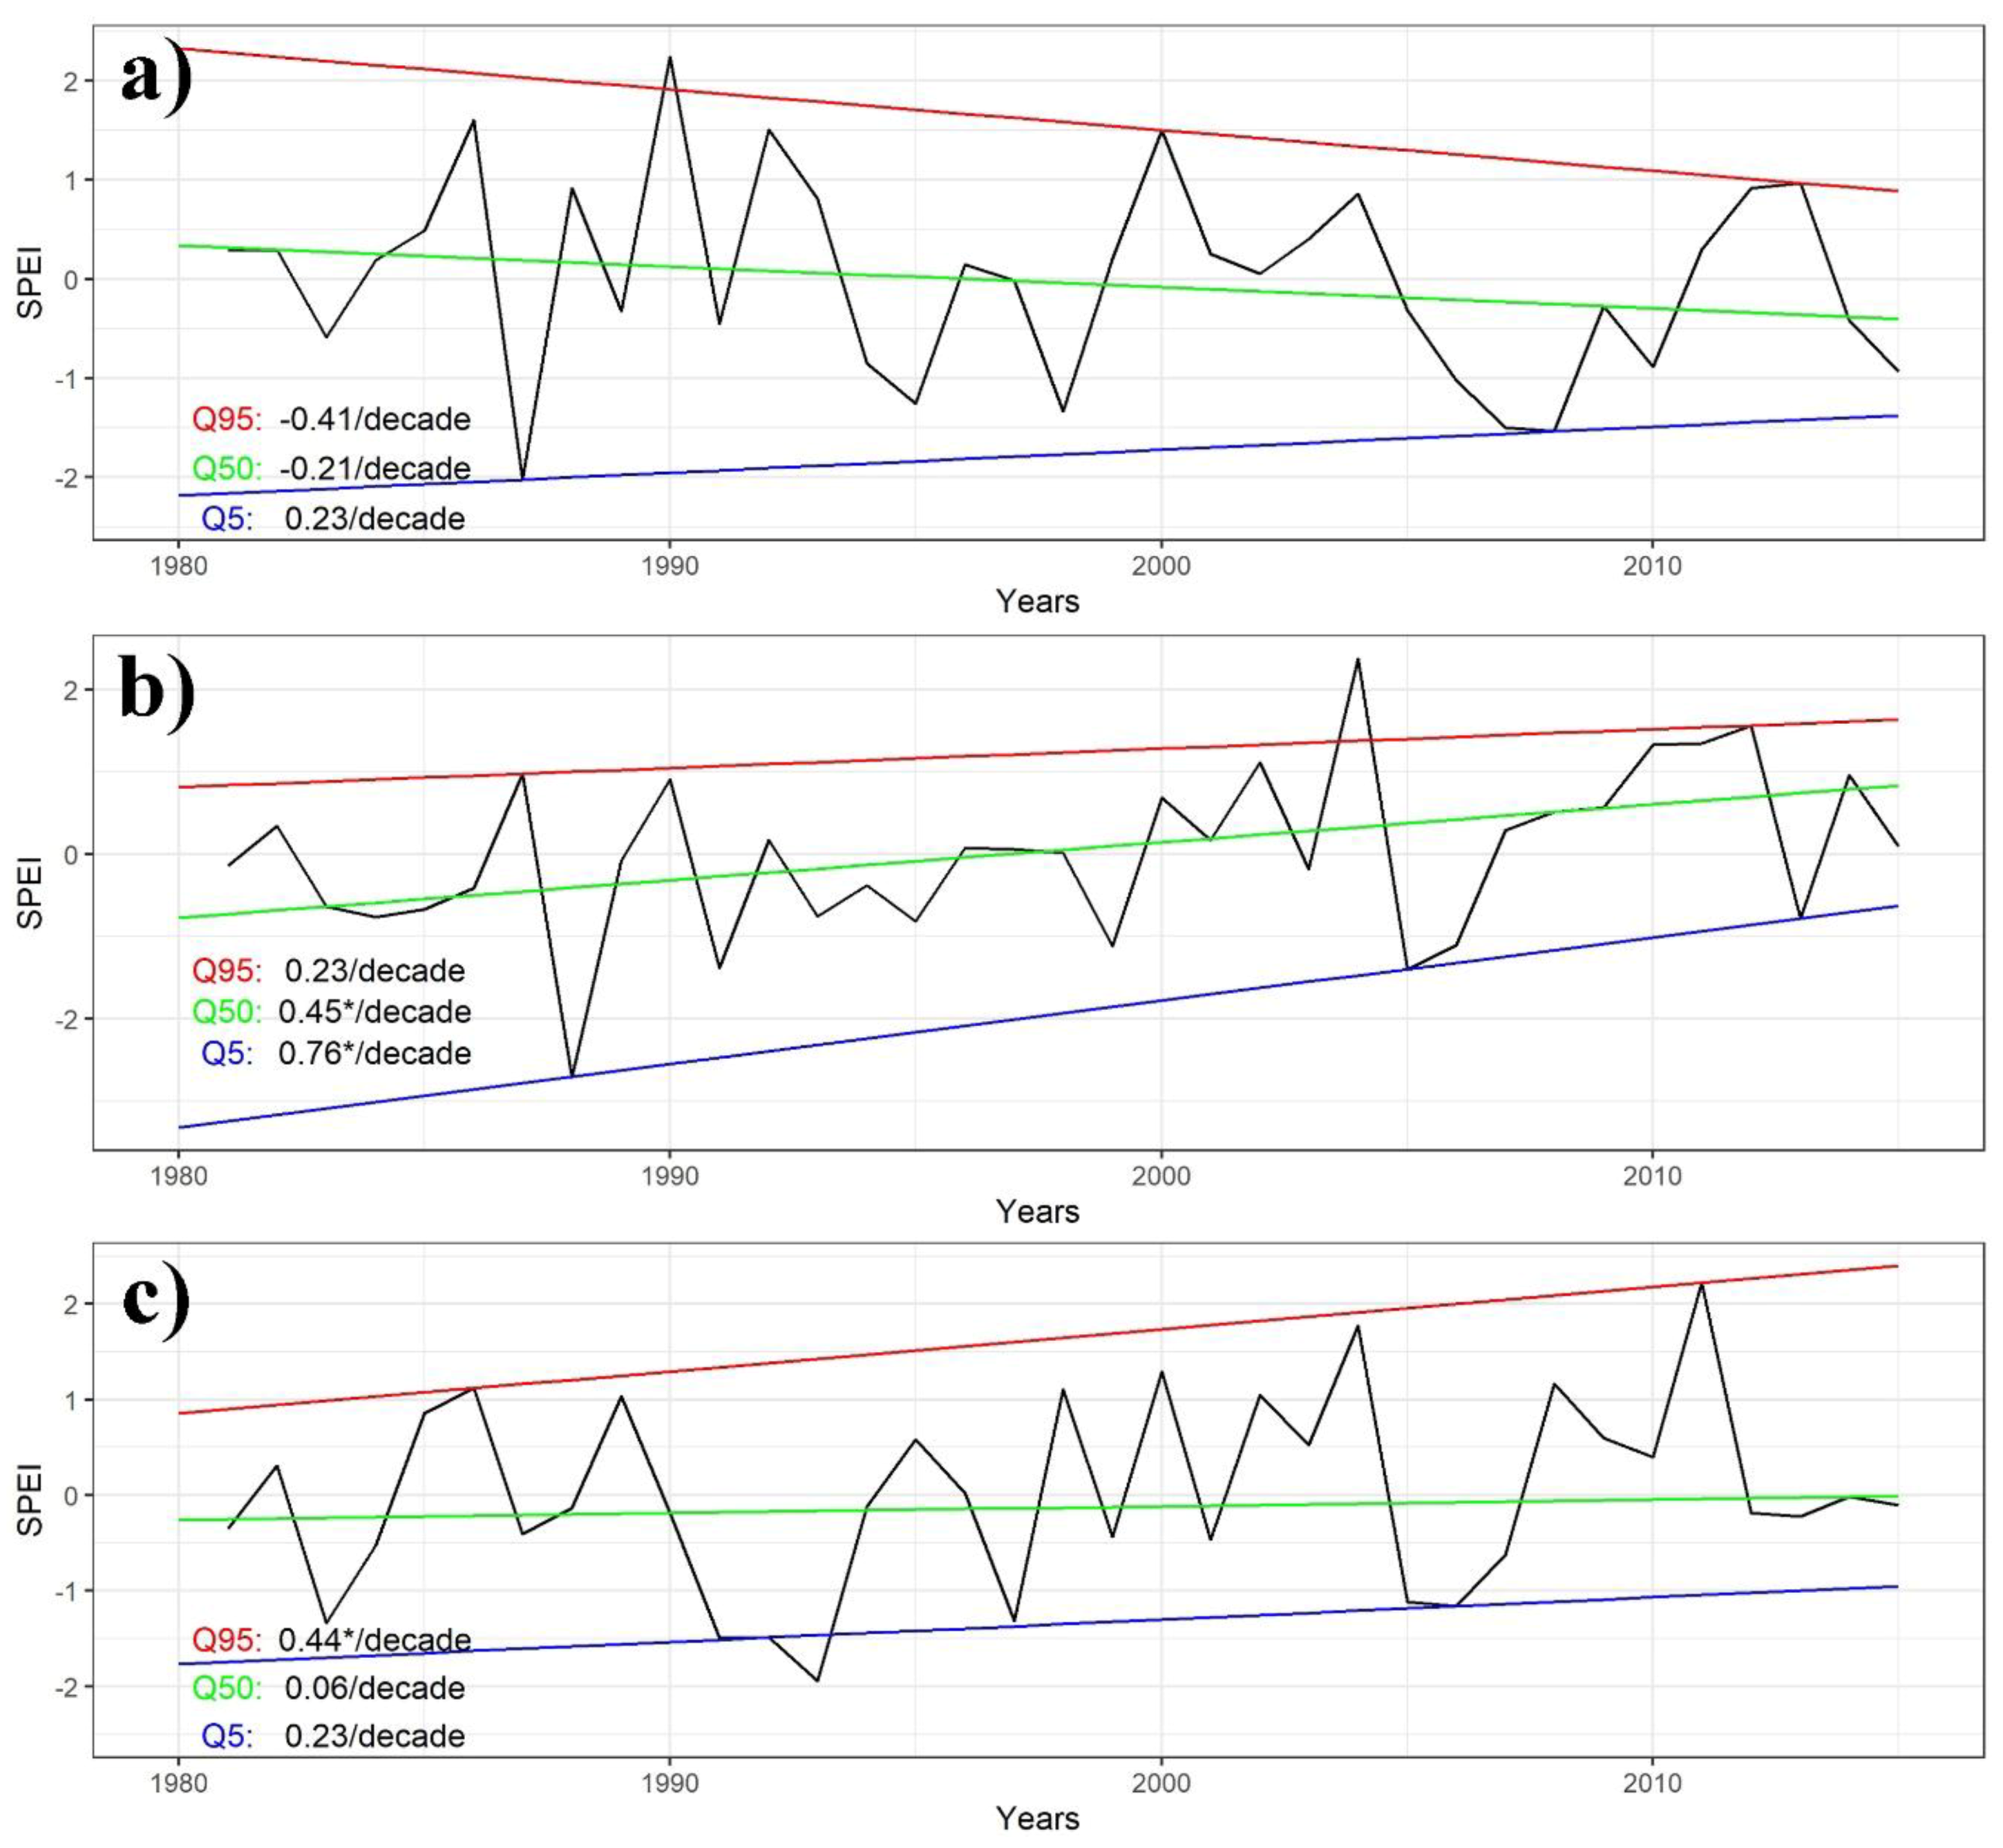
Figure 3 shows the trends of each quantile level in the three municipalities chosen to represent each of the pluviametrically homogeneous regions of the NEB (the black line is the SPEI, the red line represents the upper quantile 95, the intermediate green line the 50th quantile, and the blue line the lower quantile 05). In the NDJ quarter, Barreiras presented negative trends in Q50 and Q95, and a positive trend in Q5. None of these trends presented statistical significance (Figure 3a). Considering that there was a negative trend in Q95 and a positive trend in Q5, it can be concluded that there is a clear contraction of drought variability in this municipality, and dry and wet periods should be less intense. João Pessoa and Fortaleza presented positive trends at all levels. In João Pessoa, the Q50 trend of 0.45 SPEI units per decade was statistically significant (Figure 3b), while in Fortaleza, there was statistical significance in the Q95 positive trend of 0.44 SPEI units per decade.
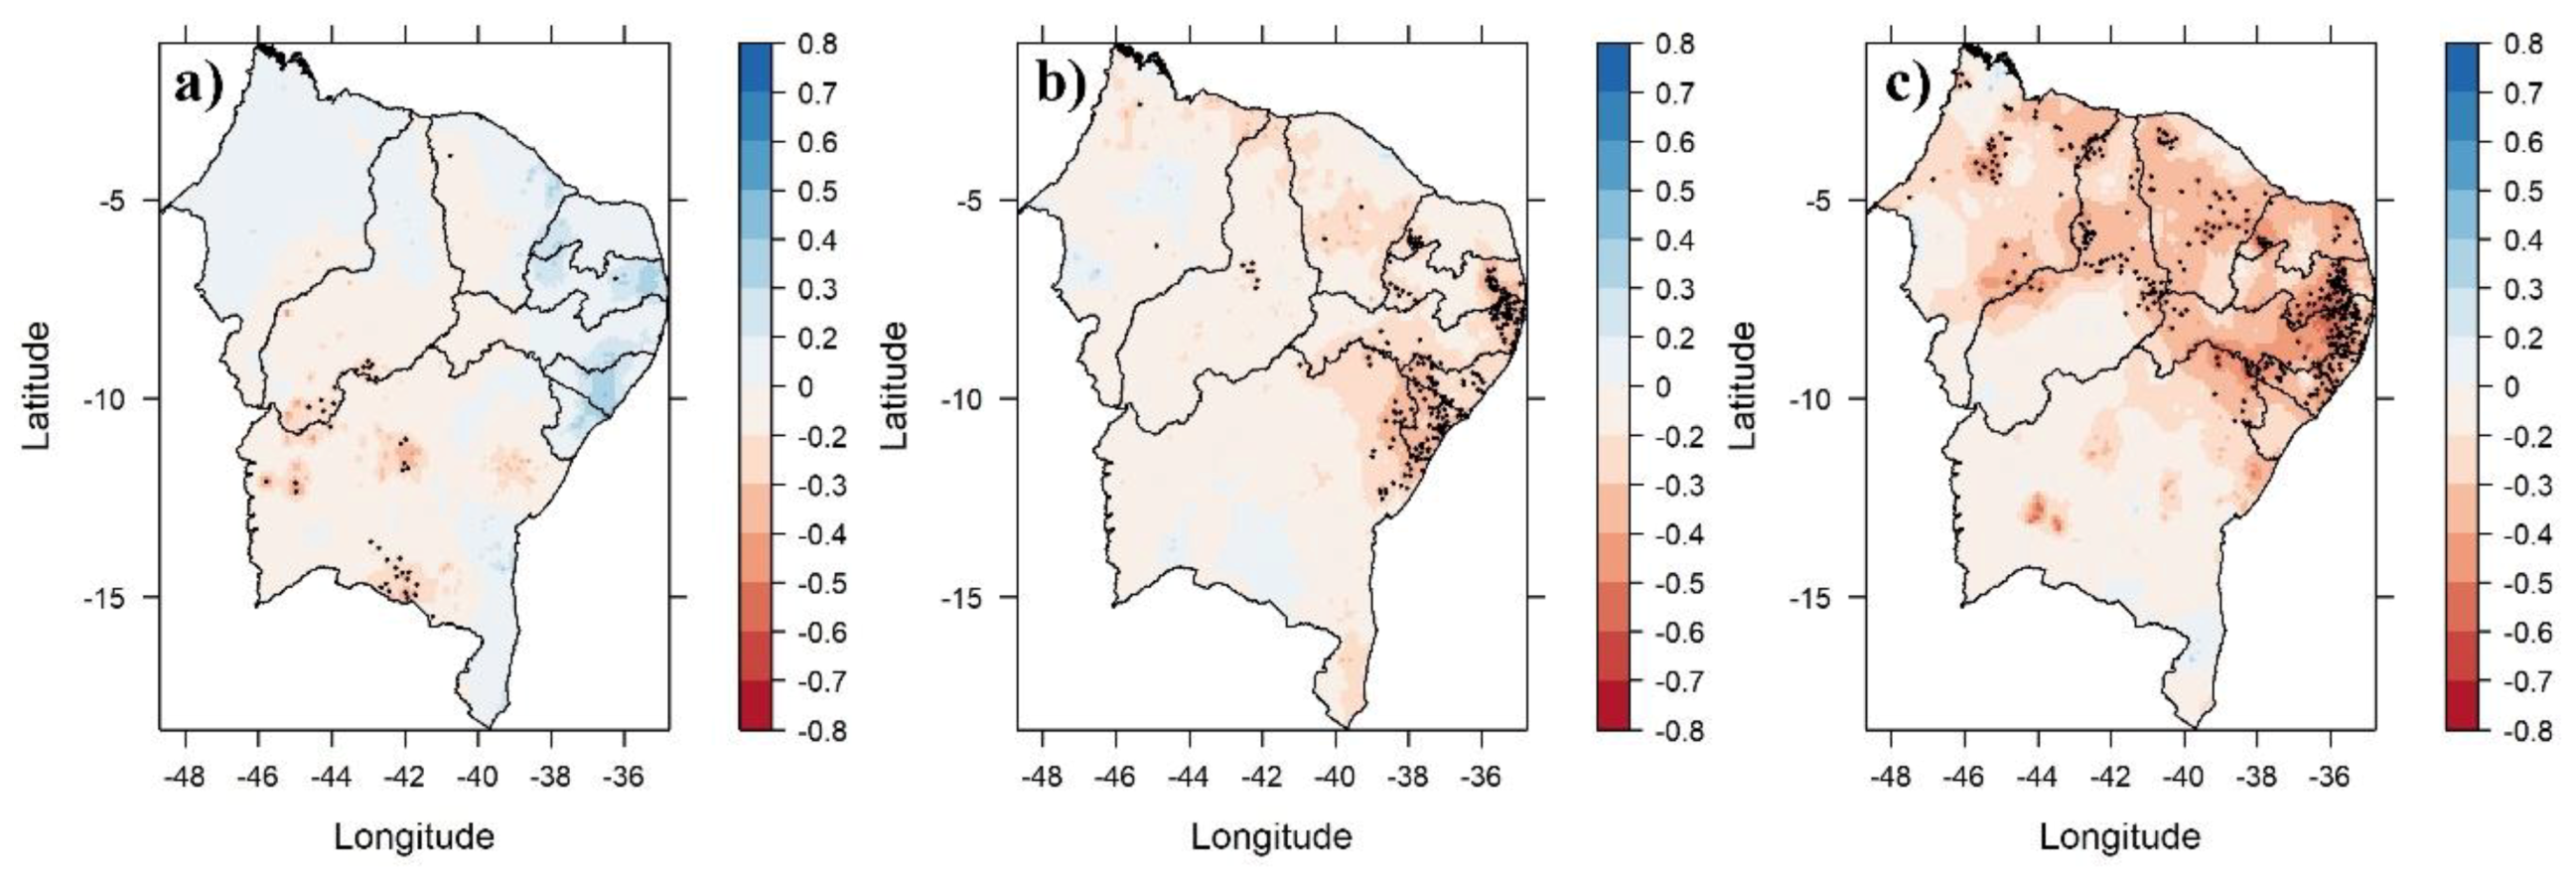
In the lower quantile of the FMA quarter, few stations presented significant trends. These stations are located in the south of NEB and showed a weak trend of dryness (Figure 4a). In the mean quantile, there were significant trends of dryness in the east of the NEB (Figure 4b), which extended throughout the north sector of the NEB in the upper quantile (Figure 4c). The FMA quarter was the rainy season of the north sector. There was a clear contrast in this sector between the NDJ and FMA quarters (Figure 2 and Figure 4). While there was a trend of dryness in the rainy period (FMA), there was a trend of higher humidity in the previous quarter (NDJ). These results suggest a temporal displacement of the rainy season in the north of the NEB.
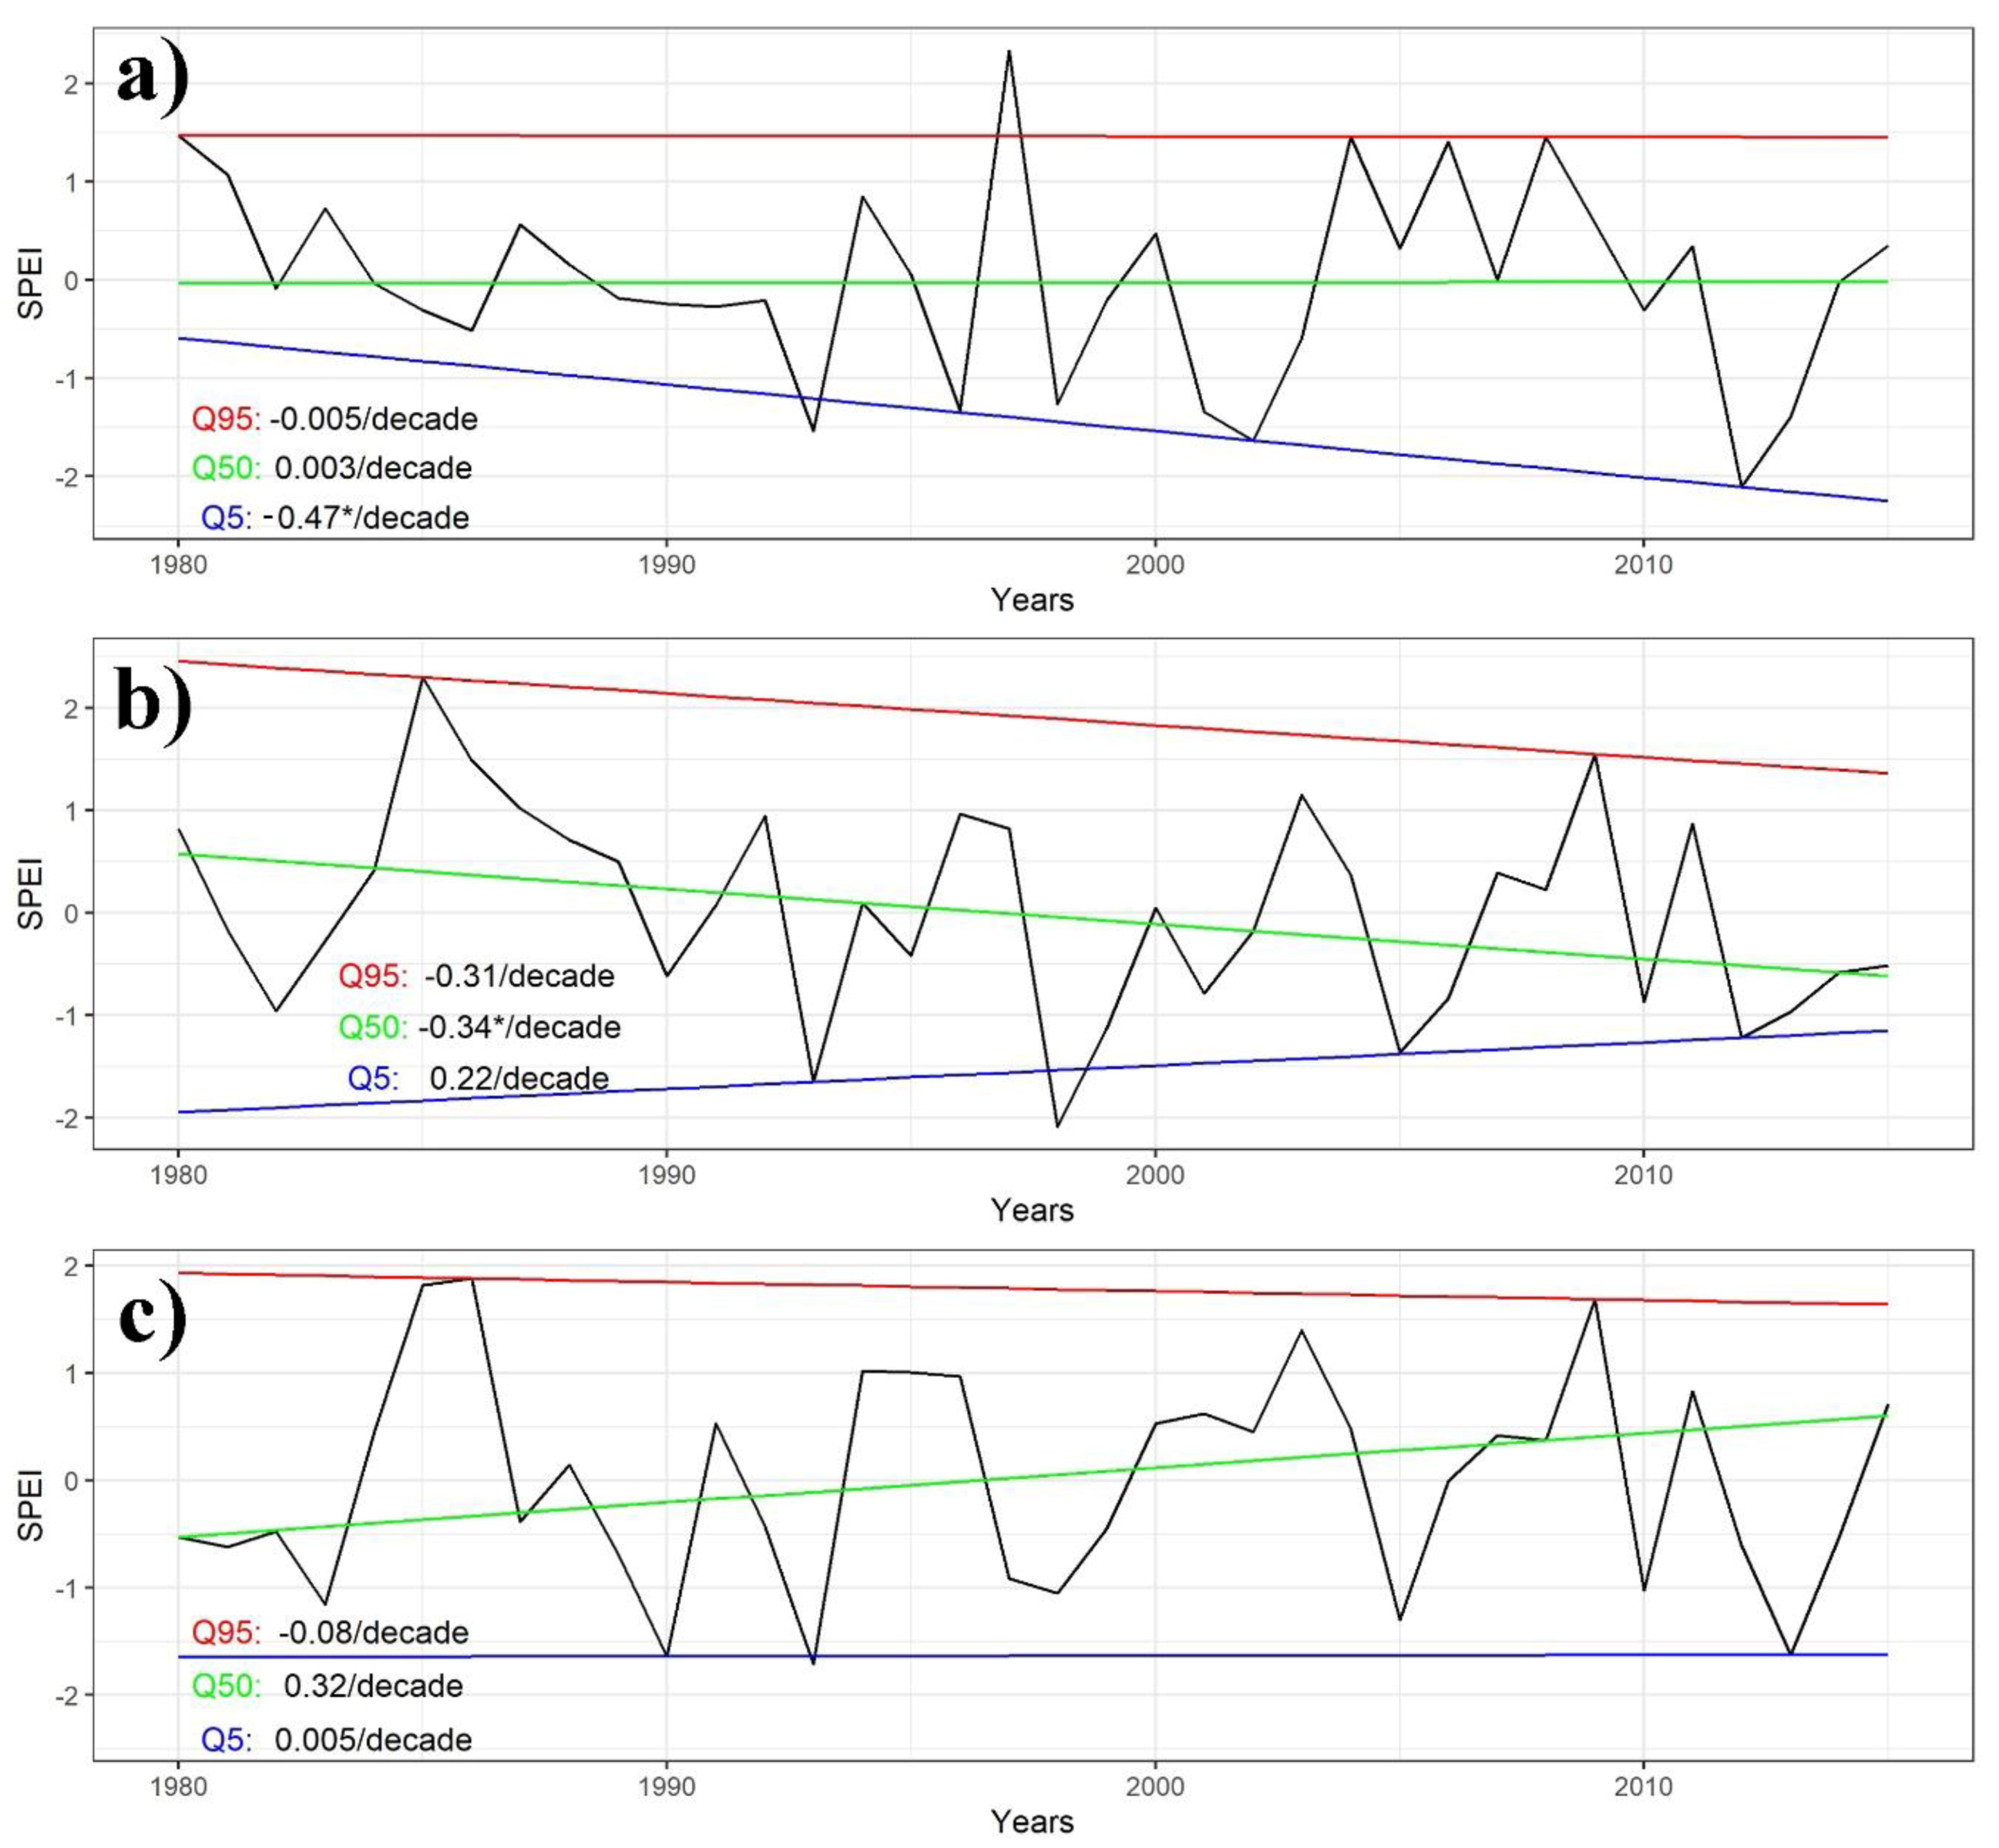
In the FMA quarter, the cities of Barreiras and João Pessoa had significant trends in Q5 (−0.47 SPEI units per decade) and Q50 (−0.34 SPEI units per decade), respectively. Barreiras exhibited negative trends at levels Q95 and Q05 (Figure 5a), indicating that there was an increase in severe drought events. In João Pessoa, Q95 and Q50 showed negative trends while Q05 showed a positive trend (Figure 5b). The pattern displayed for João Pessoa indicates a decrease in extreme drought and flood events. Fortaleza showed a positive trend only in the median quantile, indicating an increase in drought events, but without an increase in the intensity of extreme events (Figure 5c).
The MJJ quarter presented dominant humidification trends in most of the NEB at all quantile levels (Figure 6). The southwest sector presented a trend of dryness in the lower and mean quantiles (Figure 6a,b). The humidification trends of the lower quantile were more pronounced and extensive than other quantiles (Figure 6a). In the north sector, more precisely the northwest, a trend of higher humidity can be observed, characterizing a dislocation of the rainy period in this sector. This result is in accordance with [63], which showed significant positive trends in this sector, with the rainy season occurring later on. The eastern range of the NEB presented considerable trends of humidity, being the only one to present an increasing trend of the wet period during its rainy season.
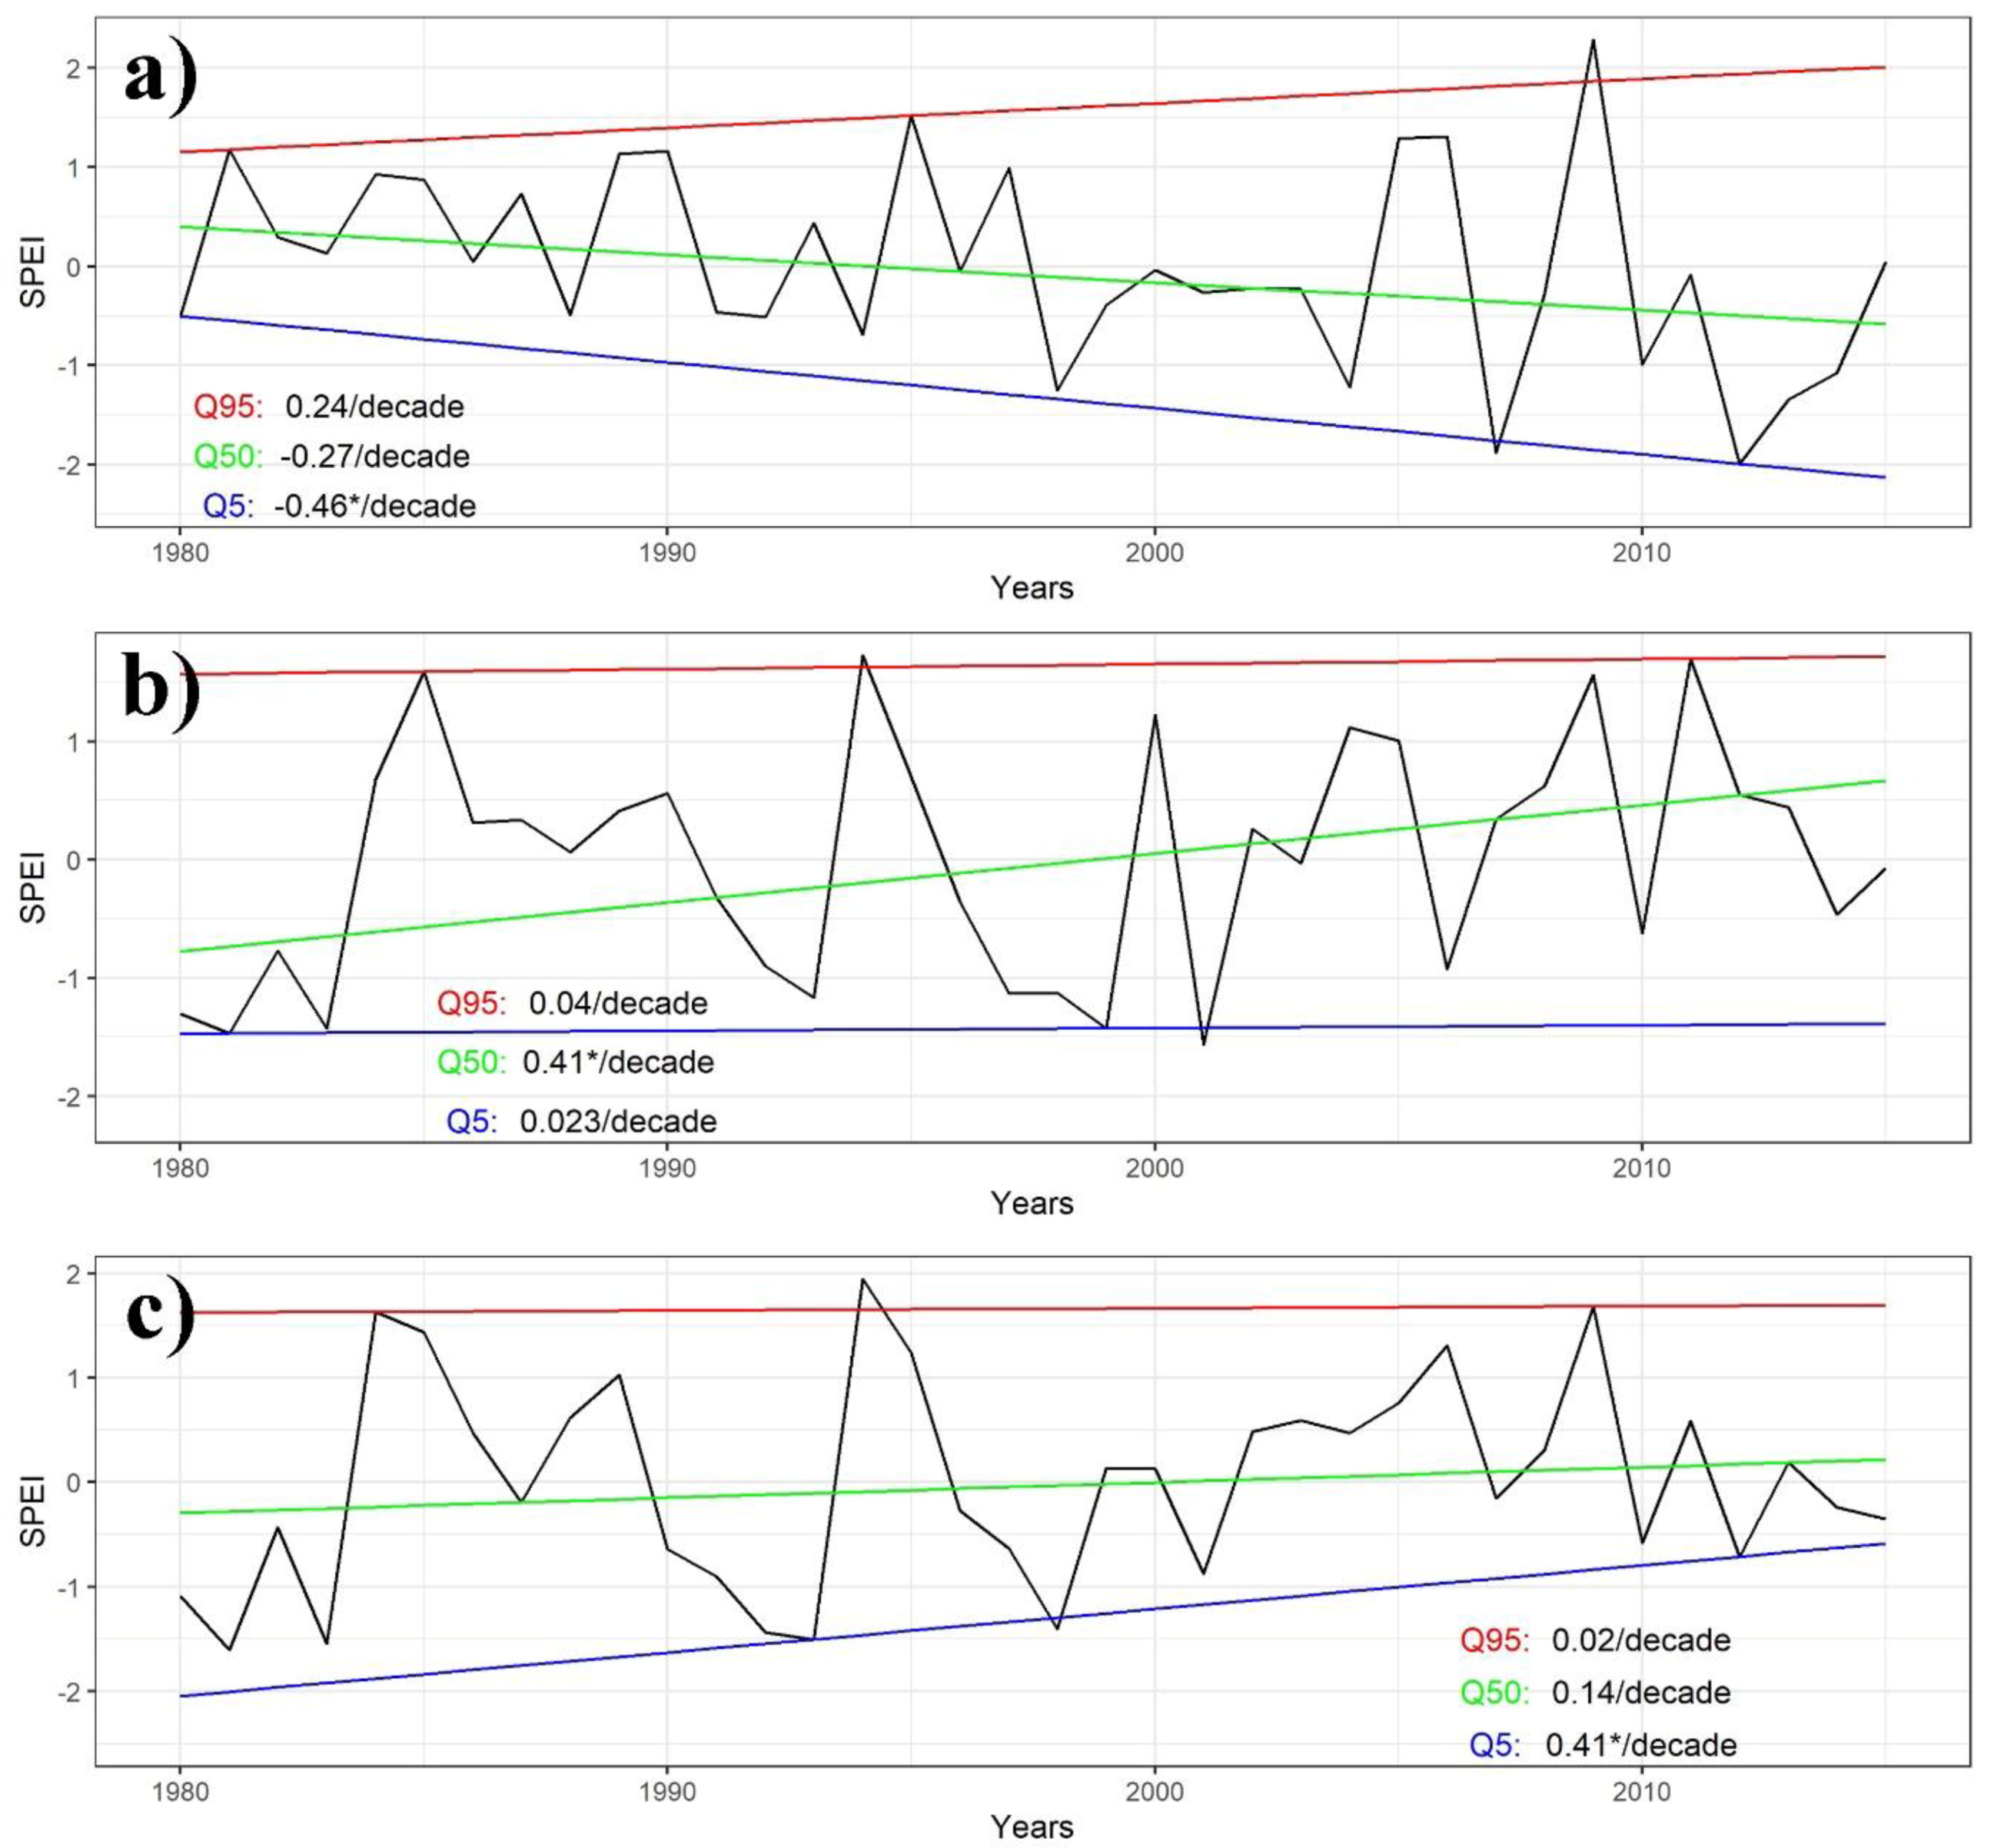
For MJJ, the municipality of Barreiras presented different trends in its quantile levels, showing a clear increase in SPEI variation, with increased intensity of both dry and wet periods (Figure 7a). The upper quantile (Q95) showed a positive trend, while the Q50 and Q5 quantiles presented negative trends. Only the trend of −0.48 SPEI units per decade on Q5 was significant. In João Pessoa, the trends in the Q95 and Q5 quantiles were practically zero (Figure 7b). On the other hand, there was a positive and significant trend of the average (Q50) of 0.41 SPEI units per decade. This implies that while the average SPEI values increased, the rainy period extremes remained stable. In other words, the frequency of the wetter period increased, while the magnitude remained the same. A similar pattern repeated itself in Fortaleza. The Q95 and Q50 quantiles were practically null (Figure 7c), but the Q5 quantile presented a positive and significant trend of 0.41 SPEI units per decade, indicating a drought variability reduction in the municipality.
The authors in [64] analyzed the scenarios generated by CMIP5 models in the NEB domain to assess the future of droughts in the region. The models showed an increase in austral summer precipitation and a decrease in austral winter. In general, the models pointed to a greater intensification of droughts in the NEB. The trends of the north and south sectors in the NDJ quarter (Figure 2) were consistent with the results found by the author for the DJF quarter. The study by [65] analyzed other scenarios using SPI at 6 and 12 month scales. Overall, the projections showed an increase in drought intensity, frequency, duration, and magnitude for the NEB region at both time scales. The results of these numerical experiments partially agree with the outcomes of this paper. [66] observed a trend of extreme increase of precipitation in the NEB. The author also observed a great temporal variability, indicating that trends are influenced by interannual variability.
In the NEB, water resources are of great importance for agriculture, supply, industry, and electrical production [67], but are not abundant. The availability of this resource is partly affected by natural or anthropogenic climate change at regional scales, which causes soil degradation by decreasing moisture, and reduced water storage in watersheds. These effects are directly related to the drought phenomenon, which is characterized by widespread water deficit over a relatively long time scale.
The vast majority of people living in the semi-arid NEB depend on rainfed agriculture. However, the great droughts are an obstacle to their lives, causing massive rural exodus. In a brief survey conducted in the state of CE, it was shown that the consequences of droughts were short and long term, with effects present in periods of three months to more than two years [68]. Due to spatiotemporal irregularity and low rainfall, much of the NEB faces a chronic problem of water scarcity, human supplies, and agricultural activities, which can be easily identified through low vegetative vigor [69,70,71].
Given these questions, the results of this research point to changes in rainfall distribution at extreme quantile levels. In NDJ, there is a tendency of decreased rainfall in the upper quantile, indicated by negative values of SPEI, especially in the state of BA. In FMA, this feature persists, with the aggravation of being a feature of the entire NEB. The only exception is the MJJ quarter, which has a tendency to increased rainfall, represented by the predominance of positive trends of SPEI in the three quantile levels analyzed. However, it can be inferred that the extreme events of accumulated precipitation have increased, especially in the eastern NEB range.

4. Conclusions

From the use of quantile regression and the SPEI index, it was possible to analyze the drought and humidity trends of the NEB on a time scale characteristic of meteorological drought. This made it possible to measure trends that are easier to interpret from the social and environmental impact point of view. The south and north sectors of the NEB showed a trend of more intense droughts during the rainy period of each region, which were NDJ and FMA, respectively. In contrast, the north sector presented significant trends of humidity one season before its rainy season, characterized by the literature, making evident a temporal dislocation of the region’s rainy season. In the MJJ quarter, there was a predominance of humidity trends at all quantile levels, with trends of dryness in a small area of the NEB’s midwest.
Individual results in the municipalities of Barreiras, João Pessoa, and Fortaleza more consistently illustrated that the series presented different trends when analyzed by quantile levels. For instance, while Barreiras presented a decrease in variability intensity of the dry and wet periods in the NDJ quarter, the same city presented an increase in the variability of drought intensity in the MJJ quarter. Such findings would not have been possible with traditional methods that would only estimate the series average.
The choice of the 3-month (SPEI-3) time scale was an important consideration, as meteorological drought generally responds on this scale. The results presented here are useful for managers who will define measures to mitigate problems related to climate variability, but do not comprehend all the nuances of the NEB’s climate. Therefore, further studies will be necessary to understand the trends at other time scales, which are more useful from the agricultural and hydrological point of views.

Author Contributions

Conceptualization, R.L.d.R.J. and F.D.d.S.S.; Methodology, R.L.d.R.J., F.D.d.S.S., and R.L.C.; Software, R.L.d.R.J. and F.D.d.S.S; Validation, R.L.C., H.B.G., and V.d.P.R.d.S.; Formal analysis, V.d.P.R.d.S. and H.B.G.; Data curation, A.C.X.; Writing-original draft preparation, R.L.d.R.J., F.D.d.S.S., V.d.P.R.d.S., and A.C.X.; Writing-review and editing, R.L.d.R.J., F.D.d.S.S., R.L.C., and D.L.H.; Visualization, V.d.P.R.d.S., D.L.H., and A.C.X.; Funding acquisition, D.L.H.

Funding

This study was financed in part by the Coordenação de Aperfeiçoamento de Pessoal de Nível Superior-Brasil (CAPES)-Finance Code 001.

Acknowledgments

The authors would also like to thank CAPES for partially funding this work through the project CAPES/Modelagem # 88881.148662/2017-01.

Conflicts of Interest

The authors declare no conflicts of interest.

References

  1. Alvala, R.C.S.; Cunha, A.P.M.A.; Brito, S.S.B.; Seluchi, M.E.; Marengo, J.A.; Moraes, O.L.L.; Carvalho, M.A. Drought monitoring in the Brazilian Semiarid region. An. Acad. Bras. Ciências 2017, 91, 1–15. (In Portugal) [Google Scholar] [CrossRef] [PubMed]
  2. Cunha, A.P.M.A.; Alvalá, R.C.S.; Nobre, C.A.; Carvalho, M.A. Monitoring vegetative drought dynamics in the Brazilian semiarid Region. Agric. For. Meteorol. 2015, 214, 494–505. [Google Scholar] [CrossRef]
  3. Cunha, A.P.M.A.; Tomasella, J.; Ribeiro-Neto, G.G.; Brown, M.; Garcia, S.R.; Brito, S.B.; Carvalho, M.A. Changes in the spatial-temporal patterns of droughts in the Brazilian Northeast. Atmos. Sci. Lett. 2018, 19, 1–8. [Google Scholar] [CrossRef]
  4. Marengo, J.A.; Alves, L.M.; Alvalá, R.C.S.; Cunha, A.P.M.A.; Brito, S.S.B.; Moraes, O.L.L. Climatic characteristics of the 2010–2016 drought in the semiarid Northeast Brazil region. An. Acad. Bras. Ciências 2018, 90, 1973–1985. (In Portugal) [Google Scholar] [CrossRef]
  5. Martins, E.S.P.R.; Coelho, C.A.S.; Haarsma, R.; Otto, F.E.L.; King, A.D.; Van Oldenborgh, G.J.; Kew, S.; Philip, S.; Júnior, F.C.V.; Cullen, H. A multimethod attribution analysis of the prolonged northeast brazil hydrometeorological drought (2012–16). Bull. Am. Meteorol. Soc. 2018, 99, 65–69. [Google Scholar] [CrossRef]
  6. Martins, M.A.; Tomasella, J.; Rodriguez, D.A.; Alvalá, R.C.; Giarolla, A.; Garofolo, L.L.; Júnior, J.L.S.; Paolicchi, L.T.; Pinto, G.L. Improving drought management in the Brazilian semiarid through crop forecasting. Agric. Syst. 2018, 160, 21–30. [Google Scholar] [CrossRef]
  7. Blunden, J.; Arndt, D.S. Supplement: State of the Climate in 2013. Bull. Am. Met. Soc. 2014, 95, ES1–ES22. [Google Scholar] [CrossRef]
  8. Alves, J.M.; Repelli, C.A. A variabilidade pluviométrica no setor norte do nordeste e os eventos El Nino-Oscilação Sul (ENOS). Rev. Bras. Meteorol. 1992, 7, 583–592. (In Portugal) [Google Scholar]
  9. Hastenrath, S.; Greischar, L. Circulation mechanisms related to northeast Brazil rainfall anomalies. J. Geophys. Res. Space Phys. 1993, 98, 5093–5102. [Google Scholar] [CrossRef]
  10. Rao, V.B.; De Lima, M.C.; Franchito, S.H. Seasonal and Interannual Variations of Rainfall over Eastern Northeast Brazil. J. Clim. 1993, 6, 1754–1763. [Google Scholar] [Green Version]
  11. Kousky, V.E. Frontal Influences on Northeast Brazil. Mon. Weather Rev. 1979, 107, 1140–1153. [Google Scholar] [CrossRef] [Green Version]
  12. Kousky, V.E.; Gan, M.A. Upper tropospheric cyclonic vortices in the tropical South Atlantic. Tellus 1981, 33, 538–551. [Google Scholar] [CrossRef] [Green Version]
  13. Costa, R.L.; De Souza, E.P.; Silva, F.D.D.S. Aplicação de uma teoria termodinâmica no estudo de um Vórtice Ciclônico de Altos Níveis sobre o nordeste do Brasil. Rev. Bras. Meteorol. 2014, 29, 96–104. [Google Scholar] [CrossRef]
  14. Cordeiro, E.S.; Fedorova, N.; Levit, V. Synoptic and thermodynamic analysis of events with thunderstorms for alagoas state in a period of 15 years (1998–2012). Rev. Bras. Meteorol. 2018, 33, 685–694. [Google Scholar] [CrossRef]
  15. Moura, A.D.; Shukla, J. On the dynamics of droughts in northeast Brazil: Observations, theory and numerical experiments with a general circulation model. J. Atmos. Sci. 1981, 38, 2653–2675. [Google Scholar] [CrossRef]
  16. Hastenrath, S. Interannual Variability and Annual Cycle: Mechanisms of Circulation and Climate in the Tropical Atlantic Sector. Mon. Weather Rev. 1984, 112, 1097–1107. [Google Scholar] [CrossRef] [Green Version]
  17. De Carvalho, M.; Ângelo, V.; Oyama, M.D. Variabilidade da largura e intensidade da Zona de Convergência Intertropical atlântica: Aspectos observacionais. Rev. Bras. Meteorol. 2013, 28, 305–316. [Google Scholar] [CrossRef]
  18. Silva, V.B.S.; Kousky, V.E.; Silva, F.D.S.; Salvador, M.A.; Aravequia, J.A. The 2012 severe drought over Northeast Brazil. Bull. Am. Met. Soc. 2013, 94, S240. [Google Scholar]
  19. Kayano, M.T.; Andreoli, R.V. Relationships between rainfall anomalies over northeastern Brazil and the El Niño–Southern Oscillation. J. Geophys. Res. Space Phys. 2006, 111, 13102. [Google Scholar] [CrossRef]
  20. Gomes, H.B.; Ambrizzi, T.; Herdies, D.L.; Hodges, K.; Da Silva, B.F.P. Rcio Easterly Wave Disturbances over Northeast Brazil: An Observational Analysis. Adv. Meteorol. 2015, 2015, 1–20. [Google Scholar] [CrossRef]
  21. Gomes, H.B.; Ambrizzi, T.; Da Silva, B.F.P.; Hodges, K.; Dias, P.L.S.; Herdies, D.L.; Silva, M.C.L.; Gomes, H.B. Climatology of easterly wave disturbances over the tropical South Atlantic. Clim. Dyn. 2019, 53, 1393–1411. [Google Scholar] [CrossRef] [Green Version]
  22. Kousky, V.E.; Kayano, M.T. Principal Modes of Outgoing Longwave Radiation and 250-mb Circulation for the South American Sector. J. Clim. 1994, 7, 1131–1143. [Google Scholar] [CrossRef] [Green Version]
  23. Kayano, M.T.; Andreoli, R.V. Decadal variability of northern northeast Brazil rainfall and its relation to tropical sea surface temperature and global sea level pressure anomalies. J. Geophys. Res. 2004, 109, C11. [Google Scholar] [CrossRef]
  24. Kayano, M.T.; Capistrano, V.P. How the Atlantic Multidecadal Oscillation (AMO) modifies the ENSO influence on the South American rainfall. Int. J. Climatol. 2014, 34, 162–178. [Google Scholar] [CrossRef]
  25. Barreto, N.J.C.; Mesquita, M.S.; Mendes, D.; Spyrides, M.H.C.; Pedra, G.U.; Lucio, P.S. Maximum covariance analysis to identify intraseasonal oscillations over tropical Brazil. Clim. Dyn. 2017, 49, 1583–1596. [Google Scholar] [CrossRef]
  26. Wells, N.; Goddard, S.; Hayes, M.J. A Self-Calibrating Palmer Drought Severity Index. J. Clim. 2004, 17, 2335–2351. [Google Scholar] [CrossRef]
  27. Mckee, T.B.; Doesken, N.J.; Kleist, J. The relationship of drought frequency and duration to time scales. In Proceedings of the 8th Conference on Applied Climatology, Boston, MA, USA, 17–22 January 1993; Volume 17, pp. 179–183. [Google Scholar]
  28. Vicente-Serrano, S.M.; Beguería, S.; Lόpez-Moreno, J.I. A multiscalar drought index sensitive to global warming: The standardized precipitation evapotranspiration index. J. Clim. 2010, 23, 1696–1718. [Google Scholar] [CrossRef]
  29. Vincente-Serrano, S.M.; Beguería, S.; Lόpez-Moreno, J.I.; Angulo, M.; Kenawy, A.E. A new global 0.5 degrees gridded dataset (1901–2006) of a multiscalar drought index: Comparison with current drought index datasets based on the Palmer Drought Severity Index. J. Hydrometeorol. 2010, 11, 1033–1043. [Google Scholar] [CrossRef]
  30. Vicente-Serrano, S.M.; Molina, C.A.; Lorenzo, A.S.; Revuelto, J.; Tejeda, E.M.; Lopez-Moreno, J.I.; Espejo, F.L. Sensitivity of reference evapotranspiration to changes in meteorological parameters in Spain (1961–2011). Water Resour. Res. 2014, 50, 8458–8480. [Google Scholar] [CrossRef]
  31. Beguería, S.; Vicente-Serrano, S.M.; Reig, F.; Latorre, B. Standardized precipitation evapotranspiration index (SPEI) revisited: Parameter fitting, evapotranspiration models, tools, datasets and drought monitoring. Int. J. Climatol. 2014, 34, 3001–3023. [Google Scholar]
  32. Liu, S.; Kang, W.; Wang, T. Drought variability in Inner Mongolia of northern China during 1960–2013 based on standardized precipitation evapotranspiration index. Environ. Earth Sci. 2016, 75, 145. [Google Scholar] [CrossRef]
  33. Manatsa, D.; Mushore, T.; Lenouo, A. Improved predictability of drought over Southern Africa using the standardized precipitation evapotranspiration index and ENSO. Theor. Appl. Climatol. 2017, 127, 259–274. [Google Scholar] [CrossRef]
  34. Hui-Mean, F.; Yusop, Z.; Yusof, F. Drought analysis and water resource availability using standardised precipitation evapotranspiration index. Atmos. Res. 2018, 201, 102–115. [Google Scholar] [CrossRef]
  35. Partal, T.; Kahya, E. Trend analysis in Turkish precipitation data. Hydrol. Process. 2006, 20, 2011–2026. [Google Scholar] [CrossRef]
  36. Gocic, M.; Trajkovic, S. Analysis of precipitation and drought data in Serbia over the period 1980–2010. J. Hydrol. 2013, 494, 32–42. [Google Scholar] [CrossRef]
  37. Zhang, Y.; Cai, W.; Chen, Q.; Yao, Y.; Liu, K. Analysis of Changes in Precipitation and Drought in Aksu River Basin, Northwest China. Adv. Meteorol. 2015, 2015, 1–15. [Google Scholar] [CrossRef] [Green Version]
  38. Turkes, M.; Tatli, H. Use of the standardized precipitation index (SPI) and a modified SPI for shaping the drought probabilities over Turkey. Int. J. Clim. 2009, 29, 2270–2282. [Google Scholar] [CrossRef]
  39. Tabari, H.; Abghari, H.; Talaee, P.H. Temporal trends and spatial characteristics of drought and rainfall in arid and semiarid regions of Iran. Hydrol. Process. 2012, 26, 3351–3361. [Google Scholar] [CrossRef]
  40. Silva, V.P.R. On climate variability in Northeast of Brazil. J. Arid Environ. 2004, 58, 575–596. [Google Scholar] [CrossRef]
  41. Ganguli, P.; Reddy, M.J. Evaluation of trends and multivariate frequency analysis of droughts in three meteorological subdivisions of western India. Int. J. Climatol. 2014, 34, 911–928. [Google Scholar] [CrossRef]
  42. Degefu, M.A.; Bewket, W. Variability and trends in rainfall amount and extreme event indices in the Omo-Ghibe River Basin, Ethiopia. Reg. Environ. Chang. 2014, 14, 799–810. [Google Scholar] [CrossRef]
  43. Dashtpagerdi, M.M.; Kousari, M.R.; Vagharfard, H.; Ghonchepour, D.; Hosseini, M.E.; Ahani, H. An investigation of drought magnitude trend during 1975–2005 in arid and semi-arid regions of Iran. Environ. Earth Sci. 2015, 73, 1231–1244. [Google Scholar] [CrossRef]
  44. Efron, B.; Tibshirani, R.J. An Introduction to the Bootstrap; CRC Press: Boca Raton, FL, USA, 1994; Volume 57. [Google Scholar]
  45. Efron, B. Second thoughts on the bootstrap. Stat. Sci. 2003, 18, 135–140. [Google Scholar] [CrossRef]
  46. LePage, R.; Billard, L. Exploring the Limits of Bootstrap; Wiley: Nova Iorque, NY, USA, 1992. [Google Scholar]
  47. Filho, T.K.; Assad, E.D.; Lima, P.R.S.R. Regiões pluviometricamente homogêneas no Brasil. Pesqui. Agropecu. Bras. 2005, 40, 311–322. (In Portugal) [Google Scholar] [CrossRef]
  48. Xavier, A.C.; King, C.W.; Scanlon, B.R. Daily gridded meteorological variables in Brazil (1980–2013). Int. J. Climatol. 2016, 36, 2644–2659. [Google Scholar] [CrossRef]
  49. Liu, B.; Liu, F.; Wang, C.; Mei, S. Unit commitment considering flexibility and uncertainty of wind power generation. Power Syst. Technol. 2015, 39, 730–736. [Google Scholar]
  50. Allen, R.G.; Pereira, L.S.; Raes, D.; Smith, M. Crop Evapotranspiration: Guidelines for Computing Crop Water Requirements-FAO irrigation and Drainage Paper 56. Fao Rome 1998, 300, D05109. [Google Scholar]
  51. Raes, D. The ETo Calculator; Food and Agriculture Organization of the United Nations (FAO): Rome, Italy, 2012. [Google Scholar]
  52. Paredes-Trejo, F.; Barbosa, H.; Dos Santos, C.A.C. Evaluation of the Performance of SM2RAIN-Derived Rainfall Products over Brazil. Remote Sens. 2019, 11, 1113. [Google Scholar] [CrossRef]
  53. Silva, P.E.; Silva, C.M.S.; Spyrides, M.H.C.; Andrade, L.M.B. Análise de Índices de Extremos Climáticos no Nordeste e Amazônia Brasileira para o Período entre 1980 a 2013. Anuário Inst. Geociências 2019, 42, 137–148. (In Portugal) [Google Scholar] [CrossRef]
  54. Noto, L.V.; La Loggia, G. Use of L-moments approach for regional flood frequency analysis in Sicily, Italy. Water Resour. Manag. 2009, 23, 2207–2229. [Google Scholar] [CrossRef]
  55. Franzke, C. A novel method to test for significant trends in extreme values in serially dependent time series. Geophys. Res. Lett. 2013, 40, 1391–1395. [Google Scholar] [CrossRef] [Green Version]
  56. Hollander, M.; Wolfe, D.A.; Chicken, E. Nonparametric Statistical Methods, 3rd ed.; John Wiley & Sons: Hoboken, NJ, USA, 2013; Volume 751. [Google Scholar]
  57. Barbosa, S.M. Quantile trends in Baltic sea level. Geophys. Res. Lett. 2008, 35, 22. [Google Scholar] [CrossRef]
  58. Lee, K.; Baek, H.-J.; Cho, C. Analysis of changes in extreme temperatures using quantile regression. Asia-Pac. J. Atmos. Sci. 2013, 49, 313–323. [Google Scholar] [CrossRef]
  59. Dhakal, N.; Tharu, B. Spatio-temporal trends in daily precipitation extremes and their connection with North Atlantic tropical cyclones for the southeastern United States. Int. J. Clim. 2018, 38, 3822–3831. [Google Scholar] [CrossRef]
  60. Farias, R.F.D.L.; Nóbrega, R.S.; Dos Santos, C.A.C. Variabilidade temporal e espacial da precipitação pluviométrica em Pernambuco através de índices de extremos climáticos. Rev. Bras. Meteorol. 2015, 30, 171–180. [Google Scholar]
  61. Santos, C.A.C.; Brito, J.I.B. Análise dos índices de extremos para o semi-árido do Brasil e suas relações com TSM e IVDN. Rev. Bras. Meteorol. 2007, 22, 303–312. [Google Scholar] [CrossRef]
  62. Medeiros, S.E.L.; Abrahão, R.; García-Garizábal, I.; Idmon Melo, B.M.P.; Pereira, L.S. Assessment of precipitation trends in the Sertão Paraibano Mesoregion. Rev. Bras. Meteorol. 2018, 33, 344–352. [Google Scholar] [CrossRef]
  63. Salviano, M.F.; Groppo, J.D.; Pellegrino, G.Q. Análise de Tendências em Dados de Precipitação e Temperatura no Brasil. Rev. Bras. Meteorol. 2016, 31, 64–73. [Google Scholar] [CrossRef]
  64. Marengo, J.A.; Torres, R.R.; Alves, L.M. Drought in Northeast Brazil-past, present, and future. Theor. Appl. Climatol. 2017, 129, 1189–1200. [Google Scholar] [CrossRef]
  65. Jenkins, K.; Warren, R. Quantifying the impact of climate change on drought regimes using the Standardised Precipitation Index. Theor. Appl. Climatol. 2015, 120, 41–54. [Google Scholar] [CrossRef]
  66. Oliveira, P.T.; Silva, C.M.S.; Lima, K.C. Climatology and trend analysis of extreme precipitation in subregions of Northeast Brazil. Theor. Appl. Climatol. 2017, 130, 77–90. [Google Scholar] [CrossRef]
  67. Silva, V.P.R.; Oliveira, S.D.; Hoekstra, A.Y.; Dantas-Neto, J.; Campos, J.H.B.C.; Braga, C.C.; Araujo, L.E.; Aleixo, D.O.; Brito, J.I.B.; Souza, M.D.; et al. Water footprint and virtual water trade of Brazil. Water 2016, 8, 517. [Google Scholar] [CrossRef]
  68. Lemos, M.C.; Finan, T.J.; Fox, R.W.; Nelson, D.R.; Tucker, J. The Use of Seasonal Climate Forecasting in Policymaking: Lessons from Northeast Brazil. Clim. Chang. 2002, 55, 479–507. [Google Scholar] [CrossRef]
  69. Marengo, J.A.; Soares, W.R.; Tomasella, J.; Alves, L.M.; Rodriguez, D.A. The drought of 2010 in the context of historical droughts in the Amazon region. Geophys. Res. Lett. 2011, 38, L12703. [Google Scholar] [CrossRef]
  70. Trejo, F.P.; Brito-Castillo, L.; Alves, H.B.; Guevara, E. Main features of large-scale oceanic-atmospheric circulation related to strongest droughts during rainy season in Brazilian São Francisco River Basin. Int. J. Climatol. 2016, 36, 4102–4117. [Google Scholar] [CrossRef]
  71. Barbosa, H.A.; Kumar, T.L.; Paredes, F.; Elliott, S.; Ayuga, J.; Kumar, T.L. Assessment of Caatinga response to drought using Meteosat-SEVIRI Normalized Difference Vegetation Index (2008–2016). ISPRS J. Photogramm. Remote Sens. 2019, 148, 235–252. [Google Scholar] [CrossRef]
Figure 1. (a) Map of Brazil highlighting the northeast region in gray, with numbered and identified states and rainfall homogeneous areas: North (red), East (blue), and Midwest (green); (b) Geographic distribution of the 1794 NEB municipalities.
Geosciences 09 00457 g001
Figure 2. Trend of SPEI-3/decade for the NDJ quarter in quantiles (a) Q5, (b) Q50 and (c) Q95. The black points indicate municipalities whose series presented statistical significance.
Geosciences 09 00457 g002
Figure 3. Trends of SPEI-3/decade multi quantile levels for the NDJ quarter in the cities (a) Barreiras (BA), (b) João Pessoa (PB), and (c) Fortaleza (CE). * Confidence interval used: 95%.
Geosciences 09 00457 g003
Figure 4. Trend of SPEI-3/decade for the FMA quarter in quantiles (a) Q5, (b) Q50, and (c) Q95. The black points indicate municipalities whose series presented statistical significance.
Geosciences 09 00457 g004
Figure 5. Trends of SPEI-3/decade multi quantile levels for the FMA quarter in the cities (a) Barreiras (BA), (b) João Pessoa (PB), and (c) Fortaleza (CE). * Confidence interval used: 95%.
Geosciences 09 00457 g005
Figure 6. Trend of SPEI-3/decade for the MJJ quarter in quantiles (a) Q5, (b) Q50, and (c) Q95. The black points indicate municipalities whose series presented statistical significance.
Geosciences 09 00457 g006
Figure 7. Trends of multi quantile levels of SPEI-3/decade for the MJJ quarter in the cities (a) Barreiras (BA), (b) João Pessoa (PB), and (c) Fortaleza (CE). * Confidence interval used: 95%.
Geosciences 09 00457 g007