Article

Advances in Snow Hydrology Using a Combined Approach of GNSS In Situ Stations, Hydrological Modelling and Earth Observation—A Case Study in Canada

1
VISTA Remote Sensing in Geosciences GmbH, Gabelsbergerstr. 51, D-80333 Munich, Gemany
2
Institute of Water Management, Hydrology and Hydraulic Engineering, University of Natural Resources and Life Sciences, 1190 Vienna, Austria
3
Ludwig-Maximilians-Universität, D-80539 Munich, Germany
4
ANavS GmbH, D-80333 Munich, Germany
*
Author to whom correspondence should be addressed.
Geosciences 2019, 9(1), 44; https://doi.org/10.3390/geosciences9010044
Submission received: 8 January 2019 / Revised: 8 January 2019 / Accepted: 10 January 2019 / Published: 15 January 2019
(This article belongs to the Special Issue Remote Sensing of Snow and Its Applications)

Abstract

:
The availability of in situ snow water equivalent (SWE), snowmelt and run-off measurements is still very limited especially in remote areas as the density of operational stations and field observations is often scarce and usually costly, labour-intense and/or risky. With remote sensing products, spatially distributed information on snow is potentially available, but often lacks the required spatial or temporal requirements for hydrological applications. For the assurance of a high spatial and temporal resolution, however, it is often necessary to combine several methods like Earth Observation (EO), modelling and in situ approaches. Such a combination was targeted within the business applications demonstration project SnowSense (2015–2018), co-funded by the European Space Agency (ESA), where we designed, developed and demonstrated an operational snow hydrological service. During the run-time of the project, the entire service was demonstrated for the island of Newfoundland, Canada. The SnowSense service, developed during the demonstration project, is based on three pillars, including (i) newly developed in situ snow monitoring stations based on signals of the Global Navigation Satellite System (GNSS); (ii) EO snow cover products on the snow cover extent and on information whether the snow is dry or wet; and (iii) an integrated physically based hydrological model. The key element of the service is the novel GNSS based in situ sensor, using two static low-cost antennas with one being mounted on the ground and the other one above the snow cover. This sensor setup enables retrieving the snow parameters SWE and liquid water content (LWC) in the snowpack in parallel, using GNSS carrier phase measurements and signal strength information. With the combined approach of the SnowSense service, it is possible to provide spatially distributed SWE to assess run-off and to provide relevant information for hydropower plant management in a high spatial and temporal resolution. This is particularly needed for so far non, or only sparsely equipped catchments in remote areas. We present the results and validation of (i) the GNSS in situ sensor setup for SWE and LWC measurements at the well-equipped study site Forêt Montmorency near Quebec, Canada and (ii) the entire combined in situ, EO and modelling SnowSense service resulting in assimilated SWE maps and run-off information for two different large catchments in Newfoundland, Canada.

1. Introduction

The seasonal snow cover has an important role as hydrological storage for the Earth’s fresh water resources. The amount of water stored in the snowpack as snow and ice is expressed as snow water equivalent (SWE) and is a key variable in water resources management, which is an essential component within the Earth’s climate system [1]. The amount of water, which is released seasonally (or in events) as snowmelt in the rivers, as well as the timing of the water release, mainly in spring, is relevant for numerous hydrological applications, such as hydropower production, irrigation, and fresh water supply. In addition, knowledge about the snow situation is a concern of many safety related institutions and businesses, such as avalanche warning centres and (re-)insurance companies. The onset of snowmelt and its intensity are major drivers for flood forecasting, especially in mountainous areas, and are, besides the knowledge on the total amount of water stored as snow, a very valuable information for hydropower companies.
Regarding in situ snow measurements, until now, SWE is mainly measured manually by weighing a given volume of snow, which is cut out of the snowpack with tubes [2]. This approach is reliable but can provide only a snapshot in time and in space, and in addition, it is labour-intense and destructive. Automatic SWE measurements are mainly performed by weighing systems like snow pillows and snow scales [3]. These methods provide time series, but the instruments and their installation and operation are quite costly, and their results might be affected by ice-bridging effects of thermal fluxes resulting in potential over- or underestimations of SWE [4]. Alternative SWE in situ observation systems make, e.g., use of cosmic rays or neutron rays [5] or apply a passive gamma monitoring sensor (GMON) [6]. However, the reliability of those sensors depends strongly on the underlying surface conditions, the measurements are limited to a certain amount of SWE and thus are only applicable at certain locations [7].
As an alternative to the standard in situ methods, L-band Global Navigation Satellite (GNSS) signals can be used to derive snow cover properties. Different methods were developed within the last years. As an advantage, it is possible to apply these methods globally as the GNSS signals can be tracked almost any place on Earth, they are non-destructive and can be used even for large amounts of snow [8]. Snow height (HS), for example, can be determined by the reflection of GNSS signals on the snow–air interface [9]. Liquid water content (LWC) can be derived by GNSS signal strength attenuation through a snowpack of a given volume [10]. Henkel et al. [11] presented for the first time the possibility to derive SWE for dry snow conditions using two low-cost GNSS sensors for a carrier phase-based approach to detect signal changes within the snowpack. Steiner et al. [12] confirmed this by using a similar technique with geodetic sensors and applying different ambiguity resolution strategies and wideline combinations. Finally, we developed a novel approach combining GNSS signal attenuation and time delay by combining information on GNSS carrier phases and signal strengths. We accomplished deriving the three snow cover parameters SWE, LWC, and snow height in parallel, as recently demonstrated in Koch et al. [8].
Spatially distributed snow information such as the snow cover extent, information weather the snow is dry or wet, and dry snow SWE or snow height, can be derived from Earth Observation (EO) data, based on different remote sensing techniques using active or passive microwaves, or optical, infrared or thermal approaches. An overview is given, for example, by Hall [13] and Tedesco [14]. In recent years, especially the freely accessible Sentinel-1, -2 and -3 data are a useful source for determining the above-mentioned snow parameters, like snow extent, or wet snow [15]. Besides ‘raw’ satellite data, also different, often project-based, internet portals like GlobSnow, CryoLand, Google Earth Engine, or EUMETSAT H-SAF are providing already processed satellite-based snow parameter products. However, in general, all remote sensing products are often not available in high-temporal resolution or may lack the required spatial resolution. This is especially the case for optical images, e.g., from MODIS, which face potential cloud cover issues [16,17,18]. Active microwave products are often restricted due to foreshortening or layover effects, in particular in mountain regions and passive microwave products are very coarse regarding their spatial resolution. Recent approaches tend to apply more and more multi-sensor techniques to overcome some of these limits, which is, e.g., currently a big aim of the NASA SnowEx campaign [19]. Additionally, the combination of EO and hydrological model approaches helps to increase the temporal and spatial availability of snow or run-off information as e.g., presented by Cline et al. [20] and Immerzeel et al. [21].
In the current study, we present a comprehensive overview of a combined approach on using in situ measurements, EO, and hydrological modelling to derive continuous information on snow parameters and run-off. The applied methods and sensors of the in situ component as well as hydrological services were designed, developed and demonstrated in the framework of the business applications demonstration project SnowSense (2015–2018), which was co-funded by the European Space Agency (ESA). The SnowSense service mainly targets snow hydrological applications and is based on three pillars, including (i) a newly developed SnowSense in situ snow monitoring stations based on GNSS signals, (ii) EO products of the snow cover extent and information if and where the snow is dry or wet, and (iii) an integrated physically-based hydrological model.
The in situ and EO information are used to assimilate the input and the parameters of the applied hydrological model PROMET (Processes of Mass and Energy Transfer) [22] to calculate SWE, snowmelt onset, and river run-off in catchments as spatial layers. Those data layers contain the relevant information for flood forecasts and hydropower plant management, particularly for so far non- or sparsely equipped catchments in remote areas. Within the project demonstration phase, we validated the GNSS in situ snow stations and the first run-off results of the combined approach were already provided as an operational service for a commercial hydropower plant company and the administration of the island of Newfoundland, Canada, being our first demo users.

2. Materials and Methods

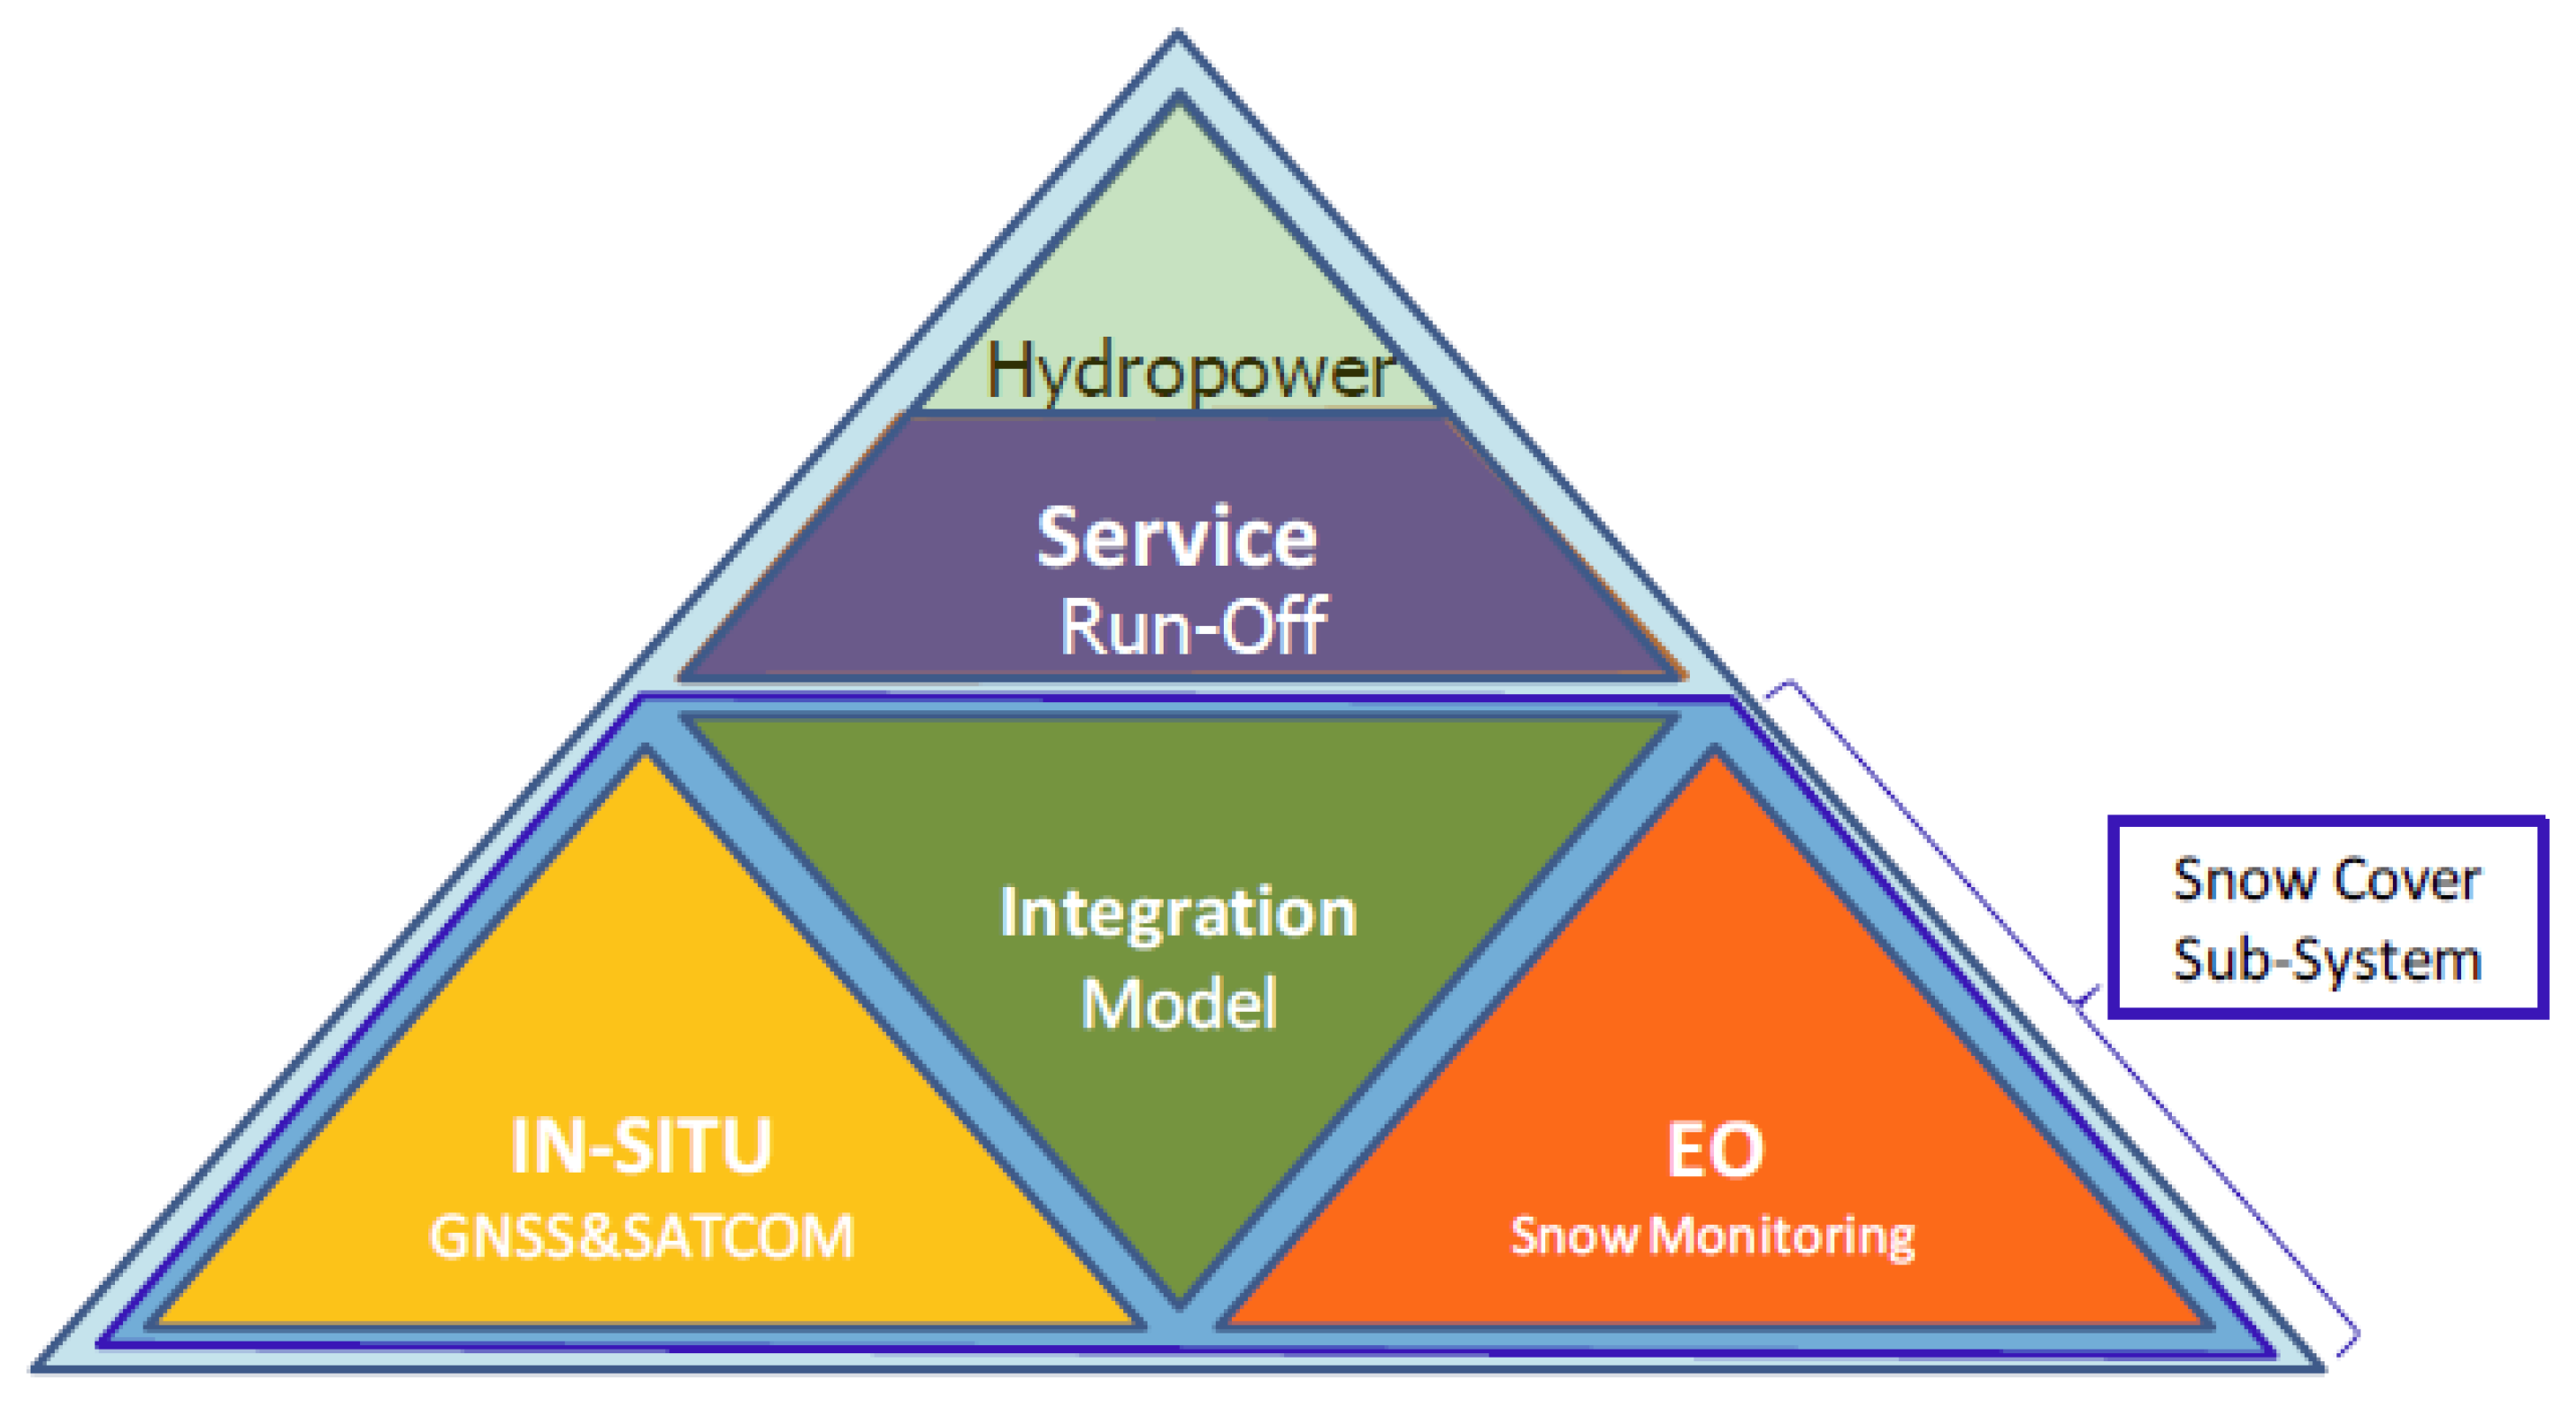
2.1. The SnowSense Concept

The overall aim of the demonstration project SnowSense was to build up an integrated service for run-off and hydropower assessment and forecast related to snow cover dynamics in remote areas. The idea of the service concept encloses the integration of in total three components for the provision of snow hydrological information. The service is based on the integration of (i) GNSS-based in situ measurements, (ii) EO monitoring and (iii) a hydrological model, to generate SWE, snowmelt and run-off products for remote areas in a temporal and spatial resolution, related to user’s operation defaults. We chose one day as temporal and 1 km as spatial resolution. Furthermore, it is possible to provide estimations and forecasts on hydropower generation (Figure 1).
In the following subchapters, the applied Canadian test sites and the description, development and assimilation of the three basic components of the snow cover sub-system as well as the entire service are presented.

2.2. SnowSense Testsites in Canada

2.2.1. The Island of Newfoundland

The main region of interest for the development of the SnowSense service was the remote location of the island of Newfoundland (97,000 km2), which is a province of Newfoundland and Labrador, Canada (Figure 2). The altitudinal gradient of this island ranges between 0 m and 800 m a.s.l. Newfoundland is primarily characterized by having a subarctic and a humid continental climate, with an annual precipitation ranging from 900 mm on the Northern Peninsula to 1700 mm in the southwestern region of the island [23,24]. This environment, together with a low population, provides the island of Newfoundland ideal conditions for taking advantage of using run-off for hydropower and building up reservoirs. However, the entire region has so far an insufficient instrumentation with only two functioning SWE measurement stations [25].
As shown in Figure 2, we had access to several run-off gauges to validate our combined and assimilated hydrological service. In this study, we focus on the Humber and the Exploits catchments (Figure 2), which are of of most interest for the operations of the users. As marked in Figure 2, we set-up seven SnowSense in situ stations in Newfoundland, where two are located in the Exploits catchment and two in the Humber catchment. The hydrology of the catchment of the Humber River is influenced by the large lakes Deer Lake, Grand Lake, Sandy Lake and Hindis Lake. The water flow from Hindis to Grand Lake and to Deer Lake is regulated including the Deer Lake Power Plant (130 MW). Water flow from the Upper Humber area to Reidville is more or less natural.
The hydrology of the Exploits River catchment is strongly influenced by the Red Indian Lake (537 km2), dividing the catchment into an upper and a lower part. The release of water from the lake at the Millertown Dam is very dynamic (55–700 m3/s) and can be assessed from a downstream station.
In the framework of the demonstration project, we provided information gained from the SnowSense in situ stations and the combined EO and modelling approach as service to two dedicated demo users. Both demo users, namely Nalcor/NL Hydro and the Water Resources Management Division in the Department of Municipal Affairs and Environment (WRMD), are active in hydropower and flood forecast. During the project demonstration phase, they accessed, monitored and investigated the SnowSense products based on their specific requirements, whereof we present a selection of the results in this paper. For the two catchments as test sites, we set up the combined approach of in situ measurements, EO, and modelling.

2.2.2. The Forêt Montmorency NEIGE Site near Quebec

The Forêt Montmorency is located 70 km north of the city of Quebec and is the largest teaching and research forest in the world with an area of 412 km2. It is open to the public and the University Laval operates in this forest the NEIGE test site (673 m a.s.l.). The Forêt Montmorency is drained by the Montmorency River and one of its tributaries, the Black River. The annual rainfall exceeds 1500 mm and in winter average snowfall is above 6 m.
As we had no possibility to validate SWE and LWC in the Humber and Exploit catchments in Newfoundland, we additionally had the opportunity to install a SnowSense in situ station at the study site NEIGE at Forêt Montmorency. At this location, numerous snow and meteorological instruments are tested and in operation. This encompasses, for example, the CS725 sensor, which was developed by Hydro Québec (Canada) in collaboration with Campbell Scientific (Logan, UT, USA) and which was used for comparison with the GNSS in situ measurements in this study [6]. Moreover, manual snow pit measurements, taken on a weekly basis, were available as further validation information on SWE. The CS725/GMON sensor was located 25 m next to the GNSS sensors, and the manual measurement are performed within a distance of less than 150 m. The site is a flat, sand/gravel surface area without significant vegetation. The close-by meteorological station site is in a distance of less than 500 m with an elevation difference less than 25 m. Since 2014, the University Laval is managing the NEIGE site, which is following the World Meteorological Organisation’s (WMO) Canadian Solid Precipitation Experiment’s (C-SPICE) objectives for solid precipitation measurements and comparisons of automatic instruments. During the winter season 2017/2018, several sensors and manual measurements from nine partners altogether took place at this location, which was a profound basis for comparing the results of our GNSS in situ station with other sensors.

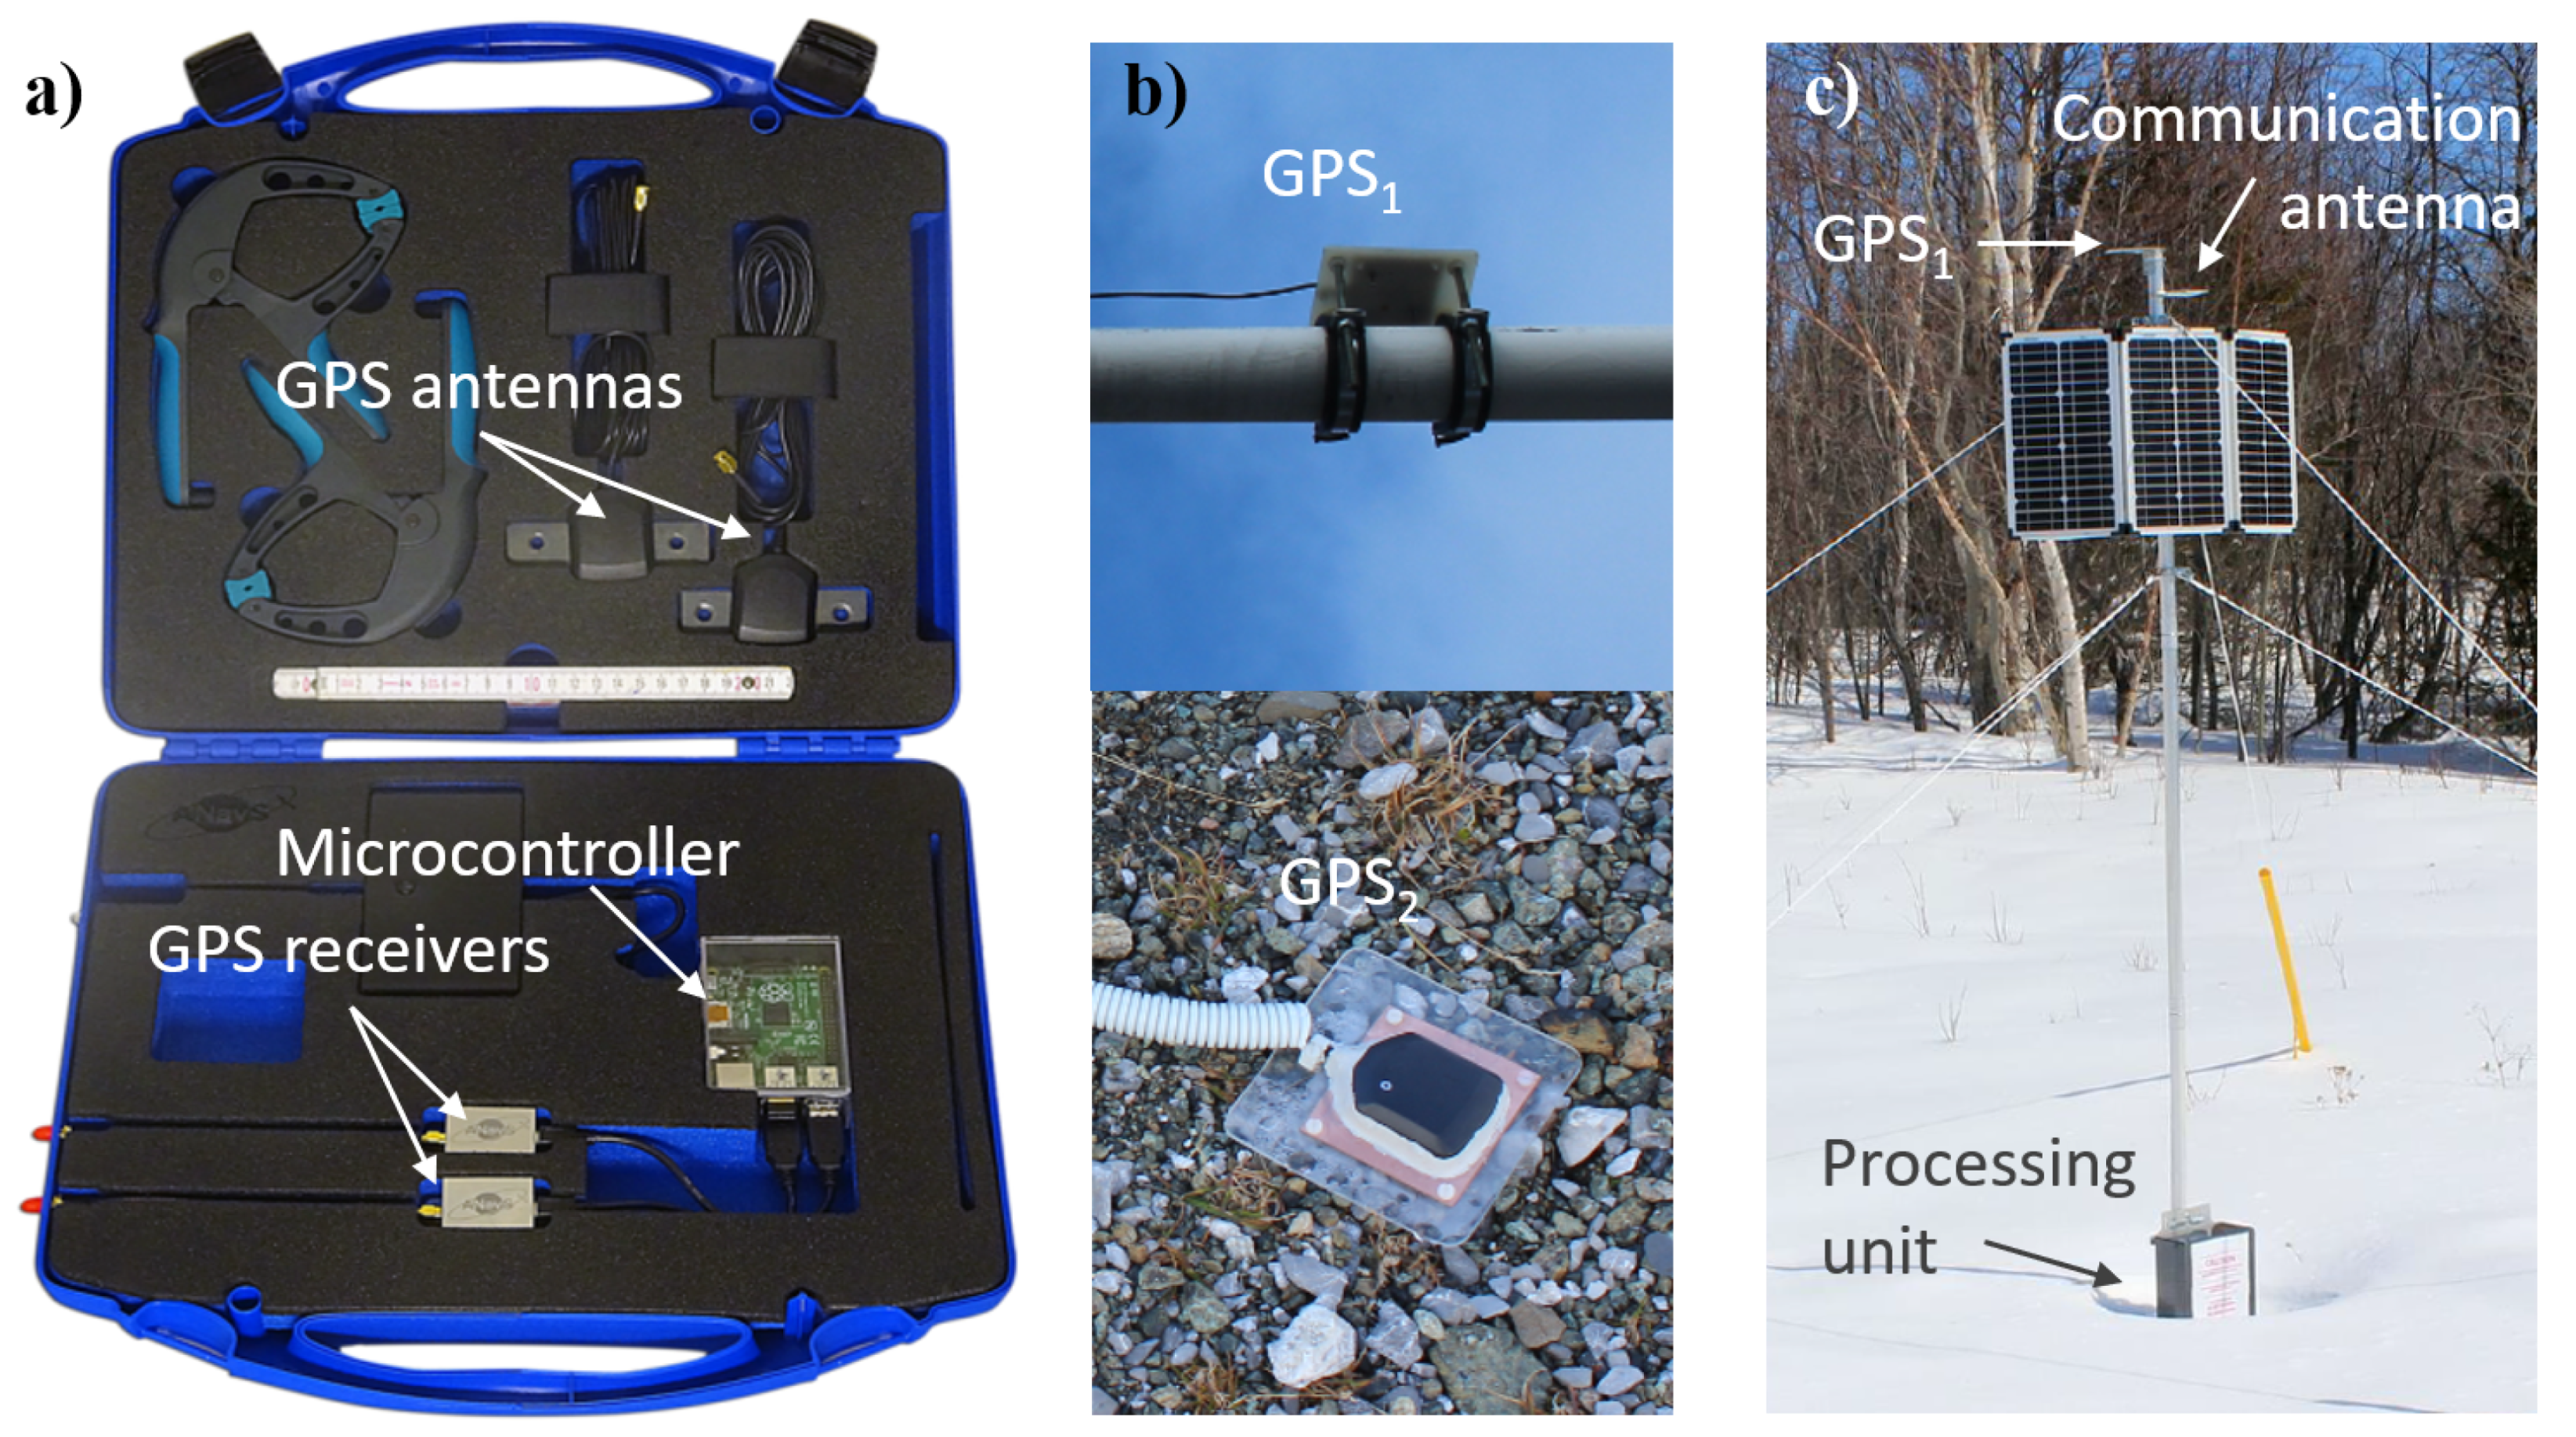
2.3. In Situ Station Design and Setup

For the in situ component, we made use of information gained by signal attenuation and signal delay of GNSS signals passing through the snowpack to derive the snow cover properties SWE and LWC [8]. In general, it is possible to use any kind of GNSS signals such as the signals of the Global Positioning System (GPS), Galileo, GLONASS or Beidou for this approach. For this study, we used the freely-available GPS L1-band signals at a frequency of 1.57542 GHz. Recently, the additional usage of Galileo signals was integrated and will be applied in further studies [26]. The in situ GNSS sensor setup is in general composed of two static antennas as presented in Henkel et al. [11] and Koch et al. [8], whereof one antenna (GPS1) was mounted on the top of a mast system to be permanently above the snow cover, and the other one (GPS2) was placed on the ground before the first snow fall. In winter, when GPS2 was covered by a layer of snow, the received GPS signals were markedly influenced by signal attenuation and time delay within the snowpack. For further information on the setup, the algorithms, the detailed GNSS signal processing steps as well as their validation at a high-alpine study site in Switzerland, we refer to [8,10,11].
A large focus regarding the development and the design of the SnowSense in situ sensor system for the study presented in this paper was to provide a practical and lightweight solution for the retrieval of continuous snow cover properties like SWE and LWC. The setup is in particular suitable for locations, which were so far not equipped with measurement sensors or which were difficult to access and not regularly visited by field observations. Having this purpose in mind, we designed, produced and tested an easily transportable solution consisting of a mast system with rigging. Regarding the deployment of the sensor system, it is practically possible to carry all sensor components in a large backpack, and two persons can install it within approx. two hours. Furthermore, the sensor system consists of two multi-GNSS sensors (u-blox, Thalwil, Switzerland), which receive GPS and Galileo signals, a processing unit capable for on-board processing of SWE and LWC as well as a power and a communication management unit. The latter two units are described in detail in [26]. The on-board processing is more power consuming than simply storing and transmitting raw data measurements. However, we promote the on-board processing to reduce the amount of data to be transmitted and to provide real-time data directly from the station to the client. The autonomous power supply for the operation and processing is provided by a combination of a solar panel and a battery pack and is controlled by the integrated power unit. As in many remote regions like in Newfoundland, the mobile network is not available, and we used an Iridium satellite communication (SatCom) module to transmit a daily or even sub-daily overview of the processed data. However, for regions with mobile networks, the communication unit can also be replaced by this technique. Figure 3a,b shows examples of some station components like the low-cost GNSS antennas and receivers as well as the microcontroller used for processing. Figure 3 gives an example of an installed sensor system and the solar panels on a 3 m high stable aluminum mast consisting of three pluggable segments.

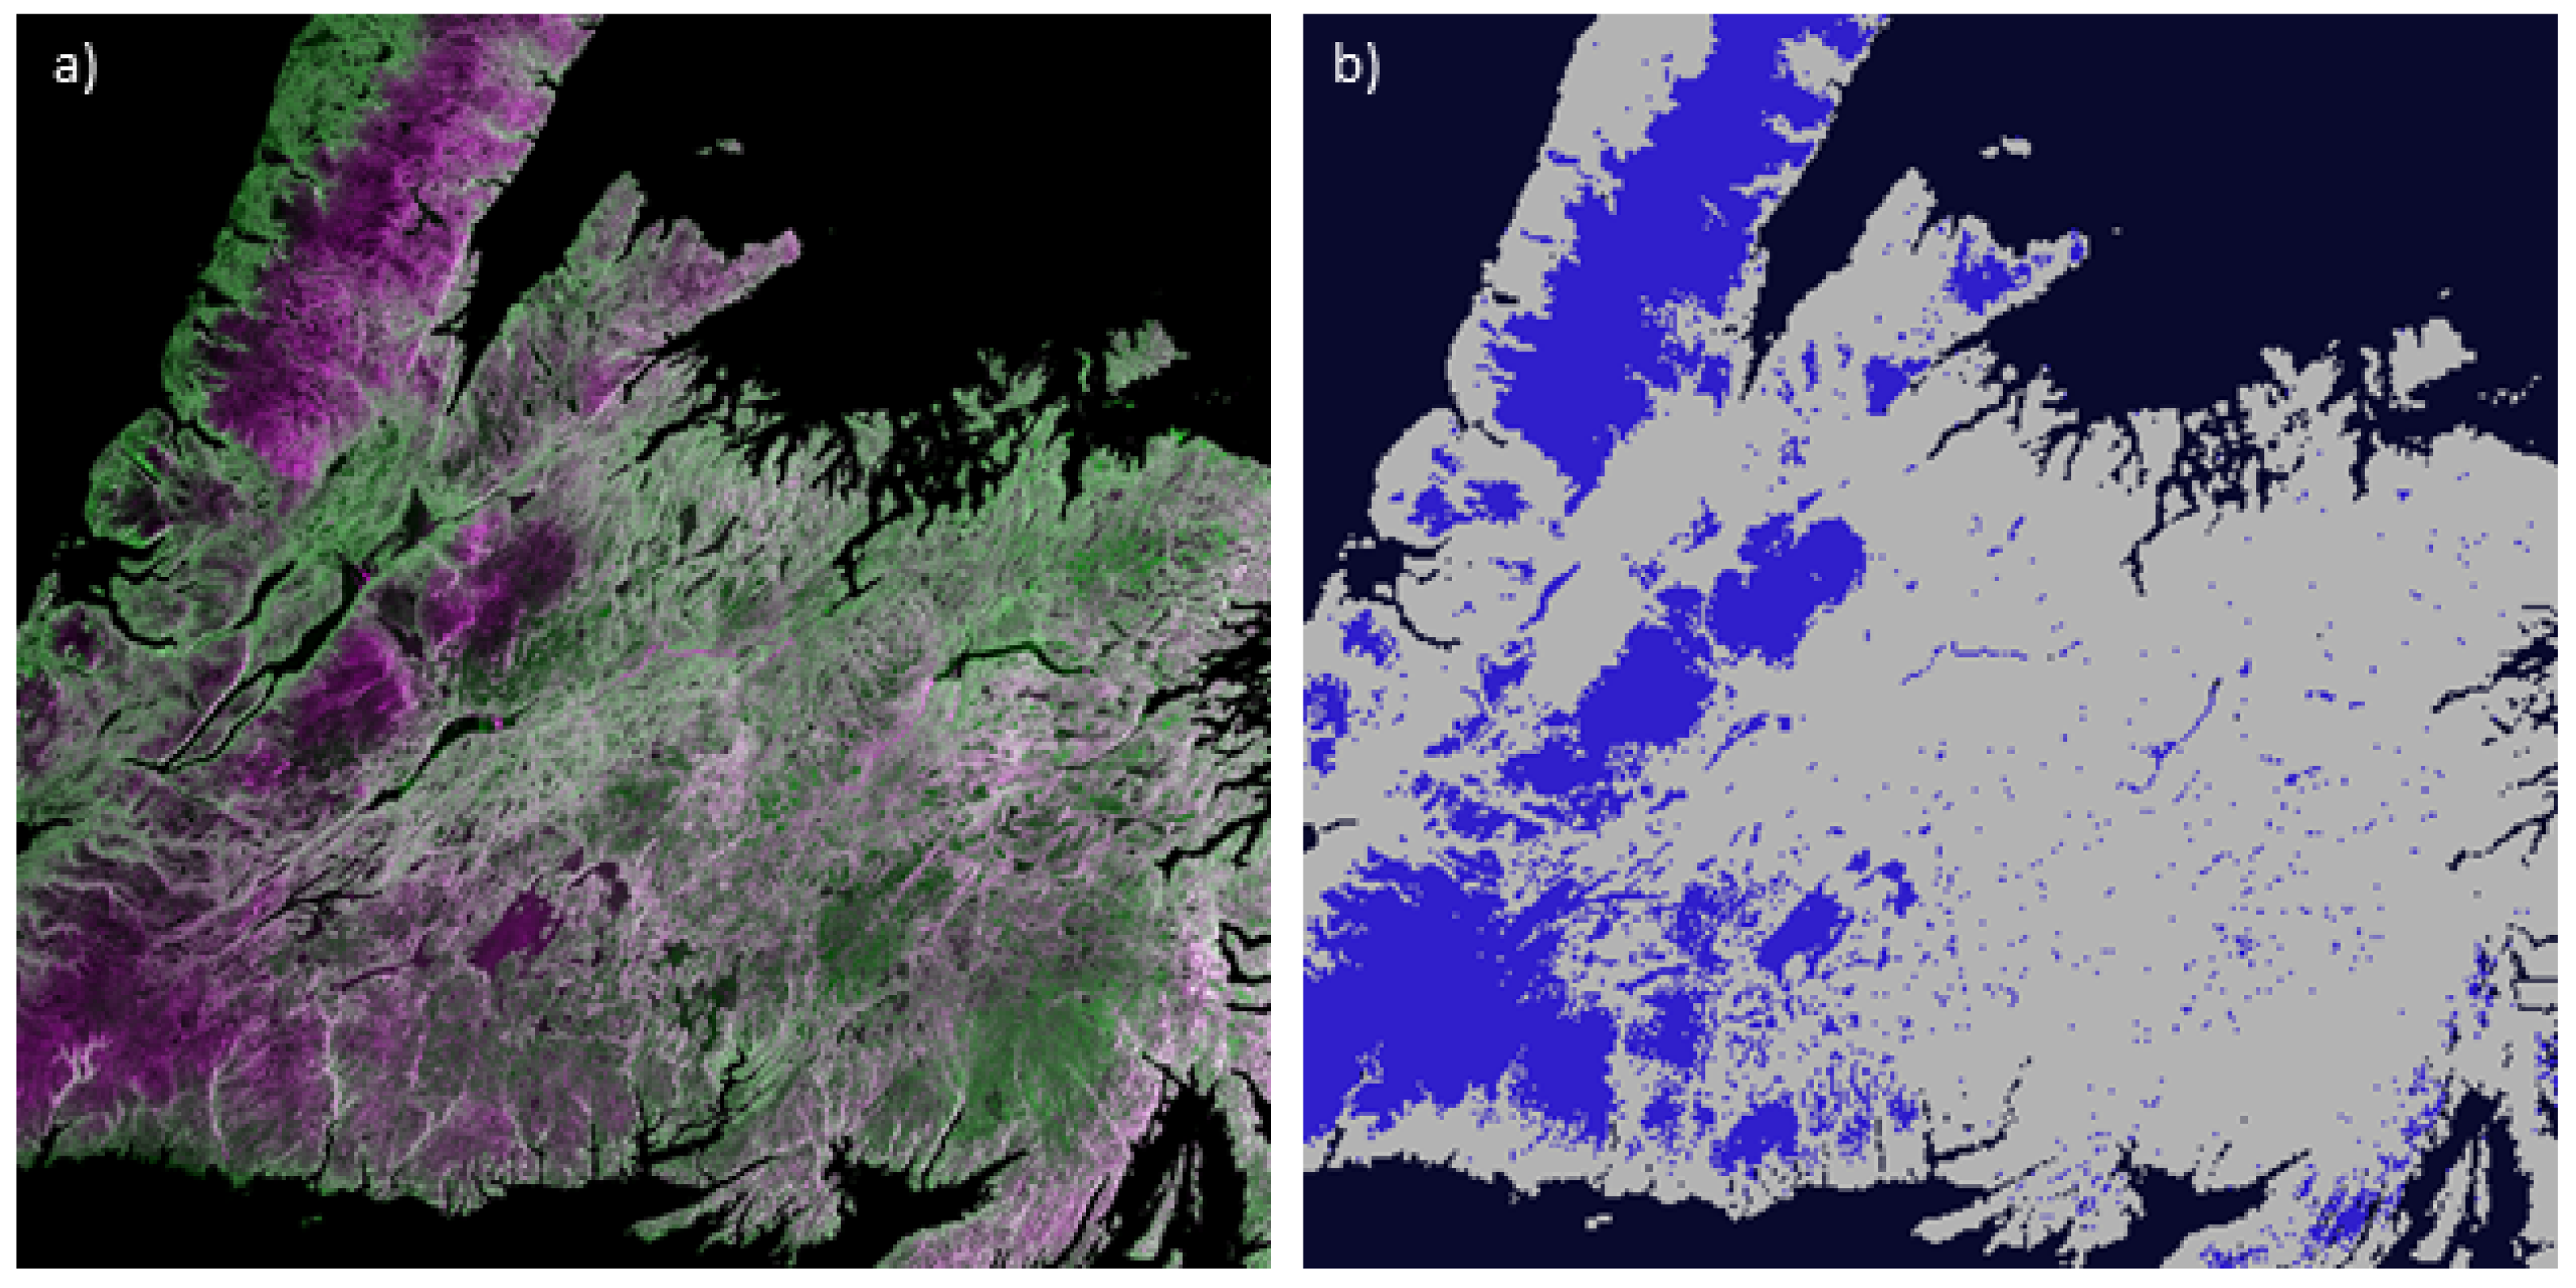
2.4. EO and Data Processing

For wet-snow detection from space, we used Sentinel-1A and -1B EO data in interferometric wide (IW) swath mode. IW mode is the main acquisition mode over land and satisfies the majority of service requirements. It acquires data with a 250 km swath at 5 m by 20 m spatial resolution [27]. The satellite data is automatically downloaded from Copernicus Data Hub (https://scihub.copernicus.eu/), and pre-processed using ESA Sentinel Toolbox for geometry and terrain corrections and it is spatially resampled on a 100 m by 100 m grid [28]. Afterwards, the data is radiometrically calibrated and corrected with regard to the elevation angle [29]. The wet-snow mapping is performed as proposed by Nagler and Rott [30] with a fixed threshold of −3 dB from a reference scene. Here, we are using a predefined reference data set with averaged standard backscatter values for different satellite geometries according to Appel et al. [29].
The results are binary wet snow maps with a resolution of 1 km by 1 km, containing three classes: wet snow, no information (which includes dry snow or snow free conditions), and no data. The maps were used in a further step for the assimilation process (see Section 2.6) and as additional visualization product, i.e., provided for the demo users in a password protected online portal (see Figure 4).

2.5. Processes of Mass and Energy Transfer—PROMET Model Component

For the retrieval of the spatially distributed snow information and forecast capabilities, the hydrological part of the coupled land surface process model PROMET [22] was chosen. It is a raster-based model that has been developed to spatially simulate the elements of the land surface water balance including vegetation, soil moisture, snow cover, reservoirs, and river discharge. PROMET incorporates a four-layer soil model and considers lateral flows along hill slopes. Due to its raster-based architecture, the model allows for the assimilation of remote sensing data for distributed hydrological applications [31]. PROMET solves the water and energy balance for hourly time steps and calculates the run-off of river basins, while it strictly conserves mass and energy. It thus allows for the validation of the complete process chain, from rainfall over soil-moisture dynamics to vegetation controlled evapotranspiration and finally routed run-off, against measured discharges on the basin and sub-basin scale.
PROMET has successfully been applied for a variety of hydrological studies in medium-to large-sized watersheds [22,31,32,33]. Required input data consist of raster-based GIS information, characterizing the spatial distribution of land use patterns, soil types and topographic features. In addition, parameters describing the characteristics of the soil and land use or crop categories are supplied through tabular input.
For the application on the island of Newfoundland, we set up a basic model environment based on a freely available digital elevation model (DEM), from which the river network was automatically derived and lakes or reservoirs were inserted as structures. Land use information was derived from EO data sources (GlobCover), as soil map the Harmonized Soil Map of the World [34] is used. All spatial input data as well as the model grid itself have a resolution of 0.00833 degrees (<1 km2). The parameterization of the catchment characteristics followed the internal standardized procedure developed by VISTA, purely based on GIS and EO data. As the PROMET model is physically based, it does not require a calibration. Further fine-tuning of parameters would be possible, but were, however, not conducted due to missing information e.g., on reservoir management and limited validation data.
PROMET can be driven by high resolution (1 h) time series of meteorological station network records, using the measured meteorological parameters. However, due to the specific characterization of our study area, only a sparse meteorological station network was available, which was not sufficient for our service target. Moreover, even in case of a sufficient number of meteorological stations, the amount of continuously provided information, e.g., on radiation and humidity or dew point are often missing or inaccurate. To overcome the lack of meteorological station data, we used global and regional climate model data as input, similar as presented by Zabel [35]. For the application in Newfoundland, we used data provided by Government of Canada as part of their High Resolution Deterministic Prediction System (HRDPS). This system is a set of nested limited-area model (LAM) forecast grids from the non-hydrostatic version of the Global Environmental Multiscale (GEM) model with a 2.5 km horizontal grid spacing.
The fields in the HRDPS high resolution data set are made available as GRIB2 for four times a day for the Pan-Canadian domain for a 48-h forecast period [36]. Those data sets are consistent in temporal (1 h) and spatial (2.5 km) resolution. We adapted the import routines for the meteorology and selected the appropriate parameters for the model forcing to perform calculations of the snow and run-off situation with hourly temporal resolution. Due to the architecture of PROMET, we are able to calculate any periods, starting from previously stored status and recovery files, and provide all information on the current snow and hydrological situation as spatial data sets in a 1 km by 1 km resolution with an hourly timestep and as tabled point data.

2.6. Assimilation

In general, and as, e.g., presented in [37,38,39,40,41,42], data assimilation is likely to improve the accuracy of the modelled snow parameters in a way that the modelled snow parameter or run-off results agree better with the real situation. For the SnowSense data assimilation, we used information gathered by the SnowSense GNSS in situ stations and the already existing online SWE measurement sites, as well as information from EO data. Regarding the in situ locations, we used the SWE and LWC (were available), regarding the EO sources, we used binary information whether the snow is dry or wet from Sentinel-1. All information was then compared twice a week with the non-assimilated output of SWE, LWC and the snow cover extent simulated by the PROMET model. In case of significant differences between simulated and observed values, assimilation runs for the last calculation period had been triggered. To adjust the model output to the observed in situ and EO information, the following options were available [43]: Adjustments of (i) the precipitation gain for the amount of snow/solid precipitation, (ii) the critical temperature for the transition of liquid and solid precipitation, and (iii) the albedo parameter for the short wave energy fluxes controlling the ablation dynamic. The sequence of the assimilation steps is following a decision tree based work-flow. After adjusting the model parameterization, the model is re-calculating the required output parameters for an improved agreement between model and reality. The adjustment of i, ii and iii is performed spatially. During the winter 2017/2018 phase, the assimilation process was performed partly manual. For a future service application, we will establish a more automated process.

3. Results and Discussion

In the first part of this section, we present the results and the validation of the GNSS in situ station for the well-equipped study site NEIGE at Forêt Montmorency. In the second part, we focus on the results and the validation of the hydrological service of the combined and assimilated run-off at, in total four, gauges of the Humber and Exploit catchments in Newfoundland.

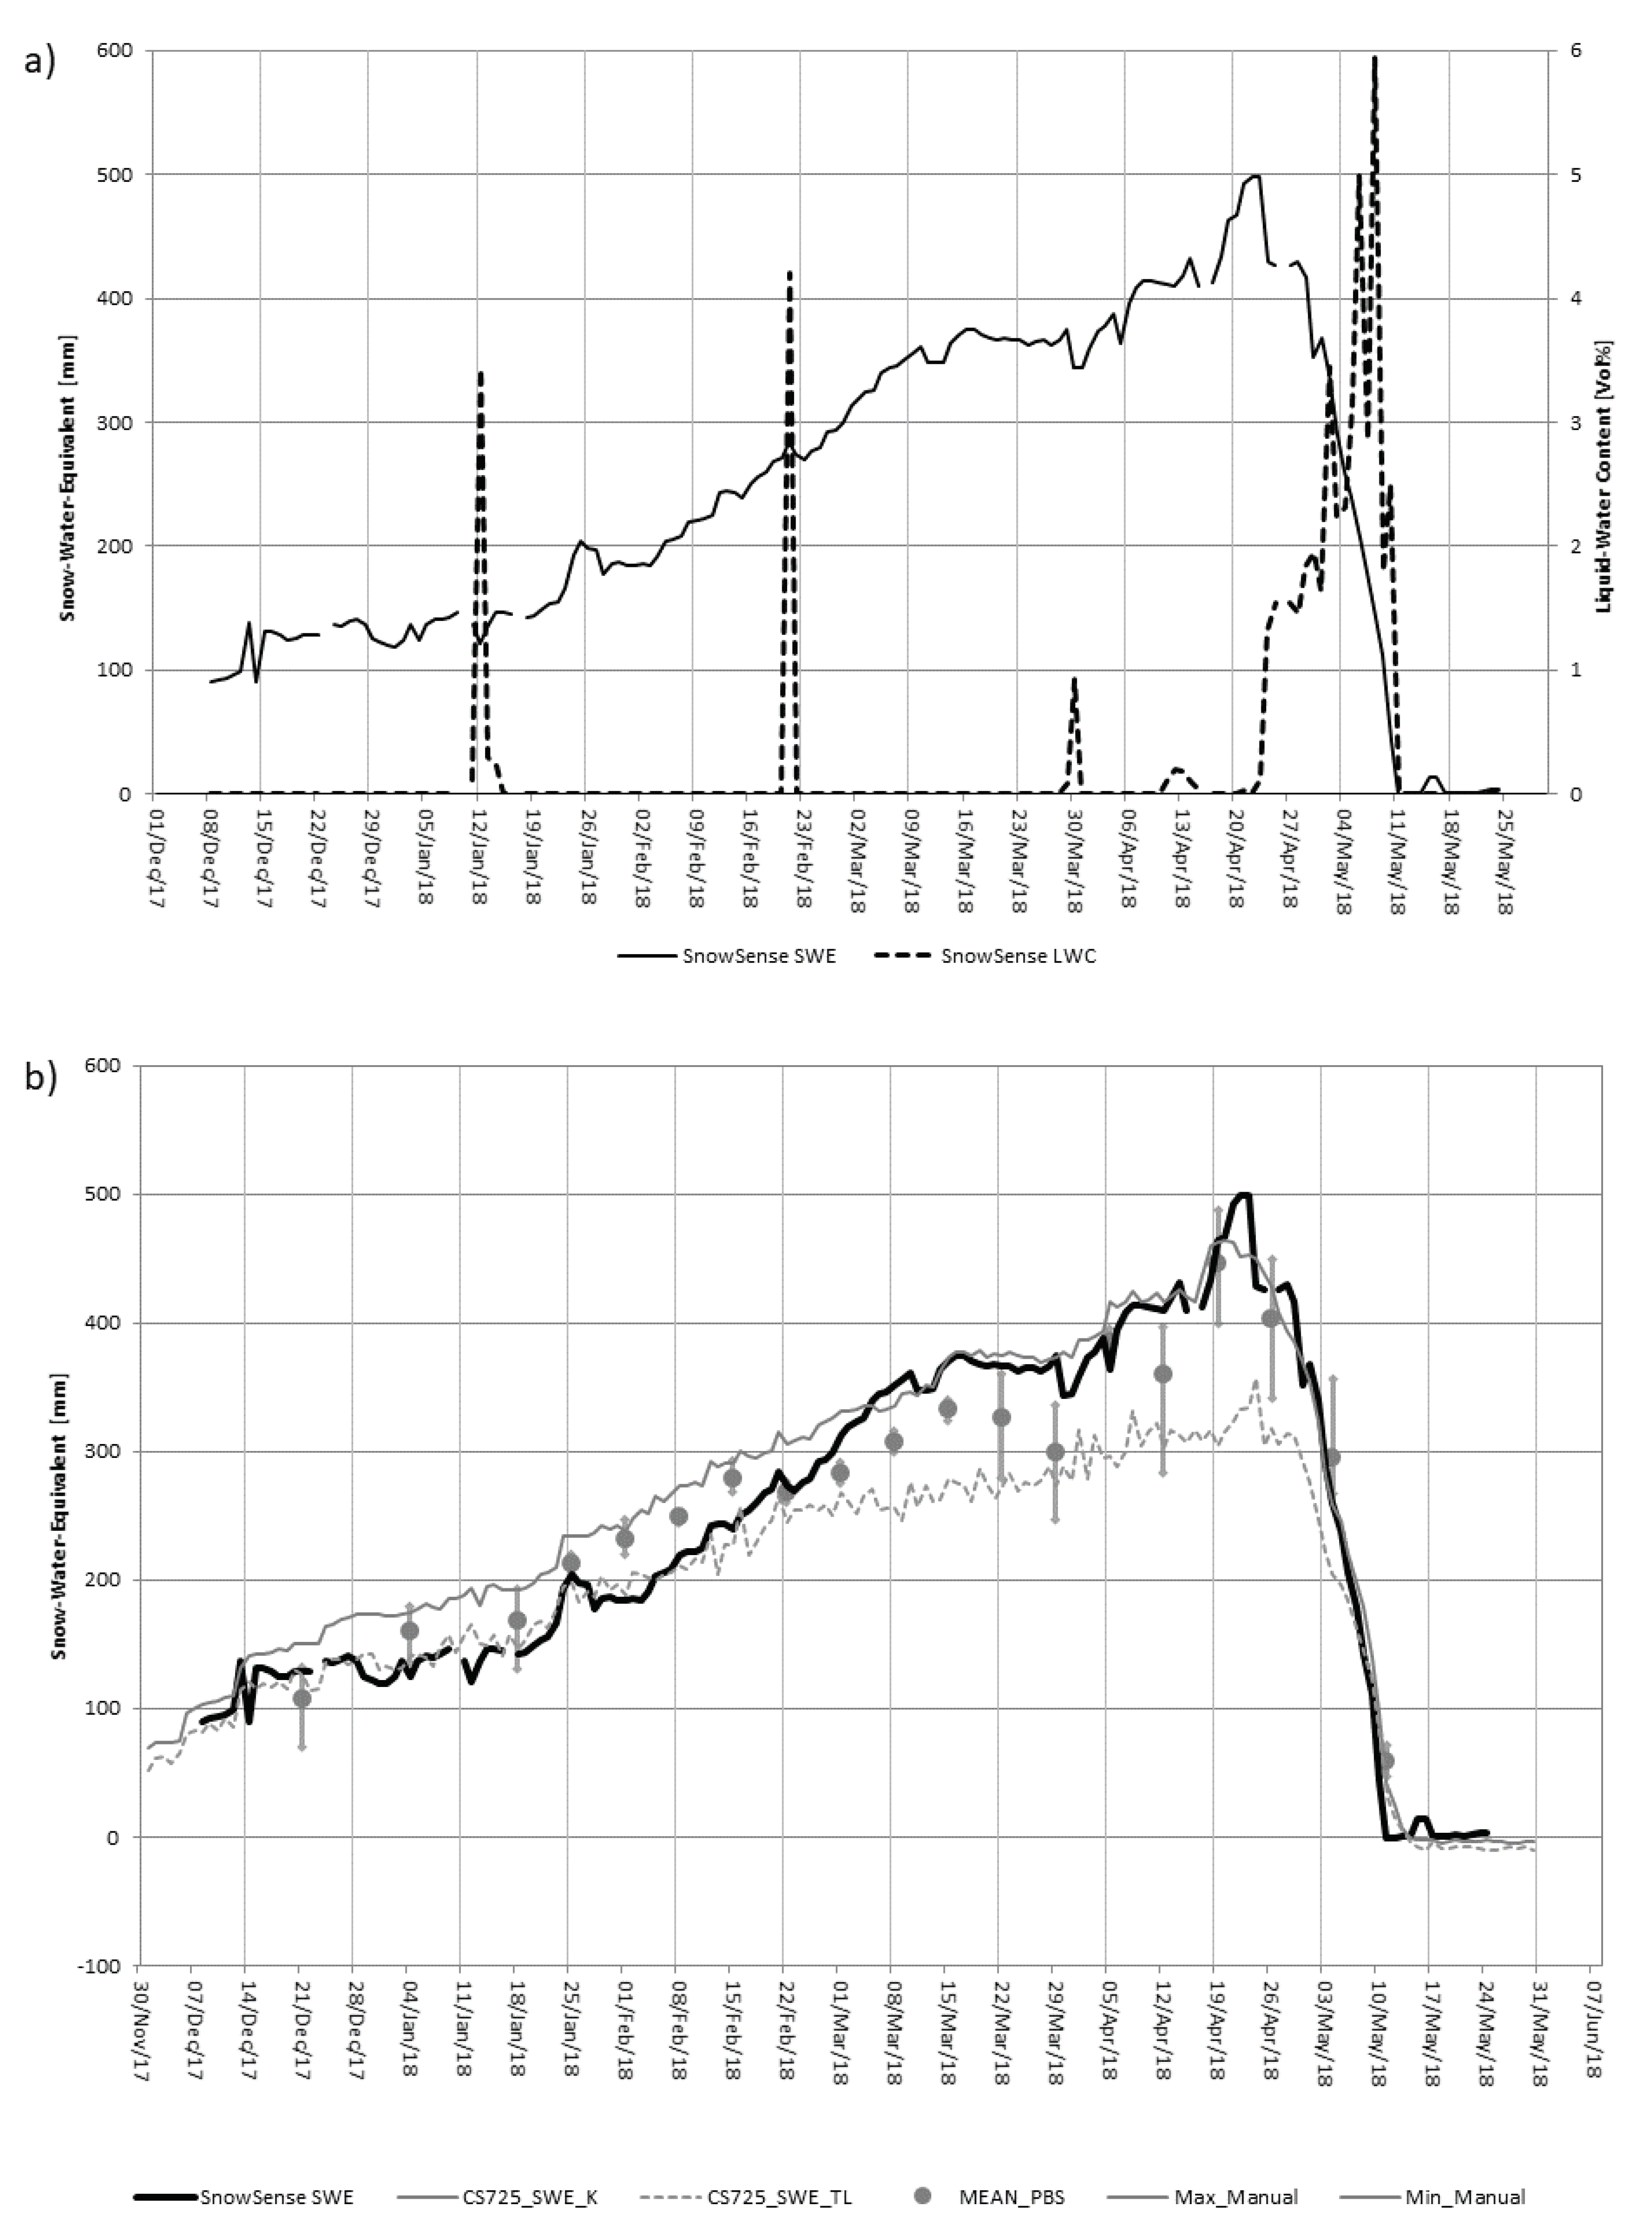
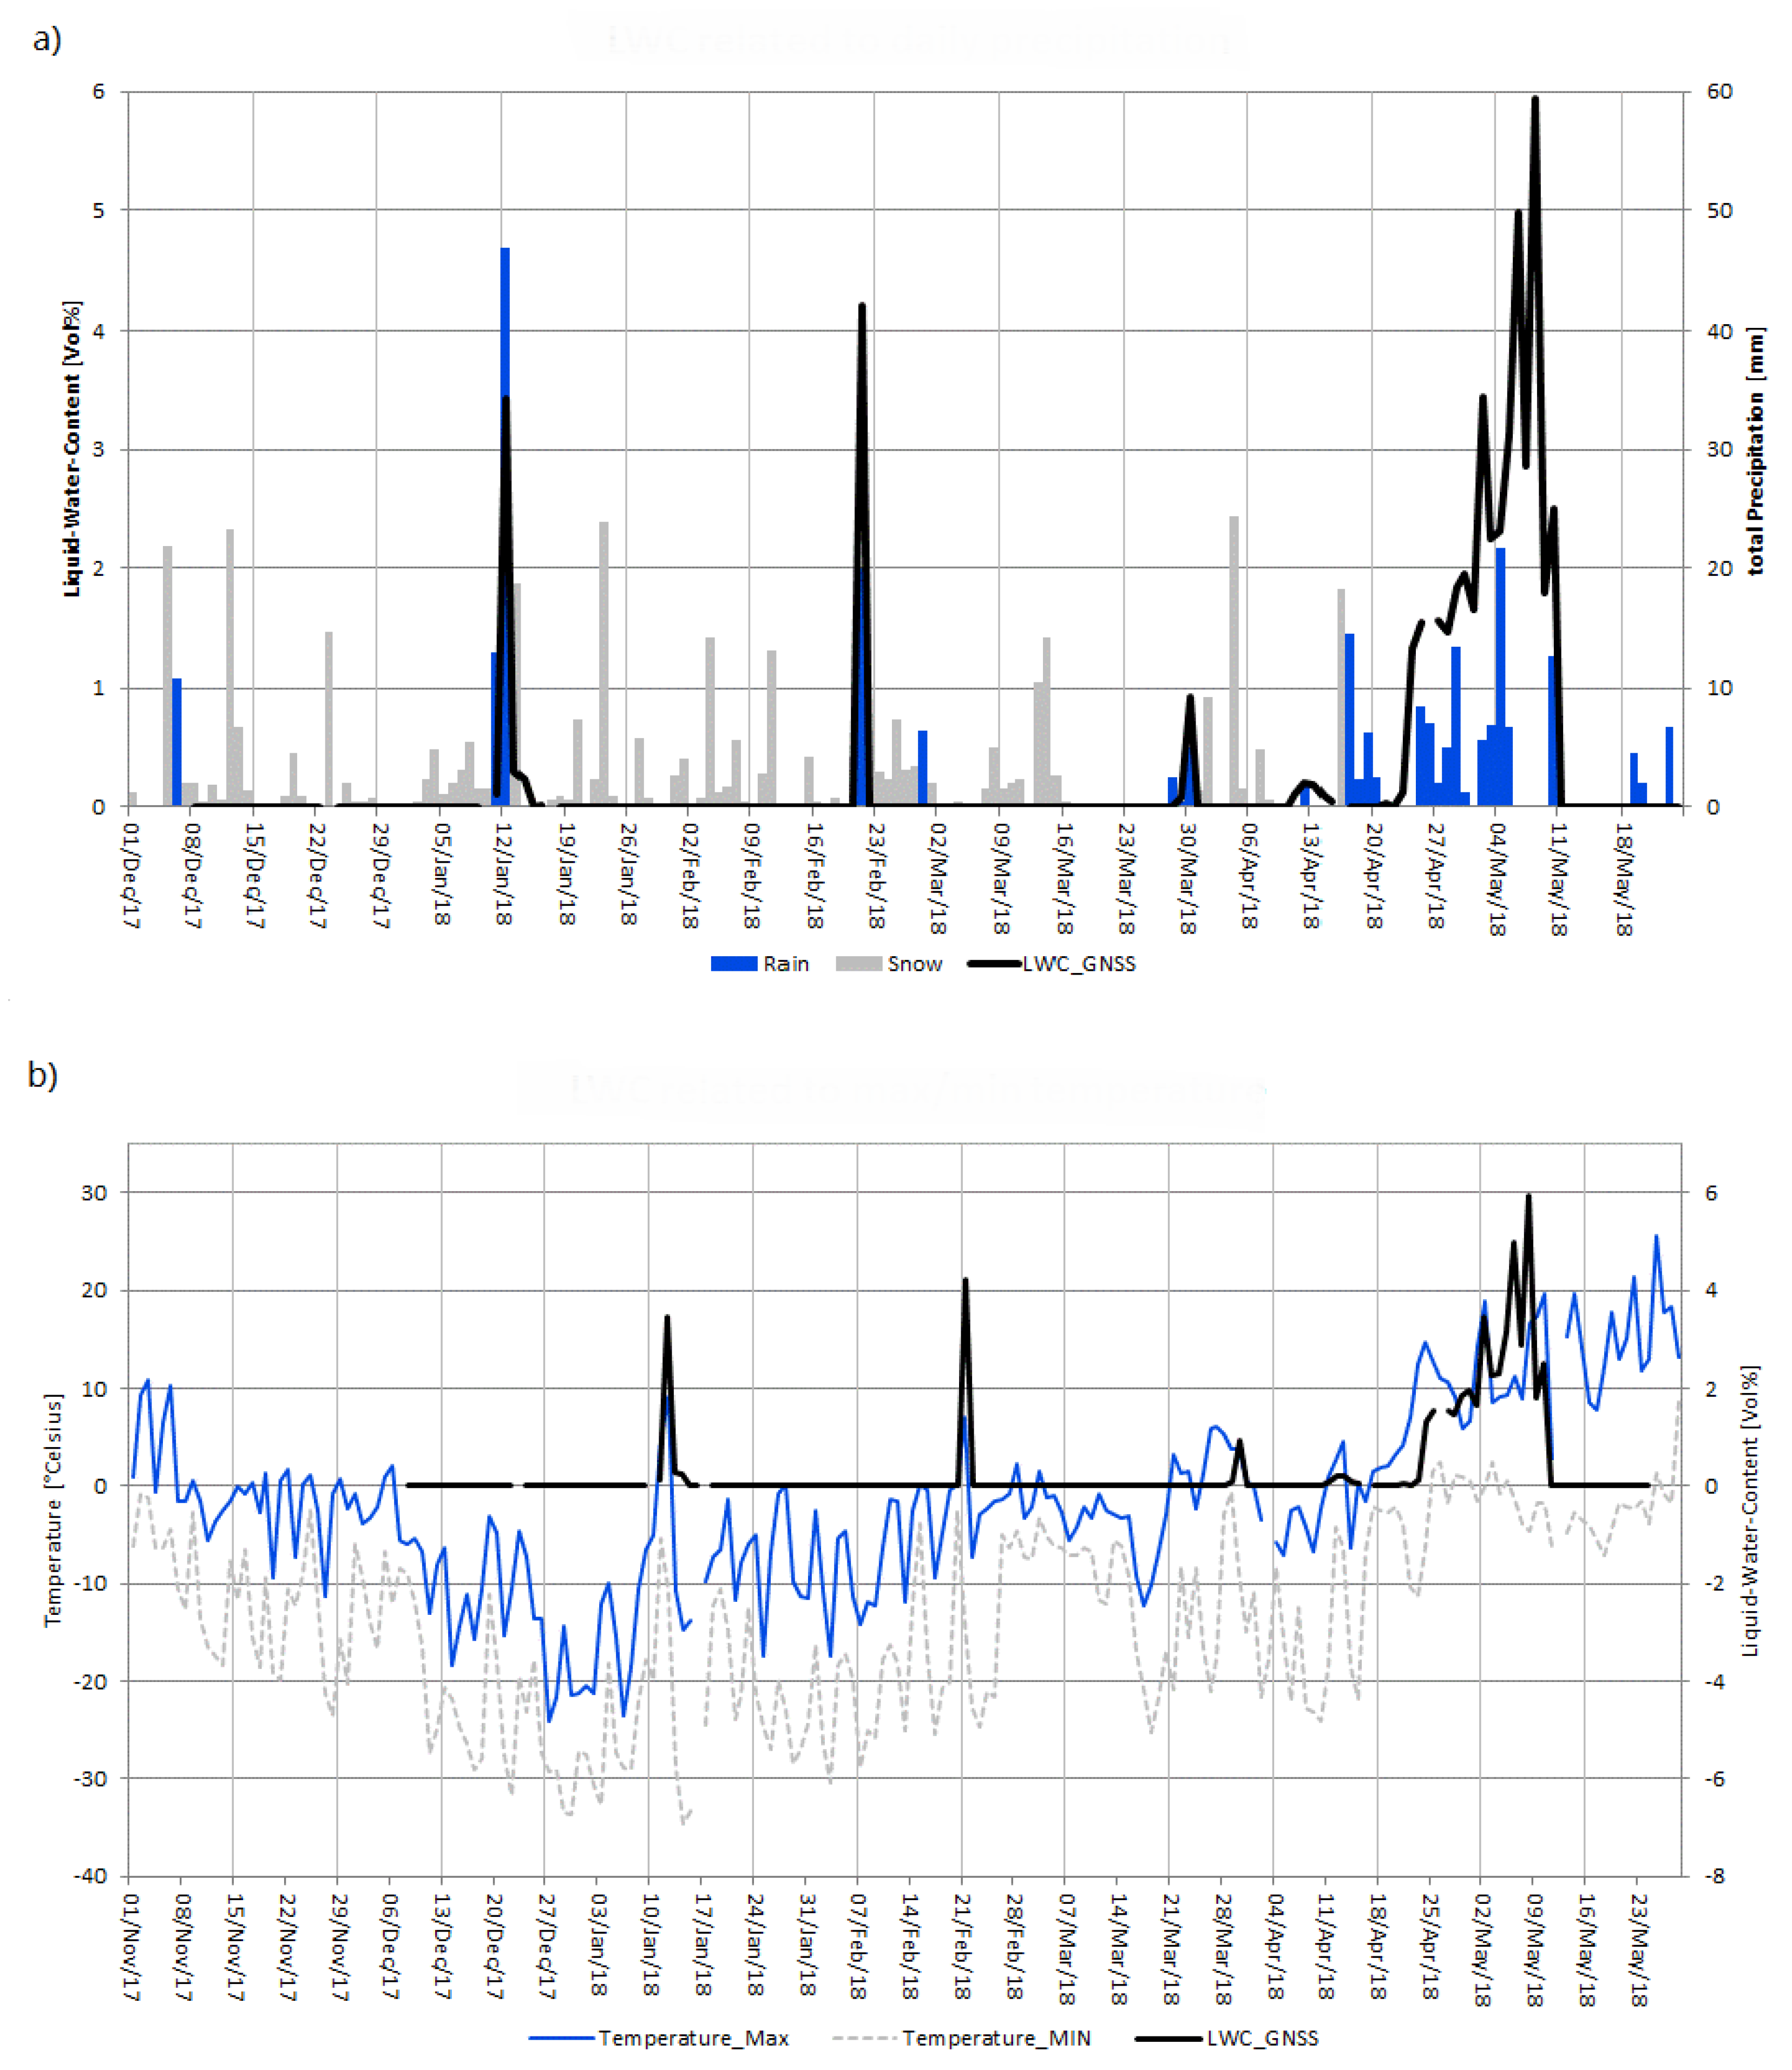
3.1. Station Performance at the Forêt Montmorency NEIGE Site near Quebec

The SnowSense station was installed in October 2017 at the NEIGE site at Forêt Montmorency and was operational during the entire snow-covered winter season 2017/18. The power supply and the communication unit resisted the cold and windy environment without damage or failure. The station delivered continuous daily SWE and LWC measurements without any significant discontinuities (Figure 5a).
In general, the SWE values derived by the SnowSense GNSS in situ station are in good agreement with the provided reference measurements by the two GMON CS725 sensors and the manual snow pit measurements (Figure 5b).
The GMON sensor as well as the GNSS sensor are both non-destructive measurement methods and are largely capable of deriving SWE. Both sensors were already validated against other sensors like snow pillows and manual measurements (e.g., [7,11,44]). As stated by Choquette et al. [6], at the observed study site NEIGE, an average error of 18% between manual measurements and the GMON sensor is reasonable, and, for SWE levels less than 400 mm w.e., the estimation is inside the 5–10% range.
At the time the GNSS measurements started in early winter 2017, the GNSS-derived SWE as well as the measurements of the two GMON sensors lay in a similar range at approximately 100 mm w.e. At the end of April 2018, the maximum amount of SWE with approximately 500 mm w.e. was reached, which was indicated by the GNSS solution as well as the manual measurements and one GMON sensor. Comparing the two GMON sensors (blue solid and blue dashed line, Figure 5b), however, an offset of the SWE measurement of up to 30% occurred between them. This offset was low in the beginning of the time series and increased during the winter continuously. The reasons for this might originate in different sensor locations e.g., with slightly different wind conditions, and are still under discussion, but are out of the scope of this paper. The manual measurements were performed 16 times on a weekly basis during the snow season. On each day, three to four snow pits were analyzed. The resulting averaged SWE measurements from the snow pits lie well in between the range of the two GMON sensors. The SWE results of the SnowSense GNSS station (black solid line) follows in the beginning of the season the lower GMON sensor (CS725_TL, blue dashed line). Since 20 February, after a heavy precipitation event, the GNSS derived SWE jumps to the level of the GMON sensor with the higher SWE values (CS725_K, blue solid line). The coefficient of determination (R2) between the GNSS data and the data from the GMON sensors is 0.53 for CS725_TL and 0.93 for CS725_K, respectively.
Throughout the entire season, the GNSS measurements agree very well with the manual measurements from snow pits including their minimum and maximum values. Here, the coefficient of determination (R2) is 0.64. For all R2 and root mean square errors (RMSE) errors of the validation study, we refer to Table 1.
The range of the SWE validation results presented in this study for the Forêt Montmorency are in good accordance with previously conducted studies validating the GNSS in situ SWE component successfully at the high-alpine study site Weissfluhjoch in the Swiss Alps as presented in Henkel et al. [11] and Koch et al. [8]. One key result of their validation is a very good performance of the SWE determination capabilities of the in situ GNSS approach: the inter-comparison of the SnowSense GNSS station with a snow pillow and manual measurements show a very high agreement indicated by the values of R2 close to 1 [11]. The root mean square errors (RMSE) between the measurements from GNSS, snow pillow, and from snow pits fit very well; they lay in the range of 11–24 mm w.e. [11] but might be higher regarding wet snow conditions, e.g., due to an increase in GNSS signal attenuation (approx. 45 mm w.e.) [8].
Until mid-April 2018, the snowpack was predominantly dry at the study site Forêt Montmorency. In January, February and March, only single wet-snow events of up to two to three days occurred. The occurrence of wet snow presented by the GNSS-derived LWC is shown in Figure 5a. As no further sensors for a comparison with the GNSS-derived LWC were available at this site, we compared the GNSS-derived LWC with meteorological parameters. In general, the measured LWC is in a good temporal correspondence with rainfall events and goes along with warm air temperatures (Figure 6), which was also demonstrated in Koch et al. [10]. However, as shown in other previous studies, we were able to successfully validate the GNSS LWC measurements with other sensors like an upward-looking ground-penetrating radar and capacity probes at the study site Weissfluhjoch [45].

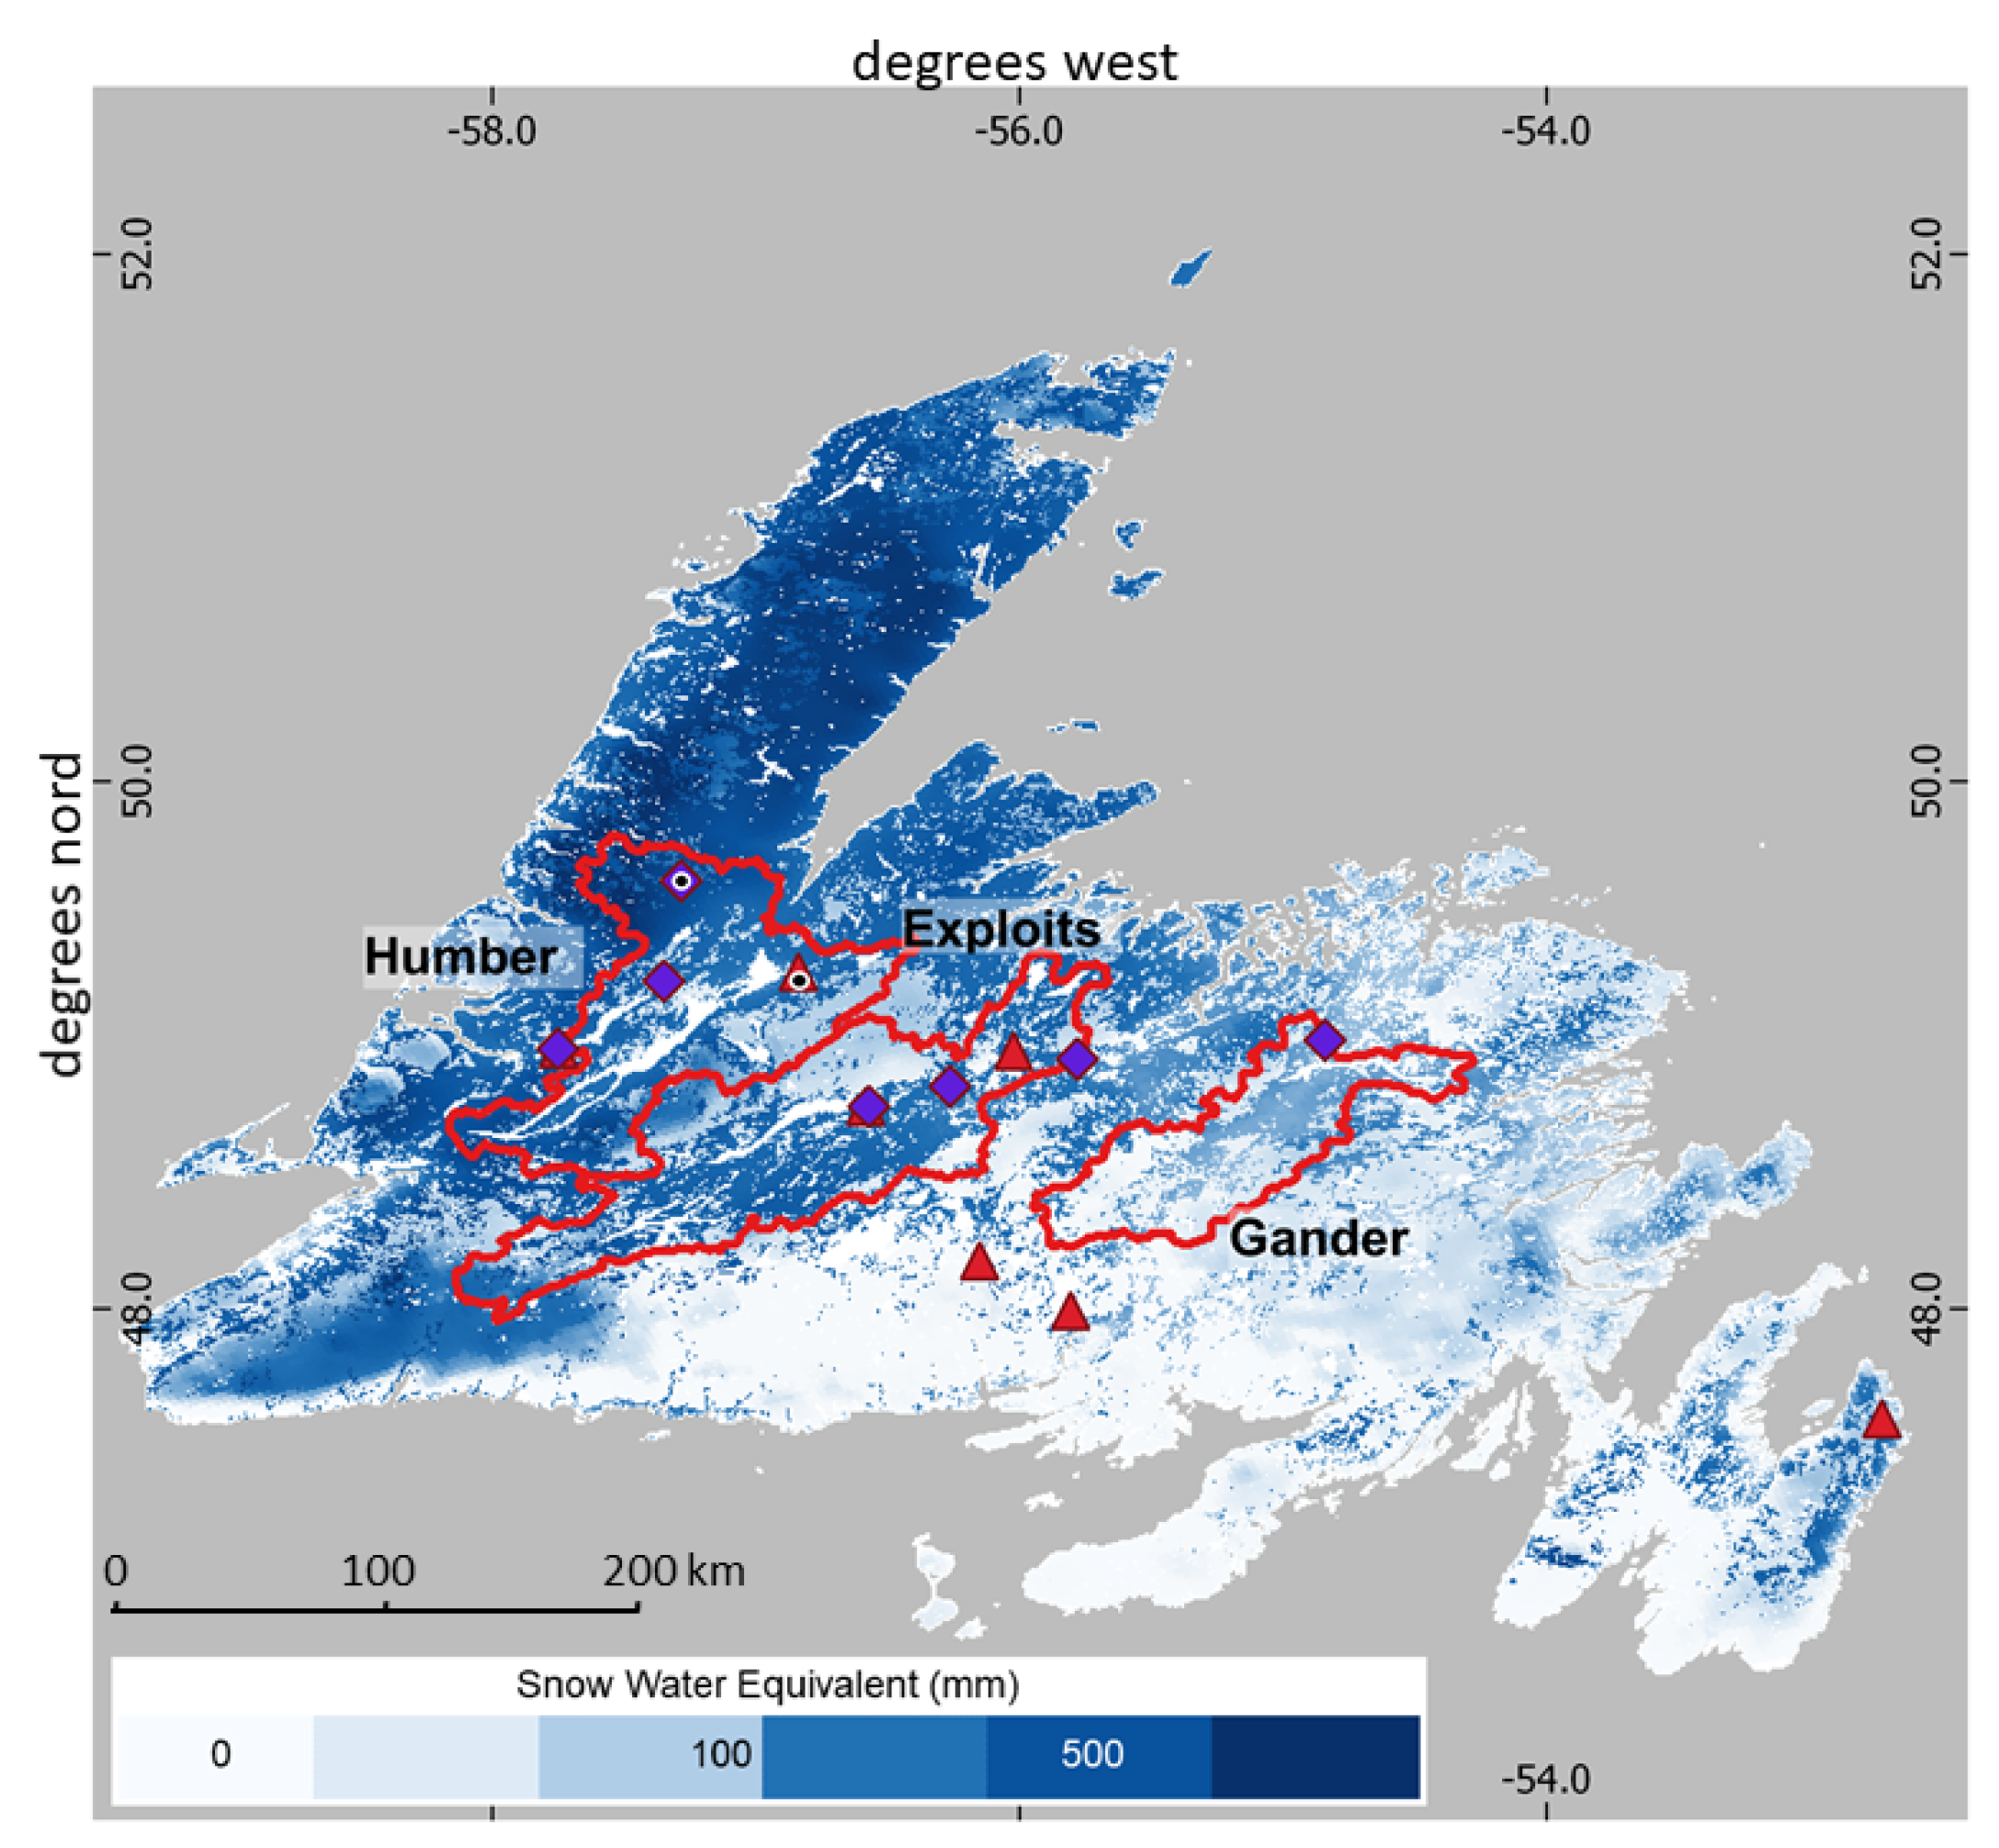
3.2. SnowSense Service for the Island of Newfoundland
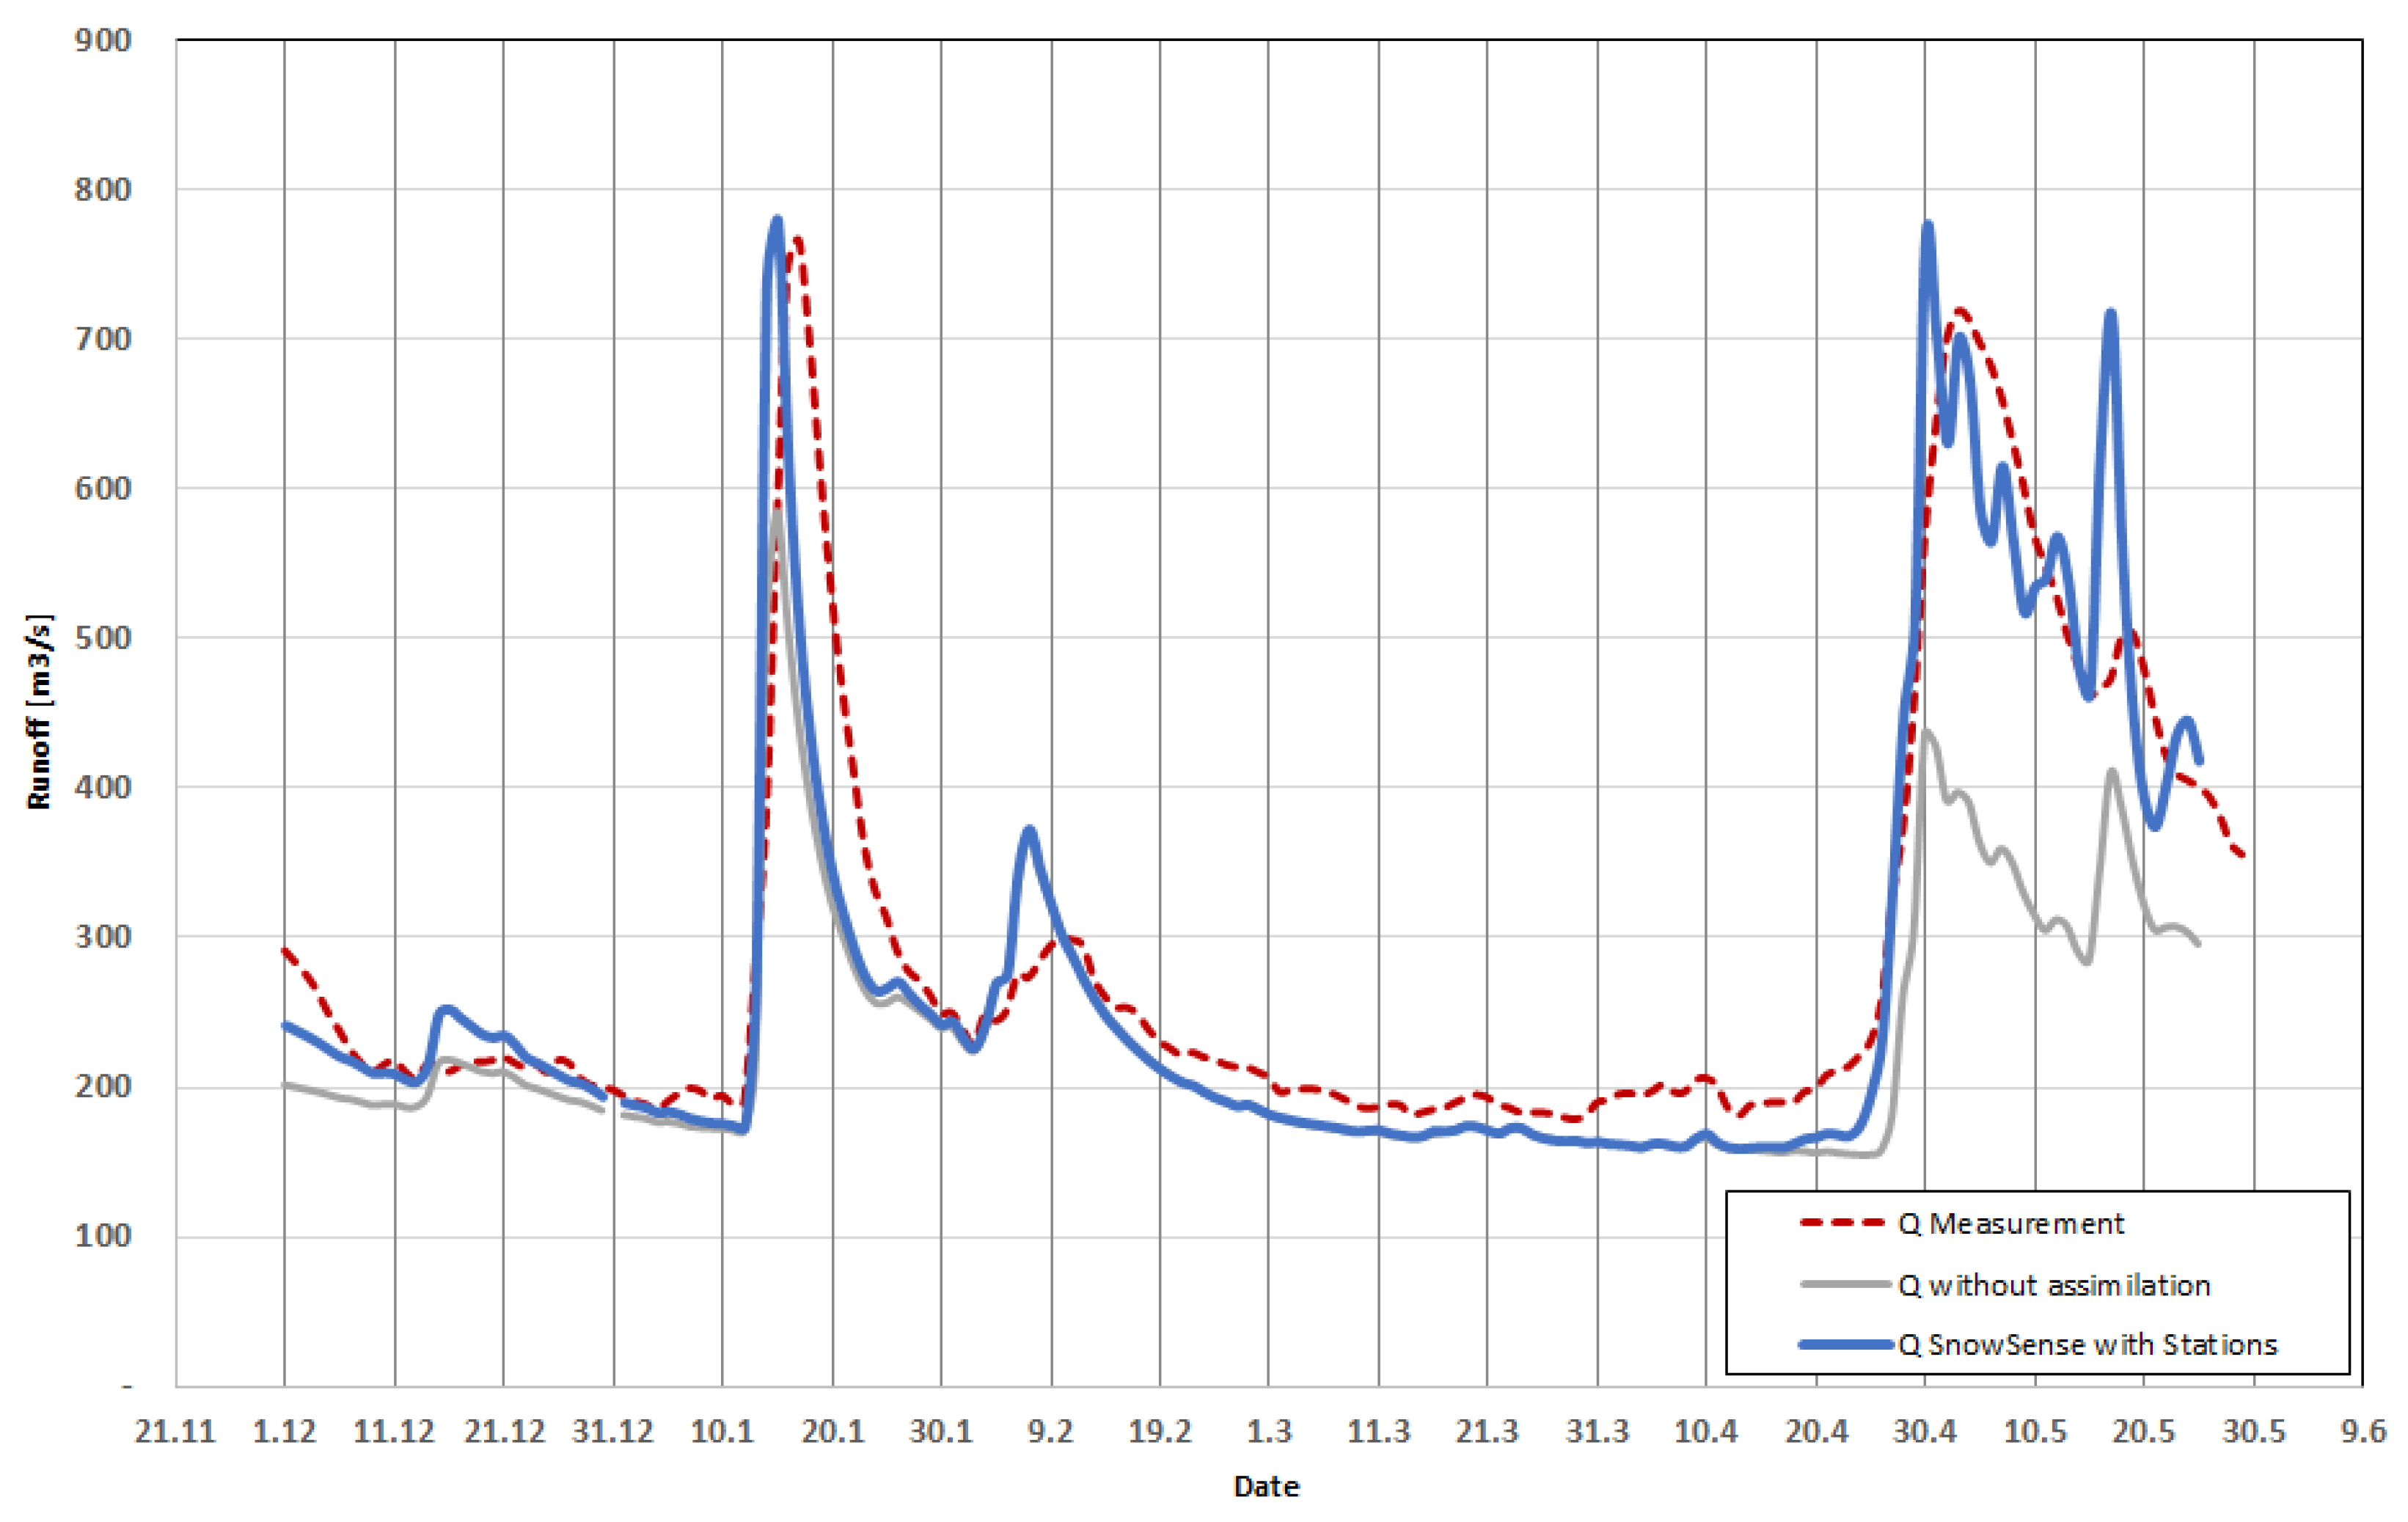
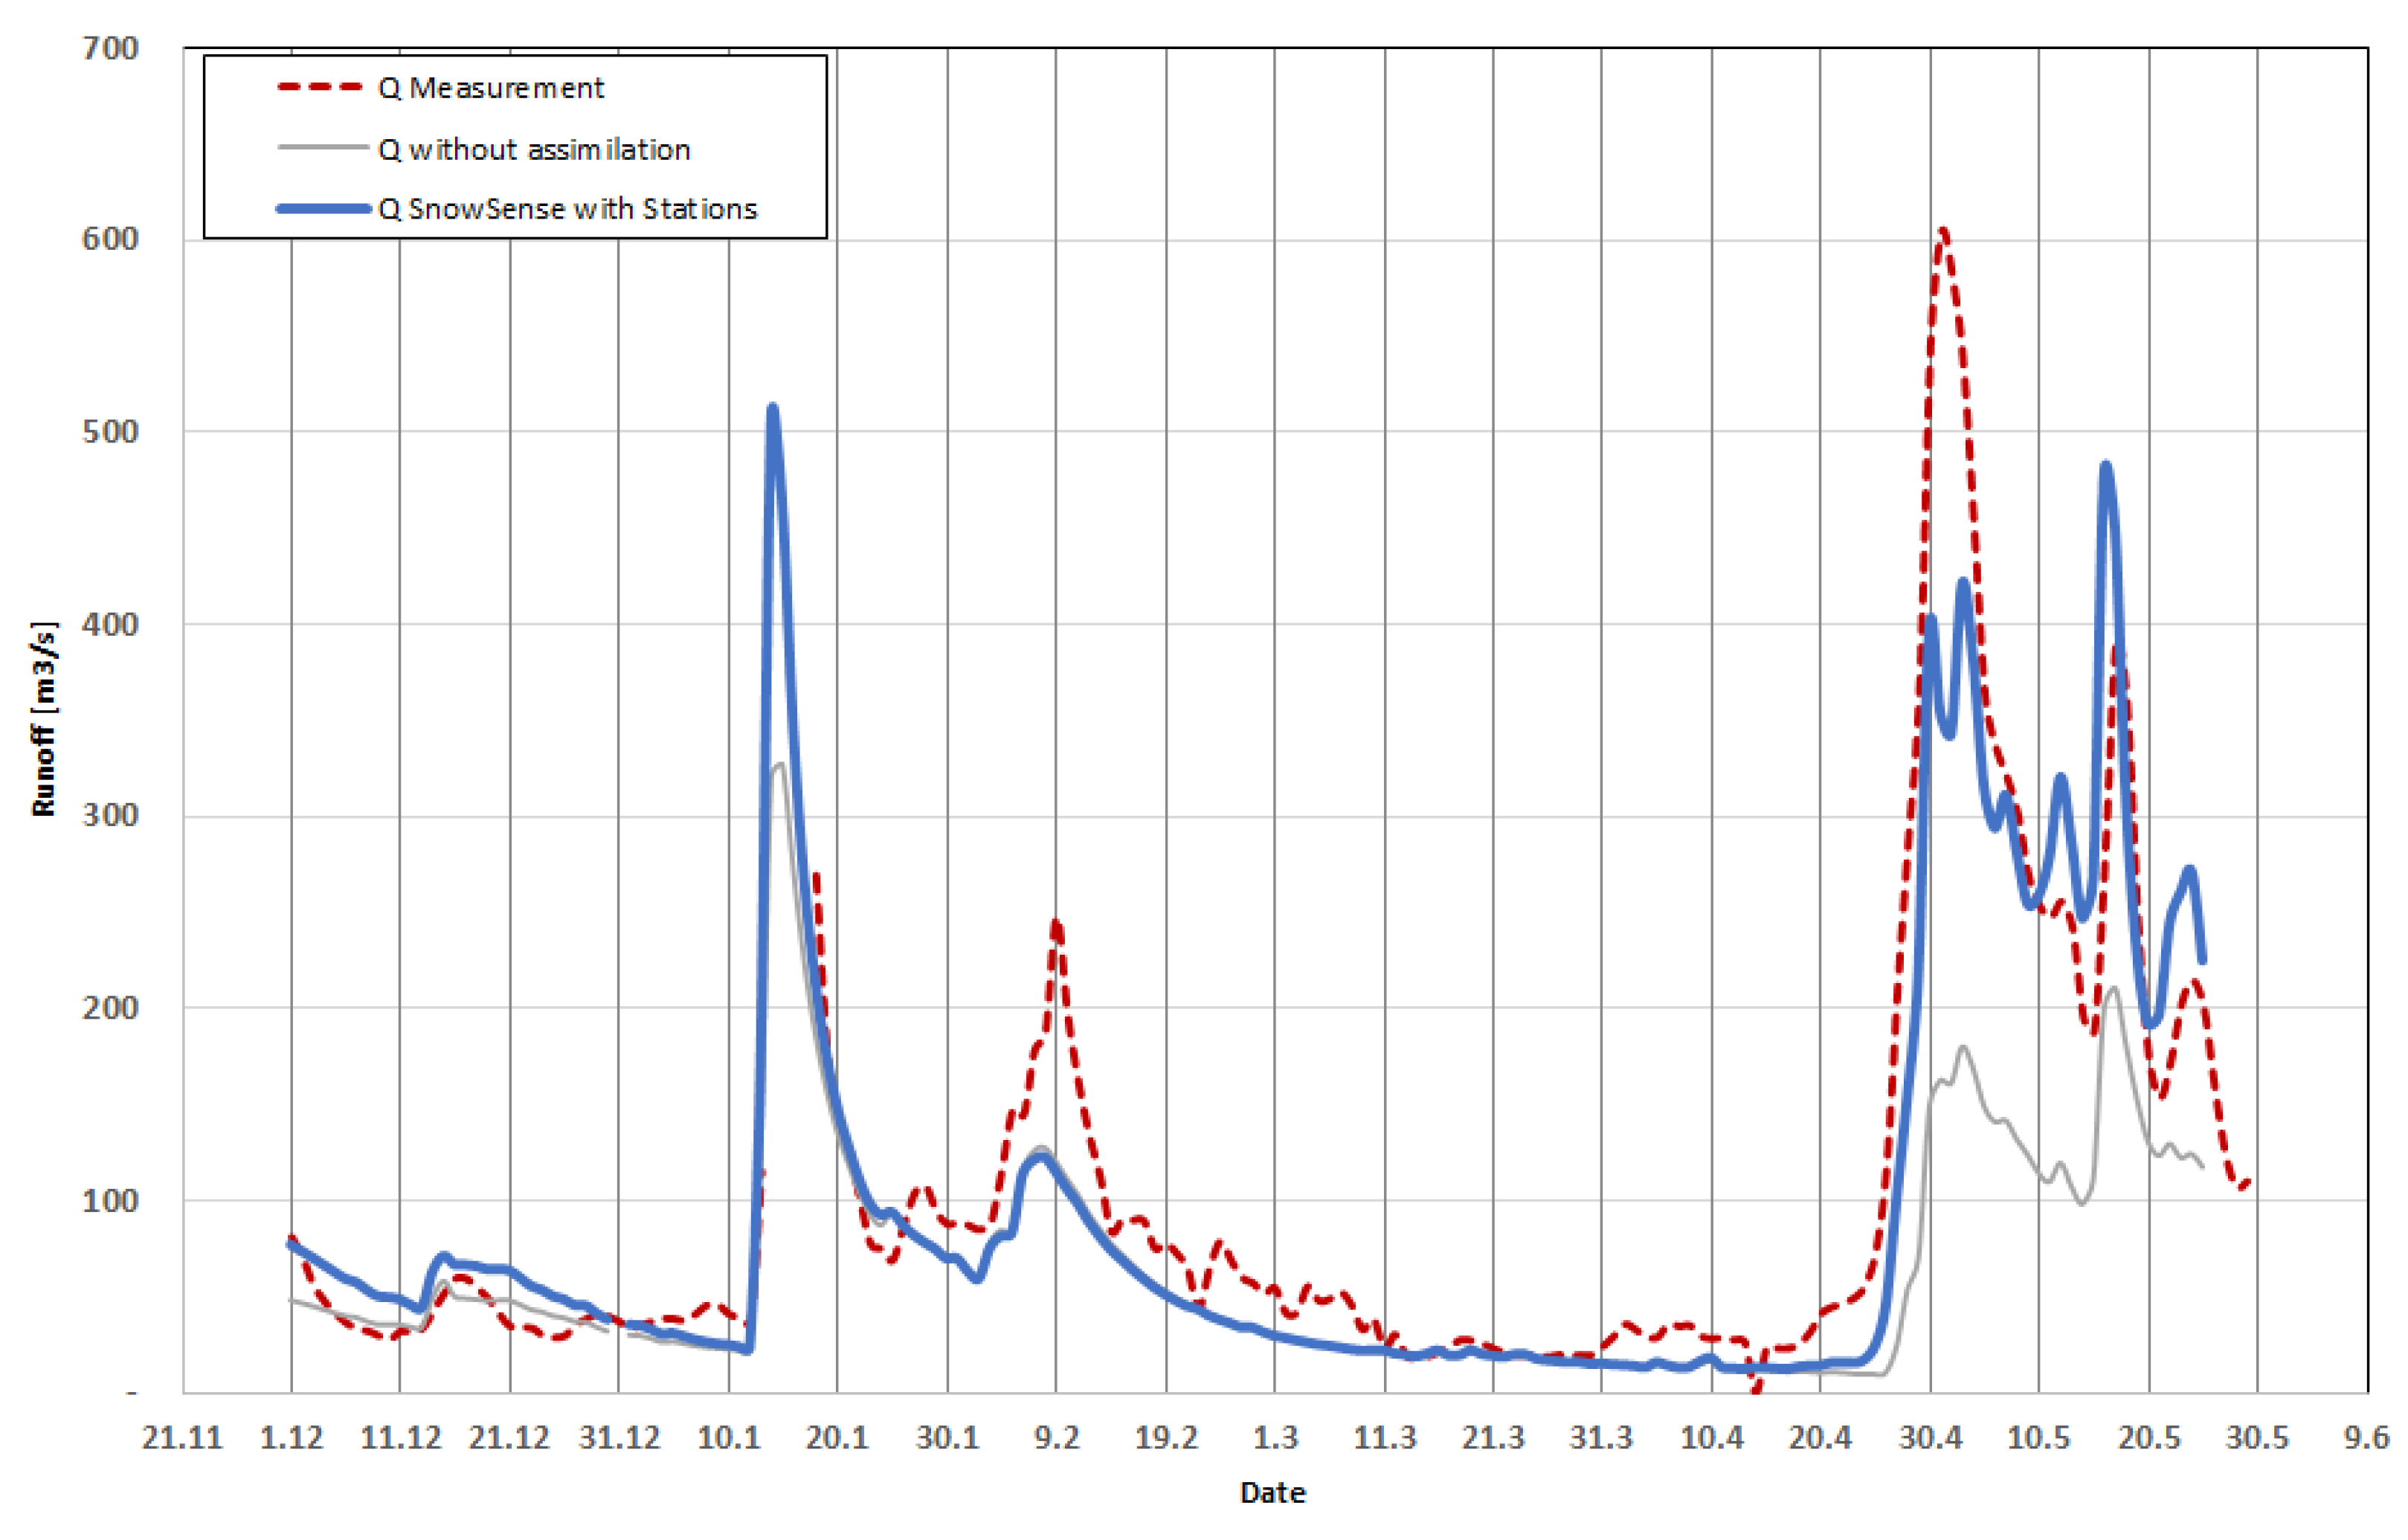
For the entire SnowSense service based on the GNSS in situ measurements, EO and modelling, spatially-distributed maps of the SWE were generated and run-off estimates were derived for several river locations in the two main catchments Humber River and Exploit River. Figure 2 gives an example of a SWE map, which was modelled and assimilated for the entire island of Newfoundland for the 15 March 2018. Such a SWE map was provided for each day.
The simulated and assimilated run-off results were validated against four run-off gauge measurements in total. Measurements (raw data) are made available by the Water Resources Management Divisions. As for the catchments of the Humber River and the Exploits River, a strong interest in flood forecast was predominating; the run-off results are presented for the gauge stations at the lower parts of the two catchments.

3.2.1. Humber River

The run-off results for Humber Village for the winter season December 2017–May 2018 show very good agreement with the measured run-off reference values (Figure 7). Assimilation of the in situ information, mainly adjusting the solid precipitation, provide a perfect match of the volume of water. For the entire region, the amount of water stored as snow was perfectly represented by the model. The volume of total water released in the winter season 2017/18 was modelled by 95% (80% without assimilation). The coefficient of determination (R2) reaches 0.90 at Humber Village. The results for the upper part of the catchment down to Reidville also show a very reasonable accordance between measured and modelled run-off behaviour (Figure 8). Due to invalid run-off measurements during the first flood peak in January 2018, no full analyses of the period were performed. However, the volume of total water released in up to Reidville was modeled by 90% (65% without assimilation). The coefficient of determination (R2) reaches 0.80 at Reidville.

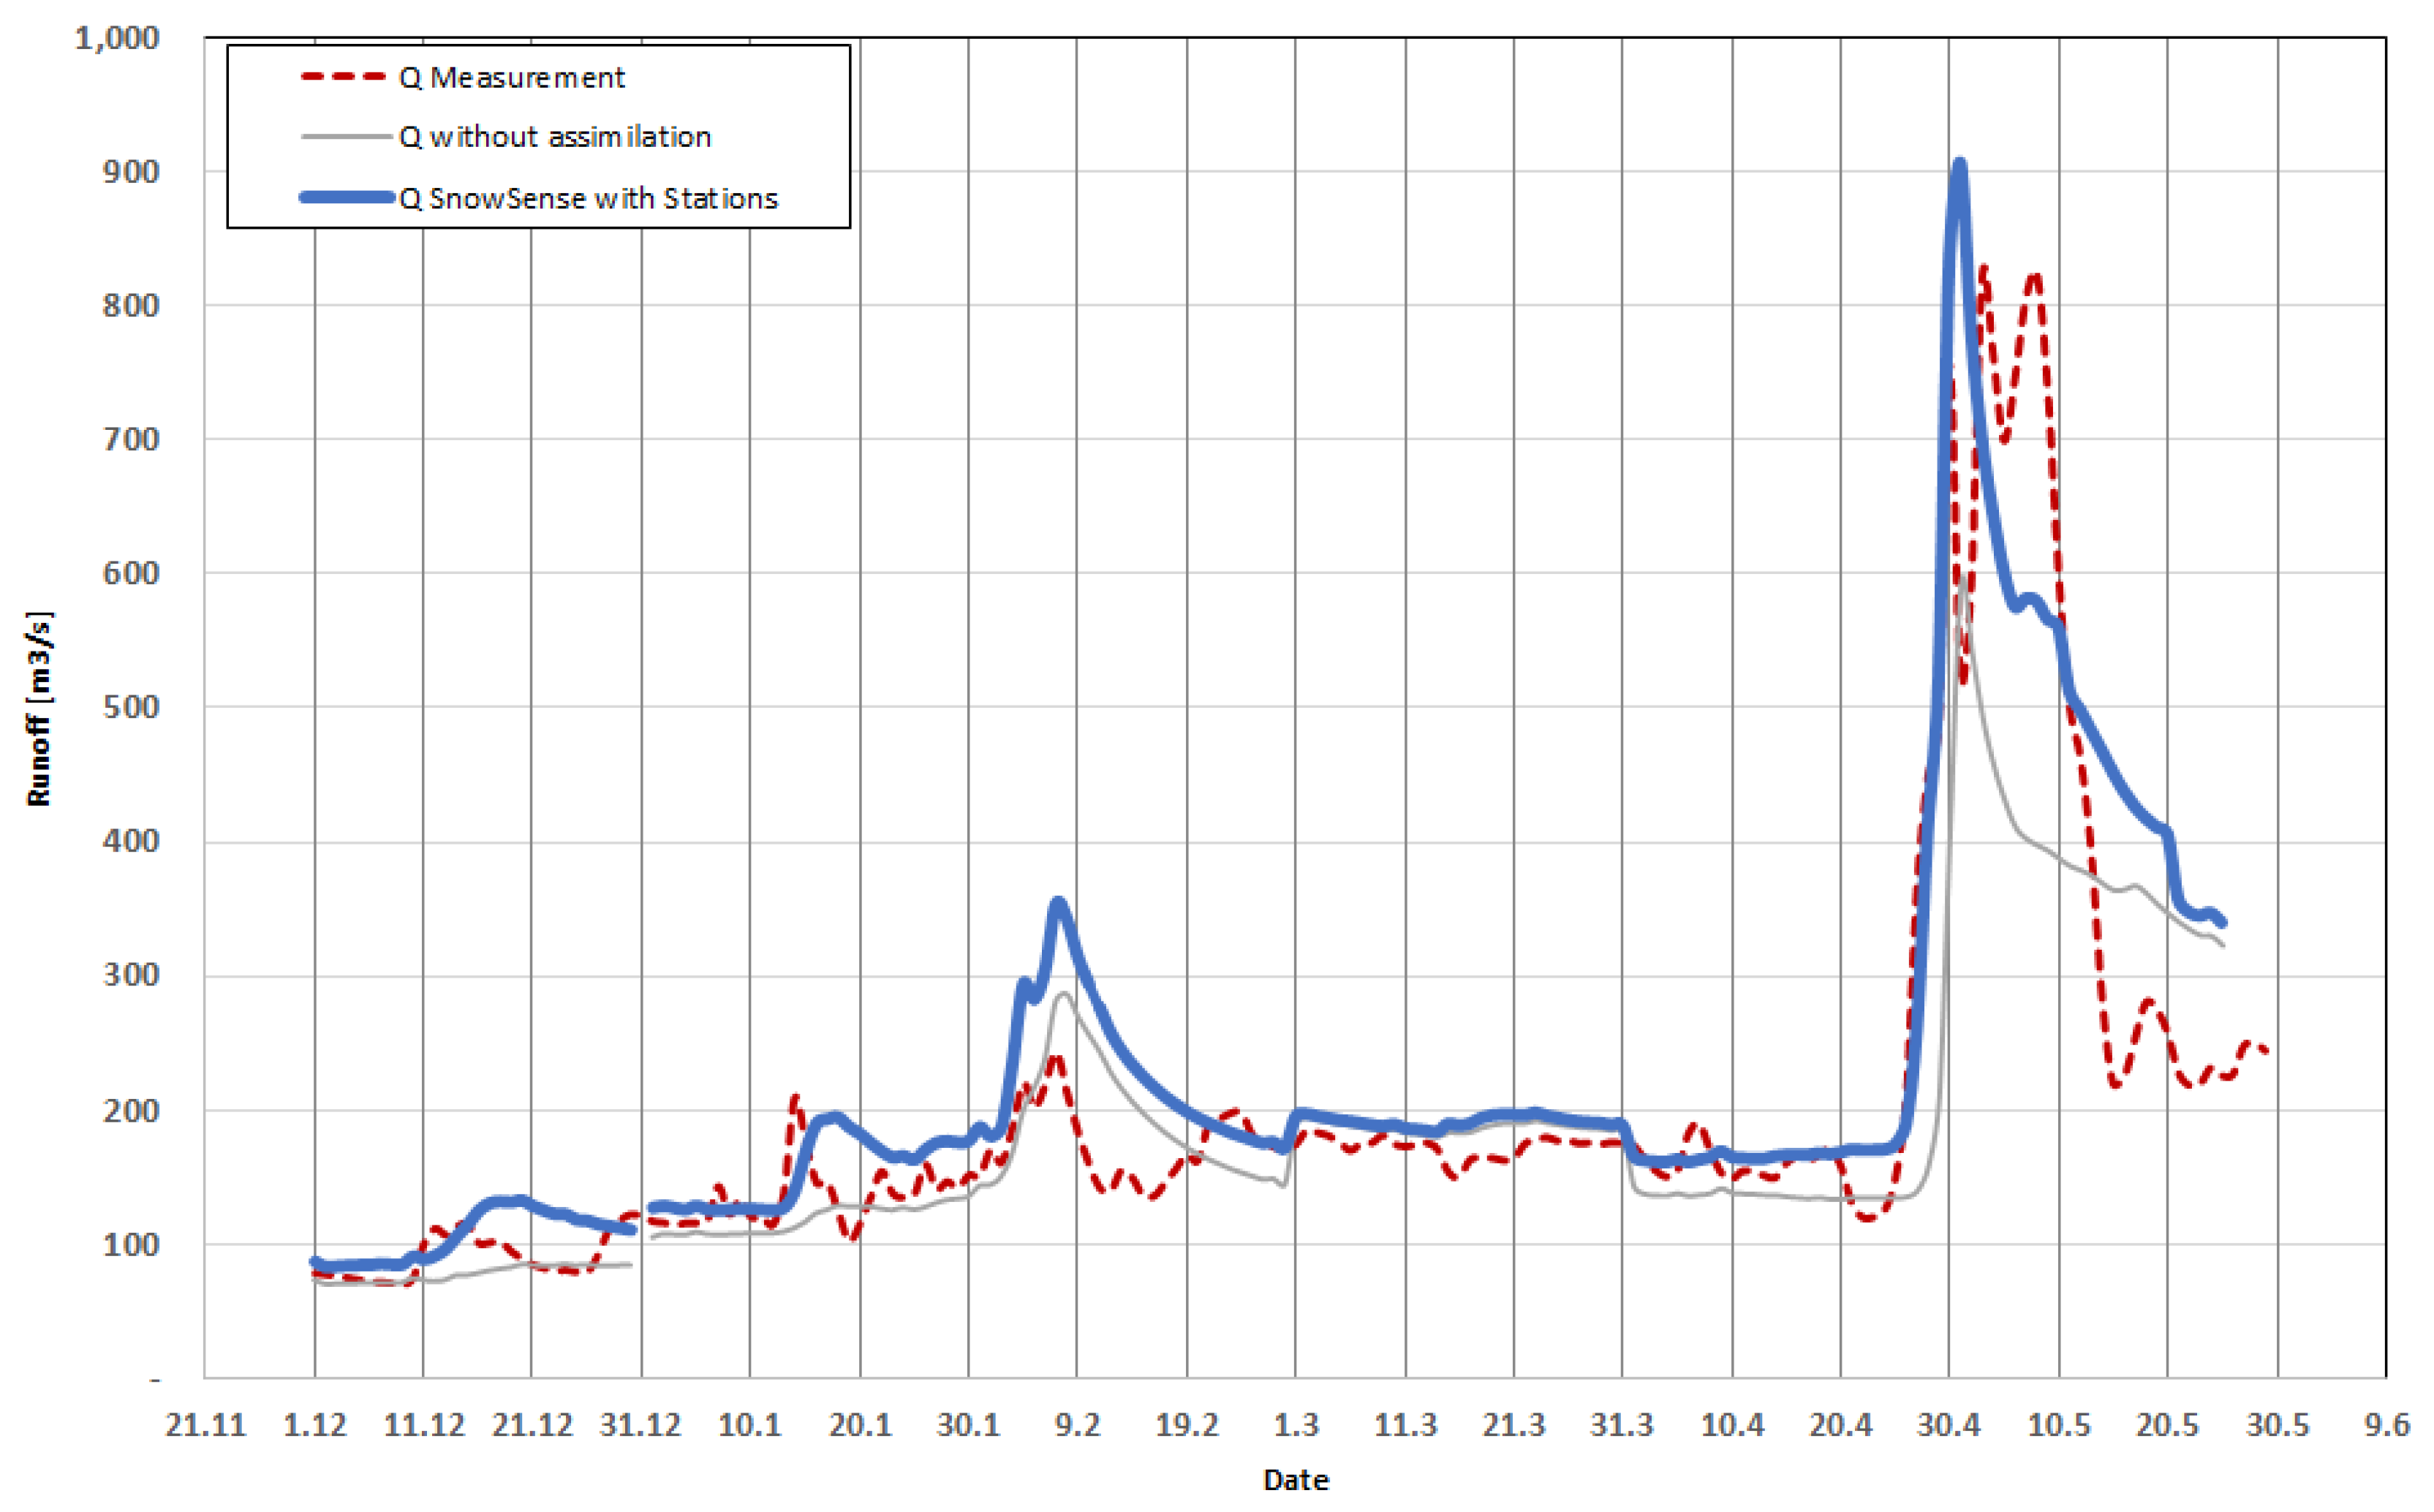
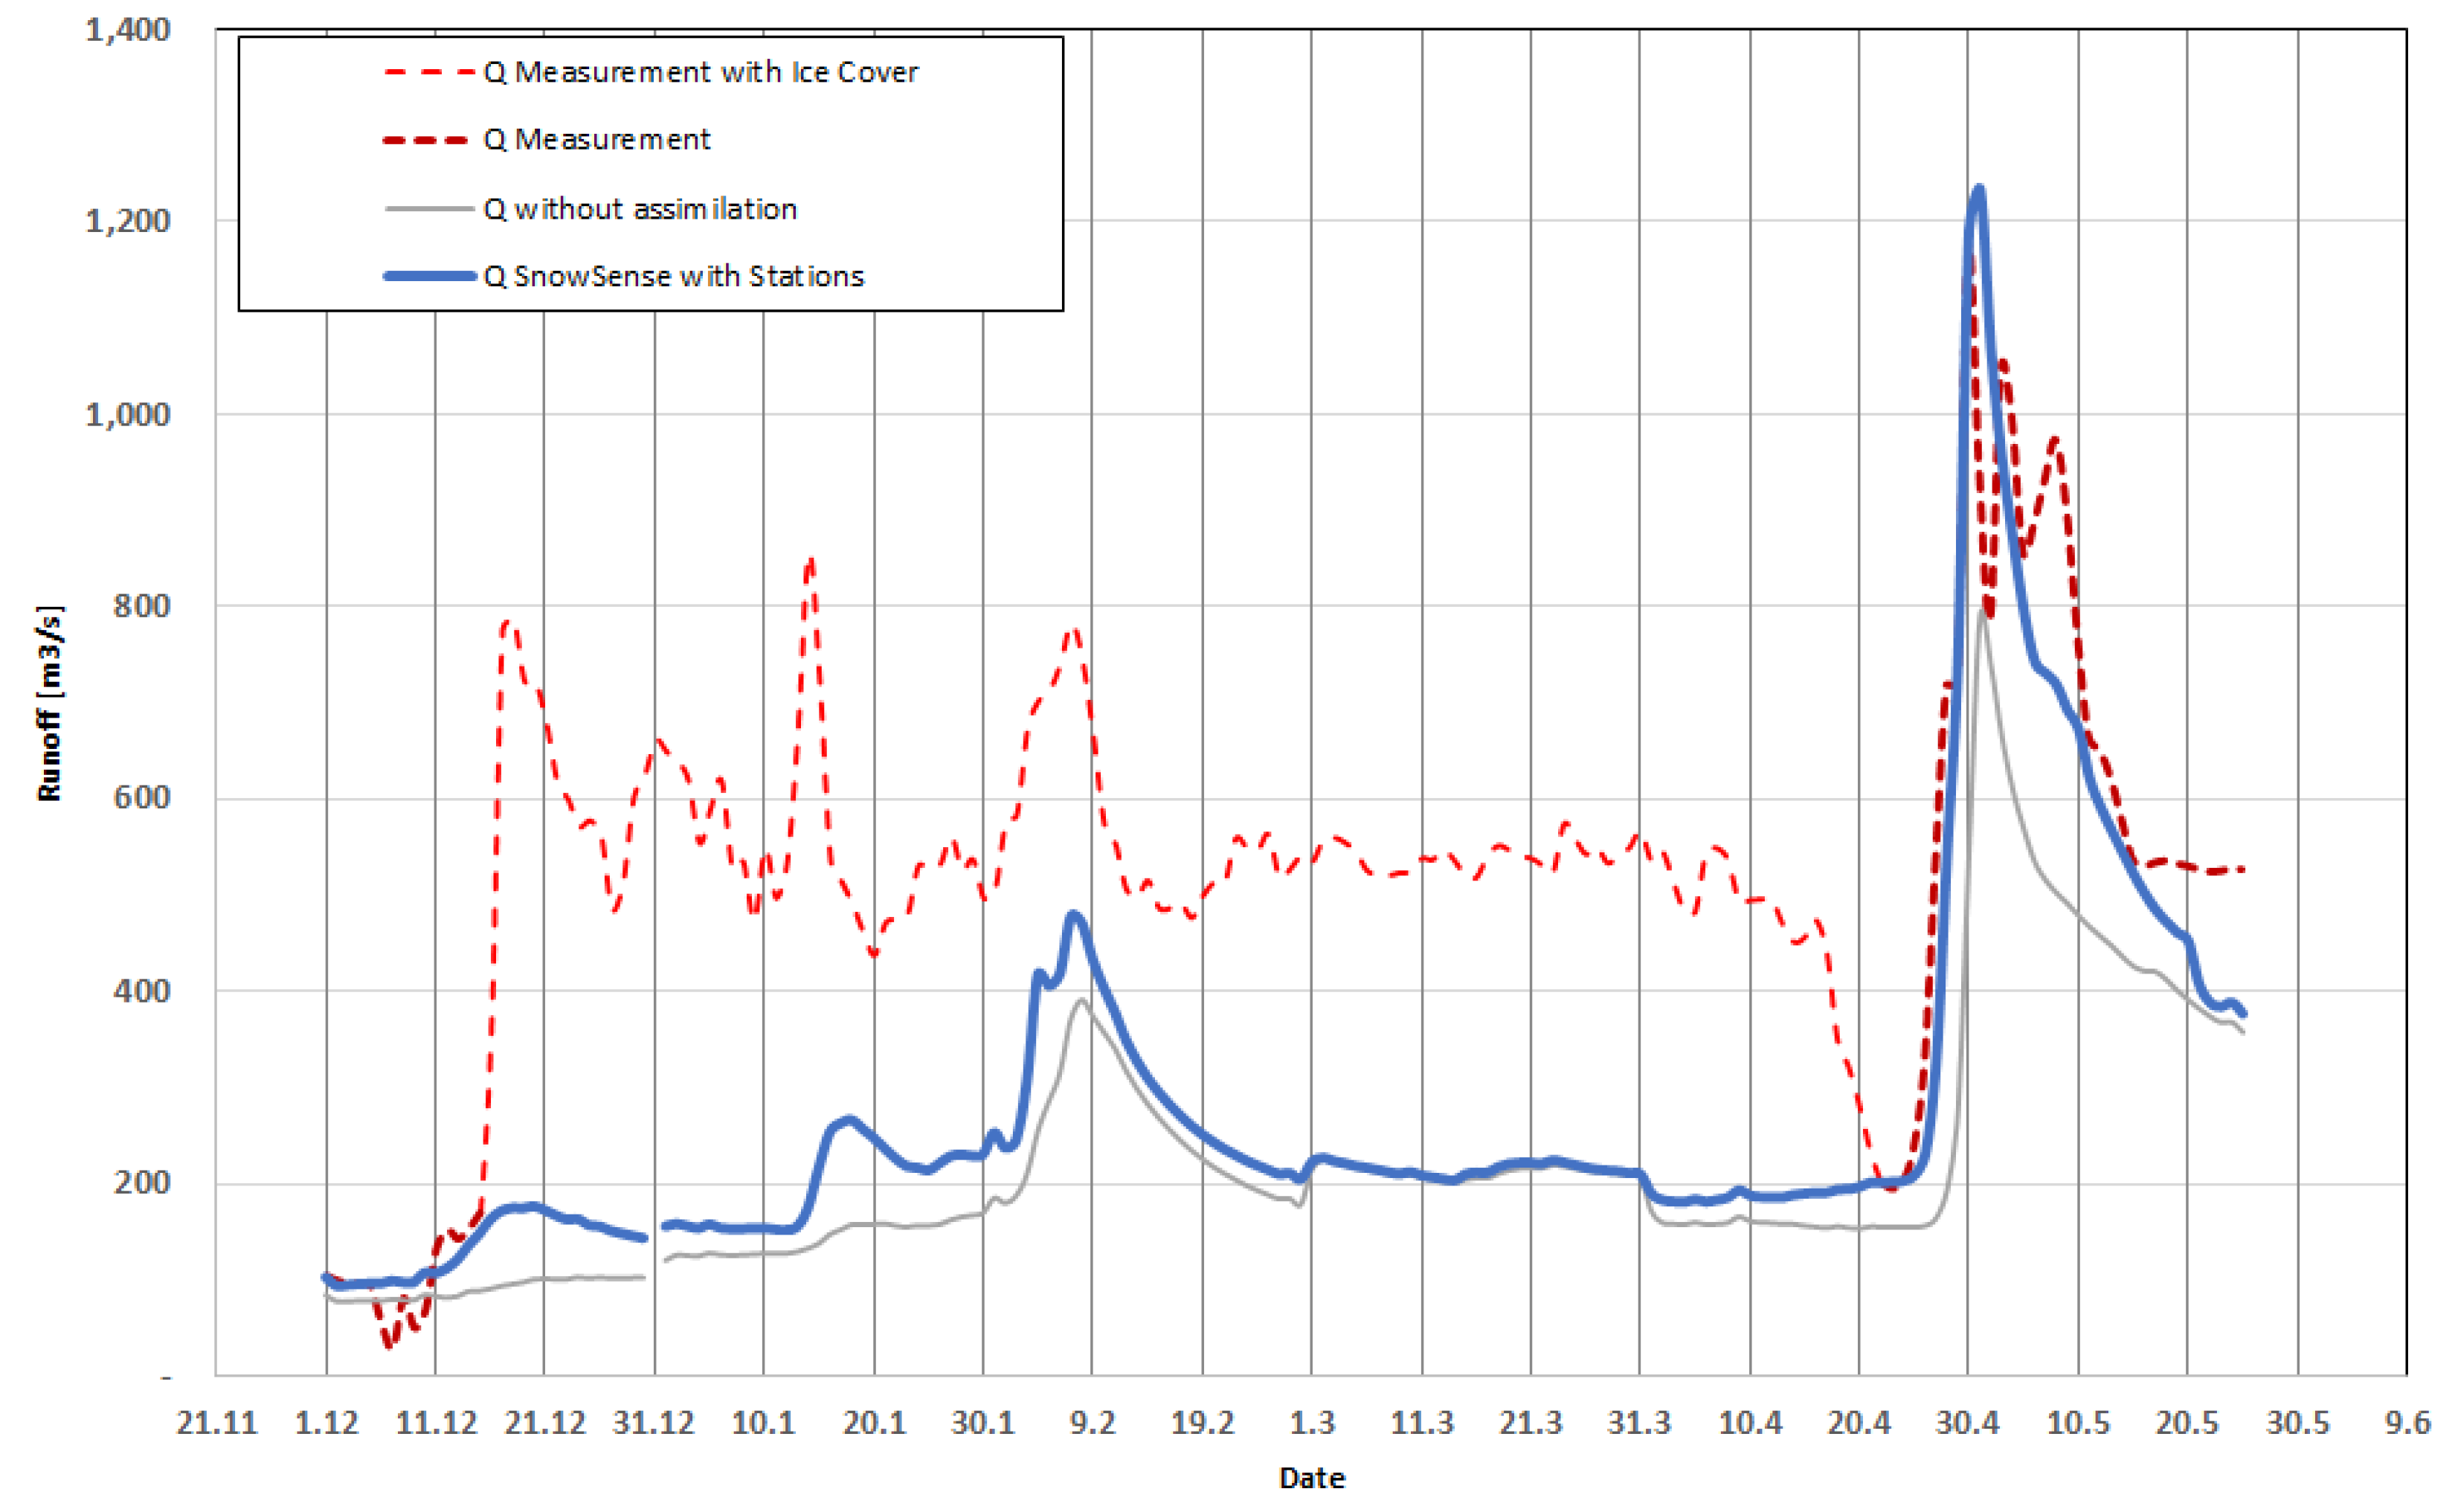
3.2.2. Exploits River

The analyzed run-off results for the down-stream gauges “Below Noel Pauls Brook” and “Charlie Edwards Point” at the Exploits River show a very notable agreement regarding timing and volume with the measured values in the winter season from December 2017–May 2018 (Figure 9 and Figure 10). Due to the strong influence of the controlled water release at Millertown Dam, and the not daily adapted model parameters during the demo, the results are a little below the ones for Humber River. The coefficient of determination (R2) reaches 0.80 at Noel Paul Brook. For the downstream section of the Exploits River, after the conjunction with Badger River, the occurrence of river ice impeded the full evaluation of the results. Within the period of mid-December to late April, the measurement point was affected by ice jams, which resulted in an increased water level and therefore a false determination of the run-off. Due to the thawing in April, the flood peak from the snow melt could be well compared (Figure 10).

3.3. Advantages and Potential Limitations

Regarding the SnowSense in situ station, it is capable of measuring reliably SWE and LWC using freely available GNSS signals and low- cost GNSS sensors. Besides the derivation of SWE and LWC, Koch et al. [8] recently presented an approach to additionally derive snow height, which might even extend the range of application, not only for hydrological targets. A great advantage of the SnowSense in situ station is its light-weight design making an easy transportation and installation possible, which is highly valuable especially for remote and difficult to access areas. In total, only two people are needed for the set-up and all components can be carried in a big backpack. As the stations have an integrated on-board-processing module and satellite communication capabilities, the results can be transmitted (sub-)daily to the users. This makes the station autonomous and guarantees low maintenance. In general, the in situ station can either be used as a stand-alone component for snow cover property determination or can easily be integrated in the entire service encompassing the EO and modelling components.
As GNSS signals are globally available, the application of such in situ stations is potentially possible all over the world. However, a potential restriction of the in situ stations might be the availability of satellite reception in extreme locations, e.g., in narrow alpine valleys or in dense forests, with reduced GNSS signal reception. As presented in Lamm et al. [26], the integration of Galileo satellites besides GPS satellites increases satellite availability markedly, which increases also the availability in potentially difficult areas. Further studies will focus in more detail on, e.g., tilted terrain like avalanche-prone slopes, different climate and altitudinal ranges as well as more challenges on the station design regarding its protection from wildlife or its mounting on top of bare rocks and ice. Until now, we were able to test the GNSS SWE-derivation for quite huge amounts of snow with up to 1000 mm w.e. in high alpine regions [8]. In this study, we reached SWE values of up to 500 mm w.e. However, further studies on even more extreme amounts of snow and especially wet snow will be conducted in the future, as the limited operational time span of the demonstration project did not provide an opportunity to test the sensor performance for such extreme events performance. This is also true for further tests on extreme temperatures for the entire sensor hardware, which is designed for minimum temperatures of −40 C, though temperatures down to −35 C were reached in December 2017 and January 2018 at the NEIGE testsite at Forêt Montmorency (Figure 6b).
Regarding the different SWE measurement techniques applied at the NEIGE study site at Forêt Montmorency, the GMON sensor is based on passive gamma rays, whereas the GNSS based measurements are based on electromagnetic waves. Both techniques are capable of deriving SWE in good accordance with standard measurement techniques like manual measurements or snow pillows [6,8,46]. Of course, slight differences in the derivation of SWE might occur considering these two relatively new sensors, however, as the sensors are not installed at the exact same place and are located up to 25 m from each other and have a distance (up to 150 m) to the manual measurements. The main differences might originate in different amounts of snow at each location, e.g., due to different wind effects and the different physical principles of the measurements.
Regarding the spatially distributed components EO and the hydrological model, it is another big advantage that both can also be potentially used worldwide and are often free of charge as, e.g., the Sentinel data. Of course, remote sensing products might be restricted in temporal and spatial resolution and face, depending on the wavelength and if the systems are active or passive, different limitations as, e.g., cloud cover or foreshortening effects. Therefore, it is often more difficult to apply EO in mountainous terrain. The applied hydrological model PROMET was already tested and validated for various applications for small and large catchments (e.g., [22,32,33,47]) and also globally (e.g., [48]) in different temporal and spatial resolutions. Although there are a few limitations in the model setup like, for example, the difficulty of implementing small-scale features regarding snow variability or the run-off generation in extreme alpine surroundings, the modelled output provides very good results for different scales, also in case of sparse input data as it is the case in Newfoundland. Especially in those remote areas with sparse data, real-time information and forecasts of run-off, fresh water availability, SWE, snow extent and the snowmelt onset can be significantly improved. Up to now, a limitation in our hydrological model setup is the lake ice formation. In general, SWE is calculated from the snow cover on the ground. However, until now, snow accumulation on top of frozen lakes is not implemented, although this SWE also contributes to the run-off after the onset of snow- and ice-melt. Moreover, we aim to describe river ice formation as an additional feature in the model since it can build up to ice dams with a subsequent banking up of water masses. These two model improvements will be implemented in the future, e.g. as suggested in [49,50].
The big advantage of the entire combined SnowSense service is that it picks up the advantages of all three components to deliver a reliable, assimilated product of snow and hydrology. In case data of one component is missing, the service can still rely on two other pillars and is therefore less vulnerable to data losses or other failures. The service can be used as entire combined system relying on the three pillars in situ measurements, EO, and hydrological modelling, but each of these pillars can also be applied as a modular stand-alone solution if desired. It therefore enhances and combines existing solutions and is, due to its modularity, a customer friendly approach.

3.4. Demo User Feedback

The feedback from the two demo users, Nalcor/NL Hydro and the Water Resources Management Division in the Department of Municipal Affairs and Environment (WRMD) of the Government of Newfoundland and Labrador, confirmed the significant importance of snow and run-off monitoring, which could be improved by using such a combined approach like the SnowSense service. They underlined that this is especially important for remote locations, as many regions in Newfoundland are only accessible by helicopter or snowmobiles and face limited access possibilities due to poor weather conditions. From their experience, standard in situ measurements sometimes fail, as the snowpack is often icy with a varying snow density and snow hardness, which makes it difficult to measure SWE with manual snow core equipment. Normally, manual snow surveys are performed three times per winter, which is expensive and is difficult to be completed under bad weather conditions, and causes labour safety risks. Existing automatic instrumentation (GMON sensors) is not providing enough information. The demo users state a need for accurate, reliable SWE information for each hydrological watershed and runoff forecasting that affects the real-time scheduling of hydrological assets and minimizes the use of thermal heat generation. From their point of view, a network of stations across the island of Newfoundland and Labrador would be the ideal scenario to give a province wide estimate of SWE for all users. In addition, they confirmed that SnowSense has the potential to fill a gap regarding the provision of spatial and temporal data at a high resolution by applying EO and modelling for spatial SWE maps of the entire region and run-off information at specific points of interest for real-time and forecasts. The received products matched with other sources of information, which they had for comparison and could even provide insights in hydrological processes. Both users stated that the in situ stations are competitive in their operation compared to other SWE monitoring technologies and therefore they have the potential to replace existing SWE monitoring stations like snow pillows or manual field observations.
In general, the feedback provided by the demo users was very positive, which encourages us in our further developments and improvements.

4. Conclusions

Within the ESA business applications demonstration project SnowSense (2015–2018), we successfully demonstrated a large scale snow hydrological monitoring service, by combining newly developed in situ stations based on signals of the Global Navigation Satellite System (GNSS), Earth Observation (EO) and hydrological modelling. With this combined approach, we present a reliable, and cost-efficient tool for the determination of snow cover properties like snow water equivalent (SWE), snow liquid water content (LWC), snow extent as well as run-off assessment, for real-time and forecast applications.
The GNSS in situ component was successfully applied and validated at the well-equipped study site NEIGE at Forêt Montmorency, Quebec, Canada. Furthermore, the entire SnowSense service providing modelled, in situ-, and EO-assimilated run-off was applied and validated at four run-off gauges within the Humber River and the Exploit River catchments on the island of Newfoundland, Canada.
The entire SnowSense service solution driven with an integrated numerical weather prediction (NWP) model for its application in this study in Newfoundland is capable of providing detailed knowledge on water stored as snow over large spatial scales. It is able to provide real-time and forecasted snow and run-off information and, if desired, also on reservoir status, which might be of great interest for hydropower plant operators. This information, which can be provided in various time steps, e.g., hourly up to daily, is especially needed in regions or catchments where in situ stations are only sparsely or non equipped catchments. The service is applicable at almost any location and was especially designed for remote locations, where access is limited and snow and run-off measurements were difficult up to now.
Within the project, the SnowSense service already reached a market dedicated design, based on the identification of potential customers (i.e., hydropower plants) and use cases (i.e., weather and climate observations, e.g., by national weather services).

Author Contributions

F.A., H.B. and W.M. conceived and developed the project idea; F.K., M.L., P.H. and F.A. were deeply involved in the development of the SnowSense algorithm, hardware development, and model integration; P.K. and H.B. were responsible for the PROMET model setup and the EO data assimilation. F.A. was the SnowSense project manager; F.A., P.H., F.K. and W.M. are involved in the patenting of the algorithm and the hardware; A.R., F.A. and F.K. wrote the paper.

Funding

The project was co-funded by the European Space Agency (ESA, 000113149/14/NL/AD) within the Business Application Demonstration Project SnowSense (2015–2018) (https://artesapps.esa.int/projects/snowsense-dp).

Acknowledgments

We thank the editors for their work and the two anonymous reviewers for their constructive comments. Florian Appel, Franziska Koch, Patrick Henkel, Markus Lamm, Philipp Klug and Anja Rösel were co-funded by the European Space Agency (ESA, 000113149/14/NL/AD) within the Business Application Demonstration Project SnowSense (2015–2018) (https://artesapps.esa.int/projects/snowsense-dp), which is gratefully acknowledged. The authors would like to thank all involved staff members of the demo users Nalcor/NL Hydro and the Department of Municipal Affairs and Environment, Water Resources Management Division (WRMD) of the Government of Newfoundland and Labrador, for their active support to the project, and for providing their run-off data. We thank the staff from University Laval for the opportunity to set up our sensor at the NEIGE site in Forêt Montmorency and for the opportunity to participate in the inter-comparison study. For the developed algorithm for the GNSS-based SWE and LWC determination as well as the invention of the in situ hardware, two patents are pending. SnowSense® is a registered trademark.

Conflicts of Interest

The authors declare no conflict of interest.

References

  1. IPCC. AR5: Climate Change 2013: The Physical Science Basis; Cambridge University Press: Cambridge, UK, 2013. [Google Scholar]
  2. Kinar, N.J.; Pomeroy, J.W. Measurement of the physical properties of the snowpack. Rev. Geophys. 2015, 53, 481–544. [Google Scholar] [CrossRef] [Green Version]
  3. Pirazzini, R.; Leppänen, L.; Picard, G.; Lopez-Moreno, J.I.; Marty, C.; Macelloni, G.; Kontu, A.; von Lerber, A.; Tanis, C.M.; Schneebeli, M.; et al. European In-Situ Snow Measurements: Practices and Purposes. Sensors 2018, 18, 2016. [Google Scholar] [CrossRef] [PubMed]
  4. Johnson, J.B.; Marks, D. The detection and correction of snow water equivalent pressure sensor errors. Hydrol. Process. 2004, 18, 3513–3525. [Google Scholar] [CrossRef]
  5. Desilets, D.; Zreda, M.; Ferre, T.P.A. Nature’s neutron probe: Land surface hydrology at an elusive scale with cosmic rays. Water Resour. Res. 2010, 46. [Google Scholar] [CrossRef]
  6. Choquette, Y.; Lavigne, P.; Nadeau, M.; Ducharme, P.; Martin, J.P.; Houdayer, A.; Rogoza, J. GMON, a new sensor for snow water equivalent via gamma monitoring. In Proceedings of the International Snow Science Workshop, Whistler, BC, Canada, 21–27 September 2008. [Google Scholar]
  7. Smith, C.D.; Kontu, A.; Laffin, R.; Pomeroy, J.W. An assessment of two automated snow water equivalent instruments during the WMO Solid Precipitation Intercomparison Experiment. Cryosphere 2017, 11, 101–116. [Google Scholar] [CrossRef] [Green Version]
  8. Koch, F.; Henkel, P.; Appel, F.; Schmid, L.; Bach, H.; Lamm, M.; Prasch, M.; Schweizer, J.; Mauser, W. Retrieval of snow water equivalent, liquid water content and snow height of dry and wet snow by combining GPS signal attenuation and time delay. Water Resour. Res. 2018. submitted. [Google Scholar]
  9. Larson, K.; Gutmann, E.; Zavorotny, V.; Braun, J.; Williams, M.; Nievinski, F. Can we measure snow depth with GPS receivers? Geophys. Res. Lett. 2009, 36, L17502. [Google Scholar] [CrossRef]
  10. Koch, F.; Prasch, M.; Schmid, L.; Schweizer, J.; Mauser, W. Measuring Snow Liquid Water Content with Low-Cost GPS Receivers. Sensors 2014, 14, 20975–20999. [Google Scholar] [CrossRef] [PubMed] [Green Version]
  11. Henkel, P.; Koch, F.; Appel, F.; Bach, H.; Prasch, M.; Schmid, L.; Schweizer, J.; Mauser, W. Snow Water Equivalent of Dry Snow Derived From GNSS Carrier Phases. IEEE Trans. Geosci. Remote Sens. 2018, 56, 3561–3572. [Google Scholar] [CrossRef]
  12. Steiner, L.; Meindl, M.; Fierz, C.; Geiger, A. An assessment of sub-snow GPS for quantification of snow water equivalent. Cryosphere 2018, 12, 3161–3175. [Google Scholar] [CrossRef]
  13. Hall, D. Remote Sensing of Ice and Snow; Springer: New York, NY, USA, 2012. [Google Scholar]
  14. Tedesco, M. Remote Sensing of the Cryosphere; Wiley: Hoboken, NJ, USA, 2014. [Google Scholar]
  15. Malenovsky, Z.; Rott, H.; Cihlar, J.; Schaepman, M.E.; Garcia-Santos, G.; Fernandes, R.; Berger, M. Sentinels for science: Potential of Sentinel-1, -2, and -3 missions for scientific observations of ocean, cryosphere, and land. Remote Sens. Environ. 2012, 120, 91–101. [Google Scholar] [CrossRef]
  16. Hall, D.K.; Riggs, G.A.; Salomonson, V.V.; DiGirolamo, N.E.; Bayr, K.J. MODIS snow-cover products. Remote Sens. Environ. 2002, 83, 181–194. [Google Scholar] [CrossRef] [Green Version]
  17. Lopez, P.; Sirguey, P.; Arnaud, Y.; Pouyaud, B.; Chevallier, P. Snow cover monitoring in the Northern Patagonia Icefield using MODIS satellite images (2000–2006). Glob. Planet. Chang. 2008, 61, 103–116. [Google Scholar] [CrossRef]
  18. Sirguey, P.; Mathieu, R.; Arnaud, Y. Subpixel monitoring of the seasonal snow cover with MODIS at 250 m spatial resolution in the Southern Alps of New Zealand: Methodology and accuracy assessment. Remote Sens. Environ. 2009, 113, 160–181. [Google Scholar] [CrossRef]
  19. Kim, E.; Gatabe, C.; Hall, D.; Newlin, J.; Misakonis, A.; Elder, K.; Marshall, H.P.; Hiemstra, C.; Brucker, L.; De Marco, E.; et al. Overview of SnowEx Year 1 Activities. In Proceedings of the SnowEx Workshop, Longmont, CO, USA, 8–10 August 2017; Available online: https://ntrs.nasa.gov/search.jsp?R=20170007518 (accessed on 9 January 2019).
  20. Cline, D.W.; Bales, R.C.; Dozier, J. Estimating the spatial distribution of snow in mountain basins using remote sensing and energy balance modeling. Water Resour. Res. 1998, 34, 1275–1285. [Google Scholar] [CrossRef] [Green Version]
  21. Immerzeel, W.; Droogers, P.; de Jong, S.; Bierkens, M. Large-scale monitoring of snow cover and runoff simulation in Himalayan river basins using remote sensing. Remote Sens. Environ. 2009, 113, 40–49. [Google Scholar] [CrossRef]
  22. Mauser, W.; Bach, H. PROMET–Large scale distributed hydrological modelling to study the impact of climate change on the water flows of mountain watersheds. J. Hydrol. 2009, 376, 362–377. [Google Scholar] [CrossRef]
  23. Banfield, C.E.; Jacobs, J.D. Regional Patterns of Temperature and Precipitation for Newfoundland and Labrador during the past Century. Can. Geogr. 1998, 42, 354–364. [Google Scholar] [CrossRef]
  24. Environment Canada. The Climate of Newfoundland. Available online: http://atlantic-web1.ns.ec.gc.ca/climatecentre/default.asp?lang=En&n=83846147-1 (accessed on 9 January 2019).
  25. Bobba, A.G.; Lam, D.C.L.; Kay, D.; Ullah, W. Interfacing a hydrological model with the RAISON expert system. Water Resour. Manag. 1992, 6, 25–34. [Google Scholar] [CrossRef]
  26. Lamm, M.; Koch, F.; Appel, F.; Henkel, P. Estimation of Snow Parameters with GPS and Galileo. In Proceedings of the International Symposium ELMAR, Zadar, Croatia, 16–19 September 2018. [Google Scholar]
  27. European Space Agency (ESA). SENTINEL-1 SAR User Guide. Available online: https://sentinel.esa.int/web/sentinel/user-guides/sentinel-1-sar (accessed on 9 January 2019).
  28. Appel, F.; Bach, H.; Heege, T.; de la Mar, J.; Siegert, F.; Rücker, G. APPS4GMES–Development of operational products and services for GMES a bavarian initiative. In Proceedings of the ESA Living Planet Symposium, Edinburgh, UK, 9–13 September 2013. [Google Scholar]
  29. Appel, F.; Bach, H.; Loew, A.; Ludwig, R.; Mauser, W. Monitoring and Modeling of the Snow Cover Dynamic in Southern Germany-Capabilities of Optical and Microwave Remote Sensing. In Proceedings of the 25th Annual Symposium of the European Association of Remote Sensing Laboratories (EARSeL), Porto, Portugal, 6–11 June 2005. [Google Scholar]
  30. Nagler, T.; Rott, H. Retrieval of wet snow by means of multitemporal SAR data. IEEE Trans. Geosci. Remote Sens. 2000, 38, 754–765. [Google Scholar] [CrossRef]
  31. Mauser, W.; Schädlich, S. Modelling the spatial distribution of evapotranspiration on different scales using remote sensing data. J. Hydrol. 1998, 212–213, 250–267. [Google Scholar] [CrossRef]
  32. Ludwig, R.; Mauser, W. Modelling catchment hydrology within a GIS based SVAT-model framework. Hydrol. Earth Syst. Sci. 2000, 4, 239–249. [Google Scholar] [CrossRef] [Green Version]
  33. Strasser, U.; Mauser, W. Modelling the spatial and temporal variations of the water balance for the Weser catchment 1965–1994. J. Hydrol. 2001, 254, 199–214. [Google Scholar] [CrossRef]
  34. Nachtergaele, F.; van Velthuizen, H.; Verelst, L. Harmonized World Soil Database. In Proceedings of the 19th World Congress of Soil Science, Soil Solutions for a Changing World, Brisbane, Australia, 1–6 August 2010. [Google Scholar]
  35. Zabel, F.; Mauser, W. 2-way coupling the hydrological land surface model PROMET with the regional climate model MM5. Hydrol. Earth Syst. Sci. 2013, 17, 1705–1714. [Google Scholar] [CrossRef] [Green Version]
  36. Government of Canada. HRDPS Data in GRIB2 Format. Available online: https://weather.gc.ca/grib/grib2_HRDPS_HR_e.html (accessed on 9 January 2019).
  37. Andreadis, K.M.; Lettenmaier, D.P. Assimilating remotely sensed snow observations into a macroscale hydrology model. Adv. Water Resour. 2006, 29, 872–886. [Google Scholar] [CrossRef]
  38. Nagler, T.; Rott, H.; Malcher, P.; Müller, F. Assimilation of meteorological and remote sensing data for snowmelt runoff forecasting. Remote Sens. Environ. 2008, 112, 1408–1420. [Google Scholar] [CrossRef]
  39. Magnusson, J.; Gustafsson, D.; Hüsler, F.; Jonas, T. Assimilation of point SWE data into a distributed snow cover model comparing two contrasting methods. Water Resour. Res. 2014, 50, 7816–7835. [Google Scholar] [CrossRef] [Green Version]
  40. Sensoy, A.; Schwanenberg, D.; Sorman, A.; Akkol, B.; Montero, R.; Uysal, G. Assimilating H-SAF and MODIS Snow Cover Data into the Conceptual Models HBV and SRM. In Proceedings of the Conference on EGU, Vienna, Austria, 27 April–2 May 2014. [Google Scholar]
  41. Jörg-Hess, S.; Griessinger, N.; Zappa, M. Probabilistic Forecasts of Snow Water Equivalent and Runoff in Mountainous Areas. J. Hydrometeorol. 2015, 16, 2169–2186. [Google Scholar] [CrossRef]
  42. Helmert, J.; Sensoy Sorman, A.; Alvarado Montero, R.; De Michele, C.; de Rosnay, P.; Dumont, M.; Finger, D.C.; Lange, M.; Picard, G.; Potopova, V.; et al. Review of Snow Data Assimilation Methods for Hydrological, Land Surface, Meteorological and Climate Models: Results from a COST HarmoSnow Survey. Geosciences 2018, 8, 489. [Google Scholar] [CrossRef]
  43. Appel, F.; Bach, H.; Ohl, N.; Mauser, W. Provision Of Snow Water Equivalent From Satellite Data and the Hydrological Model PROMET Using Data Assimilation Techniques. In Proceedings of the IGARSS 2007 International Geoscience and Remote Sensing Symposium, Barcelona, Spain, 23–28 July 2007. [Google Scholar]
  44. Wright, M.; Kavanaugh, J.; Labine, C. Performance Analysis of GMON3 Snow Water Equivalency Sensor. In Proceedings of the 79th Annual Western Snow Conference, Stateline, NV, USA, 18–21 April 2011. [Google Scholar]
  45. Schmid, L.; Koch, F.; Heilig, A.; Prasch, M.; Eisen, O.; Mauser, W.; Schweizer, J. A novel sensor combination (upGPR-GPS) to continuously and nondestructively derive snow cover properties. Geophys. Res. Lett. 2015, 42, 3397–3405. [Google Scholar] [CrossRef] [Green Version]
  46. Choquette, Y.; Ducharme, P.; Rogoza, J. CS725, an accurate sensor for the snow water equivalent and soil moisture measurements. In Proceedings of the International Snow Science Workshop, Grenoble, France, 7–11 October 2013; pp. 931–936. [Google Scholar]
  47. Mauser, W.; Klepper, G.; Zabel, F.; Delzeit, R.; Hank, T.; Putzenlechner, B.; Calzadilla, A. Global biomass production potentials exceed expected future demand without the need for cropland expansion. Nat. Commun. 2015, 6, 8946. [Google Scholar] [CrossRef] [PubMed]
  48. Mauser, W.; Prasch, M. Regional Assessment of Global Change Impacts: The Project GLOWA-Danube; Springer: New York, NY, USA, 2015. [Google Scholar]
  49. Lindenschmidt, K.E.; Sydor, M.; Carson, R.W. Modelling ice cover formation of a lake–river system with exceptionally high flows (Lake St. Martin and Dauphin River, Manitoba). Cold Reg. Sci. Technol. 2012, 82, 36–48. [Google Scholar] [CrossRef]
  50. Shen, H.T. Mathematical modeling of river ice processes. Cold Reg. Sci. Technol. 2010, 62, 3–13. [Google Scholar] [CrossRef]
Figure 1. The modular concept of SnowSense, integrating satellite technologies like Global Navigation Satellite System (GNSS), satellite communication and Earth Observation (EO) as the basis for a service.
Geosciences 09 00044 g001
Figure 2. Overview on locations of SnowSense in situ stations (red triangles) and run-off stations (purple diamonds), within the Humber, Exploits, and Gander catchments in Newfoundland, Canada. Catchments are outlined with a red line. The locations of the two existing snow water equvalent (SWE) stations are indicated as black dots. The background shows the modelled SWE, which was assimilated by in situ stations and Earth Observation (EO) for the 15 March 2018.
Geosciences 09 00044 g002
Figure 3. (a) demo suitcase with the applied low-cost LEA-M8T GPS receivers (u-blox, Thalwil, Switzerland), u-blox patch antennas and a small microcontroller and data storage; (b) examples of GPS antennas of GPS1 mounted at a pole and of GPS2 laid out on the ground before snowfall; (c) example of a SnowSense station including a mast system, a self-supplied power management (solar panels on top), a processing unit (including battery pack), and a communication module installed near Millertown, Newfoundland, Canada. GPS1 and the communication antenna are mounted at the top of the mast and GPS2 is covered by snow.
Geosciences 09 00044 g003
Figure 4. (a) Sentinel-1 IW mode composite for the Island of Newfoundland for 30 April 2017; (b) derived map of wet snow area (blue) from Sentinel-1 data.
Geosciences 09 00044 g004
Figure 5. (a) daily GNSS-derived SWE and LWC values at the Forêt Montmorency NEIGE site 2017/2018; (b) daily GNSS-derived SWE values and reference measurements from two GMON CS725 sensors and manual snow pit measurements of mean, minima and maxima SWE at the Forêt Montmorency NEIGE site.
Geosciences 09 00044 g005
Figure 6. Daily GNSS-derived LWC values at the Forêt Montmorency NEIGE site for the winter season 2017/2018 related to (a) rain and snowfall events and (b) air temperature development. Temperature and precipitation measurements were conducted at the close-by provincial and federal station sites.
Geosciences 09 00044 g006
Figure 7. Daily run-off results from PROMET without (grey), with assimilation (blue) of stations and EO against the values (dashed red) measured at Humber Village (catchment: 7600 km2) for the winter season 2017/18.
Geosciences 09 00044 g007
Figure 8. Daily run-off results from PROMET without (grey), with assimilation (blue) of stations and EO against the values (dashed red) measured at Reidville (catchment: 2100 km2) for the winter season 2017/18.
Geosciences 09 00044 g008
Figure 9. Daily run-off results from PROMET without (grey), with assimilation (blue) of stations and EO against the values (dashed red) measured at Noel Pauls Brook (catchment: 7400 km2) for the winter season 2017/18.
Geosciences 09 00044 g009
Figure 10. Daily run-off results from PROMET without (grey), with assimilation (blue) of stations and EO against the values (dashed red) measured at Charlie Edwards Point (catchment: 8850 km2) for the winter season 2017/18. Due to river ice for the period mid-December to late April, the measurements have been separated into measurements with ice cover (normal dashed line) and without (bold dashed line).
Geosciences 09 00044 g010
Table 1. Statistical comparison of SWE derived by GNSS, two GMON sensors (CS725_K and CS725_TL), and manual snow pits on a weekly basis at the NEIGE testsite at Forêt Montmorency.
RMSE [mm w.e.]R2
GMON CS725_K, manual71.940.71
GMON CS725_TL, manual91.380.15
GMON CS725_K, GNSS35.890.93
GMON CS725_TL, GNSS68.220.53
manual, GNSS65.980.64

