Article

Adsorption of Pb and Cu from Aqueous Solutions by Raw and Heat-Treated Attapulgite Clay

1
Department of Geology & Geoenvironment, National and Kapodistrian University of Athens, Panepistimiopolis Zographou, 15784 Athens, Greece
2
Edafomichaniki S.A., Em. Papadaki 19, N. Iraklio, 14121 Athens, Greece
*
Author to whom correspondence should be addressed.
Geosciences 2018, 8(5), 157; https://doi.org/10.3390/geosciences8050157
Submission received: 31 March 2018 / Revised: 21 April 2018 / Accepted: 25 April 2018 / Published: 27 April 2018

Abstract

:
The main objective of the present study is the investigation of the adsorption efficiency of raw and heat-treated attapulgite clay for removing Pb and Cu from aqueous solutions. The removal of each metal was studied separately with the use of one-substance solutions. The effect of certain factors, including solution pH and ionic strength, contact time, adsorbent concentration, temperature of treatment of the adsorbent, and initial metal concentration, was studied. In alkaline conditions, pH > 8.0, precipitation of Pb(OH)2 and Cu(OH)2 takes place, whereas at pH range 4.0–8.0 removal of metals is probably due to adsorption processes. Metal removal increases by 20% for Pb and by 80% for Cu with the increase of attapulgite content from 2 g·L−1 to 15 g·L−1. The removal of metals decreases with increasing solution ionic strength due to competition of Na with Pb and Cu for the available sites. Significant changes in the adsorption capacity of the used attapulgite clay occur after calcination in temperatures >550 °C due to destruction of the crystal lattice of the material and nano-porosity change. Finally, Pb adsorption is described well by both Langmuir and Freundlich isotherm models. According to the Langmuir model, the maximum adsorption capacity for Pb is 30 mg·g−1 and 4.41 mg·g−1 for Cu. The Freundlich model fitted better the experimental data of Cu.

1. Introduction

The presence of potentially high concentrations of toxic elements in water and soil poses risks to ecosystems and human health. High concentrations of such toxic elements occur in mining areas, in agricultural areas due to the excessive use of pesticides and herbicides, and in industrial areas due to uncontrolled waste disposal. The mobility of each metal in the environment depends on several factors affecting its toxicity and bioavailability. Many natural materials including clay minerals have been investigated for their ability to adsorb toxic trace elements, in the context of protecting the environment and human health. Such materials are efficient and cost-effective solutions, which can easily be used for remediation purposes [1,2,3]. Due to the high toxicity of Pb and Cu as trace metal contaminants in the environment, many studies have focused on their interaction with such adsorbents. Pb and Cu retention is usually attributed to ion exchange or specific adsorption (either outer-sphere or inner-sphere complexation) on silicates, metal oxide- hydroxides, and organic matter [4]. Adsorption and complexation occur rapidly, whereas ion exchange reactions of the solute with cations can be rapid or very slow.
Attapulgite (palygorskite) [(Mg,Al)4(Si)8(O,OH,H2O)26·nH2O] is a crystalline hydrated magnesium aluminum silicate mineral with a fibrous morphology and with a structure consisting of parallel ribbons of 2:1 layers that gives its unusual colloidal and sorptive properties. Its structure tends to be dioctahedral–trioctahedral, and it is characterized by high viscosity, high surface area, moderate layer charge, and a large number of silanol groups on its surface as a result of its inverted structure. Attapulgite also contains many structural hydroxyl groups (such as Al–OH and Mg–OH). The active sorption sites on attapulgite structure can be (a) oxygen ions on the tetrahedral sheet of the ribbons, (b) water molecules coordinated to Mg ions at the edges of structural ribbons, and (c) SiOH groups along the fiber axis [5]. The sorption properties of attapulgite clay are attributed to its unique fibrous structure, as well as its highly specific surface area. The ion exchange capacity of attapulgite clay is quite low, and it is estimated to be between 5 meq/100 g and 30 meq/100 g [6]. Furthermore, attapulgite can retain water up to 200% of its own weight [7] and contains three kinds of water at room temperature: (1) adsorbed water on the mineral surface by physical effect; (2) zeolitic water, weakly bound in micro-channels; and (3) crystalline structural water tightly bound by completing the coordination of the (Mg,Al) cations of each octahedral sheet [8,9].
During the last decade, attapulgite has been extensively investigated as an adsorbent for the removal of metal ions and organic pollutants from solutions, e.g., [3,10] and contaminated soil [11,12]. However, most of these studies have demonstrated the usefulness of raw attapulgite clay for environmental applications, whereas there is still a gap in knowledge, with only a few studies concerning the effectiveness of this promising clay material after heat treatment [13]. Within such a framework, the aim of the present study is to investigate and compare the adsorption efficiency of raw and heat-treated attapulgite clay in adsorbing Pb and Cu from aqueous solutions and to examine the effect of different factors including pH, ionic strength, contact time, adsorbent concentration, and initial metal ion concentration on the adsorption process. All of the above are considered within the frame of analytical and modeling uncertainty of experimental results.

2. Materials and Methods

The natural attapulgite clay (AH) used in this study was quarried in the area of Grevena, Greece and was supplied by Geohellas S.A. The clay was grinded in a laboratory ball mill to achieve a homogenous grain size sample of <63 μm. The chemical composition of the adsorbent was determined at ACME Analytical Labs, Canada by X-ray fluorescence (XRF) after fusion with LiBO2 (Table 1). The specific surface area of attapulgite sample was 120 m2·g−1, measured by the single point BET N2 adsorption method, and the ion exchange capacity was 25 meq/100 g, measured by the ammonium acetate method. The heat treated attapulgite micro-powder was calcined in muffle at 130 °C, 330 °C, 500 °C, and 800 °C for 4 h and then cooled to room temperature in a desiccator. The mineralogical composition of raw and heat-treated attapulgite clay was determined by powder X ray diffraction (P-XRD) using a Siemens D5005 X-ray diffractometer, applying Cu Ka radiation at 40 kV and 40 nA, in 0.020° steps at 1.0 step intervals. A surface topography study and microanalysis of free, carbon-coated surfaces of clay grains before and after interaction with the ion solutions was performed by scanning electron microscopy (SEM-EDS) with a JEOL JSM-5600 instrument equipped with an automated energy dispersive analysis system (ISIS 300 OXFORD), with the following operating conditions: accelerating voltage of 20 kV, beam current of 0.5 nA, time of measurement of 50 s, and beam diameter of 1–2 μm. All analysis was performed in the Laboratory of Economic Geology and Geochemistry, National and Kapodistrian University of Athens.
For the adsorption experiments, stock aqueous solutions were prepared by dissolving appropriate amounts of analytical reagent grade Pb(NO3)2 and Cu(NO3)2·3H2O in distilled water. The adsorption experiments were conducted at the following conditions : initial Pb and Cu concentration at 50 mg·L−1, attapulgite dose at 10 g·L−1 for Pb and 15 g·L−1 for Cu, temperature at 22 °C for Pb and for Cu, and pH 4.0 and contact time 2 h. All adsorption experiments were carried out by mixing known amounts of adsorbent with 50 mL of aqueous solution. The doses of 10 g/L and 15 g/L of attapulgite used in the subsequent isotherm experiments for Pb and Cu, respectively, were chosen according to the experimental results of effect of adsorbent dose on adsorption capacity.
The comparative study of Pb and Cu adsorption efficiency of heat-treated and raw material was performed for adsorbent quantities of 2 to 15 g·L−1. The effect of pH on adsorption efficiency was also evaluated for different pH values of initial solution ranging between 2.0 and 12.0. The effect of ionic strength was studied by varying the concentration of NaNO3 salt in solution from 0 mol·L−1 to 0.5 mol·L−1. In addition, adsorption of Pb and Cu on attapulgite was studied for different contact times (5, 30, 60, 90, and 120 min). Finally, adsorption isotherm experiments of Pb and Cu on attapulgite were tested for different initial concentrations of Pb and Cu (25–1500 mg·L−1).
All experiments were carried out in a chamber set at 22 °C. The adjustment of solution pH was achieved by adding 0.1N NaOH or 0.1N HNO3. The solutions were shaken in conical flasks using magnetic stirrers for 2 h to reach equilibrium at constant temperature of 22 °C. Finally, the flasks were withdrawn from the shaker, and the suspensions were filtered to remove the attapulgite clay using a 0.45 μm pore filter. The filtered solutions were analyzed by flame atomic absorption spectrometry (F-AAS) to measure the residual ion concentration. All experiments have been carried out in triplicate at the Laboratory of Economic Geology and Geochemistry, National and Kapodistrian University of Athens, Greece.
The percentage of Pb and Cu removal from aqueous solution was calculated according to the following equation:
Sorption   % = ( C o C e ) C o × 100
in which Co (mg·L−1) is the initial concentration of Pb and Cu in the solution and Ce (mg·L−1) the equilibrium concentration of Pb and Cu in the solution, while the adsorption capacity of Pb and Cu was calculated through the following equation:
q e = ( C o C e ) × V m
in which qe (mg·g−1) is the adsorption capacity of Pb and Cu on adsorbent, Co (mg·L−1) is the initial concentration of Pb and Cu, Ce (mg·L−1) is the equilibrium concentration in solution, m is the mass of adsorbent used (g), and V is the volume of Pb and Cu solution (L).

3. Results

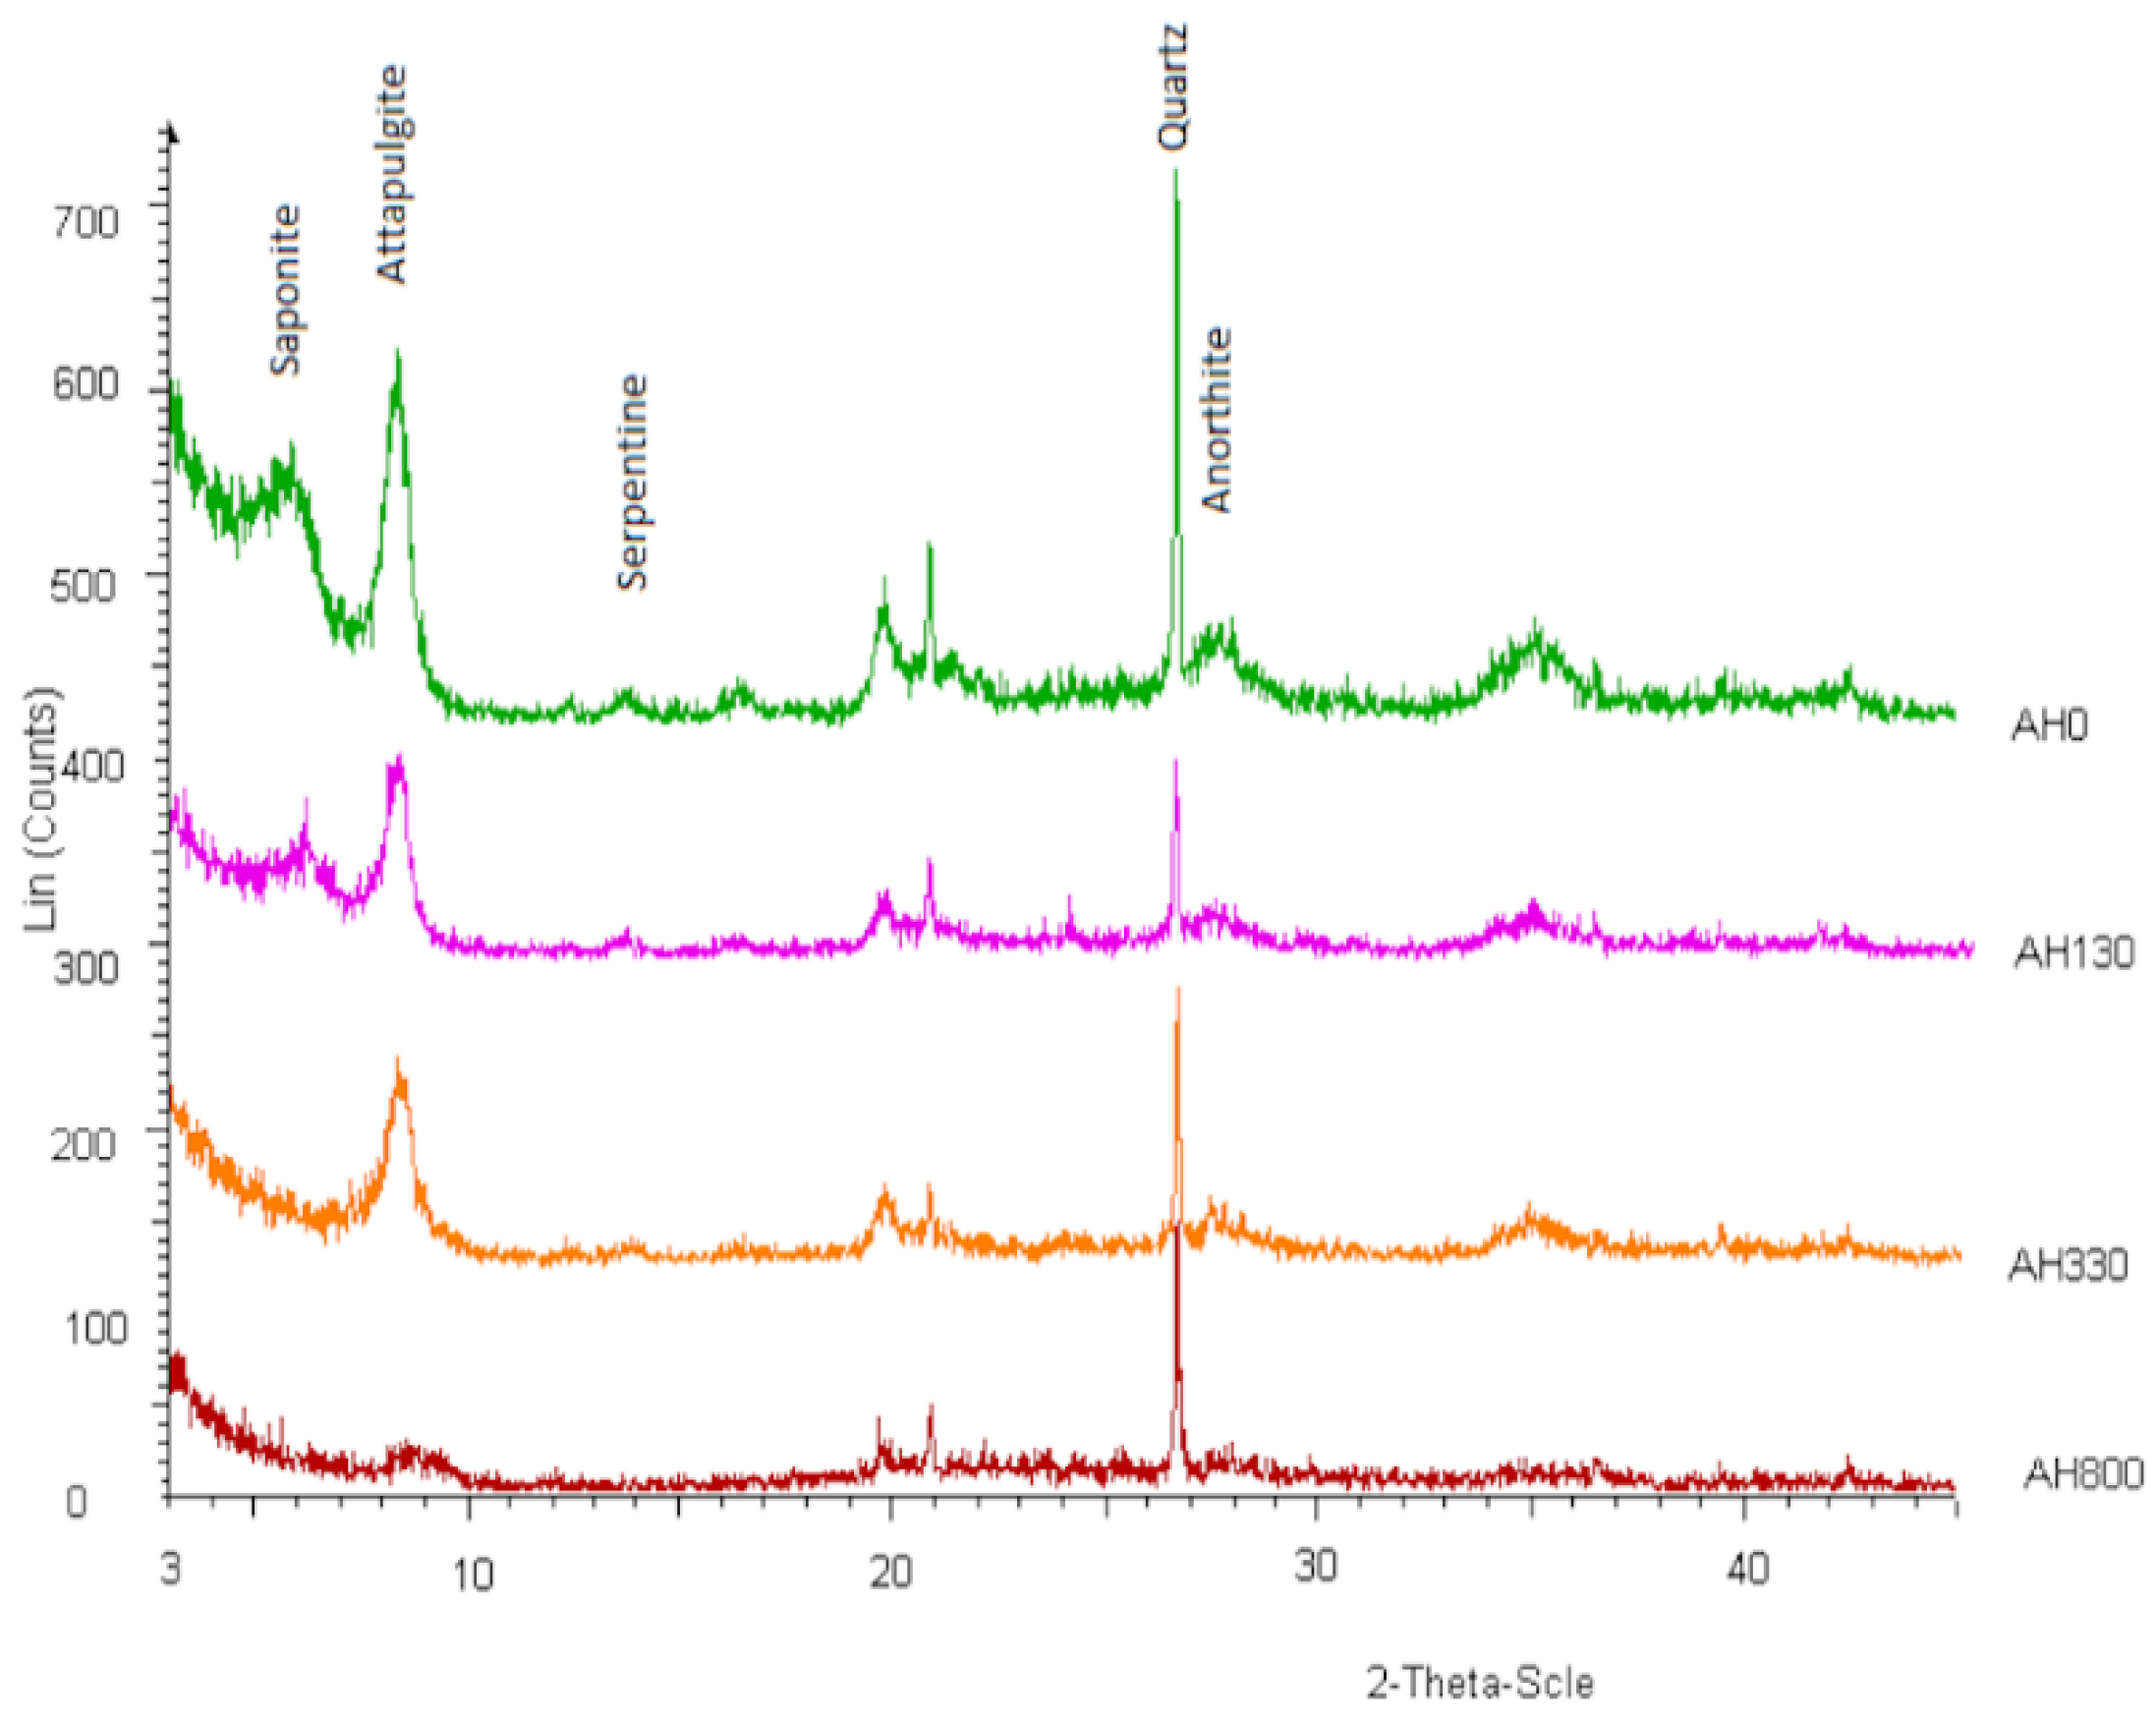
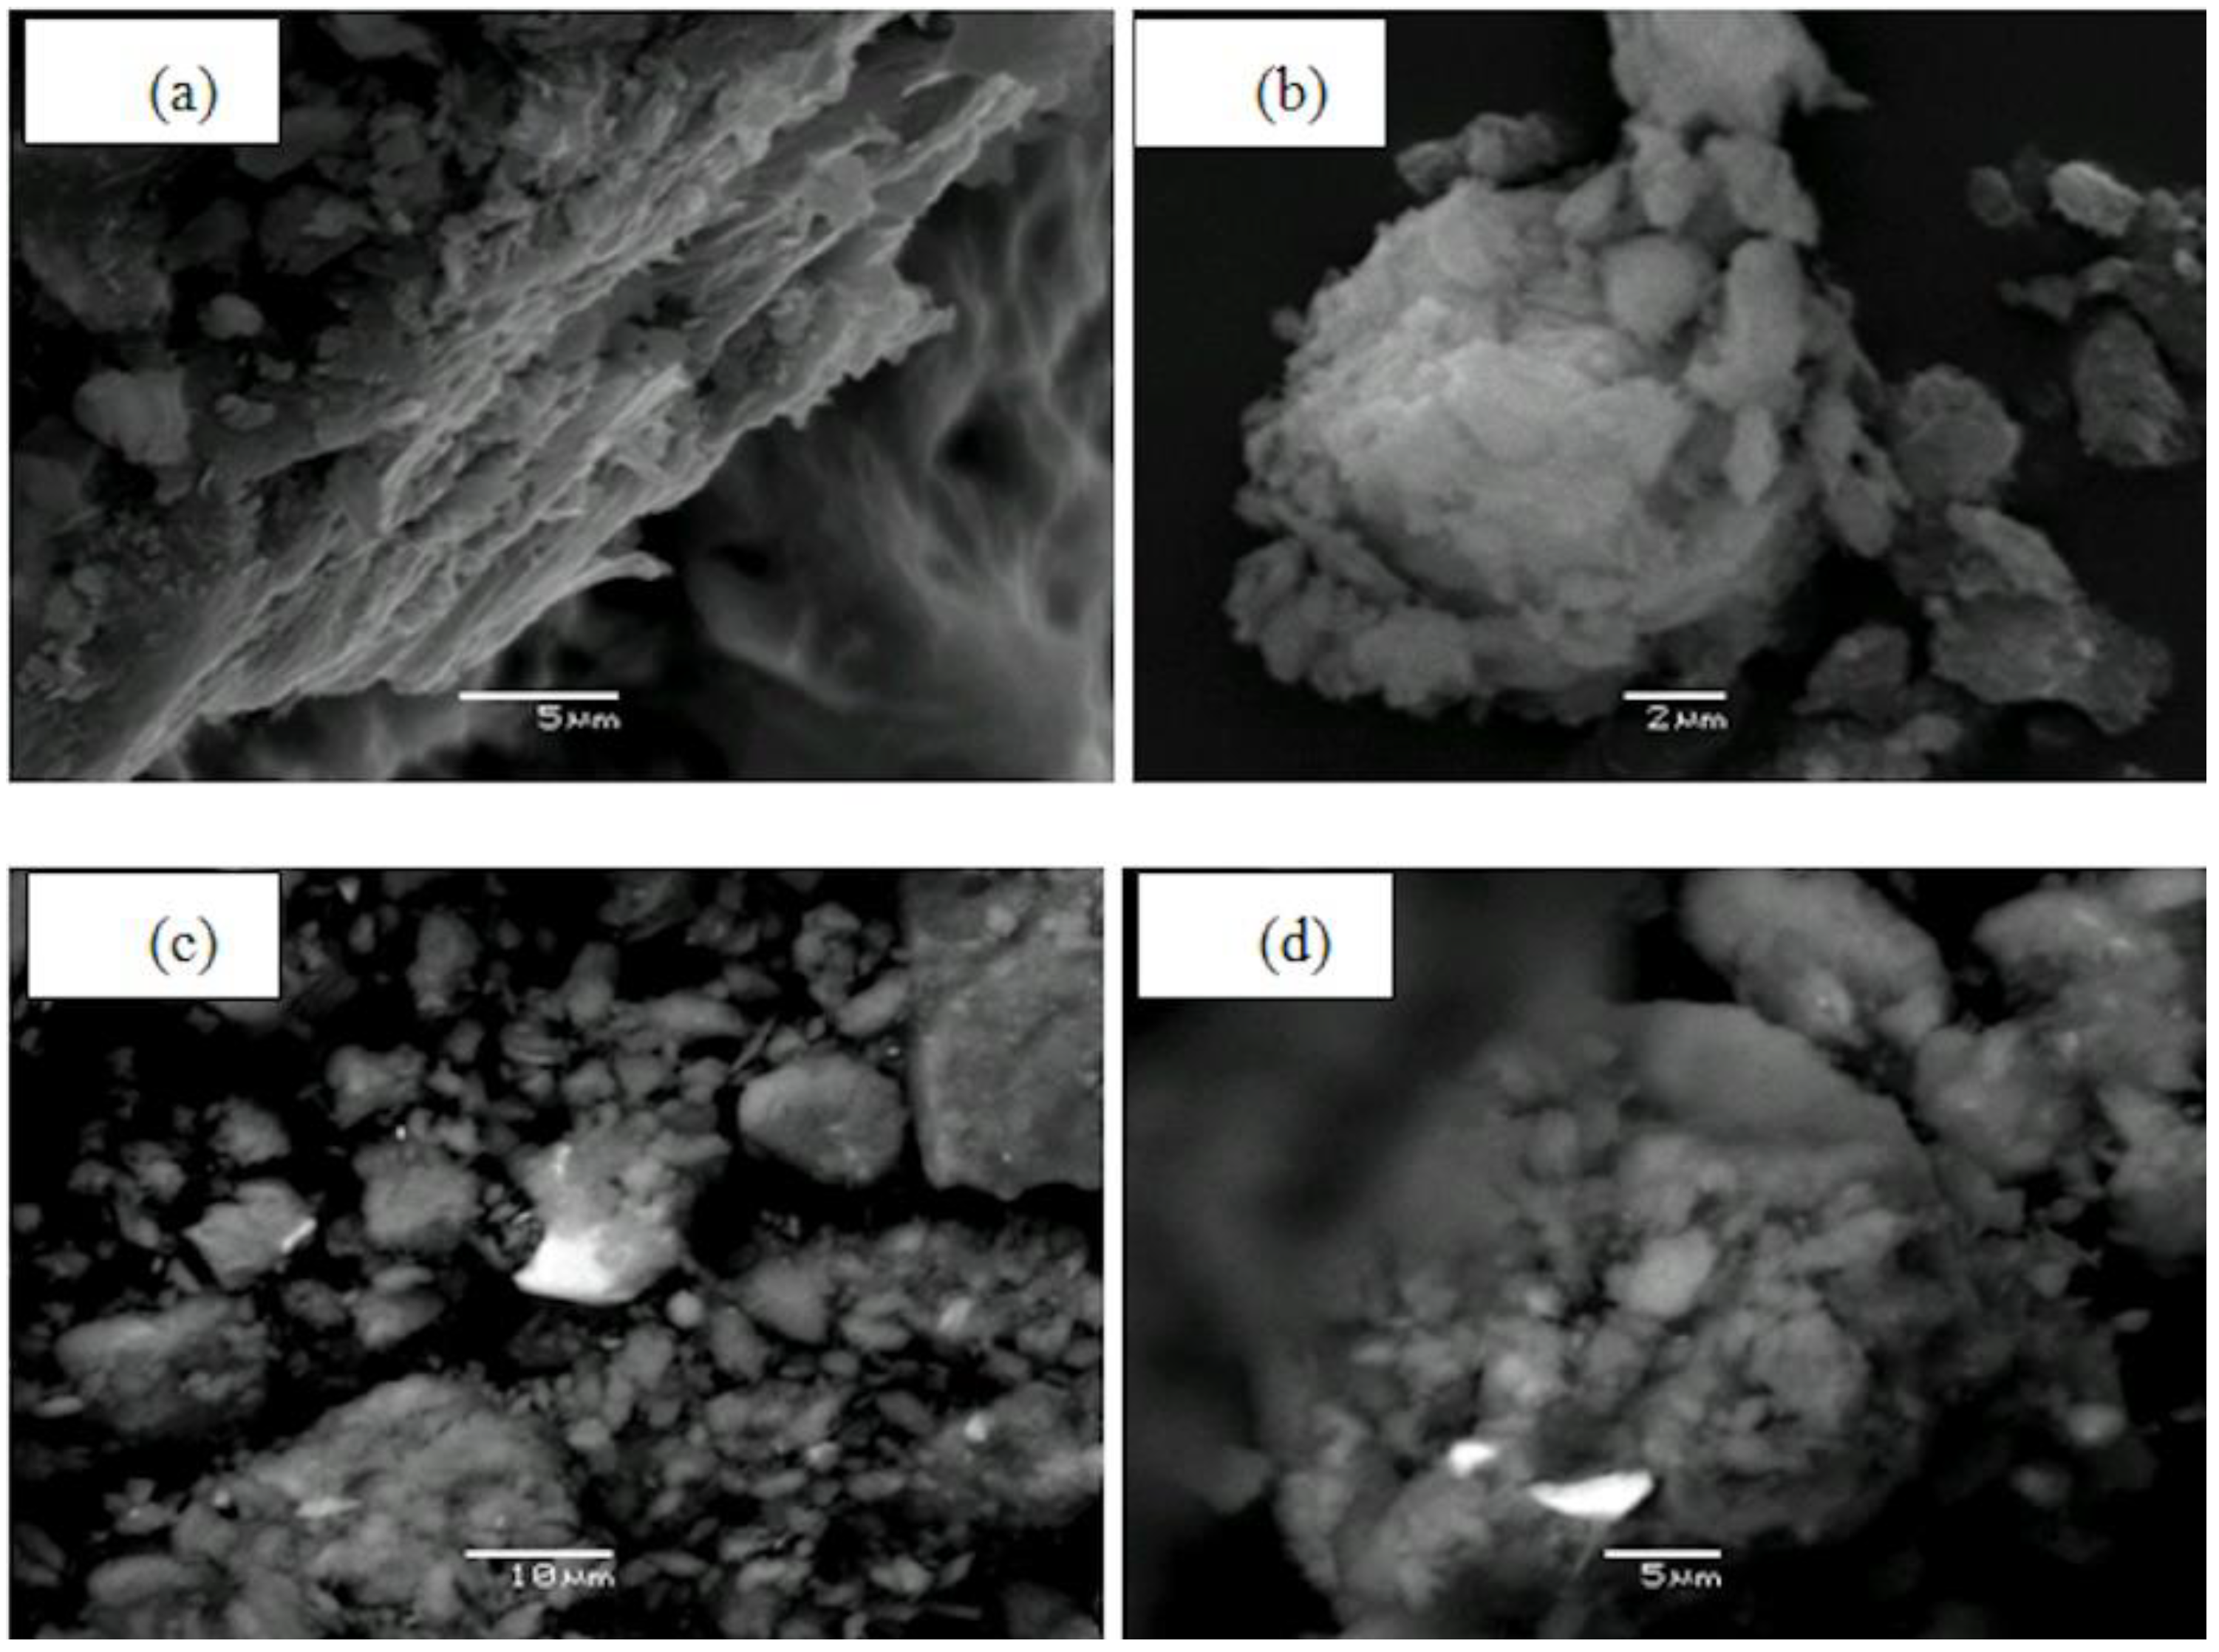
3.1. Mineralogical Composition of Raw and Heat-Treated Clay

The XRD diagrams of raw (AH0) and heat-treated attapulgite clay are presented in Figure 1. There is an obvious difference between the mineralogical composition of raw and heat-treated material. The main minerals of raw material are attapulgite and quartz with minor amounts of anorthite, saponite, and serpentine. A significant decrease in the peak counts of saponite is observed with the increase of temperature to 130 °C. At 330 °C and above, only the peaks of attapulgite and quartz were observed. The comparative XRD graphs indicate the collapse of the crystal lattice of Mg-smectite during heat treatment from the temperature of 330 °C, while attapulgite retains its crystallinity to much higher temperatures and only gets destructed when temperature reaches 800 °C.
SEM analysis of the clay revealed that there are no fibrous minerals present at 2 μm scale, and hence attapulgite is characterized as cryptocrystalline with high micro-porosity (Figure 2a,b). In addition, EDS microanalysis of clay particles after interaction with metal ion solutions showed metal enrichment. In some cases, precipitation of metal, probably as hydroxide, occurs at the surface of attapulgite grains (Figure 2c,d). Bright areas in correspond to Pb-rich precipitates after interaction with 1500 mg·L−1 Pb solution. Concerning Cu, no precipitates have been identified with SEM analysis, and this is indicative of the different behavior of the two elements.

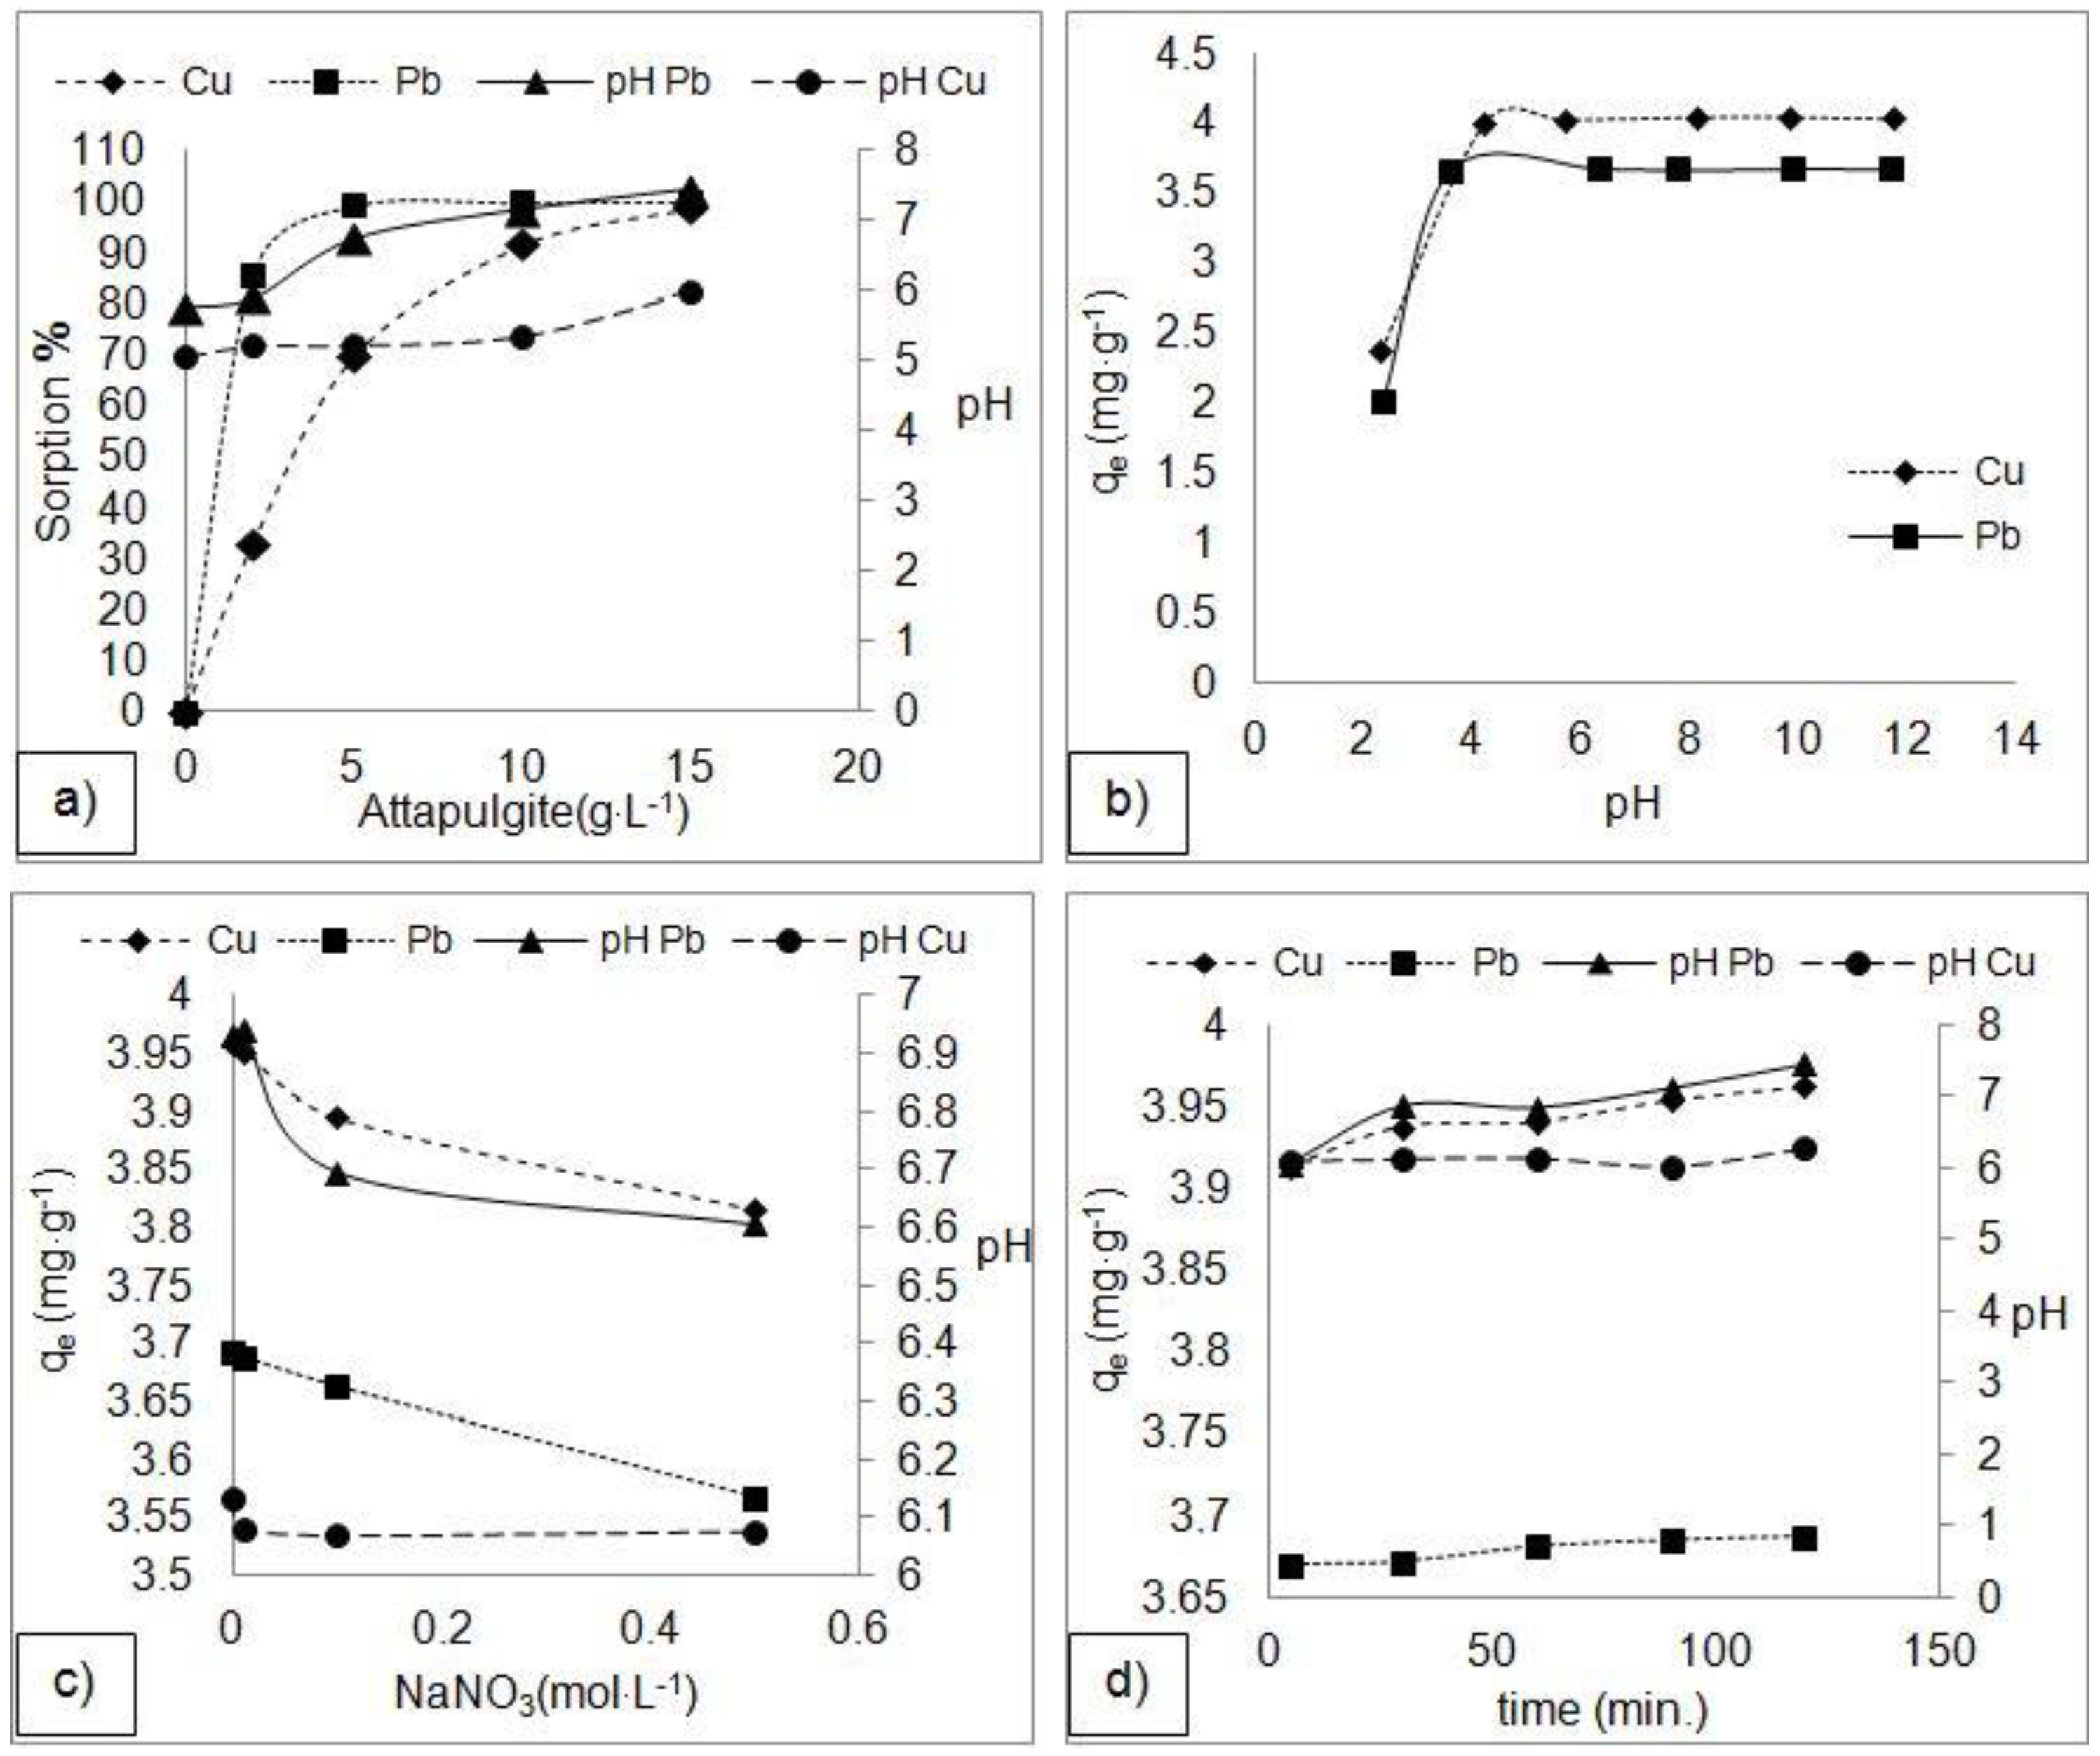
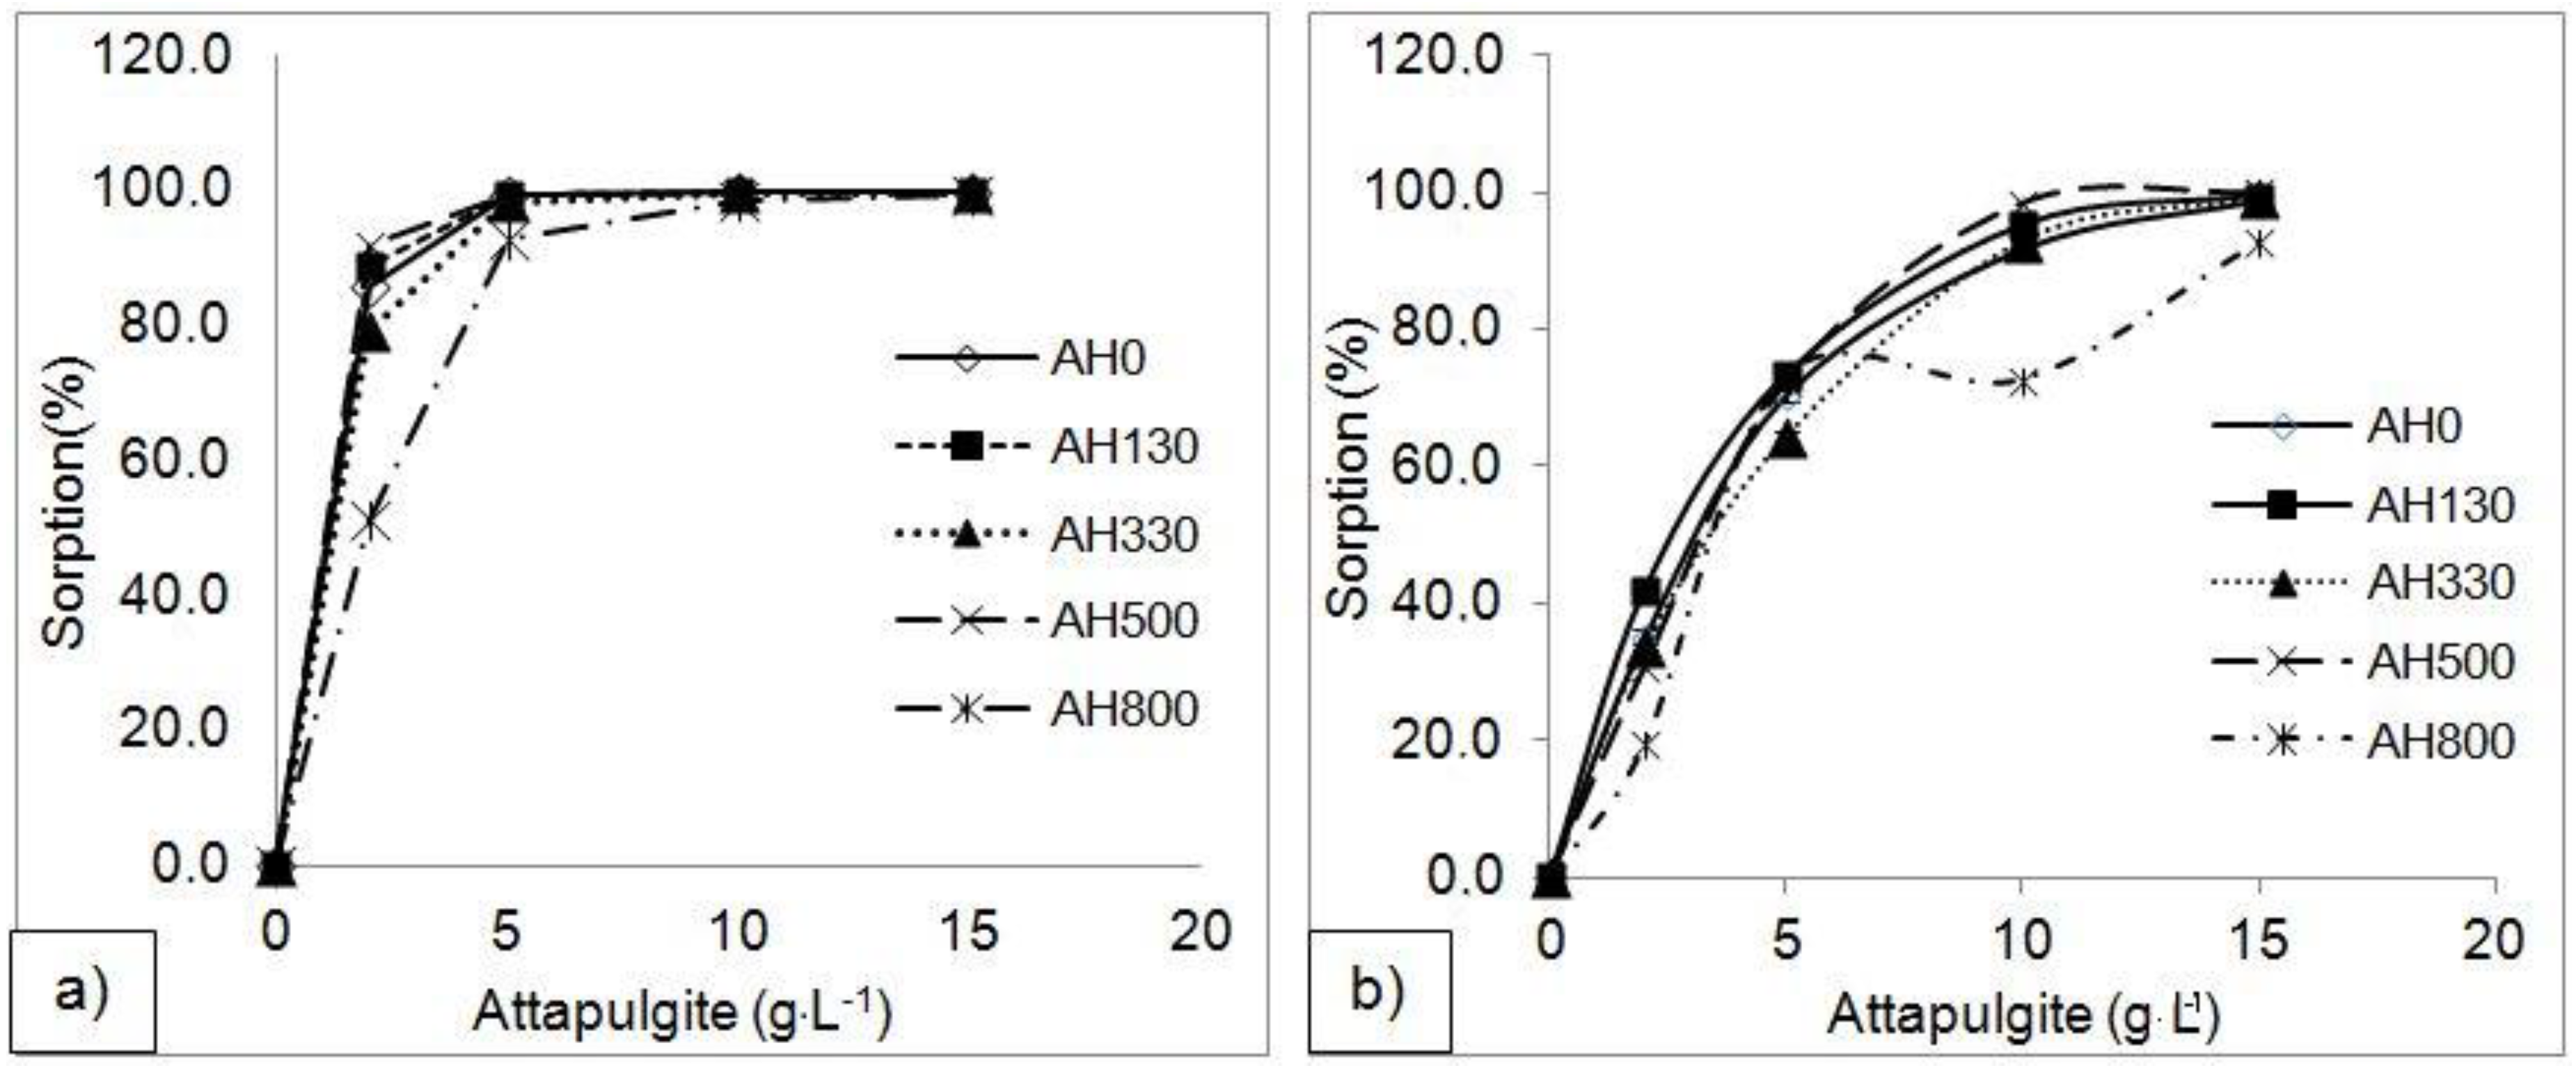
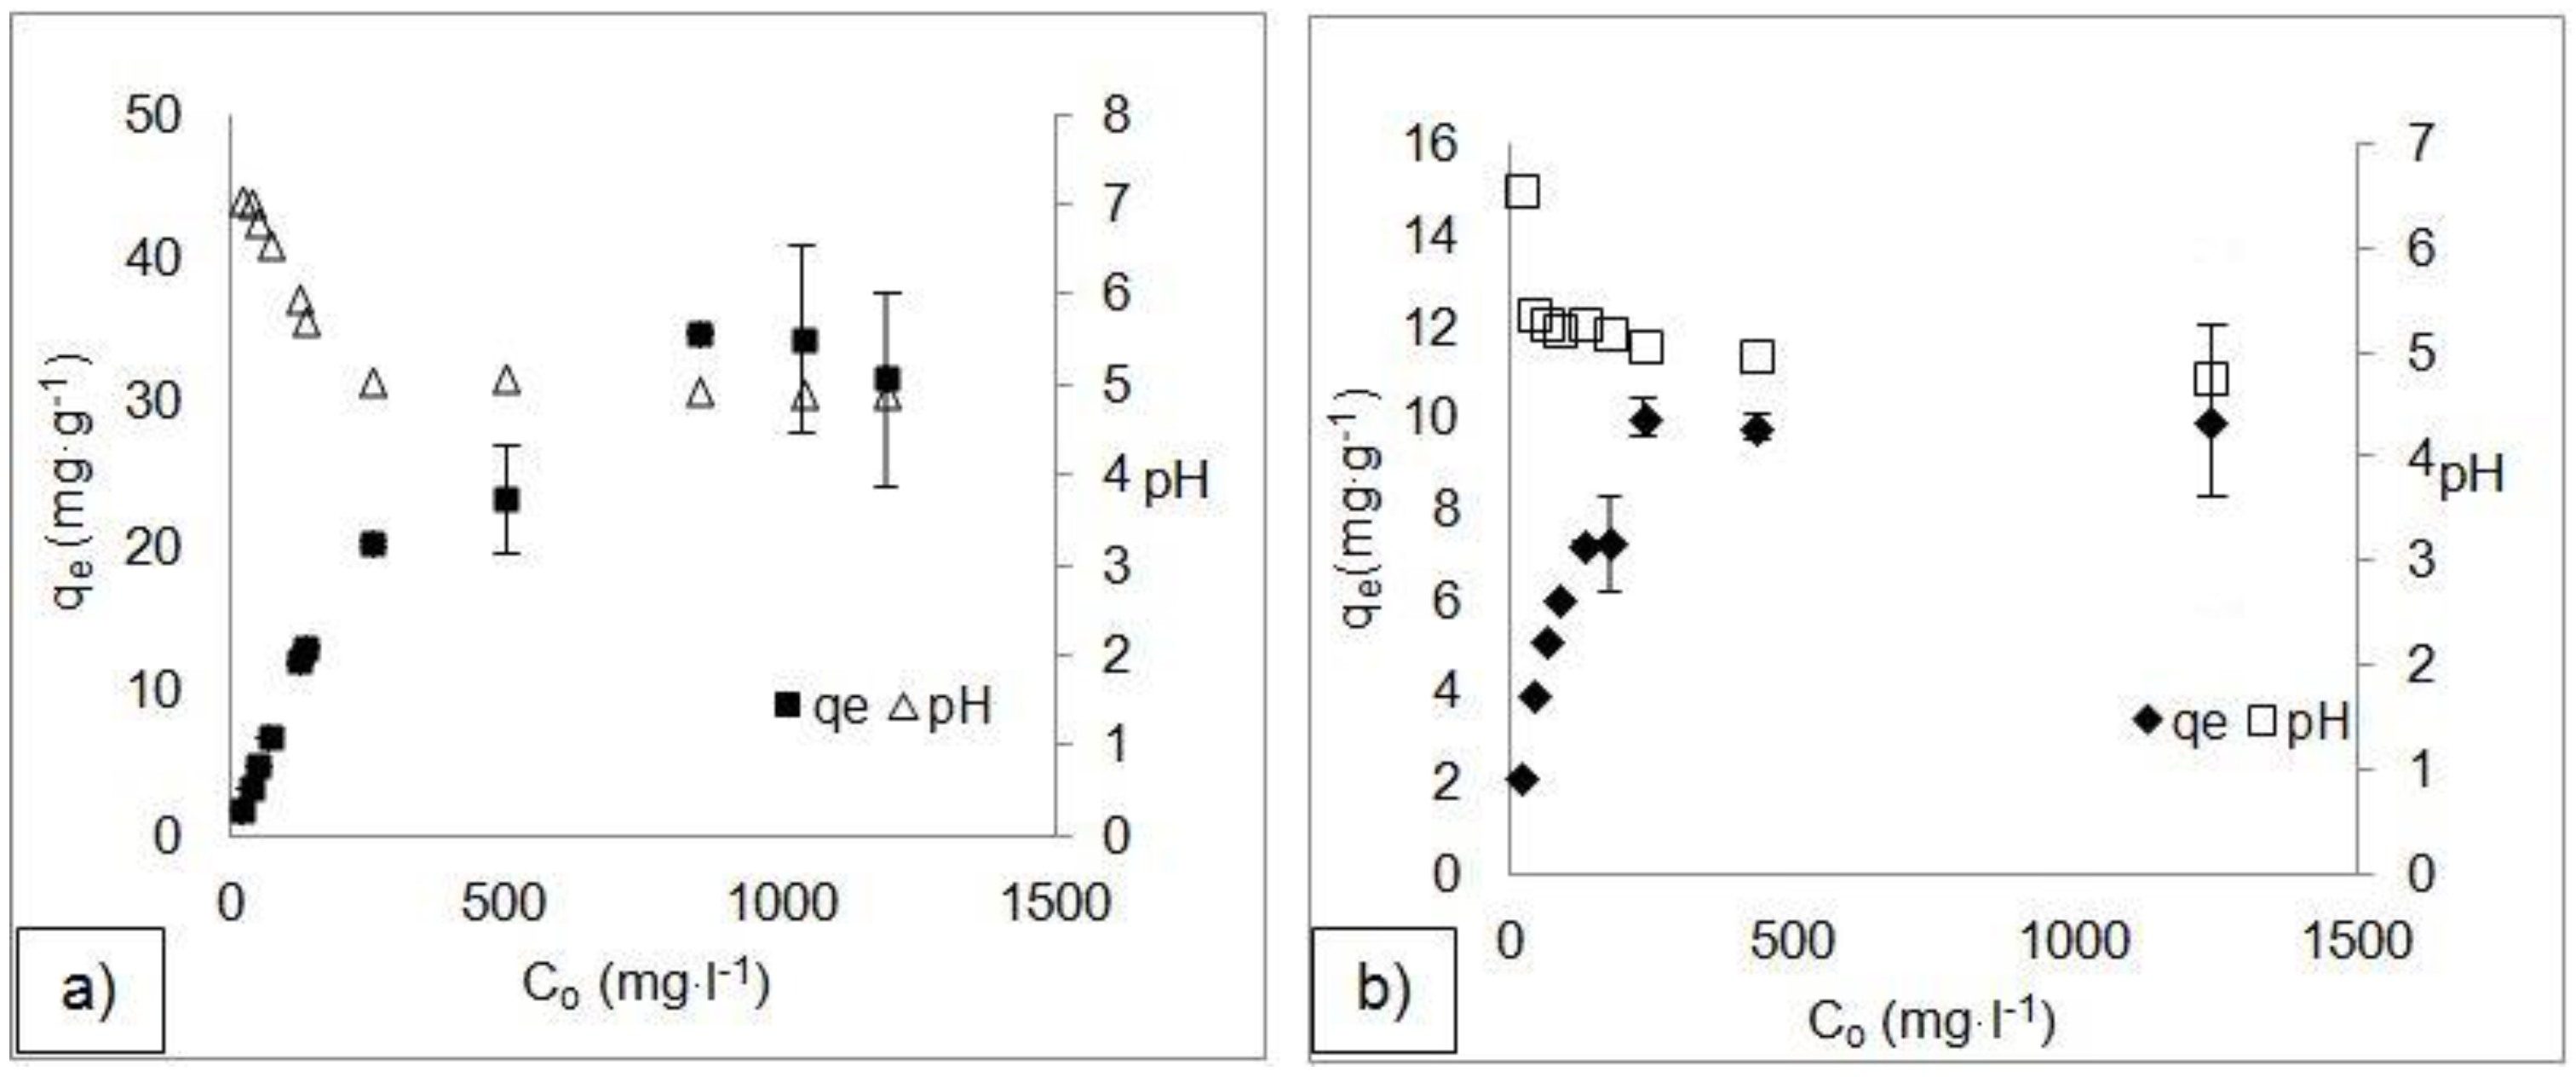
3.2. Adsorption Experiment Results

Sorption (%) of Pb and Cu cations from aqueous solution increases with the raise of attapulgite mass (Figure 3a). The maximum removal, constituting almost 100% of Pb and Cu, was observed with added concentration of 10 g·L−1 and 15 g·L−1 of attapulgite, respectively. The removal percentage of Pb increased from 86% to 100% with the raise of adsorbent concentration from 2 g·L−1 to 10 g·L−1. In addition, Cu adsorption increased from 33% to 100% with the increase of attapulgite concentration from 2 g·L−1 to 15 g·L−1. However, while 85% of Pb concentration is adsorbed when 2 g·L−1 attapulgite is added in the solution, only 33% of Cu concentration is adsorbed for the same adsorbent concentration.
Removal of Pb and Cu was strongly depended on pH. As it is shown in Figure 3b, adsorption increases with increasing pH from 2.0 to 4.0 and remains almost stable for pH values ranging from 4.0 to 12.0. The ionic strength of the solution has also a significant role on the adsorption process. The removal of Pb and Cu decreases with increasing concentration of NaNO3 in the solution at pH 4.0 (Figure 3c). This is indicative of the competition between Na+ and Pb2+ or Cu2+ for the available adsorption sites [14]. As NaNO3 concentration increases, pH is also decreasing in case of Pb from 6.9 to 6.6, while in case of Cu it remains almost stable. Contact time is an important parameter, because it is associated with the adsorption kinetics of an adsorbent for a given initial concentration of the adsorbate. Pb and Cu removal increases slightly with increasing contact time with the maximum metal removal to be achieved within the first 5 minutes of the experiment (Figure 3d).
Adsorption capacity qe increases almost linearly with increasing concentration of Pb and Cu until the concentration of approximately 250 mg·L−1 when the curve begins to reach a plateau. Adsorption of metal ions is increasing with rising initial concentration of Pb and Cu in the solution (Figure 4). The pH of final solution decreases as the concentration of metals increases. This is explained by the fact that silanol groups (SiOH) on attapulgite surface bind with Pb or Cu, replacing protons (H+) that are released into solution. Chen et al. [3] and Potgieter et al. [15] reported similar data for Pb adsorption on attapulgite.

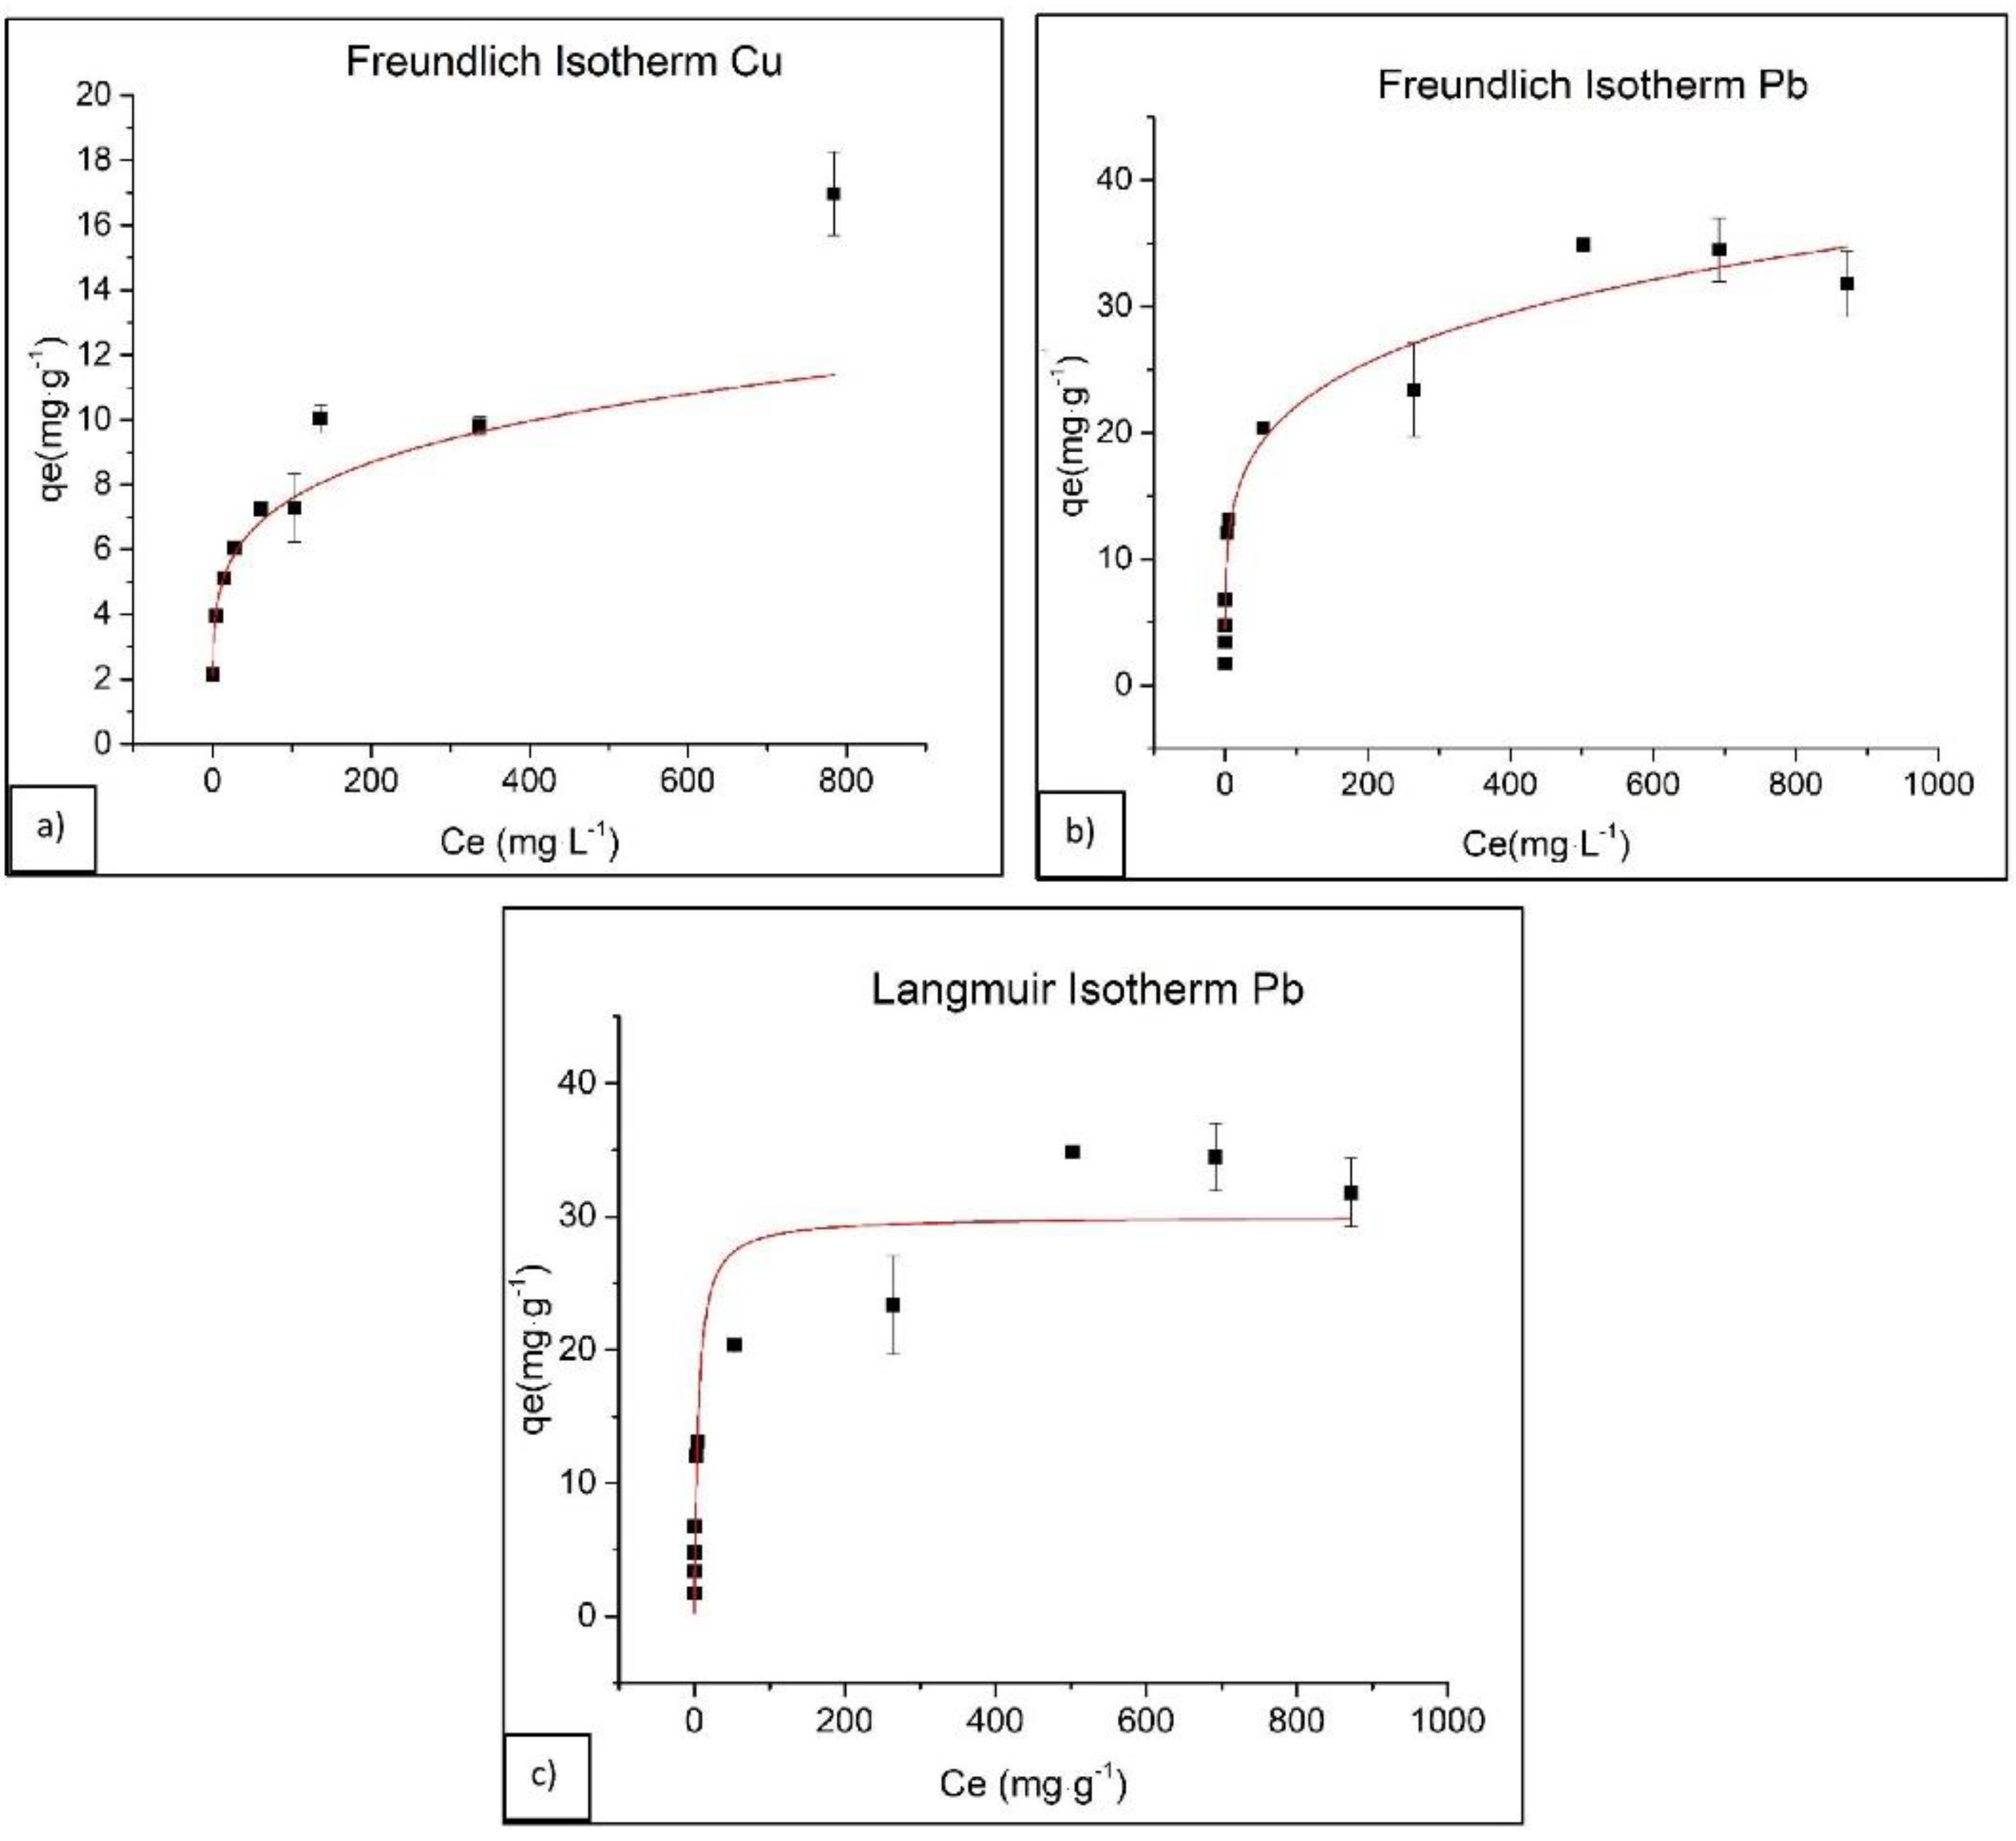
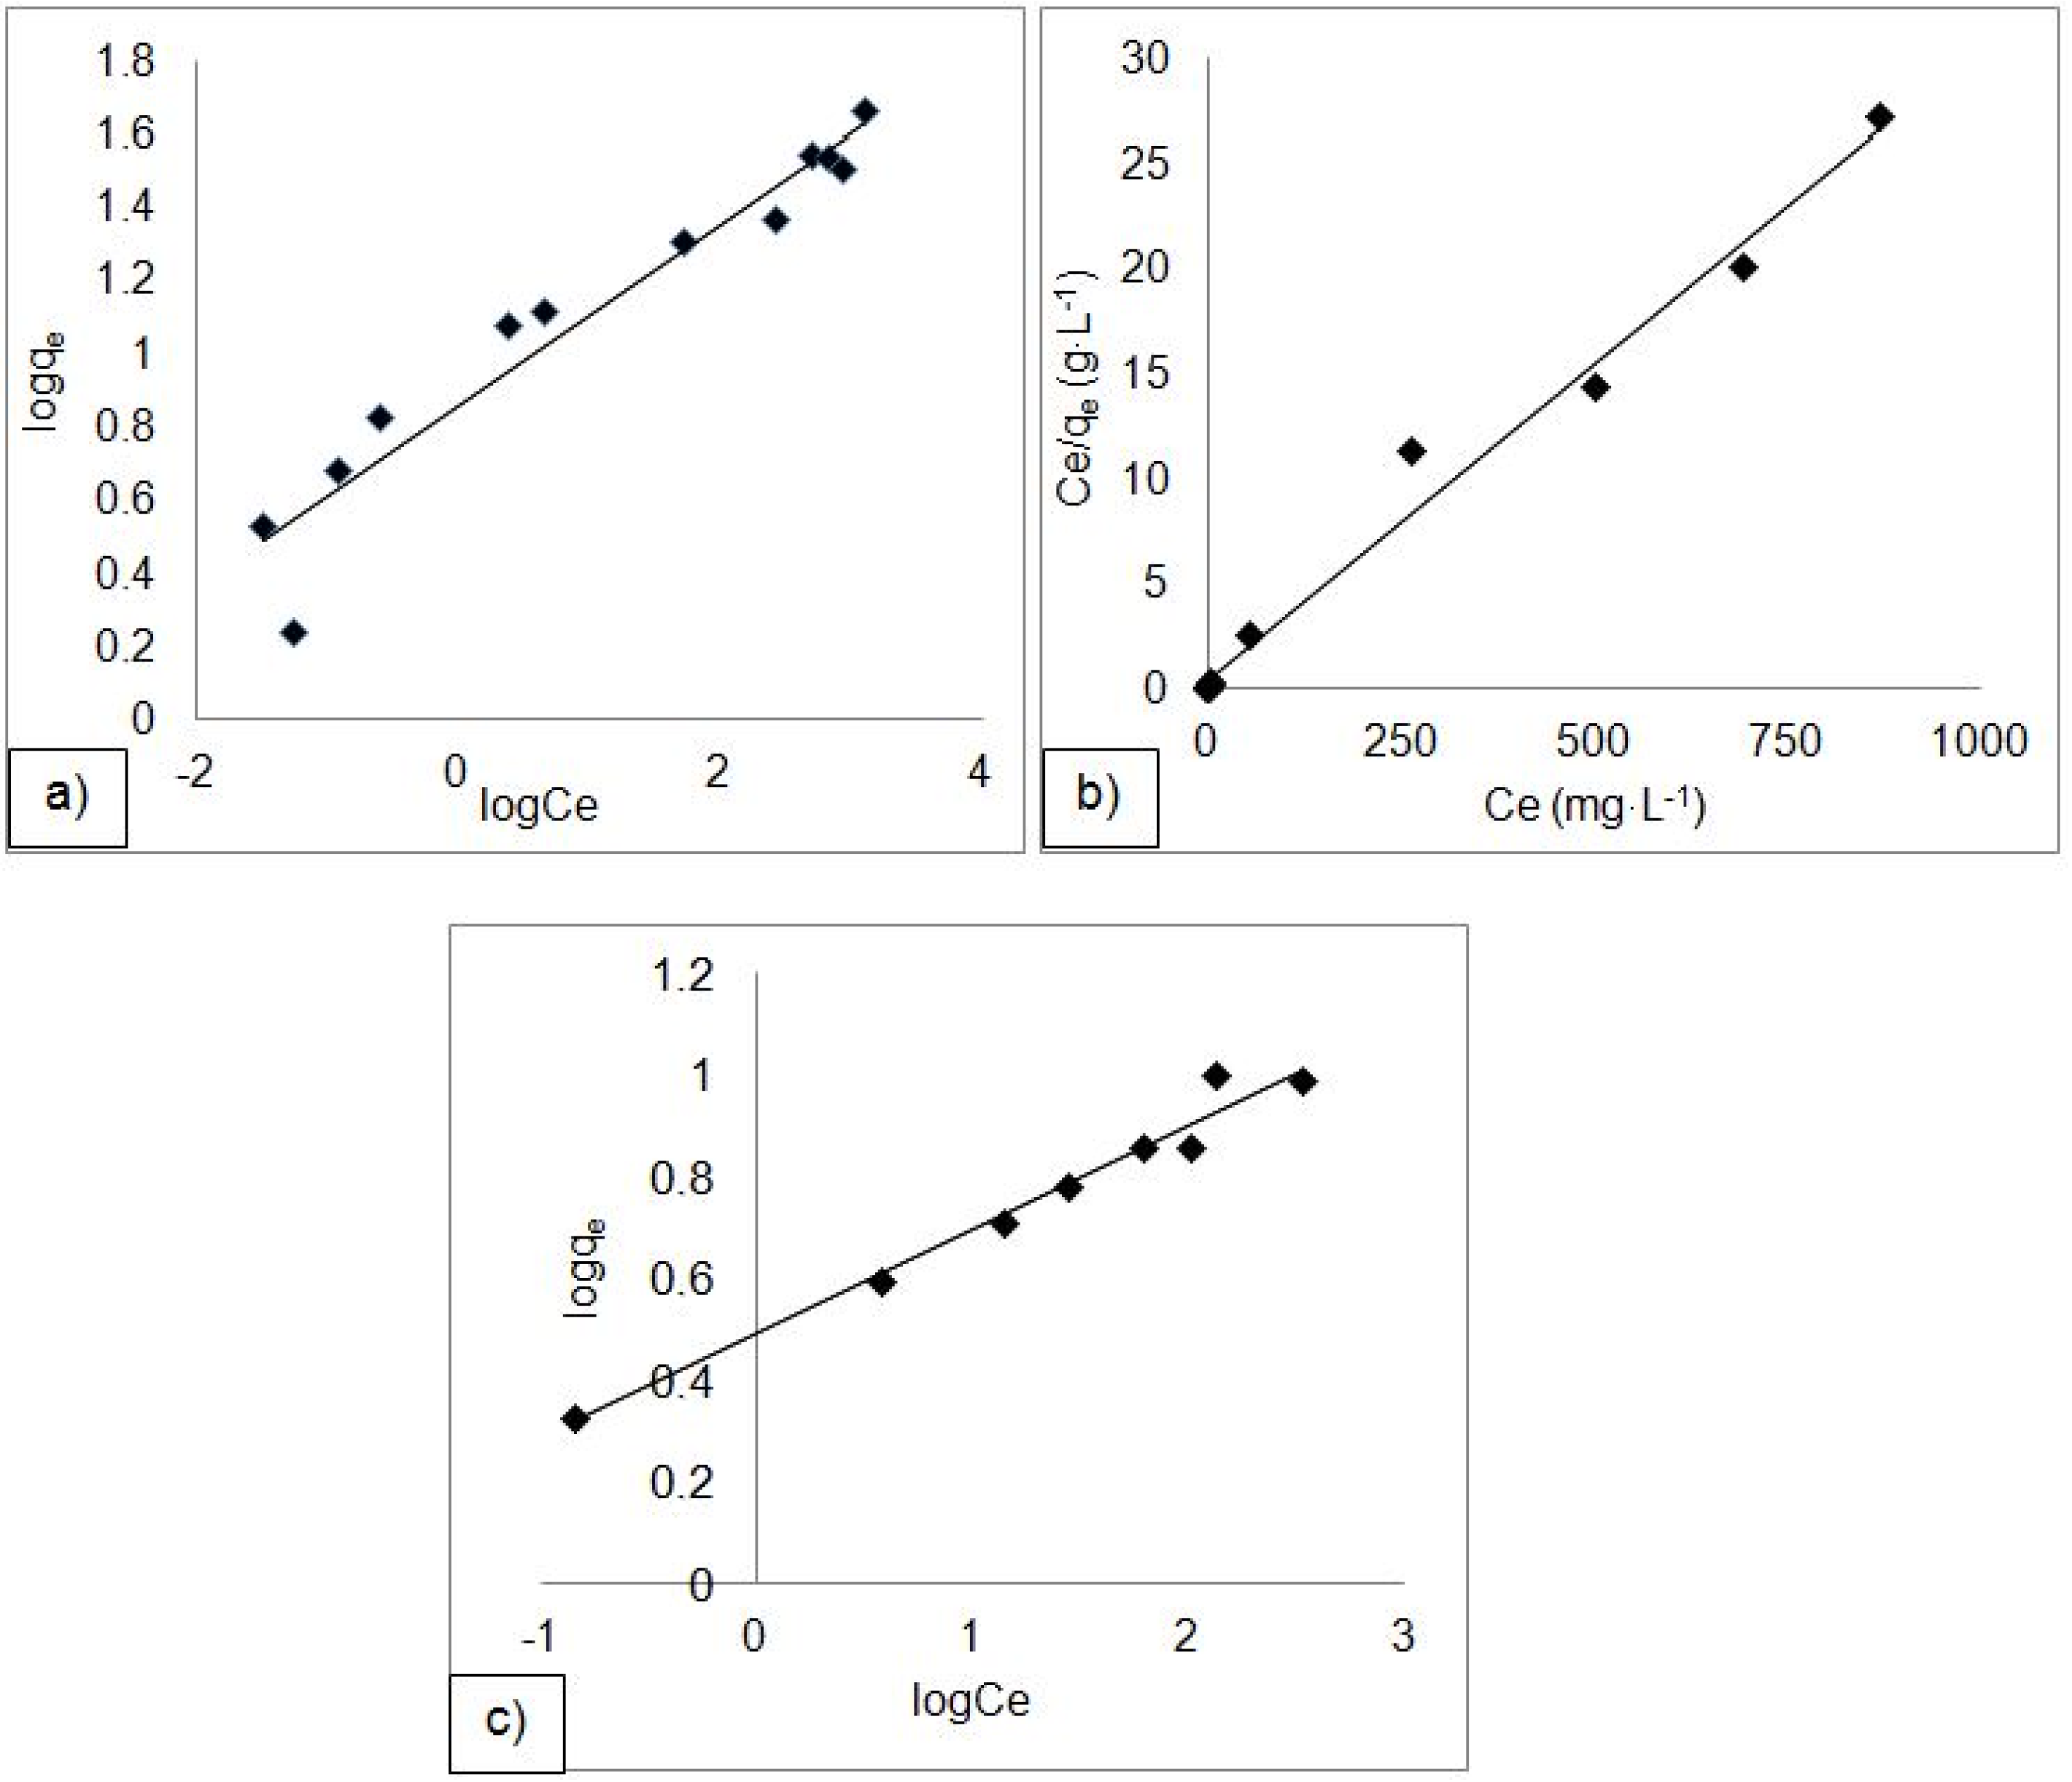
3.3. Adsorption Isotherms

The adsorption isotherm is an invaluable curve describing the phenomenon governing the retention (or release) of a substance from the aqueous porous media or aquatic environments to a solid-phase at a constant temperature and pH [16]. Temperature is one of the most important parameters that controls metal ion adsorption capacity on different materials by influencing adsorption kinetics [14]. Adsorption capacity qe increases almost linearly with increasing equilibrium concentration of Cu and Pb until reaching a concentration of approximately 200 mg·L−1 for both cations when the curve begins to reach a plateau (Figure 5). The adsorption data for each metal were also fitted to the Freundlich [17] and Langmuir [18] isotherm models by using both non-linear (Figure 5) and linear equations (Figure 6). However, the parameters of Freundlich and Langmuir models were calculated according to non-linear equations (Table 2) as the the latter takes into account the weight of the experimental points and fit better the experimental data [19]
The non-linear (1) and linear (2) Equations of Langmuir are
q e = Q max   K l   C e 1 + K l   C e  
C e q e = C e Q max + 1 K l   × Q max
in which Ce is the equilibrium concentration of Pb or Cu in the solution (mg·L−1), qe is the equilibrium capacity of lead or Cu on the adsorbent (mg·g−1), Qmax is the monolayer adsorption capacity of the adsorbent (mg·g−1), and Kl is the Langmuir adsorption constant (L·mg−1), which is related to the free energy of adsorption.
The non-linear (3) and linear (4) Equations of Freundlich model is
q e = K f C e 1 n
l o g q e = 1 n × l o g C e + l o g K f
in which qe is the equilibrium capacity of Pb or Cu on the adsorbent (mg·g−1), Ce is the equilibrium concentration of Pb or Cu solution (mg·L−1), Kf is the Freundlich constant, and 1/n (dimensionless) is the heterogeneity factor.
According to Langmuir model, the maximum adsorption capacity Qmax of Pb is 30 mg·g−1, whereas the maximum adsorption capacity Qmax of Cu is 4.41 mg·g−1. However, it must be mentioned that a better-fitted straight line with high correlation coefficient was obtained in case of Pb adsorption (Figure 6b), while the linearity of the plot of Langmuir model for Cu adsorption (figure not shown) is very poor. As a result, it is concluded that Langmuir model describes better the adsorption mechanisms of Pb than those of Cu. This is also in agreement with previously reported research data [3,14,15].
Finally, the fit of Freundlich model on the adsorption data for Pb and Cu is presented in Figure 6a,b. Comparing the linearity and the correlation coefficients for both metals, the model fits well the data of both Cu and Pb (Figure 5a,b). Furthermore, the low value of 1/n (0.20) indicates increased heterogeneity of adsorbed ions on the clay surface.

4. Discussion

4.1. Effect of Experimental Parameters on Adsorption Efficiency

Attapulgite is characterized for having a large number of silanol groups on its surface playing an important role in the sorption of Pb and Cu, especially at neutral or slightly acid conditions. The sorption reaction taking place can be summarized as follows:
Si–OH + Pb2+ → Si–OPb+ + H+
Si–OH + Cu2+ → Si–OCu+ + H+
The mechanisms underlying the adsorption of solute on solid particles comprise the following main steps: (1) solute transfer from the bulk solution to the adsorbent surface, (2) transfer from the surface to the structural active sites via ion exchange, and (3) uptake on the active site, via complexation, sorption, precipitation and hydrolysis [20]. With the raise of attapulgite content, the removal of Pb and Cu from the solutions increases, because the functional groups on attapulgite surface are increasing too, providing more available sites to form complexes via surface complexation or to exchange cations due to ion exchange process [21,22]. The pH of the final solution increases gradually with the increase in the amount of attapulgite. This is explained by the fact that more negatively charged sites on the surface of attapulgite are available with the raise of attapulgite content; as a result, more H+ ions are adsorbed on attapulgite surface, and therefore the final solution pH increases. Similar conclusions have been drawn in the study of Chen et al. [3]. The fact that adsorption increases as pH increases (from 2.0 to 4.0) is attributed to the decrease of proton competition for the adsorption sites on the adsorbent surface, as well as by an enhanced electrostatic attraction between the surface and the cationic species [23]. As the pH raises further, the negative charge on the adsorbent surface increases too, due to the raise of OH. At pH values lower than 4.0, the silanol groups of natural and heat-treated attapulgite are more protonated to form Si–OH2; hence, they are less available to adsorb Pb and Cu. However, at pH values greater than 4.0, metal removal is almost stable. This justifies the fact that at pH range from 4.0 to 8.0, retention of metals is attributed to adsorption (inner sphere or outer sphere complexation) and ion exchange processes. At higher pH values from 8.0 to 10.0, metal removal is attributed to precipitation processes with the formation of hydroxide phases Pb(OH)2 and Cu(OH)2 on attapulgite surface (Figure 2c,d). At pH > 10.0, the removal of metal ions decreases slightly possibly due to the dissolution of attapulgite clay in such alkaline conditions, reducing the available surface area for chemical precipitation of hydroxide phases Pb(OH)2 and Cu(OH)2 on attapulgite surface. Metal removal from the solution decreases with increasing concentration of NaNO3 due to the competition between Na and metal cations for the available sites [24]. It is also noteworthy that the kinetics of the chemical reactions that take place during the interaction of attapulgite with the aqueous solutions of Pb and Cu are very quick, probably due to its very high specific surface area.
Heat treatment of attapulgite induced dehydration (zeolitic H2O loss) at low temperatures (<150 °C) and dehydroxylation at higher temperatures (350–510 °C), while the complete destruction of the lattice structure of clay occurred at temperatures over 550 °C [5]. Heat treatment can produce changes in both its structural and textural properties, and therefore can affect the adsorption capacity of attapulgite. Tsampodimou et al. [25] have demonstrated using near-infrared spectroscopy the folding of the structure of attapulgite-sepiolite clays, induced by the removal of one OH2 per Mg when heating the clay at temperatures of about 300 °C. This folding marks the loss of microporosity and colloidal properties of the clay and leads to the enhancement of mesoporous absorptive properties. In the present study, no significant differences were observed in the adsorption of ions between raw and heat-treated clay up to the temperature of 500 °C (Figure 7). The material remains an effective adsorbent even at the calcination temperature of 800 °C, although higher amounts of attapulgite clay are required to achieve total removal of the ions from the solution at this temperature of heat treatment.

4.2. Comparison of Greek Attapulgite Sorption Efficiency with Other Clay Materials

Adsorption efficiency is highly dependent on the material that is used as an adsorbent, as well as on the solution conditions such as pH, temperature, ionic strength, metal ion concentration, and adsorbent concentration. These factors play a major role in determining the extent and type of cooperative sorption process. A compilation of literature data on different maximum adsorption capacities (Qmax) of different raw clay materials, estimated by the Langmuir model, is presented in Table 3. The data are compared to the results of this study. However, it has to be mentioned that the comparison is indicative, as in each experimental procedure the conditions were different. It is noted that the effectiveness of Greek attapulgite for removal of Pb and Cu ions from aqueous solutions lies within the range of reported values by other researchers [3,11,14,15,26]. When compared with other non-treated attapulgites, the tested clay demonstrates satisfactory performance for both ions, showing a preferential adsorption of Pb rather than Cu. This preferential behavior towards Pb adsorption is in agreement with the results of previous research with clays and other materials [26,27,28] and indicates that heavy metal sorption by attapulgite depends on the size of the cation. Small ions are preferred as elution proceeds, indicating that not only the structural channels but also octahedral sites at the edges of the channels can be involved in the sorption [29,30,31].

4.3. Uncertainty Issues Affecting the Adsorption Modelling Process

Contaminant adsorption is dependent on numerous variables that are difficult to quantify, including the surface area and surface site density of the adsorbing minerals, the properties of the interface between the mineral surface and bulk solution, and both the structure and composition of the adsorbing species. The simplest model for describing contaminant adsorption is the empirical distribution coefficient or Kd model that relates the equilibrium concentration of a species A adsorbed on a given mineral to the concentration of A in solution, in which
A = Kd·A(aq).
This model is frequently used in simple reactive-transport calculations, because it is easily incorporated into the advection-dispersion equations [32]. However, a Kd is based on a single batch equilibration experiment at specific conditions (e.g., pH, ionic strength, etc.) and is only applicable to the measured system. The assumptions of Kd model are the following: (1) Only trace amounts of contaminants exist in the aqueous and solid phases, (2) The relationship between the amount of contaminant in the solid and liquid phases is linear, (3) Equilibrium conditions exist, (4) Equally rapid adsorption and desorption kinetics exists, (5) It describes contaminant partitioning between 1 sorbate (contaminant) and 1 sorbent (soil), and (6) All adsorption sites are accessible and have equal strength. The last point is especially limiting for groundwater contaminant models, because it requires that Kd values should be used only to predict transport in systems chemically identical to those used in the laboratory measurement of the Kd. Variation in either the soil or aqueous chemistry of a system can result in extremely large differences in Kd values.
Thus, one component of the uncertainty is related to both the experimental procedure (measurement uncertainty), as well as to the heterogeneity of natural materials such as the natural attapulgite clay sample. Another component of the uncertainty is related to model assumptions that do not comply with the experimental or natural conditions. Both Langmuir and Freundlich isotherms models have also certain requirements to be valid. For example, Langmuir model assumes monolayer adsorption (the adsorbed layer is one molecule in thickness), the adsorption sites are finite, and the adsorption is homogeneous where all sites possess equal affinity for the adsorbate [18]. On the other hand, Freundlich model can be applied to multilayer adsorption, and it assumes that the amount adsorbed is the summation of adsorption on all sites, with the stronger binding sites occupied first, until adsorption energy is exponentially decreased upon the completion of adsorption process [17]. These uncertainty issues can be overwhelmed with spectroscopic studies of the mineral-water interface such as X-ray absorption spectroscopy, as well as molecular modelling. The fine structure of the X-ray absorption (XAFS) consists of the near-edge (XANES) and the extended portions (EXAFS) [33]. From XAFS data, it is possible to obtain important information about the local atomic structure (LAS) of adsorbed ions, such as the type of atoms surrounding the central atom (atom being probed), the coordination number (N), interatomic distances (R), and oxidation state in order to develop adsorption models that are calibrated closer to the natural system. In addition, there are uncertainty issues related to the calculation of model parameters, as the linearized equations limit the ability to model sorption data with good accuracy; for this reason, the non-linear forms are used to fit experimental data. Even so, the uncertainty of the validity of the application of surface complexation models (SCM) in natural conditions remains large, mainly because the detail required to adequately describe field geochemical processes remains unresolved. Consequently, SCM are not validated in the field.

5. Conclusions

The experimental results indicated that both raw and heat-treated attapulgite clay could be successfully used for the adsorption of Pb and Cu cations from aqueous solutions. The maximum removal was observed for 10 g·L−1 attapulgite for Pb and 15 g·L−1 for Cu. With respect to the effect of pH, it is noted that at pH < 4.0 adsorption is limited, but at higher pH values between 4.0 and 8.0 adsorption mechanisms such as inner and outer sphere complexation and ion exchange processes are responsible for the removal of Pb and Cu. However, at pH > 8.0 the removal of Pb and Cu is increased due to precipitation of hydroxide phases on attapulgite surface. Adsorption capacity increases with the rise of metal concentration, while it decreases with the rise of solution ionic strength. The maximum adsorption capacity of attapulgite for Pb according to the Langmuir model was found to be 30 mg·g−1 and for Cu 4.41 mg·g−1. Both the Freundlich and Langmuir models fit well the experimental data of Pb. On the contrary, Cu adsorption is better fitted by the Freundlich model. Heat treatment did not have a significant effect on adsorption at temperatures up to 500 °C. However, at higher calcination temperatures the crystal structure of the mineral is destroyed, and thereby the sorption efficiency decreases.
Raw attapulgite clay is a promising material that has been successfully applied for the stabilization of toxic metals in the historical mining impacted area of Lavrion, Greece during field scale experiments [12]. The material in its raw or heat-treated form could be potentially used for water and soil heavy metal remediation purposes in other active mining areas characterized by high Pb and other heavy metal concentrations in soil [34]. Nevertheless, there is a need for further investigation of the specific adsorption mechanisms, as well as of the effect of temperature on adsorption capacity and kinetics of attapulgite clay in order to reduce the degree of uncertainty related to isotherm model’s assumptions.

Author Contributions

Lab experiments were conducted by K.P. and P.M. while data analysis and validation were conducted by all authors. The writing-review and editing was made by K.P. and V.Z.

Acknowledgments

This work was partially funded by Geohellas S.A. (project No. 11896) and Edafomichaniki S.A. (project No. 11993).

Conflicts of Interest

The authors declare no conflict of interest.

References

  1. Rouff, A.A.; Reeder, R.J.; Fisher, N.S. Pb (II) sorption with calcite: A radiotracer study. Aquat. Geochem. 2002, 8, 203–228. [Google Scholar] [CrossRef]
  2. Fiol, N.; Villaescusa, I.; Martinex, M.; Miralles, N.; Poch, J.; Serarols, J. Sorption of Pb (II), Ni (II), Cu (II), and Cd (II) from aqueous solution by olive stone waste. Sep. Purif. Technol. 2006, 50, 132–140. [Google Scholar] [CrossRef]
  3. Chen, H.; Zhao, Y.; Wang, A. Removal of Cu (II) from aqueous solution by adsorption onto acid-activated attapulgite. J. Hazard. Mater. 2007, 149, 346–354. [Google Scholar] [CrossRef] [PubMed]
  4. Sauve, S.; Martinez, C.E.; McBride, M.B.; Hendershot, W.H. Adsorption of free lead by pedogenic oxides, ferrihydrite and leaf compost. Soil Sci. Soc. Am. J. 2000, 64, 595–599. [Google Scholar] [CrossRef]
  5. Galan, E. Properties and Applications of Attapulgite-Sepiolite Clays. Clay Miner. 1996, 31, 443–453. [Google Scholar] [CrossRef]
  6. Singer, A. Palygorskite and sepiolite group minerals. Miner. Soil Environ. 1989, 829–872. [Google Scholar]
  7. El-mofty, S.E.; Ashour, F.H.; El-Shall, H. Adsorption Mechanism of Toxic Metal Ions by Clay (Attapulgite). In Proceedings of the Twelfth International Water Technology Conference, IWTC12 2008, Alexandria, Egypt, 1 January 2008; pp. 403–414. [Google Scholar]
  8. Chiari, G.; Giustetto, R.; Ricchiardi, G. Crystal structure refinements of attapulgite and Maya Blue from molecular modelling and powder synchrotron diffraction. Eur. J. Mineral. 2003, 15, 21–33. [Google Scholar] [CrossRef]
  9. Giustetto, R.; Xamena, F.X.L.; Ricchiardi, G.; Borgiga, S.; Danim, A.; Gobetto, R.; Chirotii, M.R. Maya Blue: A computational and spectroscope study. J. Phys. Chem. B 2005, 109, 19360–19368. [Google Scholar] [CrossRef] [PubMed]
  10. Chang, P.H.; Li, Z.; Yu, T.L.; Munkhbayer, S.; Kuo, T.H.; Hung, Y.C.; Lin, K.H. Sorptive removal of tetracycline from water by attapulgite. J. Hazard. Mater. 2009, 165, 148–155. [Google Scholar] [CrossRef] [PubMed]
  11. Alvarez-Ayuso, E.; García-Sánchez, A. Palygorskite as a feasible amendment to stabilize heavy metal polluted soils. Environ. Pollut. 2003, 125, 337–344. [Google Scholar] [CrossRef]
  12. Zotiadis, V.; Argyraki, A.; Theologou, E. A Pilot Scale Application of Attapulgitic Clay for Stabilization of Toxic Elements in Contaminated Soil. J. Geotech. Geoenviron. Eng. 2012, 138, 633–637. [Google Scholar] [CrossRef]
  13. Yin, H.; Han, M.; Tang, W. Phosphorus sorption and supply from eutrophic lake sediment amended with thermally-treated calcium-rich attapulgite and a safety evaluation. Chem. Eng. J. 2016, 285, 671–678. [Google Scholar] [CrossRef]
  14. Fan, Q.; Li, Z.; Zhao, H.; Jia, Z.; Xu, J.; Wu, W. Adsorption of Pb (II) on attapulgite from aqueous solution: Effects of pH, ionic strength and temperature. Appl. Clay Sci. 2009, 45, 111–116. [Google Scholar] [CrossRef]
  15. Potgieter, J.H.; Potgieter-Vermaak, S.S.; Kalibantonga, P.D. Heavy metals removal from solution by attapulgite clay. Miner. Eng. 2006, 19, 463–470. [Google Scholar] [CrossRef]
  16. Limousin, G.; Gaudet, J.P.; Charlet, L.; Szenknect, S.; Barthes, V.; Krimissa, M. Sorption isotherms: A review on physical bases, modeling and measurement. Appl. Geochem. 2007, 22, 249–275. [Google Scholar] [CrossRef]
  17. Freundlich, H. Über die Adsorption in Lösungen. Z. Phys. Chem. 1906, 57, 385–470. [Google Scholar] [CrossRef]
  18. Langmuir, I. The adsorption of gases on plane surfaces of glass, mica and platinum. J. Am. Chem. Soc. 1918, 40, 1361–1403. [Google Scholar] [CrossRef]
  19. Bolster, C.H.; Hornberger, G.M. On the use of linearized Langmuir equations. Soil Sci. Soc. Am. J. 2007, 71, 1796–1806. [Google Scholar] [CrossRef]
  20. Thompson, A.F.B.; Jackson, K.J. Reactive transport in heterogeneous system: An overview. React. Transp. Porous Media 1996, 34, 269–310. [Google Scholar]
  21. Wang, W.; Chen, H.; Wang, A. Adsorption characteristics of Cd (II) from aqueous solutions onto activated attapulgite. Sep. Purif. Technol. 2007, 55, 157–164. [Google Scholar] [CrossRef]
  22. Xu, D.; Shao, D.D.; Chen, C.L.; Ren, A.P.; Wang, X.K. Effect of pH and fulvic acid on sorption and complexation of cobalt onto bare and FA bound MX-80 bentonite. Radiochim. Acta 2006, 94, 97–102. [Google Scholar] [CrossRef]
  23. He, M.; Zhu, Y.; Yang, Y.; Han, B.; Zhang, Y. Adsorption of cobalt (II) ions from aqueous solutions by palygorskite. Appl. Clay Sci. 2011, 54, 292–296. [Google Scholar] [CrossRef]
  24. Kypritidou, Z.; Argyraki, A.; Chryssikos, G.; Stamatakis, M. Interaction of clay materials with lead in aqueous solutions. Bull. Geol. Soc. Greece 2017, 50, 2221–2230. [Google Scholar] [CrossRef]
  25. Tsampodimou, M.; Bukas, V.J.; Stathopoulou, E.T.; Gionis, V.; Chryssikos, G.D. Near-infrared investigation of folding sepiolite. Am. Mineral. 2015, 100, 195–202. [Google Scholar] [CrossRef]
  26. Argyraki, A.; Boutsi, Z.; Zotiadis, V. Towards sustainable remediation of contaminated soil by using diasporic bauxite: Laboratory experiments on soil from the sulfide mining village of Stratoni, Greece. J. Geochem. Explor. 2017, 183, 214–222. [Google Scholar] [CrossRef]
  27. Zhang, H.; Tong, Z.; Wei, T.; Tang, Y. Sorption characteristics of Pb (II) on alkaline Ca-bentonite. Appl. Clay Sci. 2012, 65, 21–23. [Google Scholar] [CrossRef]
  28. Sheikhhosseini, A.; Shirvani, M.; Shariatmadari, H. Competitive sorption of nickel, cadmium, zinc and copper on attapulgite and sepiolite silicate clay minerals. Geoderma 2013, 192, 249–253. [Google Scholar] [CrossRef]
  29. Brigatti, M.F.; Lugli, C.; Poppi, L. Kinetics of heavy-metal removal and recovery in sepiolite. Appl. Clay Sci. 2000, 16, 45–57. [Google Scholar] [CrossRef]
  30. Shahmohammadi-Kalalagh, S.; Babazadeh, H.; Nazemi, A.H.; Manshouri, M. Isotherm and kinetic studies on adsorption of Pb, Zn and Cu by kaolinite. Caspian J. Environ. Sci. 2011, 9, 243–255. [Google Scholar]
  31. Chen, H.; Wang, A. Kinetic and isothermal studies of lead ion adsorption onto palygorskite clay. J. Colloid Interface Sci. 2007, 307, 309–316. [Google Scholar] [CrossRef] [PubMed]
  32. Koretsky, C. The significance of surface complexation reactions in hydrologic systems: A geochemist’s perspective. J. Hydrol. 2000, 230, 127–171. [Google Scholar] [CrossRef]
  33. Fendorf, S.E.; Sparks, D.L. Methods of Soil Analysis. Soil Sci. Soc. Am. 1996, 5, 377. [Google Scholar]
  34. Argyraki, A. Garden soil and house dust as exposure media for lead uptake in the mining village of Stratoni, Greece. Environ. Geochem. Health 2014, 36, 677–692. [Google Scholar] [CrossRef] [PubMed]
Figure 1. XRD diagrams of raw (AH0) and heat-treated (at 130 °C, 330 °C, and 800 °C) attapulgite clay.
Geosciences 08 00157 g001
Figure 2. SEM microphotographs showing the porous morphology of attapulgite clay particles: (a,b) before interaction with Pb aqueous solutions and (c,d) after interaction with Pb aqueous solutions.
Geosciences 08 00157 g002
Figure 3. Diagrams of adsorption capacity for different parameters: (a) attapulgite mass versus adsorption (%) of Pb and Cu, (b) effect of pH of initial suspension on adsorption of Pb and Cu, (c) effect of ionic strength on adsorption of Pb and Cu, and (d) effect of shaking time on adsorption of Pb and Cu.
Geosciences 08 00157 g003
Figure 4. Effect of initial concentration on adsorption of (a) Pb and (b) Cu in aqueous solution.
Geosciences 08 00157 g004
Figure 5. Freundlich and Langmuir Isotherm curves for (a,b) Cu and (c) Pb.
Geosciences 08 00157 g005
Figure 6. Isotherm models: (a) Freundlich model plot for Pb adsorption, (b) Langmuir model plot for Pb adsorption, and (c) Freundlich model plot for Cu adsorption.
Geosciences 08 00157 g006
Figure 7. Sorption percentage of (a) Pb and (b) Cu for different solid content for raw and heat-treated attapulgite (130 °C, 330 °C, 800 °C).
Geosciences 08 00157 g007
Table 1. Chemical composition of the Greek attapulgite clay that has been used as adsorbent in the present study.
OxidesSiO2Al2O3Fe2O3CaOMgONa2OK2OTiO2P2O5Cr2O3BaLOISUM
wt %54.109.798.490.366.760.300.820.480.020.200.0218.3799.98
Table 2. Isotherm parameters of Freundlich and Langmuir models.
Isotherm ModelParameterPbCu
Non-LinearLinearNon-LinearLinear
Freundlich1/n0.210.250.200.20
Kf8.487.243.043.09
R20.9650.9330.9970.976
LangmuirQmax (mg·g−1)3033.114.417.32
KL (L·mg−1)0.1980.0775.773.04
R20.8760.9870.8270.802
Table 3. Comparison of maximum adsorption capacities for Pb and Cu (Langmuir model) by different raw clay materials.
AdsorbentQmax (mg·g−1) PbQmax (mg·g−1) CuConditionsReference
Natural kaolinite7.754.42293 K, pH 4.5Shahmohammadi-Kalalagh 2011 [28]
Natural palygorskite clay62.130.7298 K, pH 7.0Potgieter et al., 2006 [15]
Natural palygorskite clay-2.36298 KSheikhhosseini et al., 2013 [28]
Natural palygorskite clay104.28-303 K, pH 6.0Chen and Wang 2007 [31]
Natural palygorskite clay20.72-313 K, pH 5.0Fan et al., 2009 [14]
Natural palygorskite clay37.217.4pH 5–6Alvarez-Ayuso and Sanchez 2003 [11]
Natural Greek palygorskite clay304.41295 K, pH 4.0This study

