Article

Estimating Regional Scale Hydroclimatic Risk Conditions from the Soil Moisture Active-Passive (SMAP) Satellite

Science and Technology Branch, Agriculture and Agri-Food Canada, Ottawa, ON K1A 0C6, Canada
*
Author to whom correspondence should be addressed.
Her Majesty the Queen in Right of Canada, as represented by the Minister of Agriculture and Agri-Food Canada.
Geosciences 2018, 8(4), 127; https://doi.org/10.3390/geosciences8040127
Submission received: 5 February 2018 / Revised: 20 March 2018 / Accepted: 3 April 2018 / Published: 7 April 2018
(This article belongs to the Special Issue Drought Monitoring and Prediction)

Abstract

:
Satellite soil moisture is a critical variable for identifying susceptibility to hydroclimatic risks such as drought, dryness, and excess moisture. Satellite soil moisture data from the Soil Moisture Active/Passive (SMAP) mission was used to evaluate the sensitivity to hydroclimatic risk events in Canada. The SMAP soil moisture data sets in general capture relative moisture trends with the best estimates from the passive-only derived soil moisture and little difference between the data at different spatial resolutions. In general, SMAP data sets overestimated the magnitude of moisture at the wet extremes of wetting events. A soil moisture difference from average (SMDA) was calculated from SMAP and historical Soil Moisture and Ocean Salinity (SMOS) data showed a relatively good delineation of hydroclimatic risk events, although caution must be taken due to the large variability in the data within risk categories. Satellite soil moisture data sets are more sensitive to short term water shortages than longer term water deficits. This was not improved by adding “memory” to satellite soil moisture indices to improve the sensitivity of the data to drought, and there is a large variability in satellite soil moisture values with the same drought severity rating.

1. Introduction

Soil moisture is a key variable for identifying and characterizing hydroclimatic risk conditions, as it quantifies water availability for evapotranspiration, plant water uptake, and can indicate where runoff may occur when soils are saturated. The hydroclimate is defined as the physical mechanisms that characterize how climate influences surface hydrology. The risks associated with the hydroclimate include extremes in climate that lead to a high probability of impact on surface water availability and includes events such as drought, dry spells, excess moisture, and flooding [1]. Quantifying these risks, therefore, requires developing indicators of the surface water balance and soil moisture is a reflection of how weather and climate have influenced this balance [2]. Soil moisture is difficult to quantify over large areas since it is highly variable in space and time and there are limitations to the most common ways that soil moisture has traditionally been quantified. In situ measurements are sparse and often not spatially representative of larger regions. Modelled soil moisture is reliant on underlying soil properties data sets that are often imprecise, and meteorological forcing data can be sparse or inaccurate in many areas [3]. Satellite soil moisture has shown promise, but accuracy and the limited sensitivity to surface soil moisture presents a challenge to quantifying risk conditions [4]. The launch of the Soil Moisture and Ocean Salinity (SMOS) mission in 2009 and the Soil Moisture Active/Passive (SMAP) mission in 2015, as well as other soil moisture satellite data sets, have helped to bridge part of the gap in estimating soil moisture at a regional scale by providing surface soil moisture information at spatial and temporal resolutions and degrees of accuracy that are useful for studying many key land and water processes. This is in turn leading to many improvements in quantifying key processes that are related to hydroclimatic risk conditions, including surface runoff, crop water availability, and drought [5,6,7,8,9,10].
Risk monitoring and reporting programs integrate large amounts of data to achieve a confluence of evidence to determine risk magnitude and extent [11,12,13]. Traditionally used risk indicators are based on precipitation and temperature data, and generally relate current conditions to a historical average or a normal to provide an index of how current hydroclimatic risks compare to what is normally observed in a given place and at a given time [14]. Satellite soil moisture can potentially provide a key piece of evidence in this risk reporting by providing information on water storage at or near the surface that can complement the traditionally used indicators. There are several limitations to using satellite data for this purpose that have been noted in past literature. Microwave sensors detect moisture in a thin surface layer and therefore cannot be used to quantify water storage in the root zone. Satellites often lack long historical data records that can be used to relate current conditions to a robust long-term average. The accuracy of satellite soil moisture data sets are limited by the assumptions and data gaps used in the retrieval models. The spatial resolution of passive microwave sensors is also very coarse, with pixel resolutions in the tens of kilometers, complicating interpretation of the observed soil moisture. Recent advances have addressed many of these limitations. Statistically robust data records have been created and evaluated by using spatial aggregation or blending of data from multiple satellites to create larger sample sizes or longer, consistent time series [15,16,17,18]. Limitations in surface soil moisture can be reconciled by treating satellite soil moisture as a wetness index rather than an absolute measure of water storage [4]. Soil moisture retrieval accuracy has gradually improved with the emergence of L-Band microwave sensors designed specifically for monitoring soil moisture and these improvements in retrieval models have helped to overcome some key gaps in accurately estimating soil moisture [19,20].
The launch of the SMOS mission in 2009 marked the first L-Band passive microwave mission specifically dedicated to soil moisture retrieval. The launch of the SMAP mission in 2015 provided a further data source on which to build models and indicators of climatic risk, but to date, these data sets have not been compared to determine how these data sets can be used to evaluate risk conditions. Both data sets have been shown to compare well with in situ data sets. Soil moisture from SMOS has been shown to provide high accuracy estimates of soil moisture in the top 5 cm, particularly in areas with low biomass vegetation, such as croplands and grasslands [20]. SMOS soil moisture has a dry bias in many areas, but in general captures wetting and drying cycles at the surface consistently over time in these low biomass regions [21,22,23,24]. SMAP soil moisture has similarly shown a high accuracy in most regions and in some regions showed a slightly improved retrieval compared to SMOS [25,26,27]. These two sensors can potentially provide complementary information on soil moisture and in turn climate related risk, but an evidence based approach is required to determine how to optimally incorporate this information into risk assessment.
The objective of this paper is to examine SMAP soil moisture as an indicator of hydroclimatic risk conditions, including drought and excess moisture. Given the temporal limitations of SMAP data, SMAP and SMOS data were compared and combined to determine their sensitivity to hydroclimatic risk based on both quantitative and qualitative risk indicators. Data were evaluated for agricultural regions in Canada for two growing seasons, where diverse events of wet and dry extremes were observed over a varied geography. Different SMAP data sets were assessed to determine the value of having higher spatial resolution data or data processed to reflect soil moisture at root zone depths for use in developing a hydroclimatic risk indicator. The objective was to evaluate an indicator that can be used for real time monitoring applications, and as a result the use of data sets such as the European Space Agency Climate Change Initiative (ESA-CCI) soil moisture data set was not considered since it is not currently available for real time monitoring [16]. A table of the acronyms used is provided in Table 1.

2. Materials and Methods
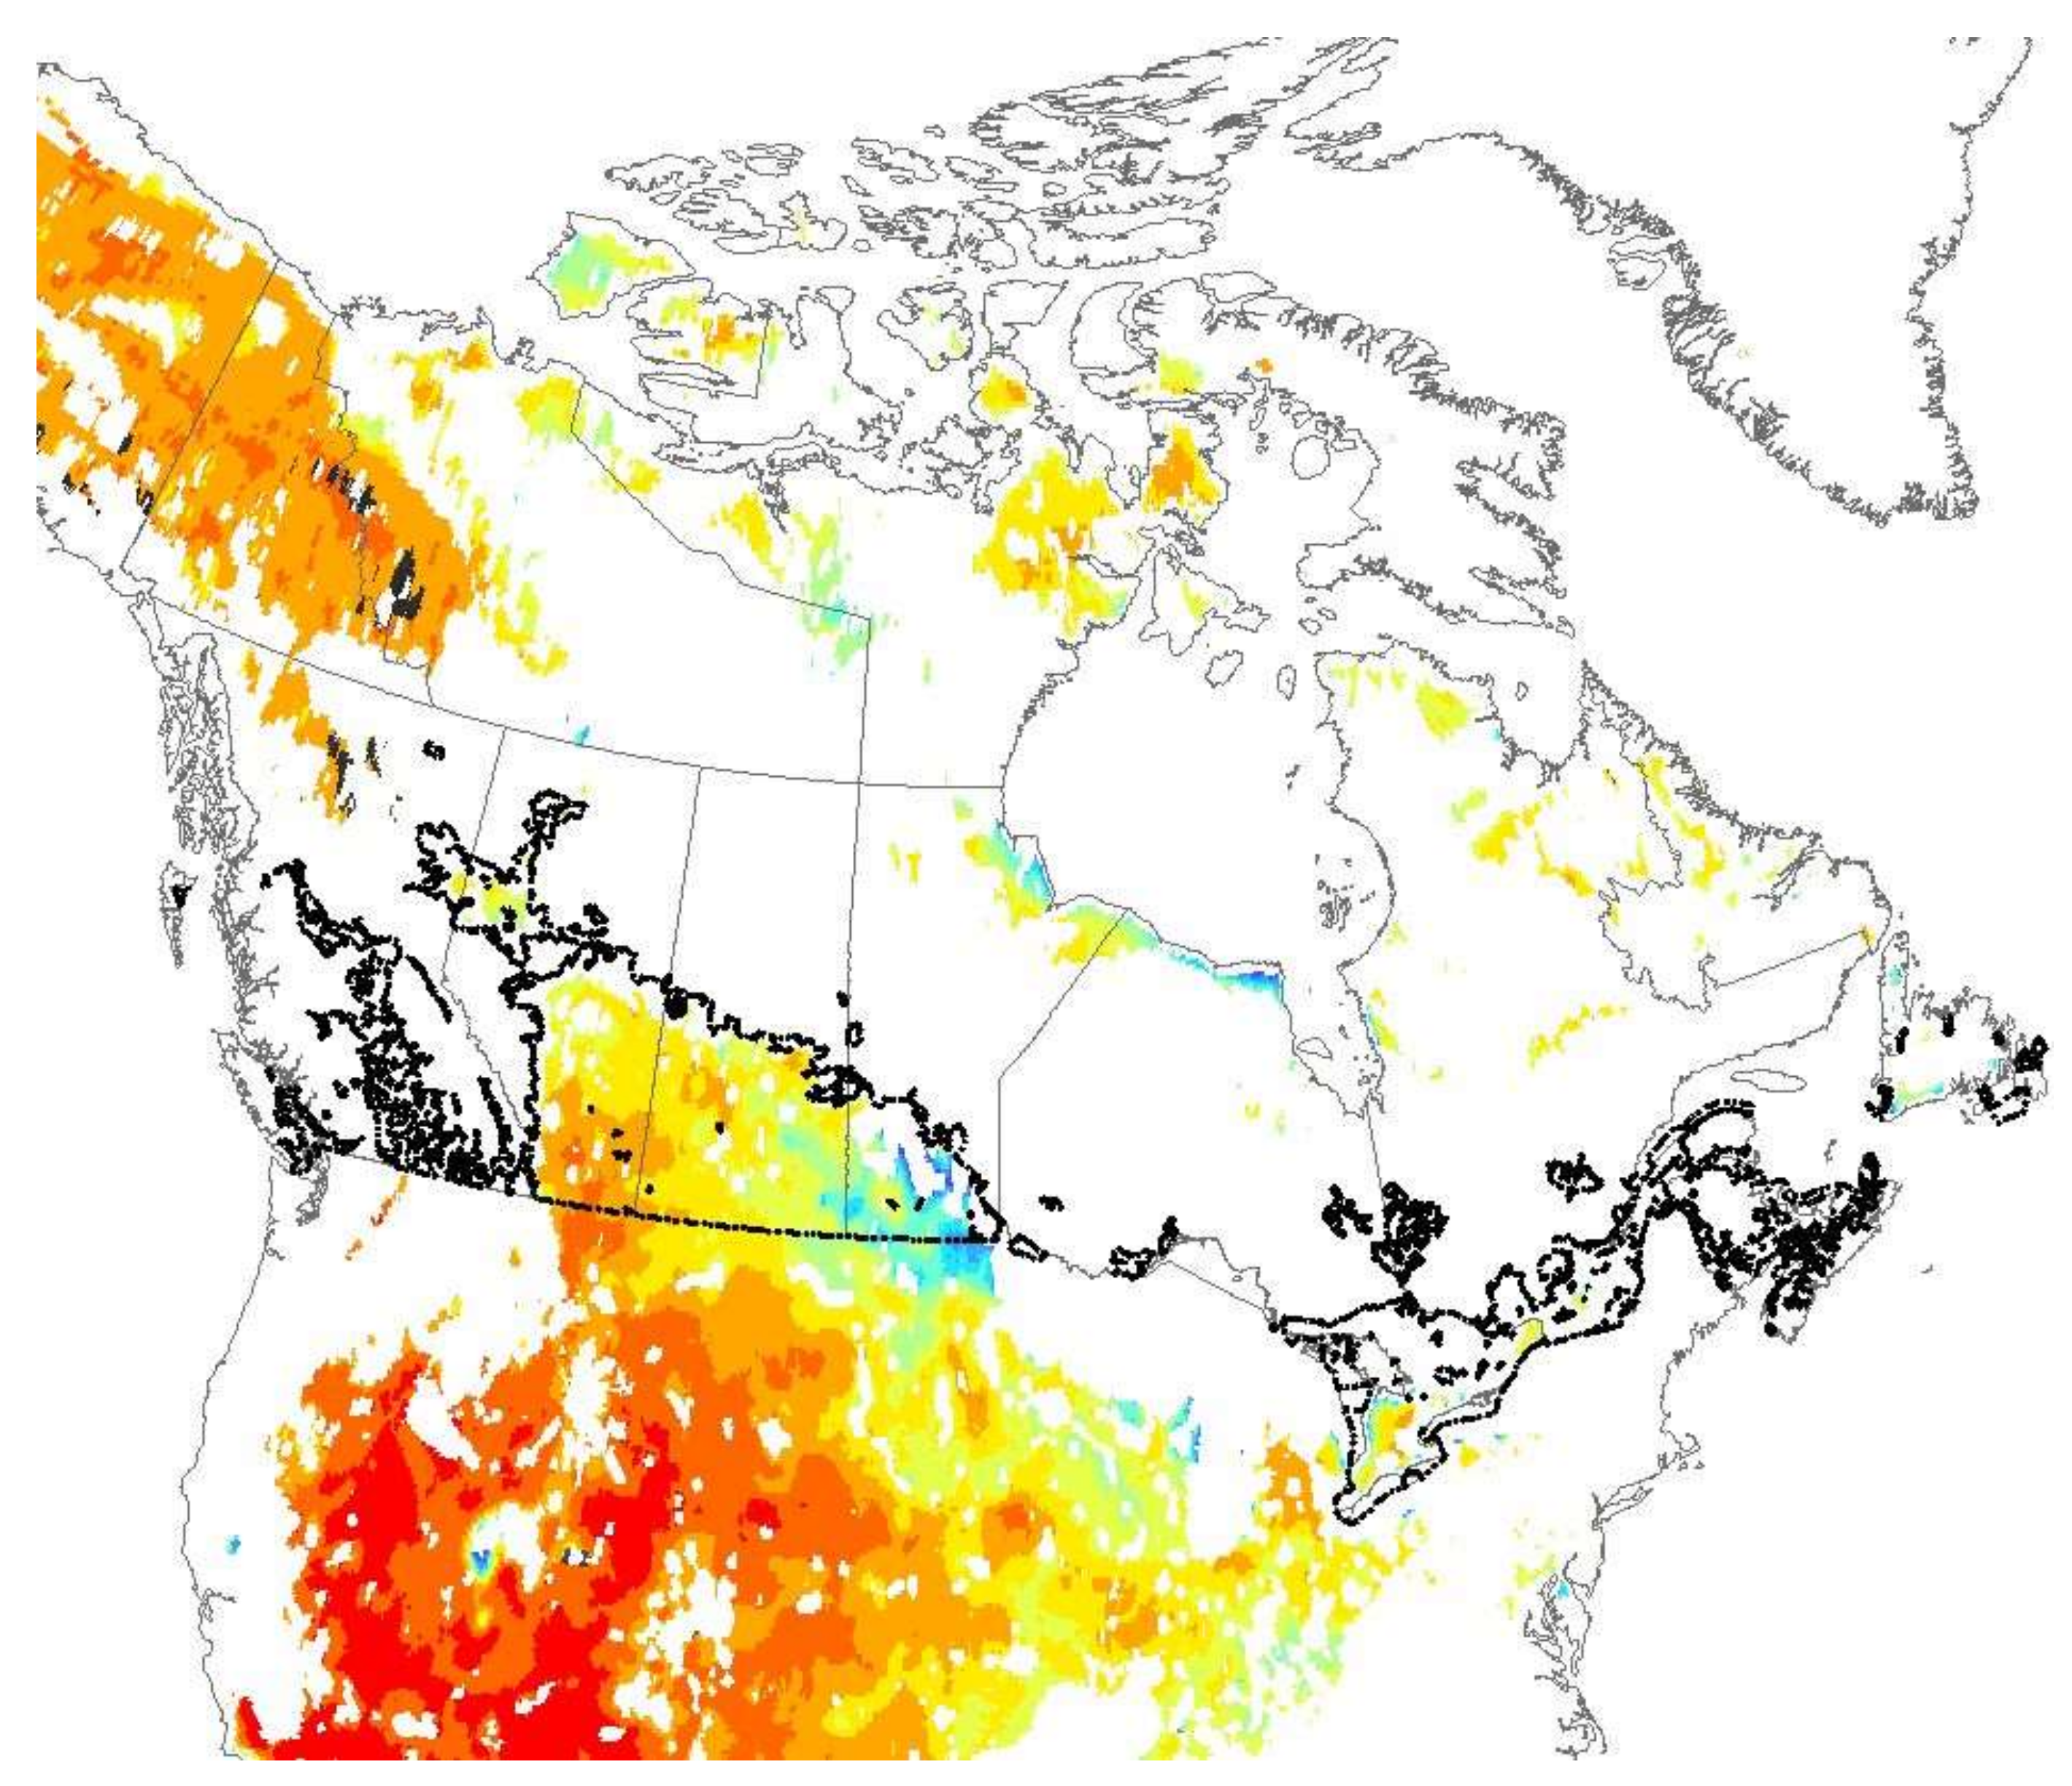
2.1. Research Area

Satellite soil moisture from SMAP was evaluated for agricultural areas in Canada for the 2015 and 2016 growing seasons (Figure 1). Commercial agriculture in Canada is geographically limited to areas where climate and soil conditions can support agricultural production, which are primarily in the southern parts of the country. Over the time period observed, both wet and dry extreme events, ranging from flooding to excess moisture, to abnormal dryness and drought were observed in different parts of the study region at different times.

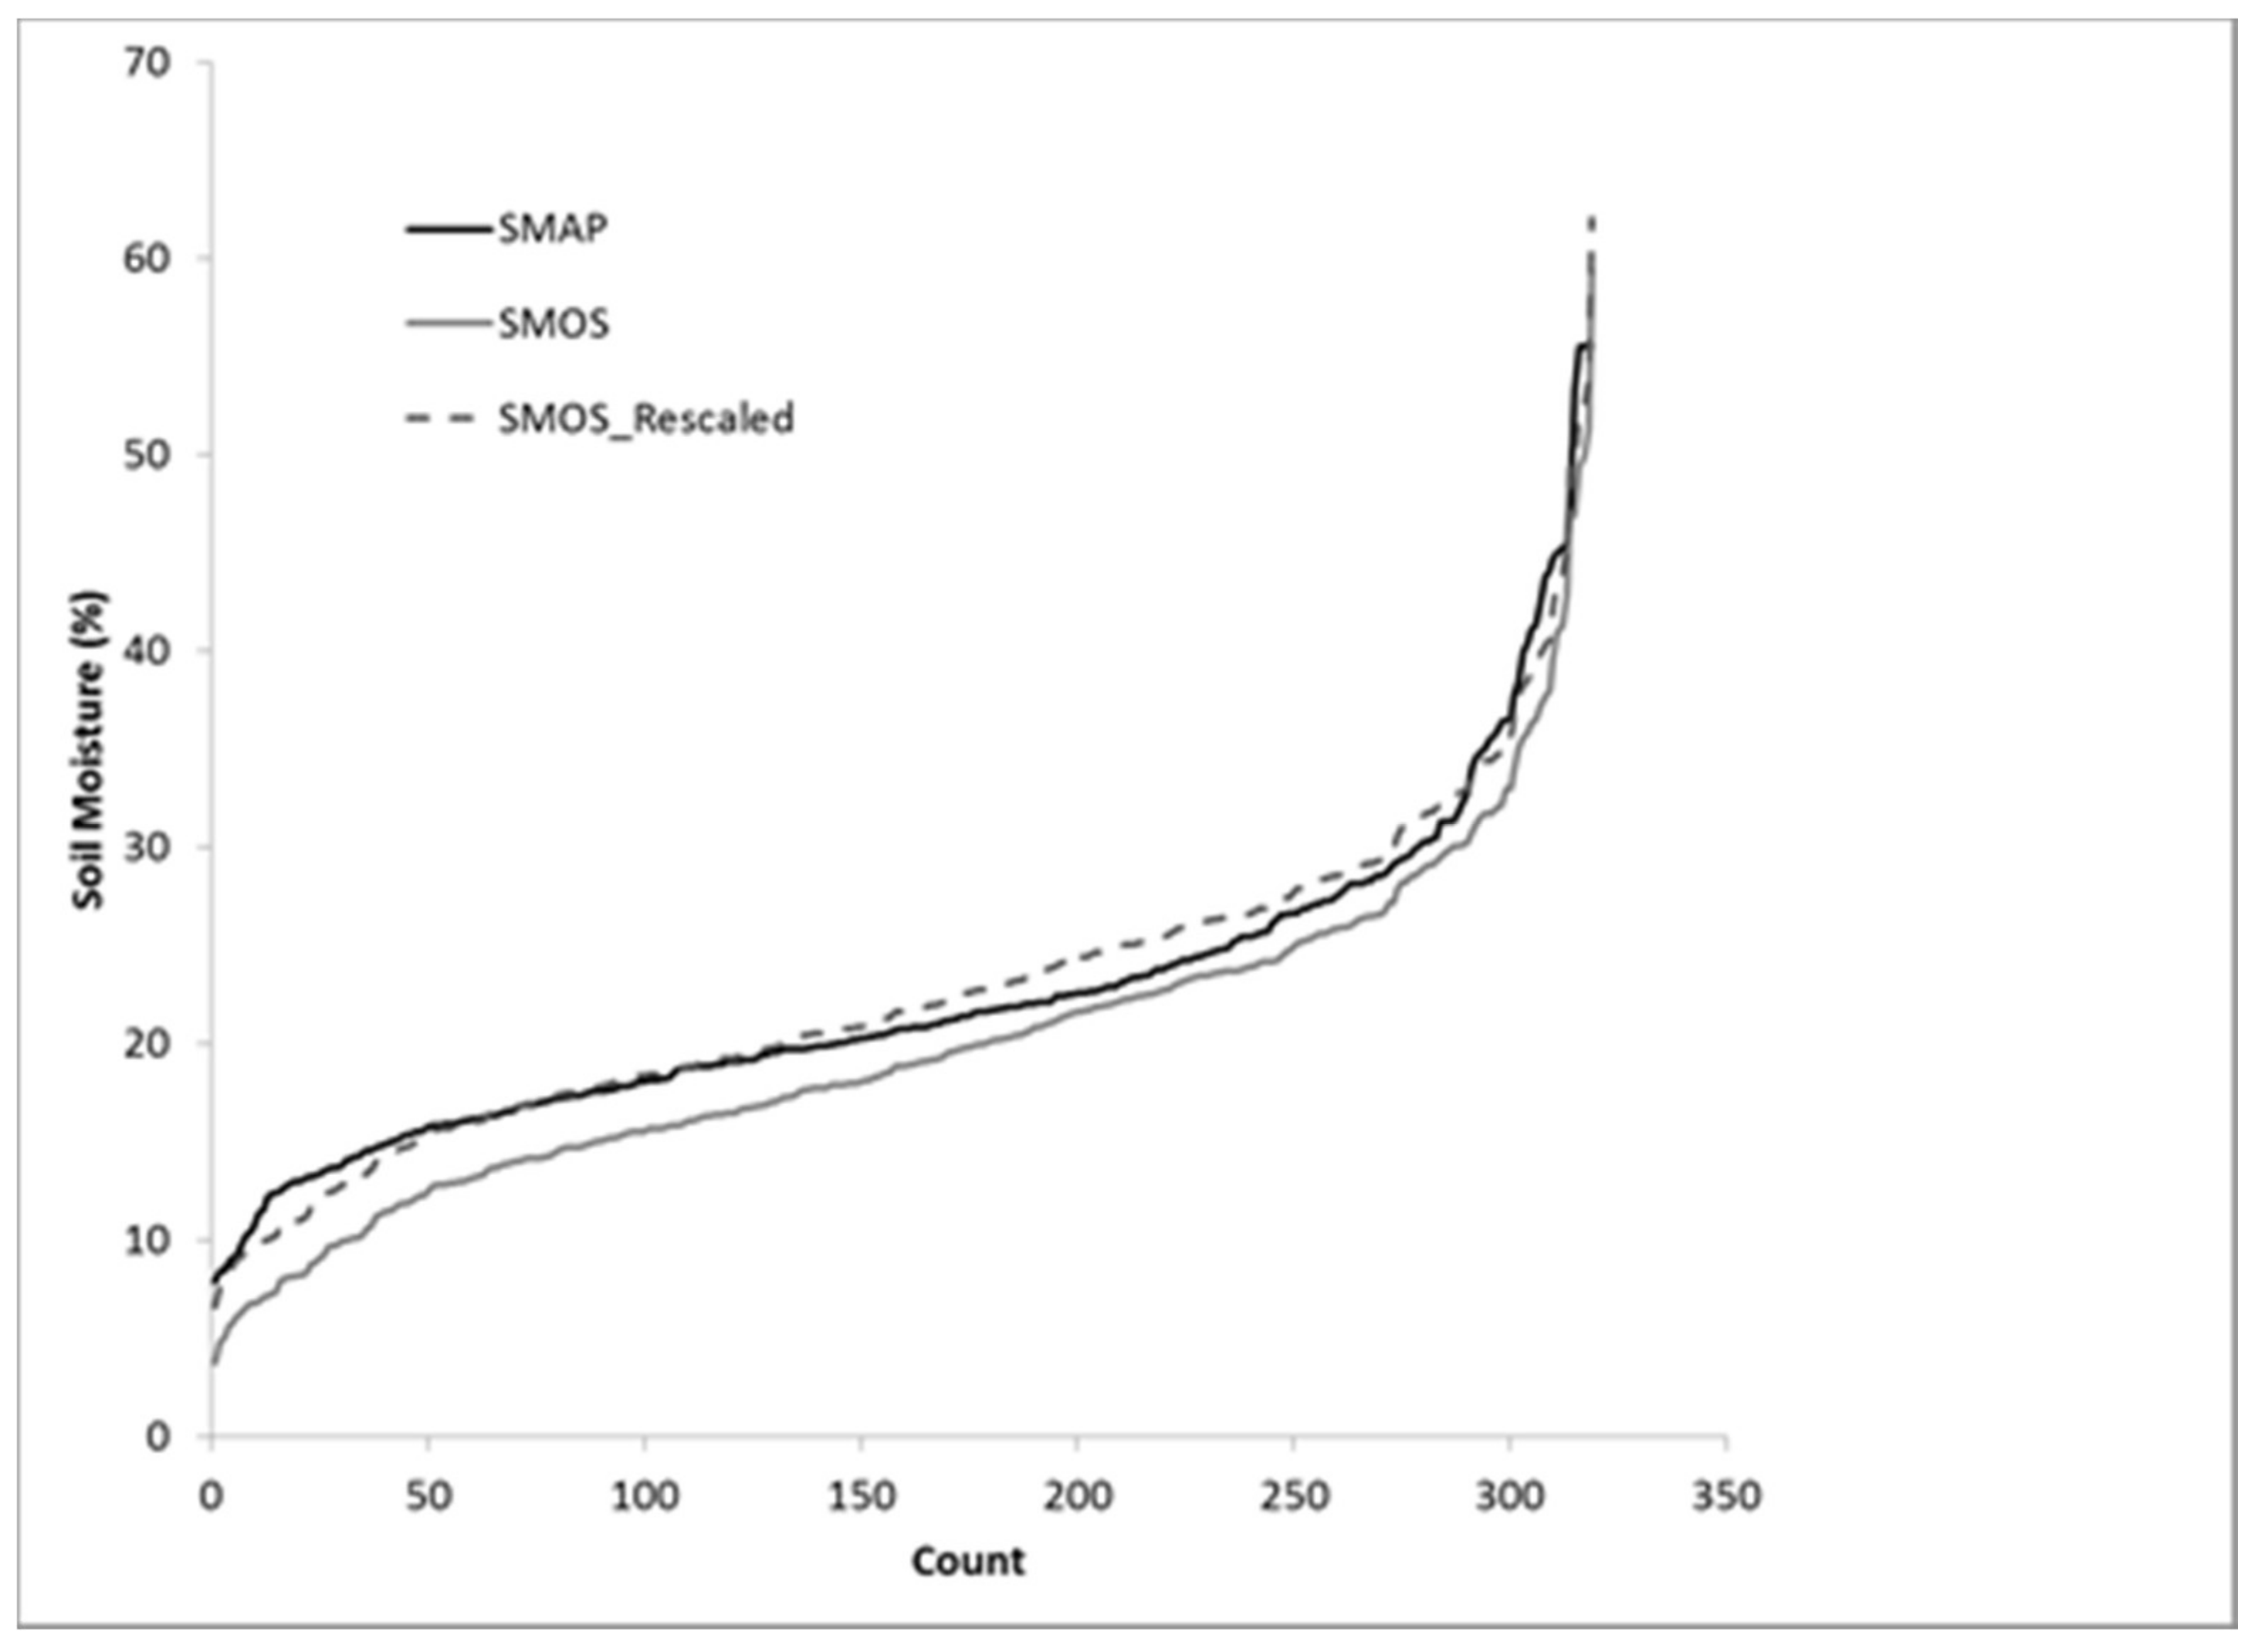
2.2. Satellite Soil Moisture Data Sets

Soil moisture data from SMAP was acquired from the standard retrieval algorithms applied to the data by the mission teams. Several SMAP data sets using the Level 3 product, version 3 (subset 4.010) of the data were evaluated to determine if differences would impact the sensitivity to risks [28,29]. The 9 km Active-Passive soil moisture product (SMAP_AP) was evaluated for the 2015 period during which the active sensor was functioning (April 13, 2015 to July 7, 2015). The 36 km passive microwave derived soil moisture product (SMAP_P36) and the 9 km enhanced passive microwave data set (SMAP_P09) were also evaluated for the 2015–2016 seasons. Finally, the 9 km Level 4 soil moisture analysis update data sets (SMAP_AUP_surface, SMAP_AUP_rootzone) were evaluated at the surface and root zone for the 2015–2016 seasons. More details on the retrieval of soil moisture from the SMAP sensor can be obtained from the product documentation, but a brief summary is provided here. Soil moisture is derived from the SMAP passive sensor using L-band brightness temperature measurements and a single-channel retrieval algorithm at V-polarization. The retrieval model solves the tau-omega model using a constant incidence angle, solving for soil moisture as a single variable [30]. Ancillary data is used to account for variables that impact the brightness temperature other than the soil moisture. Vegetation optical depth is taken from a 13-year climatological database of the Normalized Difference Vegetation Index (NDVI) and is not specific to each crop type, and surface temperature is estimated using the NASA Global Land Data Assimilation Model. Results from the descending (morning) pass only were used since these represent higher quality retrievals due to greater uniformity in surface soil temperature and reduced impacts of Faraday rotation [31]. The Active-Passive soil moisture combines soil moisture retrieved using the passive sensor, with soil moisture retrieved using the active microwave sensor located on the SMAP platform [32]. As these retrievals have higher noise levels, the soil moisture is retrieved at a 3 km grid spacing and combined with the retrieved soil moisture from the passive sensor to create a downscaled 9 km soil moisture data set (SMAP_AP). Level 4 soil moisture data sets (SMAP_AUP_surface and SMAP_AUP_rootzone) were retrieved using a methodology described here [33]. In brief, the brightness temperature data from SMAP is assimilated into the NASA Catchment land surface model using an ensemble Kalman filter approach to update the model analysis with measured data from SMAP. The model assimilates data where retrievals are valid, but provides data over all grid cells where a valid land surface model value is retrieved, resulting in a temporally and spatially complete data set where retrieved values represent both soil moisture estimations impacted by data assimilation as well as modelled soil moisture only where and when soil moisture retrievals were not valid. Analysis updates were retrieved for this study for both the surface layer (top 5 cm) and the root zone (top 100 cm). The SMAP soil moisture retrieval algorithms include a Retrieval Quality Flag (RQF) that flags retrievals over surfaces with permanent ice and snow, urban areas, wetlands, and vegetated areas with vegetation water content greater than 5 kg/m2, as well as areas with close proximity to coastal areas and large water bodies. The result is limited to high quality retrievals over Canada (Figure 1), particularly in coastal regions and in proximity to the North American Great Lakes. Future improvements to SMAP retrieval correction for water bodies will greatly expand the area where analyses can be conducted. For the purposes of this study, results were only conducted over areas where SMAP retrievals were available.
Due to the short time frame for which the SMAP sensor has been operating and the importance of historical context in assessing risk conditions, SMAP data for this study was combined with soil moisture retrieved from the SMOS sensor, which uses a similar radiometric frequency to retrieve soil moisture at a comparable spatial resolution to the SMAP data. This was done to build an index of soil moisture risk by developing a longer term average. Although other, longer term satellite soil moisture data sets are available, such as the European Space Agency Climate Change Initiative (ESA-CCI) data set, this study was restricted to the SMOS-SMAP operational time frame since other data sets use soil moisture derived at different radiometric frequencies that are not optimal for soil moisture retrieval. A previous study found that SMOS soil moisture over a six year period was able to provide in most areas an adequate range of variability to capture soil moisture extremes to characterize risk conditions [4]. A gridded SMOS soil moisture data set produced by Agriculture and Agri-Food Canada was used for the index development and is described in more detail here [21]. In brief, the data set uses the Level 2 soil moisture data using version 6.30 of the soil moisture processor. These data were interpolated using a simple averaging approach to a 0.25 degree resolution flat global grid. The SMOS soil moisture processor uses the tau-omega model to quantify the soil dielectric constant and vegetation opacity using multi-angular brightness temperature and an iterative optimization method to achieve a best fit between measured and modelled brightness temperatures [34]. As with SMAP, the vegetation water content is estimated using global models and is not crop specific.

2.3. Soil Moisture Difference from Average (SMDA) Index

To use soil moisture to quantify risk conditions, an index that evaluates current soil moisture compared to a long-term average was calculated for each location and time step. The soil moisture difference from average (SMDA) was calculated as the current soil moisture difference from the multi-year average for each time step and location for the available data record (2010–2016):
SMDA = SMc − (SMavg),
where SMc is the current soil moisture conditions and the SMavg is the average of the soil moisture for each year in the baseline. The average is calculated uniquely for each pixel and time step (i.e., monthly), such that the average conditions are indicative of what is normally observed for a given place and time. For example, the average for location A for the month of April would be calculated from the average for the pixel associated with location A for April of each year in the data record. A previous study evaluated this index using SMOS satellite data and found that this index was more robust than other indices, such as percentiles, when only a short data record is available [4]. One of the limitations of satellite based indices that only capture surface soil moisture is that they do not adequately represent water accumulation, since they do not capture storage in the profile that would reflect long term moisture deficits or long term saturation beyond a short period [35]. To compensate for this deficiency, an accumulating or long-term SMDA was computed that weights historical observations in a similar manner to the calculation of the Palmer Drought Severity Index [36]:
SMDA-LTc = SMDAc (0.25) + SMDA-LTp (0.75),
where SMDAc is the current Soil Moisture Difference from Average and SMDA-LTp is the accumulating SMDA from the previous time step. The SMDA-LTp is equal to the SMDA at the first time step. In this way, negative extremes, for example, that have occurred in the past can weigh on the current index until the conditions move closer to average or above average. Due to the short window in which soil moisture can be observed from satellites in most parts of Canada due to frozen winter surface conditions, the SMDA-LT was computed starting with the SMDA value for the month of April, and the accumulation term applied to subsequent months up to the end of October. The weights on each term in Equation (2) were determined iteratively by varying the weights in Equation (2) in comparison to seasonal precipitation anomalies. Fractional weights varying from 0.25 to 0.95 were used, and the optimal weight was selected based on the correlation between the SMDA-LT and the cumulative seasonal precipitation. It was found that weighting the soil moisture from the previous time step using a weight of 0.75 removed high frequency variation that was not representative of longer term trends. This is consistent with recent findings, that surface soil moisture from satellites globally retains only 14% of precipitation after three days [35].
Due to the short data record of SMAP soil moisture, a blended SMOS-SMAP data set was used to calculate the long-term average. The blended data set was created by spatially resampling daily gridded SMOS soil moisture to the daily gridded SMAP soil moisture grid at 9 and 36 km, and calculating the cumulative distribution function (CDF) of each data set of the coincident time periods in 2015 and 2016. The SMOS data was then corrected to the SMAP data climatology relating the mean and standard deviation of each data set to create an unbiased time series using a CDF matching approach [37]:
SMOSrescaled = P1 + (P2 × SMOS),
where
P1 = SMOSavg − (SMAPavg × P2),
P2 = SMAPstd/SMOSstd,
where SMOSavg is the average soil moisture from SMOS and SMAPavg is the average soil moisture from SMAP over the comparable time period of 2015–2016. Similarly, SMOSstd and SMAPstd is the standard deviation of SMOS and SMAP over the comparable time period of 2015–2016. Note that the calculation of the statistics for CDF matching differs from the statistics used to calculate the SMDA in Equation (1); for the CDF matching, the mean for each sensor is calculated for each pixel using all days with valid observations in the satellite record, whereas Equation (1) calculates a mean that is time specific, such that the number of values in the mean in Equation (1) is equivalent to the number of years in the satellite record. The use of the mean and standard deviation for CDF matching was selected for simplicity as an exploration of the impacts of different CDF matching approaches was beyond the scope of this study. The statistical distribution of each data set before and after CDF matching for a selected location is given in Figure 2. The use of SMOS and SMAP together resulted in a baseline of seven years used in the calculation of the SMDA in Equation (1). To evaluate if any advantage is gained from using a SMAP-SMOS blend over SMOS data along, these indices were also calculated using SMOS data only as was done in [4].

2.4. Hydroclimatic Risk Indicators and Analyses

Quantifying hydroclimatic risk is complex, and often many different indicators are used to capture different aspects, intensities, and durations of risk events. Validating SMAP as an indicator of risk, therefore, requires evaluation against numerous metrics to better understand what the soil moisture data is most sensitive to and how it may complement existing indicators. For this study, risk was assessed using both a ground based set of modelled quantitative indicators (the Palmer Drought Severity Index and the Crop Water Deficit Index) and an expert qualitative analyses based on a large number of quantitative indicators and regional expert reports. Climate Related Production Risk Committee (CRPRC) reports are prepared by the National Agroclimate Information Service of Agriculture and Agri-Food Canada (the national agricultural agency in Canada).
The CRPRC reports are produced biweekly during the active growing season from April to September, and monthly outside of that time period. The reports are based on a convergence of evidence approach and expert assessments for a suite of climate-related risks, including drought, excess moisture, and flooding. Information is summarized at the regional level using a dashboard with both quantitative and qualitative descriptions of risks categorized by type and severity of impact. Regional designations of risk type (i.e., “drought”, “dry”, “excess moisture”, “flood”) are reported, as well as severity based on intensity or geographic extent (ranging from “no significant risk” to “one or more significant risks, large urgent or disaster impacts”). The expert assessment is based on a large number of data inputs, including drought indices such as the Palmer Drought Severity Index (PDSI), the Standardized Precipitation Index (SPI), rainfall and temperature anomalies, short- and long-term weather forecasts as well as crowd sourced reports from farmers. These data sets are analyzed by regional experts and categorical descriptors of risks are assigned to each geographic region. To evaluate these against the SMDA, SMDA was calculated at monthly time steps and averaged to each geographic region and compared to the categorical descriptors from the CRPRC dashboard to evaluate sensitivity of the data to hydroclimatic risk.
To capture risk conditions at finer spatial scales, two modelled indicators of water related risk were computed at 346 climate stations located in agricultural or grassland regions of the study area. Each station had a complete daily record of precipitation and temperature covering at least a 30 year period. The PDSI is a well-established indicator of drought conditions and calculates drought severity by computing a simple water balance model using precipitation and temperature measurements [36]. This index is widely used in the drought monitoring community. For this study the PDSI was calculated using a modified formula, which replaces the water balance in the original model with one computed using the Versatile Soil Moisture Budget (VSMB) model [38,39]. For the PDI calculation, a 30 year normal period was used spanning from 1981–2010. This normal period differs from the average period used for the SMDA, so it should provide a more statistically robust assessment of drought conditions than the SMDA, which has an averaging period limited by the length of the satellite data record. PDSI has been found to be correlated with soil moisture in the soil profile at depths of approximately 1 m, and can therefore be used to evaluate if the SMDA can serve as a surrogate wetness indicator that is sensitive to profile soil moisture. The PDSI quantifies water related risk on a scale of −10 to +10, with −10 being the most severe drought, and +10 representing an abundance of rainfall (Table 2, adapted from [40]).
In addition to PDSI, a crop Water Deficit Index (WDI) was calculated using the VSMB model [41]. This index calculates water deficits as:
WDI = 1 − (AET/PET),
where AET and PET are the Actual and Potential Evapotranspiration rates, respectively. AET and PET are calculated within the VSMB model using temperature and precipitation data and a crop-specific biometeorological time scale model to estimate growth stage [42], with phenological and crop water extraction coefficients for spring wheat and canola taken from [43]. The WDI ranges between 0 and 1, with a value closer to 1 indicating higher stress (Table 3).

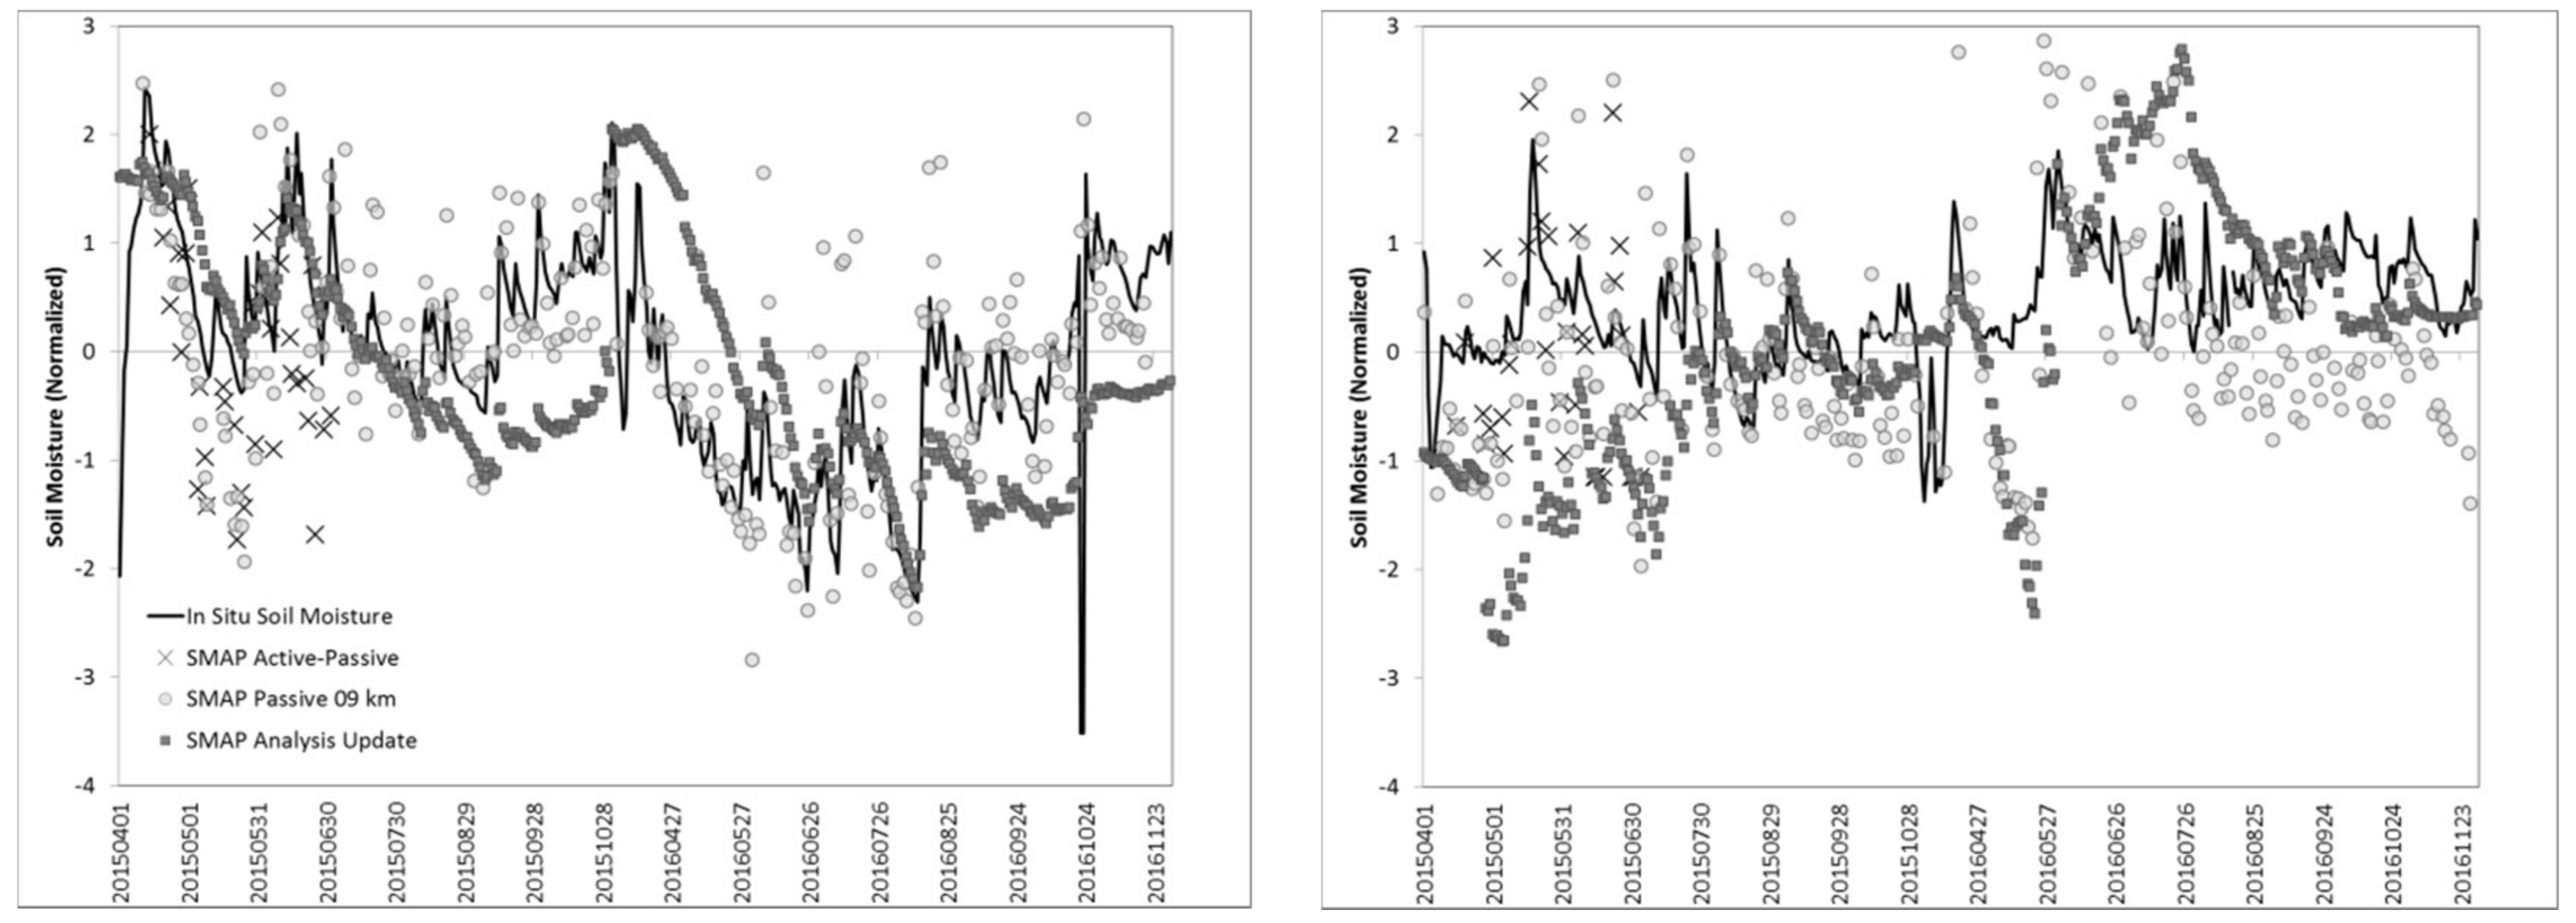
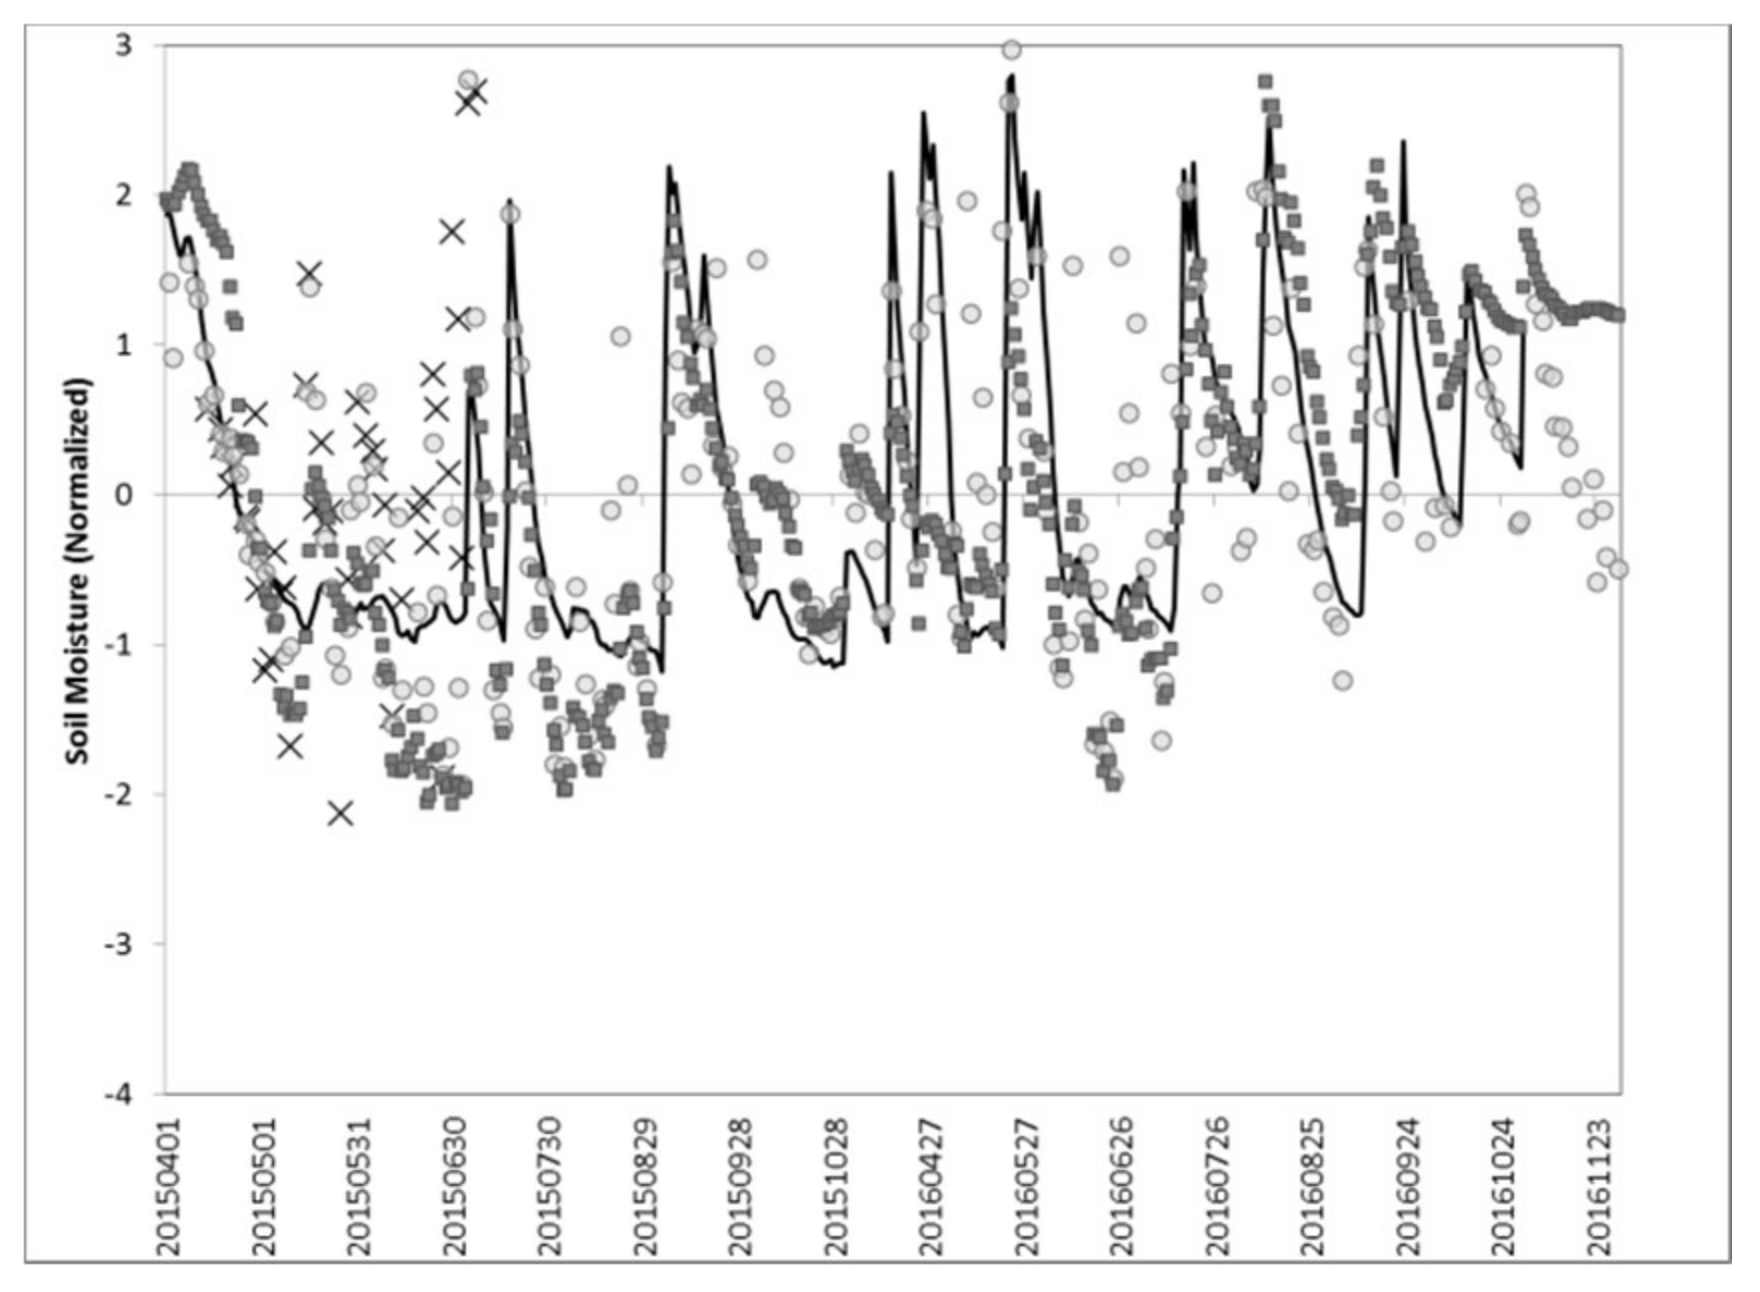
2.5. Ground-Based Soil Moisture Measurements

To evaluate which SMAP data set was optimal for this application, data sets were compared on a relative basis to measured soil moisture at in situ monitoring stations in agricultural regions in Canada. The objective of this work was not to perform a detailed validation of SMAP since this has been done elsewhere at the SMAP core validation sites in the study area [27,30,33]. Coincident records of ground-measured soil moisture were obtained from numerous sources as described in [21]. In brief, soil moisture from two sites that are part of the Real Time In-Situ Monitoring for Agriculture (RISMA) network were used, one in Ontario (east-central Canada) and one in Manitoba (west-central Canada). In addition, in situ measurements from numerous sites from the Alberta Ground Drought Monitoring Network (AGDMN) mesonet in western Canada were examined at surface and root zone. The RISMA sites were established for satellite data validation and consist of numerous stations selected to represent soil variability over a larger region detected within one satellite pixel [23]. The AGDMN sites were established to capture variability in climate over the province of Alberta, and consist of sparsely distributed stations that capture broader trends in the region are too sparse to characterize soil moisture at a pixel level. In situ stations were used for evaluation of relative soil moisture trends; detailed model validation of SMOS and SMAP using these data sets can be found elsewhere [21,23,27,44]. In situ soil moisture trends were evaluated over the 2015 and 2016 season for the four SMAP data sets described above: SMAP_AP, SMAP_P36, SMAP_P09 and the SMAP_AUP (SMAP_AUP_surface and SMAP_AUP_rootzone) at the validation sites in Ontario, Manitoba and over 33 sparsely distributed sites in the AGDMN. For this assessment, daily gridded soil moisture values were extracted for the pixel locations corresponding to in situ station locations and compared to average in situ soil moisture measured at each in situ station location. Since the objective of this assessment was to better evaluate data sets in terms of their sensitivity to wetting and drying trends, volumetric soil moisture was converted to standard normal deviates using the average and standard deviation of moisture values from each data set to normalize to a mean of zero and a standard deviation of one [37]. Comparisons between surface soil moisture products were made to in situ sensors at a 5 cm depth for all SMAP data sets. For the SMAP_AUP root zone modelled data, modelled soil moisture was compared to an integrated soil moisture value calculated from soil moisture measured at discrete depths up to 100 cm, such that the profile moisture was a depth-weighted average of in situ probes at 5, 20, 50, and 100 cm. All in situ soil moisture data sets were converted from absolute volumetric soil moisture to normalize values to compare bias free estimates to satellite data sets, using the same procedure applied to the satellite data. Temporal Pearson’s Pairwise correlation and relative Root Mean Squared Error (RMSE) are reported.

3. Results and Discussion

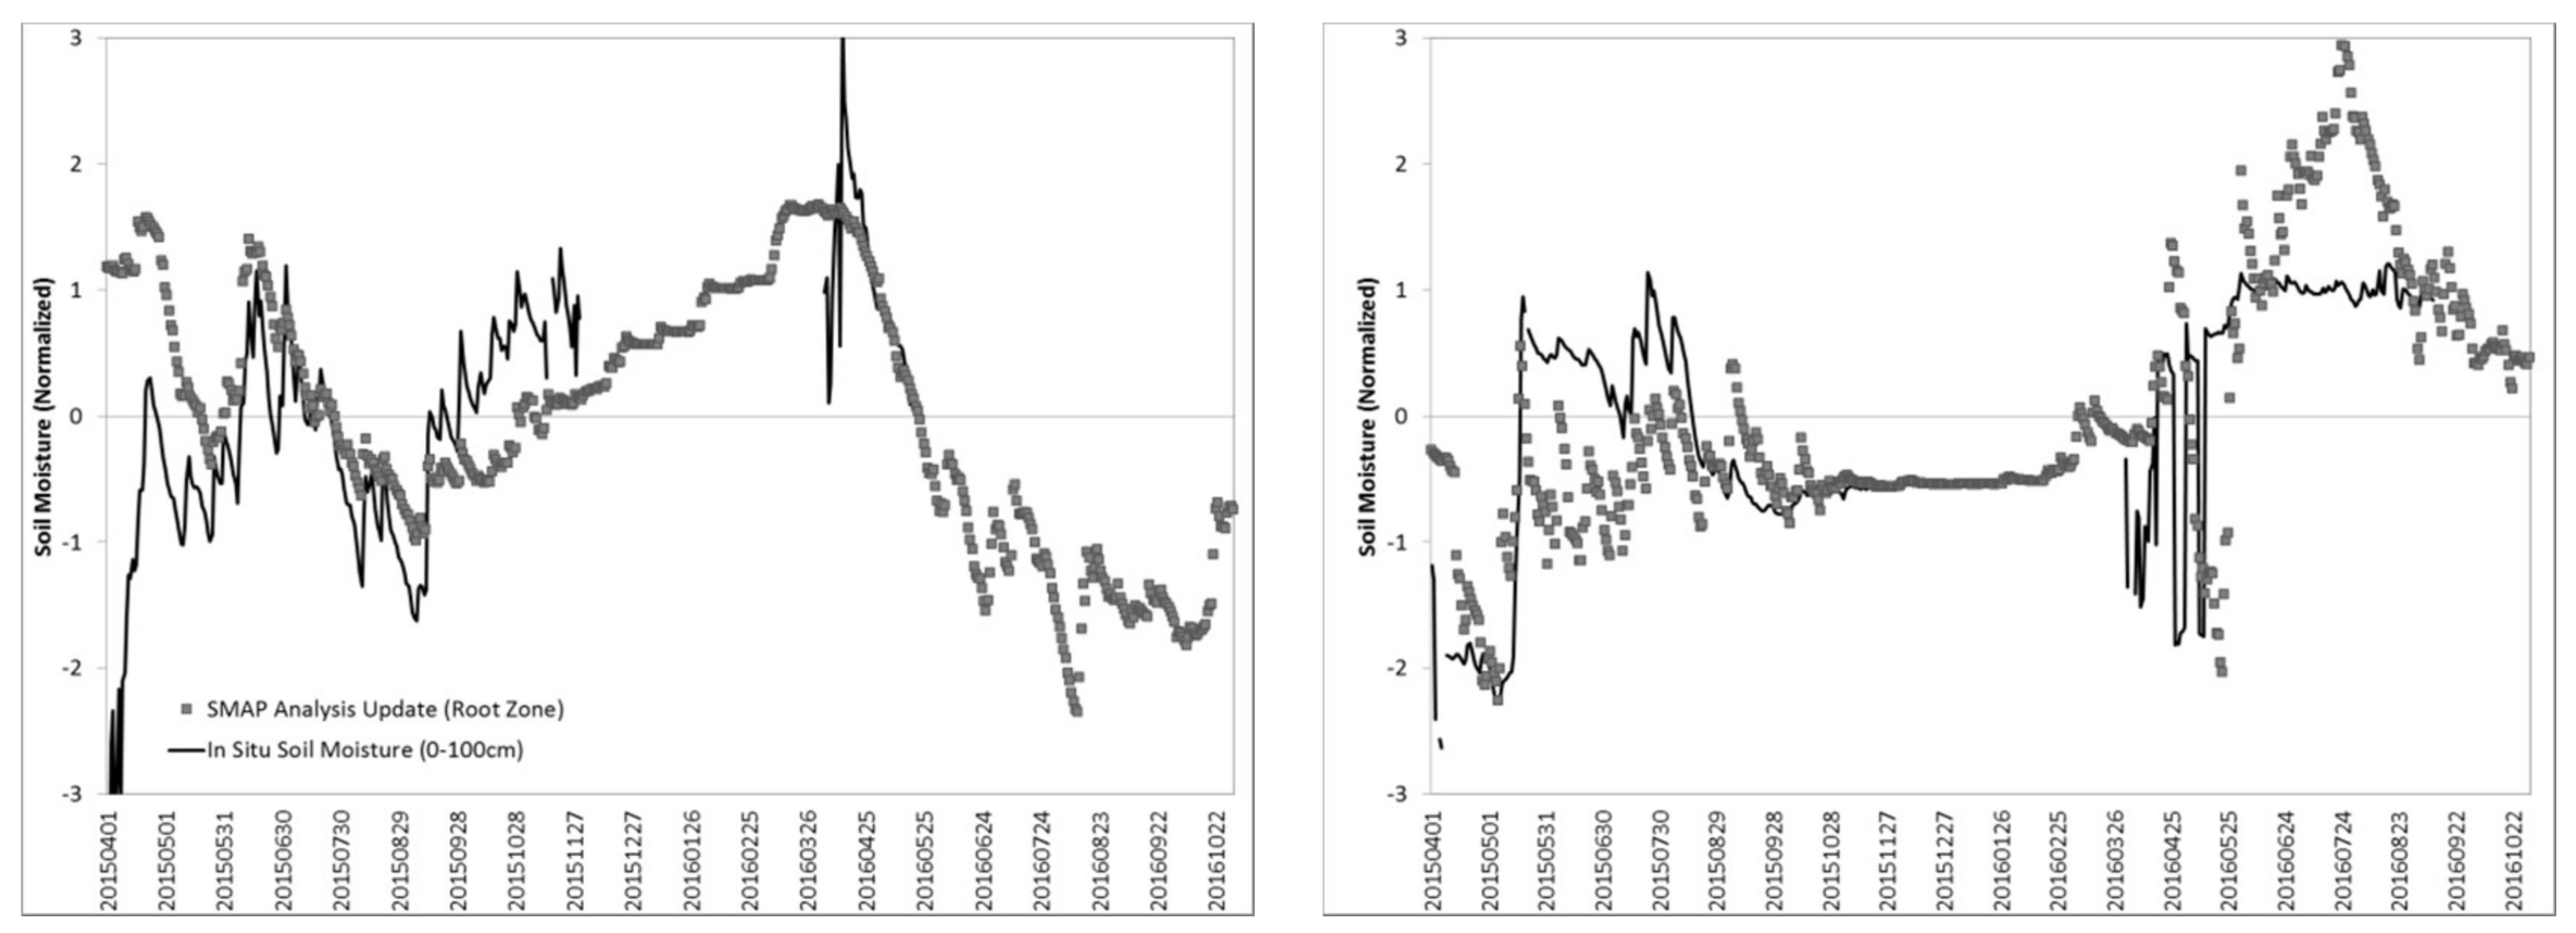
3.1. Relative Soil Moisture Trends Compared to In Situ

Overall, the SMAP passive soil moisture data sets (SMAP_P09 and SMAP_P36) showed the best correspondence, with correlation coefficients (R) averaging 0.5 over all sites and ranging as high as 0.8 for the Ontario site, and the lowest RMSE values (Table 4). These two data sets showed very similar trends at each site and there were no significant benefits in accuracy from using the spatially enhanced (SMAP_P09) data. The active-passive soil moisture data set (SMAP_AP) showed a somewhat weaker relationship with in situ soil moisture, with an average correlation of 0.3 over all sites, but ranging as high as 0.7 for some individual stations in the Alberta network. The SMAP_AUP soil moisture at the surface showed a similar relationship with in situ measurements as the SMAP_P09 and SMAP P36_data sets, but the relationship was much poorer at the Ontario site, where the estimates from SMAP_AUP_surface were much less responsive to the trends in late summer and fall (August, September and October) of both years evaluated (Figure 3). The relationship between all SMAP surface soil moisture data sets was poorest at the Manitoba site, where moisture trends were poorly estimated in April to July of 2015, and in particular in July and August of 2016. The difficulty in parameterizing SMOS and SMAP soil moisture retrieval models over this site has been discussed elsewhere and may be due to the high soil texture variability in this area [21,23,43]. Overall, there was a tendency of the satellite soil moisture to underestimate soil moisture during the driest conditions and overestimate it during wettest conditions, evident by the higher ‘peaks’ in both positive and negative soil moisture anomalies in Figure 3. For the SMAP_AP and SMAP_P09/P36 data sets, there was a greater underestimation of the magnitude of dry conditions, particularly for the sites in western Canada. Given the completeness and consistency of the passive microwave soil moisture, this data set was used in subsequent analysis. Since there was no significant difference between the soil moisture at the 36 km or 9 km grid for the passive soil moisture data set, the 9 km data set was used for further analyses.
The root zone (SMAP_AUP_rootzone) showed a somewhat lower overall correlation with the in situ trends than the surface analysis, with the exception of Manitoba and selected sites in Alberta, where the root zone analysis had a better correlation with measured soil moisture than the surface estimates (Table 4). Improved model performance seemed to be associated with reduced accuracy of the satellite soil moisture data sets. The SMAP_AUP_rootzone showed higher temporal variability than the measured root zone soil moisture, showing stronger wetting-drying cycles than what was measured (Figure 4). This could be due to the high influence of the SMAP surface measurements on the model update [33]. Given this high sensitivity to the surface soil moisture, it is not clear if a root zone soil moisture data set would provide a more robust estimator of risk than the surface estimates. Due to the short length of the SMAP_AUP data record and the absence of an analogous data set to perform longer term analysis (as is done with the surface measurements, combining them with SMOS data), this is difficult to assess, and so the evaluation of the SMAP_AUProotzone was limited to comparison against in situ data and this data set was not assessed against risk indicators as in the subsequent sections. A longer term data set would be needed to examine if assimilated satellite-modelled data sets provide improved information relevant to hydroclimatic risk.

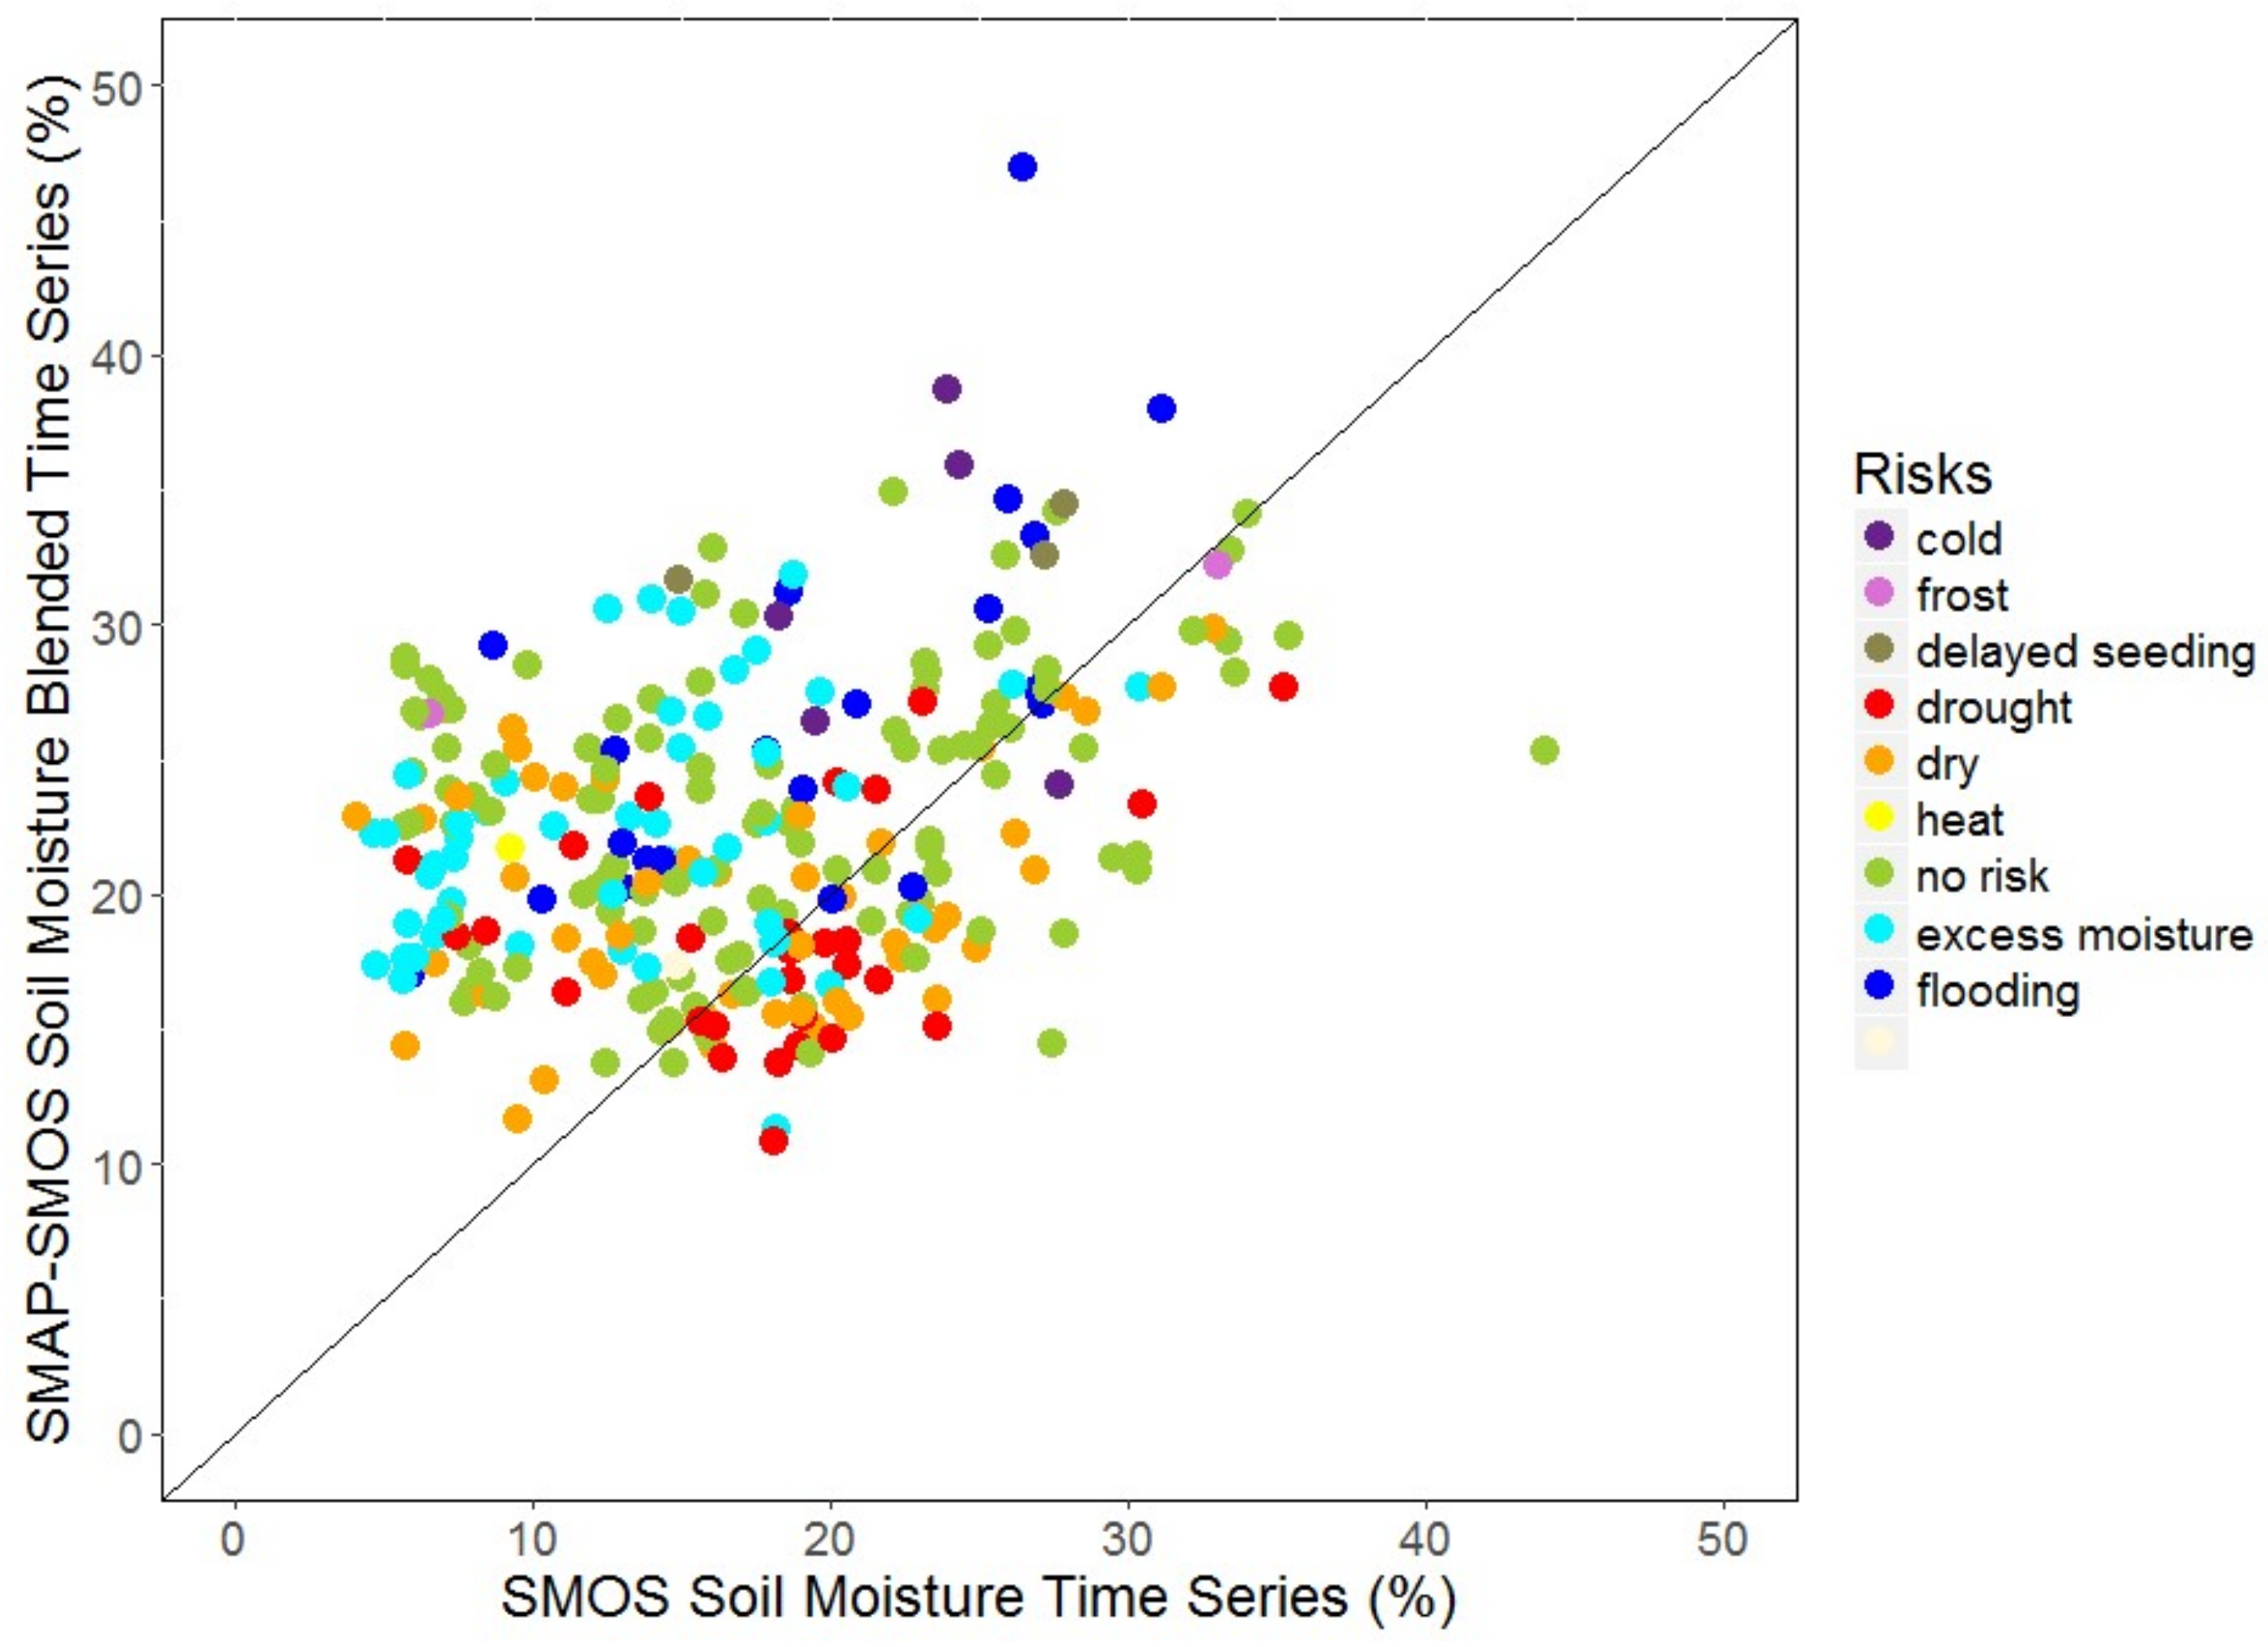
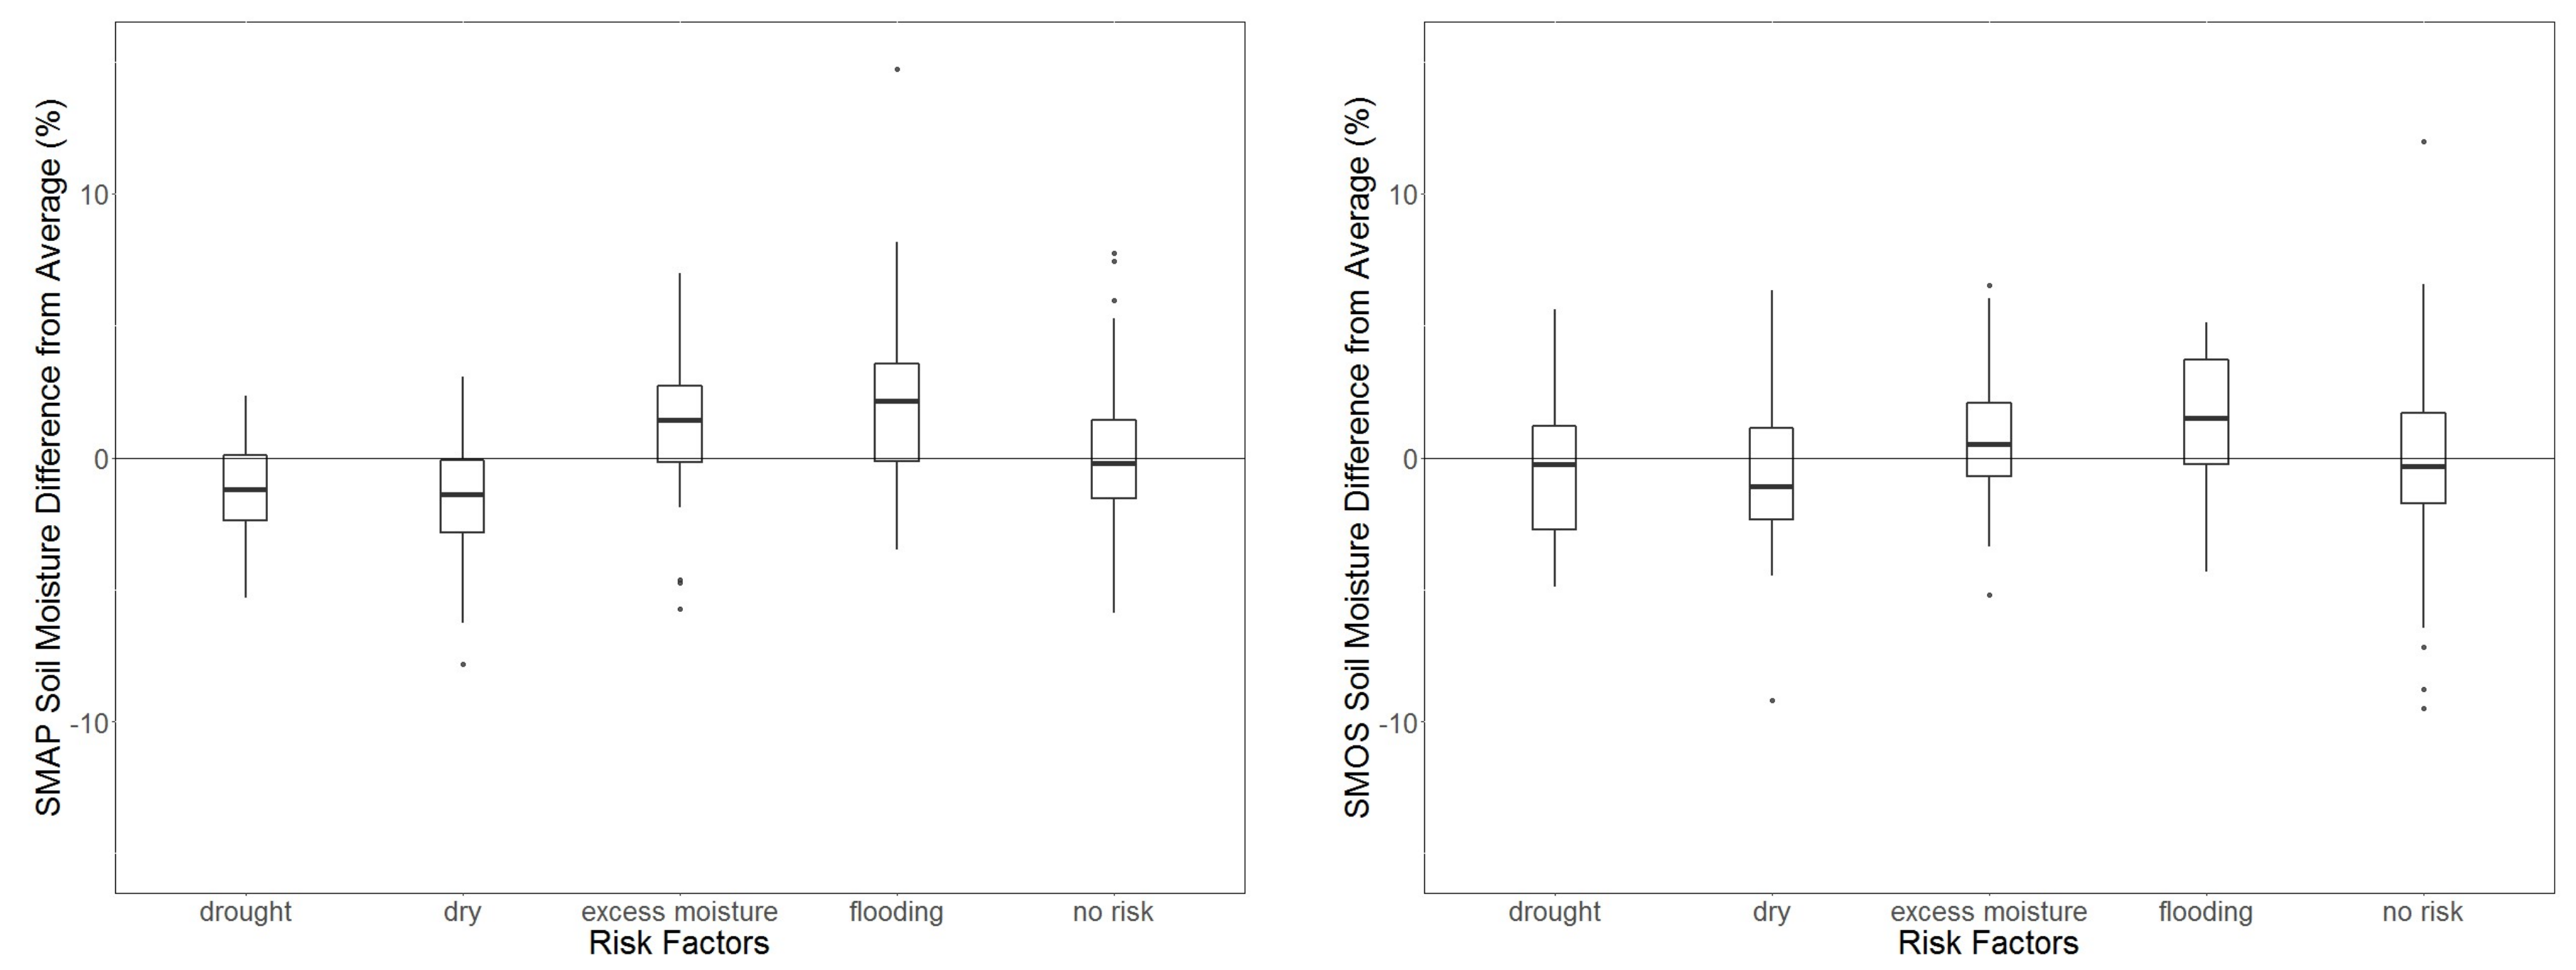
3.2. Assessment Against Expert-Based Risk Analysis

To gain an understanding of how the accuracy of the satellite data sets impact the use of the data for risk assessment, the soil moisture from the SMAP-SMOS and SMOS-only time series used to calculate the SMDA were compared to each other at the provincial scale and sorted by risk category (Figure 5). In general, the SMAP time series was wetter than the SMOS time series, particularly for areas that were identified as being subject to excess moisture. The range in moisture values between the SMAP-SMOS time series and the SMOS-only time series for areas where no risk was identified was high for both data sets, but somewhat higher in the SMOS-only data set (indicated by the larger horizontal spread in the data in Figure 5 than the vertical spread).
The blended SMAP-SMOS and the SMOS-only time series were used to calculate the SMDA under different risk categories (Figure 6). There was a large degree of variability in the SMDA for each risk category at the regional level. This may be in part due to the way that risks are analyzed, which assigns a general risk category at the regional level where the spatial extent of the risk conditions may be more localized. Overall, the risk conditions assessed from the SMAP-SMOS data set showed a general agreement with the CRPRC risk categories, with areas classified as drought or dry showing negative SMDA values and excess moisture and flooding showing positive SMDA values (Figure 6, left). In areas where no risk was assessed, the moisture values were close to zero, indicating they were exactly average over the long term and the variability was distributed equally in both directions. The blended SMAP-SMOS soil moisture time series showed a somewhat improved differentiation of wet and dry extremes compared to the SMOS-only soil moisture data set, with the average values more distinctly different from normal conditions in each case, the mid-quartile range more clearly above or below zero appropriate to each risk category, and a smaller overall interquartile range between the 25th and 75th quartiles. (Figure 6, right). This may be due to the differences between the soil moisture in each data set shown in Figure 5. Both data sets contained outliers that fell far outside the interquartile range, which may be related to the imprecise spatial delineation of risk using these qualitative reports, but could also be due to errors in both data sets in capturing relevant wetting and drying trends.

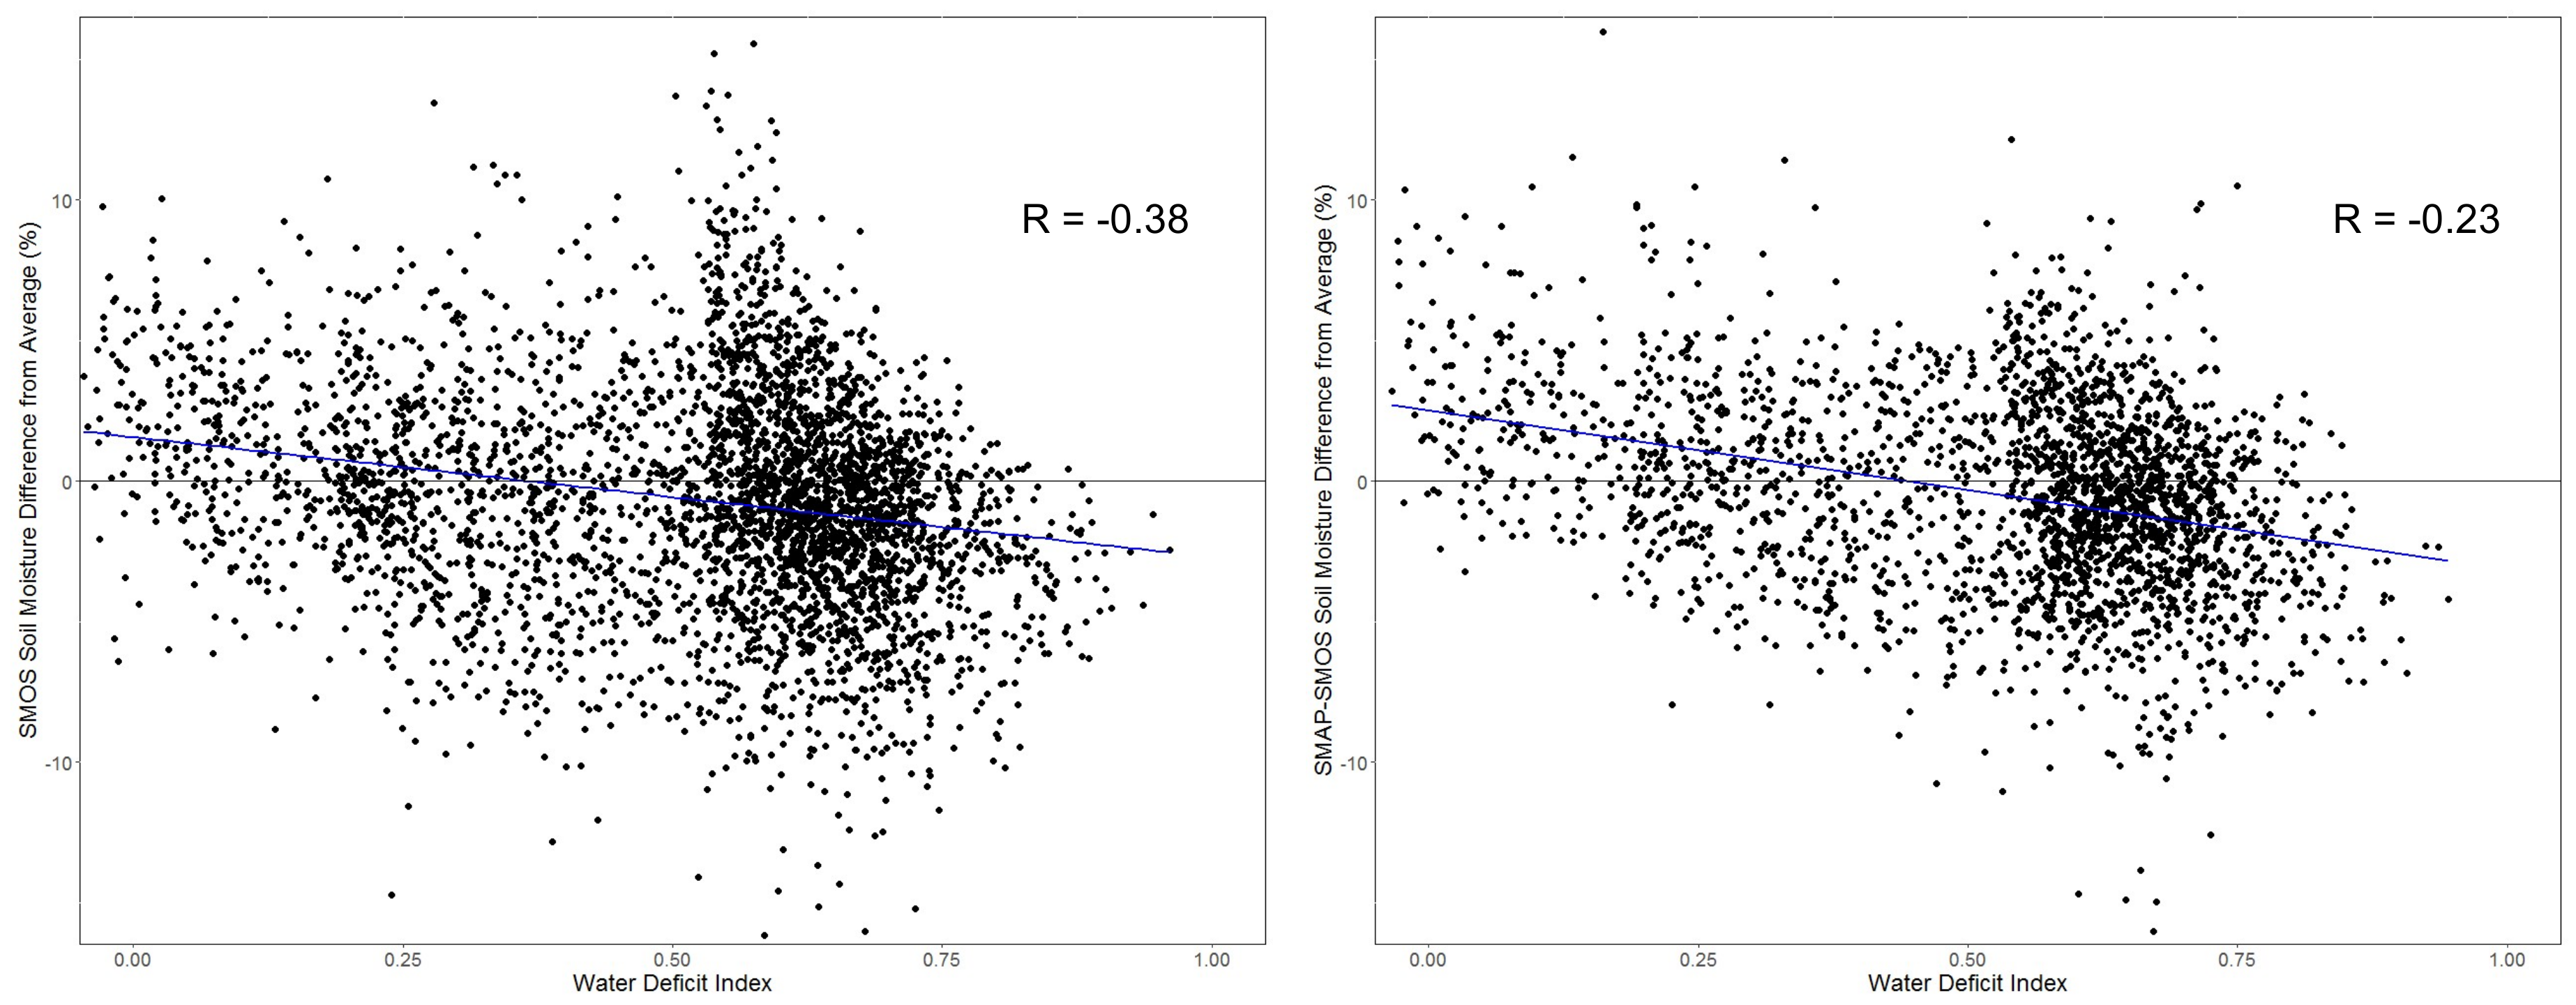
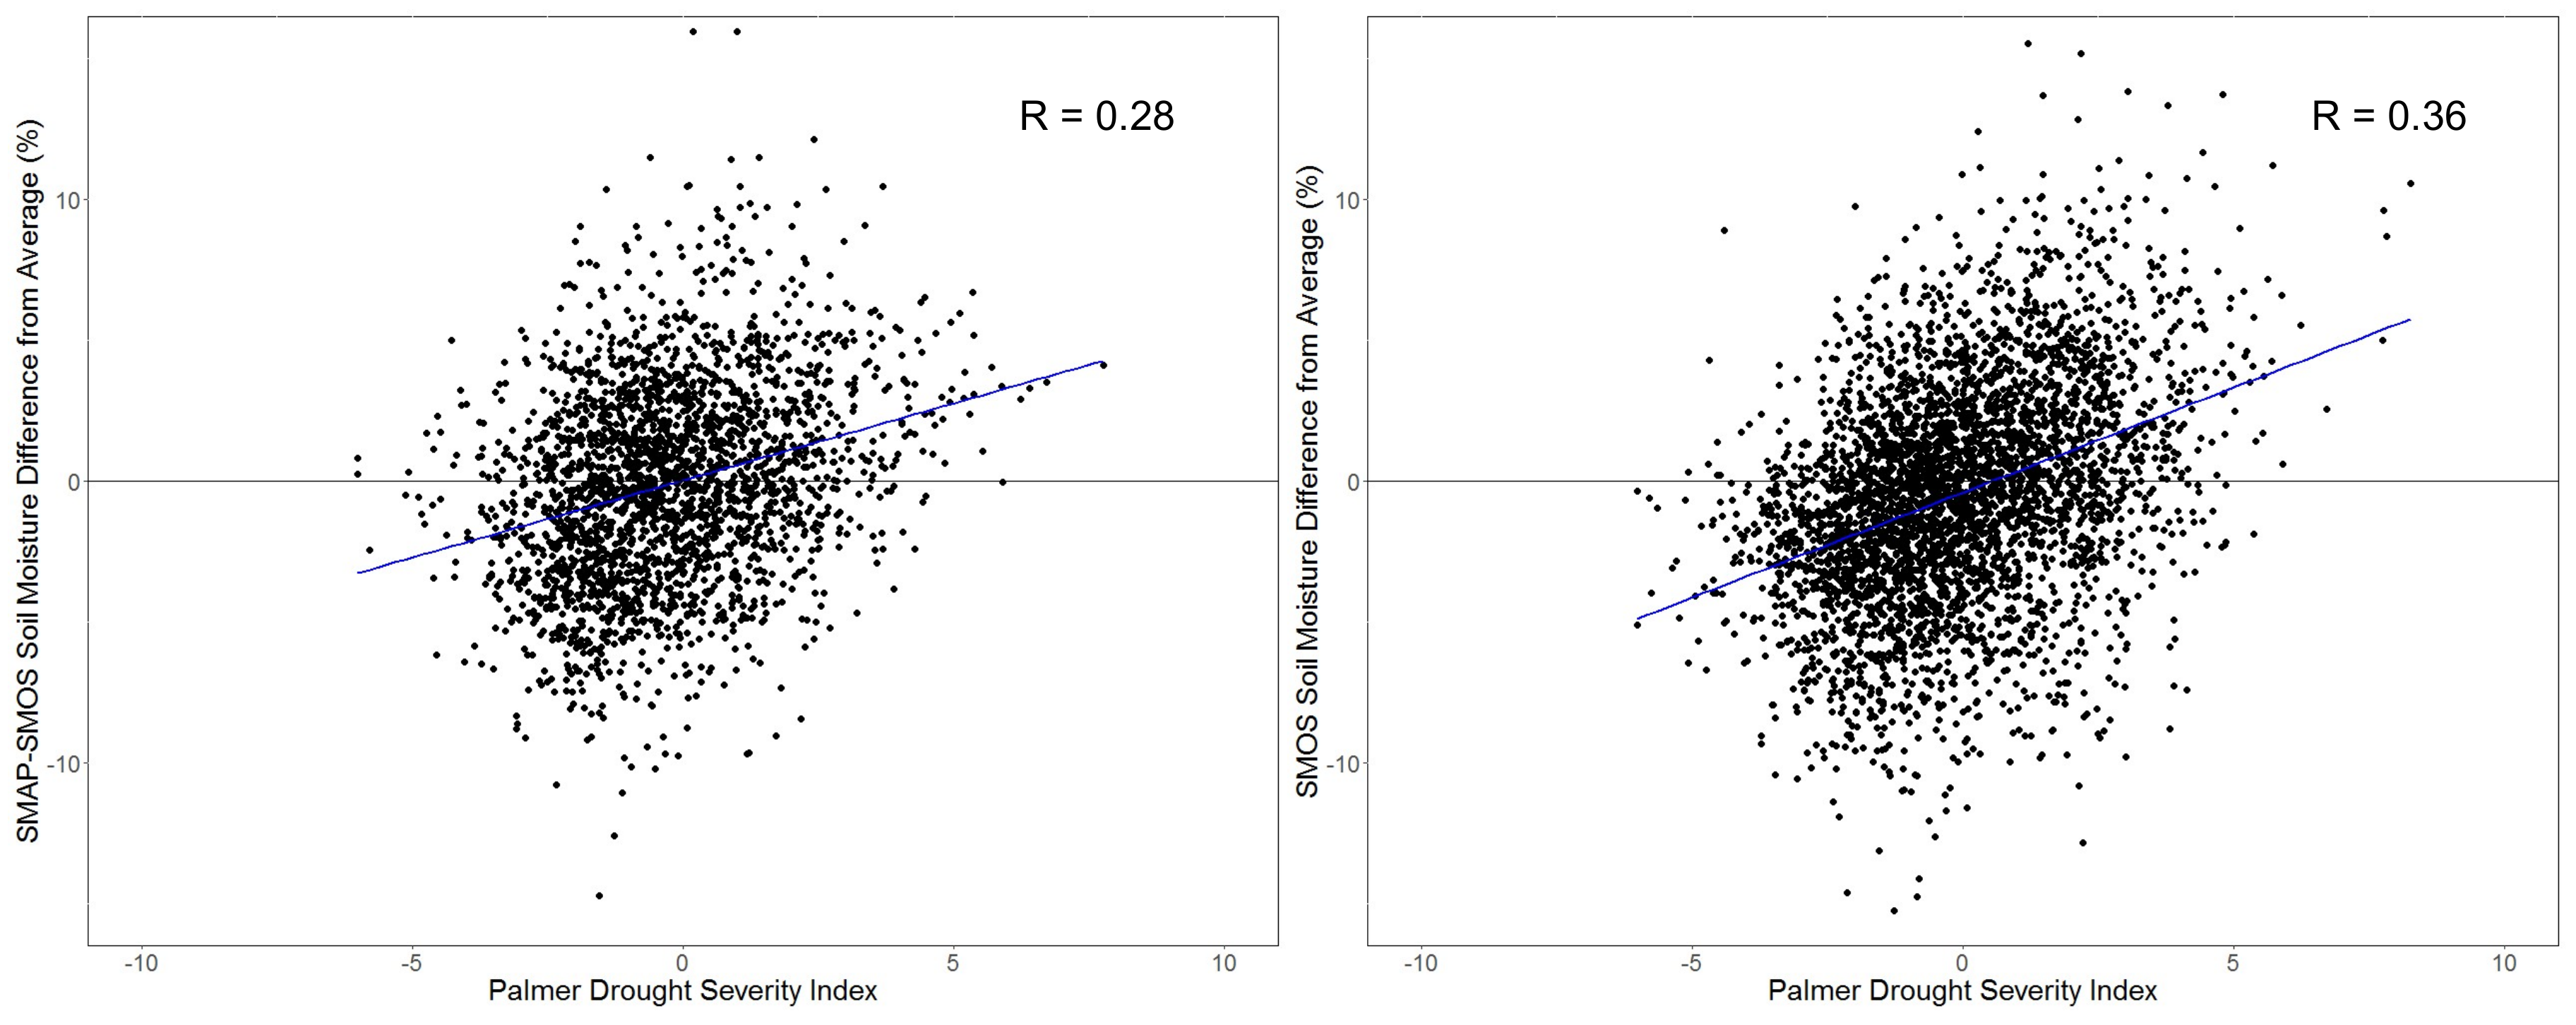
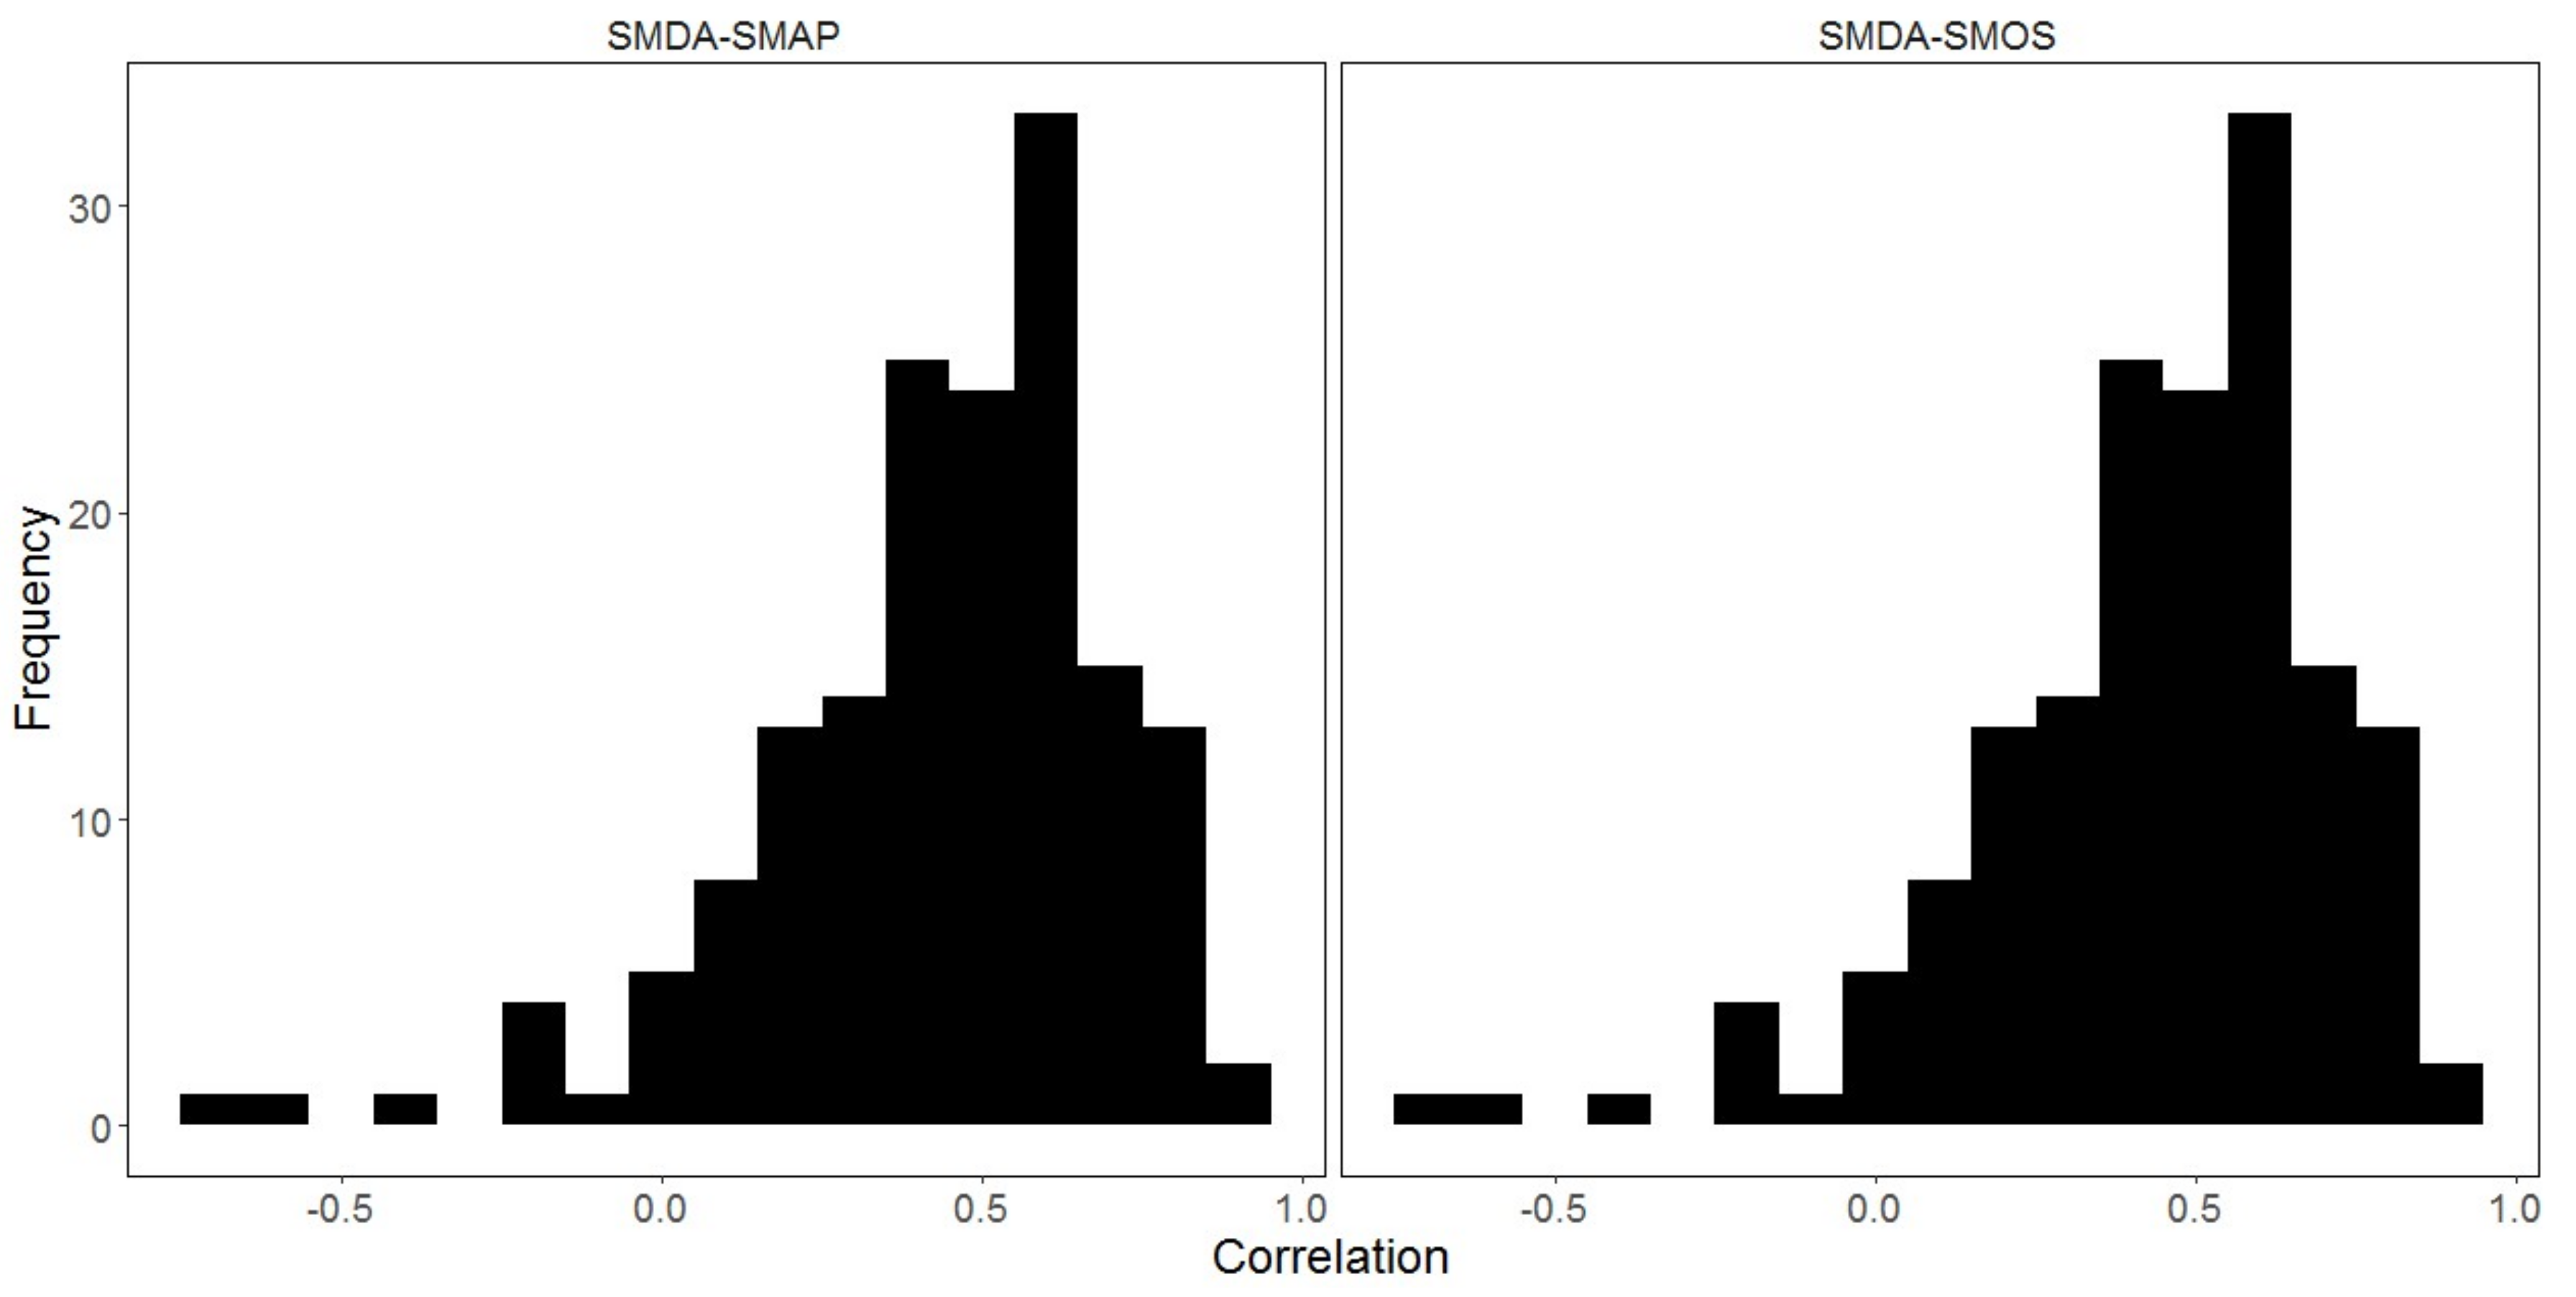
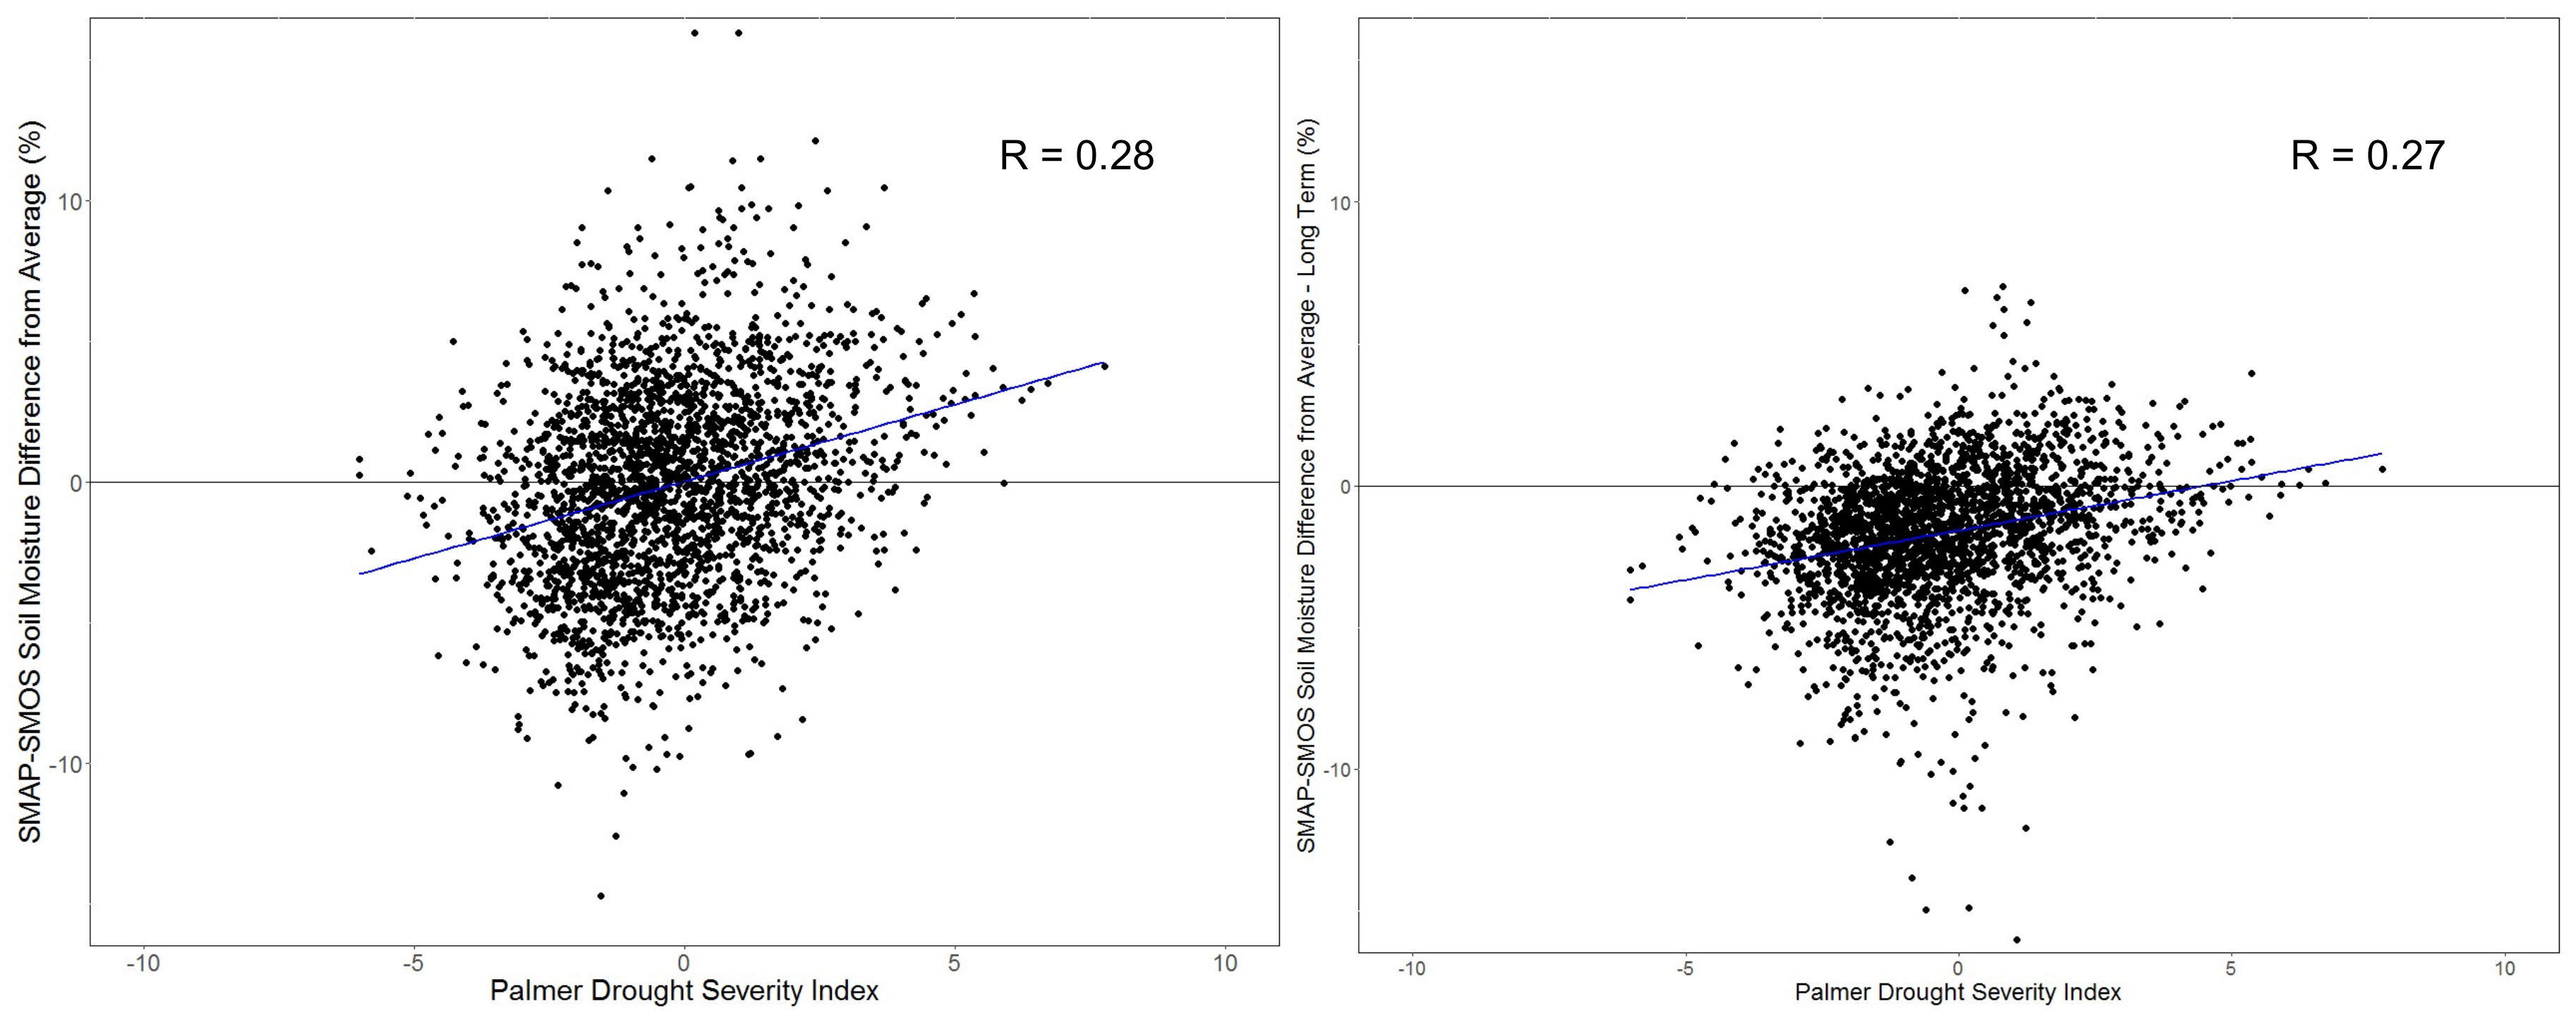
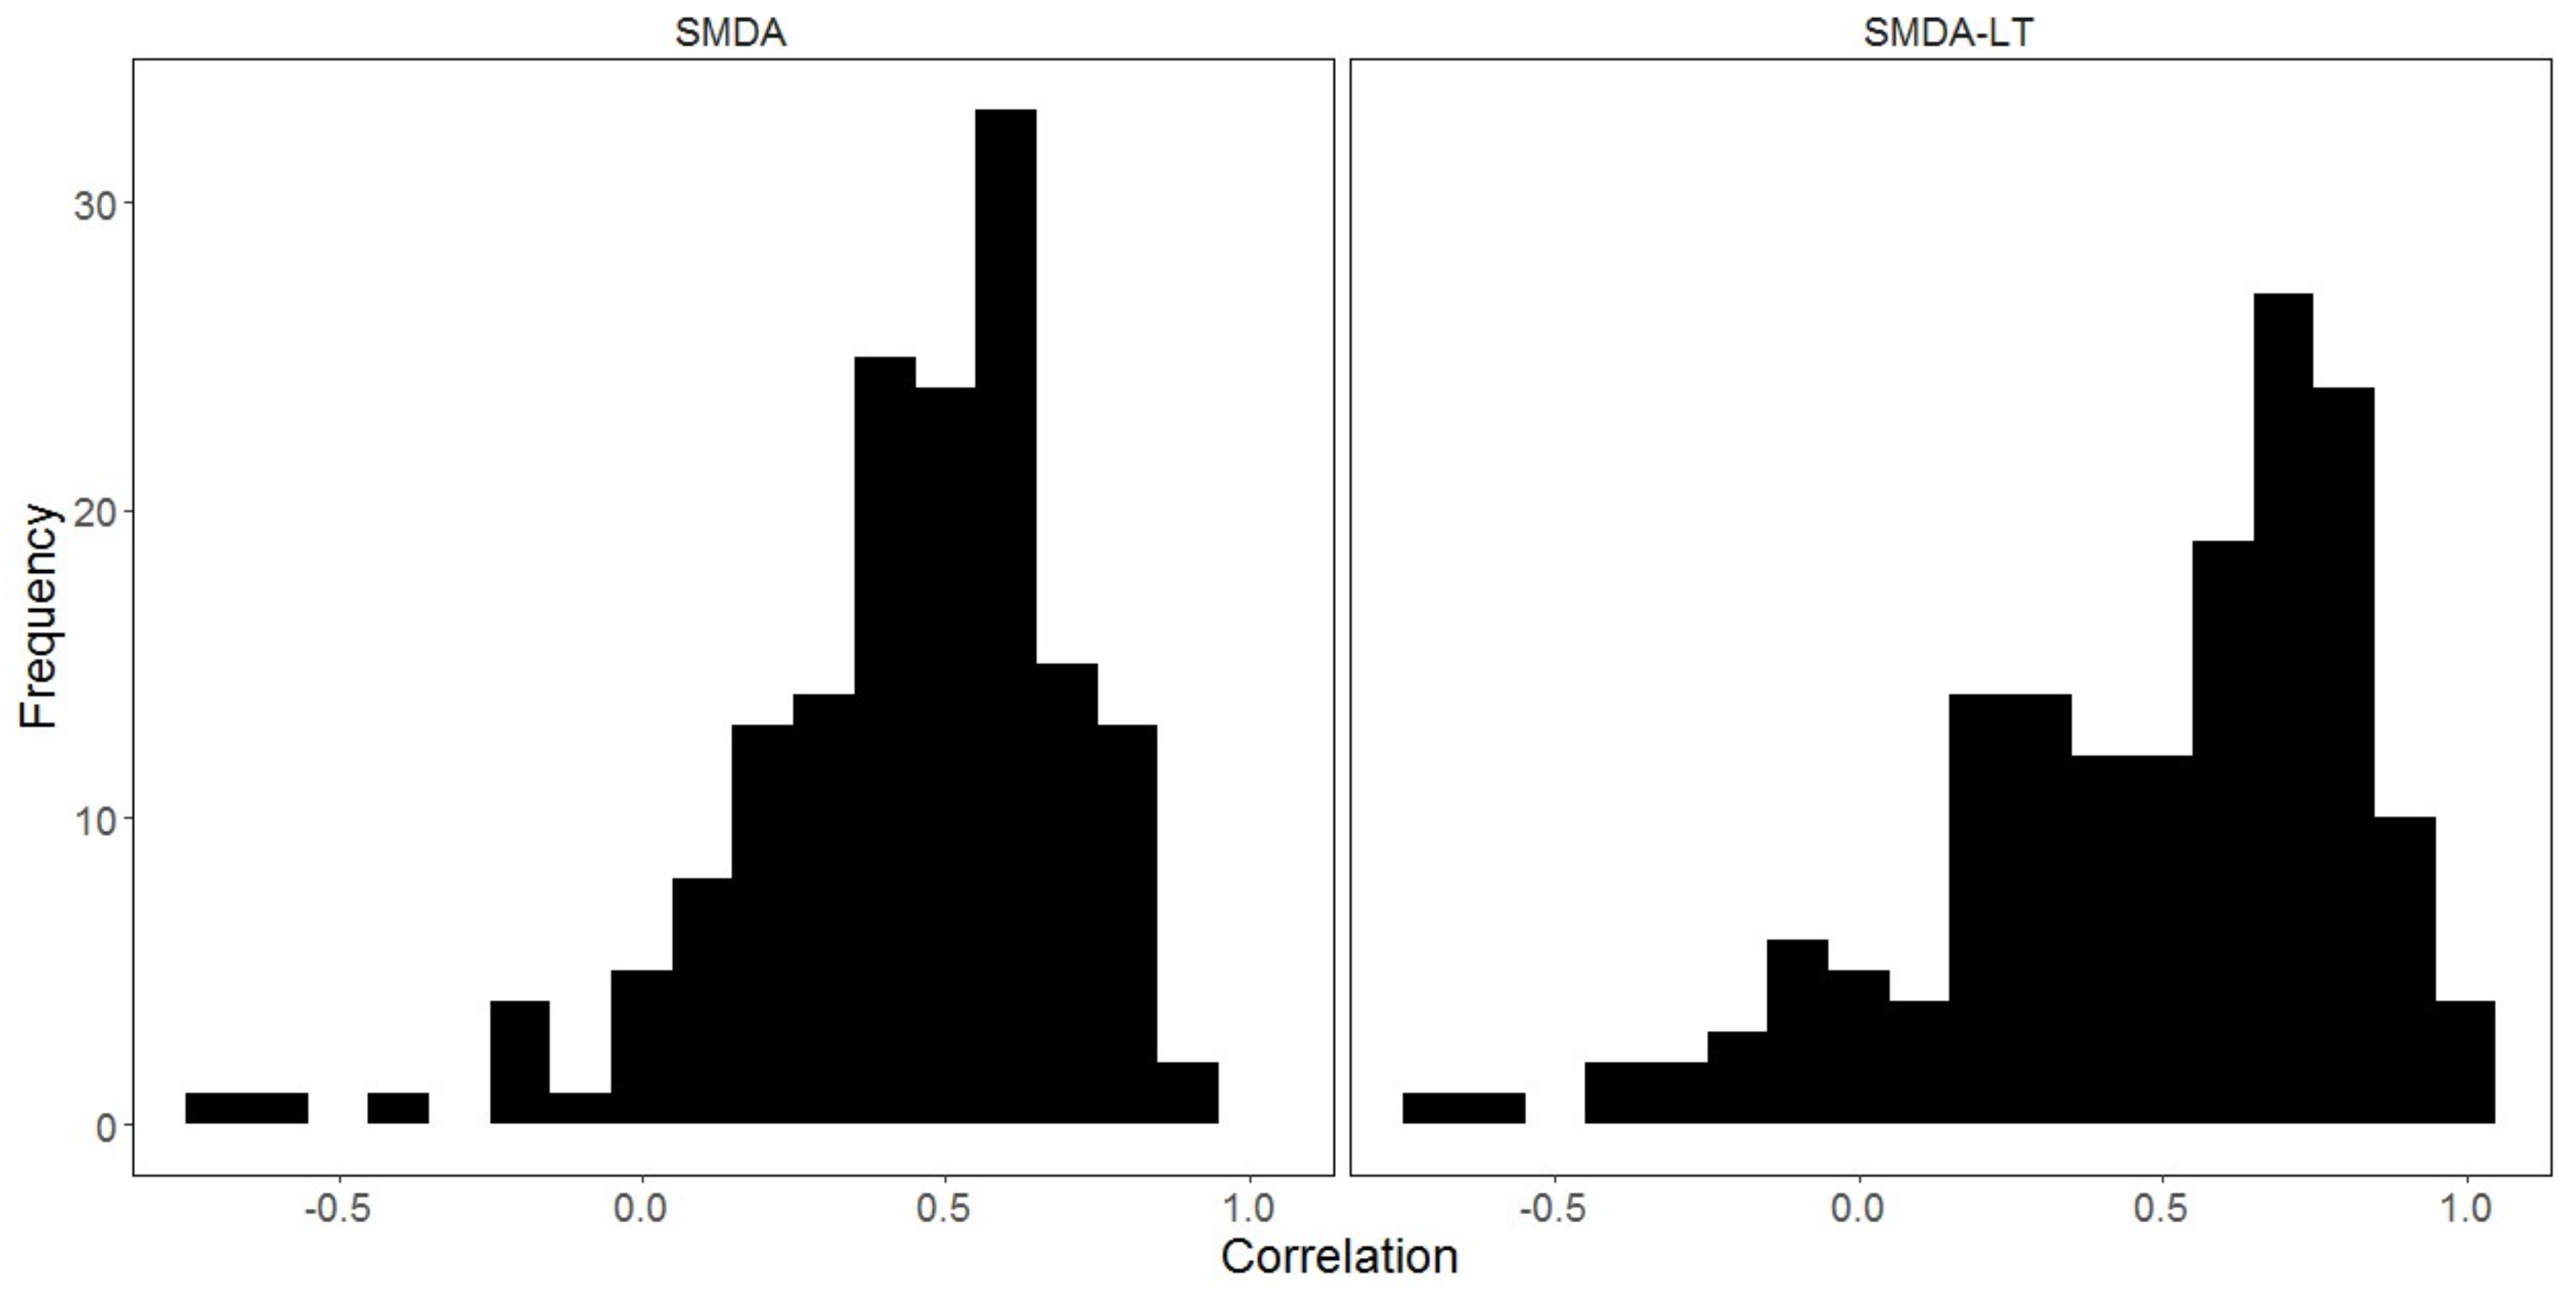
3.3. Assessment Against Quantitative Risk Indicators

The SMAP-SMOS time series was compared to more spatially specific quantitative indicators of drought, the Palmer Drought Severity Index (PDSI), and the Crop Water Deficit Index (WDI). The SMAP-SMOS SMDA indicator showed a small but significant negative trend with WDI (R = −0.38), indicating that as crop water stress increases, the SMDA index decreased or showed drier than average conditions (Figure 7, left). There was a large amount of scatter in the observations, but in general areas where WDI was less than 0.25, indicating “no stress”, the SMDA indicated values above the long-term average. Conversely, areas with WDI above 0.75, indicating the most extreme stress, showed soil moisture values below the long-term average. Areas between these two categories showed greater variability, indicating that light to moderate stress is less clearly identified by the SMAP-SMOS SMDA index, with some instances being shown well below the long-term average, but other instances showing conditions above the long-term average. This may be related to the over/underestimation of soil moisture peaks and valleys seen in the soil moisture trend analysis against the in situ data, which would result in moisture values being over/under estimated right after wetting events, and drying more quickly and to a greater degree than the actual soil moisture. This may also be related to errors in the WDI itself, which relies on soil properties data in its calculation and plant water uptake models that may contain errors where parameters are estimated and not known precisely. The SMOS only data set (Figure 7, right) showed a somewhat weaker negative relationship with WDI (R = −0.23), with much greater scatter in the data, particularly at WDI values greater than 0.5 (or severe to extreme stress). The relationship between these two variables suggests that satellite soil moisture could be a good, but imprecise, surrogate for crop water deficits, and indicative of water related stress, with SMAP providing a somewhat more precise estimate than SMOS. The WDI has been found to be more strongly predictive of crop yields in other studies in Canada [41].
The SMAP-SMOS SMDA showed a weak but significant relationship with PDSI, with a positive correlation of 0.28 (Figure 8, top). The SMDA from the SMOS only data set showed a slightly stronger relationship with PDSI with R = 0.36 but with a similarly large scatter in the points. This weak relationship and the large scatter in the data suggests that the SMDA is not strongly indicative of longer term drought patterns characterized by PDSI. This is not surprising since satellite soil moisture data sets are observations of surface conditions and not water storage. The distribution of the site by site correlation coefficients for each climate station are given in Figure 8 (bottom), showing that most stations have a moderately high correlation with PDSI, but few have a strong correlation of greater than 0.75. The correlations for both the SMAP-SMOS blended data set and the SMOS only data set were similar (Figure 8).
The PDSI was conceived of as an indicator of long term drought, which is a creeping or cumulative state, and the formulation of PDSI incorporates this accumulation by integrating past moisture states into the calculation of the current state, or “adding memory” to the current index. This large variability in the relationship between PDSI and SMDA suggests that satellite soil moisture is not strongly indicative of the same process that PDSI quantifies. For this reason, PDSI was compared to an accumulating SMDA (SMDA-LT) that incorporated a temporal ‘memory’ into the estimation of the satellite based index. The SMDA-LTshowed a similar linear relationship with PDSI, with a correlation of 0.27, but with much less scatter in the data (Figure 9). To better understand this relationship, the site by site correlation coefficients for each climate station site are given in Figure 10, with summary statistics given in Table 5. The SMDA-LT overall has a weaker relationship with PDSI, with a wider distribution and a larger interquartile range. This suggests that the use of an accumulating index such as SMDA-LT adds more uncertainty to the estimation of drought conditions. The relatively weak relationship for both the SMDA and SMDA-LT values with PDIS, particularly at PDSI values close to zero (representing normal or “no drought “conditions) show that this estimation of drought conditions represented by PDSI is imprecise, but that SMDA has a slightly better relationship with WDI, which may reflect shorter term hydroclimatic anomalies. The PDSI and the WDI are not strongly related to each other (with a correlation of −0.27), indicating that they are capturing different aspects of hyroclimatic extremes, with the WDI capturing shorter term stress impacts and PDSI capturing longer term water availability. These results suggest SMDA from both SMOS and SMAP is more sensitive to shorter term stress than longer term risks, but improvements in both soil moisture accuracy, particularly during drying cycles, might improve this. A longer term climatology may also improve this, but the accuracy of these data sets must be consistent over time to provide precise estimates of hydroclimatic risk events.

4. Conclusions

Satellite soil moisture data sets from SMAP and SMOS were evaluated against measured moisture trends from in situ stations, as well as against both qualitative and quantitative indicators of hydroclimatic risk. The SMAP soil moisture data sets in general capture relative moisture trends, with the best estimates from the passive-only derived soil moisture. In general, SMAP data sets overestimated the magnitude of moisture at the wet extremes of wetting events. A SMDA data set calculated from a blended SMAP-SMOS baseline showed a good sensitivity to expert-assessed risk events, including drought, dryness, excess moisture, and flooding, with the SMDA being on average negative during dry extremes and positive during wet extremes. The SMAP-SMOS data sets showed a somewhat improved separation of these extremes from average conditions than the SMDA calculated from a SMOS-only data set. The SMDA was more sensitive to a WDI that quantified differences in modelled actual and potential evapotranspiration rates and was less sensitive to the PDSI, even when an accumulation term was added to the index (SMDA-LT). This shows that satellite soil moisture can be used more effectively to track short term moisture related stress than long term moisture stress. Future improvements in the accuracy of soil moisture retrievals may improve the precision with which hydroclimatic risk events can be estimated.

Acknowledgments

The authors wish to thank Heather McNairn and Jarrett Powers from Agriculture and Agri-Food Canada for providing the RISMA in situ soil moisture data, and Daniel Itenfisu and Ralph Wright from the Alberta Ministry of Agriculture and Forestry for providing the AGDMN data, and Richard Warren for providing PDSI data. The authors also wish to thank Niloofar Alavi and Alexander Elmes for assistance with data processing.

Author Contributions

Catherine Champagne completed data processing and analysis of satellite soil moisture data, preparation of all figures and drafting of the manuscript. Yinsuo Zhang provided expertise in quantitative drought indicators and processing of Water Stress Index Data. Patrick Cherneski and Trevor Hadwen provided expertise in drought monitoring and assessment and Climate Related Production Risk Committee assessments.

Conflicts of Interest

The authors declare no conflict of interest.

References

  1. Langbein, W.G. Hydroclimate. In Encyclopedia of Atmospheric Sciences and Astrogeology; Fallbridge, R.W., Ed.; Reinhold: New York, NY, USA, 1967; pp. 447–451. [Google Scholar]
  2. Entekhabi, D.; Rodriguez-Iturbe, I.; Castelli, F. Mutual interaction of soil moisture state and atmospheric processes. J. Hydrol. 1996, 184, 3–17. [Google Scholar] [CrossRef]
  3. Western, A.W.; Grayson, R.B.; Bloschl, G. Scaling of soil moisture: A hydrologic perspective. Annu. Rev. Earth Planet. Sci. 2002, 30, 149–180. [Google Scholar] [CrossRef]
  4. Champagne, C.; Davidson, A.; Cherneski, P.; L’Heureux, J.; Hadwen, T. Monitoring Agricultural Risk in Canada Using L-Band Passive Microwave Soil Moisture from SMOS. J. Hydrometeorol. 2015, 16, 5–18. [Google Scholar] [CrossRef]
  5. Burgin, M.S.; Colliander, A.; Njoku, E.G.; Chan, S.K.; Cabot, F.; Kerr, Y.H.; Bindlish, R.; Jackson, T.J.; Entekhabi, D.; Yueh, S.H. A Comparative Study of the SMAP Passive Soil Moisture Product with Existing Satellite-Based Soil Moisture Products. IEEE Trans. Geosci. Remote Sens. 2017, 59, 2959–2971. [Google Scholar] [CrossRef]
  6. Crow, W.T.; Chen, F.; Reichle, R.H.; Liu, Q. L band microwave remote sensing and land data assimilation improve the representation of prestorm soil moisture conditions for hydrologic forecasting. Geophys. Res. Lett. 2017, 44, 5495–5503. [Google Scholar] [CrossRef]
  7. He, B.; Wang, H.; Huang, L.; Liu, J.; Chen, Z. A new indicator of ecosystem water use efficiency based on surface soil moisture retrieved from remote sensing. Ecol. Indic. 2017, 75, 10–16. [Google Scholar] [CrossRef]
  8. Crow, W.T.; Han, E.; Ryu, D.; Hain, C.R.; Anderson, M.C. Estimating annual water storage variations in medium-scale (2000–10,000 km2) basins using microwave-based soil moisture retrievals. Hydrol. Earth Syst. Sci. 2017, 21, 1849–1862. [Google Scholar] [CrossRef]
  9. Mladenova, I.E.; Bolten, J.D.; Crow, W.T.; Anderson, M.C.; Hain, C.R.; Johnson, D.M.; Mueller, R. Intercomparison of Soil Moisture, Evaporative Stress, and Vegetation Indices for Estimating Corn and Soybean Yields over the U.S. IEEE J. Sel. Top. Appl. Earth Obs. Remote Sens. 2017, 10, 1328–1343. [Google Scholar] [CrossRef]
  10. McNally, A.; Shukla, S.; Arsenault, K.R.; Wang, S.; Peters-Lidard, C.D.; Verdin, J.P. Evaluating ESA CCI soil moisture in East Africa. Int. J. Appl. Earth Obs. Geoinf. 2016, 48, 96–109. [Google Scholar] [CrossRef] [PubMed]
  11. Tadesse, T.; Wardlow, B.D.; Brown, J.F.; Svoboda, M.D.; Hayes, M.J.; Fuchs, B.; Gutzmer, D. Assessing the Vegetation Condition Impacts of the 2011 Drought across the U.S. Southern Great Plains Using the Vegetation Drought Response Index (VegDRI). J. Appl. Meteorol. Climatol. 2014, 54, 153–169. [Google Scholar] [CrossRef]
  12. Svoboda, M.; LeComte, D.; Hayes, M.; Heim, R.; Gleason, K.; Angel, J.; Rippey, B.; Tinker, R.; Palecki, M.; Stooksbury, D.; et al. The drought monitor. Bull. Am. Meteorol. Soc. 2002, 83, 1181–1190. [Google Scholar] [CrossRef]
  13. Anderson, M.C.; Hain, C.; Otkin, J.; Zhan, X.; Mo, K.; Svoboda, M.; Wardlow, B.; Pimstein, A. An Intercomparison of Drought Indicators Based on Thermal Remote Sensing and NLDAS-2 Simulations with U.S. Drought Monitor Classifications. J. Hydrometeorol. 2013, 14, 1035–1056. [Google Scholar] [CrossRef]
  14. Heim, R.R. A review of twentieth-century drought indices used in the United States. Bull. Am. Meteorol. Soc. 2002, 83, 1149–1165. [Google Scholar] [CrossRef]
  15. Champagne, C.; Berg, A.; McNairn, H.; Drewitt, G.; Huffman, T. Monitoring agricultural soil moisture extremes in Canada using passive microwave remote sensing. Remote Sens. Environ. 2011, 115, 2434–2444. [Google Scholar] [CrossRef]
  16. Dorigo, W.; Wagner, W.; Albergel, C.; Albrecht, F.; Balsamo, G.; Brocca, L.; Chung, D.; Ertl, M.; Forkel, M.; Gruber, A.; et al. ESA CCI Soil Moisture for improved Earth system understanding: State-of-the art and future directions. Remote Sens. Environ. 2017, 203, 185–215. [Google Scholar] [CrossRef]
  17. Van der Schalie, R.; de Jeu, R.A.M.; Kerr, Y.H.; Wigneron, J.P.; Rodríguez-Fernández, N.J.; Al-Yaari, A.; Parinussa, R.M.; Mecklenburg, S.; Drusch, M. The merging of radiative transfer based surface soil moisture data from SMOS and AMSR-E. Remote Sens. Environ. 2017, 189, 180–193. [Google Scholar] [CrossRef]
  18. Rodríguez-Fernández, N.J.; Kerr, Y.H.; van der Schalie, R.; Al-Yaari, A.; Wigneron, J.P.; de Jeu, R.; Richaume, P.; Dutra, E.; Mialon, A.; Drusch, M. Long term global surface soil moisture fields using an SMOS-Trained neural network applied to AMSR-E data. Remote Sens. 2016, 8, 959. [Google Scholar] [CrossRef]
  19. Jackson, T.J.; Cosh, M.H.; Bindlish, R.; Starks, P.J.; Bosch, D.D.; Seyfried, M.; Goodrich, D.C.; Moran, M.S.; Du, J. Validation of advanced microwave scanning radiometer soil moisture products. IEEE Trans. Geosci. Remote Sens. 2010, 48, 4256–4272. [Google Scholar] [CrossRef]
  20. Kerr, Y.H.; Al-Yaari, A.; Rodriguez-Fernandez, N.; Parrens, M.; Molero, B.; Leroux, D.; Bircher, S.; Mahmoodi, A.; Mialon, A.; Richaume, P.; et al. Overview of SMOS performance in terms of global soil moisture monitoring after six years in operation. Remote Sens. Environ. 2015, 180, 40–63. [Google Scholar] [CrossRef]
  21. Champagne, C.; Rowlandson, T.; Berg, A.; Burns, T.; L’Heureux, J.; Tetlock, E.; Adams, J.R.; McNairn, H.; Toth, B.; Itenfisu, D. Satellite Surface Soil Moisture from SMOS and Aquarius: Assessment for Applications in Agricultural Landscapes. Int. J. Appl. Earth Obs. Geoinf. 2016, 45, 143–154. [Google Scholar] [CrossRef]
  22. Sanchez, N.; Martinez-Fernandez, J.; Scaini, A.; Perez-Gutierrez, C. Validation of the SMOS L2 Soil Moisture Data in the REMEDHUS Network (Spain). IEEE Trans. Geosci. Remote Sens. 2012, 50, 1602–1611. [Google Scholar] [CrossRef]
  23. Adams, J.R.; McNairn, H.; Berg, A.A.; Champagne, C. Evaluation of near-surface soil moisture data from an AAFC monitoring network in Manitoba, Canada: Implications for L-band satellite validation. J. Hydrol. 2015, 521, 582–592. [Google Scholar] [CrossRef]
  24. Al Bitar, A.; Leroux, D.; Kerr, Y.H.; Merlin, O.; Richaume, P.; Sahoo, A.; Wood, E.F. Evaluation of SMOS Soil Moisture Products over Continental U.S. Using the SCAN/SNOTEL Network. IEEE Trans. Geosci. Remote Sens. 2012, 50, 1572–1586. [Google Scholar] [CrossRef] [Green Version]
  25. Albergel, C.; Zakharova, E.; Calvet, J.C.; Zribi, M.; Pardé, M.; Wigneron, J.P.; Novello, N.; Kerr, Y.; Mialon, A. A first assessment of the SMOS data in southwestern France using in situ and airborne soil moisture estimates: The CAROLS airborne campaign. Remote Sens. Environ. 2011, 115, 2718–2728. [Google Scholar] [CrossRef] [Green Version]
  26. Al-Yaari, A.; Wigneron, J.P.; Kerr, Y.; Rodriguez-Fernandez, N.; O’Neill, P.E.; Jackson, T.J.; De Lannoy, G.J.M.; Al Bitar, A.; Mialon, A.; Richaume, P.; et al. Evaluating soil moisture retrievals from ESA’s SMOS and NASA’s SMAP brightness temperature datasets. Remote Sens. Environ. 2017, 193, 257–273. [Google Scholar] [CrossRef]
  27. Colliander, A.; Jackson, T.J.; Bindlish, R.; Chan, S.; Das, N.; Kim, S.B.; Cosh, M.H.; Dunbar, R.S.; Dang, L.; Pashaian, L.; et al. Validation of SMAP surface soil moisture products with core validation sites. Remote Sens. Environ. 2017, 191, 215–231. [Google Scholar] [CrossRef]
  28. O’Neil, P.E.; Chang, S.; Njoku, E.G.; Jackson, T.; Bindlish, R. Application of Triple Collocation in Ground-Based Validation of Soil Moisture Active/Passive (SMAP) Level 2 Data Products. IEEE J. Sel. Top. Appl. Earth Obs. Remote Sens. 2017, 10, 489–502. [Google Scholar]
  29. Reichle, R.; Koster, R.; De Lannoy, G.; Crow, W.; Kimball, J. Level 4 Surface and Root Zone Soil Moisture (L4_SM); Global Modeling and Assimilation Office: Greenbelt, MD, USA, 2014. [Google Scholar]
  30. Chan, S.K.; Bindlish, R.; O’Neill, P.E.; Njoku, E.; Jackson, T.; Colliander, A.; Chen, F.; Burgin, M.; Dunbar, S.; Piepmeier, J.; et al. Assessment of the SMAP Passive Soil Moisture Product. IEEE Trans. Geosci. Remote Sens. 2016, 54, 4994–5007. [Google Scholar] [CrossRef]
  31. O’Neil, P.E.; Chan, S.; Njoku, E.; Jackson, C. Level 2 & 3 Soil Moisture (Passive) Data Products; Soil Moisture Active Passive (SMAP) Algorithm Theoretical Basis Document; Revision B; Jet Propulsion Laboratory, California Institute of Technology: Pasadena, CA, USA, 2015. [Google Scholar]
  32. Kim, S.B.; Van Zyl, J.J.; Johnson, J.T.; Moghaddam, M.; Tsang, L.; Colliander, A.; Dunbar, R.S.; Jackson, T.J.; Jaruwatanadilok, S.; West, R.; et al. Surface Soil Moisture Retrieval Using the L-Band Synthetic Aperture Radar Onboard the Soil Moisture Active-Passive Satellite and Evaluation at Core Validation Sites. IEEE Trans. Geosci. Remote Sens. 2017, 55, 1897–1914. [Google Scholar] [CrossRef]
  33. Reichle, R.H.; De Lannoy, G.J.M.; Liu, Q.; Ardizzone, J.V.; Colliander, A.; Conaty, A.; Crow, W.; Jackson, T.J.; Jones, L.A.; Kimball, J.S.; et al. Assessment of the SMAP Level-4 Surface and Root-Zone Soil Moisture Product Using in Situ Measurements. J. Hydrometeorol. 2017, 18, 2621–2645. [Google Scholar] [CrossRef]
  34. Kerr, Y.H.; Waldteufel, P.; Richaume, P.; Wigneron, J.P.; Ferrazzoli, P.; Mahmoodi, A.; Al Bitar, A.; Cabot, F.; Gruhier, C.; Juglea, S.E.; et al. The SMOS Soil Moisture Retrieval Algorithm. IEEE Trans. Geosci. Remote Sens. 2012, 50, 1384–1403. [Google Scholar] [CrossRef]
  35. McColl, K.A.; Alemohammad, S.H.; Akbar, R.; Konings, A.G.; Yueh, S.; Entekhabi, D. The global distribution and dynamics of surface soil moisture. Nat. Geosci. 2017, 10, 100–104. [Google Scholar] [CrossRef]
  36. Alley, W.M. The Palmer Drought Severity Index: Limitations and Assumptions. J. Appl. Meteorol. 1984, 23, 1100–1109. [Google Scholar] [CrossRef]
  37. Crow, W.T.; Koster, R.D.; Reichle, R.H.; Sharif, H.O. Relevance of Time-Varying and Time-Invariant Retrieval Error Sources on the Utility of Spaceborne Soil Moisture Products - Art. No. L24405. Geophys. Res. Lett. 2005, 32. [Google Scholar] [CrossRef]
  38. Akinremi, O.O.; McGinn, S.M.; Barr, A.G. Evaluation of the Palmer Drought Index on the Canadian Prairies. J. Clim. 1996, 9, 897–905. [Google Scholar] [CrossRef]
  39. Chipanshi, A.C.; Warren, R.T.; L’Heureux, J.; Waldner, D.; McLean, H.; Qi, D. Use of the National Drought Model (NDM) in Monitoring Selected Agroclimatic Risks across the Agricultural Landscape of Canada. Atmos.-Ocean 2013, 51, 471–488. [Google Scholar] [CrossRef]
  40. Tadesse, T.; Champagne, C.; Wardlow, B.D.; Hadwen, T.A.; Brown, J.F.; Demisse, G.B.; Bayissa, Y.A.; Davidson, A.M. Building the Vegetation Drought Response Index for Canada (VegDRI-Canada) to Monitor Agricultural Drought: First Results. GISci. Remote Sens. 2017, 54, 230–257. [Google Scholar] [CrossRef]
  41. Chipanshi, A.; Zhang, Y.; Kouadio, L.; Newlands, N.; Davidson, A.; Hill, H.; Warren, R.; Qian, B.; Daneshfar, B.; Bedard, F.; et al. Evaluation of the Integrated Canadian Crop Yield Forecaster (ICCYF) Model for in-Season Prediction of Crop Yield across the Canadian Agricultural Landscape. Agric. For. Meteorol. 2015, 206, 137–150. [Google Scholar] [CrossRef]
  42. Robertson, G.W. A biometeorological time scale for a cereal crop involving day and night temperatures and photoperiod. Int. J. Biometeorol. 1968, 12, 191–223. [Google Scholar] [CrossRef]
  43. Akinremi, O.O.; McGinn, S.M.; Barr, A.G. Simulation of Soil Moisture and Other Components of the Hydrological Cycle Using a Water Budget Approach. Can. J. Soil Sci. 1996, 76, 133–142. [Google Scholar] [CrossRef]
  44. McNairn, H.; Jackson, T.J.; Wiseman, G.; Bélair, S.; Berg, A.; Bullock, P.; Colliander, A.; Cosh, M.H.; Kim, S.B.; Magagi, R.; et al. The Soil Moisture Active Passive Validation Experiment 2012 (SMAPVEX12): Prelaunch Calibration and Validation of the SMAP Soil Moisture Algorithms. IEEE Trans. Geosci. Remote Sens. 2015, 53, 2784–2801. [Google Scholar] [CrossRef]
Figure 1. Study area. Thick dotted black line depicts ecological limits of where agriculture is conducted in Canada. The colored area of the map shows typical spatial extent of SMAP soil moisture retrievals during the active growing season.
Geosciences 08 00127 g001
Figure 2. Cumulative distribution functions for soil moisture from SMOS and SMAP and SMOS rescaled to SMAP statistical distribution.
Geosciences 08 00127 g002
Figure 3. Time series of normalized surface soil moisture from three SMAP data sets for sites in Ontario (Top Left), Manitoba (Right), and Alberta (Wrentham site, Bottom Left). Soil moisture was normalized for each data set to compare data sets as indicators of relative trends. The Alberta Wrentham site was selected for display as it represented average results for Alberta. The SMAP_P36 trends where not shown since they were very similar to SMAP_P09.
Geosciences 08 00127 g003aGeosciences 08 00127 g003b
Figure 4. Time series of normalized root zone soil moisture from SMAP modelled data sets for sites in Ontario (Top Left), Manitoba (Right) and Alberta (Wrentham site, Bottom Left). Soil moisture was normalized for each data set to compare data sets as indicators of relative trends. The Alberta Wrentham site was selected for display as it represented average results for Alberta.
Geosciences 08 00127 g004aGeosciences 08 00127 g004b
Figure 5. Comparison of monthly soil moisture (volumetric) retrieved from a blended SMAP-SMOS time series and a SMOS-Only time series under different risk conditions as evaluated from expert reports. Data are aggregated to monthly time step.
Geosciences 08 00127 g005
Figure 6. Soil Moisture difference from the long-term average (SMDA) from a SMAP-SMOS time series (Left) and a SMOS-only time series (Right) for different risk conditions as evaluated from expert reports. Data are aggregated to monthly time step.
Geosciences 08 00127 g006
Figure 7. Comparison of WDI modelled from station data to SMDA from blended SMAP-SMOS time series. Trend line represents a linear correlation of −0.38 for the SMAP-SMOS SMDA and −0.23 for the SMOS-only SMDA, significant at p < 0.001.
Geosciences 08 00127 g007
Figure 8. Comparison of PDSI modelled from station data to SMDA from blended SMAP-SMOS time series and SMOS only time series (top). Trend line represents a linear correlation of 0.28 for the SMAP-SMOS SMDA and 0.36 for the SMOS-only SMDA, significant at p < 0.001. Histograms (bottom) show distribution of correlation coefficients for data from each of the 346 climate stations.
Geosciences 08 00127 g008aGeosciences 08 00127 g008b
Figure 9. Comparison of PDSI modelled from station data to Soil moisture difference from average with an added “memory” term (SMDA-LT) from blended SMAP-SMOS time series. Trend line represents a linear correlation of 0.27, significant at p < 0.001.
Geosciences 08 00127 g009
Figure 10. Histograms comparing site by site correlation coefficients for 346 climate stations between PDSI and SMDA (Left) and SMDA-LT (Right).
Geosciences 08 00127 g010
Table 1. Key acronyms used in this manuscript.
AcronymDescription
SMAPSoil Moisture Active Passive mission
SMOSSoil Moisture and Ocean Salinity mission
SMDASoil Moisture Difference Index
SMDA-LTSoil Moisture Difference Index—Long Term
PDSIPalmer Drought Severity Index
WDIWater Deficit Index
CRPRCClimate Related Production Risk Committee
SMAP_P36SMAP Passive Microwave Derived Soil Moisture at 36 km
SMAP_P09SMAP Passive Microwave Derived Soil Moisture Spatially Enhanced to 9 km
SMAP_APSMAP Active-Passive Soil Moisture at 9 km
SMAP_AUPSMAP analysis updates at surface and rootzone
Table 2. Palmer Drought Severity Index scale and categorization.
Palmer Drought Severity RangeCategorical Description
<−4Extreme Drought
−4 to −3Severe Drought
−3 to −2Moderate Drought
−2 to −1Pre-drought
−1 to 2Near Normal
2 to 3Unusually Moist
3 to 4Very Moist
>4Extremely Moist
Table 3. Crop Water Deficit Index scale and categorization.
Crop Water Deficit Index RangeStress Category
0 to 0.25No Stress
0.25 to 0.50Light Stress
0.50 to 0.75Severe Stress
0.75 to 1.0Extreme Stress
Table 4. Pearson pairwise linear correlation coefficients between SMAP soil moisture data sets and in situ measurements at 5cm depth. The values for Alberta represent the average statistics for all 33 sites in the Alberta network.
SiteSMAP_APSMAP_P36SMAP_P09SMAP_AUP_SurfaceSMAP_AUP_Rootzone
Ontario0.550.830.810.560.30
Manitoba0.480.400.430.510.63
Alberta (Average of all Sites)0.310.450.620.630.41
SiteSMAP_APSMAP_P36SMAP_P09SMAP_AUP_SurfaceSMAP_AUP_Rootzone
Ontario1.040.610.600.991.08
Manitoba0.910.910.851.000.94
Alberta (Average of all Sites)1.200.970.850.931.08
Table 5. Summary statistics for site by site correlations.
VariableMinMaxMeanMedianInter-Quartile Range
SMDA−0.660.980.480.580.47
SMDA-LT−0.720.880.430.470.57

