Abstract
The Setubal municipality, Portugal, has diversified land use along its coastline (mostly located in a low-lying area): on the west there are beaches; the centre is dominated by a densely populated downtown; and the east has an important industrial area. Although the seismic activity in mainland Portugal is moderate, considering the variety of exposed elements, the objectives of this study are to present and discuss the implementation of tsunami evacuation maps at Setubal municipality. Thus, tsunami numerical modelling was carried out by considering the 1969 tsunami and the 1755 tsunami scenarios. The model results show that the first tsunami wave arrived within 30–40 min of the earthquake. The inundation depth was up to 9 m at the beaches, 4.9 m downtown, and 4.0 m in the industrial area. These velocities are too dangerous if beach users are caught by the tsunami waves, even in a moderate scenario. Therefore, coastal communities must evacuate the inundated zones to high ground before the arrival of the first tsunami wave. For this reason, tsunami evacuation maps were created, indicating the quickest and safest routes to the meeting points, located on high ground and outside of the inundation zones.
1. Introduction
The 1755 tsunami caused significant damage all along the Portuguese coastline. According to witnesses’ accounts, more than 2000 people died due to the earthquake, fire, and tsunami in the city of Setubal, which corresponds to over 16.9% of the city’s 18th century population [1]. After this historic disaster, the city was rebuilt, with significant development that extended to the entire municipality. In the present-day, Setubal municipality has diversified land use along its coastline, which is also located on low ground (3–4 m above mean sea level), thus increasing the exposure of coastal communities to a future tsunami scenario. As shown in Figure 1, in the western part of Setubal, there are mostly beaches, while the centre is dominated by the urban area, and the east contains a port and most of the industrial plants. Therefore, the challenge is to assess the conditions for the safe evacuation of coastal communities in Setubal municipality if a moderate to large tsunami occurs, since the impact of a potential tsunami on the municipality is still largely unknown.

Figure 1.
Coastline land use of the studied area: (a) Location of Setubal municipality; (b) Main exposed areas, with the location of the urban area and the Port of Setubal at the centre. 1—Portinho da Arrábida beach; 2—Galapinhos and Galapos beaches; 3—Figueirinha beach; 4—Outao campsite and beach; 5—Comenda park; 6-Albarquel park. Seveso industrial companies: A—Secil; B—Sapec Agriculture; C—Sapec Chemical; D—The Navigator Company; E—Tanquisado.
West of Setubal, the stretch of beaches is famous for its beauty and natural landscape because it is located within the Arrabida Natural Park, which is classified as a Protected Natural Area [2]. For these reasons, the beaches are popular among residents and tourists, especially during summer. Also, in the same area, there are unstable cliffs [3,4,5]. Thus, in order to provide some protection to beach users, the cliffs have undergone significant intervention. Nevertheless, evacuating crowded beaches in an emergency situation is difficult, especially if there are narrow beach access points with many stairs.
The centre of Setubal municipality consists of a densely populated downtown, with more than 120,000 residents, according to the 2011 census [6]. In addition, the downtown area has many historic buildings, 30% of whose occupants are over 64 years old. In order to improve safety for downtown residents, visitors, and tourists, the Municipal Services of Civil Protection and Firefighters of Setubal (SMPCB) installed five electronic information panels, 11 emergency columns (Figure 2), and 10 meeting points [7]. These electronic information panels are unique in the country. They provide basic guidelines regarding safety, as well as cultural and heritage spots of interest to visitors. The Municipal Emergency Response Centre also disseminates a variety of real-time written messages. The emergency panels are equipped with loudspeakers that provide real-time sound dissemination. In order to test the Historic Centre Emergency Plan, an earthquake drill was organized by the SMPCB on 6 June 2013. Over 2500 residents participated in this exercise, including students and city council staff.

Figure 2.
Information panels installed by the SMPCB in the urban area: (a) Front of electronic panel; (b) Back of an electronic panel; (c) Emergency column.
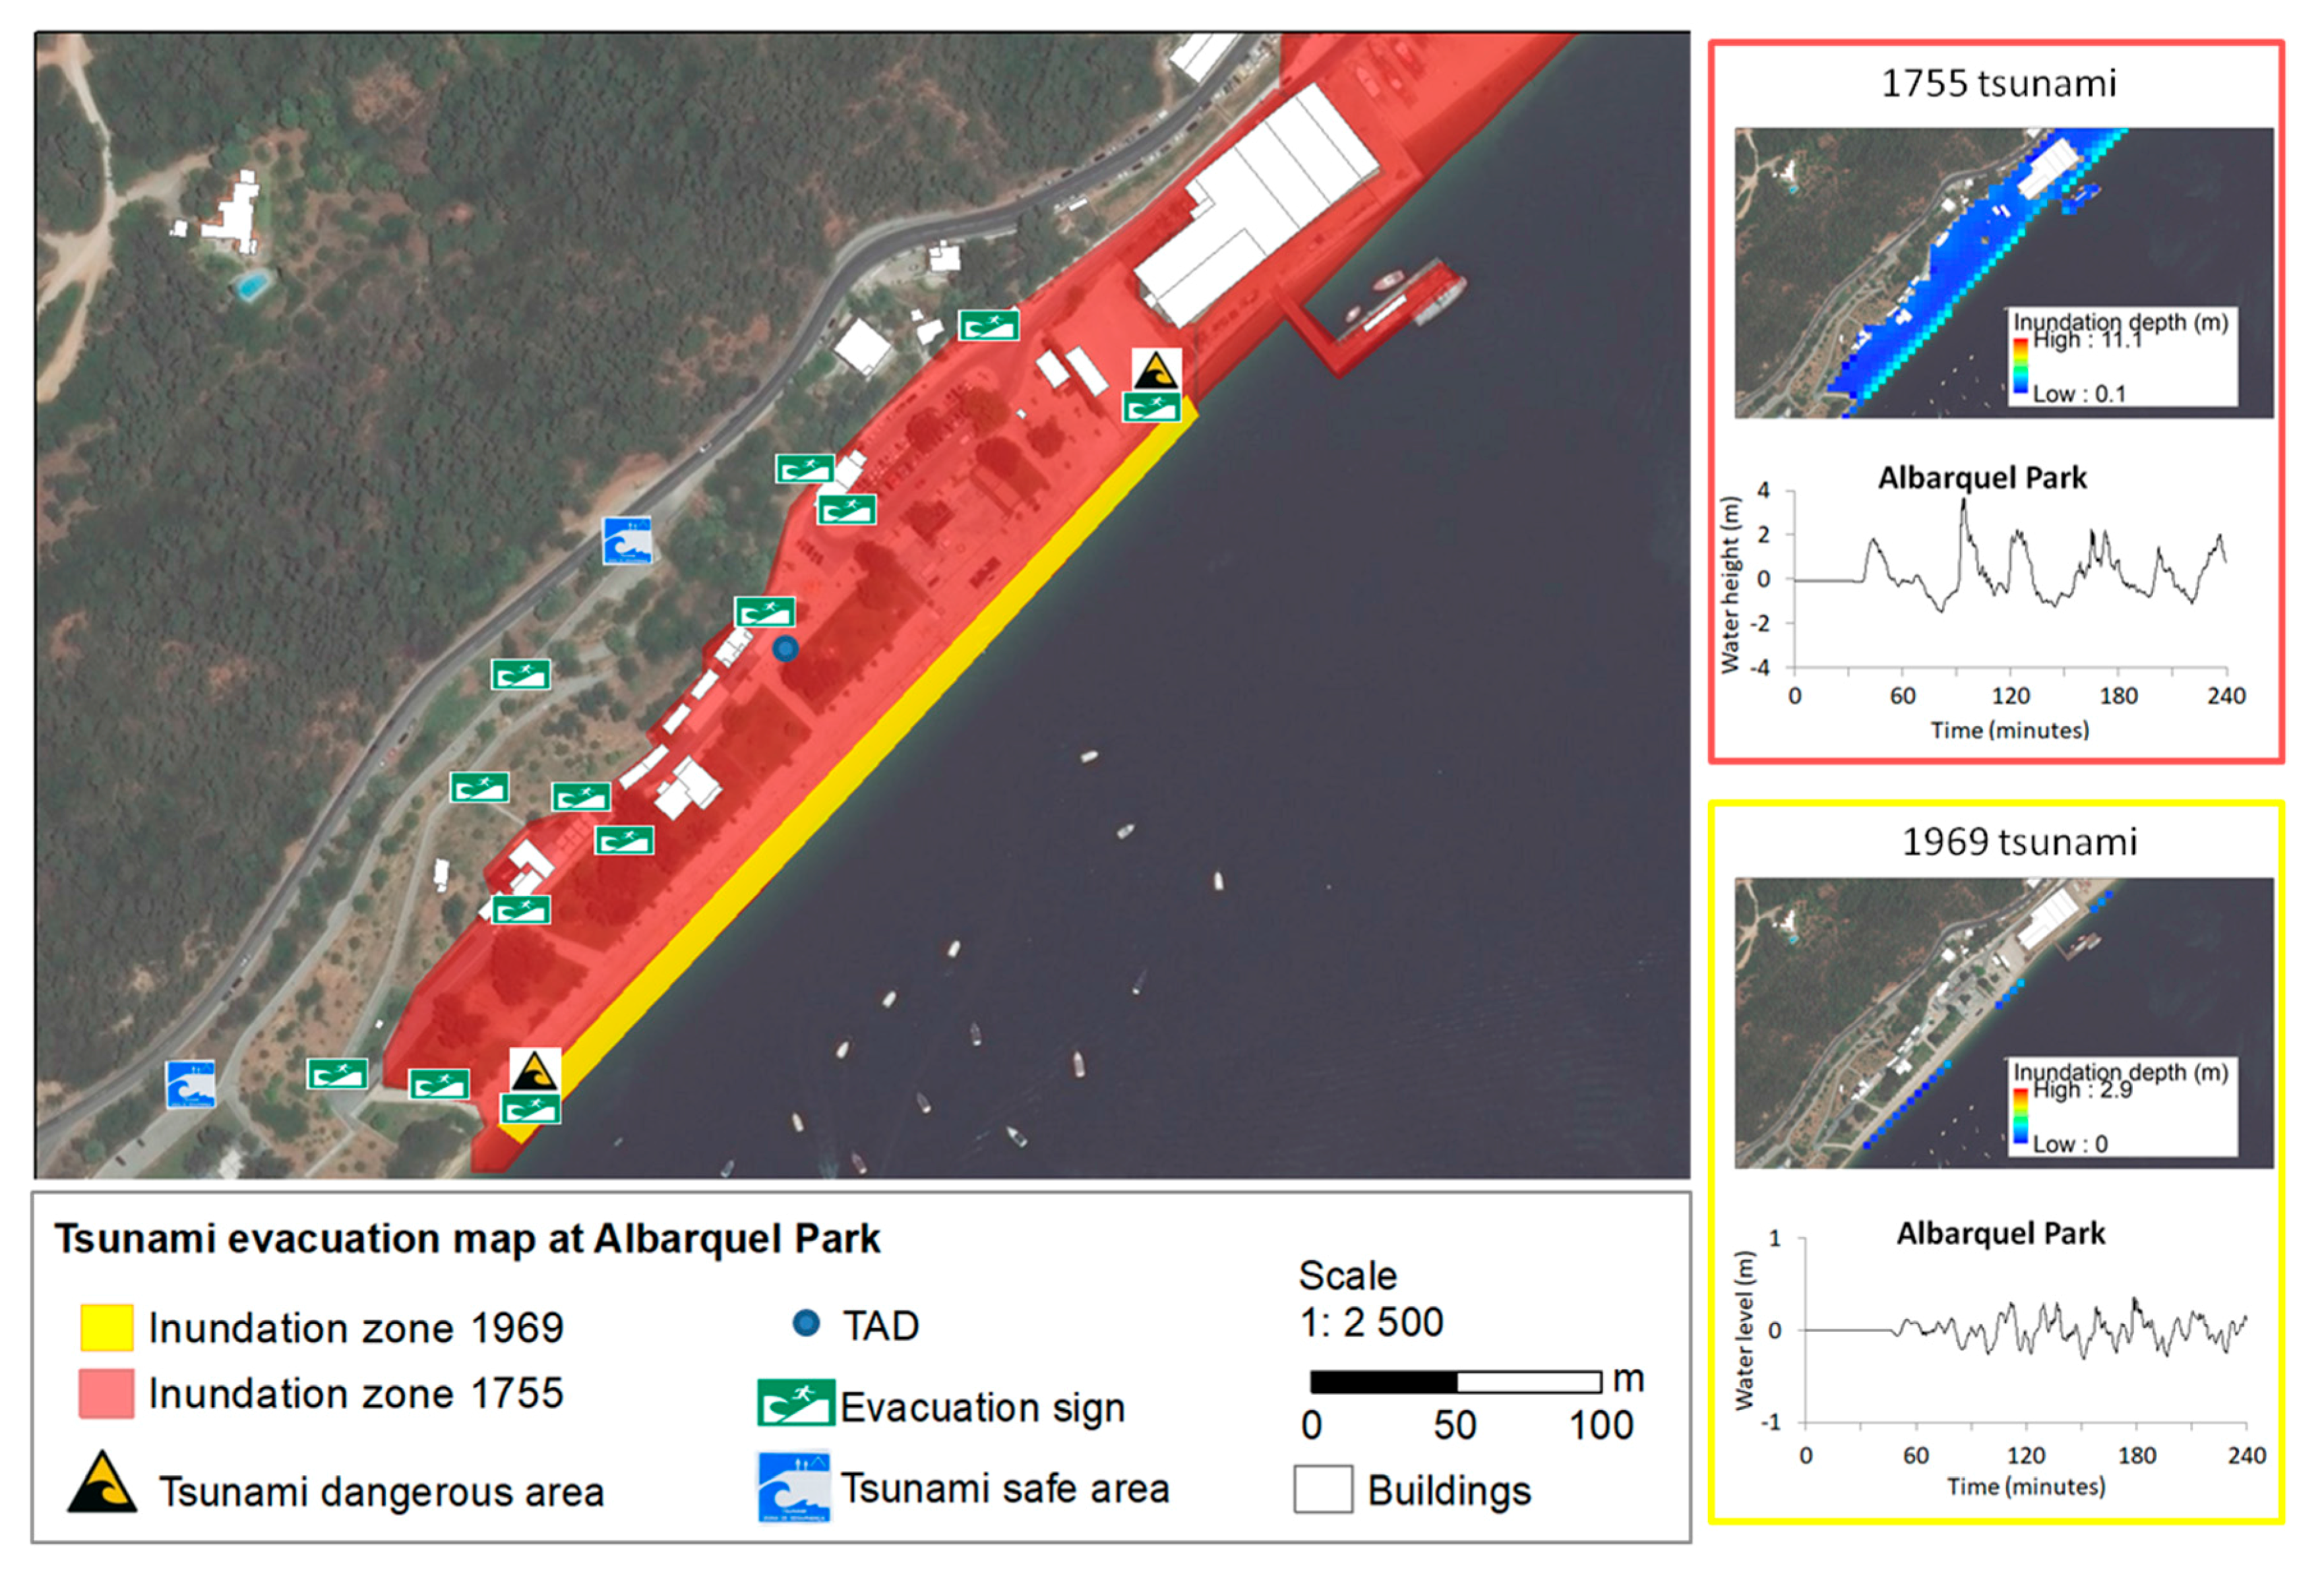
In addition, considering the variety of exposed elements in the central area of the municipality, in the period 2011–2014, a Tsunami Alerting Device (TAD) was installed at Albarquel Park (Point 6 in Figure 1). This was an experimental installation resulting from the collaboration between the SMPCB, the Instituto Portugues do Mar e da Atmosfera (IPMA), and the Joint Research Centre of the European Commission (JRC-EU). The TAD was the first system of this kind to be installed in Portugal; it consists of an information panel and a siren and is connected to a tsunami tide gauge station located at a distance of approximately 4 km, installed at the Secil cement company (facility A in Figure 1). This instrument network is part of the first attempt to implement a functional tsunami warning system in the country. The TAD is also connected to the Municipal Emergency Response Centre, which enables it to disseminate real-time written and spoken messages. In November 2016, temporary tsunami evacuation signs were installed in the park. In order to test the tsunami evacuation maps, a pilot-tsunami drill was organized by the authors as part of the collaboration between academia and local stakeholders. This took place at Albarquel Park (Point 6 in Figure 1) on 5 November 2016, according to UNISDR guidelines, which indicated World Tsunami Awareness Day to carry out educational activities regarding tsunamis. It involved emergency agents and the local population. In preparation for the drill, a guide for the emergency plan was prepared [8]. The behaviour of the participants was recorded on camera, and at the end of the drill, they answered a questionnaire. The results show that the participants were evacuated in an organized way and took around seven minutes to reach the meeting point [9]. However, they pointed out that the distribution of tsunami evacuation signs should be improved. Later, permanent tsunami evacuation signs were installed in the park.
The eastern part of the Setubal municipality is where most of the industrial facilities are concentrated. According to the Seveso Directive [4], Setubal has five facilities which are located on the coastline, in low-lying areas (Figure 1). These industrial facilities are already dangerous due to the variety of toxic and inflammable products that are manufactured and stored there. Therefore, exposure to a moderate/large tsunami could trigger a chain of secondary disasters like fires, explosions, or the spread of toxic materials. For example, at the Tanquisado company (facility E, Figure 1), there are 44 buildings: 33 would be affected by a potential fire, and 17 are fuel tanks [10]. One would also expect a significant financial loss, with high impact at local and national levels, since as of 18 August 2016, these companies represent 4.3% of this type of operation in Portugal. These industries need strict safety procedures, not only to avoid accidents but also because the area is surrounded by the Sado Estuary, which is classified as a Natural Reserve [2]. With these issues in mind, a drill was organized by the SMPCB on 8 November 2012 in eastern Setubal [11], where most industries are concentrated. One of the goals of the drill was to test the Municipal Emergency Plan regarding technological accidents. In this exercise, more than 600 volunteers participated, mainly students, with the support of several companies (industrial and transportation concerns like buses and the ferry), as well as various emergency agents. The exercise was assessed by external experts.
More recently, in October 2016, the SMPCB created SOS Setubal, which is a free application for mobile devices. It enables users to send emergency messages to the Municipal Emergency Response Centre and to receive various types of information (e.g., weather warnings). The Setubal municipality has created a variety of tools that make the civil protection and spatial planning agents, the population, and its territory more resilient in the area of civil protection. However, residents, visitors, and tourists must be aware that they have to evacuate to the safe higher ground before the arrival of the first tsunami wave. This shows the importance of the regular dissemination of tsunami evacuation maps to the public. In the coastal regions of Japan, California, and Hawaii, this approach has been widely disseminated, as discussed by [12]. However, in Portugal, the general lack of hazard maps and evacuation information is still an issue and the dissemination of tsunami evacuation maps to the public has not been fully implemented. In addition, several studies related to risk perception in Portugal showed a lack of knowledge regarding safety during earthquakes and tsunamis [13,14,15].
Therefore, the objective of this study is to carry out a tsunami numerical model by considering moderate/large tsunami scenarios. Then, the tsunami inundation model outputs at Setubal municipality will enable the creation of tsunami evacuation maps, which will provide new data to support emergency planning. As indicated by several international guidelines [16,17], the tsunami numerical model is an important tool for hazard assessment at a local scale (which includes the calculation of the tsunami run-up and inundation). Also, a variety of tsunami source models have been used for tsunami hazard assessment (e.g., [18,19]). Furthermore, the collaboration between stakeholders and academia is fundamental in order to disseminate know-how to the local communities, as recommended by the Sendai Framework for Disaster Risk Reduction [20]. Nevertheless, this kind of collaboration is an innovation among Portuguese academia. Thus, with this study, the authors hope to provide practical guidelines to coastal communities and stakeholders in order to reduce the number of fatalities during a potential future tsunami event, and therefore to contribute to more resilient communities.
2. Methods
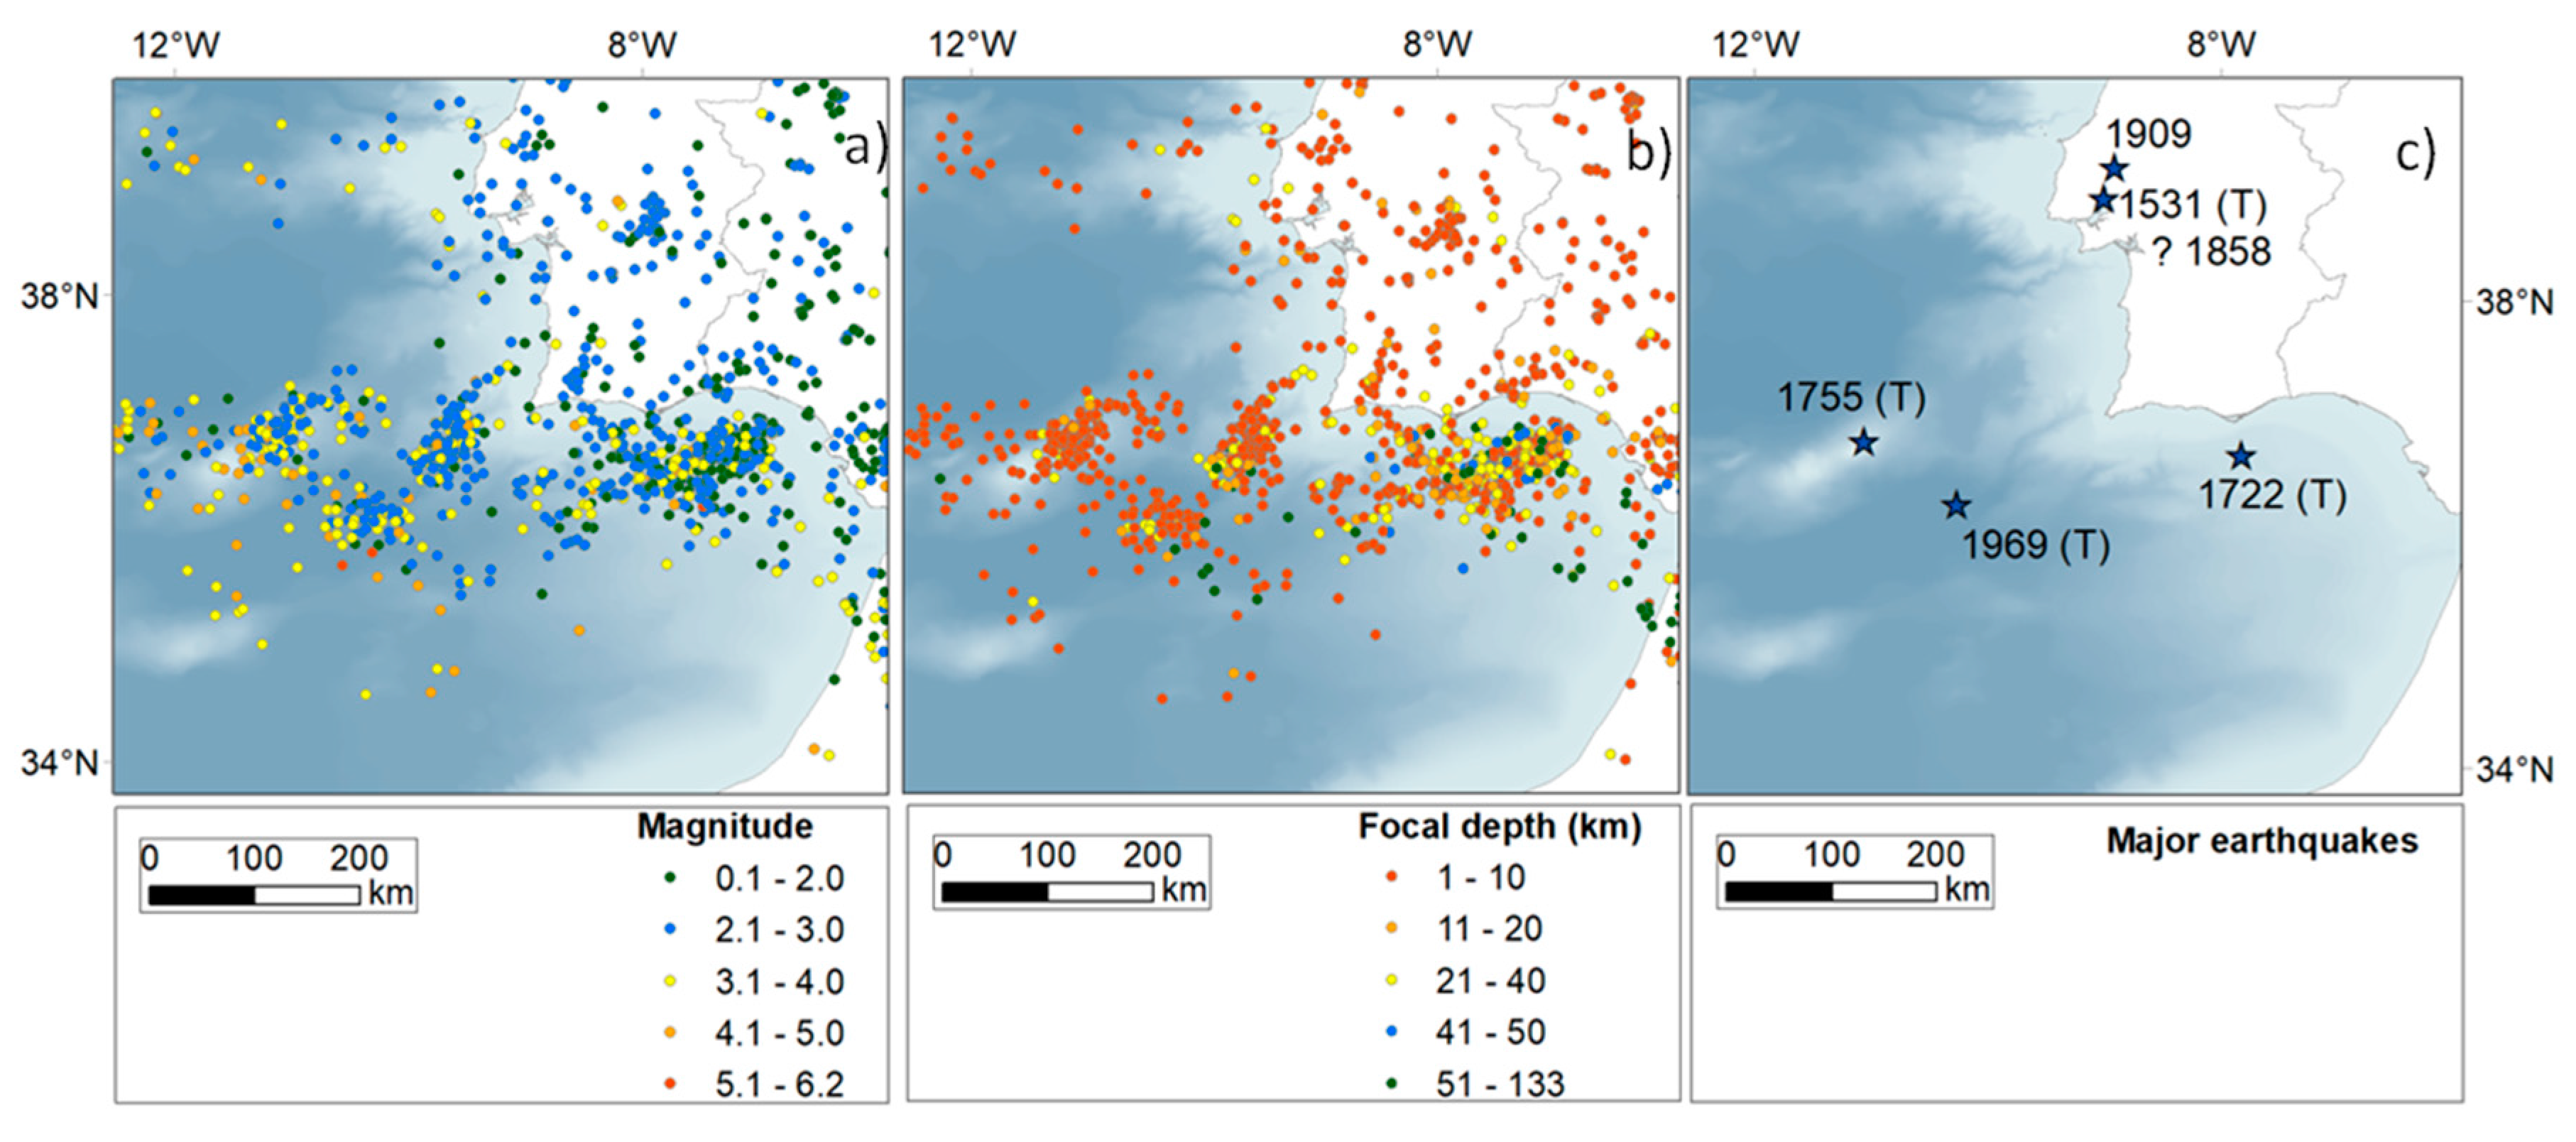
Seismicity data in mainland Portugal show that most earthquakes have epicentres off the southern shore of the country and are grouped into four major clusters (Figure 3). In general, earthquake magnitudes are under M 6.2 and their focal depth is quite shallow (less than 10 km). However, there have been few earthquakes in the past with a magnitude higher than M 6.0. This indicates one seismic event on each fault (Figure 3c). It has been estimated that large earthquakes in Portugal have a return period of approximately 1000 years [21]. Therefore, in this study, a deterministic approach [22,23] is considered, by identifying previous moderate/large tsunamis that hit Setubal.
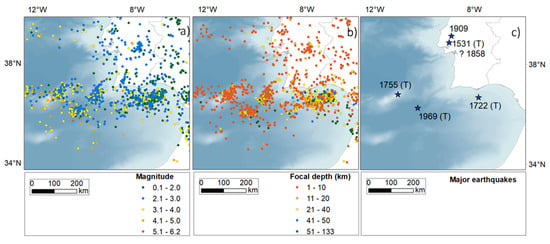
Figure 3.
Seismicity in southern Portugal mainland, adapted from [22]: (a) Magnitude; (b) Focal depth. Data from USGS, from 14 December 2000 to 14 December 2007; (c) Major earthquakes. (T) indicates earthquakes that triggered tsunamis. The epicentre of 1858 is unknown.
In fact, there were six registered high magnitude earthquakes (higher than M6.2), four of which triggered tsunamis, as compiled by [24]. The 1531 earthquake (M 6.9) [25] and its local tsunami caused severe damage and fatalities in Lisbon. Historic accounts are rather scarce since they were only reported in Lisbon. The 1722 earthquake (M 7.5) caused some damage in southern Portugal. Previous results of the tsunami numerical model of this tsunami [26] showed it might have affected the south of the country, with waves reaching up to 6 m at the beaches near the tsunami source area, but in general, the tsunami propagated with waves up to 0.5 m in height and did not reach Setubal municipality. In 1858, Setubal was hit by an earthquake (M 7.1) [25]. However, historical accounts are too insufficient for further conclusions regarding the epicentre location and fault parameters. The 1909 earthquake, with an estimated magnitude of 6.3 [25,27], caused 47 fatalities, and severe damage in Benavente, but no tsunami was generated.
The 1969 earthquake, with a magnitude of Ms 8.0 [28], triggered a tsunami. It occurred on 28 February at around 2:40 a.m. [29], and although it was on a winter night, many people felt the earthquake. It was the only earthquake experienced by many Portuguese people living in the area between Lisbon and the south of the country. However, neither the earthquake nor the tsunami caused damage or fatalities in the country and no records about this tsunami have been found in Setubal. Nevertheless, smaller events can also make evacuation difficult, especially if tsunami travel times are quite short [30]. Since there are records of the 1969 earthquake, Grandin et al., 2007 [28] were able to validate the earthquake source model. For this reason, in this study, numerical modelling of this tsunami was carried out using the fault parameters proposed by [28] and source dimensions of 82.5 km by 35 km, located on the Horse Shoe Fault.
The 1755 earthquake also generated a tsunami. Since this is a historic event, there were many uncertainties regarding the features of it. However, several studies were able to validate the source model: (i) a study that took almost 20 years to complete [31] was able to identify the seismic intensity based on the historical reports of the damaged buildings, combined with the geology of the Portuguese mainland territory; (ii) sediment analysis in the UK allowed the reproduction of several waves [30], which identified four major waves, with the first and second not being as high as the third and forth. The same tsunami behaviour was reported by the UK witnesses, as compiled by [1]. In addition, sediments were identified as a signature of the 1755 tsunami [32,33,34]; (iii) a seismic moment assessment was conducted by [35] and the author proposed an earthquake of Mw 8.7, with the source model located on the Gorringe Bank, and with dimensions of 200 km by 80 km; (iv) turbidities were found nearby the Gorringe Bank by two different teams of researchers [36,37] who concluded that the records were associated with the 1755 earthquake; (v) seismic intensity modeling was carried out by [28], who were able to validate the observed intensity published by [31]; (vi) by re-analyzing tsunami travel times reported by the witnesses, [38] used wave ray analysis and determined the tsunami source area. The authors concluded that it could be located on the Gorringe Bank; (vii) in this same study ([38]), the tsunami numerical model was carried out at the regional scale. The authors were able to validate the tsunami initial response, which was the subsidence at Cadiz, Spain and Morocco, as reported by the witnesses. The authors also validated most of the travel times reported by the witnesses, and tsunami water level waveforms in the UK; (viii) and, tsunami numerical modeling carried out at the local scale on the Portuguese coastline allowed researchers to calculate the tsunami inundation, reproducing tsunami travel times and local tsunami features such as the number of waves, inundation extension, and run-up [39,40,41,42].
Therefore, different methodologies that were conducted by different authors have led to the conclusion that the source area of the 1755 tsunami would be located on the Gorringe Bank. For this reason, the tsunami numerical model of this historical event was carried out using the fault parameters proposed by [38] and source dimensions of 200 km by 80 km [28,35], located on the Gorringe Bank.
The tsunami’s initial sea surface displacements of these two tsunamis were calculated using the Okada formulas [43]. Furthermore, tsunami numerical modelling was carried out at the municipal scale by using the TUNAMI-N2 code of Tohoku University which considers the non-linear shallow water equations, discretized with a staggered leap-frog finite difference scheme [44]. Bottom friction considers Manning’s coefficient to be n = 0.025.
where,
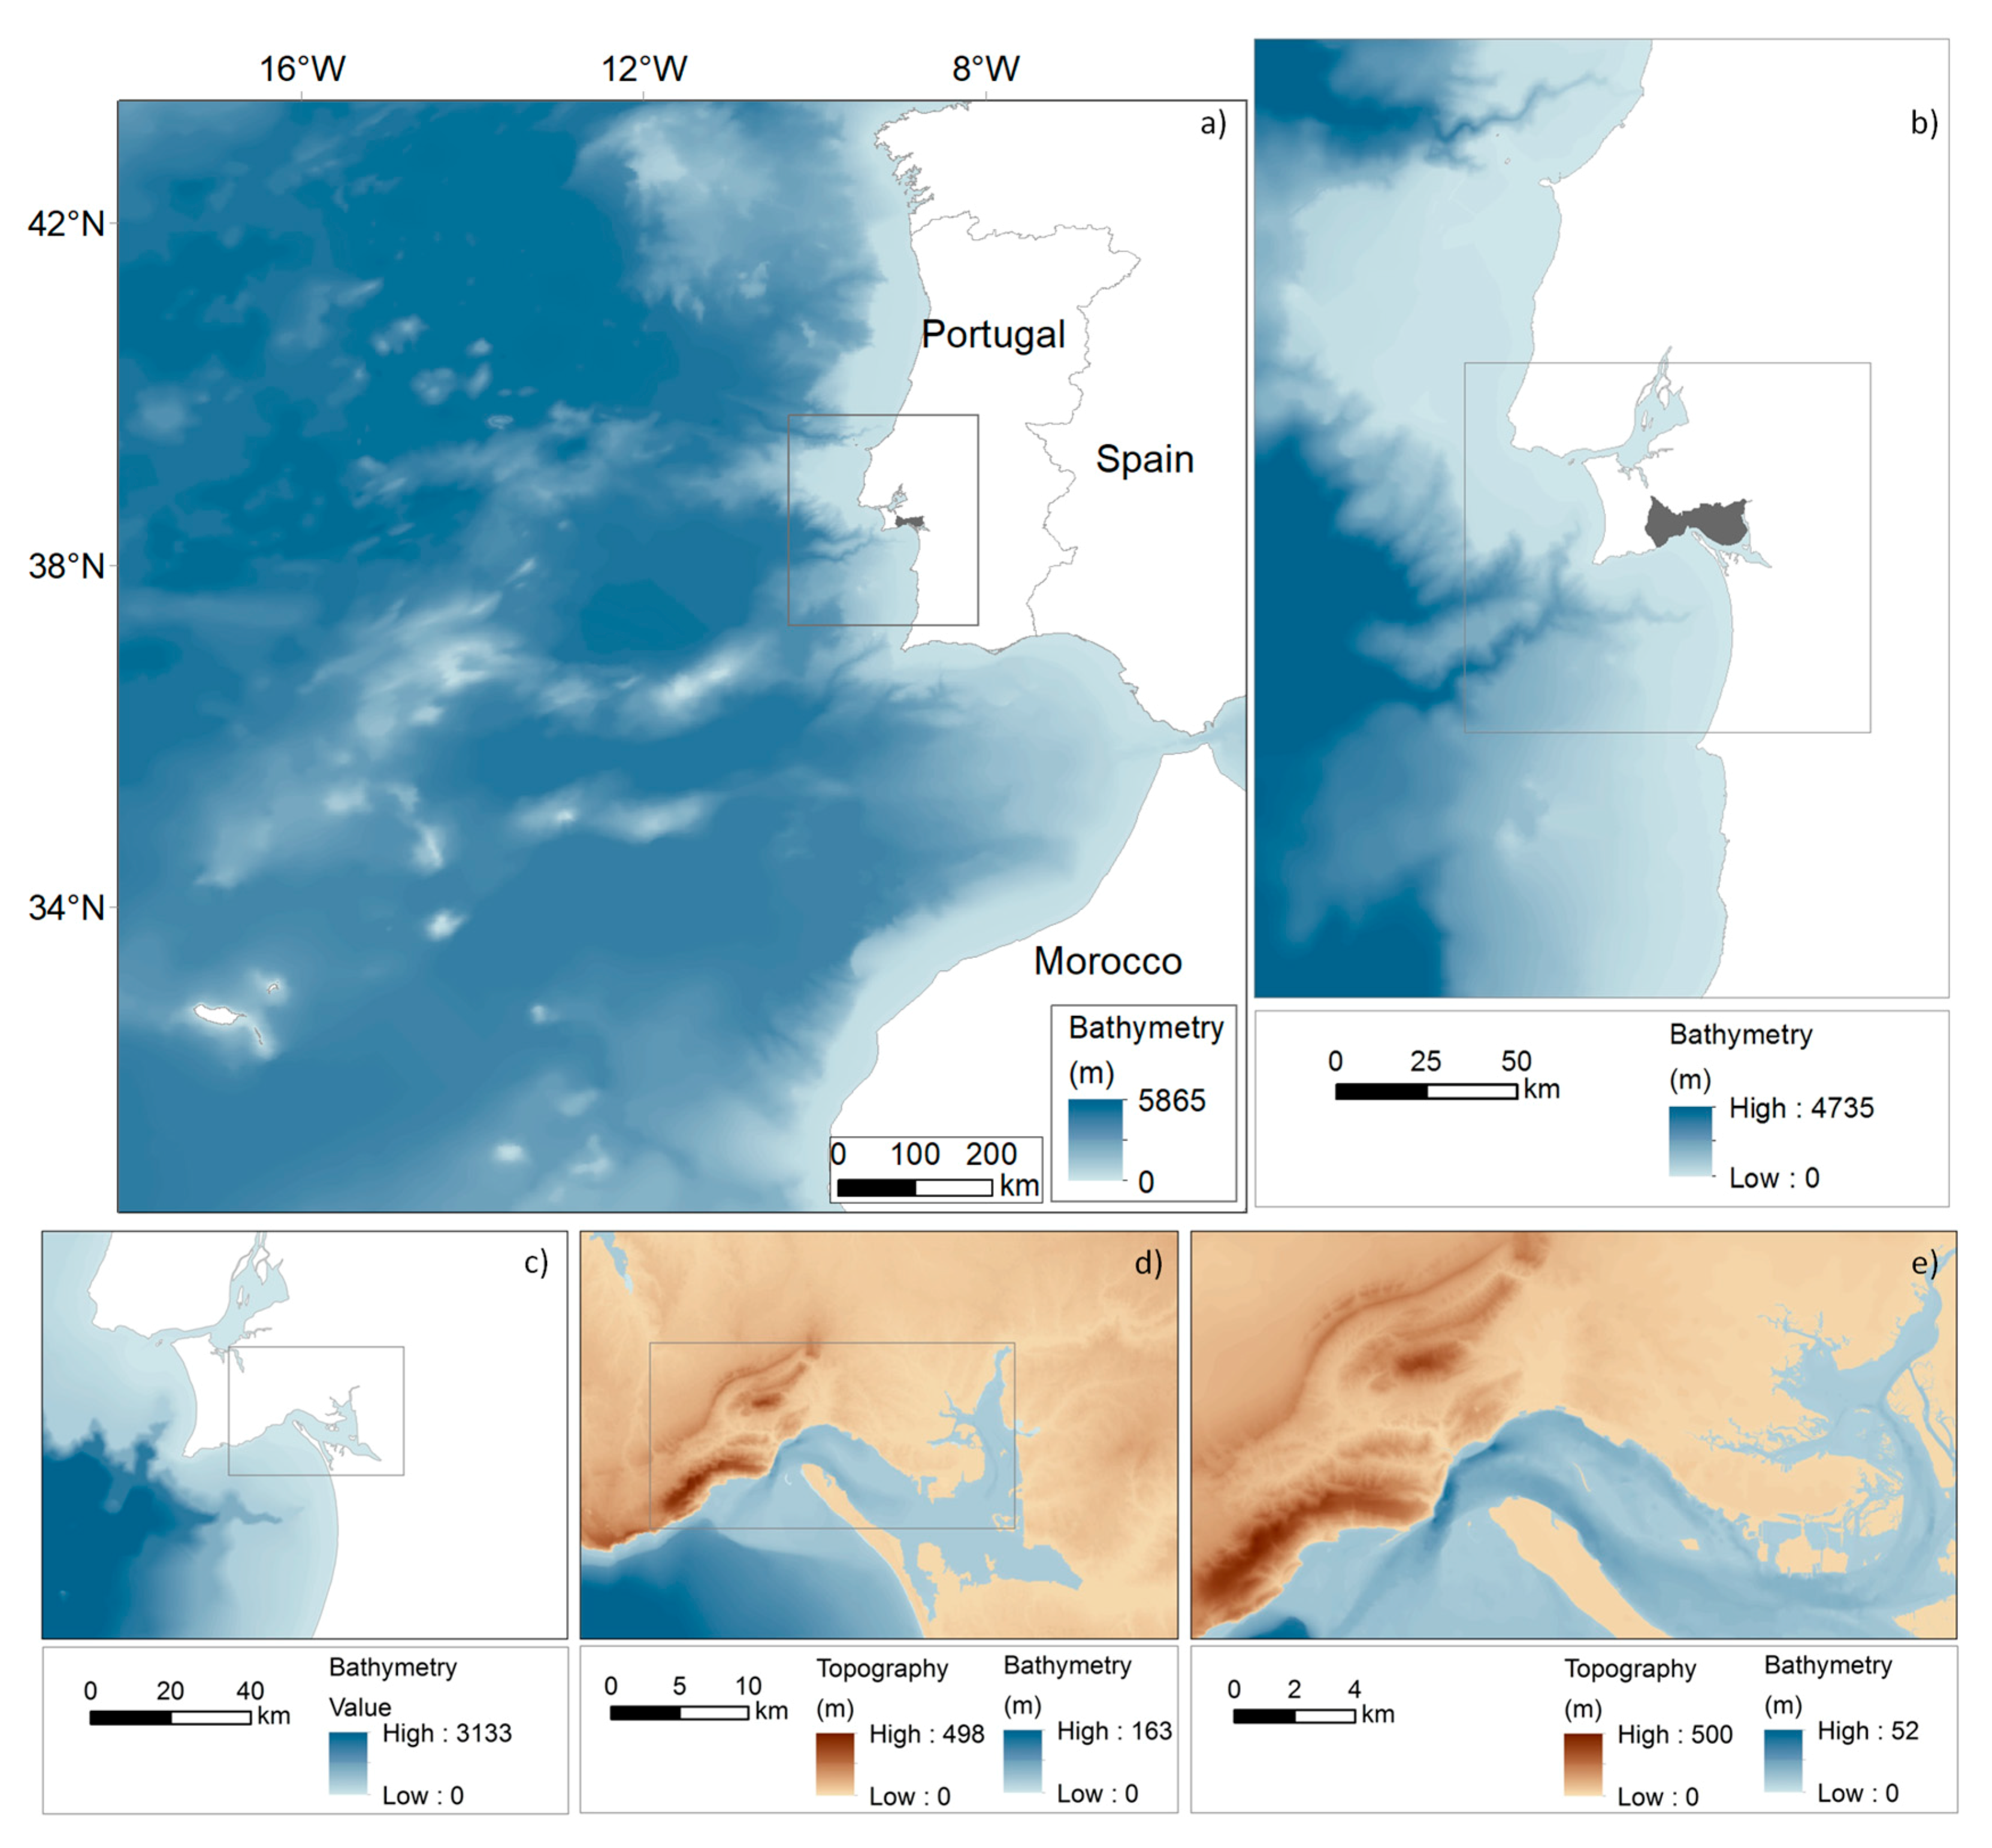
M and N are the discharge flux; u and v are the velocities of the x and y direction, respectively; η is the water level; and h is the water depth above the mean sea level. They were applied to a nesting of five regions, where the regions have progressively smaller areas and finer grid cell sizes and are included in the previous region, as shown in Figure 4. The first region is the widest and has a cell size of 810 m. The tsunami propagation results for region 1 allow a comprehensive analysis as to how the tsunami waves spread out from the tsunami source area. Then, regions 2 and 3 have cell sizes of 270 m and 90 m, respectively. Finally, regions 4 and 5 have cell sizes of 30 m and 10 m, respectively, and include details of the coastal areas and topography. This method has been applied in several tsunami numerical modelling studies, e.g., [45]. In the construction of each region of Setubal (Figure 3), several bathymetry charts were used [46,47,48], as well as detailed topographic maps [49]. In addition, several field surveys were conducted to provide better topographic data and improve the input data for the numerical model, by using a Trimble GPS. In computational region 5, tsunami inundation allows tsunami run-up to be calculated. Thus, in region 5, a 10 m cell size is suitable for the study area because it accurately reproduces local natural topography variations as well as structures such as buildings. Other authors have also been using the non-linear shallow water equations to calculate tsunami run-up, e.g., [50]. The results calculated in region 5 include: water level waveforms; snapshots of water level height; tsunami travel times, which represent the elapsed time of the first wave crest since the earthquake; maximum water level; inundation depth; and velocity field.
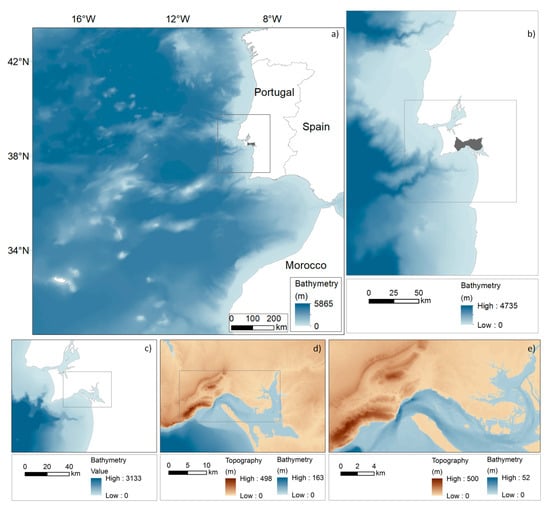
Figure 4.
Conditions of the tsunami numerical model setting to Setubal municipality with cell sizes of: (a) 810 m; (b) 270 m; (c) 90 m; (d) 30 m; (e) 10 m.
The tsunami numerical model results were the base for constructing tsunami inundation maps. Then, tsunami evacuation conditions in the coastal areas were assessed. The purpose was to select the location of the meeting points, which are safe areas located outside the inundation zones. The combination of these data allowed tsunami evacuation maps to be created, which will be provided to coastal communities and emergency responders. This approach has been suggested by several methodological guidelines [16,17,20,51].
3. Results and Discussion
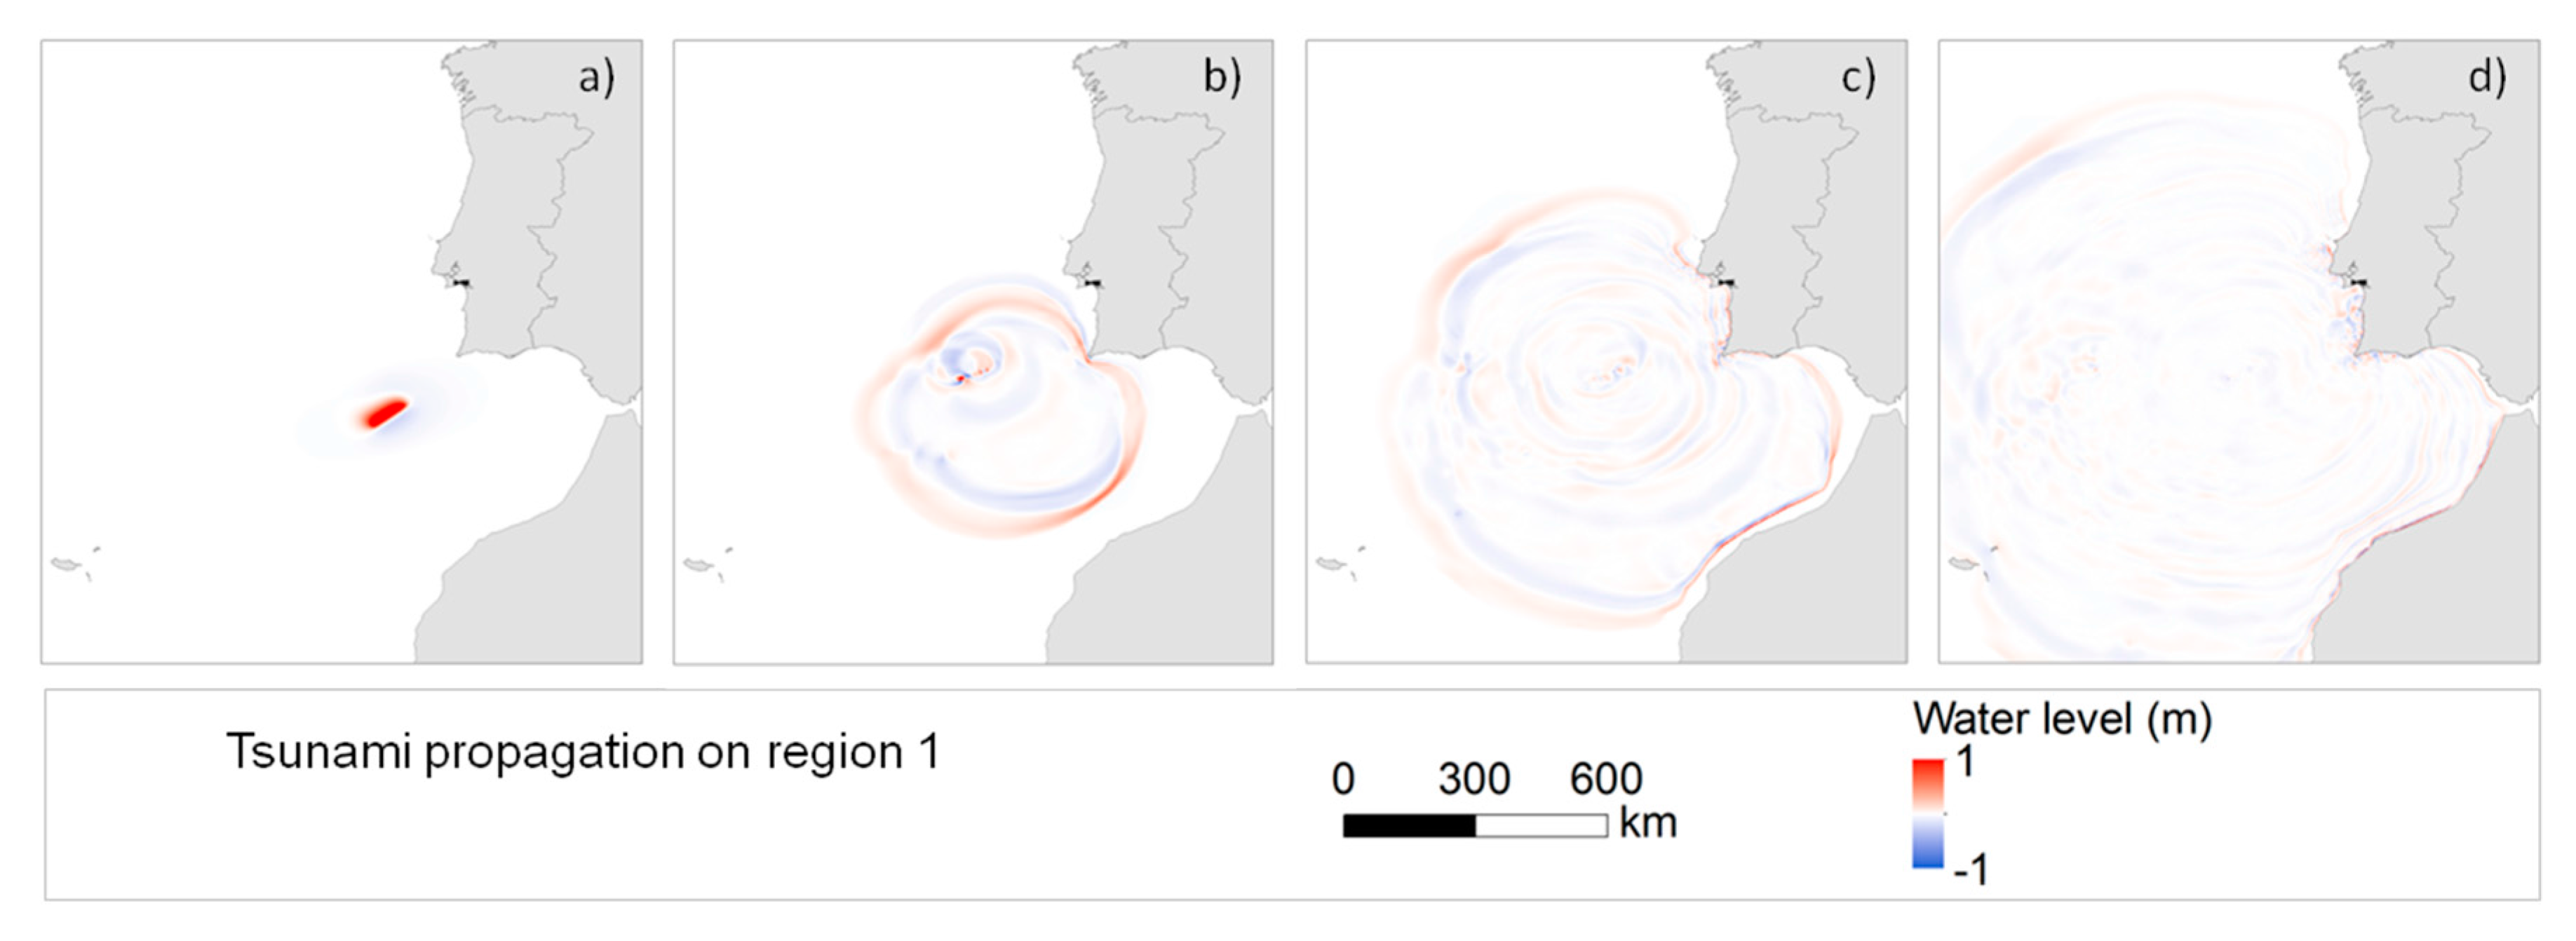
Tsunami propagation results obtained for region 1 in the 1969 tsunami are shown in Figure 5. Initial sea surface displacement was +1.7 m. The water level snapshots show how the 1969 tsunami waves spread out from the tsunami source area, reaching Setubal municipality within 40 min of the earthquake. At the regional scale, several tsunami waves propagated in the region under study, being less than 1 m in height at the coasts of Portugal, southern Spain, and Morocco.
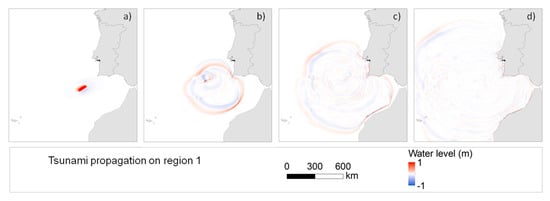
Figure 5.
Tsunami propagation snapshots of computational region 1 for the 1969 Tsunami: (a) initial sea surface displacement; (b) 20 min; (c) 40 min; (d) 60 min.
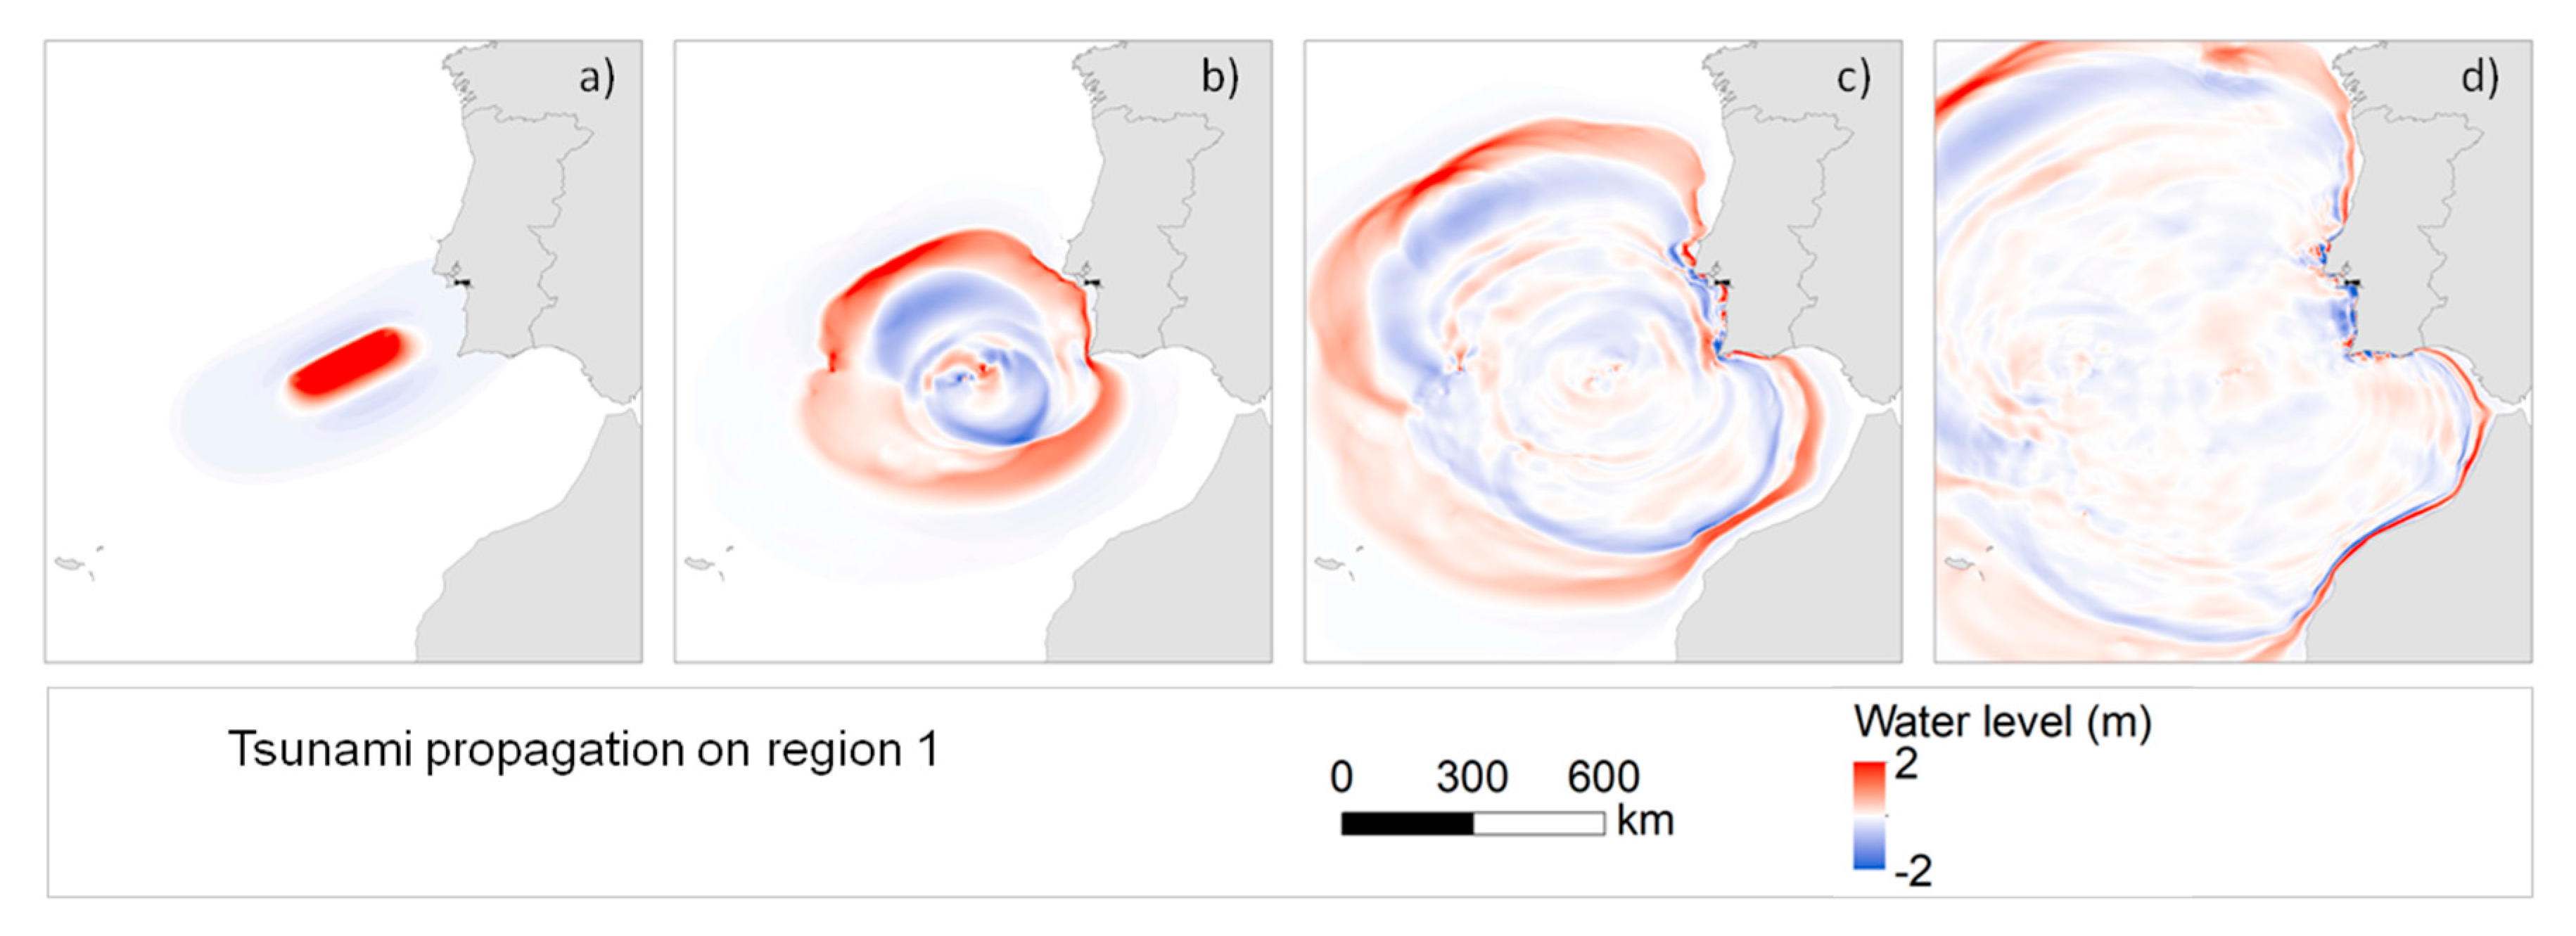
The second scenario was the 1755 tsunami. Tsunami propagation results obtained in computational region 1 are shown in Figure 6. Initial sea surface displacement was +6 m. The water level snapshots show how the tsunami waves spread out from the tsunami source area over the selected computational region. The first tsunami wave reached Portugal in about 15 min, which is consistent with previous tsunami numerical modelling at the regional scale [38] and local scale [41]. In addition, the tsunami arrived in Setubal municipality within 30 min after the earthquake, which is about 10 min earlier than the 1969 tsunami. Thus, the 1755 scenario allows Setubal’s coastal communities a shorter evacuation time than the 1969 scenario.
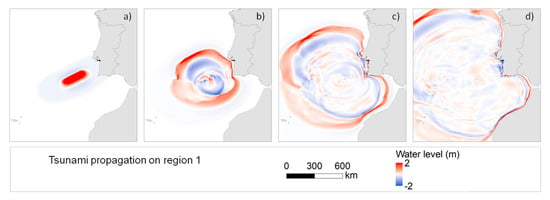
Figure 6.
Tsunami propagation snapshots of region 1 for the 1755 tsunami: (a) initial sea surface displacement; (b) 20 min; (c) 40 min; (d) 60 min.
In addition, the model results also show that the initial wave response was a subsidence at the coasts of Cadiz, Spain and Morocco which is also consistent with previous model results and historic accounts of this historical tsunami, as obtained by [38]. Furthermore, at the regional scale, the 1755 tsunami propagates with wave heights of less than 2.0 m, with local amplifications on the Portuguese coastline reaching up to 8 m in height.
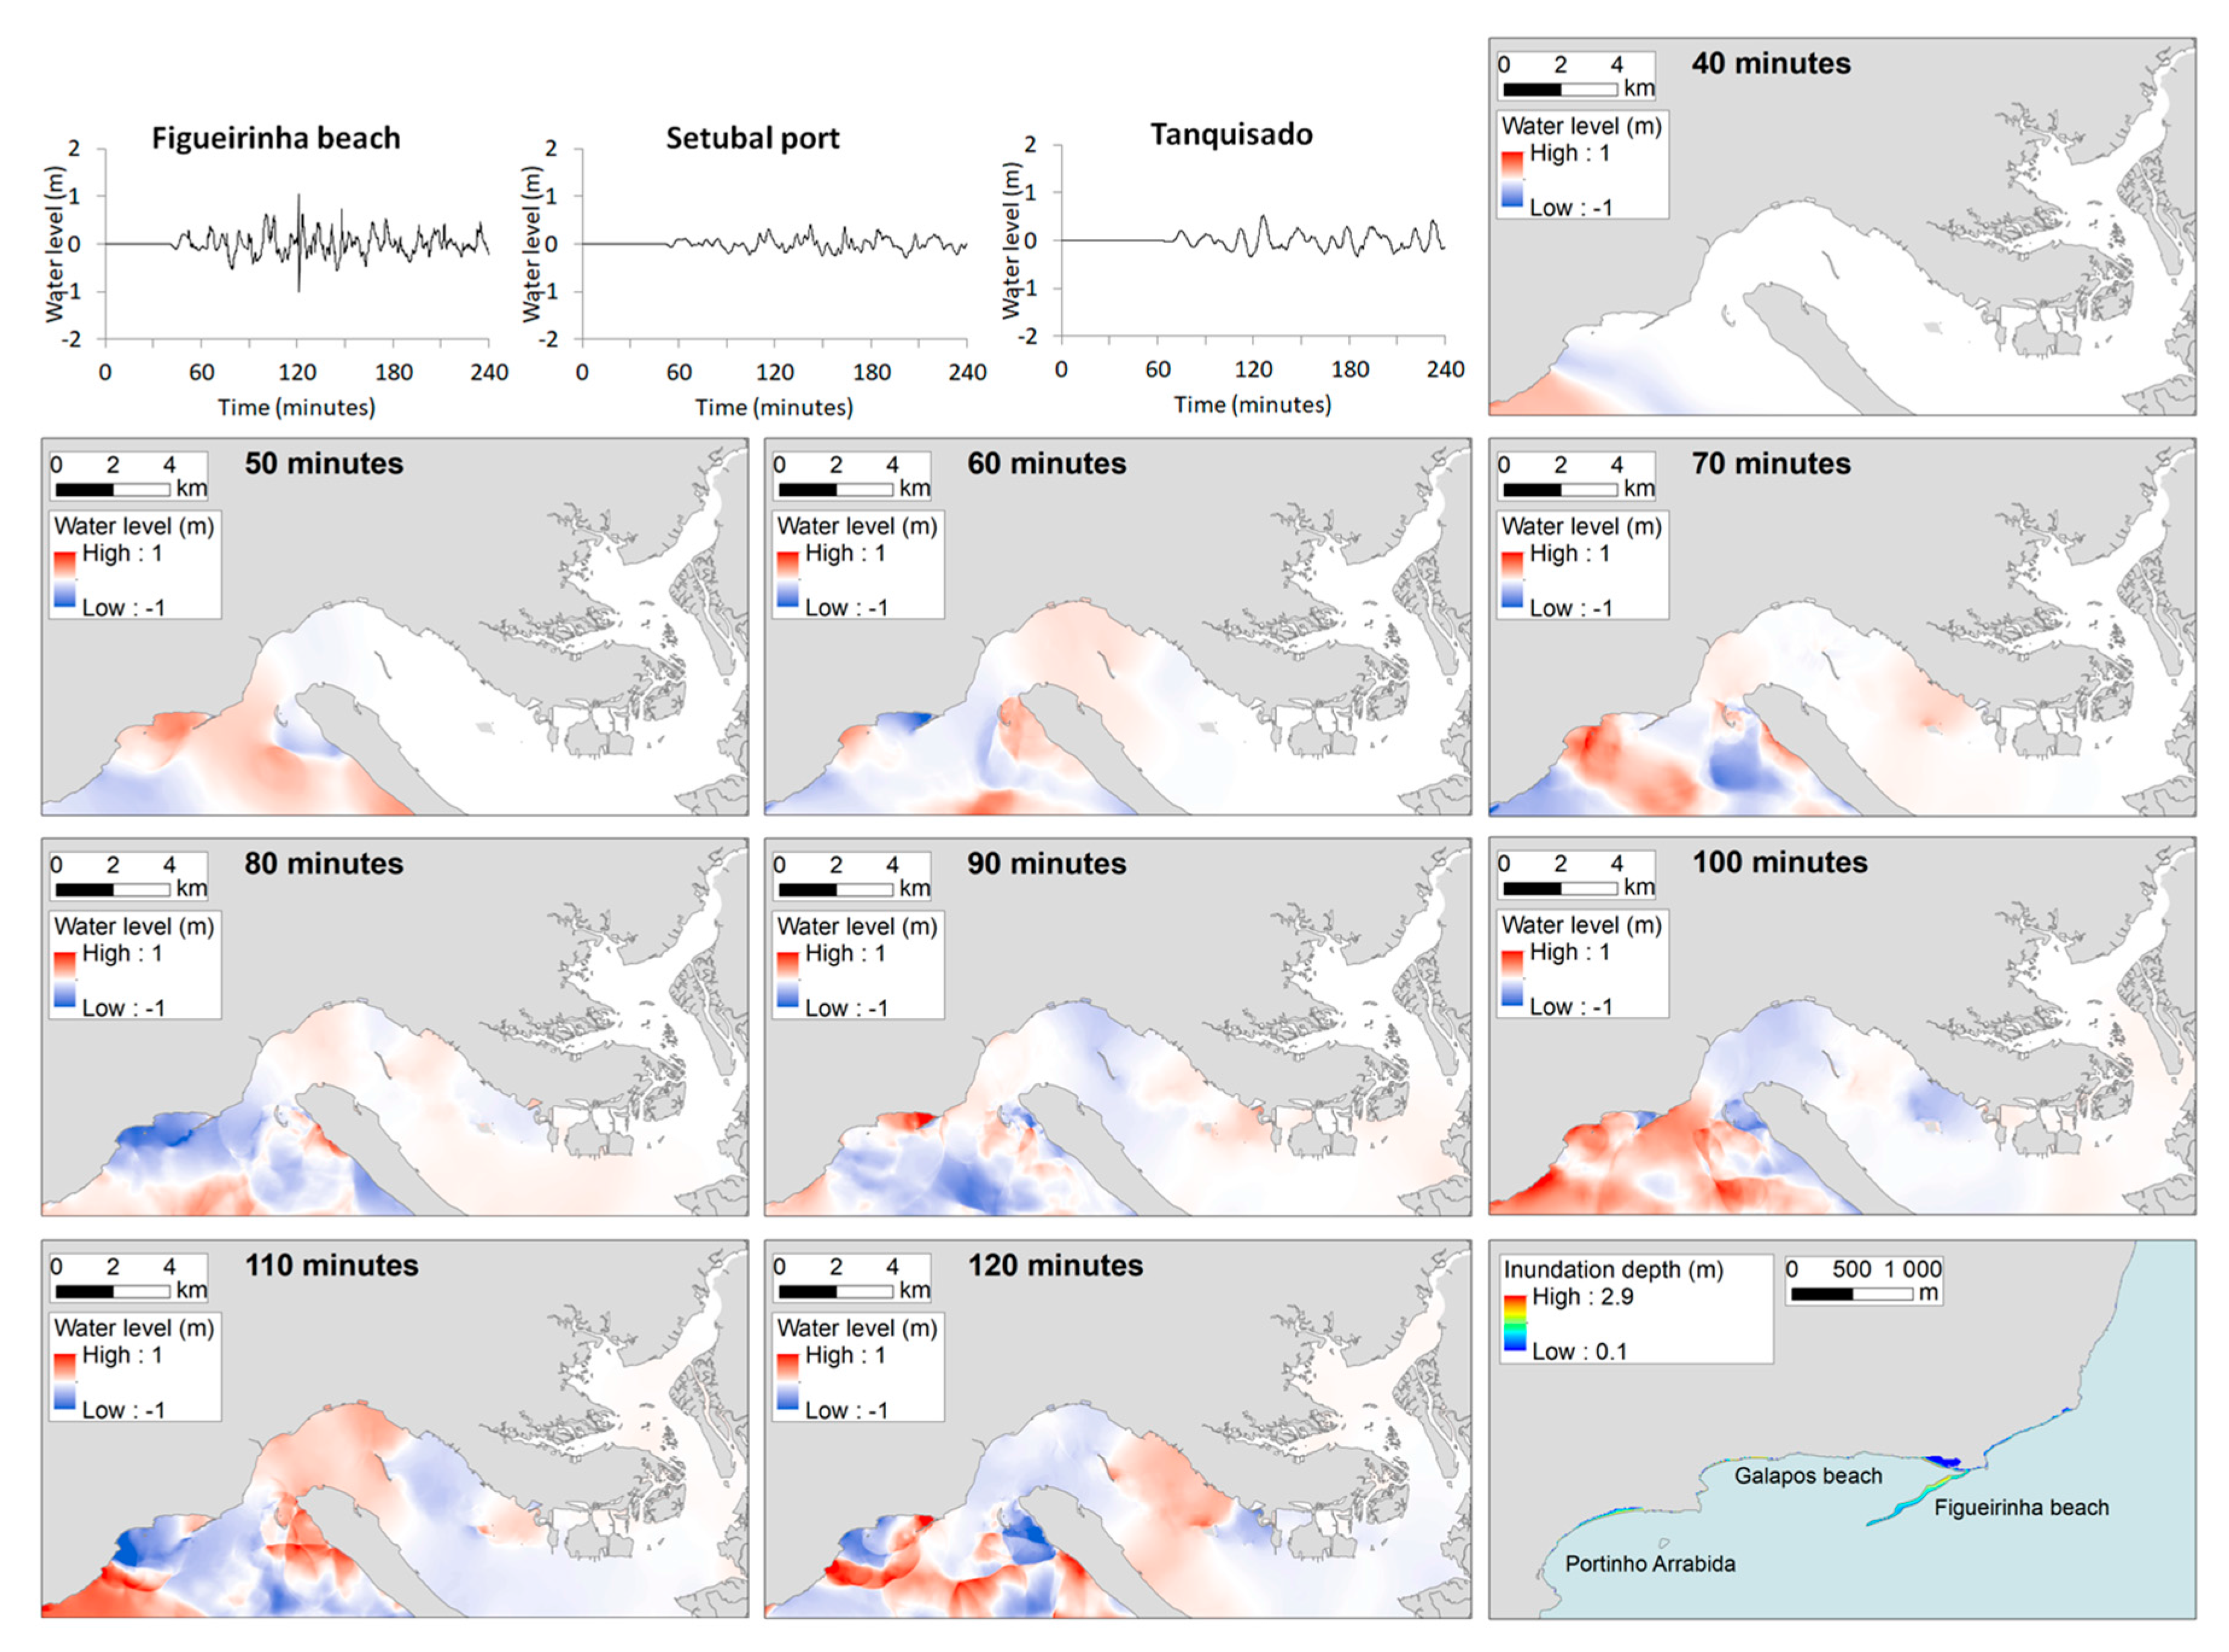
On the other hand, the tsunami numerical model results for computational region 5 show more details about the tsunami’s features than region 1. The numerical model results of region 5 for the 1969 tsunami are shown in Figure 7. The water level waveforms show that the tsunami triggers several waves of less than 1 m in height at the Figueinha beach, and less than 0.5 m in height on the port of Setubal and the Tanquisado company. The snapshots show the arrival of the first wave within 40 min after the earthquake. Ten minutes later, the tsunami hit the western area of Setubal municipality, where the beaches are located (Figure 1), with wave heights of up to 0.50 m. 60 min after the earthquake, and the first wave that hit the urban area was less than 0.20 m in height and it did not inundate the riverside streets. Simultaneously, the second wave started approaching at a height of 0.5 m, amplifying to 1m at Portinho da Arrabida (beach 1, in Figure 1) at 70 min. The third and fourth waves arrived within 100 min of the earthquake, reaching approximately 2 m in height near the beaches, but were much attenuated at the Sado River mouth and up the river. The tsunami inundated the sandy beaches, with inundation depths of less than 2.9 m.
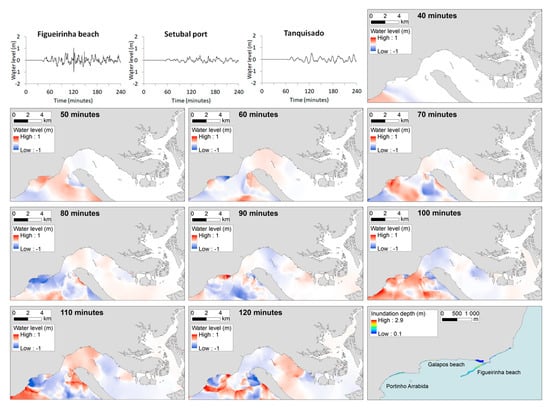
Figure 7.
Water level waveforms, snapshots, and inundation depths of the 1969 tsunami.
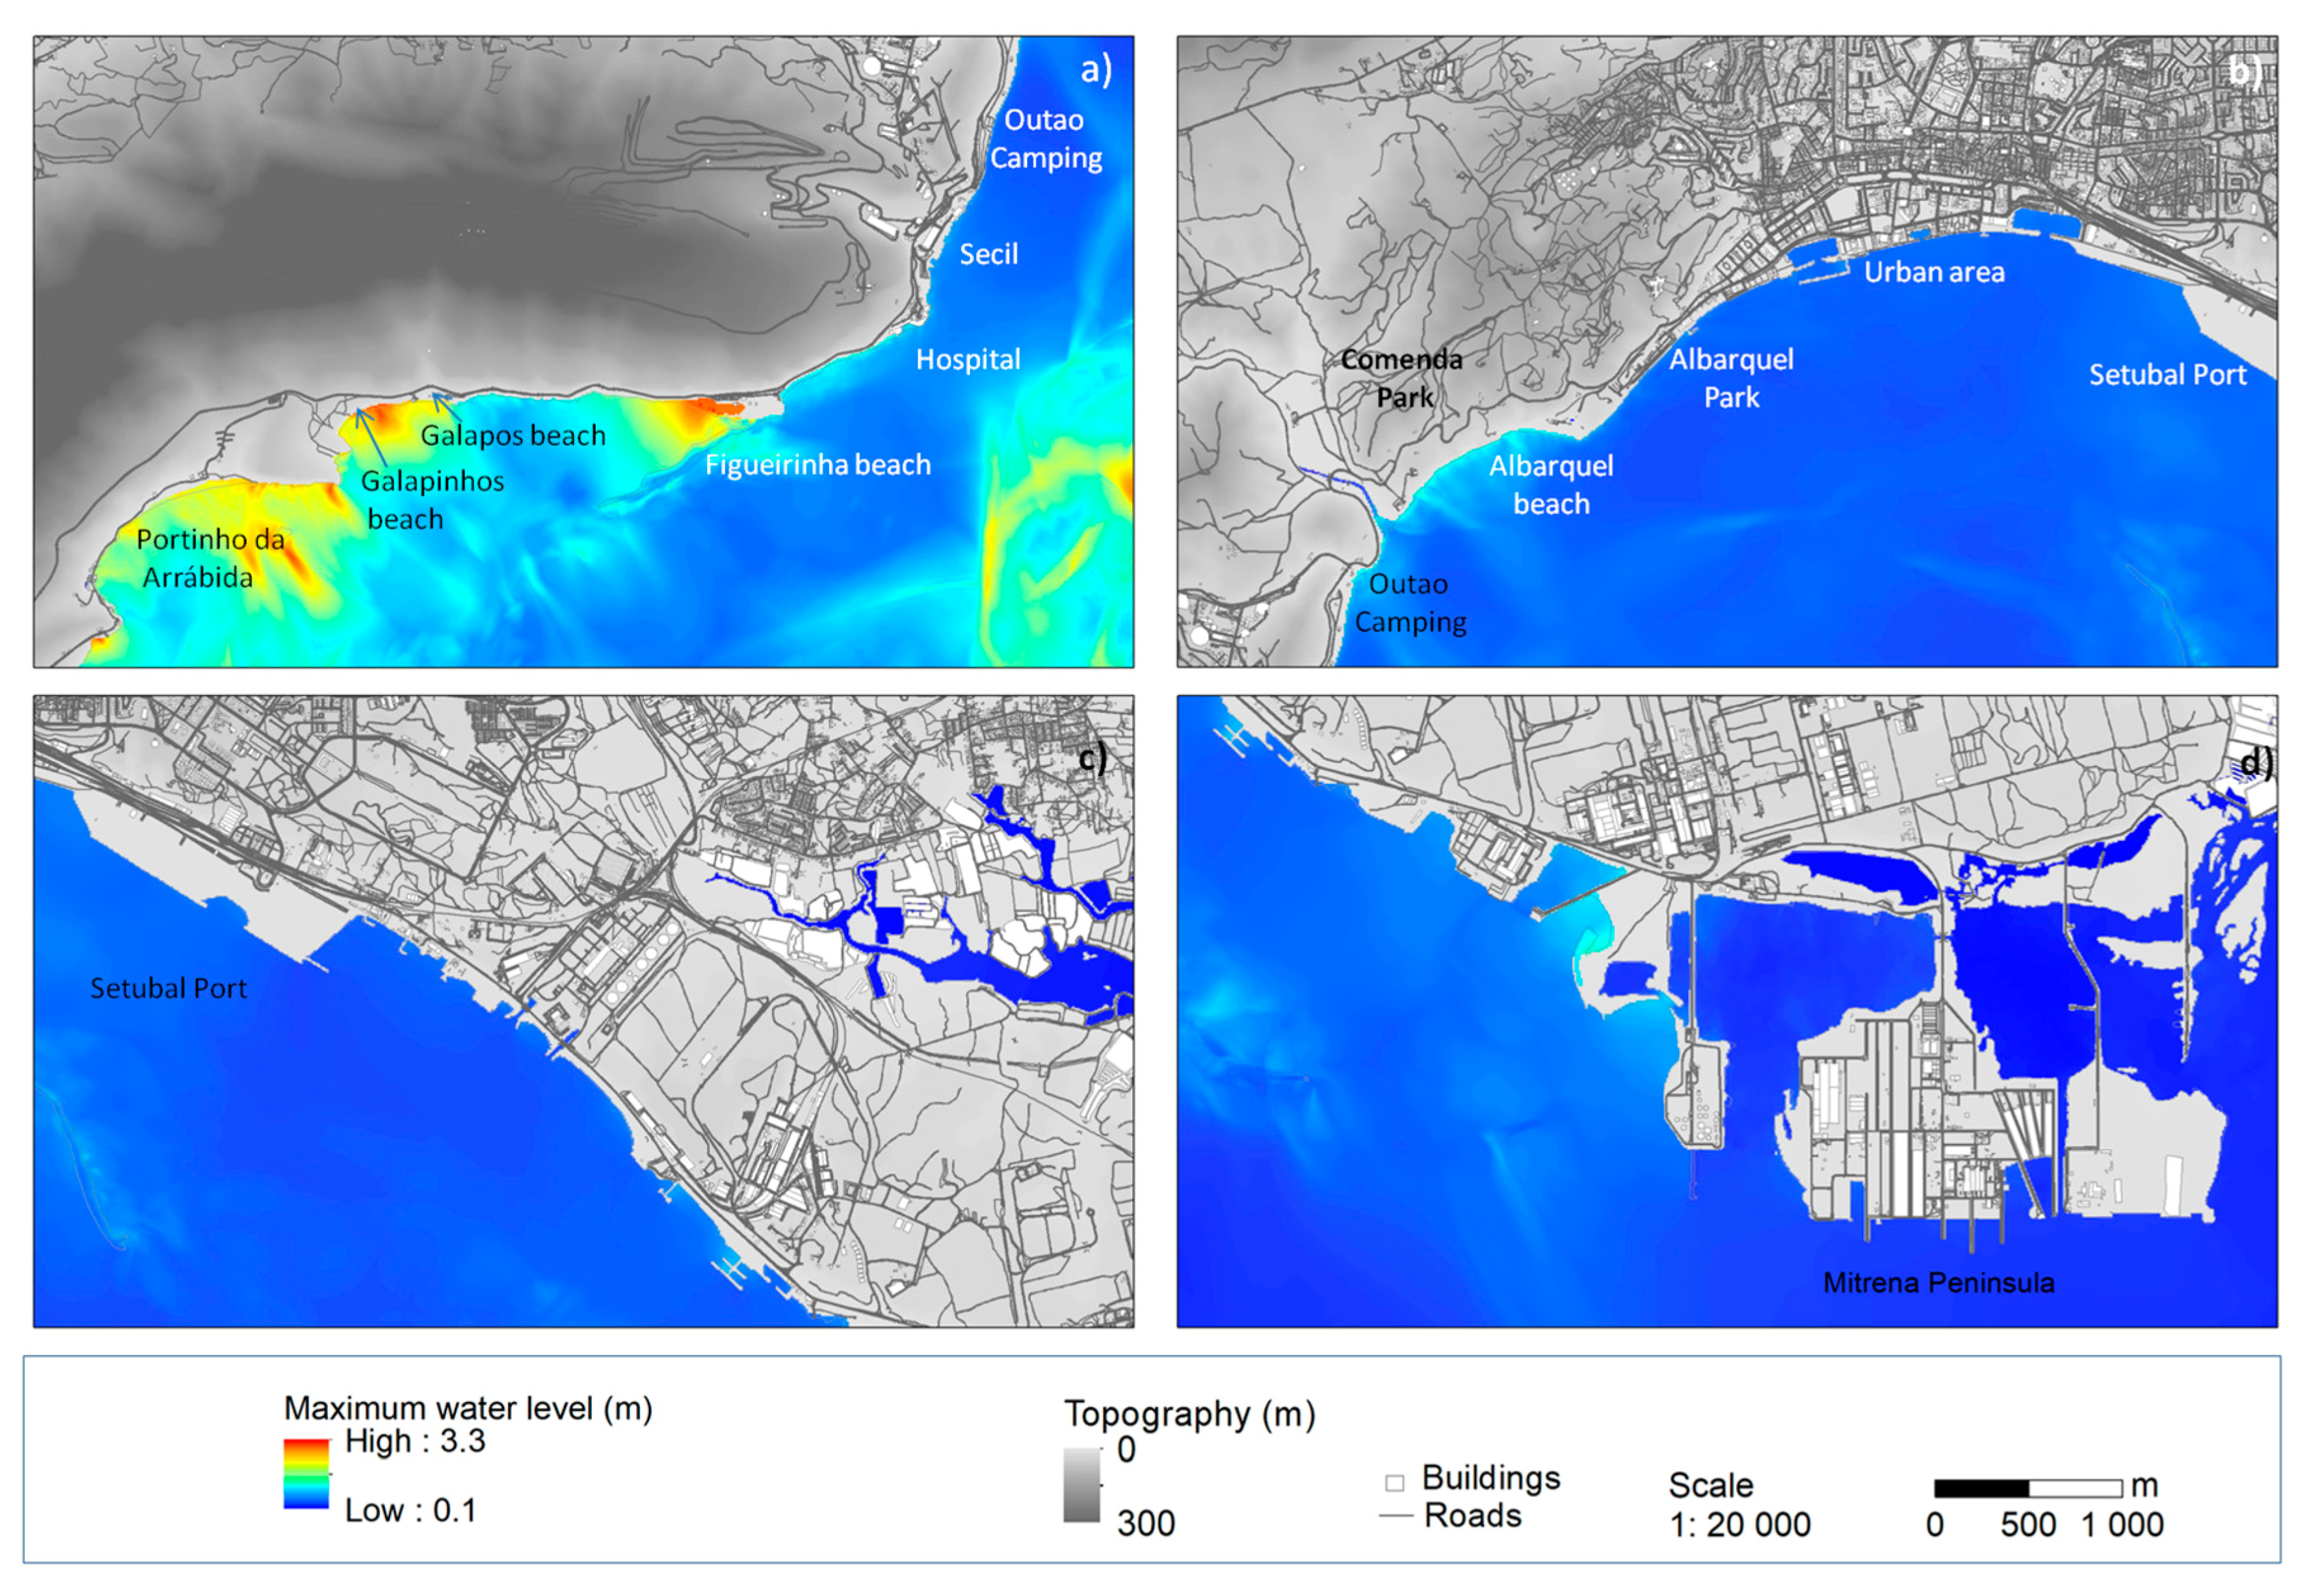
Thus, the maximum water level of the 1969 tsunami (Figure 8) shows maximum values near the beaches, reaching up to 3.3 m in height. However, in the Sado River, the maximum water level was generally up to 0.5 m and did not inundate the coastal areas.
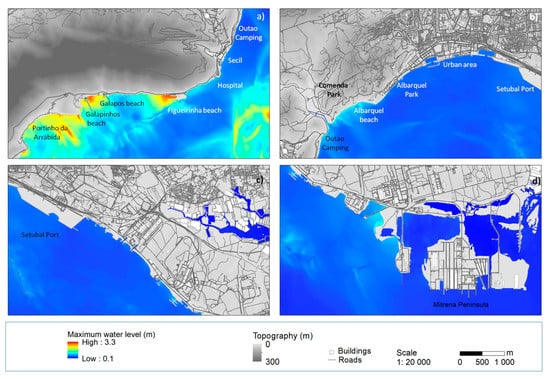
Figure 8.
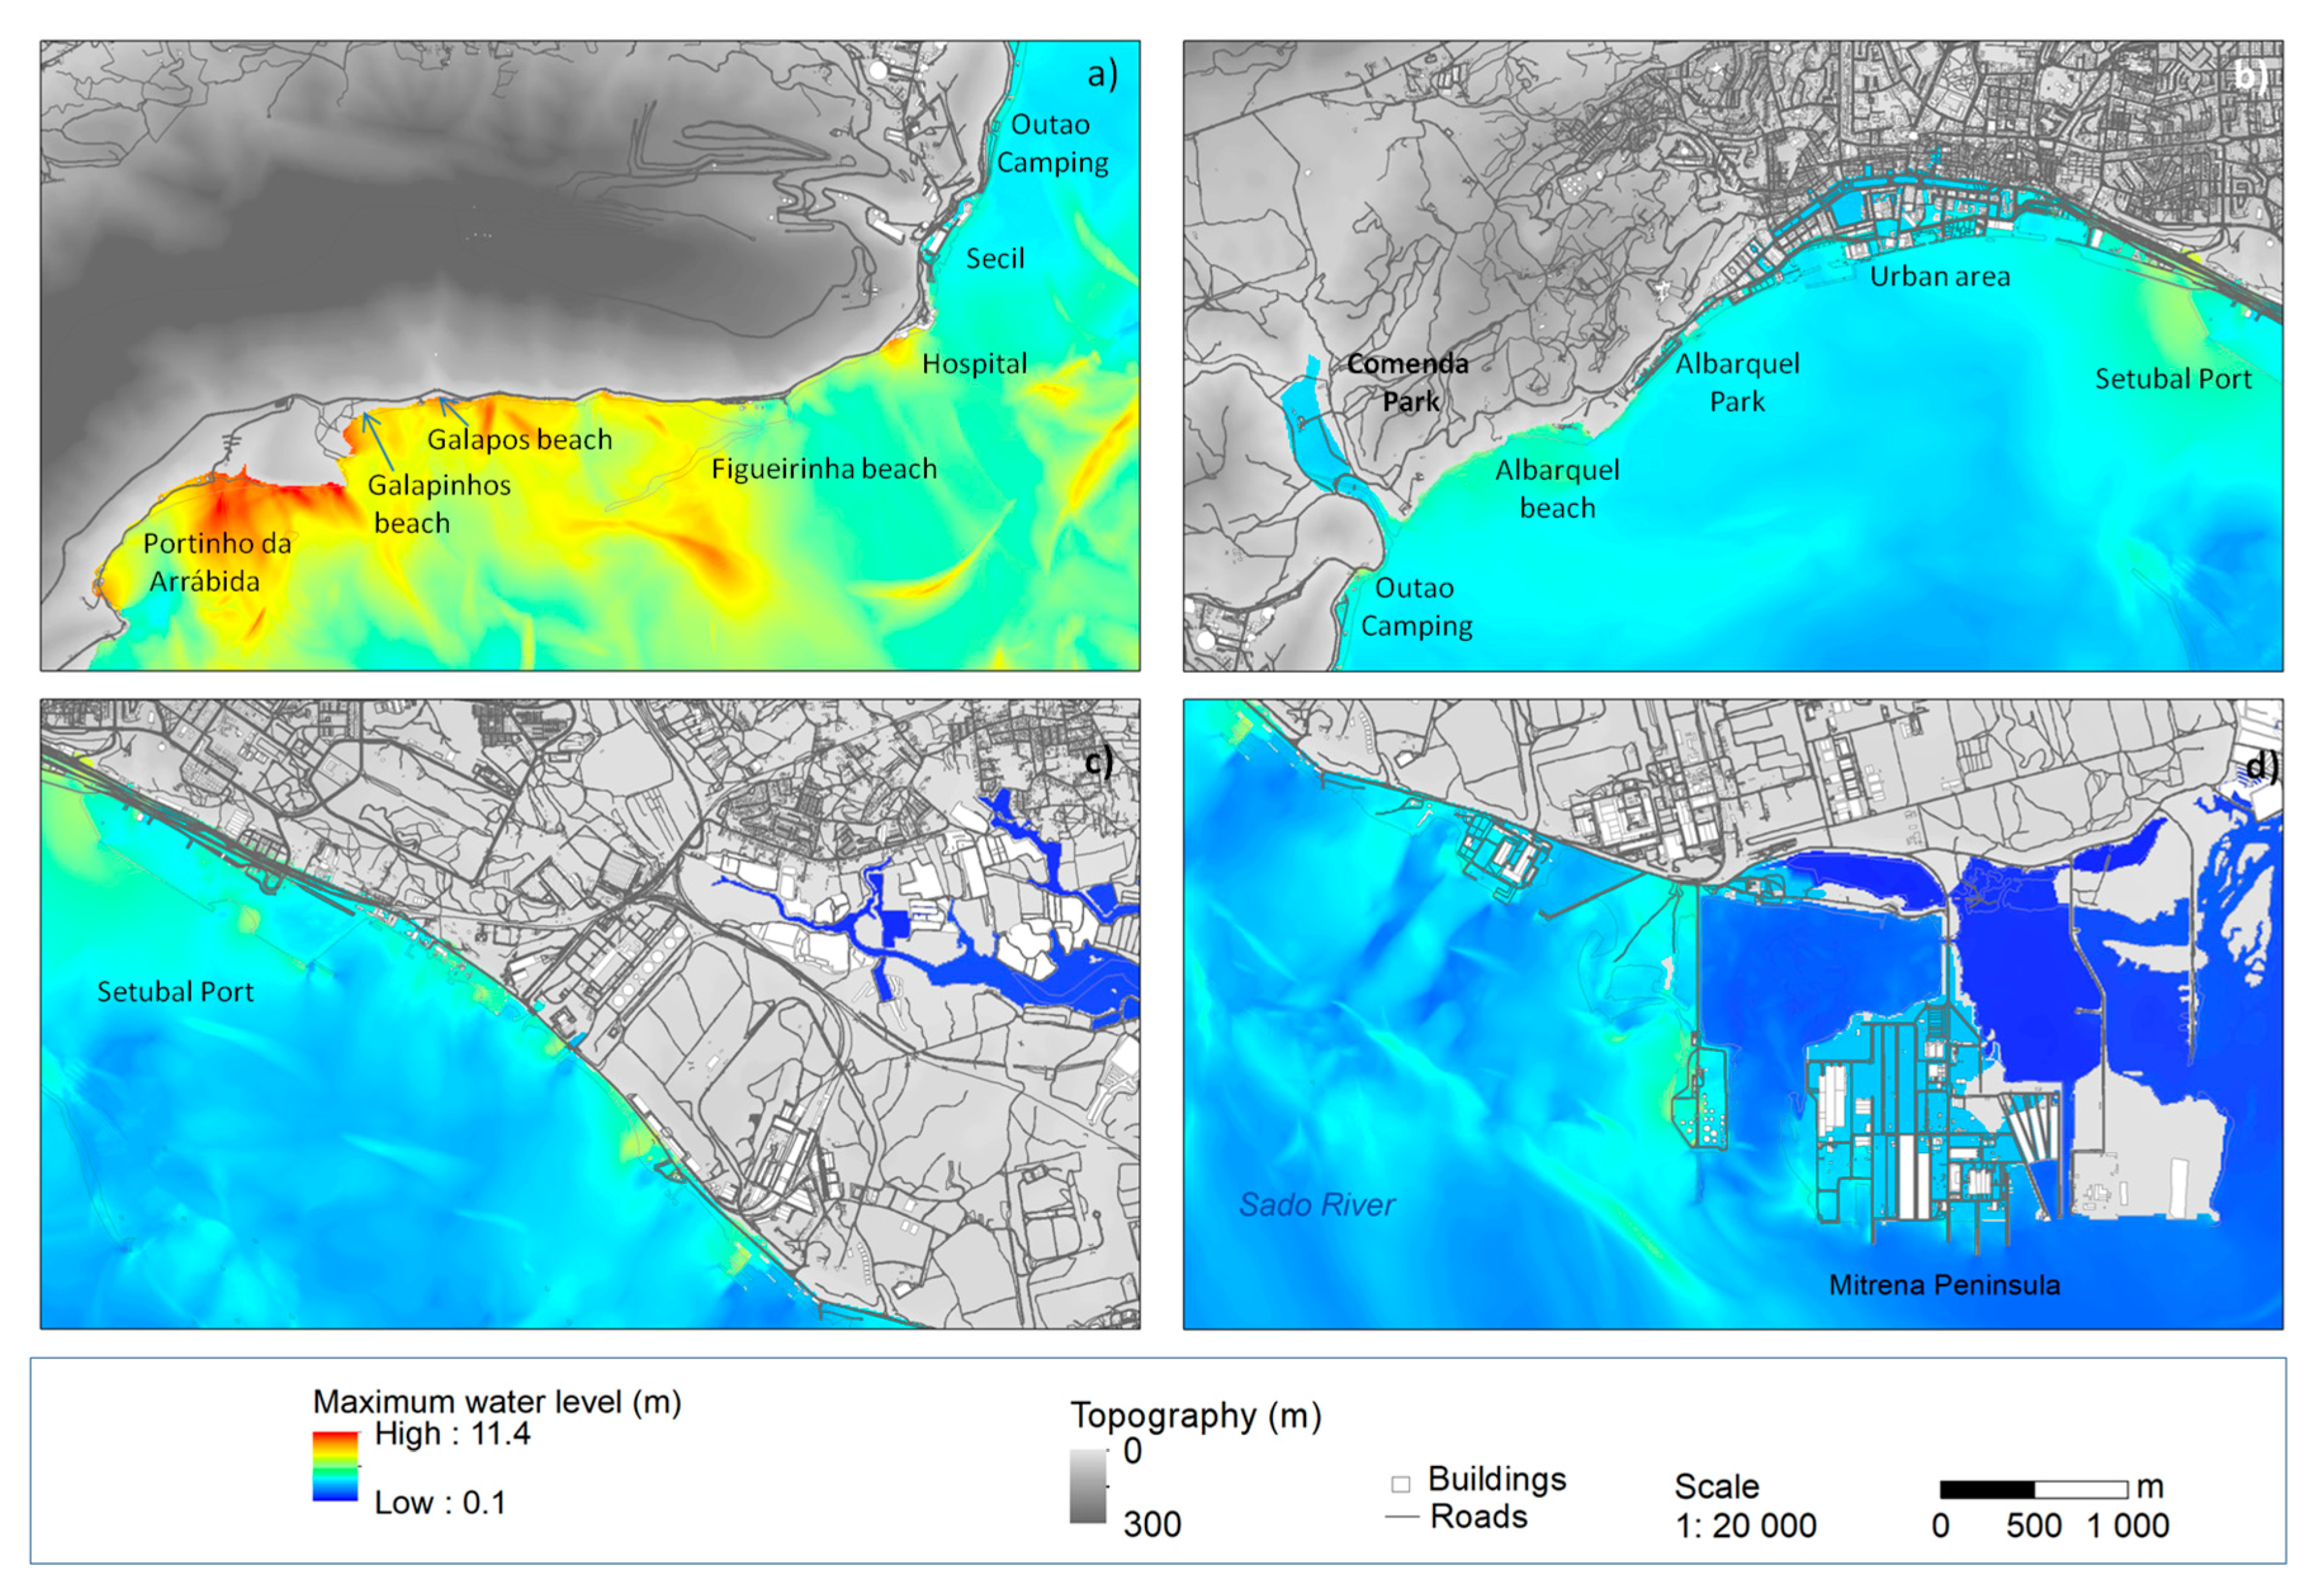
Maximum water level of the 1969 tsunami: (a) Western area; (b) Central area, including the urban area; (c) Eastern area, including the industrial area; (d) South-east area where the Mitrena Peninsula is located.
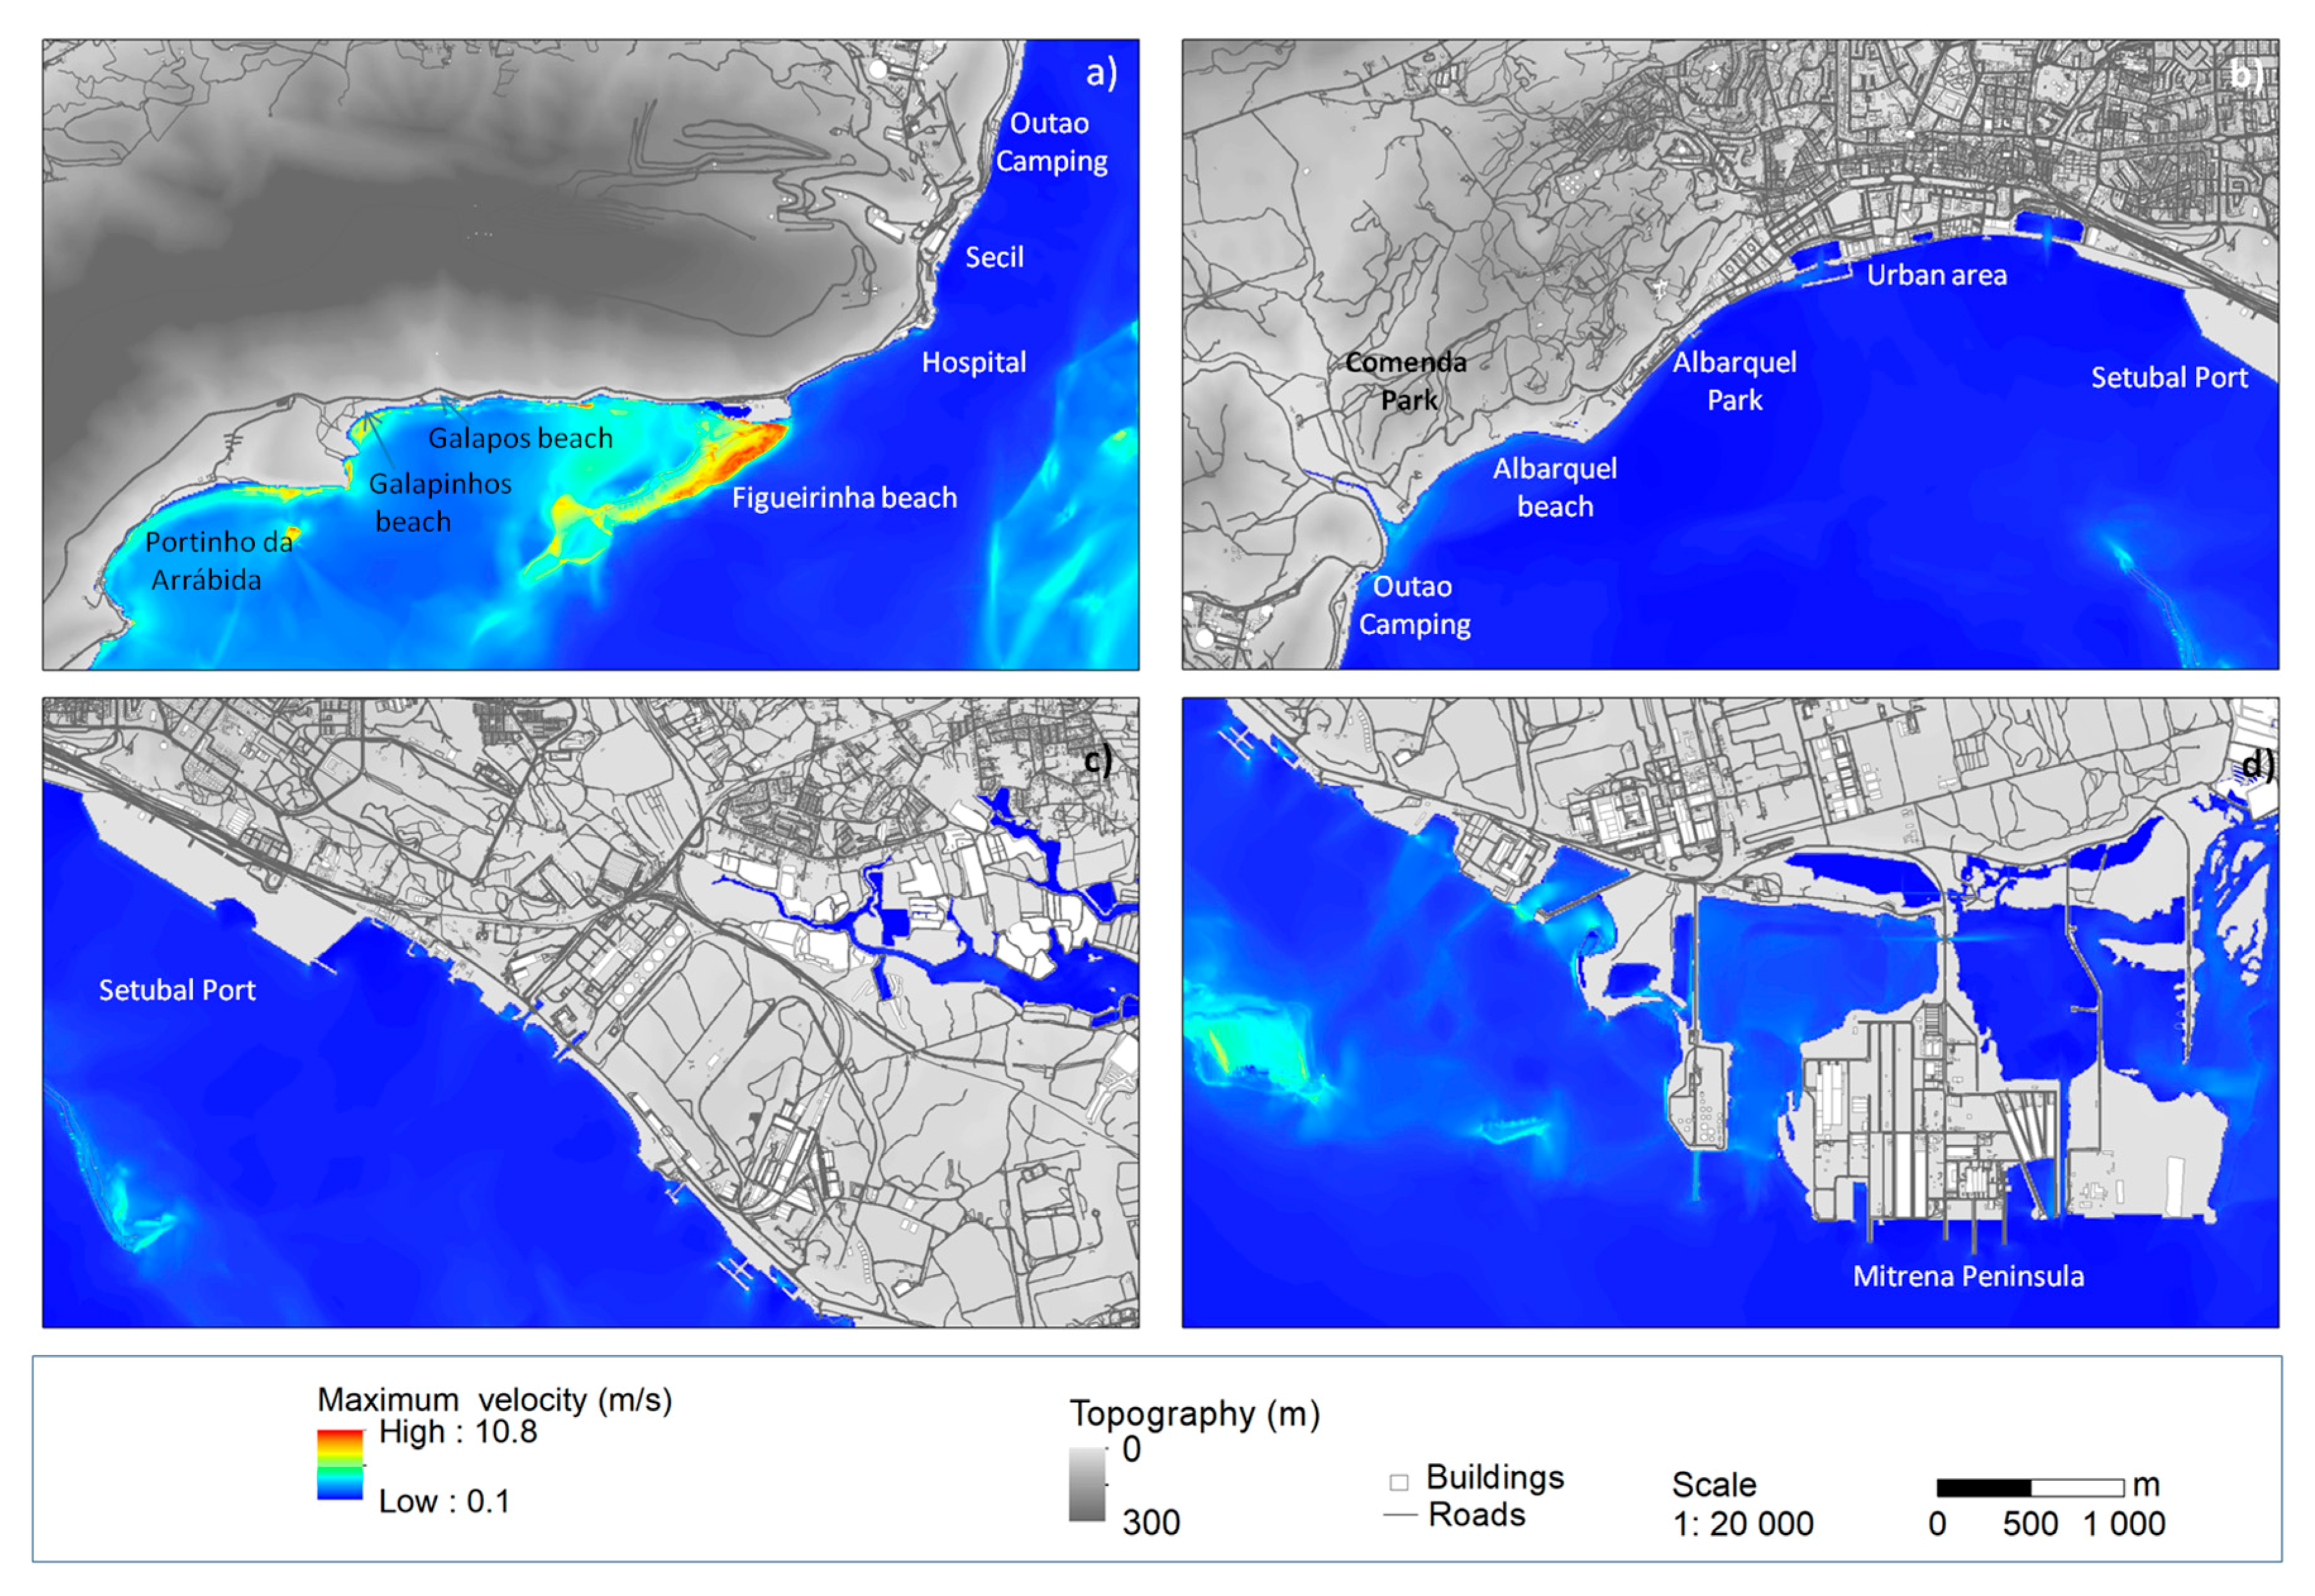
In addition, the maximum velocity (Figure 9) had its highest values off Figueirinha beach, at 10.8 m/s. Still, near all the beaches, the velocity ranged between 3 and 6 m/s, which is also significantly high. However, in the Sado River, the velocity was generally less than 2.0 m/s, which is below the usual tide currents velocity of approximately 4 m/s.
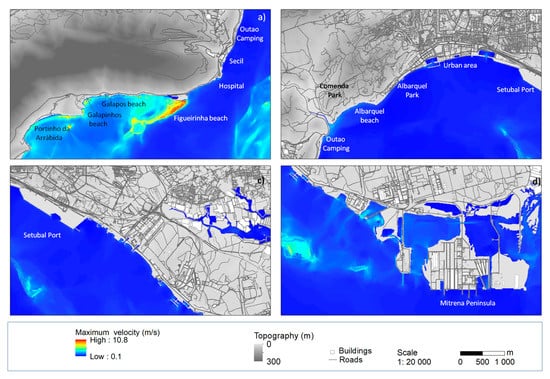
Figure 9.
Maximum velocity of the 1969 tsunami: (a) Western area; (b) Central area, including the urban area; (c) Eastern area, including the industrial area; (d) South-east area where the Mitrena Peninsula is located.
The 1969 tsunami occurred on a winter night, and for that reason, nobody was at the beaches. In addition, because the tsunami waves did not inundate the coastal areas of the Sado River, including the urban area, the tsunami went unnoticed by the residents. Nevertheless, if this earthquake had occurred on a summer day, or during the day at a weekend, some beach users could have been caught by the tsunami.
Therefore, even if a moderate earthquake is felt, Setubal beach users should evacuate the water and the sandy beaches to high ground within 40 min of the earthquake because of the danger posed by the tsunami waves.
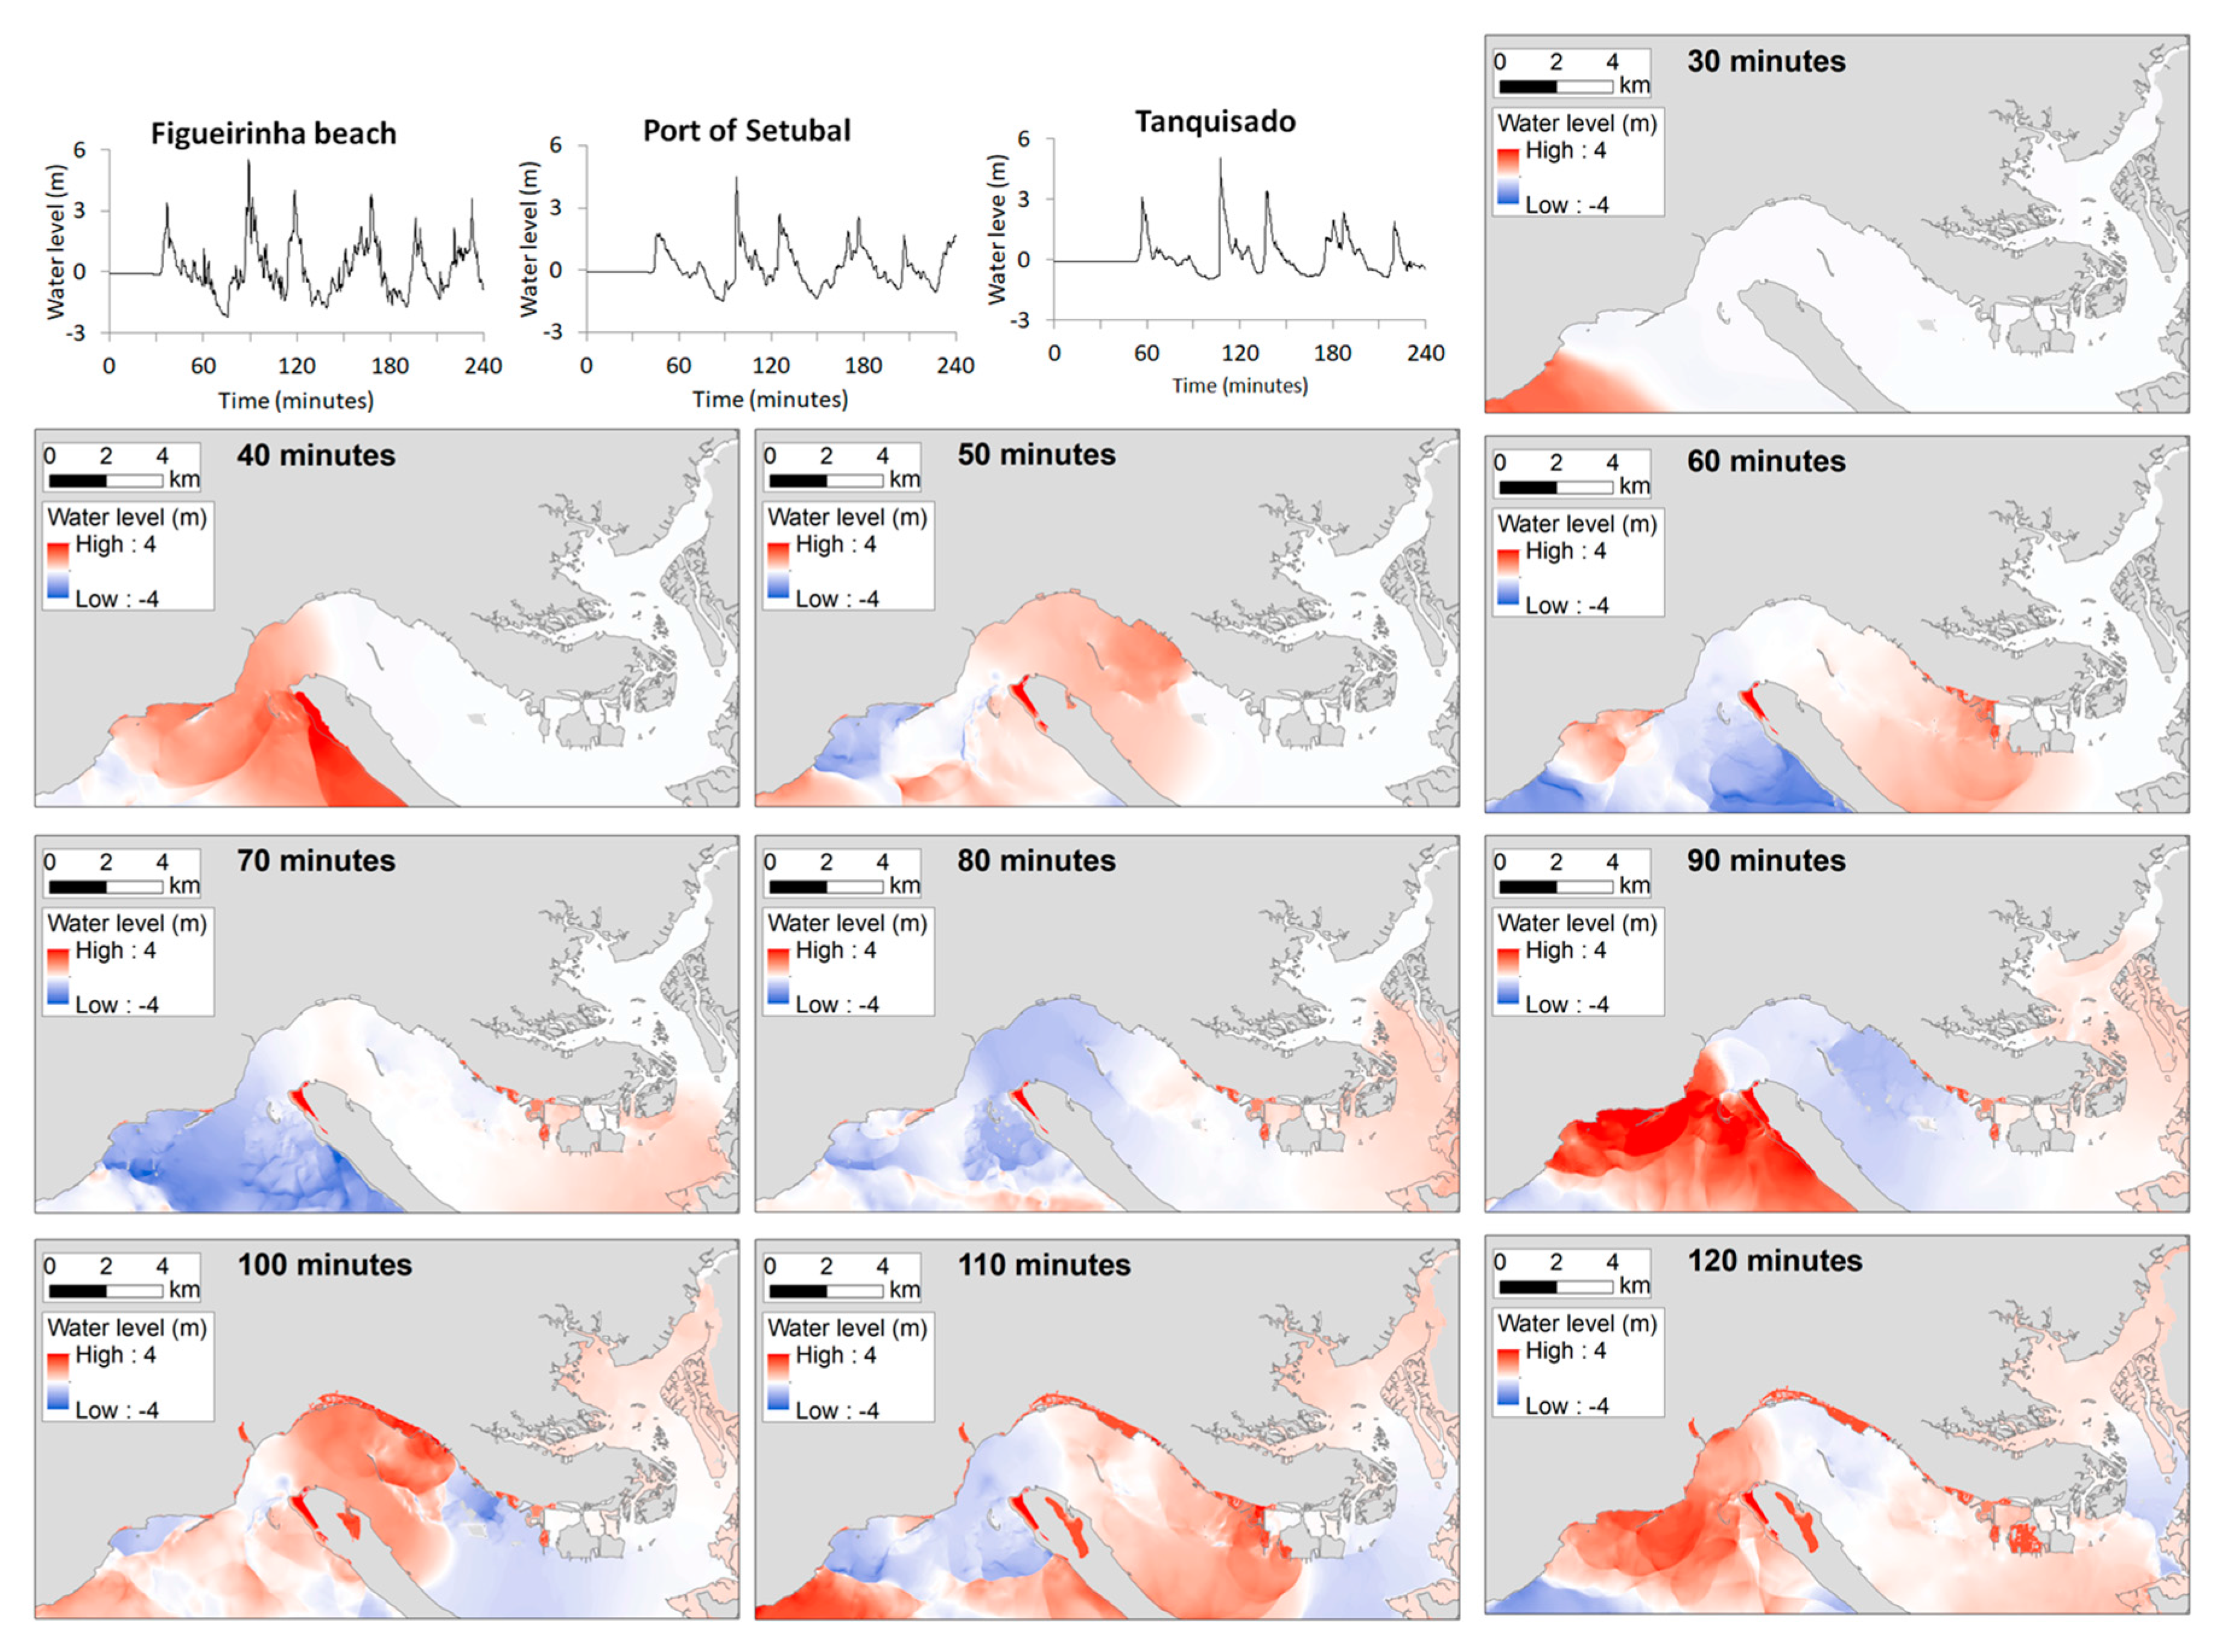
The numerical model of the 1755 tsunami in computational region 5 is represented in Figure 10, Figure 11, Figure 12 and Figure 13. The water level waveforms (Figure 10) show that over the four hours of computation time, there were several waves hitting Setubal, but there were clearly three major waves (over 2.5 m in height) at the port of Setubal. This is supported by witnesses’ accounts, as reported and discussed by [1,39]. In addition, the tsunami water level snapshots show the first tsunami wave arriving at the beaches located on the west of the municipality within 30 min, which was approximately 2.5 m in height. The tsunami continued to propagate up the Sado River reaching the urban area within around 40 min of the earthquake. The second wave was the highest calculated wave, arriving at Setubal municipality within 90 min after the earthquake. This wave was responsible for most of the inundation of the coastal area, reaching approximately 5.8 m in height at Figueirinha beach and at the Tanquisado company (locations of Figure 1). Therefore, for evacuation purposes, coastal communities should be aware that this is the maximum time available for a safe evacuation, whereas the minimum is given by the tsunami travel times, which is the arrival of the first wave. The third wave arrived within two hours of the earthquake; therefore, coastal communities should also be aware that they have to remain on high ground for at least four hours after an earthquake.
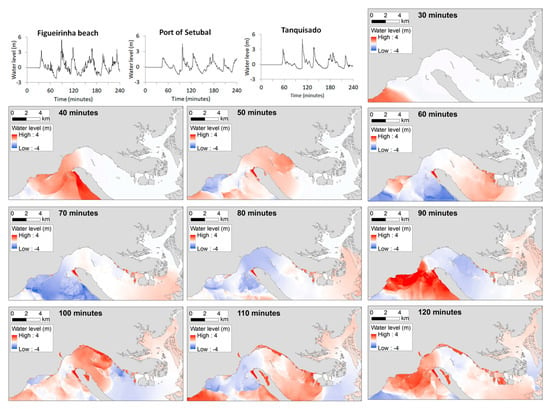
Figure 10.
Water level waveforms and snapshots of the 1755 tsunami.
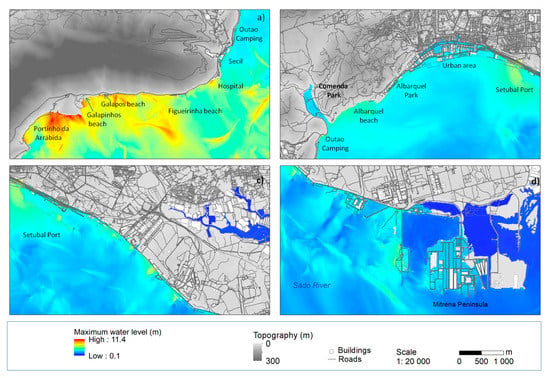
Figure 11.
Maximum water level of the 1755 tsunami: (a) Western area; (b) Central area, including the urban area; (c) Eastern area, including the industrial area; (d) South-east area where the Mitrena Peninsula is located.
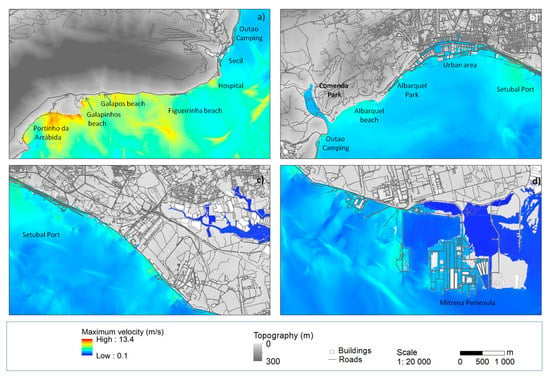
Figure 12.
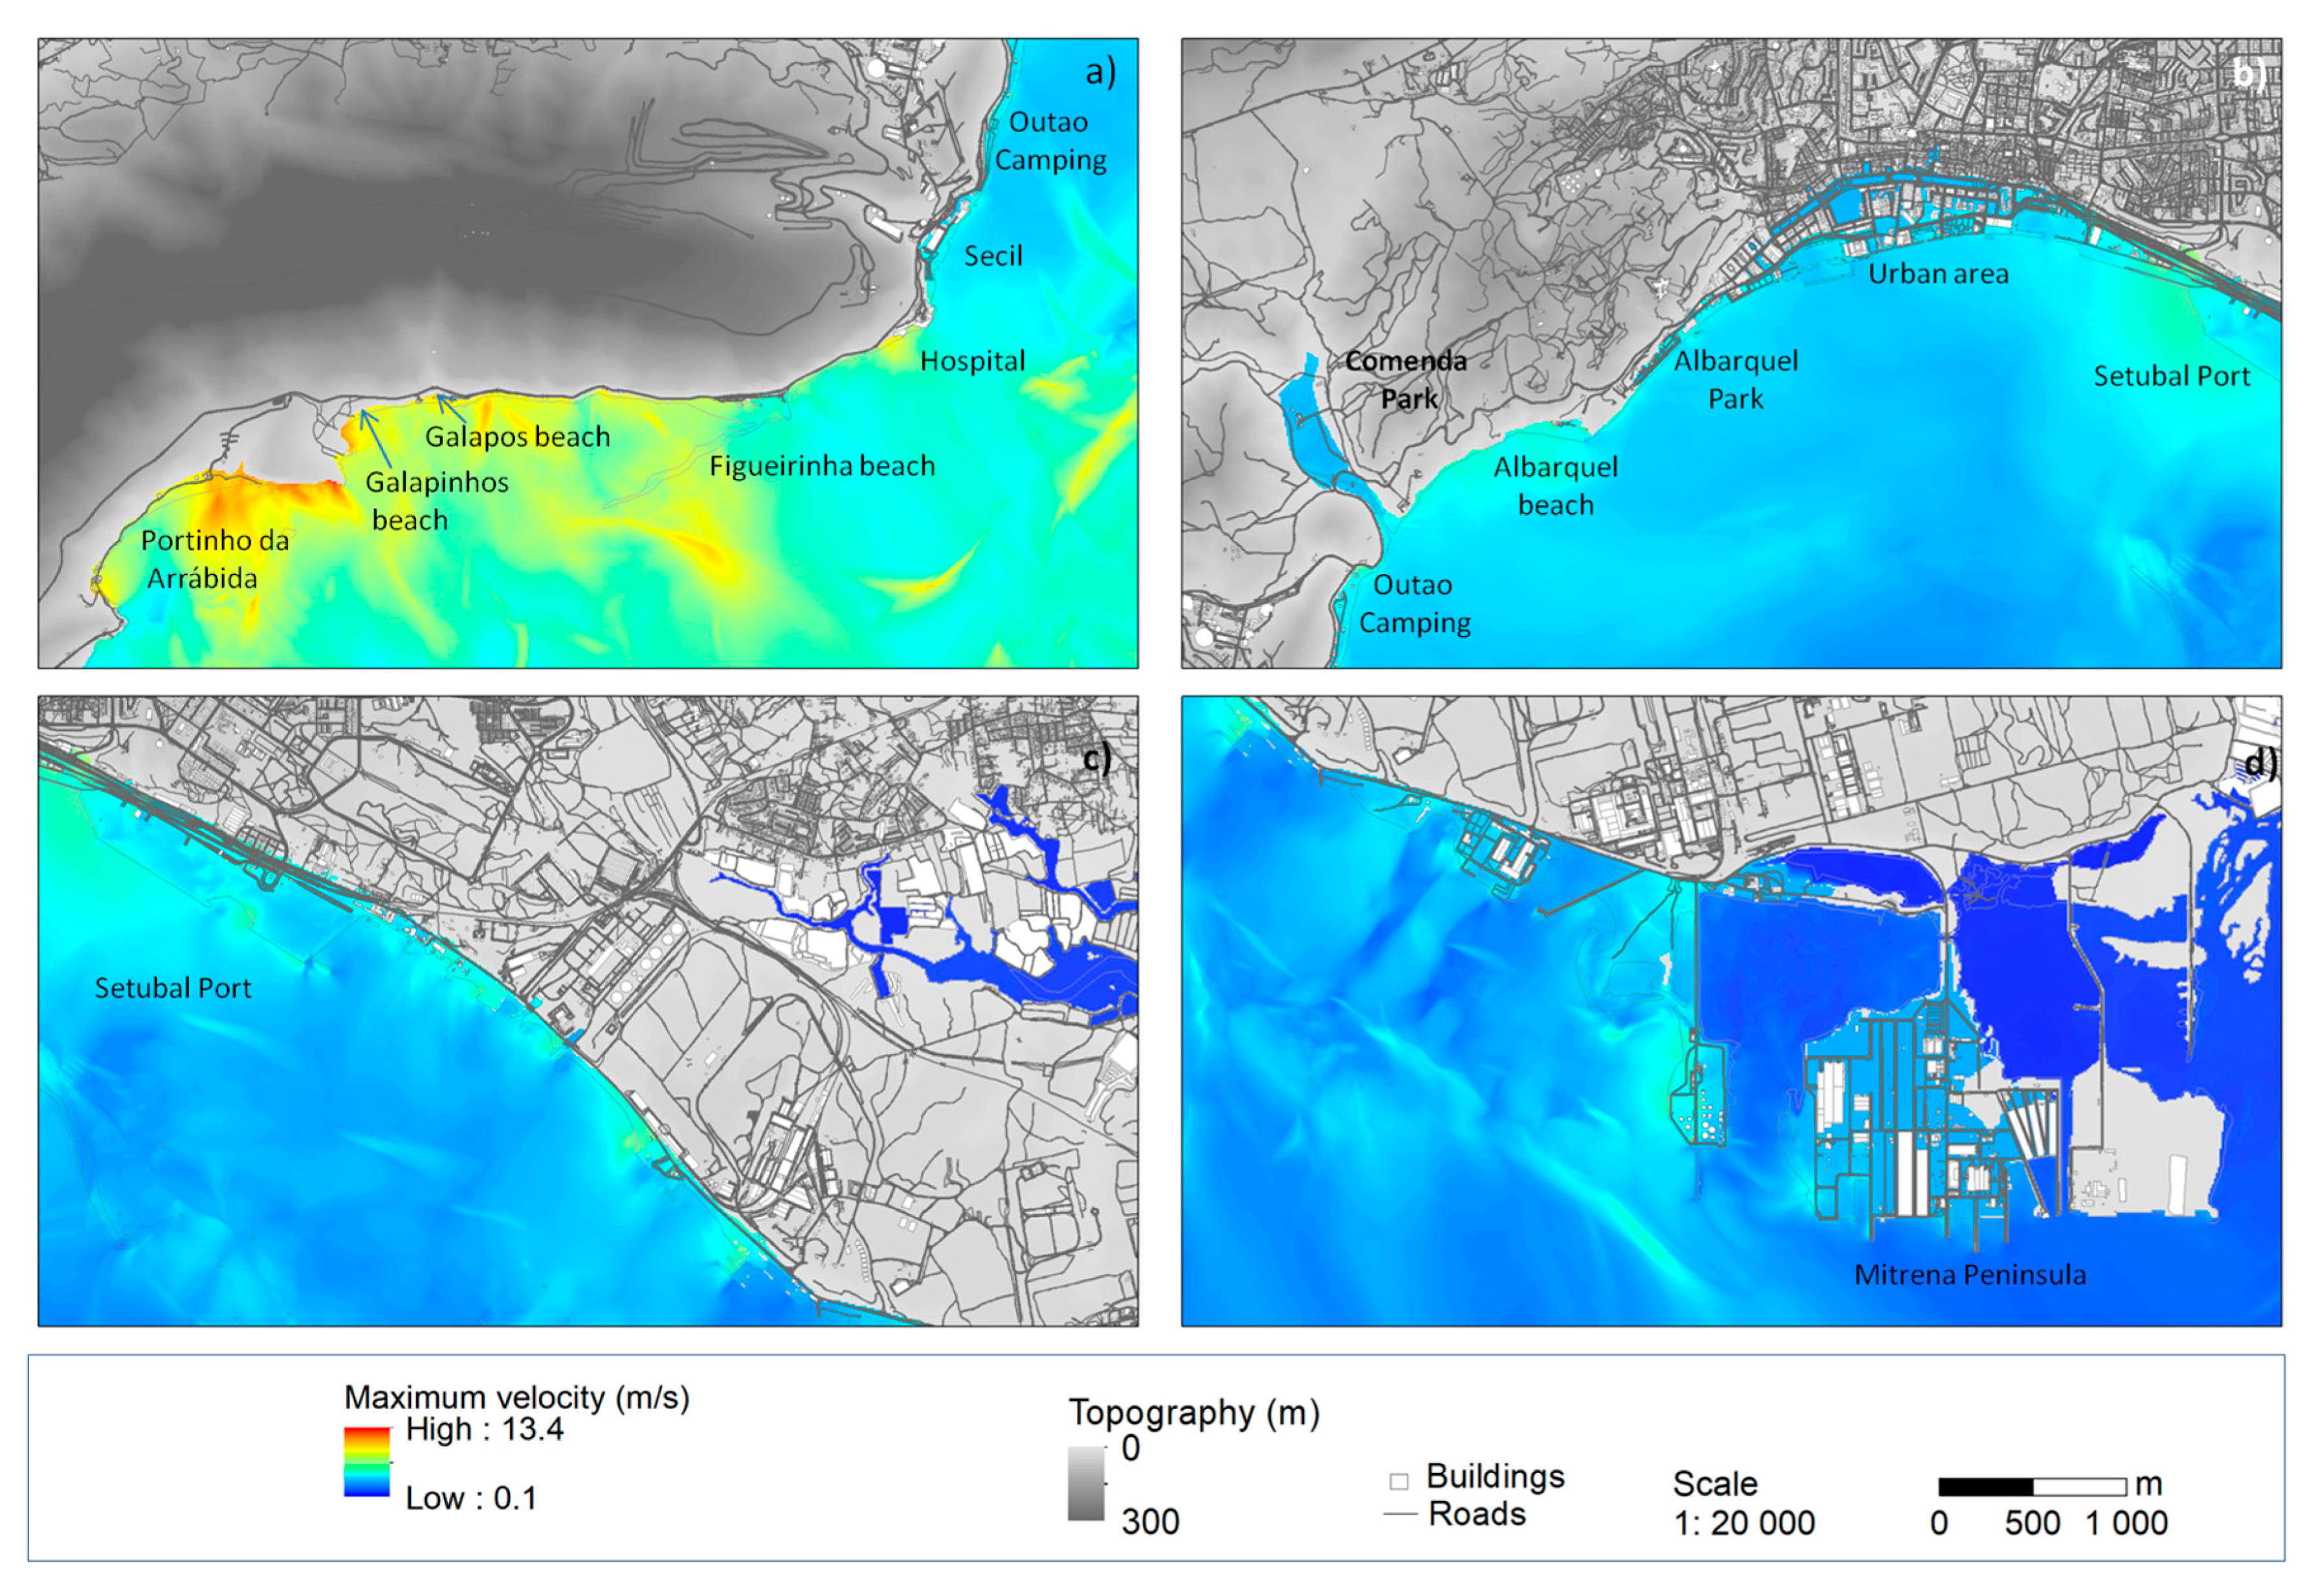
Maximum velocity of the 1755 tsunami: (a) Western area; (b) Central area, including the urban area; (c) Eastern area, including the industrial area; (d) South-east area where the Mitrena Peninsula is located.
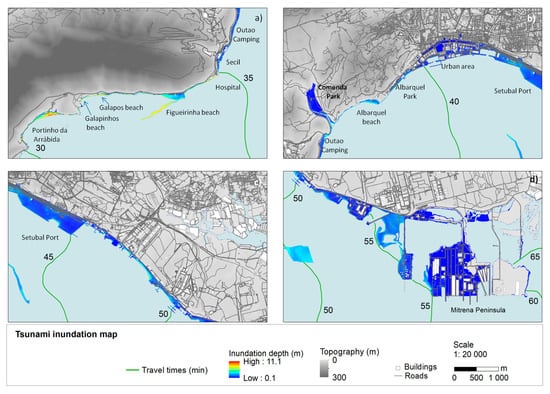
Figure 13.
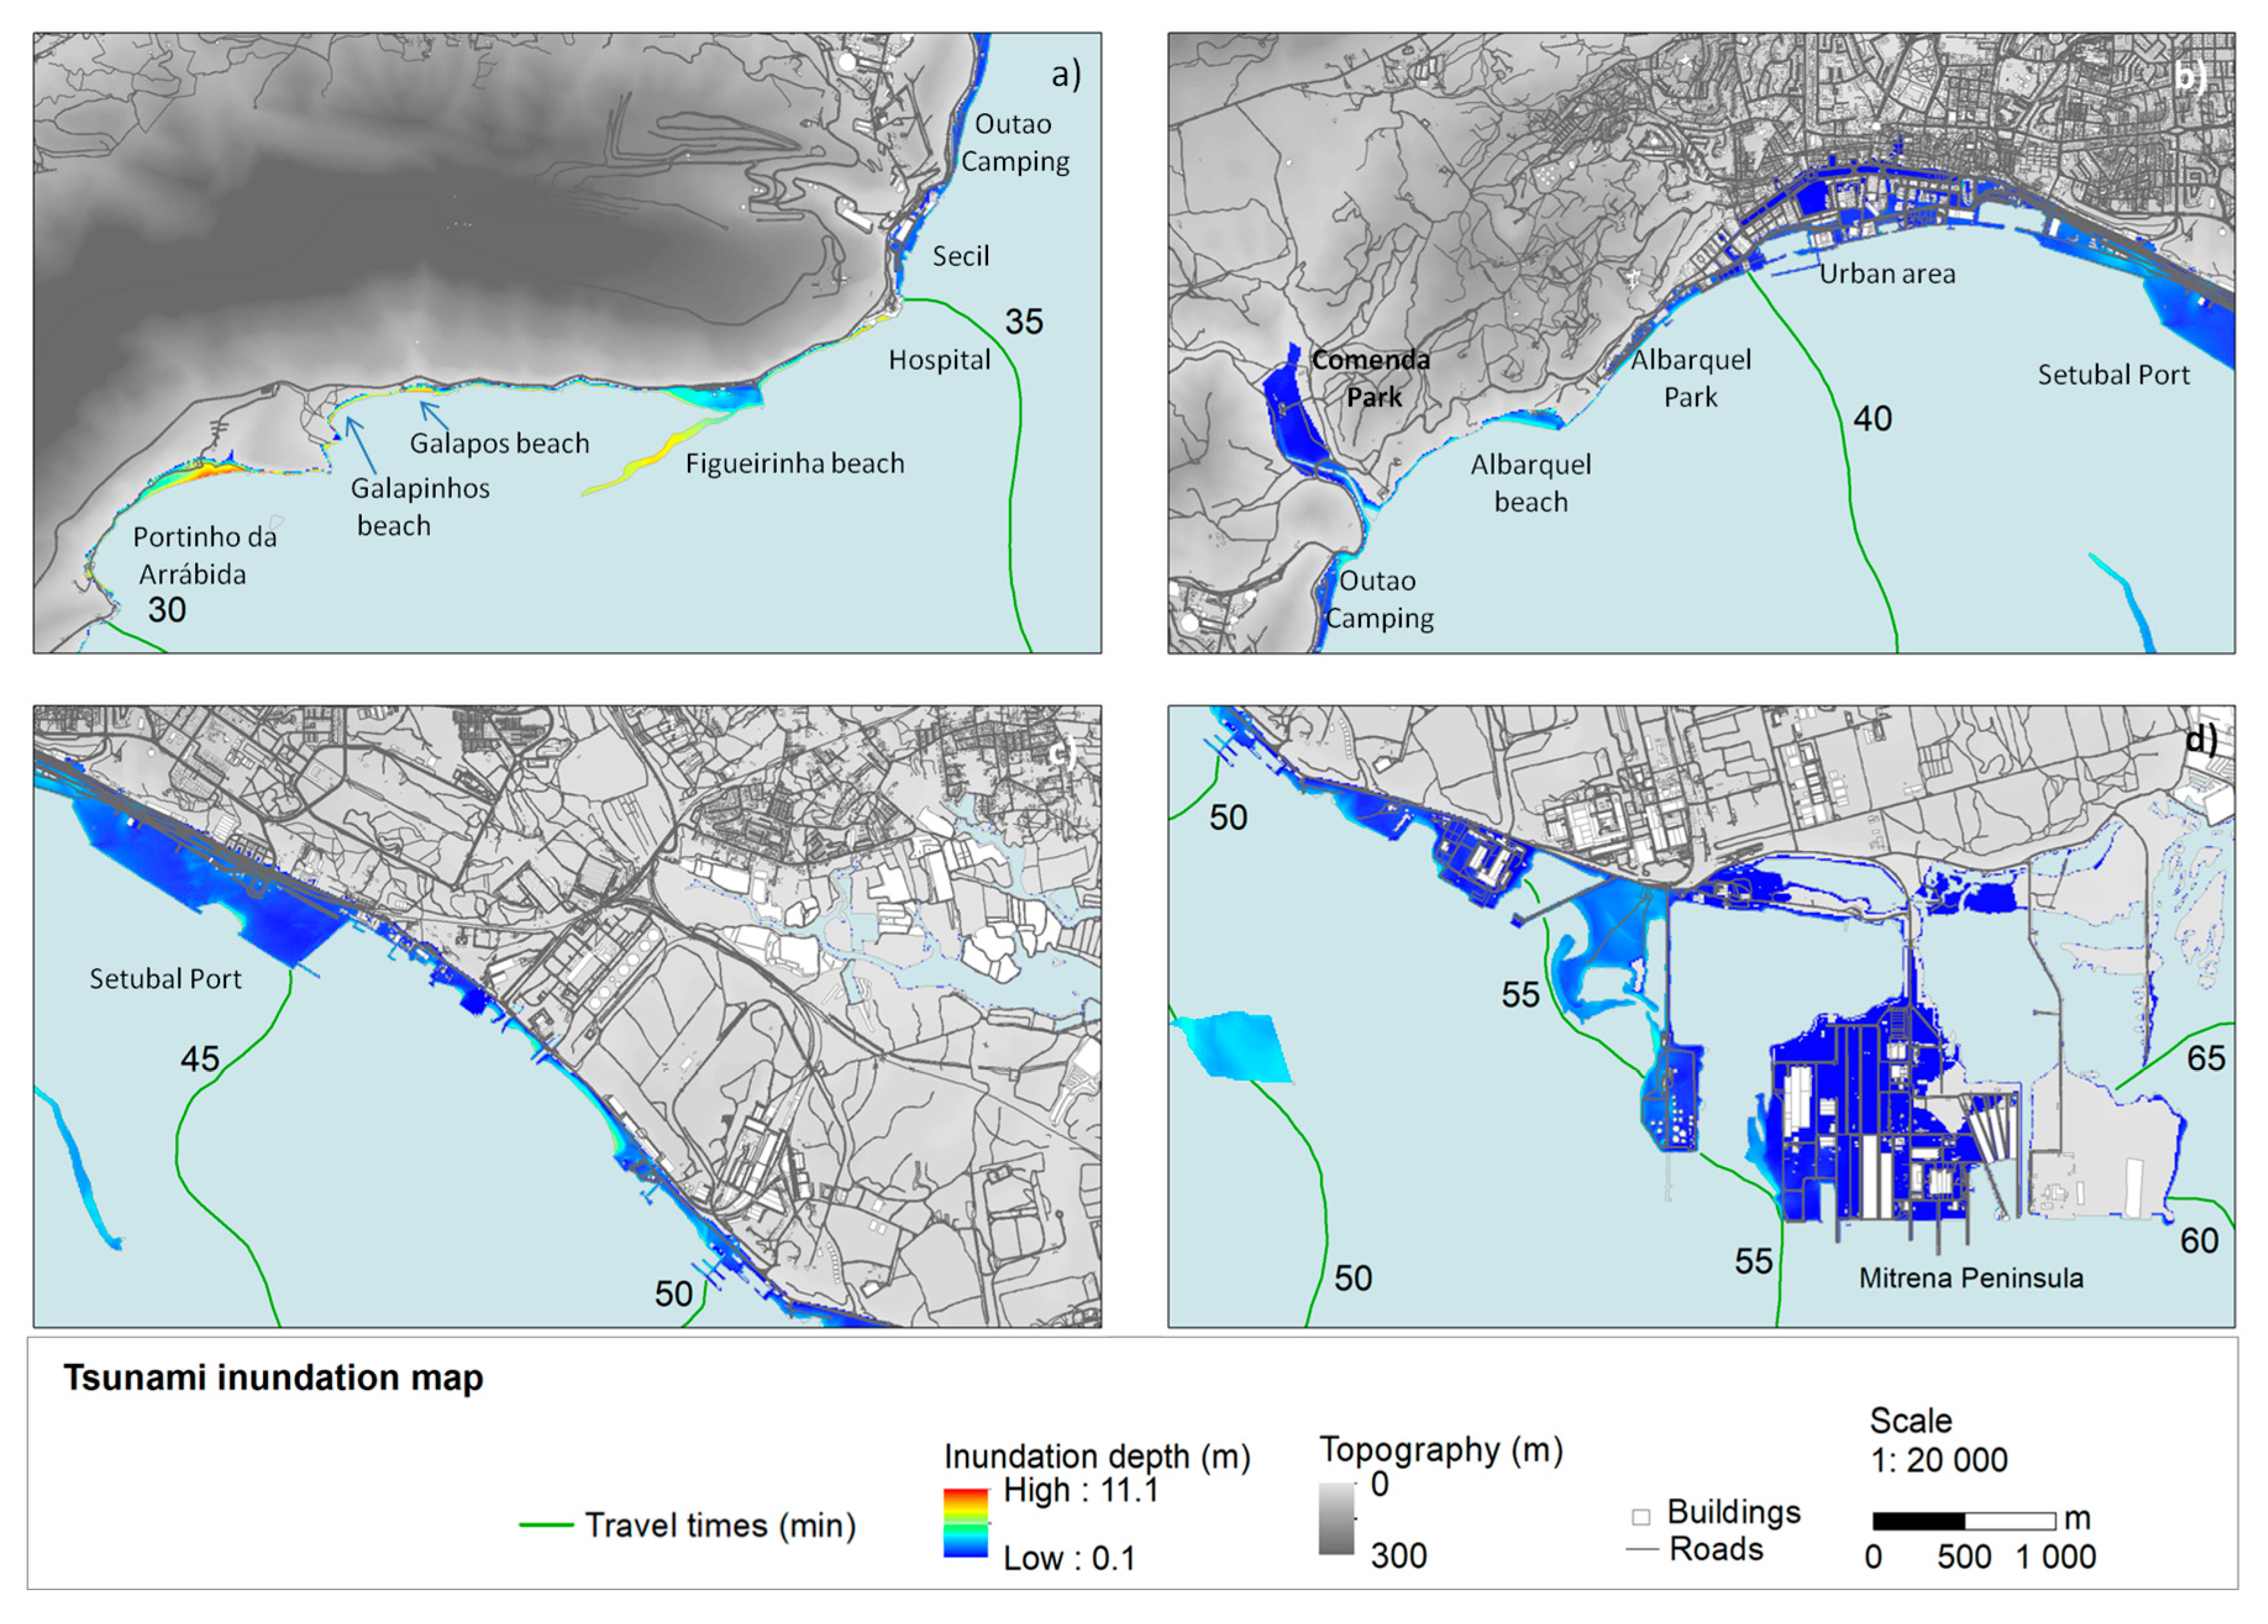
Inundation map due to the 1755 tsunami. Tsunami travel times represent elapsed time since earthquake, in minutes: (a) Western area; (b) Central area, including the urban area; (c) Eastern area, including the industrial area; (d) South-east area where the Mitrena Peninsula is located.
The maximum water level has the highest values in the western part of the municipality, at the beaches, where it varies between 6.4 and 11.4 m (Figure 11), while the absolute maximum of 11.4 m was calculated to be near Portinho da Arrabida. Next, the maximum water level varies between 4.2 and 5.1 m near the Outao Campsite and Comenda Park (Figure 11b), at approximately 5.8 m at the port of Setubal and approximately 3.8 m at the marinas. Further east (Figure 11c), the maximum water level varies between 3.7 and 6.4 m at the various companies’ docks. In the Mitrena Peninsula (Figure 11d), the maximum water level decreases, varying between 0.67 and 5.6 m.
The maximum velocity (Figure 12) shows a similar distribution of values from those obtained with the maximum water level (Figure 11). The highest values are obtained in the western part of the municipality, at the beaches, where it varies between 4.5 and 13.4 m/s. In the centre of Setubal, near the Comenda Park and the marinas, velocities vary between 4.1 and 9.7 m/s; these are still dangerous currents if a person is caught by these tsunami waves. In addition, at the industrial areas located in the eastern part of Setubal municipality, velocities vary significantly from 2.4 to 11.6 m/s. These results show that a tsunami scenario like the 1755 event would be very dangerous for the entire Setubal coastline.
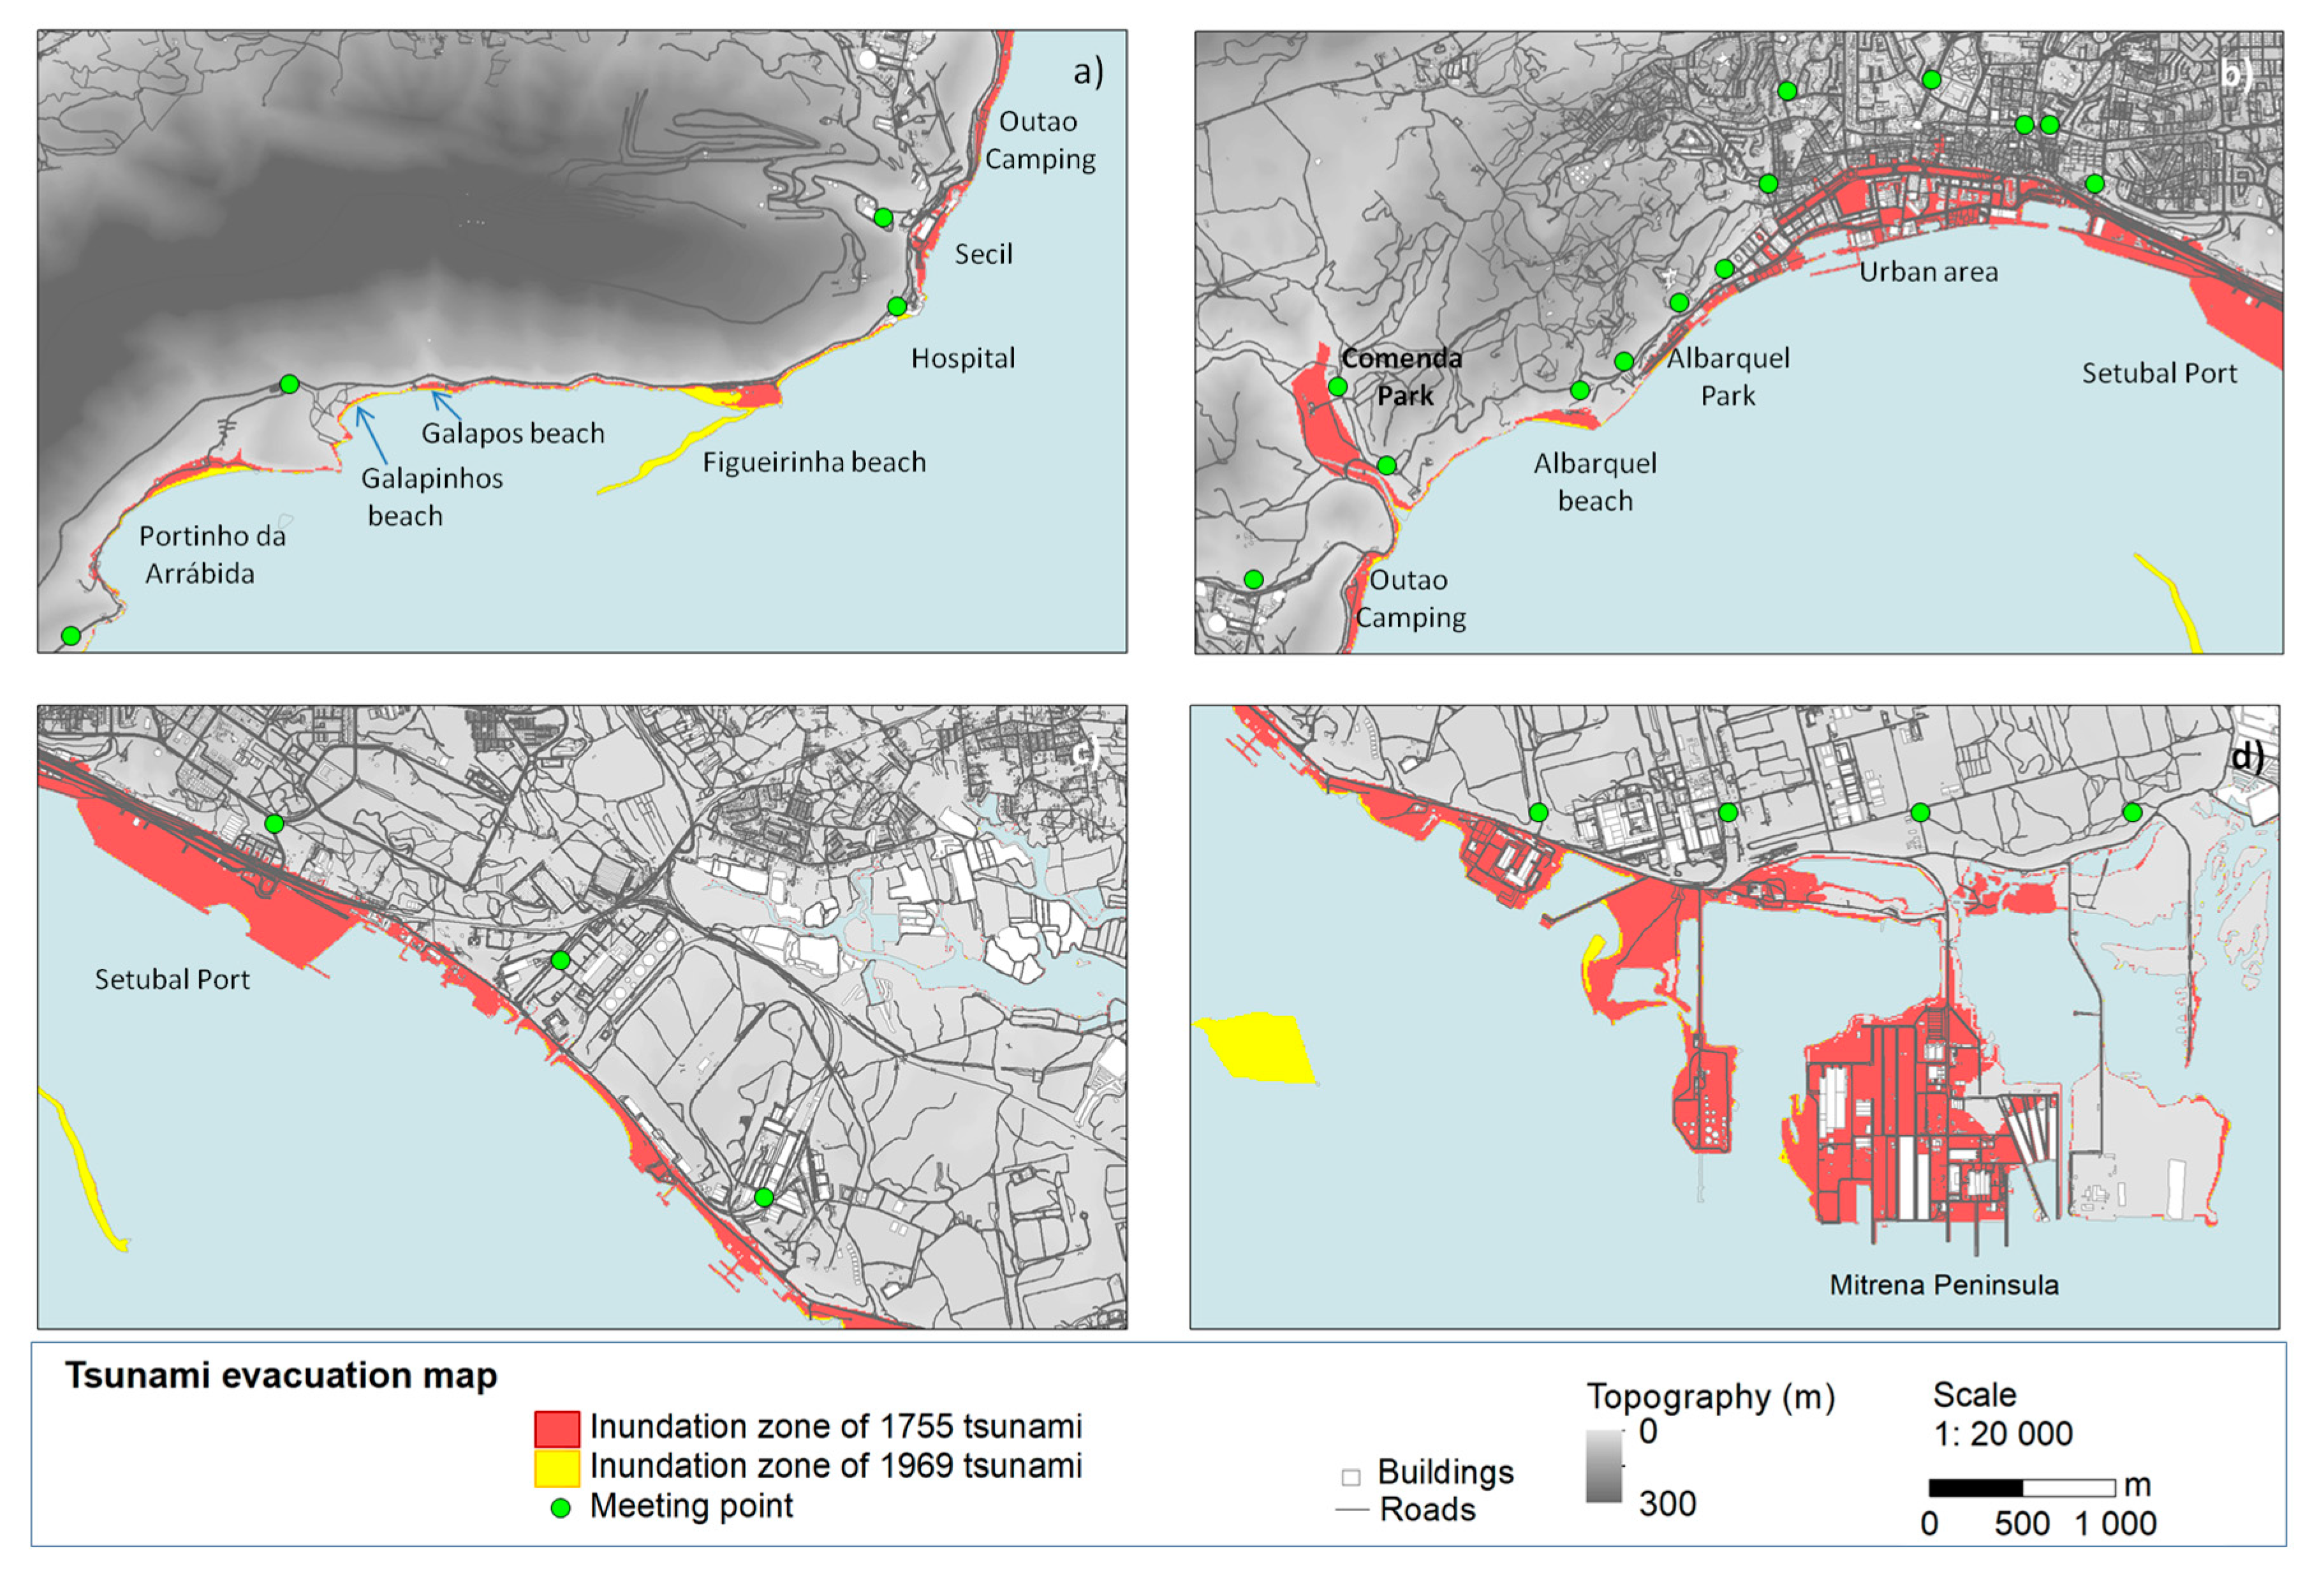
In addition, the inundation depth map of the 1755 tsunami (Figure 13) shows that the total area affected by the tsunami would have been 17.7 km2. All the beaches located in the west of the municipality (Figure 13a) are inundated with an inundation depth of 1.2 m to 9 m. The only industrial plant located in the western part of Setubal is Secil (location on Figure 1). Its ship dock is completely inundated, with an inundation depth of up to 4.1 m. The Outao campsite is completely inundated with inundation depths of 0.57 to 4.4 m. Figure 13b shows that the central part of Setubal is inundated up to 4.9 m, and in general, is approximately 1 m high at Albarquel park, less than 0.5 m in the urban area, and less than 2.0 m at the port of Setubal. In addition, the urban area is inundated to 400 m inland, reaching the streets and buildings downtown. A study focused only on the tsunami vulnerability in the Setubal urban area [52] showed that the 1755 tsunami would potentially affect 481 buildings and 923 residents (equivalent to about 0.8% of the total for the municipality [52]). An author [53] presented new formulas to include damage on the buildings; however, that was not considered in this research. Still, the tsunami vulnerability study [52] showed that there are two buildings in the moderate vulnerability class, 26 in the low vulnerability class, and 453 buildings in the very low vulnerability class. Next, for a stretch of approximately 3 km, the inundated area is approximately 50 m wide and restricted to the road (Figure 13c), which is inundated up to 2 m high. In the southeast area of Setubal, the Mitrena Peninsula (Figure 13d) is almost completely inundated reaching an extension of over 1.2 km. Inundation depth reaches approximately 4 m, but in general, it is 2 m on the left facility and 0.1 m on the right facility. However, the access to these companies’ roads is inundated to approximately 1.5 m high. The inundation of the roads would most likely cause some damage to the roads, so the access to the companies could be compromised. Furthermore, Figure 13 also shows the tsunami travel times which indicate the recommended evacuation times for coastal communities. These are 30 min at the beaches, 40 min in the urban areas, and at least 45 min in the eastern area, where the industries are located.
The comparison between the 1969 and the 1755 scenarios shows that the first tsunami wave arrived in Setubal within approximately 40 min of the earthquake in the first case, and within 30 min in the second. Thus, the 1755 tsunami allowed a shorter evacuation time for the coastal communities. In addition, the 1969 tsunami only inundated the beaches located on the west coast of Setubal, while in 1755, it inundated all the low-lying areas, including the Mitrena Peninsula, which is located in the eastern part of Setubal. Therefore, the 1755 tsunami produced larger inundation zones.
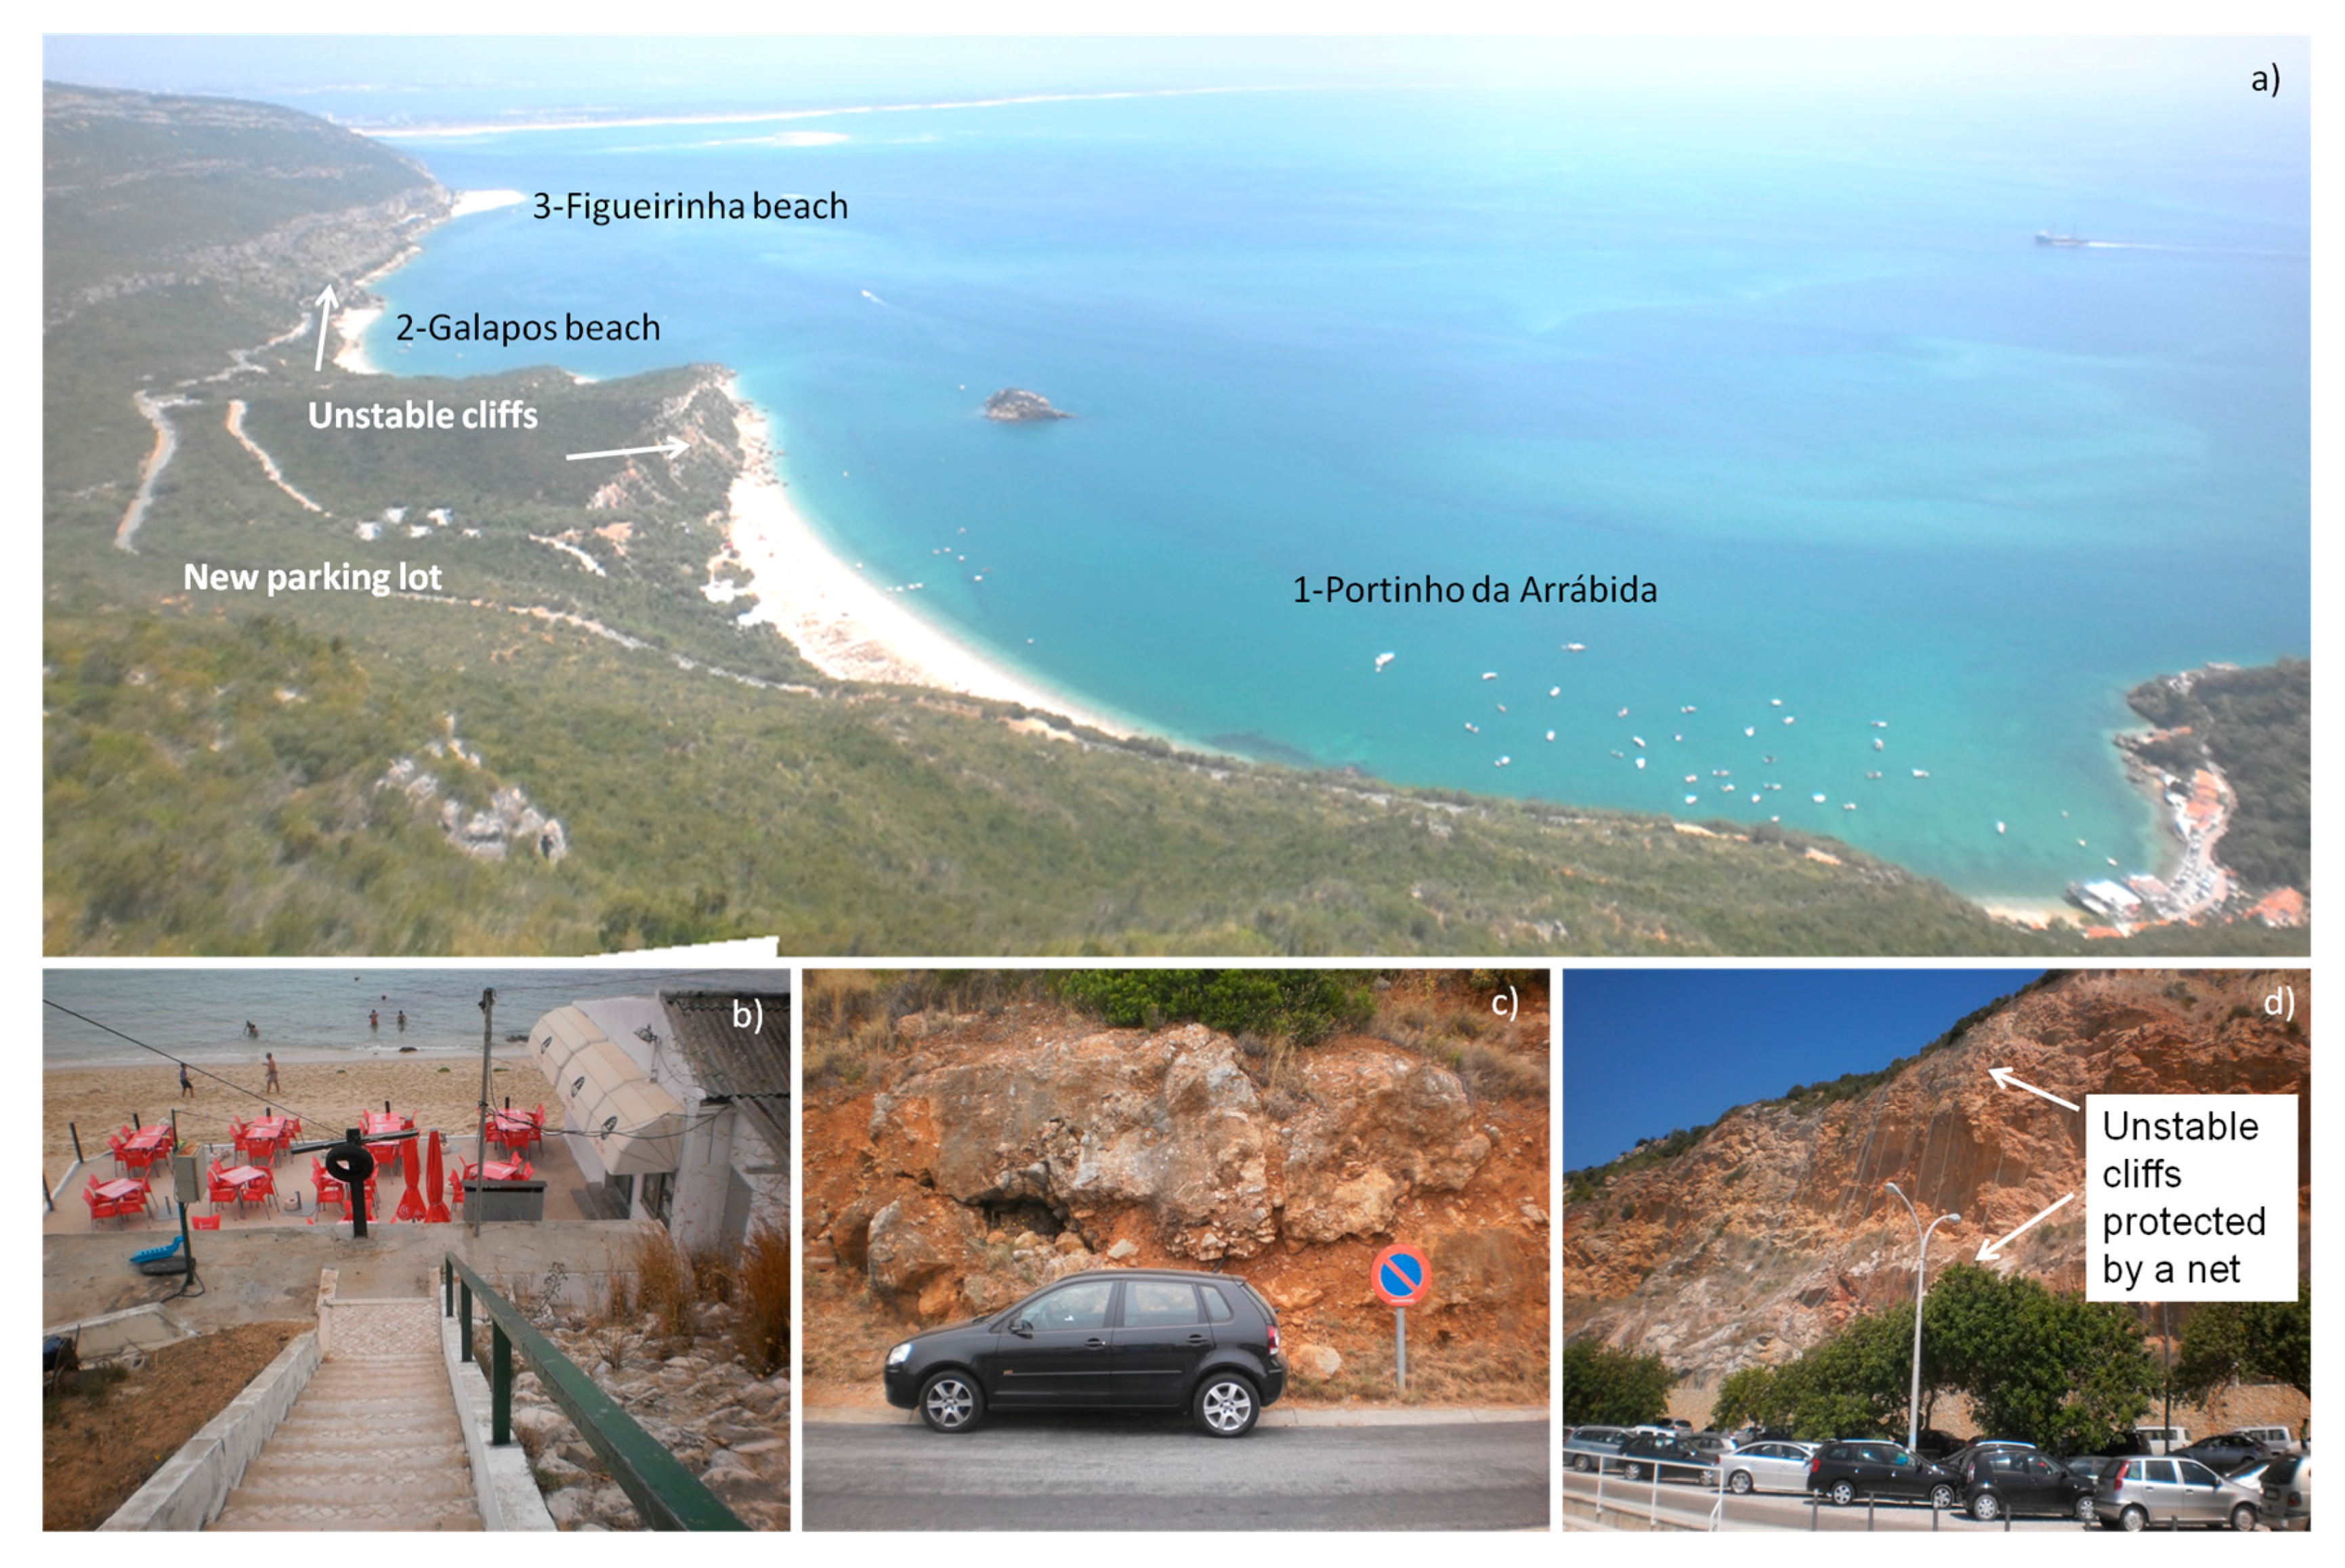
For these reasons, an assessment was conducted on the coastline. It showed that there is high ground near the coastline, outside the inundation zones. The easy access to safe and wide areas allows people to reach high ground in less than 5–10 min in almost the whole municipality. However, the coastline poses some challenges that, if not addressed, could render safe evacuation almost impossible. The beaches are located in the western part of Setubal (location on Figure 1) and are very popular, especially during the summer. Nevertheless, the significant number of beach users represents a challenge if an emergency evacuation becomes necessary. Figure 14b shows the narrow beach access which could be an obstacle to evacuating a crowded beach in less than 30 min. In addition, there are unstable cliffs near the beaches. If a large earthquake occurs, rock falls could be generated, obstructing the roads. Although a new parking lot was created in a safe area, people continue to leave their cars in forbidden locations (Figure 14c). In order to control this problem, several nets have been installed (Figure 14d). Still, on 31 August 2017, a minor rock fall occurred at the south edge of Albarquel park [54,55]. Although there was no damage or casualties, this shows that the cliffs must be permanently monitored and under surveillance. Therefore, the meeting points on the west coast of Setubal were selected so as to be located at the new parking lot, at the hospital’s parking lot, and on a wide road near the Secil company (Figure 15a).
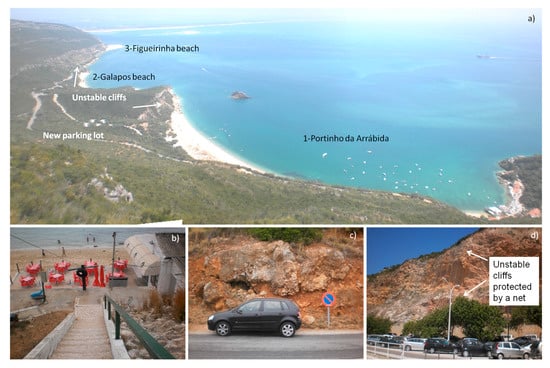
Figure 14.
West part of Setubal: (a) Location of the main beaches; (b) Access to Galapos beach; (c) Road nearby Galapos beach; (d) Parking lot of Figueirinha beach.
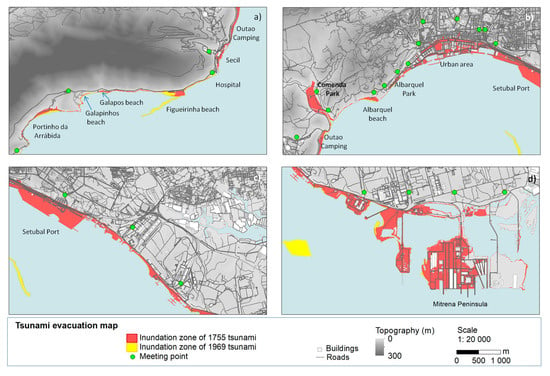
Figure 15.
Tsunami evacuation map: (a) Western area; (b) Central area, including the urban area; (c) Eastern area, including the industrial area; (d) South-east area where the Mitrena Peninsula is located.
In the central part of Setubal, people could reach the meeting points, located outside the inundation zone, in around 10 min (Figure 15b). Since the first tsunami wave would arrive within 35–40 min of the earthquake, there would be enough time for people to evacuate safely and in an organized manner. Still, there is some concern related to the conditions of the buildings in the urban area after the earthquake. Since it is an historic area, with many old buildings that may collapse if there is a large earthquake (as reported by several guidelines, e.g., [56]), there could be damage to the buildings themselves as well as obstruction of the narrow streets. For this reason, most of the evacuation paths in the urban area were selected so that people could use wider and more modern streets. In order to address this situation, the SMPCB and Spatial Planning Agents are now planning to demolish unoccupied buildings that are located in the historic urban area and which are not structurally safe against earthquakes and fires. In addition to residential buildings, there are several buildings related to emergency services, such as a fire station, a police station, and the port administration facilities. For this reason, there are plans underway to relocate these facilities to safer areas.
In the eastern part of Setubal, the inundation zone included only the ship docks/ports of the industrial companies, with the main facilities located on high ground outside the inundation area (Figure 15c,d). In addition, the existence of high ground near the facilities shows that workers would reach high ground less than 5 min after the earthquake. Thus, if there is no damage due to the earthquake, the evacuation would go smoothly. However, the main concern is at the Tanquisado company because the entire facility could be inundated. Workers should evacuate in less than 55–60 min after the earthquake (Figure 13d) and before the arrival of the first tsunami wave. Since the facility is located more than 1 km from the nearest safe high ground, workers would take approximately 20 min to go that far. In addition, there is only one access road, which could be inundated with an inundation depth of 1–2 m. While during the 2012 drill [11] alternative roads were tested to reach the affected companies, at Tanquisado this is not an option. Furthermore, this facility is a potential hazard for explosions and fires of toxic materials, even without the occurrence of a large earthquake. An incident that caused concern occurred in the early hours of 14 February 2017: there was a sulphur explosion and fire at the Sapec Agriculture company (facility B in Figure 1). The fire itself was confined to one building, validating the previously evaluated scenarios [10,11], and for this reason, the Emergency Plan was activated and successfully implemented to extinguish the fire. However, the fire generated a toxic plume that extended to a distance of approximately 50 km northward, resulting in a recorded value of 400 μg/m3 of SO2 at 11 a.m. at the Alverca Air Quality Station [57]. Then, the wind direction shifted southward and the toxic plume headed towards the Atlantic Ocean. Thus, in this particular event, the Setubal urban area was not directly hit by the toxic plume, and neither were other major cities like Almada, Lisbon, and Amadora. However, it took the SMPCB three days to extinguish the fire. As a precaution, all schools and public buildings were closed, and residents were advised to stay indoors and to wear masks. In spite of the fire, the affected company never stopped production, since the incident occurred in a storage building. After the 2017 incident, the SMPCB issued guidelines to improve the safe storage of dangerous materials like sulphur. Still, it would be expected that the Setubal population (over 120,000) might be affected by a toxic fire plume due to the wind direction. Thus, all the population should stay indoors, if buildings do not collapse because of the earthquake.
Furthermore, after the drill at Albarquel park [8,9], the SMPCB installed permanent tsunami evacuation signs in the park (Figure 16). Although there is no general consensus regarding the use and installation of tsunami signs, this research follows the guidelines of the ITIC [51]. The tsunami evacuation map provides a variety of information to the public, including the location of tsunami safe areas and how to reach them. It also includes direct outputs of the tsunami numerical model, like the inundation zone, inundation depth, and water level waveforms. In addition, the implementation of tsunami evacuation maps allowed tsunami risk areas to be identified, making the coastline safer for coastal communities. Also, after the 2012 and 2016 drills, there was an increase in information and training on natural hazards for the staff of the industries, including workers and their supervisors, as well as first responders. Education and awareness of the tsunami risk in Setubal will allow future disasters to be mitigated, which in turn, will lead to more resilient communities. For this reason, a new earthquake and tsunami drill is being prepared for November 2017 in the urban area.
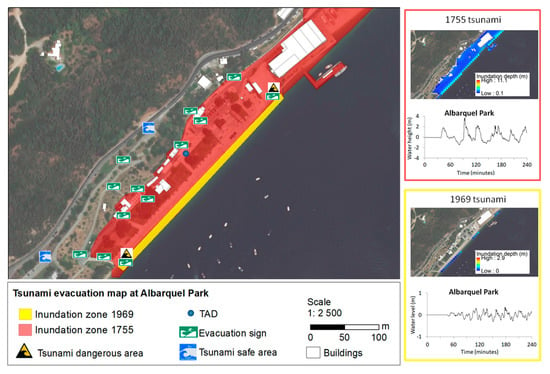
Figure 16.
Details of the tsunami evacuation map at Albarquel park.
4. Conclusions
Seismicity off the southern coast of mainland Portugal is moderate, with earthquake magnitudes under 6.0. However, there have been six earthquakes in the past with a magnitude higher than M 6.0. Among them, there were two earthquakes that triggered tsunamis and hit Setubal: the 1755 and 1969 earthquakes, which were considered large and moderate events in the Setubal municipality. Thus, tsunami numerical modelling of these two events was carried out at the local scale, in order to calculate tsunami inundation in Setubal. Although records related to the 1969 tsunami were not found in Setubal, the numerical modelling results show that the first wave arrived within 40 min after the earthquake to the west of the municipality. The tsunami inundated the beaches up to 2.4 m. However, the velocity off Figueirinha beach was approximately 11 m/s, which is very dangerous if beach users do not leave the water. On the other hand, the 1755 tsunami arrived within 30 min of the earthquake, inundating the low-lying areas of the entire Setubal coastline. The inundation depth was up to 9 m at the beaches, 4.9 m downtown, and 4.0 m in the industrial area. In addition, the tsunami velocity was over 10 m/s near the beaches and approximately 5m/s on the Sado River. These are very dangerous values for the entire coast.
Although there is high ground near the coastlines, several challenges were observed. Still, the meeting points were selected so as to be located on high ground, outside of the inundation zones of both tsunami scenarios. In the west, the beaches have narrow accesses that may hinder a safe evacuation (within 30 min of the earthquake) if the beaches are very crowded. The urban area is mostly made up of historic buildings and narrow streets. Although wider and more modern streets were selected as evacuation routes, buildings that collapse due to a large earthquake may also be obstacles to safe evacuation within 90 min of the earthquake. In order to overcome this situation, there are plans to gradually demolish unoccupied old buildings. In the industrial areas, the main concern is not related to the tsunami, since most of the facilities are located on high ground outside the inundation zone. The main problem would be related to materials that can cause explosions, fires, and toxic smoke plumes. After the 2017 sulphur fire, the SMPCB issued guidelines to improve safety in the industrial area. Nevertheless, there is one facility that would be completely inundated by the tsunami and which workers should evacuate within 55–60 min of the earthquake. Moreover, this facility only has one road access and it would also be inundated, so there would be no access to this facility if a tsunami occurred. The tsunami evacuation maps obtained in this research will be disseminated to the coastal communities in order to raise awareness about tsunamis and to increase resilience to these types of disasters.
Acknowledgments
The authors would like to thank the comments and suggestions of the academic editor and reviewers that contributed to the improvement of the paper.
Author Contributions
A.S. carried out the numerical model of the 1755 tsunami and the field surveys; N.F. compiled data related to the industrial companies; J.L.B. was the coordinator of the drills and installation of safety equipment; A.S. and N.F. made the figures. All authors contributed with references and to the overall structure of the paper. A.S. wrote the paper, which was discussed and reviewed by all the other authors.
Conflicts of Interest
The authors declare no conflict of interest.
References
- Santos, A.; Koshimura, S. The Historical Review of the 1755 Lisbon Tsunami. J. Geodesy Geomat. Eng. 2015, 1, 38–52. [Google Scholar] [CrossRef]
- Institute of Conservation of Nature and Forests. Available online: http://www.icnf.pt/portal/ap (accessed on 8 September 2017).
- Zezere, J.L.; Neves, M.; Reis, E.; Fonseca, N.; Pereira, S.; Santos, A. Delimitation of the National Ecological Reserve, Version 2; IGOT, Lisbon University: Lisboa, Portugal, 2012; p. 69. (In Portuguese) [Google Scholar]
- Zezere, J.L.; Neves, M.; Reis, E.; Fonseca, N.; Pereira, S.; Santos, A.; Lopes, A.; Correia, E. Evaluation and Cartography of the Natural, Mix and Technological Risk at Setubal Municipality; IGOT, Lisbon University: Lisboa, Portugal, 2012; p. 129. (In Portuguese) [Google Scholar]
- Fonseca, A.; Zezere, J.L.; Nves, M. Contribution to the knowledge of the geomorphology of the Arrabida chain (Portugal): Geomorphological mapping and geomorphometry. Rev. Bras. Geomorfol. 2015, 16, 137–163. [Google Scholar]
- Statistics Portugal. Census 2011. Available online: https://www.ine.pt/xportal/xmain?xpgid=ine_main&xpid=INE (accessed on 8 September 2017).
- Setubal City Hall. Municipal Plan Intervention on the Historical Center; Setubal City Hall: Setubal, Portugal, 2010. (In Portuguese)
- Parrulas, J.; Tome, M.; Santos, A. Municipal Emergency Plan—Drill to Evacuate Population at the Albarquel Park—Operational Guide; Setubal City Hall and SMPCB: Setubal, Portugal, 2017; p. 20. (In Portuguese)
- Santos, A.; Bucho, J.L.; Queirós, M. World tsunami awareness day at Setubal. In Proceedings of the International Conference Risks, Security and Citizenship, Setubal, Portugal, 30–31 March 2017; pp. 111–117. [Google Scholar]
- Caramelo, A.; Cornaglia, G.; Bucho, J.; Macedo, M.; Isabel, S.; Pires, P.; Sacadura, P. Risk Chart of the Mitrena Peninsula National; Authority of Civil Protection and the SMPCB: Carnaxide, Portugal, 2011; p. 94. (In Portuguese)
- SMPCB. MITREX Exercise; Setubal City Hall: Setubal, Portugal, 2012; p. 487. (In Portuguese)
- Santos, A.; Tavares, A.O.; Queirós, M. Numerical modelling and evacuation strategies for tsunami awareness: Lessons from the 2012 Haida Gwaii Tsunami. Geomat. Nat. Hazards Risk 2016, 7, 1442–1459. [Google Scholar] [CrossRef]
- Santos, A.; Queirós, M.; Carvalho, L. Fire and seismic risk perception at Lisbon University—Faculty of Letters. Territorium 2017, 27, 15–27. [Google Scholar] [CrossRef]
- Santos, A.; Queirós, M.; Montecchiari, G. Evacuation exercises and simulations toward improving safety at public buildings. In From Science to Society, Progress in IS; Benoît Otjacques, B., Hitzelberger, P., Naumann, S., Wohlgemuth, V., Eds.; Springer International Publishing AG: Cham, Switzerland, 2018; pp. 25–35. [Google Scholar]
- Carvalho, L.; Freitas, A.; Rocha, C.; Farinha, A. The importance of awareness regarding seismic risk reduction in the municipality of Amadora. In The 1755 Lisbon Earthquake: What Have We Learned; Imprensa da Universidade de Coimbra: Coimbra, Portugal, 2015; pp. 77–96. (In Portuguese) [Google Scholar]
- Committee on the Review of the Tsunami Warning and Forecast System and Overview of the Nation’s Tsunami Preparedness; Ocean Studies Board; Division on Earth and Life Studies. Tsunami Warning and Preparedness: An Assessment of the U.S. Tsunami Program and the Nation’s Preparedness Efforts; The National Academies Press: Washington, DC, USA, 2011; p. 297. [Google Scholar]
- International Olympic Committee (IOC). Tsunami Risk Assessment and Mitigation for the Indian Ocean; Knowing Your Tsunami Risk—And What to Do about It, IOC Manuals and Guides, No. 52; United Nations Educational, Scientific and Cultural Organization (UNESCO): Paris, France, 2015; p. 162. [Google Scholar]
- Taubenböck, H.; Goseberg, N.; Setiadi, N.; Lammel, G.; Moder, F.; Oczipka, M.; Klupfel, H.; Wahl, R.; Schlurmann, T.; Strunz, G.; et al. “Last-Mile” preparation for a potential disaster—Interdisciplinary approach towards tsunami early warning and an evacuation information system for the coastal city of Padang, Indonesia. Nat. Hazards Earth Syst. Sci. 2009, 9, 1509–1528. [Google Scholar] [CrossRef]
- Cankaya, Z.C.; Suzen, M.L.; Yalciner, A.C.; Kolat, C.; Andrey Zaytsev, A.; Aytore, B. A new GIS-based tsunami risk evaluation: MeTHuVA (METU tsunami human vulnerability assessment) at Yenikapı, Istanbul. Earth Planets Space 2016, 68, 22. [Google Scholar] [CrossRef]
- United Nations International Strategy for Disaster Reduction UNISDR. Sendai Framework for Disaster Risk Reduction 2015–2030; UNISDR: Geneva, Switzerland, 2015; p. 32. [Google Scholar]
- Matias, L.M.; Cunha, T.; Annunziato, A.; Baptista, M.A.; Carrilho, F. Tsunamigenic earthquakes in the Gulf of Cadiz: Fault model and recurrence. Nat. Hazards Earth Syst. Sci. 2013, 13, 1–13. [Google Scholar] [CrossRef]
- Ansal, A.; Akinci, A.; Cultrera, G.; Erdik, M.; Pessina, V.; Tonuk, G.; Ameri, G. Loss estimation in Istanbul based on deterministic earthquake scenarios of the Marmara Sea region (Turkey). Soil Dyn. Earthq. Eng. 2009, 69, 699–709. [Google Scholar] [CrossRef]
- Poljanšek, K.; Marin Ferrer, M.; De Groeve, T.; Clark, I. Science for Disaster Risk Management 2017: Knowing Better and Losing Less; EUR 28034 EN; Publications Office of the European Union: Luxembourg, 2017; p. 554. [Google Scholar]
- Santos, A. Tsunami Hazard Assessment in Portugal by the Worst Case Scenario: The November 1st, 1755 Lisbon Tsunami. Ph.D. Thesis, Tohoku University, Miyagi Prefecture, Japan, 2008; p. 210. [Google Scholar]
- Fonseca, J.; Vilanova, S. The April 23 1909 Benavente (Portugal) M 6.3 Earthquake. Seismol. Res. Lett. 2010, 81, 534–536. [Google Scholar] [CrossRef]
- Santos, A. Modeling the Tsunami Run-up Generated by the 1722 Earthquake in Tavira. Ph.D. Thesis, Lisbon University, Lisboa, Portugal, 2001; p. 44. (In Portuguese). [Google Scholar]
- Sa, L.; Pires, P.; Henriques, P.; Telhado, M.J. Contributions to the development of a national simulator for seismic risk. In The 1755 Lisbon Earthquake: What Have We Learned; Imprensa da Universidade de Coimbra: Coimbra, Portugal, 2015; pp. 174–180. (In Portuguese) [Google Scholar]
- Grandin, R.; Borges, J.F.; Bezzeghoud, M.; Caldeira, B.; Carrilho, F. Simulations of strong ground motion in SW Iberia for the 1969 February 28 (Ms = 8.0) and the 1755 November 1 (Ms = 8.5) earthquakes—II. Strong ground motion simulations. Geophys. J. Int. 2007, 171, 807–822. [Google Scholar] [CrossRef]
- Martins, I.; Victor, L. Contribution for the Study of Seismicity in Portugal Mainland; Instituto Nacional de Meteorologia e Geofísica: Lisbon, Portugal, 1990; p. 65.
- Suppasri, A.; Leelawat, N.; Latcharote, P.; Roeber, V.; Yamashita, K.; Hayashi, A.; Ohira, H.; Fukui, K.; Hisamatsu, A.; Nguyen, D.; et al. The 2016 Fukushima earthquake and tsunami: Local tsunami behavior and recommendations for tsunami disaster risk reduction. Int. J. Disaster Risk Reduct. 2017, 21, 323–330. [Google Scholar] [CrossRef]
- Sousa, L. The Earthquake of the November 1, 1755 and a Demographic Study; Portuguese Geological Services: Lisbon, Portugal, 1932; p. 1013. (In Portuguese)
- Dawson, A.; Foster, I.D.L.; Shi, S.; Smith, D.E.; Long, D. The identification of tsunami deposits in coastal sediment sequences. Sci. Tsunami Hazards 1991, 9, 73–82. [Google Scholar]
- Foster, I.D.L.; Albon, A.J.; Barbell, K.M.; Fletcher, J.L.; Jardine, T.C.; Mothers, R.J.; Pritchard, M.A.; Turner, S.E. High energy coastal sedimentary deposits; an evaluation of depositional processes in Southwest England. Earth Surf. Process. Landf. 1991, 16, 341–356. [Google Scholar] [CrossRef]
- Banerjee, D.; Murray, A.S.; Foster, I.D.L. Scilly Isles, UK: Optical dating of a possible tsunami deposit from the 1755 Lisbon earthquake. Quat. Sci. Rev. 2001, 20, 715–718. [Google Scholar] [CrossRef]
- Johnston, A. Seismic Moment Assessment of Earthquakes in Stable Continental Regions–III. New Madrid 1811–1812, Charleston 1886 and Lisbon 1755. Geophys. J. Int. 1996, 126, 314–444. [Google Scholar] [CrossRef]
- Lebreiro, S.M.; McCave, I.N.; Weaver, P.P.E. Late Quaternary Turbidite Emplacement on the Horseshoe Abyssal Plain (Iberian Margin). J. Sediment. Res. 1997, 67, 856–870. [Google Scholar]
- Thomson, J.; Weaver, P.P.E. An AMS radiocarbon method to determine the emplacement time of recent deep-sea turbidites. Sediment. Geol. 1994, 89, 1–7. [Google Scholar] [CrossRef]
- Santos, A.; Koshimura, S.; Imamura, F. The 1755 Lisbon Tsunami: Tsunami source determination and its validation. J. Disaster Res. 2009, 4, 41–52. [Google Scholar] [CrossRef]
- Santos, A.; Koshimura, S. Tsunami Hazards at Setubal urban area considering the 1755 Lisbon Tsunami. In Proceedings of the IX Portuguese Congress of Geography; Correia, T.P., Henriques, V., Julião, V.R.P., Eds.; Associação Portuguesa de Geógrafos: Évora, Portugal, 2013; pp. 930–935. ISBN 978-972-99436-6-9. [Google Scholar]
- Santos, A.; Pereira, S.; Fonseca, N.; Paixão, R.; Andrade, F. Tsunami risk assessment in the Peniche and Lourinha municipalities. In The 1755 Lisbon Earthquake: What Have We Learned; Imprensa da Universidade de Coimbra: Coimbra, Portugal, 2015; pp. 251–276. (In Portuguese) [Google Scholar]
- Santos, A.; Koshimura, S. The 1755 Lisbon Tsunami at Vila do Bispo municipality, Portugal. J. Disaster Res. 2009, 10, 1067–1080. [Google Scholar] [CrossRef]
- Santos, A.; Queirós, M.; Rodriguez, J. Tsunami Risk Assessment at Albufeira Downtown, Portugal. In Proceedings of the ICUR 2016, Lisbon, Portuga, 30 June–2 July 2016; Costa, P., Quin, D., Garcia, R., Eds.; Centro Europeu de Riscos Urbanos (EUR-OPA): Lisbon, Portugal, 2016; pp. 449–454. [Google Scholar]
- Okada, Y. Surface Deformation due to Shear and Tensile Faults in a Half Space. Bull. Seismol. Soc. Am. 1985, 75, 1135–1154. [Google Scholar]
- Imamura, F. Review of tsunami simulation with a finite difference method. In Long-Wave Runup Models; World Scientific: Singapore, 1995; pp. 25–42. [Google Scholar]
- Koshimura, S.; Oie, T.; Yanagisawa, H.; Imamura, F. Developing Fragility Functions for Tsunami Damage Estimation Using Numerical Model and Post-tsunami Data from Banda Aceh Indonesia. Coast. Eng. J. 2009, 51, 243–273. [Google Scholar] [CrossRef]
- GEBCO Digital Atlas, General Bathymetric Chart of the Oceans, BODC. 2003. Available online: https://www.gebco.net/ (accessed on 8 September 2017).
- Hydrographic Institute. International Bathymetric Chart of the Central and Eastern Atlantic, Sheet 1.01. 2001. Available online: https://www.ngdc.noaa.gov/mgg/ibcea/ (accessed on 8 September 2017).
- Hydrographic Institute. Bathymetry Charts No. 24204, No. 26308, No. 26309. Hydrographic Institute: Lisbon, Portugal, 2011. Available online: http://eurogoos.eu/locations/hydrographic-institute-of-portugal/ (accessed on 8 September 2017).
- Geographic Institute of the Army (IGeoE). Charts No. 454, No. 455, No. 465, No. 466. Geographic Institute of the Army: Lisbon, Portugal, 2001. Available online: https://www.igeoe.pt/index.php?id=1 (accessed on 8 September 2017).
- Madsen, P.; Schäffer, H. Analytical solutions for tsunami runup on a plane beach: Single waves, N-waves and transient waves. J. Fluid Mech. 2010, 645, 8. [Google Scholar] [CrossRef]
- International Tsunami Information Center. Available online: www.ioc-unseco.org (accessed on 25 October 2016).
- Santos, A.; Tavares, A.O.; Emidio, A. Comparative tsunami vulnerability assessment of an urban area: An analysis of Setubal city, Portugal. Appl. Geogr. 2014, 55, 19–29. [Google Scholar] [CrossRef]
- Yeh, H.; Barbosa, A.R.; Ko, H.; Cawley, J.G. Tsunami loadings on structures: Review and analysis. In Proceedings of the 34th Conference on Coastal Engineering, Seoul, Korea, 15–20 June 2014; p. 13, ISBN 978-0-9896611-2-6. [Google Scholar]
- Maritime National Authority. Rock Fall of a Cliff in Setubal Does Not Cause Victims. Available online: www.amn.pt (accessed on 2 September 2017). (In Portuguese).
- Daily Journal Correio da Manhã. Rockfall on the Cliff of the Serra da Arrabida; Daily Journal Correio da Manhã: Lisbon, Portugal, 2017; p. 51. (In Portuguese) [Google Scholar]
- Committee on National Earthquake Resilience—Research, Implementation, and Outreach; Committee on Seismology and Geodynamics; Board on Earth Sciences and Resources; Division on Earth and Life Studies. National Earthquake Resilience—Research, Implementation, and Outreach; The National Academies Press: Washington, DC, USA, 2011; p. 279. [Google Scholar]
- Portuguese Environment Agency. Available online: http://qualar.apambiente.pt/ (accessed on 14 February 2017).
© 2017 by the authors. Licensee MDPI, Basel, Switzerland. This article is an open access article distributed under the terms and conditions of the Creative Commons Attribution (CC BY) license (http://creativecommons.org/licenses/by/4.0/).


