1. Introduction
Satellite interferometric synthetic aperture radar (InSAR) is a valuable tool for observing the deformation of the earth’s surface. Such techniques use the radar phase information of SAR images acquired at different times over the same area [
1,
2]. Persistent Scatterer Interferometry (PSI) [
2,
3,
4,
5] is one of the Multi-Temporal InSAR (MT-InSAR) algorithms that produces deformation time series and velocity for point objects called a Persistent Scatterer (PS). PSs have, on average, identical scattering properties over time and a stronger reflection amplitude within a pixel. The procedure allows the temporal decorrelation and the geometrical decorrelation to be reduced, which are both problematic for the InSAR technique. Based on these considerations, PSI is particularly efficient in urban areas as the density of reflecting objects and the amplitude of reflection are high.
Therefore, during the international Terrafirma project [
6] funded by the European Space Agency (ESA) SAR images covering a large majority of the capitals of Europe were processed using PSI. Since then, the Geological Survey of Belgium (GSB) is involved in radar applied interferometry research. Brussels was one of the cities studied during this project. In the city centre, a previously unknown uplift has been highlighted and analysed [
7] At that time, 74 scenes from the ERS satellite covering the period 1992–2003 were processed. Nowadays, thanks to new Synthetic Aperture Radar (SAR) satellites (Envisat in 2002, TerraSAR-X in 2007 and Sentinel 1 in 2014) 300 scenes covering the region of Brussels were processed using the PSI technique.
In the literature, land subsidence of large cities related to groundwater extraction highlighted by remote sensing techniques is a well-known phenomenon. Mexico city centre [
8,
9,
10,
11], Las Vegas [
12], Shanghai [
13,
14] are just a few of many extensively studied examples. On the contrary, uplifts caused by the recharge of aquifers have received far less attention in scientific literature except for some studies dealing with the effects of fluid injections [
15] or CO
2 storage [
16], and uplifts related to volcanism [
5,
17,
18]. Hence this paper monitors 25 years of the ground movements in the city centre of Brussels (Belgium) using PSI. Several piezometers giving the evolution of the water table in different aquifers were analyzed. According to the results, it has been possible to propose a model for the ground movements evolution based on the recharge of the Cenozoic and Paleozoic aquifers in the study area. The second aim highlights the duration of the recharge of the deep aquifers in Brussels after a century of groundwater withdrawal that has started during the industrialisation time interval of the city.
2. Geographical and Geological Setting
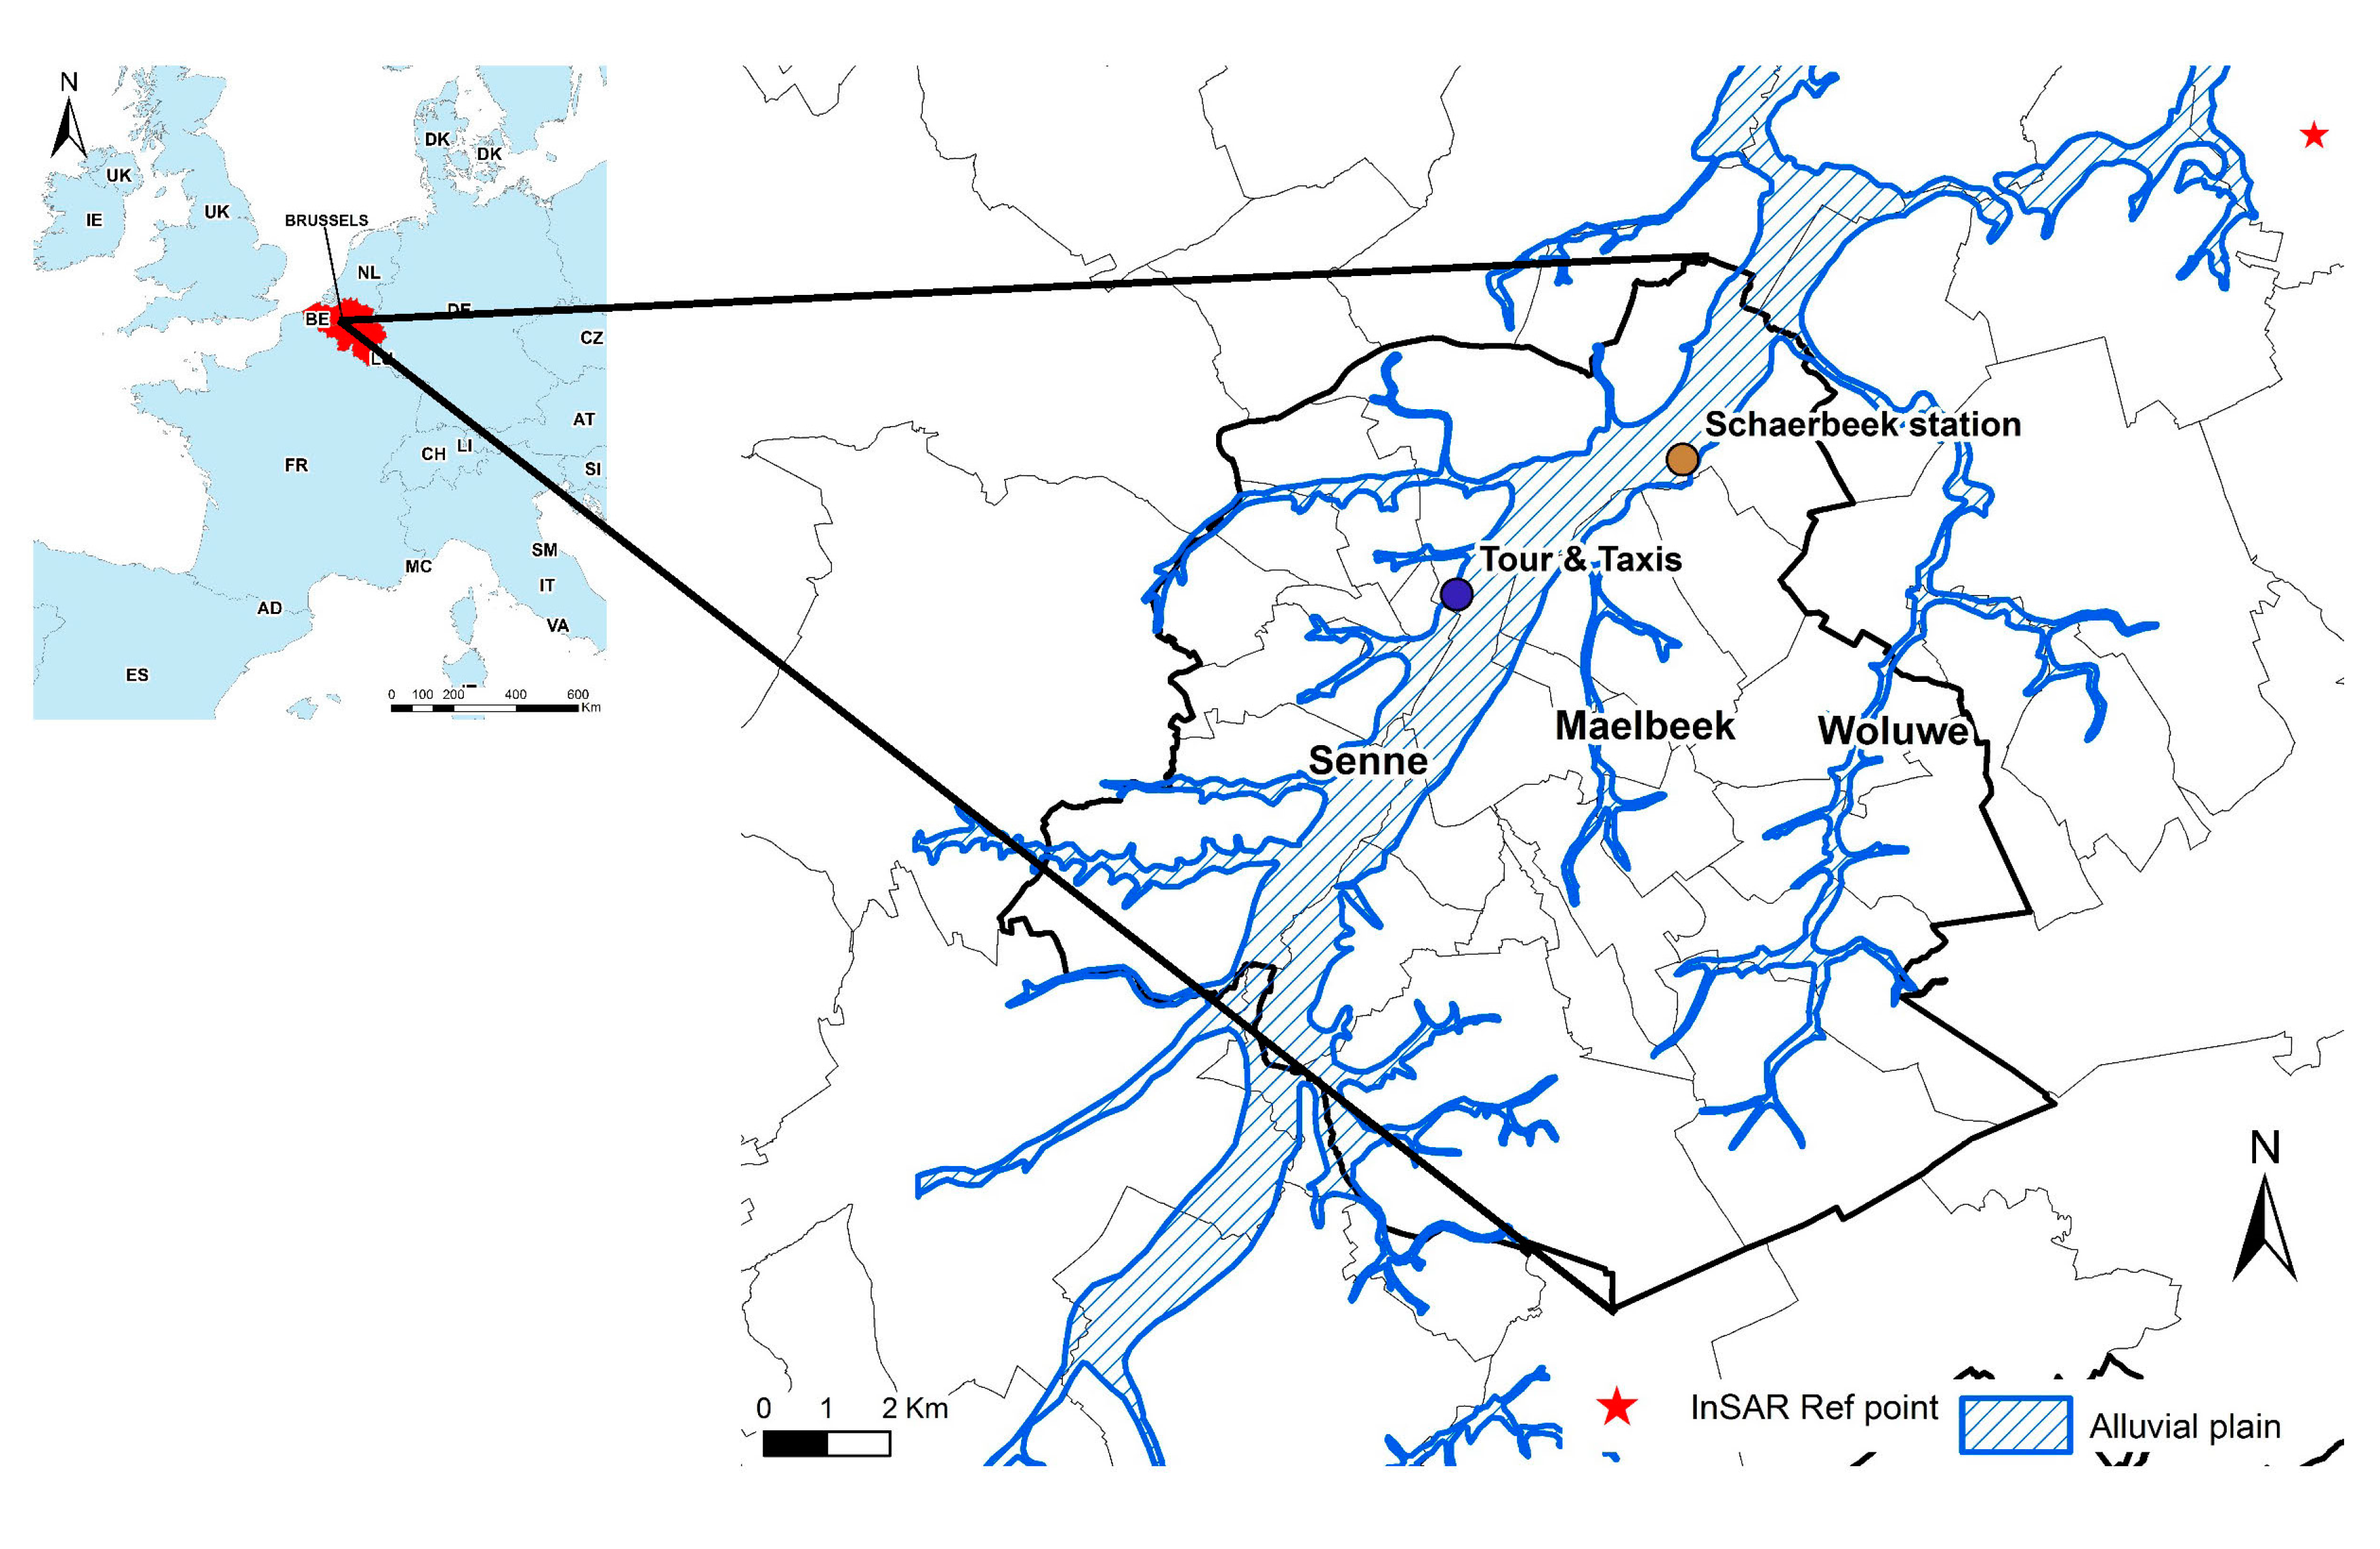
The area of Brussels, and more particularly the historical heart of the city, is crosscut by the Senne valley along a SW–NE axis (
Figure 1). Some less important, parallel valleys (such as the Maelbeek and Woluwe) have incised the eastern part of the urban landscape of Brussels. The altitude difference between the top of the hills and the base of the valleys reaches more than 80 m. The large alluvial plain of the Senne River inclines gently towards the north from an altitude of 19 m in the south to 13 m in the north.
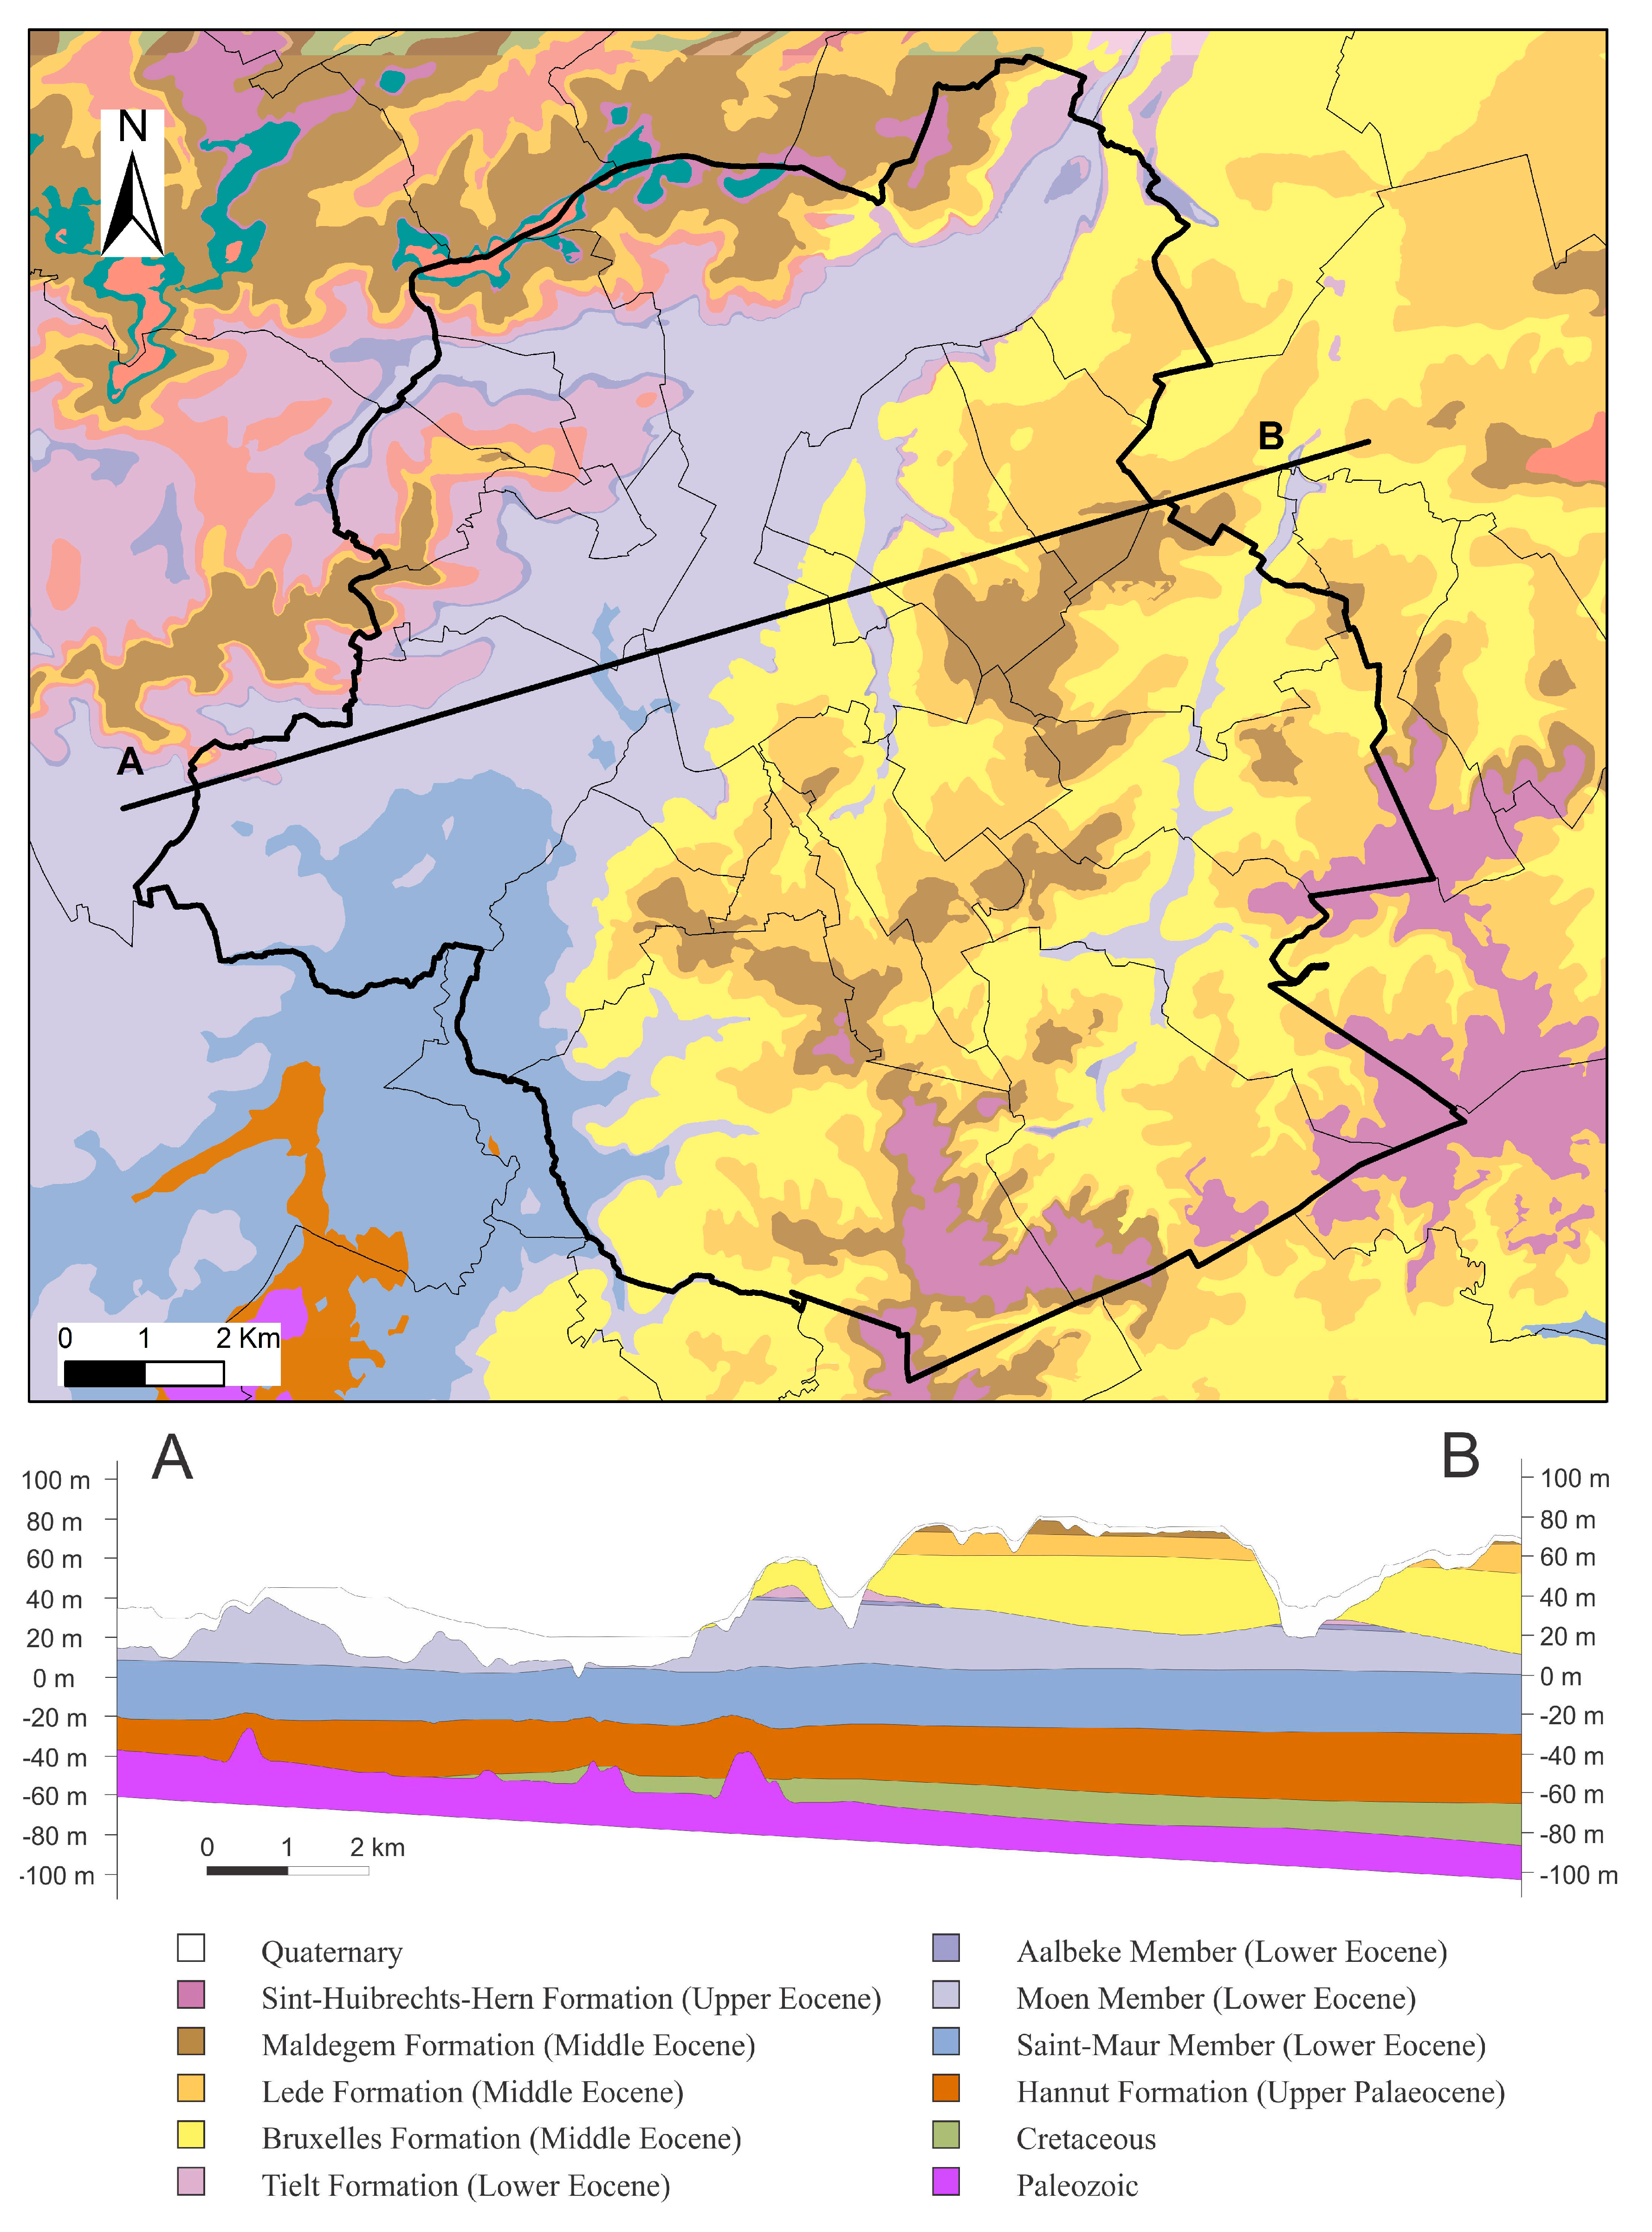
The region of Brussels (
Figure 2) is located over a major geological structure from the Paleozoic age called the Brabant Massif, which covers large areas of Belgian territory. The Brabant Massif consists of a compressed wedge, the core of which is formed by steeply deformed Cambrian formations [
19] that are flanked to the NE and SW by younger Ordovician and Silurian formations [
20]. The paleotopographical surface of the Brabant Massif basement is affected along the Senne valley by a chain of NW–SE trending ridges and depressions that have a width ranging between 0.5 to 1 km and a spacing of 1 to 1.5 km [
21]. The steeply dipping Lower Paleozoic deposits that occur in subcrop in the mapped area belong to the Blanmont, (quartzites), Tubize (from shales to sandstones) and Oisquercq (claystones to siltstones) formations. The Brabant Massif was a persistent positive area with only reduced sedimentation during the Late Paleozoic period. The Carboniferous was probably removed by erosion during a Jurassic uplift [
22]. Late Cretaceous chalk deposits (Senonian Age) are partly preserved and were eroded by an uplift phase of the Brabant Massif during the middle Paleocene Laramide phase [
23]. Sedimentary Tertiary marine series, composed of clays, silts and sands, occur in numerous eustatic cycles. The subsurface geology of the latter is detailed in the following paragraphs.
Anthropogenic fillings are present almost everywhere and have a thickness up to several meters. Holocene alluvial sediments, composed of loam, sand, clay, peat and gravel layers, are essentially located in the valleys. Their thickness ranges generally from 10 to 20 m. Pleistocene deposits (mainly loess) cover the whole area. Their thickness varies strongly and can reach up to 20–30 m. Underneath the Quaternary continental sediments, Cenozoic marine formations are present, their age spanning from the Upper Miocene down to the Upper Paleocene (
Figure 2).
The Diest Formation (Upper Miocene) and the Bolderberg Formation (Lower Miocene) correspond to limited sand deposits at the top of the hills in the northern part of Brussels. The Sint-Huibrechts-Hern sandy Formation (Upper Eocene) has a reduced thickness in the north while in the southeast it can reach more than 10 m. The Maldegem Formation (Middle Eocene) contains four Members: Zomergem, Onderdale, Ursel and Asse and, finally Wemmel. The Maldegem Formation is relatively good for house foundations except when it is saturated with water. The Lede Formation (Middle Miocene) is made of sands and sandy calcareous layers. The Bruxelles Formation (Middle Eocene) is characterised by coarser sands than those of Lede. The Gent Formation (Lower Eocene) reaches a thickness of 8 m and is only observed in the north-western part of Brussels. The clay and fine sands of the Tielt Formation (Lower Eocene) are generally 20 m thick. The Kortrijk Formation (Lower Eocene) is subdivided into three Members and mainly composed of clays, silts and sands. The average total thickness of the Kortrijk Formation reaches 70 m. The Upper Paleocene Formation (Hannut) contains an upper sandy Member (Grandglise) and a lower greenish clay Member (Lincent). The thickness ranges from 15–20 m in the south, up to 28 m in the north. Cretaceous deposits are only present in the northern part of Brussels. White to grey chalk with black cherts from the Gulpen Formation is described only in drill holes. The Cretaceous disappears progressively to the southwestern part of the Brussels Region and the thickness increases towards the NE. The Tertiary and Cretaceous rocks are unconformably overlaying the Paleozoic basement.
The hydrogeological structure of the area is formed by several superimposed aquifers separated by layers of clays. An alluvial aquifer lies within the Quaternary deposits of the Senne valley. The eastern part of the Brussels Region is characterized by an important aquifer in the sands of the Lede, Bruxelles and part of the Kortrijk Formations. The glauconitic sands of the Hannut Formation (Late Paleocene) contain an aquifer separated from the artesian aquifer of the Cretaceous sediments by a clay layer a few metres thick corresponding to the Lincent Member. The Lincent Member is disappearing towards the south in the Wallonia area where the Hannut aquifer is outcropping and lying on the Cretaceous rocks when present. The Cretaceous is absent in the southern and southwestern parts of Brussels. The thickness of the Cretaceous increases from a few metres to around 20 m towards the north and to more than 40 m in the most eastern parts of Brussels [
24]. The artesian aquifer of the Cambro-Silurian is sometimes separated locally from the Cretaceous aquifer by a thick clay layer originating from weathered basement rocks. Locally, it can play the role of an aquitard level, but on a regional scale it is not distinguished and these aquifers are aggregated as “Cretaceous-Paleozoic aquifer”.
Table 1 gives a summary of the different aquifer and aquitard levels recognized in the Brussels Region.
3. Materials and Methods
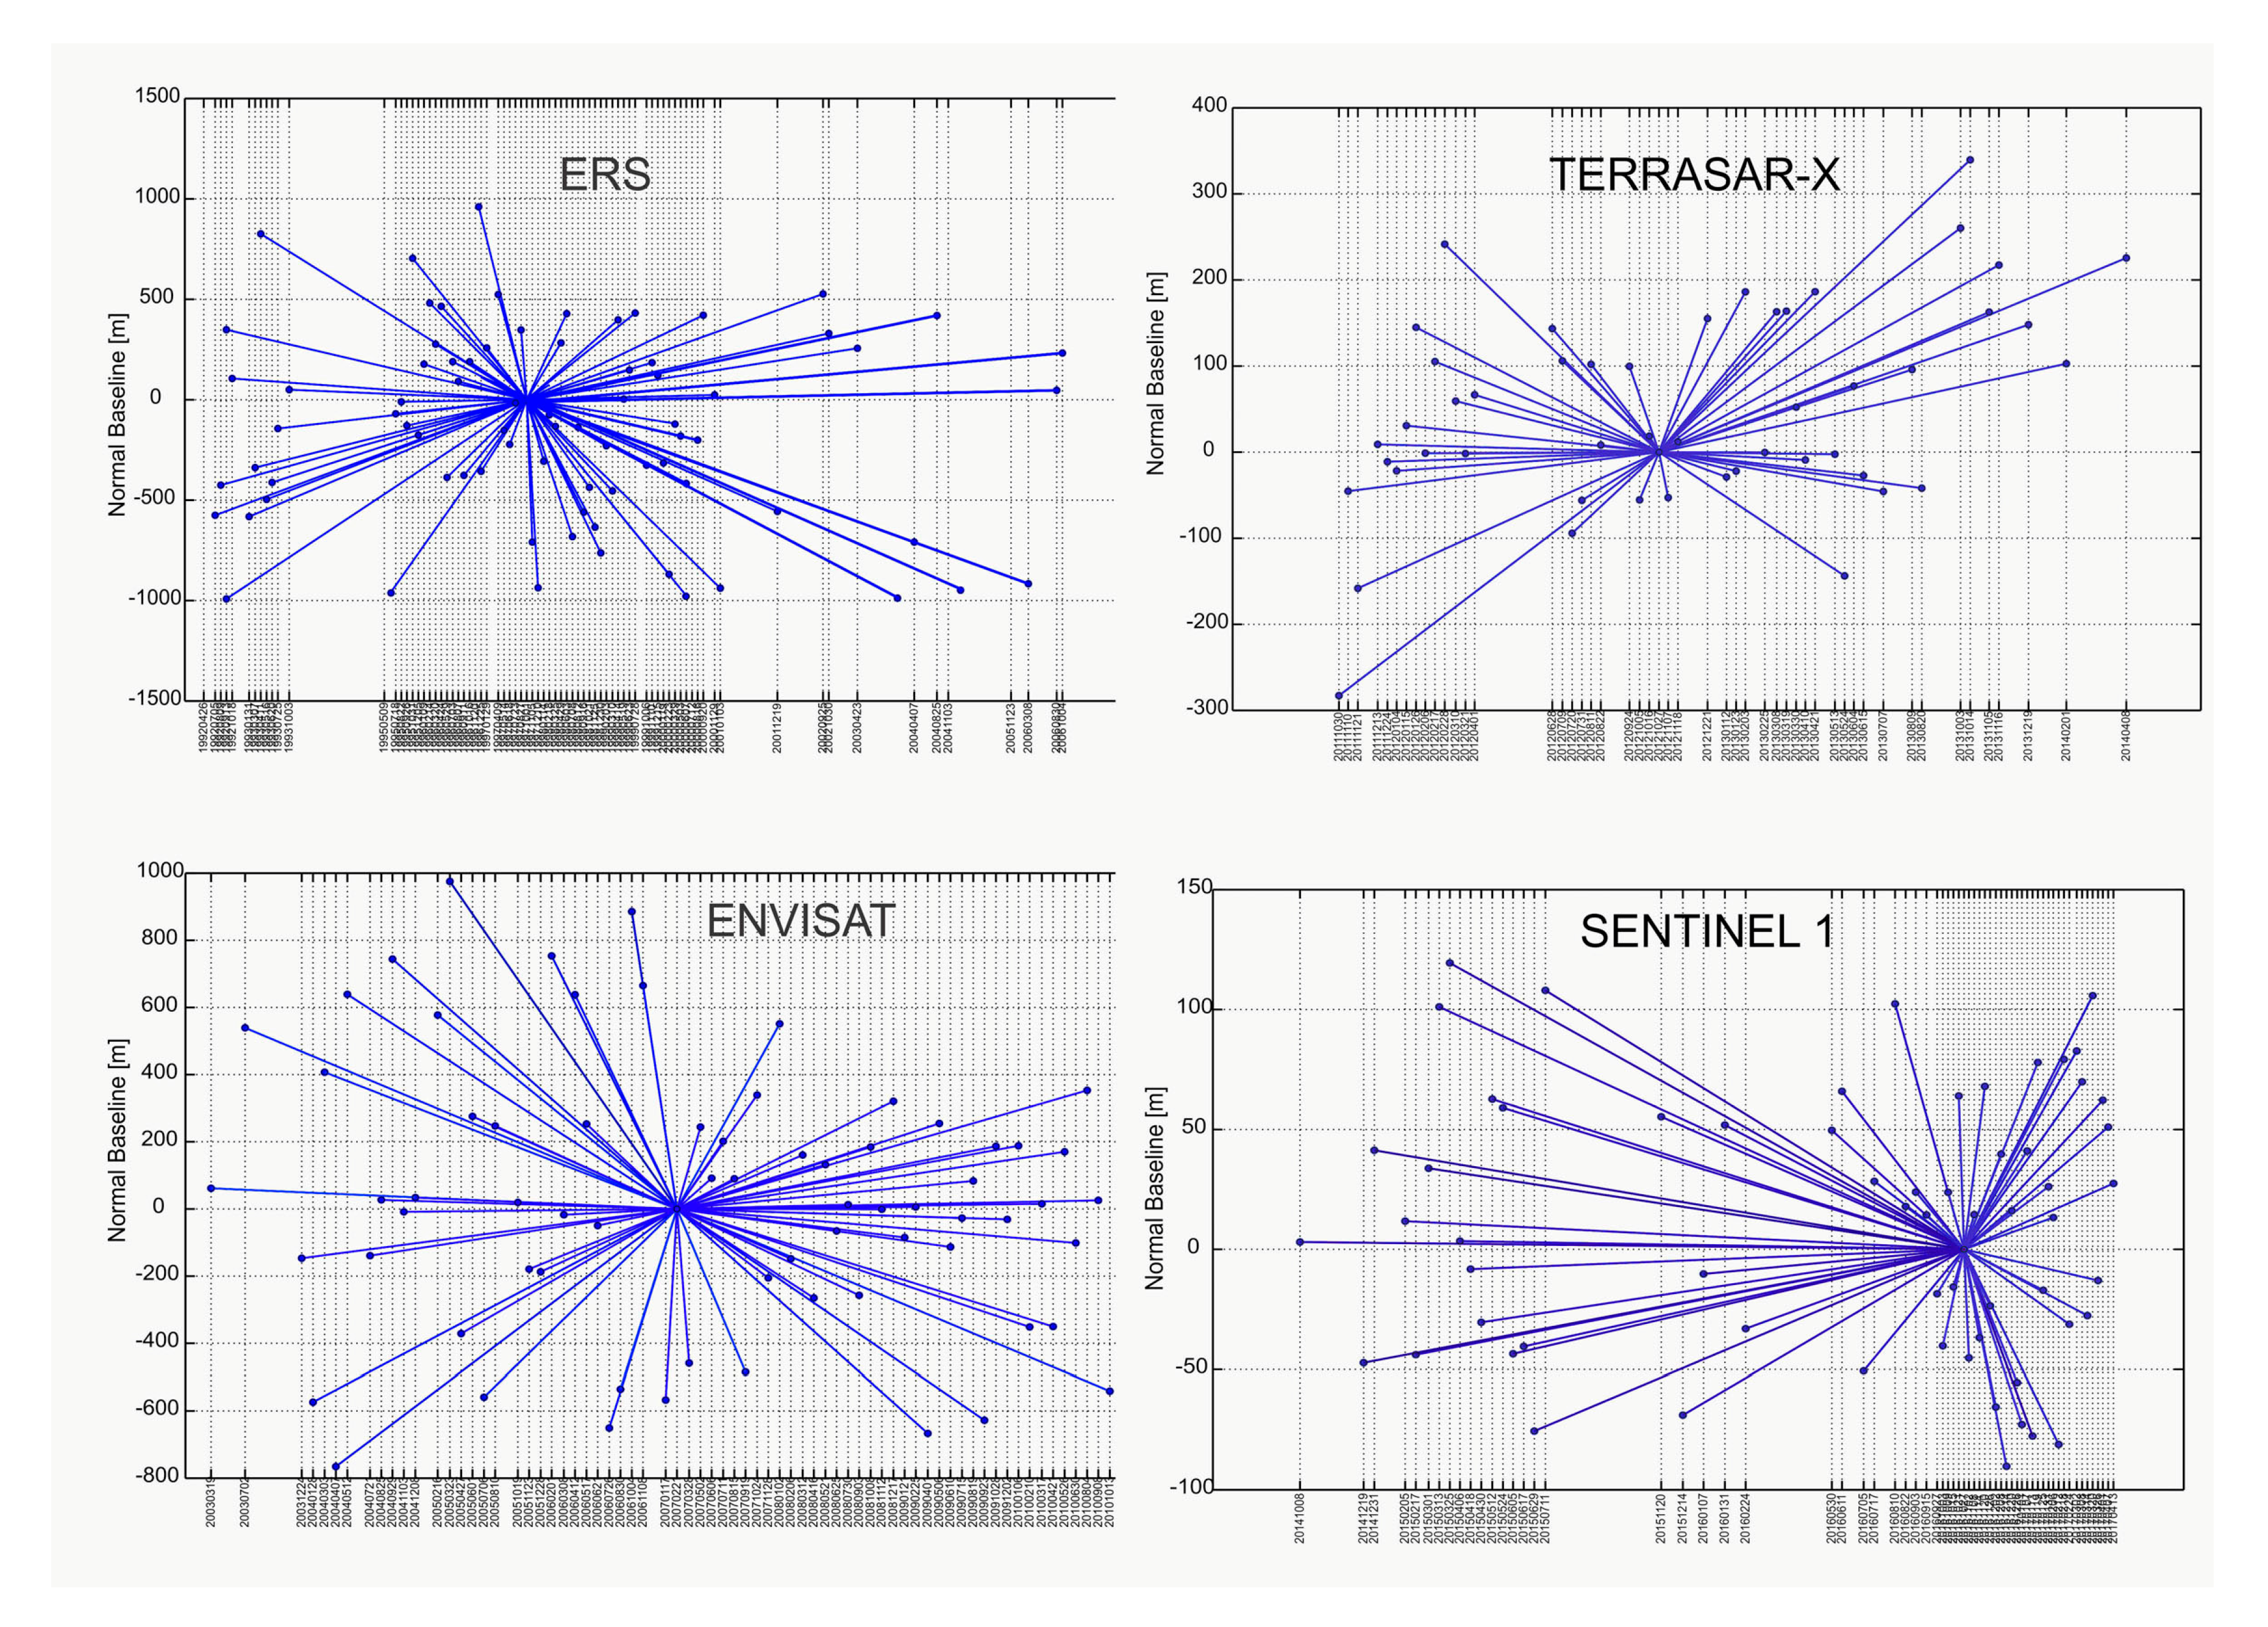
Four datasets of SAR images were acquired and processed (
Table 2,
Figure 3 and
Figure 4), spanning a total period of 25 years. The ERS, Envisat and Sentinel-1 missions acquired data in C-band (frequency 5.7 GHz, wavelength 5.6 cm) at a ground resolution of circa 5–20 m; the TerraSAR-X data were acquired in X-band (frequency 9.6 GHz, wavelength 3.1 cm) at a ground resolution of c. 3 m (Stripmap mode). An external digital elevation model (DEM) data from the Shuttle Radar Topography Mission (SRTM 3-arc second) with 90 m horizontal resolution was used to remove the topographic component of the interferometric phase. A common reference point (
Figure 1) was defined 15 km NW of Brussels (4.54° E 50.932° N).
The ERS1/2 scenes of descending track 423 were obtained in raw L0 format from ESA. An initial selection comprised all scenes providing full coverage of Belgium, with restrictions on the baseline difference (maximum of 1200 m relative to an arbitrarily chosen master acquisition) and Doppler shift (maximum of 1200 Hz) to ensure good coherence. During various pre-processing steps, some scenes were dropped due to failure of focusing or coregistration. The final, fully processed dataset includes 78 acquisitions between 1992 and 2006. All images were coregistered to a single master image, and selected by minimizing spatial and temporal baselines. The conversion from raw L0 to SLC (Single Look Complex) format was done using ROI_PAC software [
25]. The SLC files were oversampled with a factor of two and interferograms were produced using the Doris InSAR processor [
26] and recomputed ERS-1/2 ODR orbits [
27]. The interferograms were then imported in StaMPS (Stanford Method for Persistent Scatterers) for Persistent Scatterer processing [
5]. The default parameters were used, except a slight relaxation of the thresholds for amplitude dispersion for selecting PS candidates (0.42 instead of 0.4) and standard deviation for phase noise weeding (1.2 instead of default 1), in order to improve the number of PS points. After unwrapping, spatially-correlated errors due to atmosphere, DEM and orbit error were iteratively estimated and removed.
A dataset comprising 73 ENVISAT scenes of descending track 423 in raw L0 format was obtained from ESA. All scenes had baselines of less than 1000 m with respect to the chosen master (
Table 2) and were successfully processed following the same procedures as for ERS, except for the use of DORIS Precise Orbit State Vectors and no changes made to the default parameter settings in StaMPS.
A dataset of 74 TerraSAR-X and TanDEM-X Stripmap (SM) descending scenes in SLC format was obtained from German Aerospace Centre (DLR). Creation of interferograms and PS processing were carried out using DORIS and StaMPS. Some parameter settings in StaMPS (size of spatial filters and windows) were adjusted to fit the higher spatial resolution of TerraSAR-X. This dataset is characterized by a high spatial resolution (3 m) and short baselines (maximum of 348 m).
The final dataset consisted of data acquired by the Sentinel-1A and 1B missions and accessed through the Copernicus Open Access Hub. The geometric specifications of this satellite constellation (i.e., short spatial and temporal baselines [
28]) promise improved data quality (higher coherence) and enhanced performance of PS-InSAR techniques, but the processing of TOPSAR data is more challenging. The study area is covered by 64 descending scenes acquired in Interferometric Wide Swath Mode (IWSM), with a maximum baseline of 119 m. The complete PS-InSAR data processing chain was carried out in Sarproz, which can handle individual swaths of TOPSAR data [
29]. Throughout the workflow the recommended/default settings were used. A significant difference with StaMPS is the use of weather data (temperature, atmospheric pressure, humidity, precipitation) for the estimation and removal of atmospheric phase.
Only PS points with a coherence value larger than 0.70 were used in further analyses. If the observed displacements are predominantly in a vertical direction and considering the differences in incidence angle between the datasets, the line-of-sight (LOS) displacements were converted to vertical displacements: ddispl = dLOS/cosθ, where ddispl is the vertical displacement, dLOS is the LOS displacement and θ is the average incidence angle.
The time series of displacements were merged for common PS points by assuming a linear displacement in time gaps and minimizing the offset between datasets. PS points were considered to be common to the nearest point in other datasets within a radius of 20 m.
4. Results
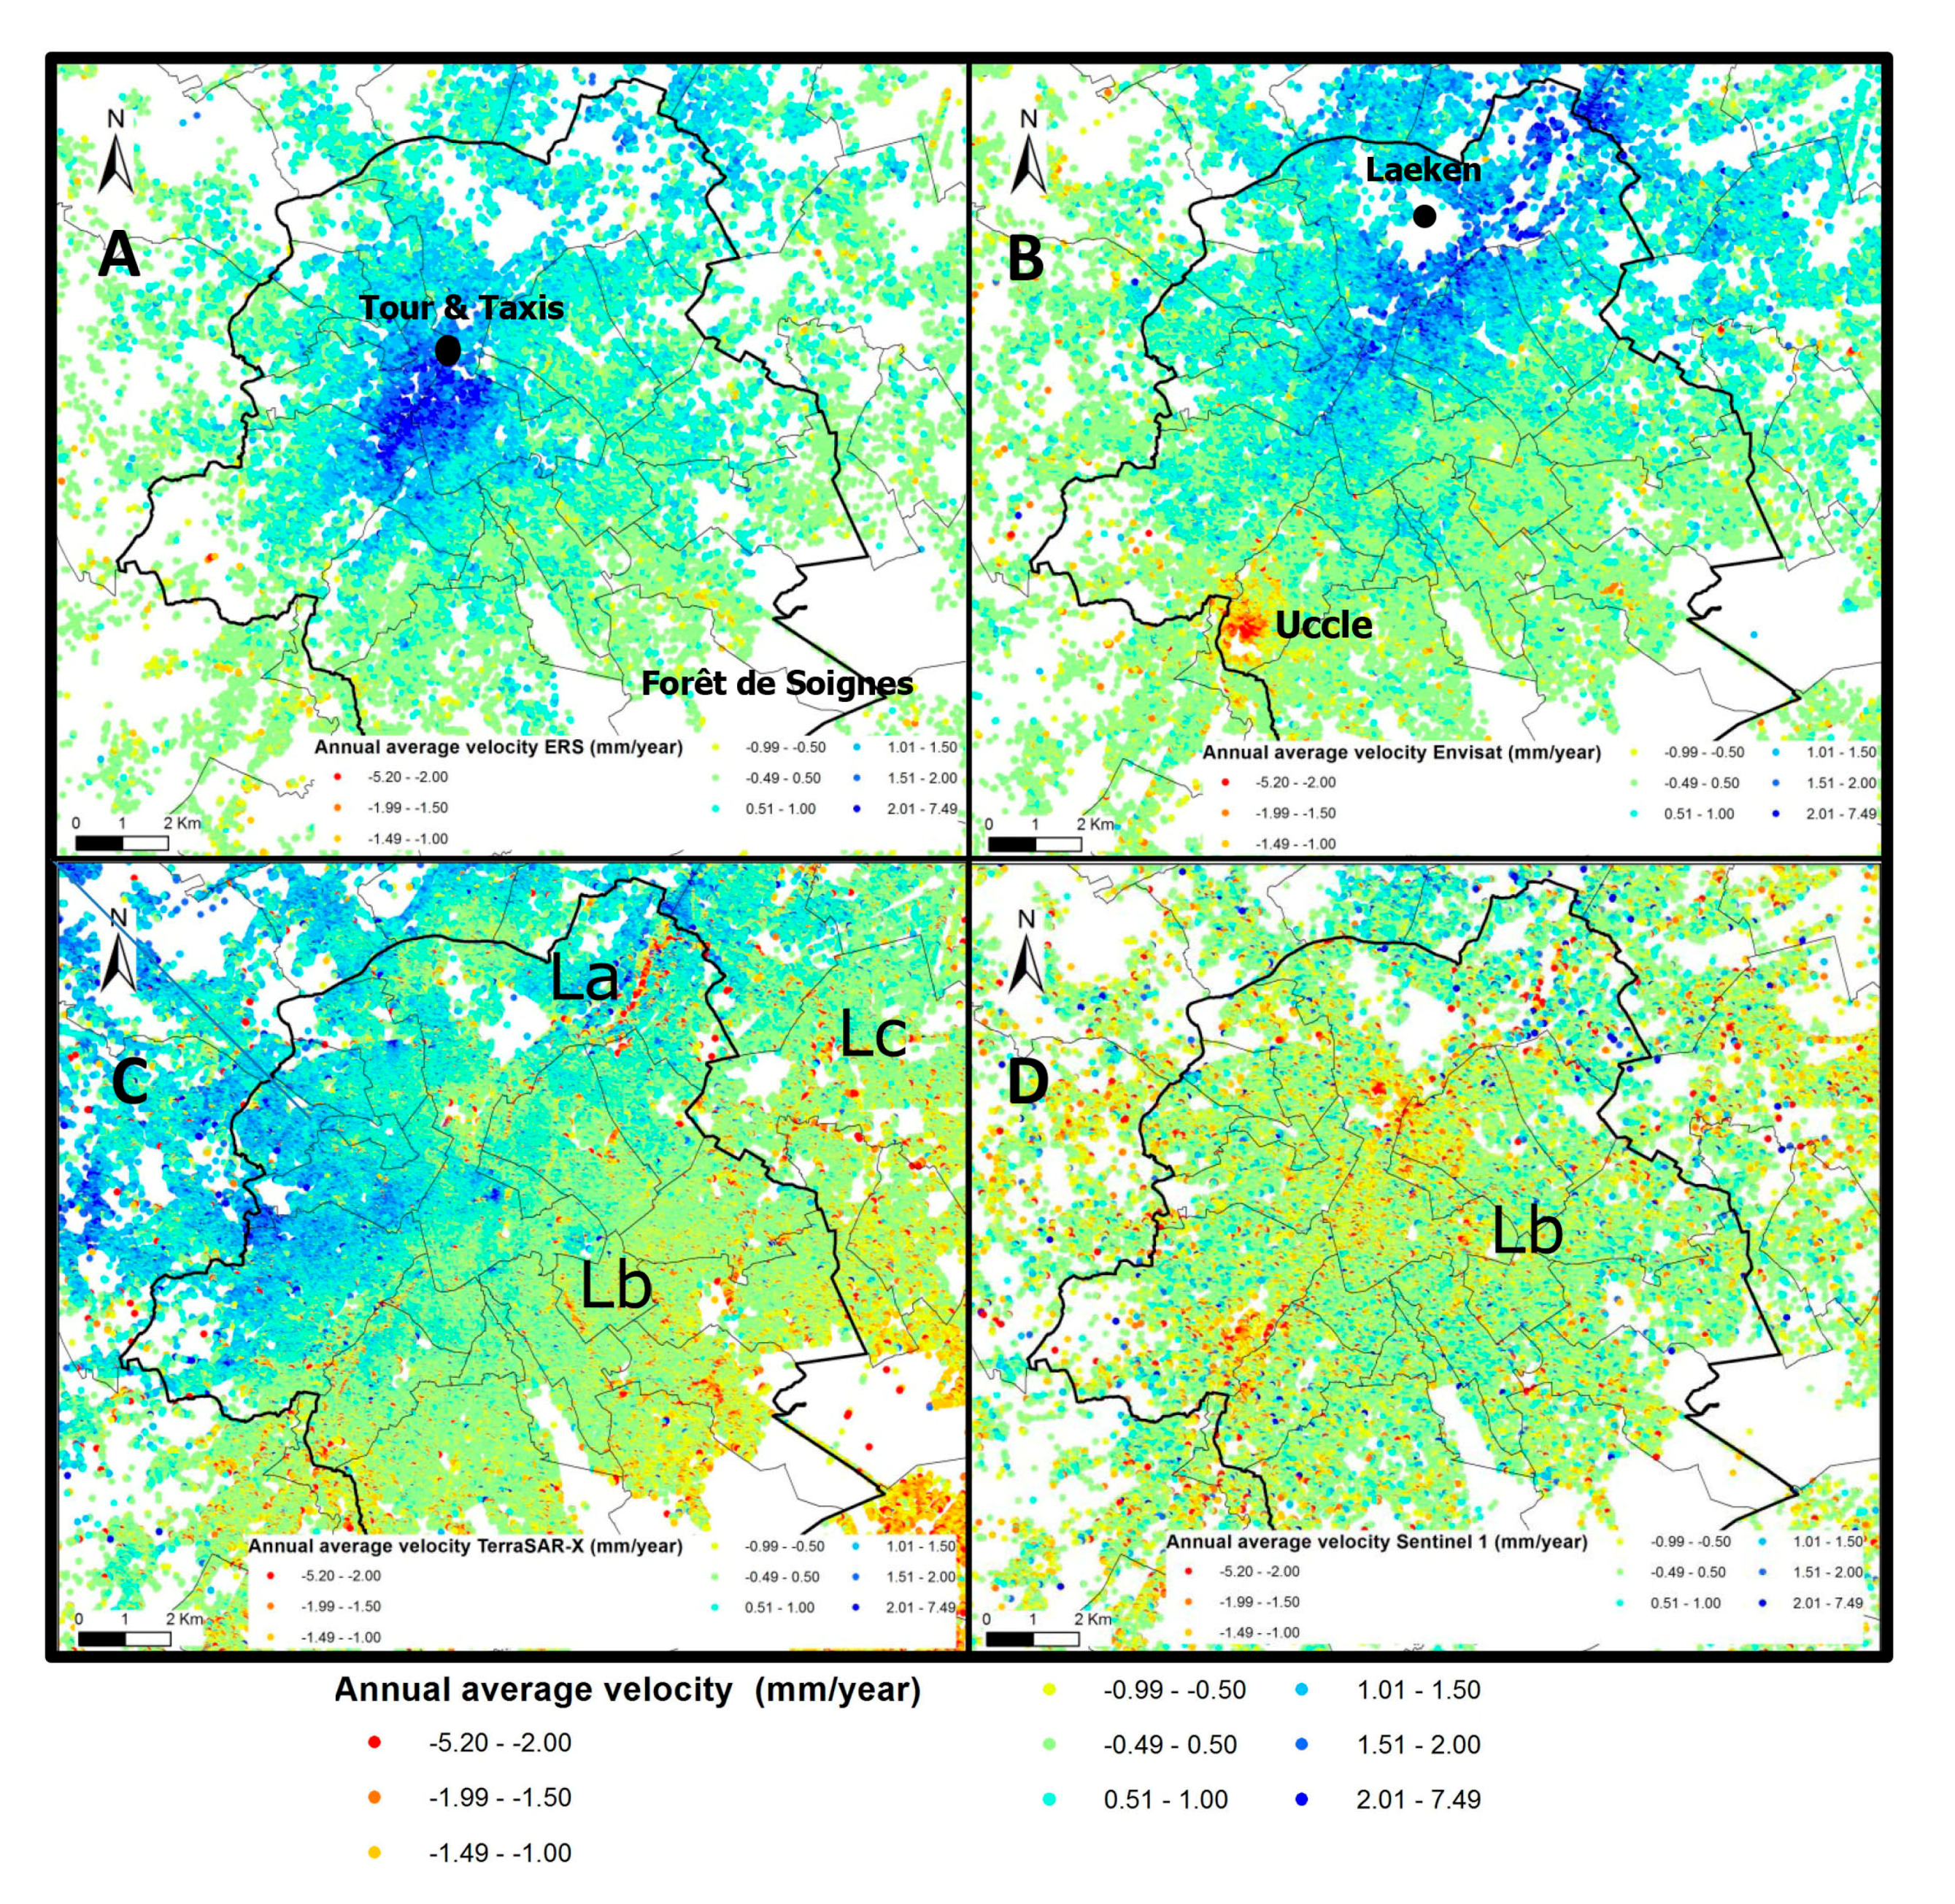
Analysis of the ERS (1992–2006), Envisat (2003–2010) and TerraSAR-X (2011–2014) velocities shows that the city of Brussels is, overall, characterized by a regional uplift, with a diminishing trend through time (
Figure 5A–C). The Sentinel 1 dataset (2014–2017) indicates that the uplift has faded and the area that was previously uplifting is now characterized by negative velocities (
Figure 5D).
The C-band missions (ERS, Envisat, Sentinel 1) acquired data at a similar ground resolution, resulting in PS point densities of the same order of size (circa 200 PS/km
2 in the study area, see
Table 2). A steady increase between the successive missions may be attributed to improved geometric specifications. Owing to its higher spatial resolution, the point density achieved by TerraSAR-X is an order of magnitude larger (circa 2700 PS/km
2 for the study area). In the urbanized centre of Brussels, point densities are highest, exceeding 800 PS/km
2 and 6000 PS/km
2 for the C-band satellites and TerraSAR-X, respectively. The Soignes Forest located to the SSE of the Brussels city centre (
Figure 5A) and the Laeken Park in the northern part of the city centre do not contain PS points. Vegetation is responsible for the loss of coherence between the acquisitions and thus the capability to detect PS.
For ERS (
Figure 5A), the general observed trend of uplift is most pronounced in the city centre of Brussels, along a SW–NE oriented axis (average velocity of 2.7 mm/year). The affected area roughly corresponds to the Senne river valley inside the historic heart of Brussels.
For Envisat (
Figure 5B), the main uplift area has shifted along the Senne river valley towards the northern suburbs of Brussels (average velocity of 2.3 mm/year). In the SW of the city, the ground movements are reduced to the range of stable values. A notable subsidence feature is observed in Forest/Uccle districts, at the SW border of the Brussels Region: here, an area of circa 1.5 km
2 is characterized by substantial negative velocities (average velocity of −3.1 mm/year).
For TerraSAR-X (
Figure 5C), the data show a more diffuse pattern in the city centre, with most of the velocities close to stable values. An uplift is still visible westwards of Brussels (average velocity of 1.8 mm/year), but the eastern part of the study area is characterized by stable velocity values. Distinct, local subsidence features are observed in some areas characterized by erratic negative velocities. Lineament “La” corresponds to the railway tracks at Schaerbeek station. Lineaments “Lb” and “Lc” correspond to the NNW–SSE oriented Maelbeek and NNE–SSW oriented Woluwe river valleys, respectively.
During the Sentinel 1 time frame (
Figure 5D), the general trend of ground movements appears to have stabilized. Within a zone (which is SW–NE oriented, 200–800 m across, and corresponds to the Senne river valley), the direction of movement reversed from uplift to slight subsidence (average velocity of −1.3 mm/year). Lineament “La” is still visible as a distinct subsiding feature. However, as the range of the velocities is quite small and the observation period is short in comparison with ERS and Envisat the Sentinel 1, the results look noisy. In the future, after one or two years of new Sentinel 1 acquisition, a new processing operation will be conducted in order to verify the current observations.
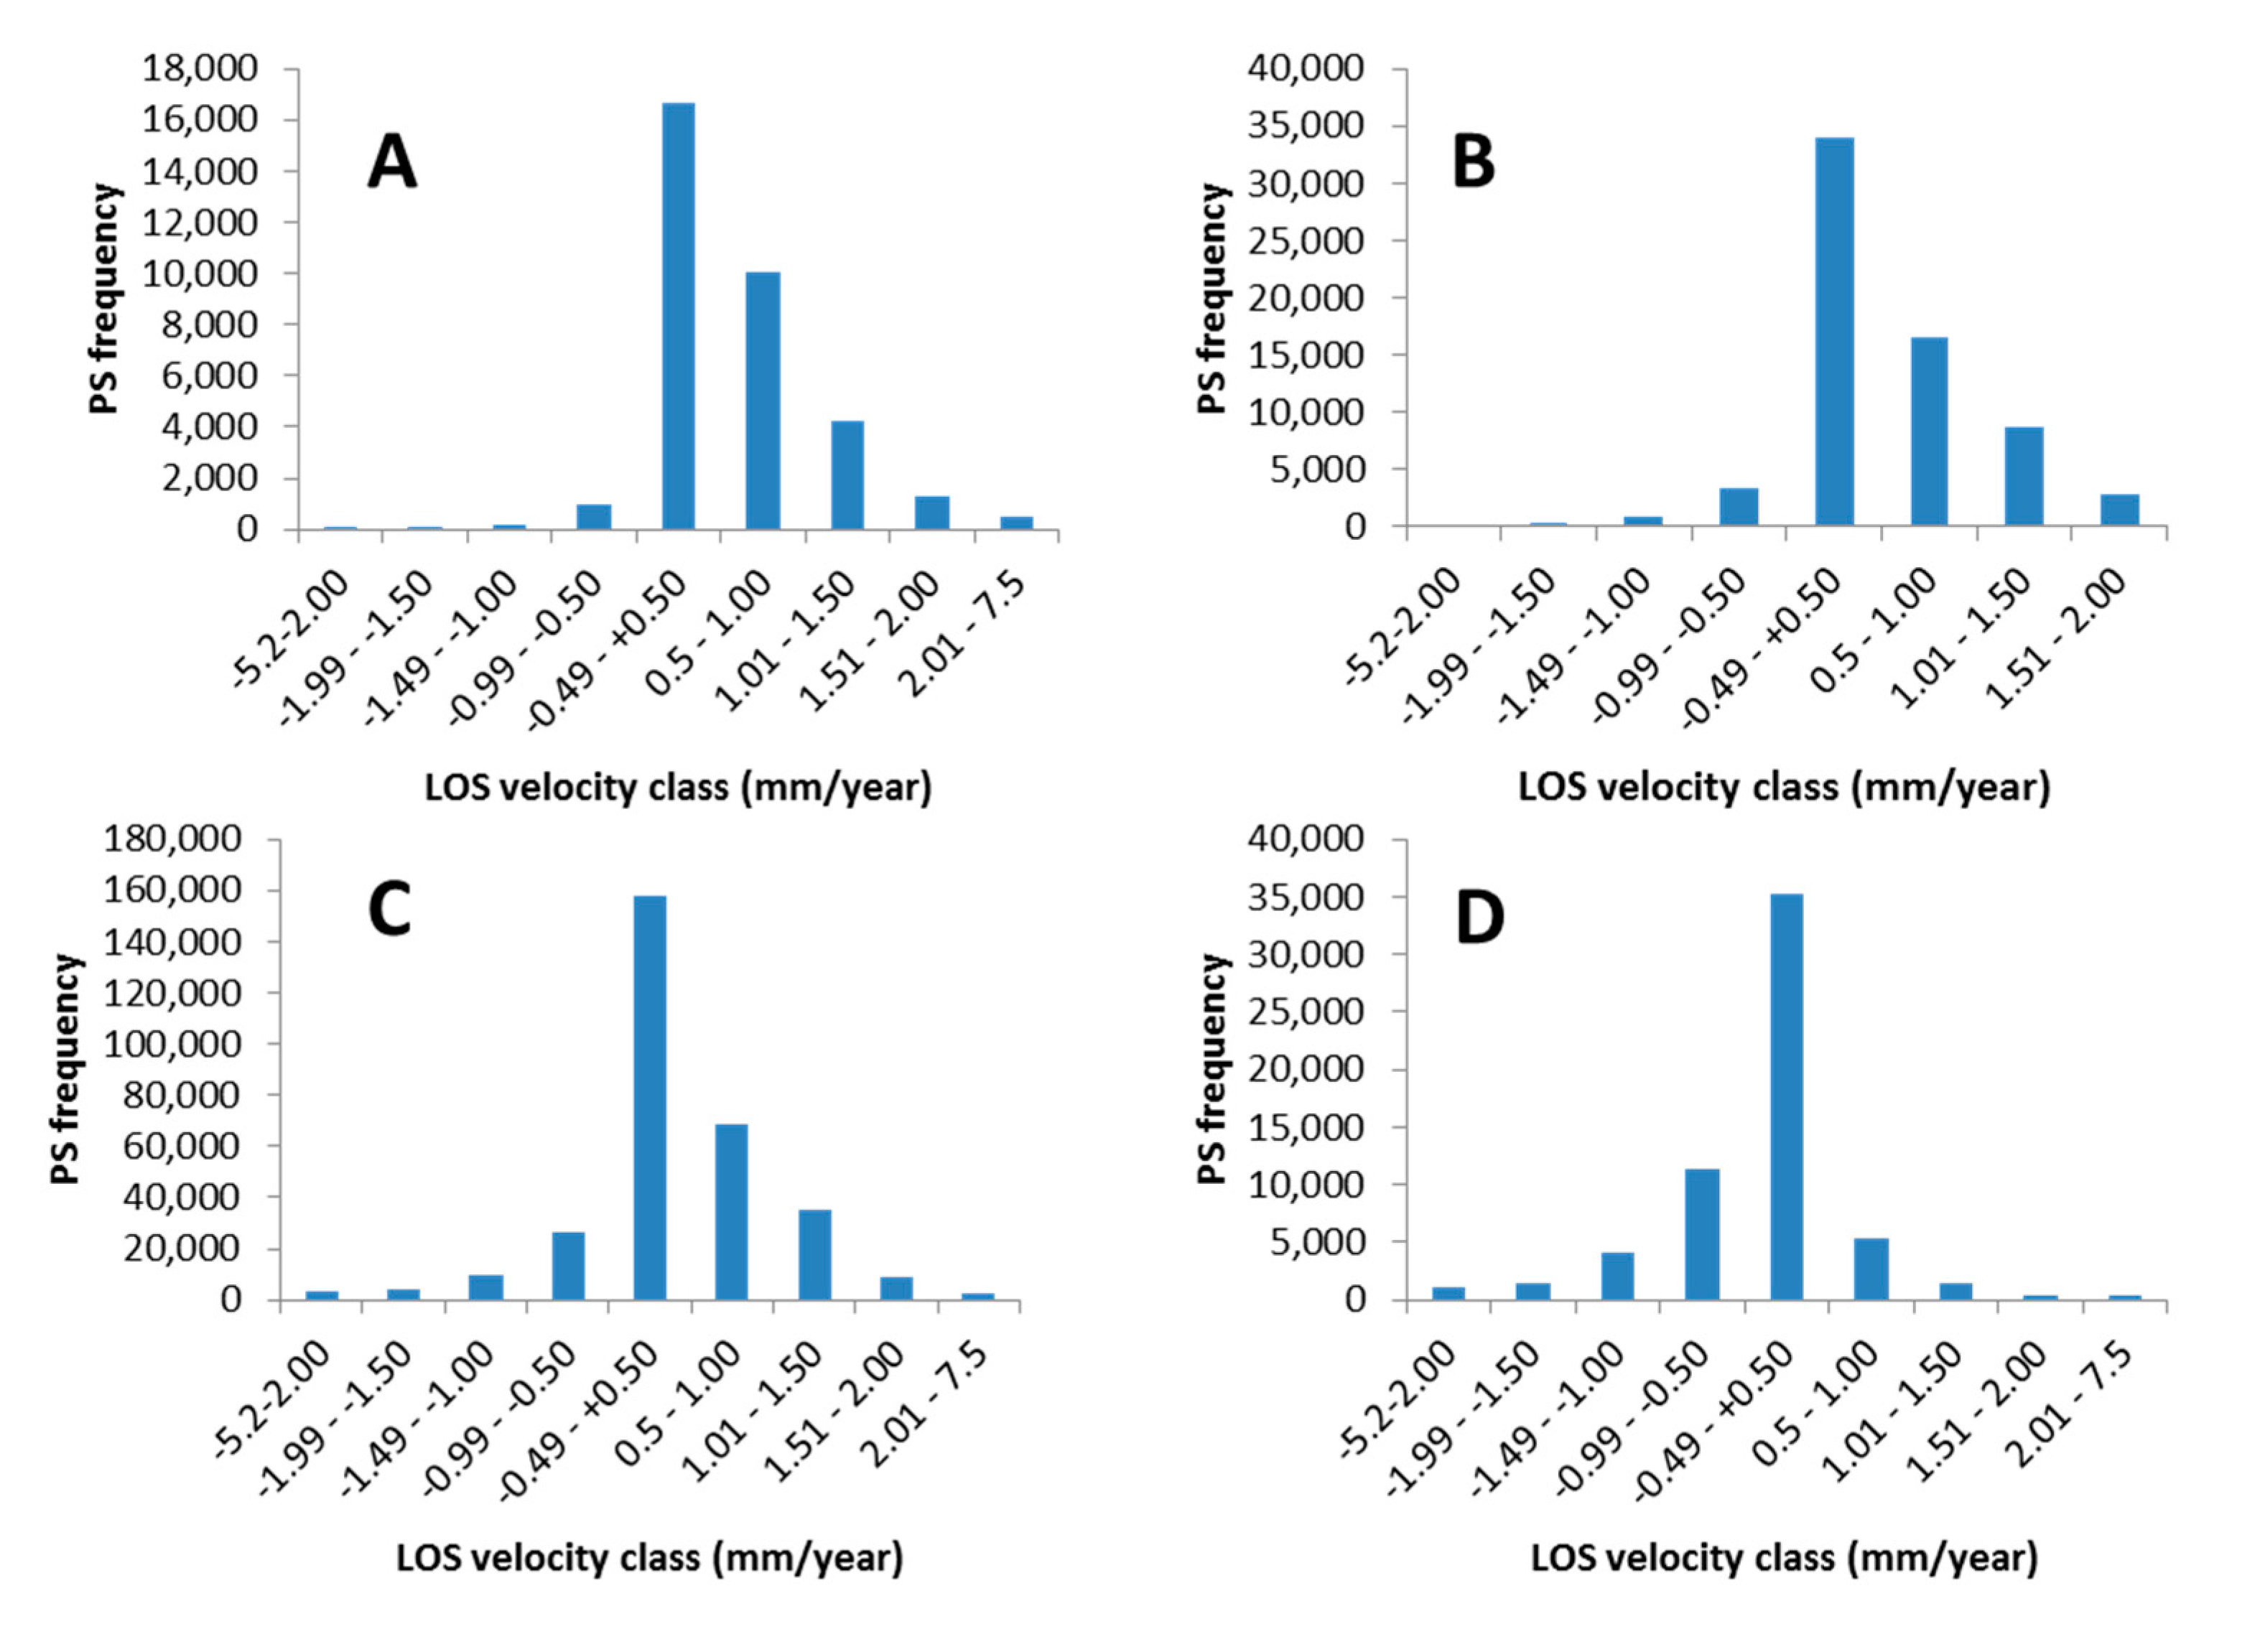
From all datasets, histograms were plotted to analyze the frequency distribution of the average annual velocities (
Figure 6A–D). Values in the range of −0.49 to 0.5 mm/year can be considered as stable during the observation period, relative to the reference point. Although the majority of PS points in Brussels appear more or less stable, the ERS and Envisat histograms show a clear asymmetry towards positive values, confirming the general trend of uplift in the area.
5. Interpretation and Discussion
PS-InSAR techniques are a powerful tool to measure displacements of moving ground objects from time series of SAR images to millimetric precision [
2]. Although the lower resolution of ERS and Envisat makes it harder to exactly identify individual objects acting as persistent scatterers in the resolution cell. Therefore, for regional studies, the displacements of the objects reflecting the radar signal can be assumed to represent the ground movements of the earth surface and not only the object on top of it.
Identifying the underlying cause of regional displacement patterns can be challenging and different hypotheses should be tested. In the present study, we verified whether the observed slow, decelerating uplift in Brussels can be explained by tectonic processes or whether it is the result of human activity.
Concerning the tectonic setting, Belgium is located in an intraplate zone and the seismic activity is considered as moderate [
30,
31]. According to the records of historic earthquakes held by the Belgian Royal Observatory [
32], the study area has not been affected by significant earthquakes during the last 25 years. Given the absence of any recent seismic activity, the hypothesis of induced tectonic uplift of Brussels can be safely rejected.
Regarding the second hypothesis, many studies have demonstrated that extraction of groundwater can have major impacts on ground stability [
1,
2,
3,
4,
5,
6,
7]. To get a clear view of the evolution of groundwater levels in the study area, piezometric data were harvested from the Brussels Environment Agency database and analyzed.
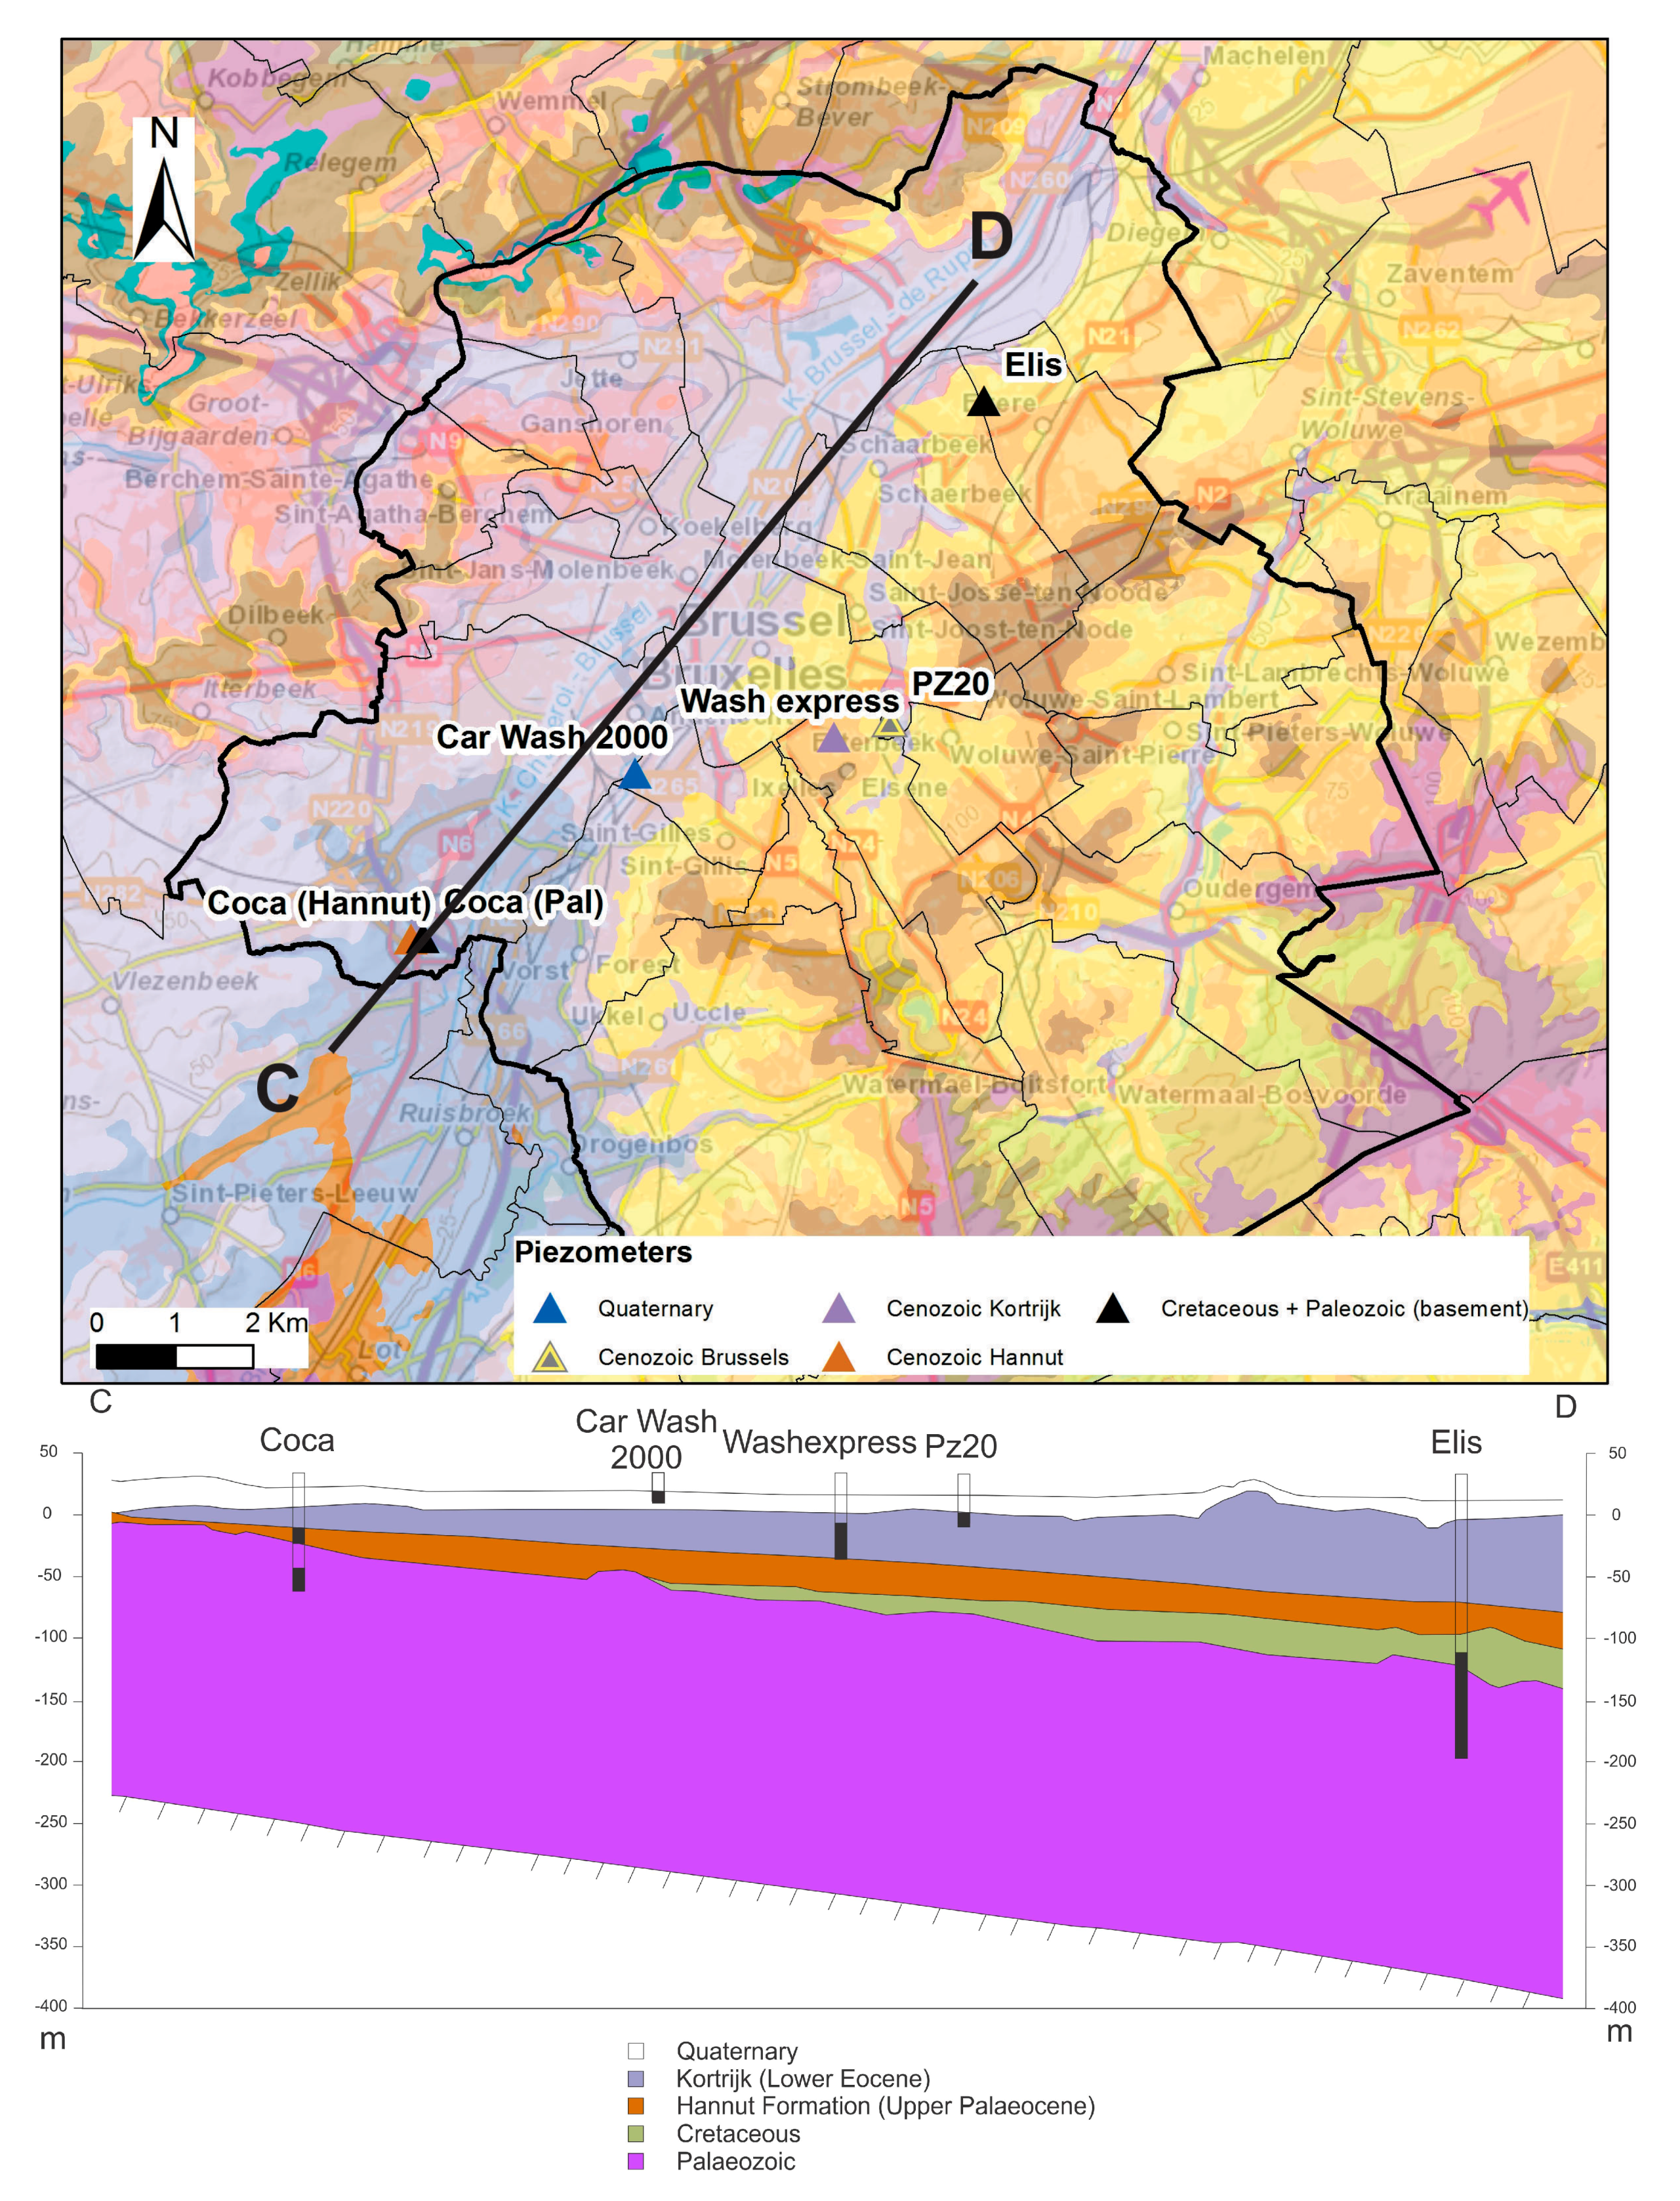
Figure 7 shows the location of six selected piezometers providing continuous and reliable measurements from the main aquifers located in the studied area (
Figure 7). The evolution of their groundwater levels through time are reported and subdivided into the different aquifers encountered for each piezometer site (
Figure 8).
Four of the selected piezometers are placed in the main aquifers below the thick aquitard of the Saint-Maur Member (Kortrijk Formation): piezometers Elis and Coca in the Paleozoic-Cretaceous aquifer, Coca in the Upper Paleocene aquifer (Hannut Formation) and Wash Express in the Lower Eocene (Kortrijk). Two piezometers are placed in the main aquifers above the Kortrijk Formation: PZ20 in the Middle Eocene aquifer (from Diest to Moen) and Car Wash 2000 in the Quaternary aquifer. A synthetic cross-section through the axis of the Senne River is presented at the
Figure 7. The piezometers that are not exactly located in this axis were projected on this axis in order to simplify the understanding of the succession of aquifers/aquitards. No piezometers in perched aquifers were selected for this study as their importance in terms of areal extent and volume is limited.
The evolution of the groundwater levels through time clearly shows a recharge of the deeper aquifers in Brussels since the early/mid-1990s. In the Elis piezometer the groundwater has risen by circa 30 m between 1995 and 2014. In the two Coca piezometers, rising groundwater levels were observed since the mid-1990s. Piezometer Wash Express shows a recharge in the Lower Eocene since 1992; after 2006 the recharge rate has reduced.
In the two shallow aquifers no clear trends of rising groundwater can be observed. Piezometer PZ20 in the Brussels aquifer shows an initially rising groundwater level of circa 1 m between 1992 and 1994, which may be related to the end of a local groundwater extraction within the zone of influence around the piezometer. For the remaining period, the groundwater level is relatively stable, with short-term fluctuations reflecting seasonal effects and/or the effects of local groundwater extractions. Piezometer Car Wash 2000 is measuring in the Quaternary aquifer in the centre of the Senne river valley. Here too, the evolution of the groundwater level does not show a clear trend and appears to be mainly influenced by seasonal effects and/or local groundwater extractions.
Considering the evolution of groundwater recharge in the deep aquifers below the Kortrijk Formation aquitard, increased pore water pressures and elastic rebound of the area seem to provide a plausible mechanism for the uplift observed during the ERS and Envisat timespan (1992–2010,
Figure 5A,B). The centre of the uplift is migrating from the city centre towards northern Brussels during the Envisat timespan. This evolution could be linked either to remaining groundwater pumping activities or either to an increased thickness of the Cretaceous layer or a combination of both. It is well known from drillings data that the Cretaceous is thinner in the SW and thicker towards the NE along the Senne River (
Figure 7). The increased thickness implies a delay in the groundwater recharge due to a higher volume of the unsaturated aquifer. The TerraSAR-X data (2011–2014,
Figure 5C) indicate a decrease in both spatial extent and rate of uplift, which corresponds with the reduced rates of groundwater recharge observed after 2006 (notably in the Elis and Wash Express piezometers). The lateral migration to the west of the uplift should be associated to groundwater recharge, which cannot be proved because this area suffers from a lack of piezometers. As for the Sentinel 1 data (2014–2017,
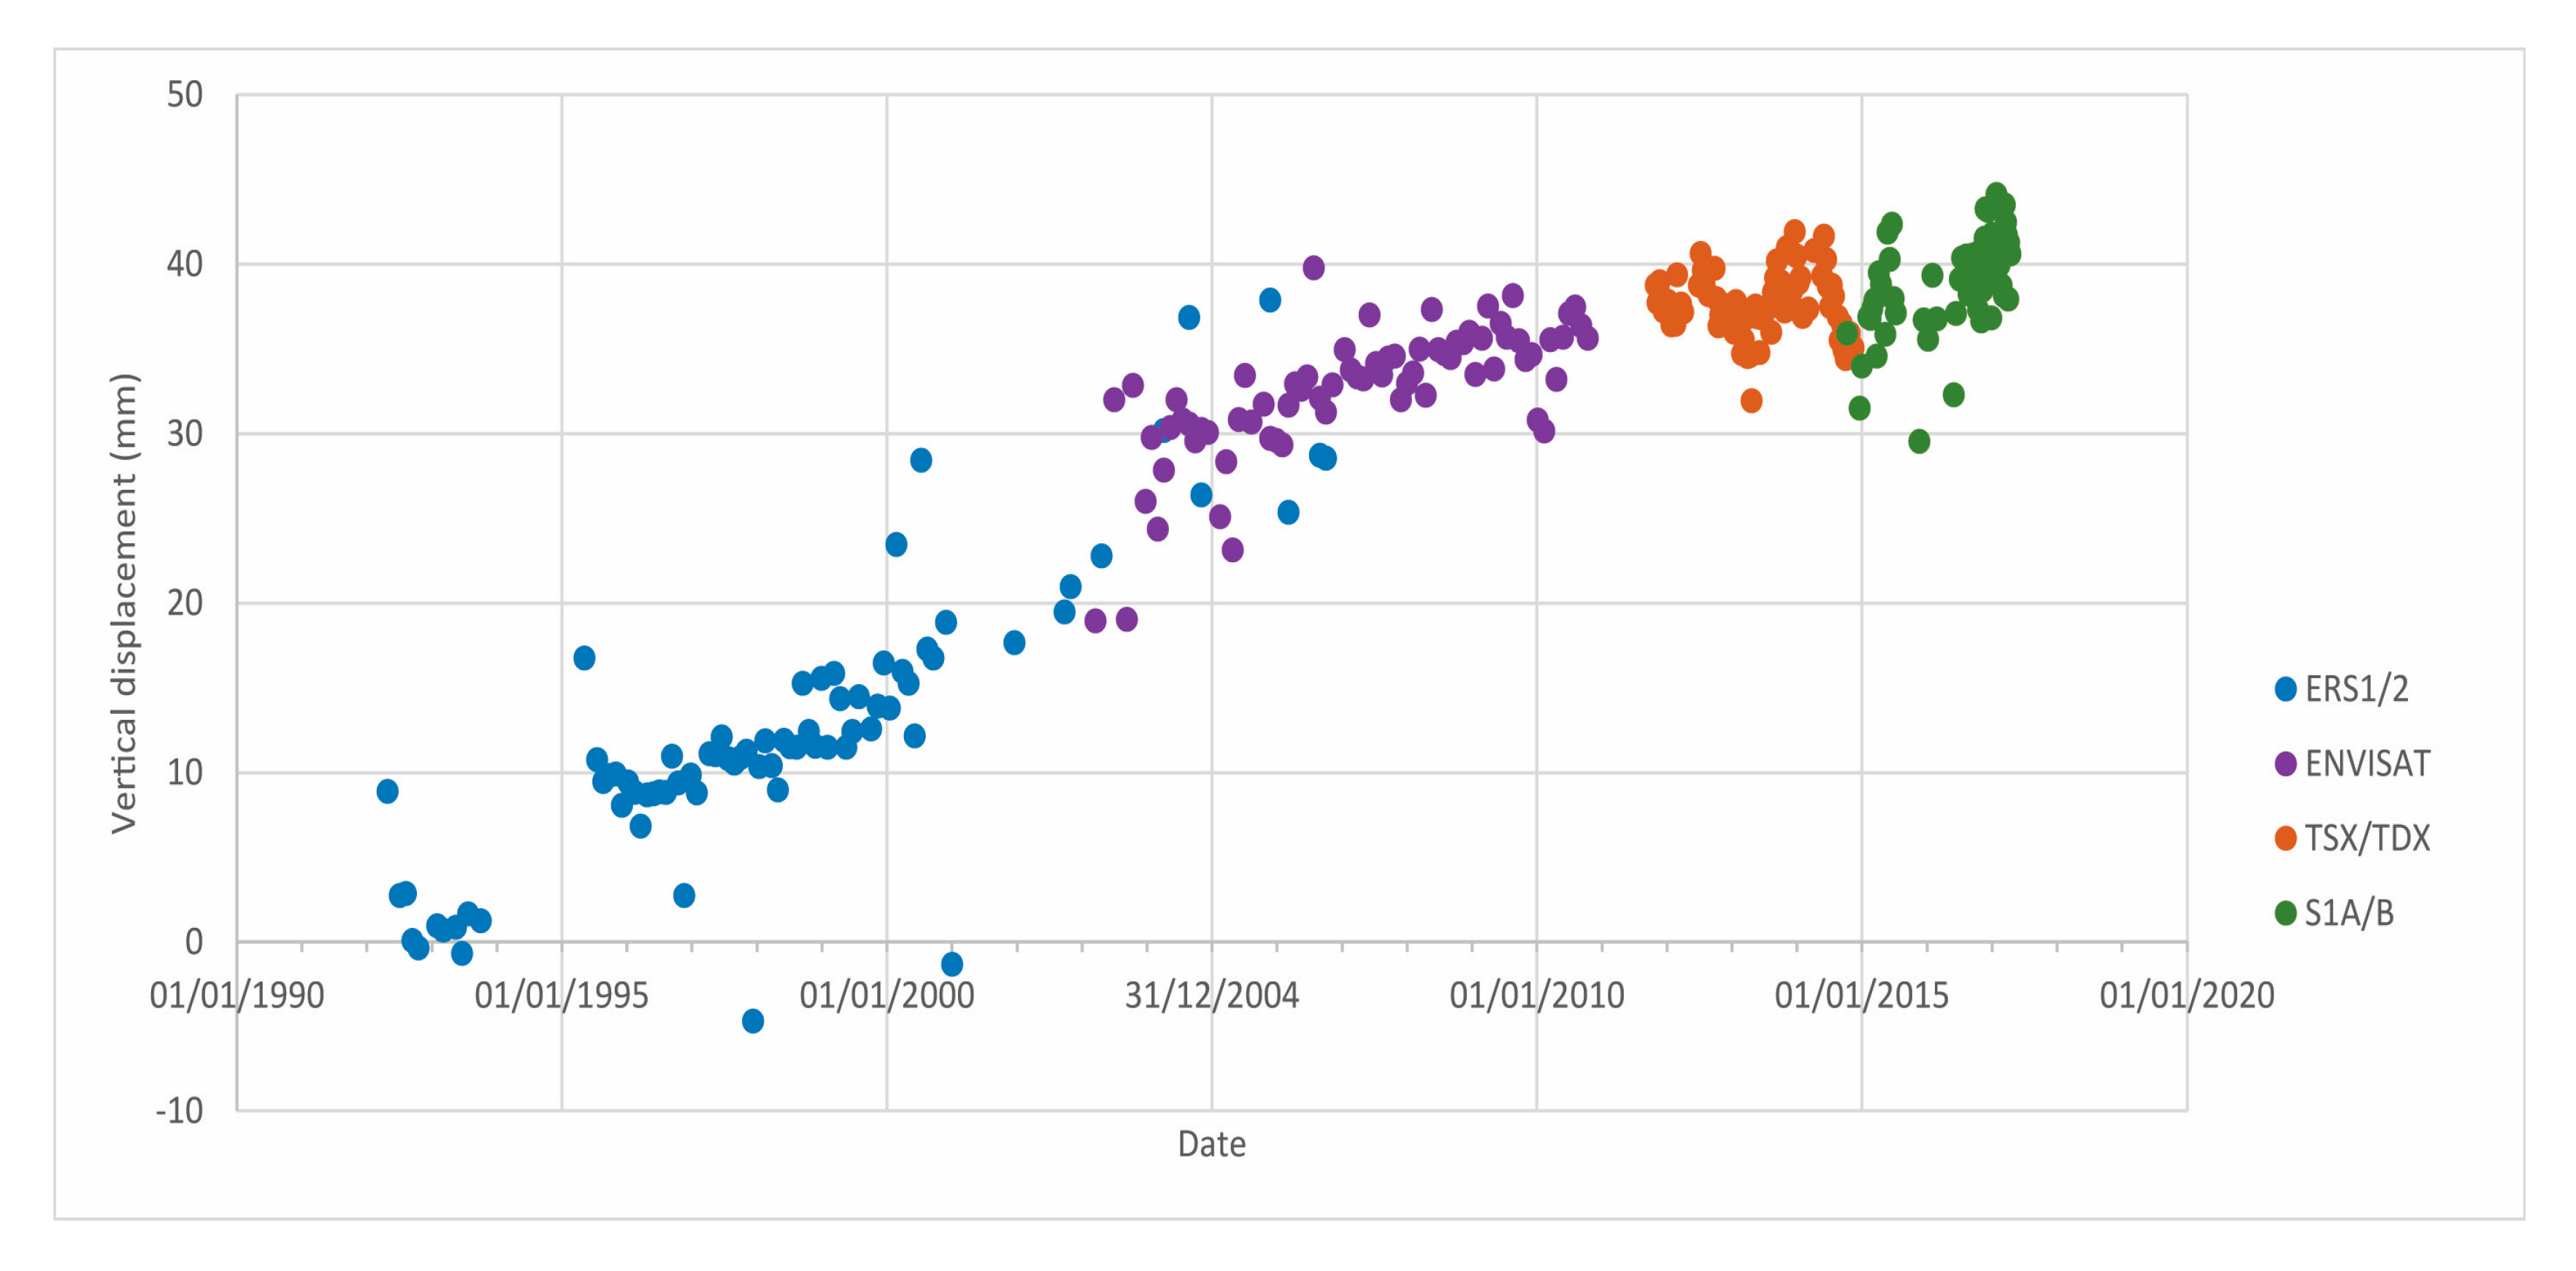
Figure 5D), the uplift has virtually vanished inside the city centre, and has even reversed within the Senne river valley. This declining trend in uplift rates is further exemplified by averaged time series of PS points located in a 50 m buffer around the Tour & Taxis site, NW of the city centre (
Figure 1 and
Figure 5A). The PS points show a steady uplift throughout the ERS and Envisat periods, which gradually declines during the TerraSAR-X timespan and reaching more stable fluctuations during Sentinel 1 timespan (
Figure 9). Another possibility is that the aquifer recharge has ended and the slight negative values of the SAR data are reflecting only a natural compaction process that has been observed in alluvial plains on recent Quaternary sediments. This natural subsidence effect was never highlighted along the Senne River because it was hidden by stronger positive values related to the aquifer recharge.
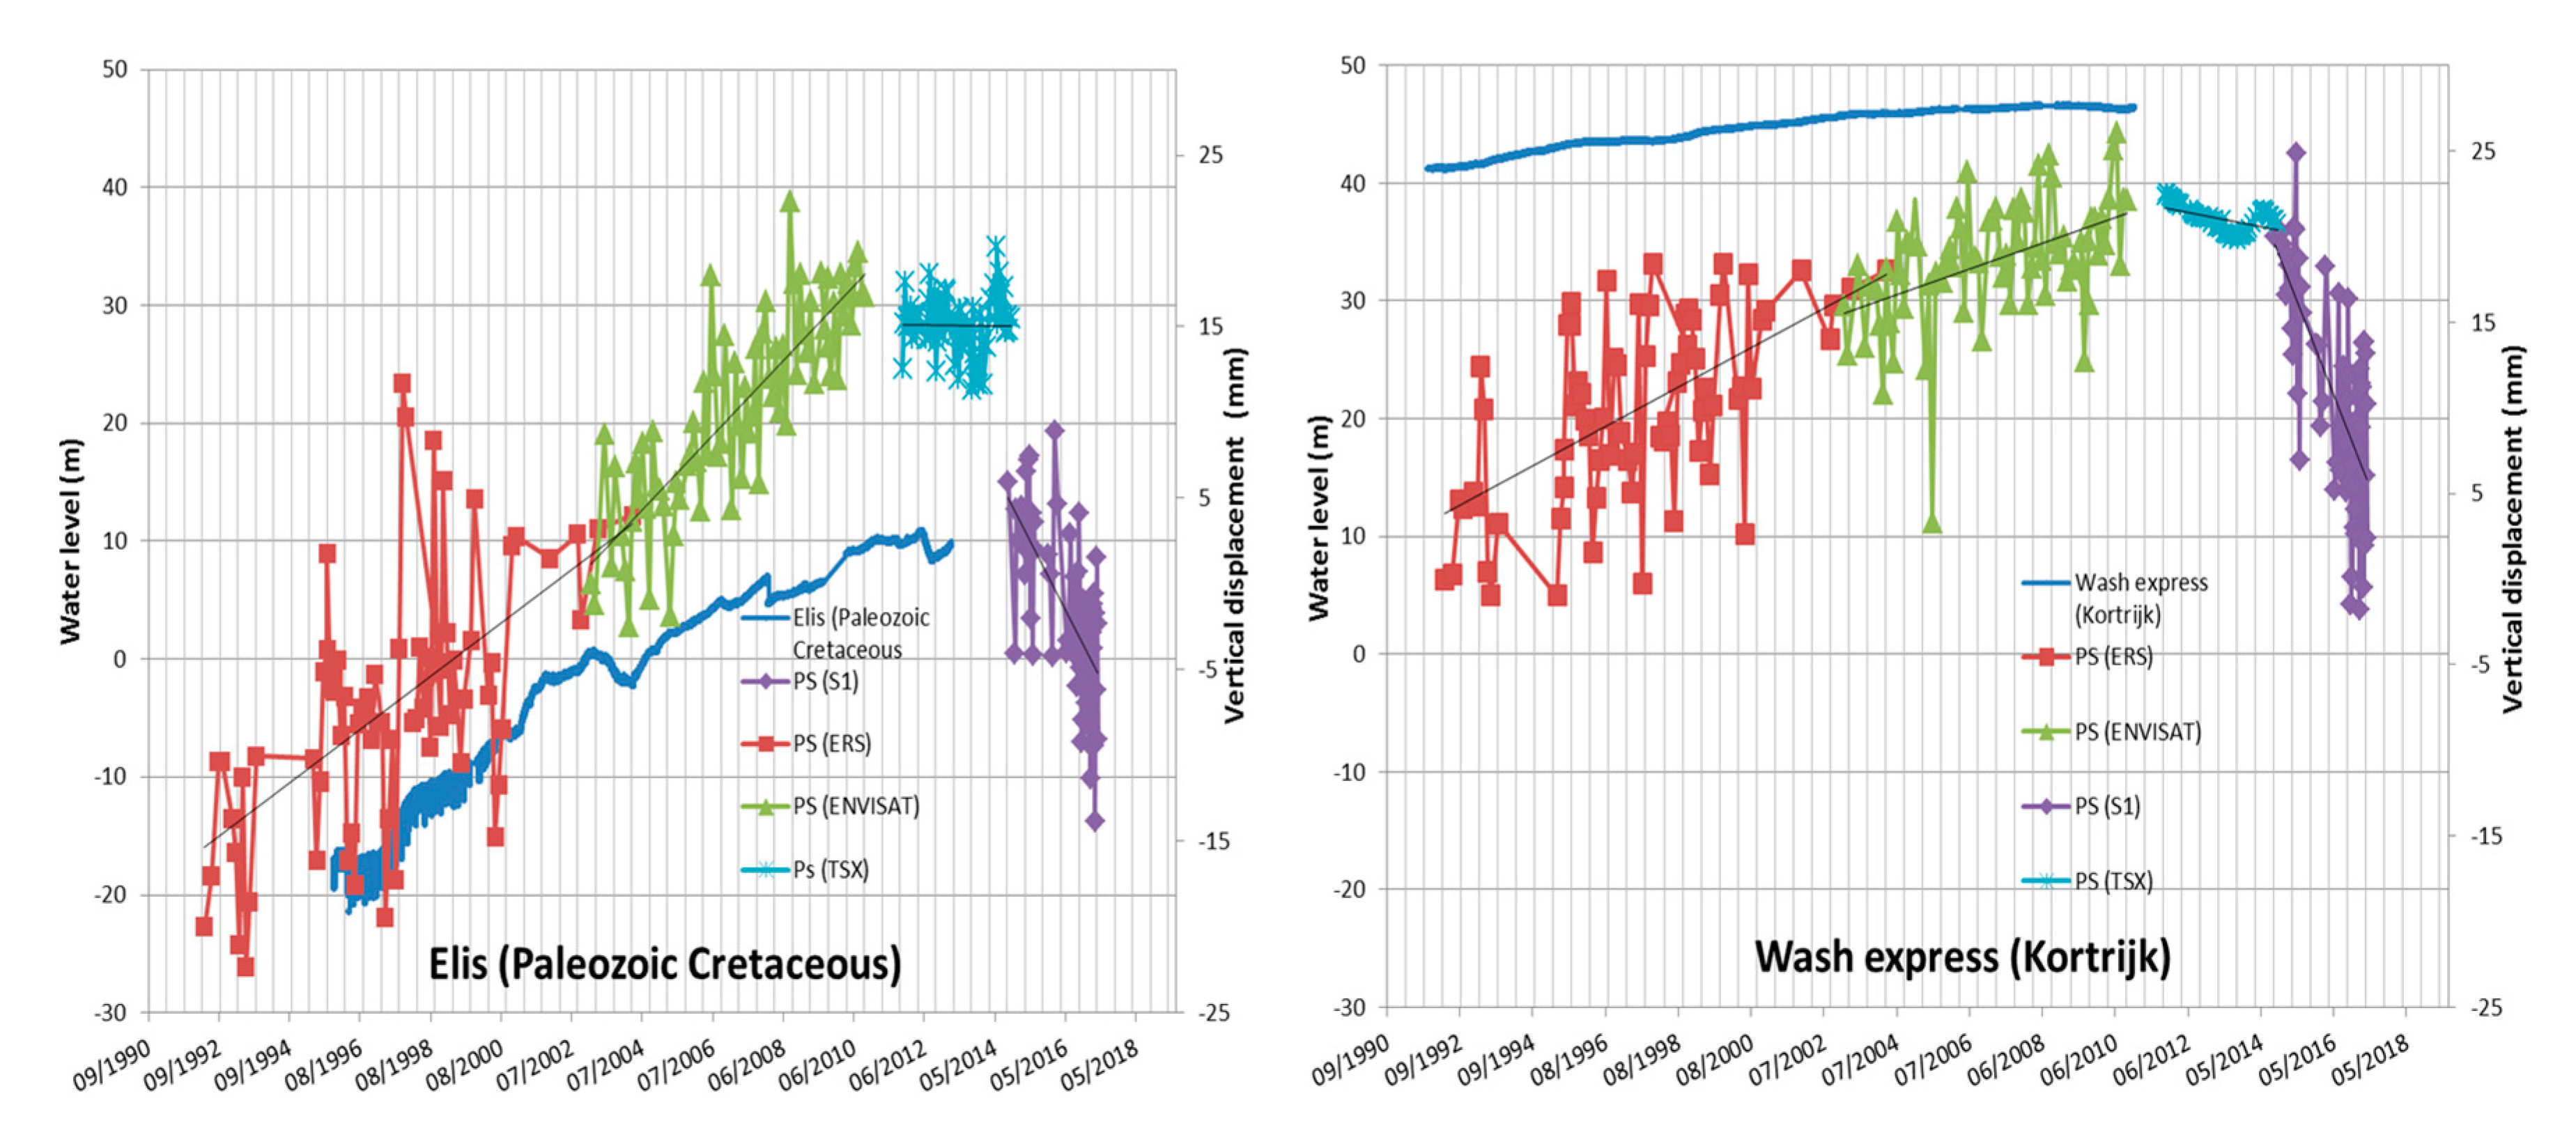
A comparison between the time series of PS located in a 50 m buffer around the piezometers Elis and Wash Express (
Figure 10) was realized. With respect to the scale change between the two types of measurements, it shows that the deformation trends match during the recharge period observed in the piezometers. During the TerraSAR-X period, a decrease of the velocity is visible and corresponds to the reduction of the recharge rate visible in Wash express. This decrease of the recharge rate induced the reduction of the PS velocity but it delayed over time, which is a signal that there is an offset between the recharge and its effect at the surface. The Sentinel 1 PS data show negative velocities of about −3 to −5 mm/year for both piezometers. However, this subsidence trend recorded by Sentinel-1 in the vicinity of the piezometer does not follow the schema of a recharge of the Paleozoic-Cretaceous aquifer recharge. The PS velocity trend in the city centre for the Envisat period of time and TerraSAR-X is characterized by a reduction of the rates towards stable ground movements. Negative PS velocities of Sentinel-1 could be explained by a short-term subsidence event included inside a longer uplifting trend visible since the first ERS SAR image. Unfortunately, the piezometric measurements after 2012 are not available and consequently it is not possible to confront the decreasing velocity trend of PS with the evolution of the deep aquifers.
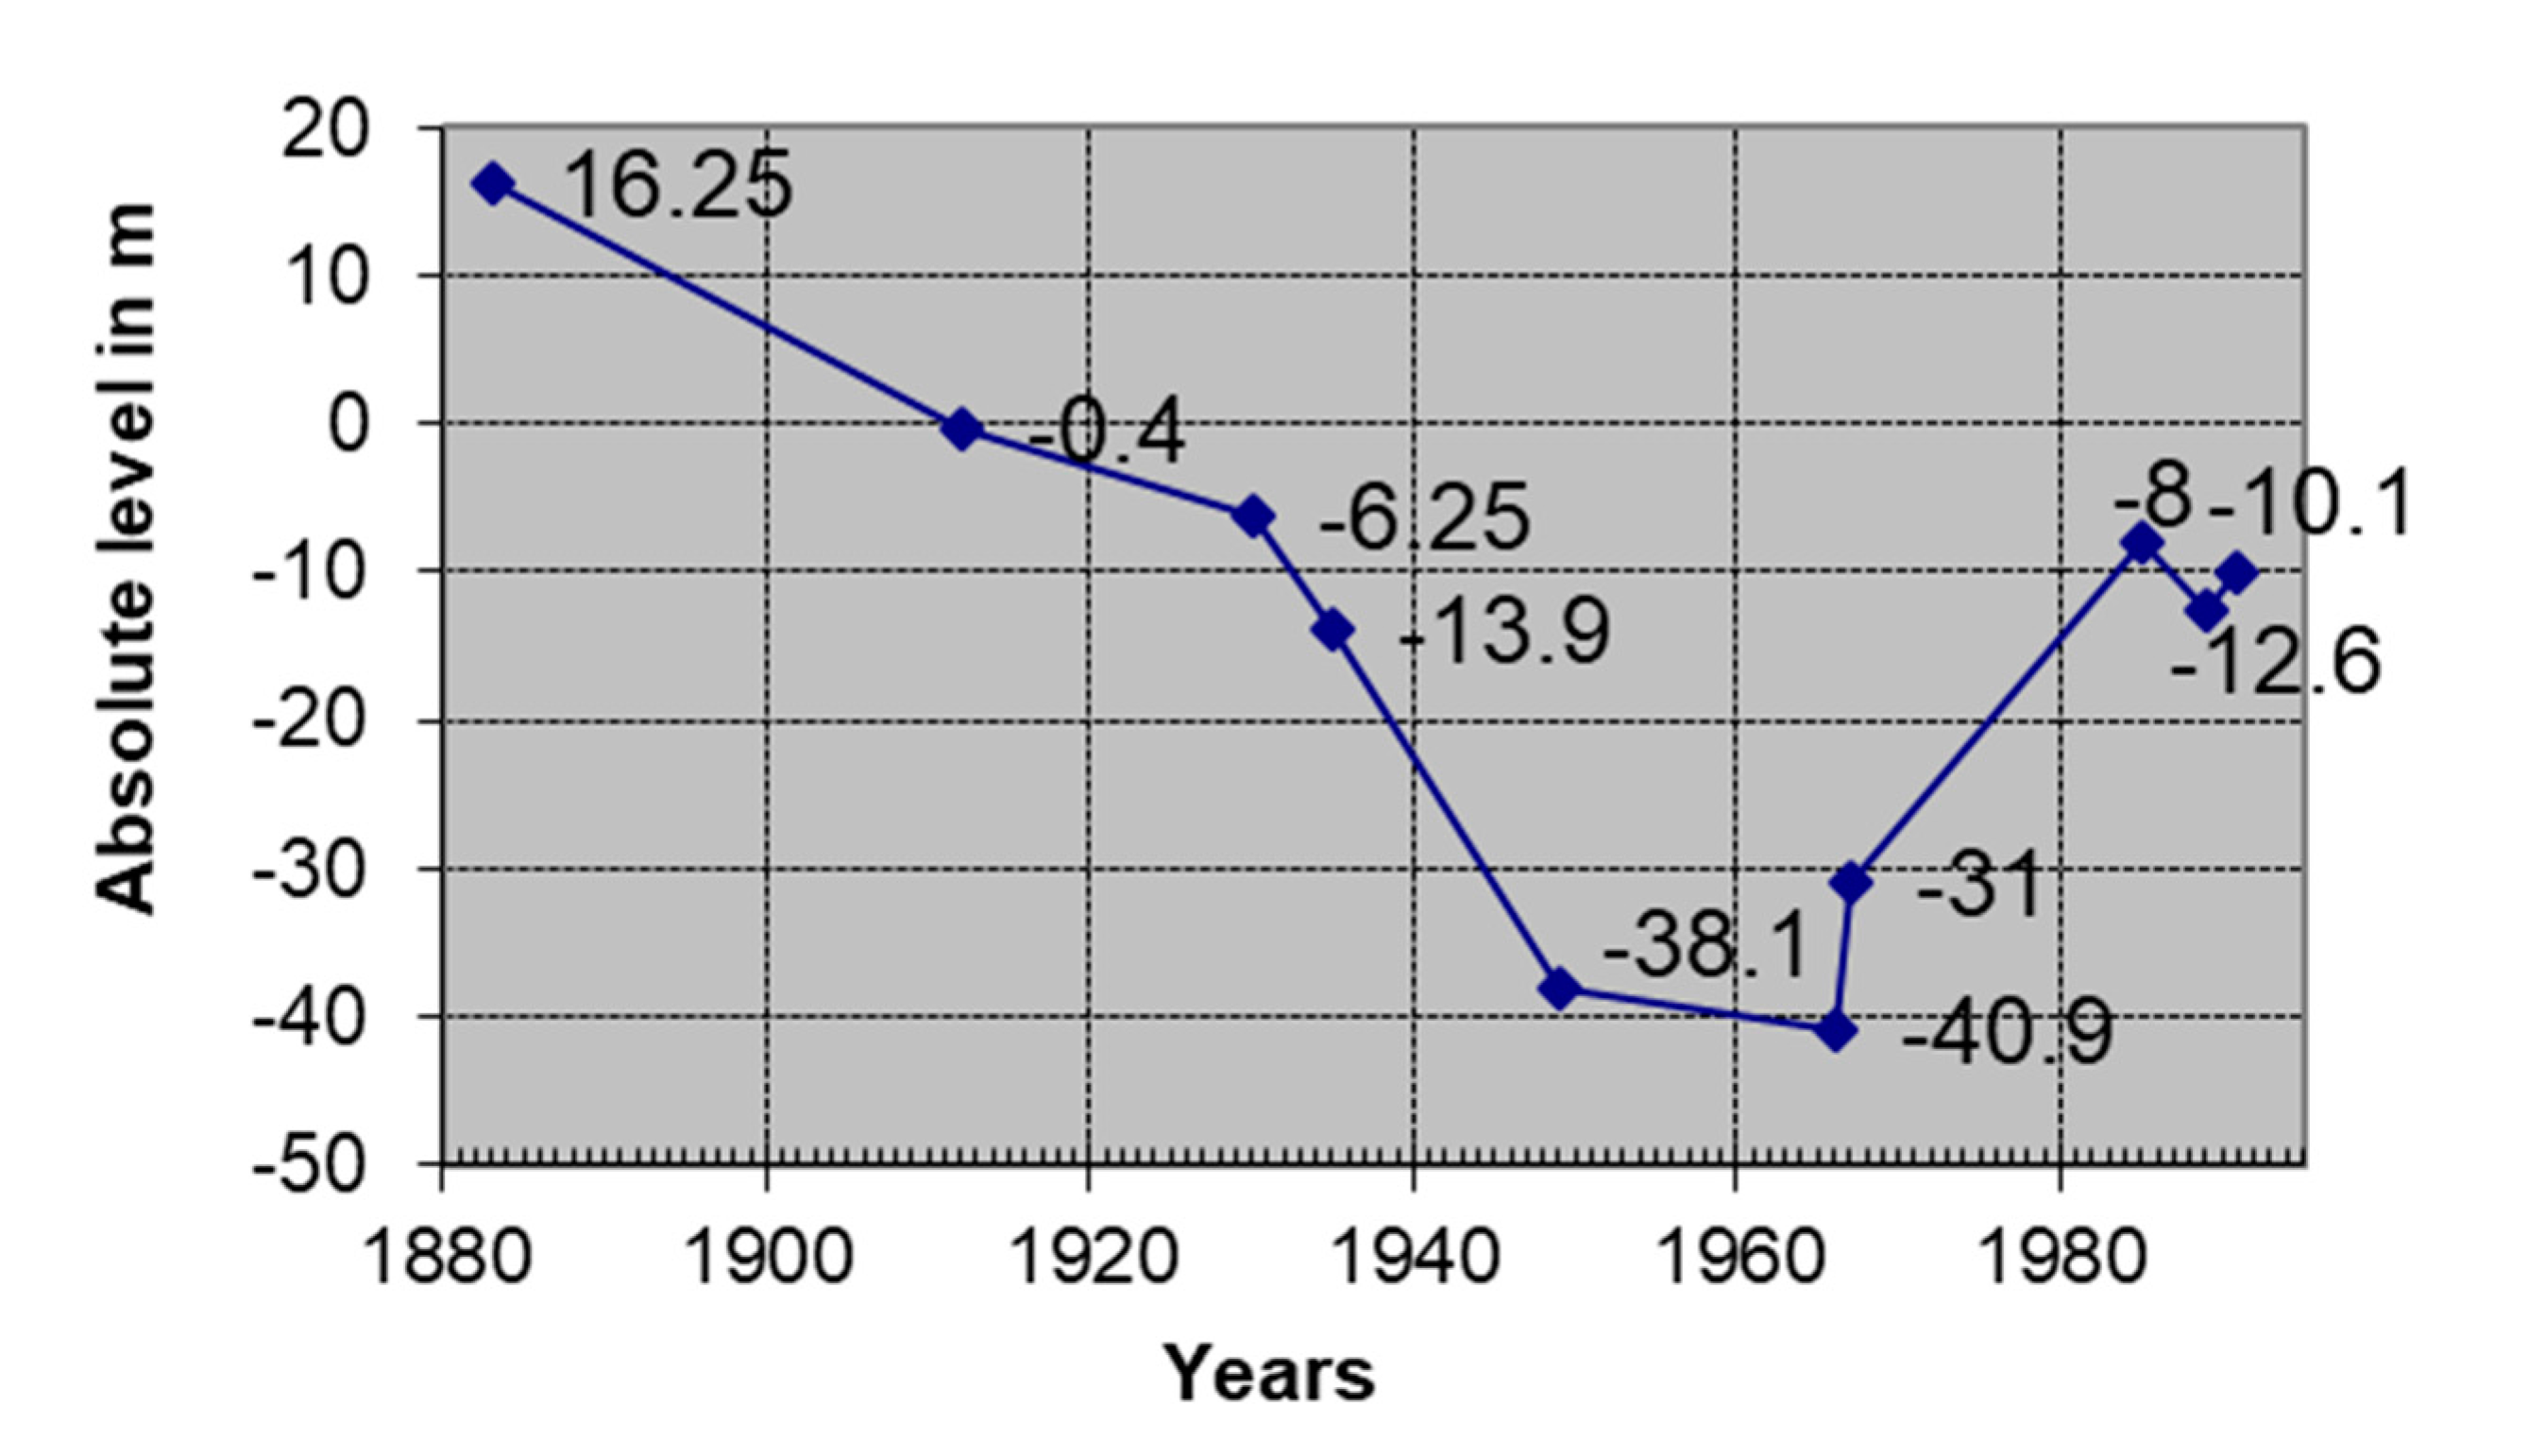
It should be noted that the rising groundwater levels in the Paleozoic and Mesozoic aquifers since the early/mid-1990s are part of a general trend that started in the 1970s. From historical records [
33] it is known that, due to the abundant presence of water-demanding industries in the city centre of Brussels, groundwater levels had dropped drastically between the 1880s and 1960s (circa 50 m, see
Figure 11). It can be reasonably argued that overexploitation of the aquifers would have led to wide-spread ground subsidence in the period of heavy industrialisation. Since the 1970s, heavy industries moved out of the city centre [
34] and groundwater levels began to recover (circa 30 m by the end of the 1980s,
Figure 11).
Several local subsidence features can be identified on the maps of ground displacements (
Figure 3A–D) and may correspond to local groundwater extraction activities or ground settlements. The subsiding phenomenon in Forest/Uccle is observed only in the Envisat data and is probably related to intense groundwater pumping, which lowers the Quaternary aquifer level for civil engineering works locally (confidential report, Brussels Environment Agency). Subsidence along lineament “La” in the TerraSAR-X and Sentinel 1 datasets may be related to engineering works or settlement of the railway embankments at Schaerbeek station, although conclusive records are not available to the authors. Subsidence in the Maelbeek and Woluwe river valleys (
Figure 1) (TerraSAR-X data: linear features “Lb” and “Lc”), as well as in the Senne river valley (Sentinel 1 data: apparent reversal of the direction of movement from uplift to subsidence), may be attributed to the compaction of alluvial deposits [
35,
36,
37]. The natural settlement of the river deposits is intensified by the load of buildings. The ground settlements probably existed during previous observation periods [
38], but may have been obscured by the stronger signal of uplift in the area. As for local phenomena observed in the TerraSAR-X data, their absence in the other datasets may be related to differences in ground resolution.
