Article

Research on the Seismogenic Mechanism of the 2025 Mw = 6.9 Dingri Earthquake

1
School of Transportation and Engineering, Jiangxi Flight University, Nanchang 330088, China
2
Key Laboratory of Low Altitude Geographic Information and Air Route of Jiangxi Education Institutes, Nanchang 330088, China
3
Nanchang Key Laboratory for Low Altitude Air Route Planning and Information Perception, Jiangxi Flight University, Nanchang 330088, China
4
College of Geological Engineering and Geomatics, Chang’an University, Xi’an 710064, China
*
Author to whom correspondence should be addressed.
Geosciences 2026, 16(9), 363; https://doi.org/10.3390/geosciences16090363
Submission received: 2 February 2026 / Revised: 14 March 2026 / Accepted: 18 March 2026 / Published: 10 September 2026
(This article belongs to the Section Natural Hazards)

Abstract

Two earthquakes greater than Mw 5.5 occurred in Dingri County, Tibet, between 2020 and 2025. Whether a triggering relationship exists between them remains debated. Therefore, in this study, we examine the kinematic mechanisms of the two events and seismogenic faults, as well as the post-seismic Coulomb stress changes. The results show that the maximum slip of the 2020 Dingri earthquake is 1.3 m at a depth of about 3.55 km, with a seismic moment of 6.53 × 10¹⁷ N·m, equivalent to an Mw = 5.8 earthquake. Regarding the 2025 earthquake, the maximum slip of F1 fault is 5.1 m at a depth of about 4.5 km, and the peak slip of the F2 fault is 0.46 m at a depth of about 2.5 km. With a seismic moment of 2.82 × 10¹⁹ N·m, the 2025 earthquake matches an Mw = 6.9 earthquake. The Dengmecuo fault exhibits a deformation rate of about 14.4 mm/yr, and the southern section of the fault is nearly locked before the 2025 earthquake, with a slip deficit of about 13.5 mm/yr. The Coulomb stress change five years after the 2020 earthquake is 10,700 Pa, which exceeds the threshold for triggering subsequent seismic activity, indicating a triggering relationship between the two earthquakes.

1. Introduction

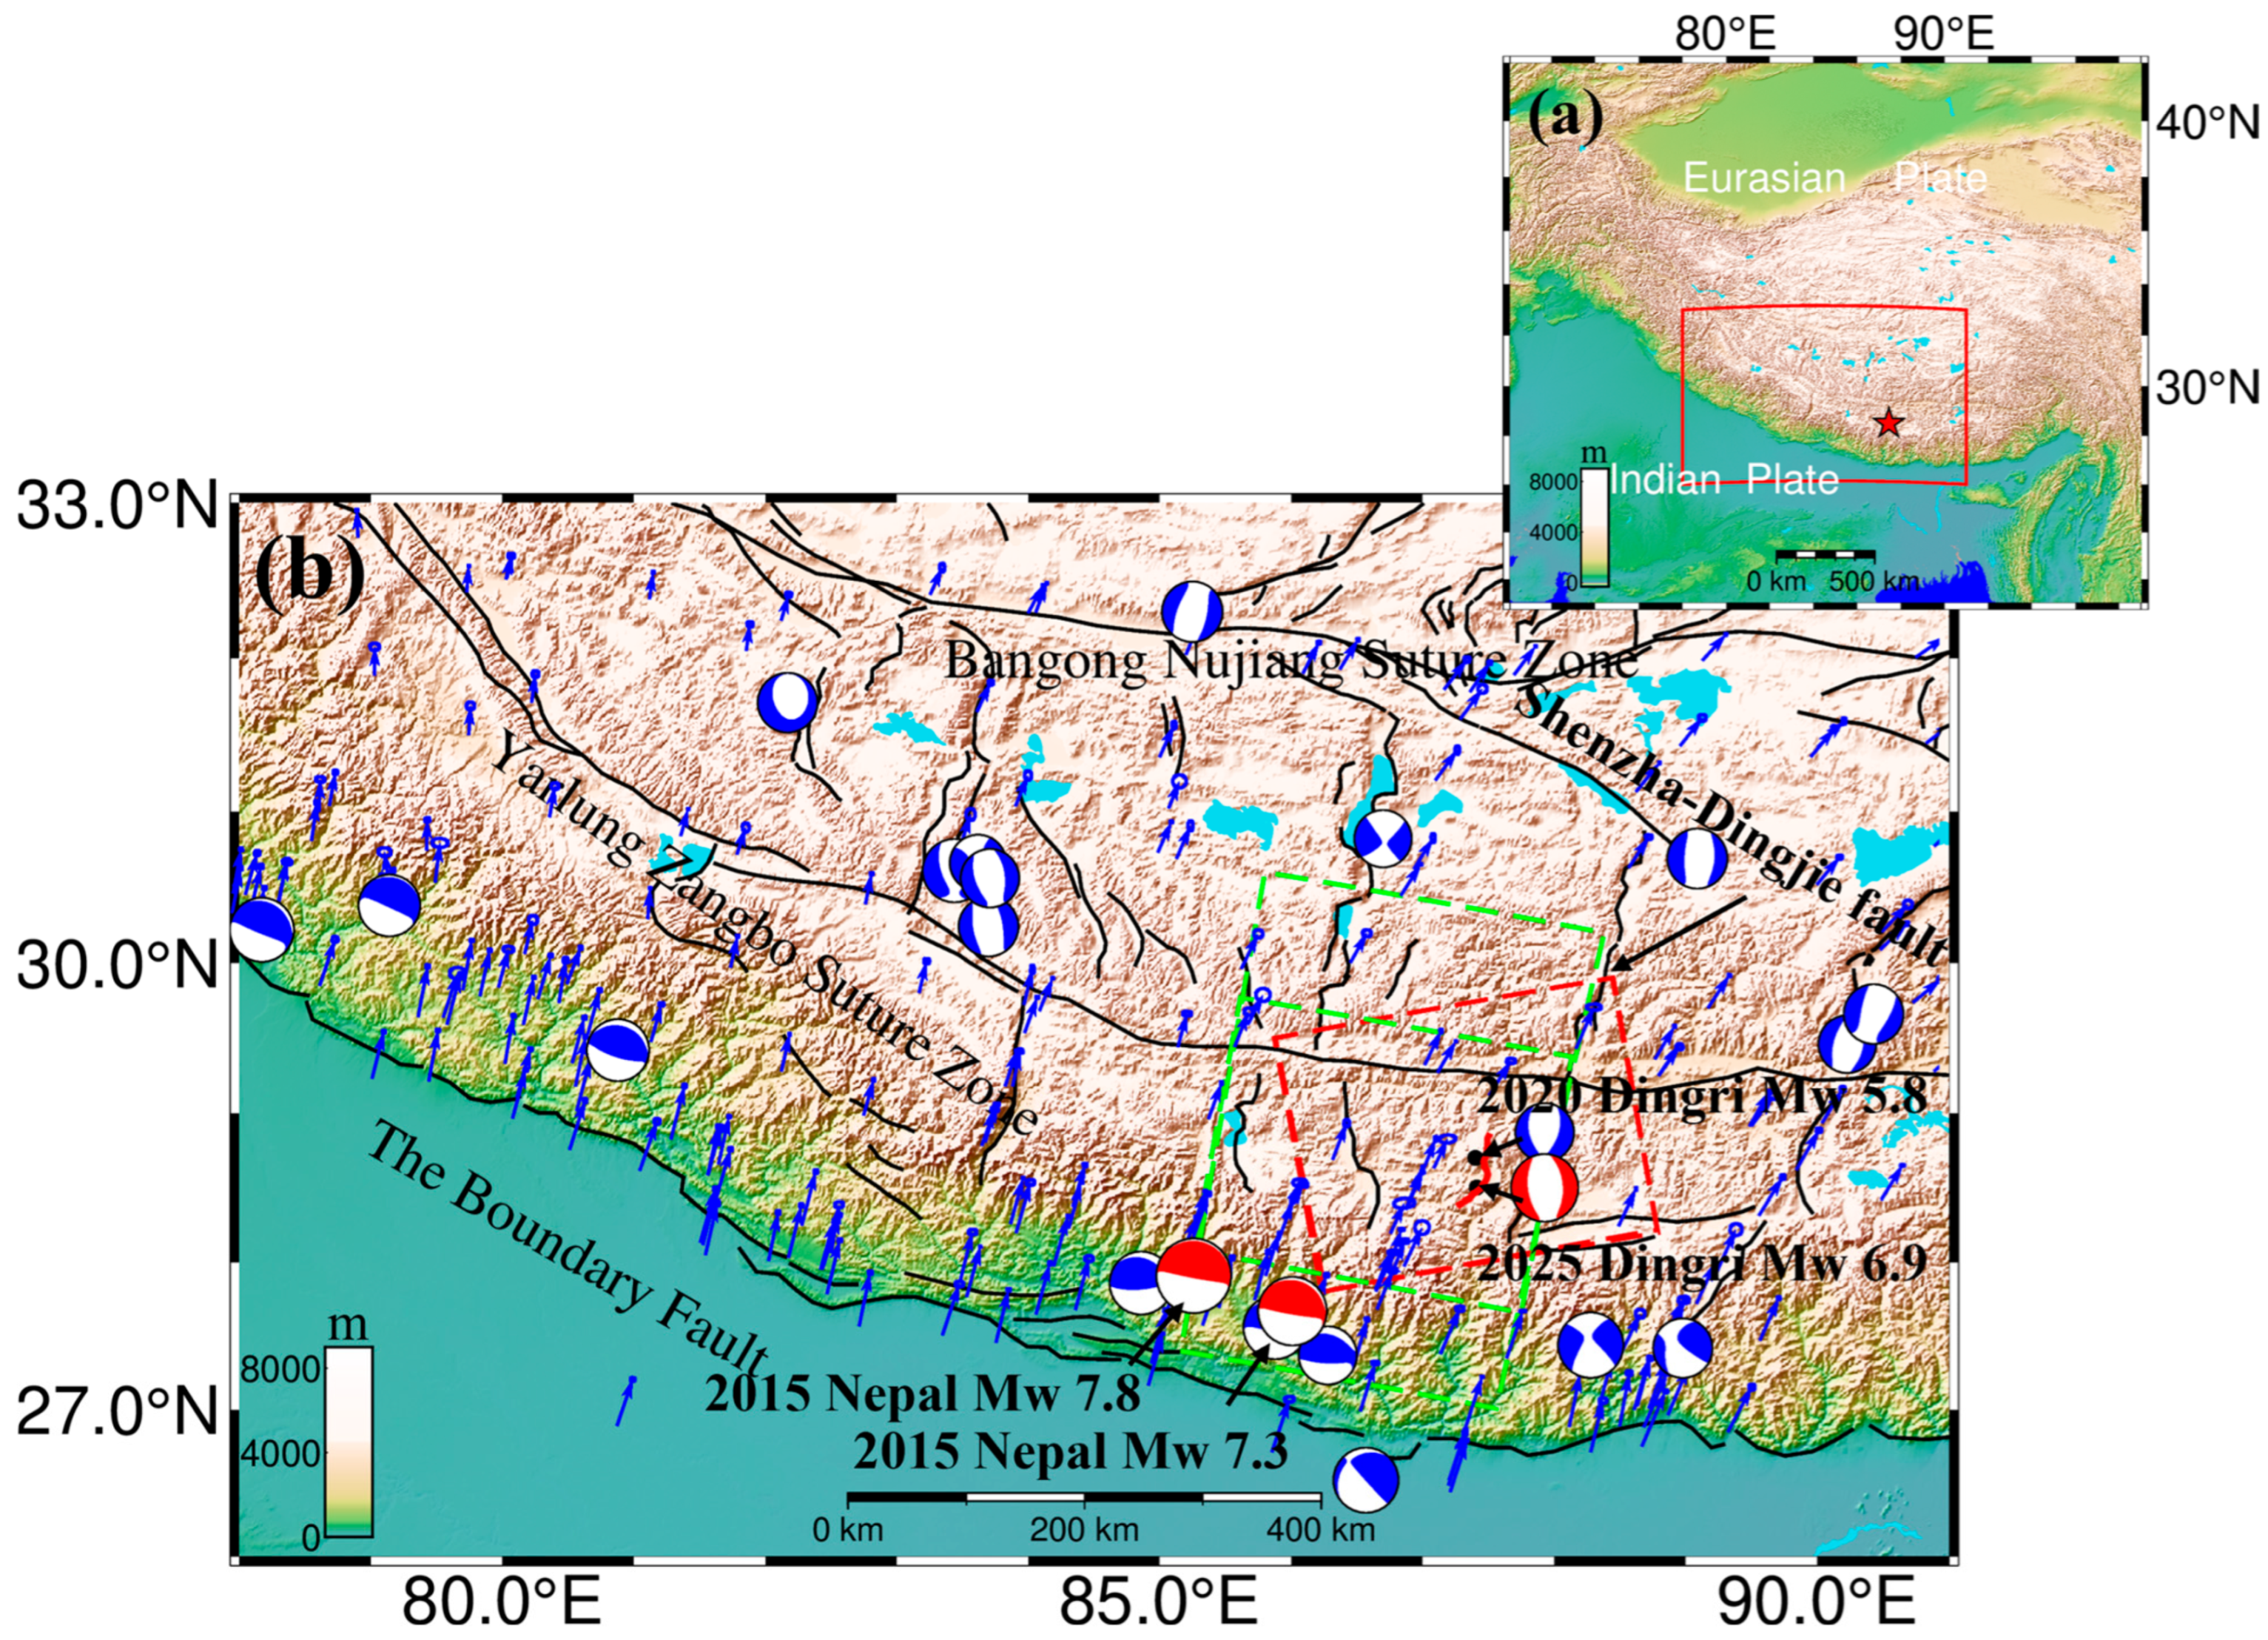
An earthquake measuring Mw = 6.9 took place on 7 January 2025, at 09:05, in Dingri County (2025 Dingri earthquake), situated on the Tibetan Plateau in China (Figure 1). This earthquake led to 126 deaths and left 27,248 houses with damage, ranging from minor to severe. The epicenter is located on the northern slope of the Himalayas, with associated seismic activity also affecting neighboring countries, including India and Nepal. This area falls within the prominent Mediterranean–Himalayan seismic belt, a key reason for its designation as one of the most seismically active areas globally [1]. The Himalayan orogen is 2500 km long, with an average height approaching 6000 m [2]. Formed by the collision of the Eurasian and Indian Plates, Mount Everest (27.9881° N, 86.9250° E) stands as the highest peak above sea level. The subduction and collision of the Indian and Eurasian plates cause the crust to thicken and uplift, thus forming the Tibetan Plateau [3]. The Tibet Plateau (Figure 1) is continuously migrating at an estimated rate of 40 mm/yr, as revealed by GPS measurements [4]. Concurrently, the Tibet Plateau experiences both a northward compressive force and an east–west tensional force, resulting in the development of several north–south oriented rift valleys, among them the notable Shenzha-Dingjie fault (Figure 1b) [5]. The 2025 Dingri earthquake is a typical crustal earthquake, with epicenter (87.45° E, 28.5° N) and a focal depth of about 10 km. Notably, an Mw = 5.8 earthquake (the 2020 Dingri earthquake) had also struck Dingri County on 20 March 2020 [6]. The 2020 Dingri earthquake, centered at (87.42°E 28.63°N) on the southwestern Tibet Plateau with a 12 km focal depth, is identified as a normal-fault earthquake [7]. Both the 2020 and 2025 Dingri earthquakes are originated from the north–south-oriented Dengmecuo fault (Figure 1). These two Dingri earthquakes are normal-fault earthquakes, differing from thrust-fault earthquakes (like the 2015 Nepal Mw 8.1 earthquake), found on the southern slope of the Himalayas, and are primarily caused by the collision of the Eurasian and Indian Plates [8].
Figure 1. Tectonic background of the two Dingri earthquakes: (a) the red rectangle indicates the study area and the red star indicates the epicenter of the 2025 Dingri earthquake; (b) the red and blue beach balls indicate the focal mechanism. Available online: https://www.globalcmt.org/ (accessed on 7 March 2026). The red and green dashed rectangles indicate the satellite coverage. The black lines are faults. The red line indicates the Dengmecuo fault. The colormap is the elevation. The blue arrows denote the GNSS velocity field. Available online: https://data.earthquake.cn/ (accessed on 7 March 2026).
Geosciences 16 00363 g001
Based on Coulomb stress changes, some researchers have proposed that the 2020 Dingri earthquake was jointly triggered by the Mw 7.9 Nepal earthquake in 2015 and four subsequent seismic occurrences in Dingri County [9,10,11]. Despite both being located within the Himalayan orogenic belt, the seismic characteristics and underlying causes on the northern side of Mount Everest exhibit significant differences from those on the southern side [12]. For instance, the 2015 Mw 7.8 Nepal earthquake, which took place on the southern flank, was a thrust-faulting earthquake resulting from tectonic compression directed north–south [13]. However, the 2020 and 2025 Dingri earthquakes occurring on the northern slope of Mount Everest are categorized as normal faults, originating from east–west directed tensional forces. The precise origin of the 2025 Dingri earthquake and, specifically, whether it was triggered by the 2020 Dingri earthquake or represents an inherent stage in the broader orogenic development, warrants further inquiry. As a result, this study meticulously examines not only the Coulomb stress changes following these two earthquakes but also the fault inversion of the Dengmecuo fault between the 2020 and 2025 Dingri earthquakes, ultimately determining fault locking, slip deficits, and Coulomb stress changes for a complete understanding.

2. Data and Methods

2.1. The DInSAR and POT Methods

The Satellite-1 A images, which cover the periods before and after both Dingri earthquakes (Table 1), were processed with two techniques—Differential Interferometric Synthetic Aperture Radar (DInSAR) and Pixel Offset Tracking (POT)—to generate interferograms and displacements [14]. Both methods were implemented using professional Gamma software (20231201)developed by GAMMA Remote Sensing Research and Consulting AG in Bern, Switzerland [15]. Achieving sub-pixel accuracy required image registration for both approaches, and a digital elevation model (DEM) was also used to eliminate the topographic phase [16]. A multi-looking ratio of 10:2 was selected to suppress speckle noise [17]. The minimum-cost flow (MCF) method was employed for phase unwrapping to obtain true deformation. In contrast, phase unwrapping is unnecessary for the POT technique, because it relies on the intensity information within the images. Additionally, Generic Atmospheric Correction Online Service (GACOS) was selected as an atmospheric correction tool. It is developed by the University of Newcastle, UK and is designed to mitigate the impact of atmospheric delays on deformation monitoring [18]. Finally, the interferograms and displacements were obtained after geocoding (Figure 4, Figure 5 and Figure 6).

2.2. The GNSS Data

A high-resolution 3D velocity field for the Tibetan Plateau was established using GNSS data from 750 stations, showing a rate of approximately 40 mm/yr from the Indian plate to Eurasia [19]. Additionally, a 3-D crustal deformation of the Tibetan Plateau was built using GNSS data (1999–2016), and the Himalaya and the northeastern plateau have an uplift rate from 1.3 to 1.7 mm/yr [20]. For this study, 275 GNSS stations were collected covering northern India and southern Tibet, at the National Earthquake Data Center in China [21]. Based on GNSS velocity fields, we have computed the dilatation, rotation rate, maximum shear strain, principal strain, and the second invariant (Figure 7) [22].

2.3. The SM-VCE Method and PSGRN/PSCMP Program

The conventional approach for three-dimensional displacement is the weighted least square method (WLS), which can be settled pixel by pixel [23]. The accuracy depends on coherence to some extent and lacks spatial constraints between adjacent pixel points. Hence, in this study, the strain model and variance component estimation method (SM-VCE) were selected to achieve the three-dimensional displacement [1]. Although the DInSAR method could reach displacement in Line of Sight (LOS), it does not include the N-S component. However, the POT method could offer the azimuth displacement for three-dimensional displacement. Even though the azimuth displacement might be affected by noise, it is nevertheless crucial to consider it a key constraint for three-dimensional displacement [24]. Consequently, the range displacements from the POT method were not included in the construction of the three-dimensional displacement. In the SM-VCE method, windows of 40 × 40 pixels were selected, with a resolution of 30 m × 30 m, corresponding to the real 2 km × 2 km. Finally, we were able to acquire the three-dimensional displacement, as shown in in Figure 8.
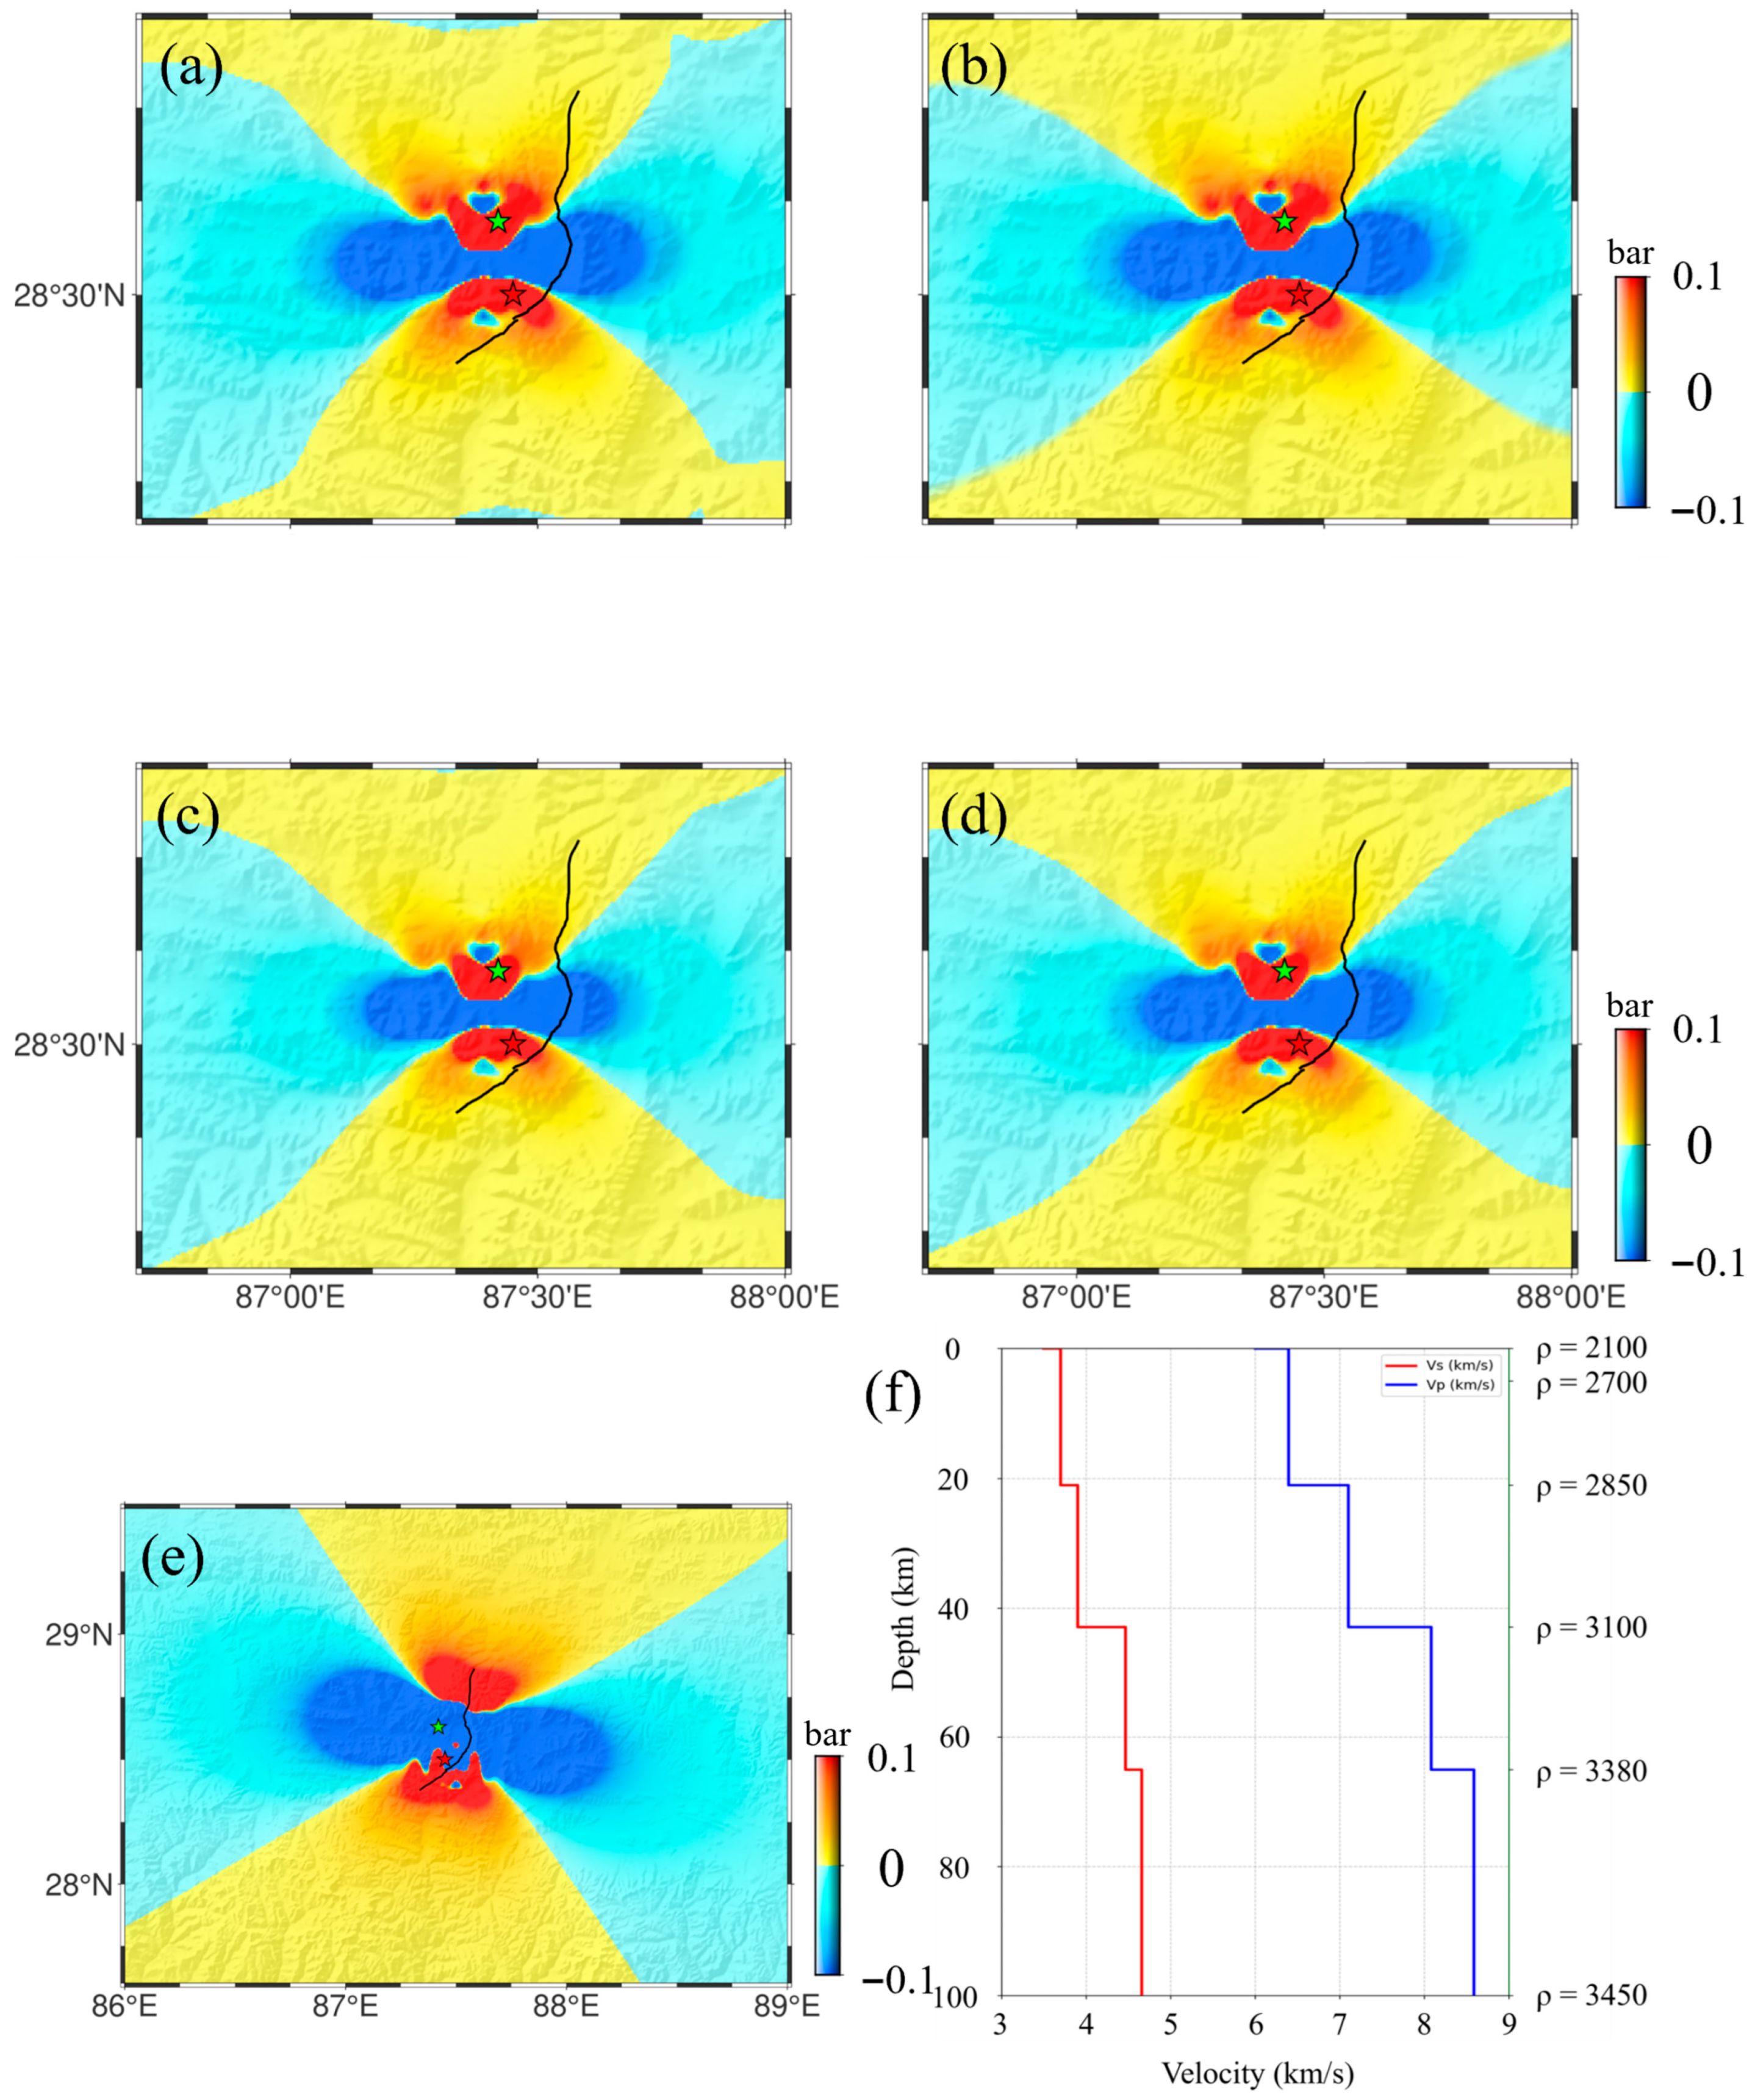
After the 2020 Dingri earthquake, the surface rupture modified the stress conditions within the epicenter area. This modification is a key manifestation of the ongoing seismic dynamic process and often has a strong relationship with aftershocks [25]. Therefore, the co-seismic and post-seismic Coulomb stress changes were calculated for the two Dingri earthquakes with the PSGRN/PSCMP program, constrained by the focal mechanism [26,27]. For this study, a model of a horizontal layered Earth medium was developed based on the crustal architecture of the relevant region, with an effective friction coefficient (μ′) of 0.4 (Figure 9f). This model calculates the Green’s function for displacement, strain, and stress at any point in space, all resulting from a unit seismic moment. Assessment of the triggering effect largely relies on the magnitude of the Coulomb stress changes. When this value is positive and greater than 0.01 MPa (1,000,000 Pa), the former earthquake is considered to have triggered the latter. With respect to the 2020 Dingri earthquake, both co-seismic and Coulomb stress changes at 1 year, 3 years, and 5 years after the seismic event were obtained at a depth of 5 km. Meanwhile, for the 2025 Dingri earthquake, the co-seismic Coulomb stress changes are at a depth of 10 km (Figure 9). The reason why post-seismic Coulomb stress changes were calculated over different time scales, such as 1 year, 3 years, and 5 years, is primarily to account for the rheological properties of the crustal medium, which is the adjustment and migration process of stress over time following an earthquake. Co-seismic Coulomb stress changes refer to the instantaneous stress changes generated at the moment of the earthquake (elastic response). After the earthquake, due to stress adjustments caused by mechanisms such as viscoelastic relaxation of the crust, stress begins to migrate to a wider area, potentially triggering medium- to long-term earthquakes. The stress accumulation from long-term tectonic loading can be used to assess the prolonged impact of an earthquake on the stress state of regional faults.

2.4. The SBAS-InSAR and TDEFNODE Program

To better study the impact of the 2020 Dingri earthquake on the 2025 Dingri earthquake, we acquired 255 scenes of Sentinel-1A data spanning from 2020 to 2025, with the image coverage shown in Figure 1. Moreover, the SBAS-InSAR method was selected with the GAMMA software to obtain the long-term deformation rate [28]. The images were scheduled with a 12-day temporal sampling interval to reduce errors and improve accuracy. Image registration must be at the sub-pixel level, and the DEM in 30 m resolution from the Shuttle Radar Topography Mission (SRTM) was selected to reduce the topographic phase. The perpendicular baseline (B⊥) of 200 m was applied to reduce incoherence. In addition, the minimum-cost flow (MCF) method, with a coherence threshold of 0.35, was applied for phase unwrapping [29]. In the end, the deformation rates were reached after geocoding and phase to deformation conversion (Figure 10).
The TDEFNODE program was selected for the fault inversion to reach the fault locking, slip deficit, and seismic moment (Figure 10 and Figure 11) [30,31]. The simulated annealing method and grid search method were applied in the negative dislocation model [32,33]. Before the fault inversion, it was first necessary to reduce data redundancy and improve efficiency with the Quadtree down-sampling method. For the inversion, two distinct datasets were formed by combining the GNSS with ascending and descending InSAR measurements. The InSAR measurements were derived from the SBAS-InSAR method. The term fault locking is usually represented by Phi (0 ≤ Phi ≤ 1) [34]. A value of 1 for Phi denotes full fault locking, whereas 0 signifies a free-slip condition. If Phi is between 0 and 1, it indicates a partial creep state. Therefore, the Dengmecuo fault is defined as a unified structure, with the left block as the footwall. With a strike of 65°, the fault consisted of 20 nodes oriented north to south, with a depth of 30 km. The fault inversion takes multiple trials until the Xn2 is close to 1.
X n 2 = S U M γ 2 ( s F ) 2 / d o f
γ is the residual (difference between observed and predicted values), s is the standard deviation, F is the scale factor, and dof is the degrees of freedom (number of observations minus number of free parameters).

3. Earthquake Rupture Model

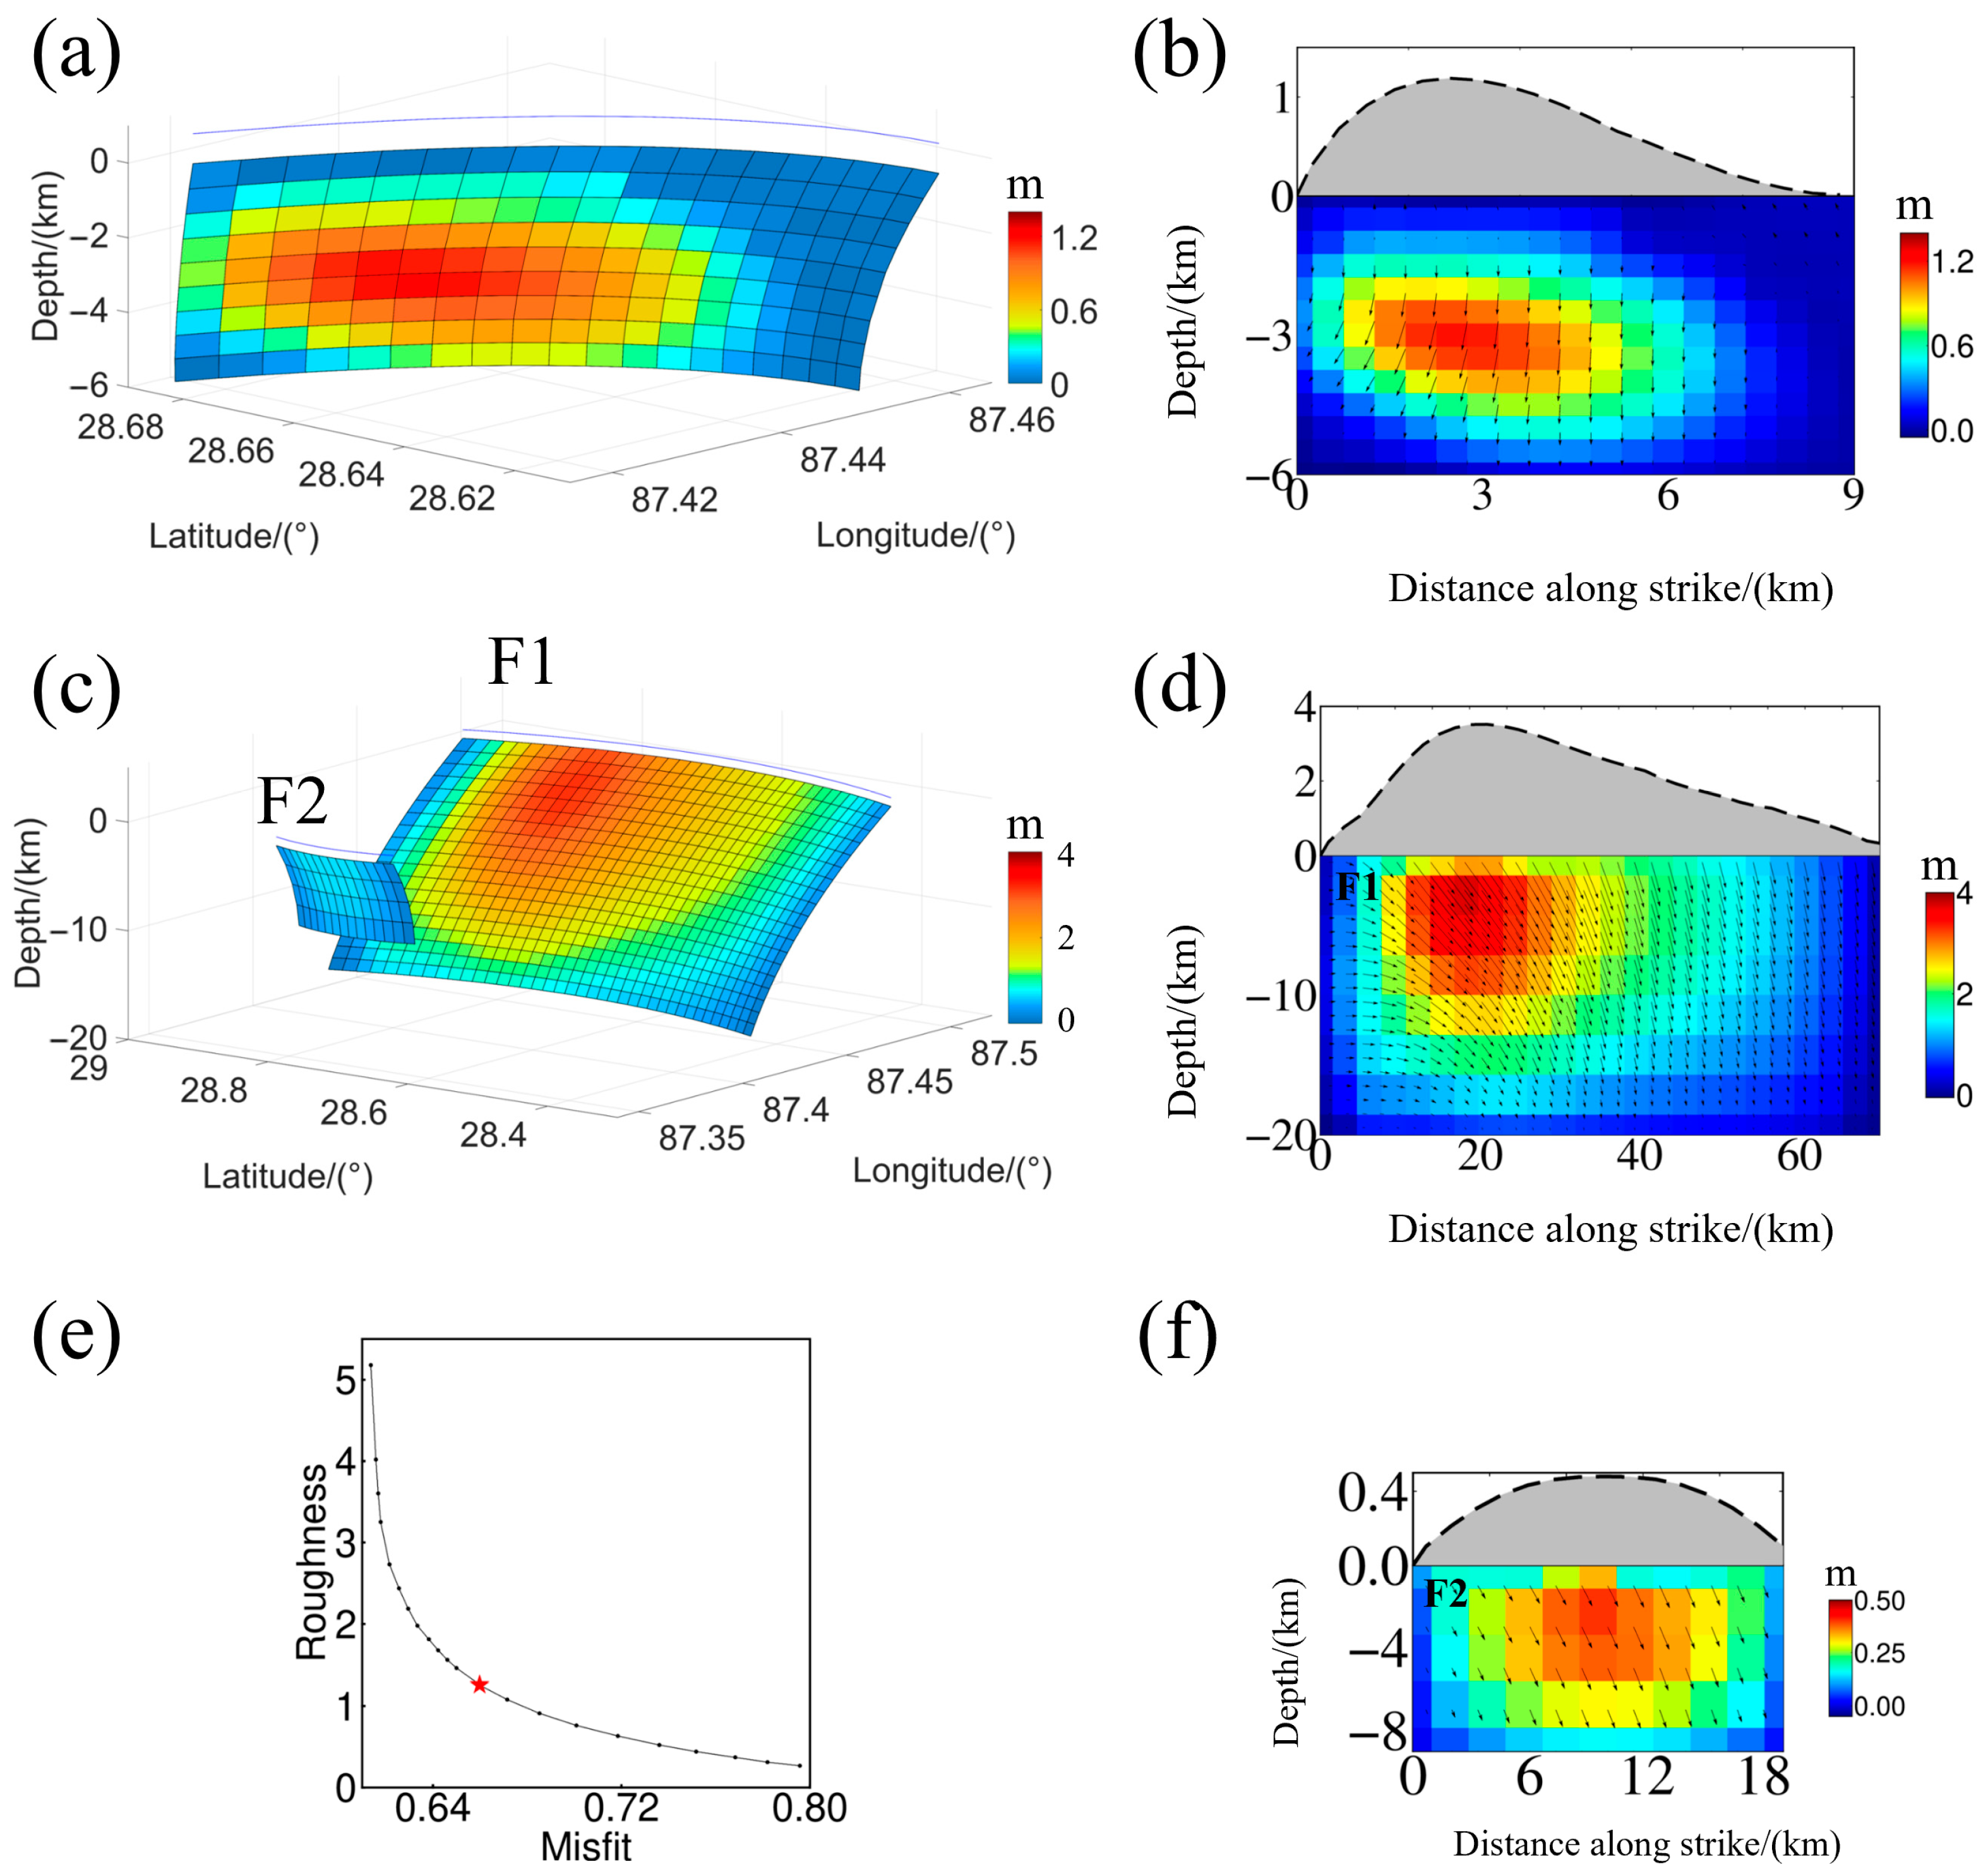
In this study, the elastic half-space model is applied for slip inversion, with a two-step method including the uniform and distributed slip model [35]. It is of vital importance to reduce data redundancy with the Quadtree down-sampling method [36]. Hence, the data points for slip inversion are 928 points for the ascending track and 913 points for the descending track in the 2020 Dingri earthquake. For the 2025 Dingri earthquake, there are 1300 and 1489 points for the ascending and descending tracks, respectively. To determine the geometric parameters of the seismogenic fault, we employ a uniform slip inversion model constrained by ascending and descending displacement data. A Bayesian approach, based on Markov Chain Monte Carlo (MCMC) sampling, is adopted, combined with a grid search algorithm to obtain the fault geometry parameters [37]. The inversion process involved 150,000 nonlinear iterations to ensure parameter convergence, ultimately obtaining the optimal fault location and geometric parameters (Figures S1 and S2 in Supplementary File). Then, in the second step, the steepest descent method (SDM) model is used to invert the fault slip, with the help of the fault rupture line and focal mechanism under the constrain of SAR and GNSS data (Table 2) [38]. If the rupture of F2 is assumed to be continuous, a second-order Laplacian smooth matrix is applied [39]. The optimal smoothing factor is determined by the trade-off curve between the model roughness and data misfit (Figure 2). For the 2020 Dingri earthquake, the model is extended along the strike and the dip, with dimensions 9 km × 6 km, while for the 2025 Dingri earthquake, the dimensions are 75 km× 20 km. For 2020 Dingri earthquake, the rupture line is divided into 20 (strike) × 10 (dip), while for the 2025 Dingri earthquake, the F1 is divided into 45 (strike) × 20 (dip) and the F2 is divided into 15 (strike) × 5 (dip) (Figure 6). For the 2020 Dingri earthquake, we set the strike, dip, and rake angle with a range of [150–210°], [30–90°] and [−90–−30°], respectively. For the F1 fault for the 2025 Dingri earthquake, the strike, dip, and rake angles are set as [150–225°], [30–90°] and [−90–−30°], respectively. For the F2 fault, the strike, dip, and rake angles are set as [160–200°], [60–90°] and [−60–0°], respectively. At last, the slip distributions of two Dingri earthquakes are obtained with the constraint of the non-negative least-squares algorithm (Figure 2).
Figure 2. (a) the three-dimensional slip distribution of the 2020 Dingri earthquake; (b) two-dimensional slip distribution of the 2020 Dingri earthquake; (c) the three-dimensional slip distribution of the 2025 Dingri earthquake; (d) two-dimensional slip distribution along the F1 for the 2025 Dingri earthquake; (f) two-dimensional slip distribution along the F2 for the 2025 Dingri earthquake; and (e) the trade-off curve between model roughness and data misfit. The red star marks the optimal smoothing factor. The arrows indicate the direction and magnitude of the relative motion. F1 and F2 indicate the surface rupture lines.
Geosciences 16 00363 g002
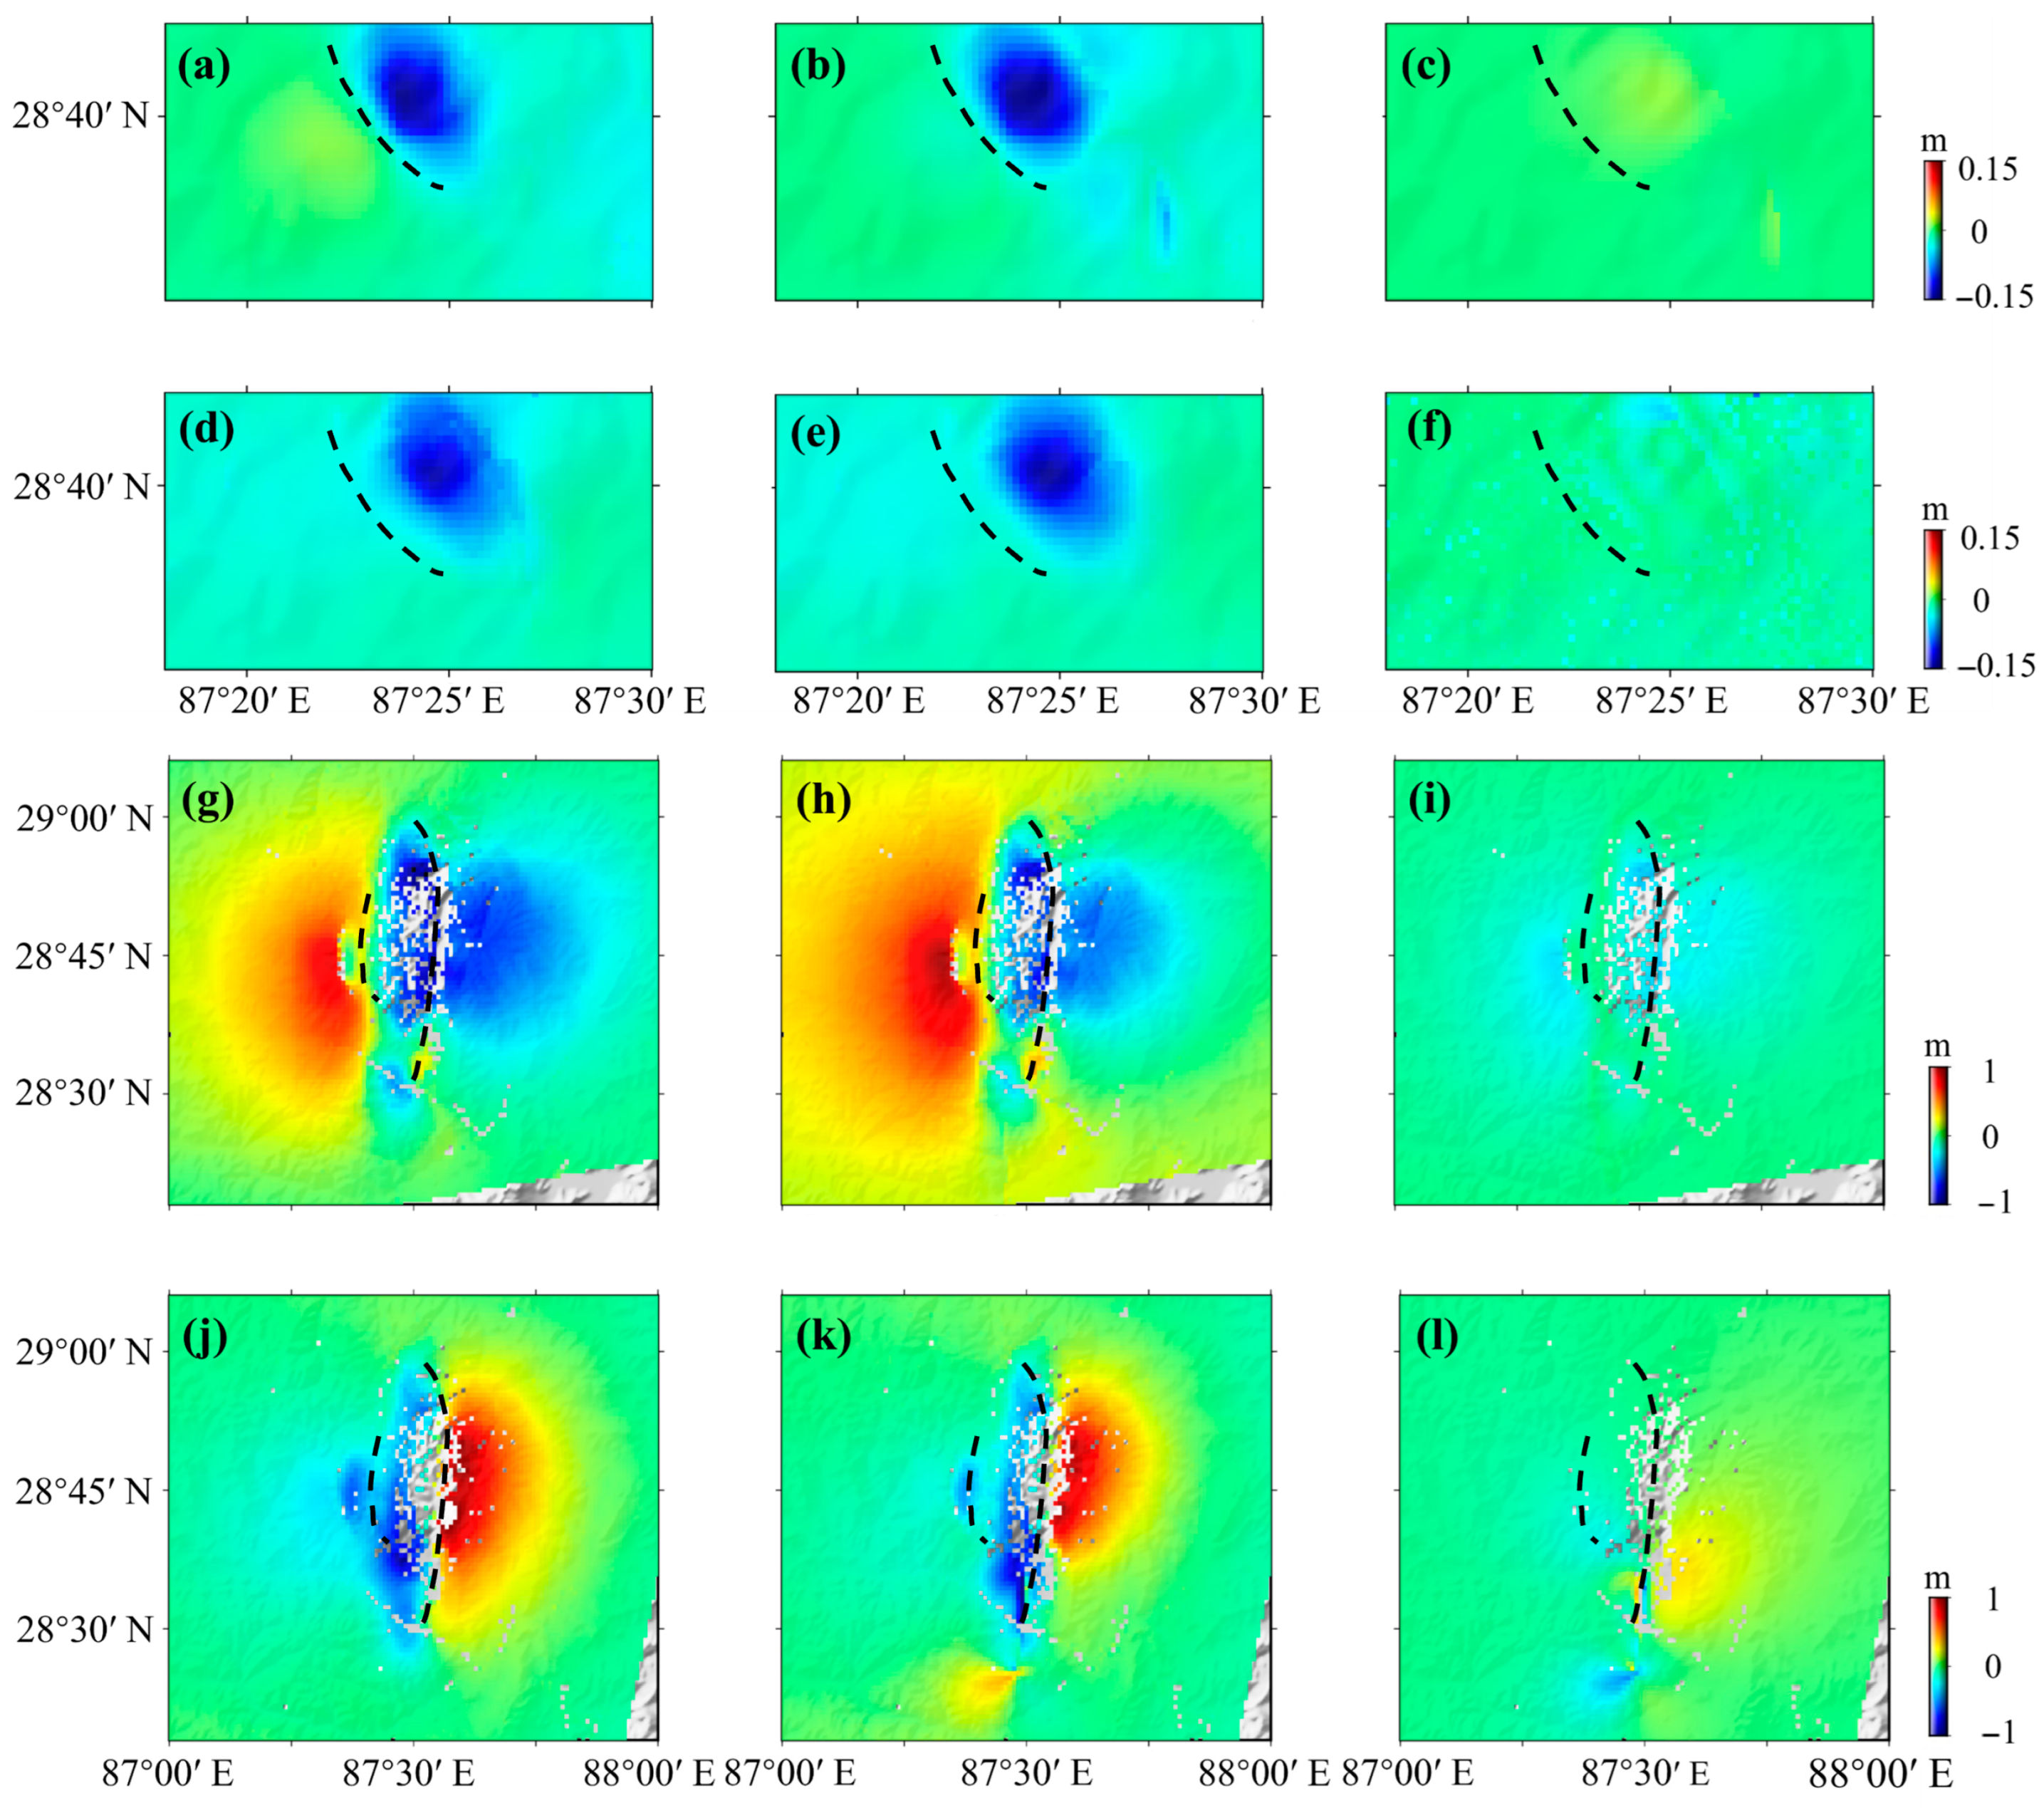
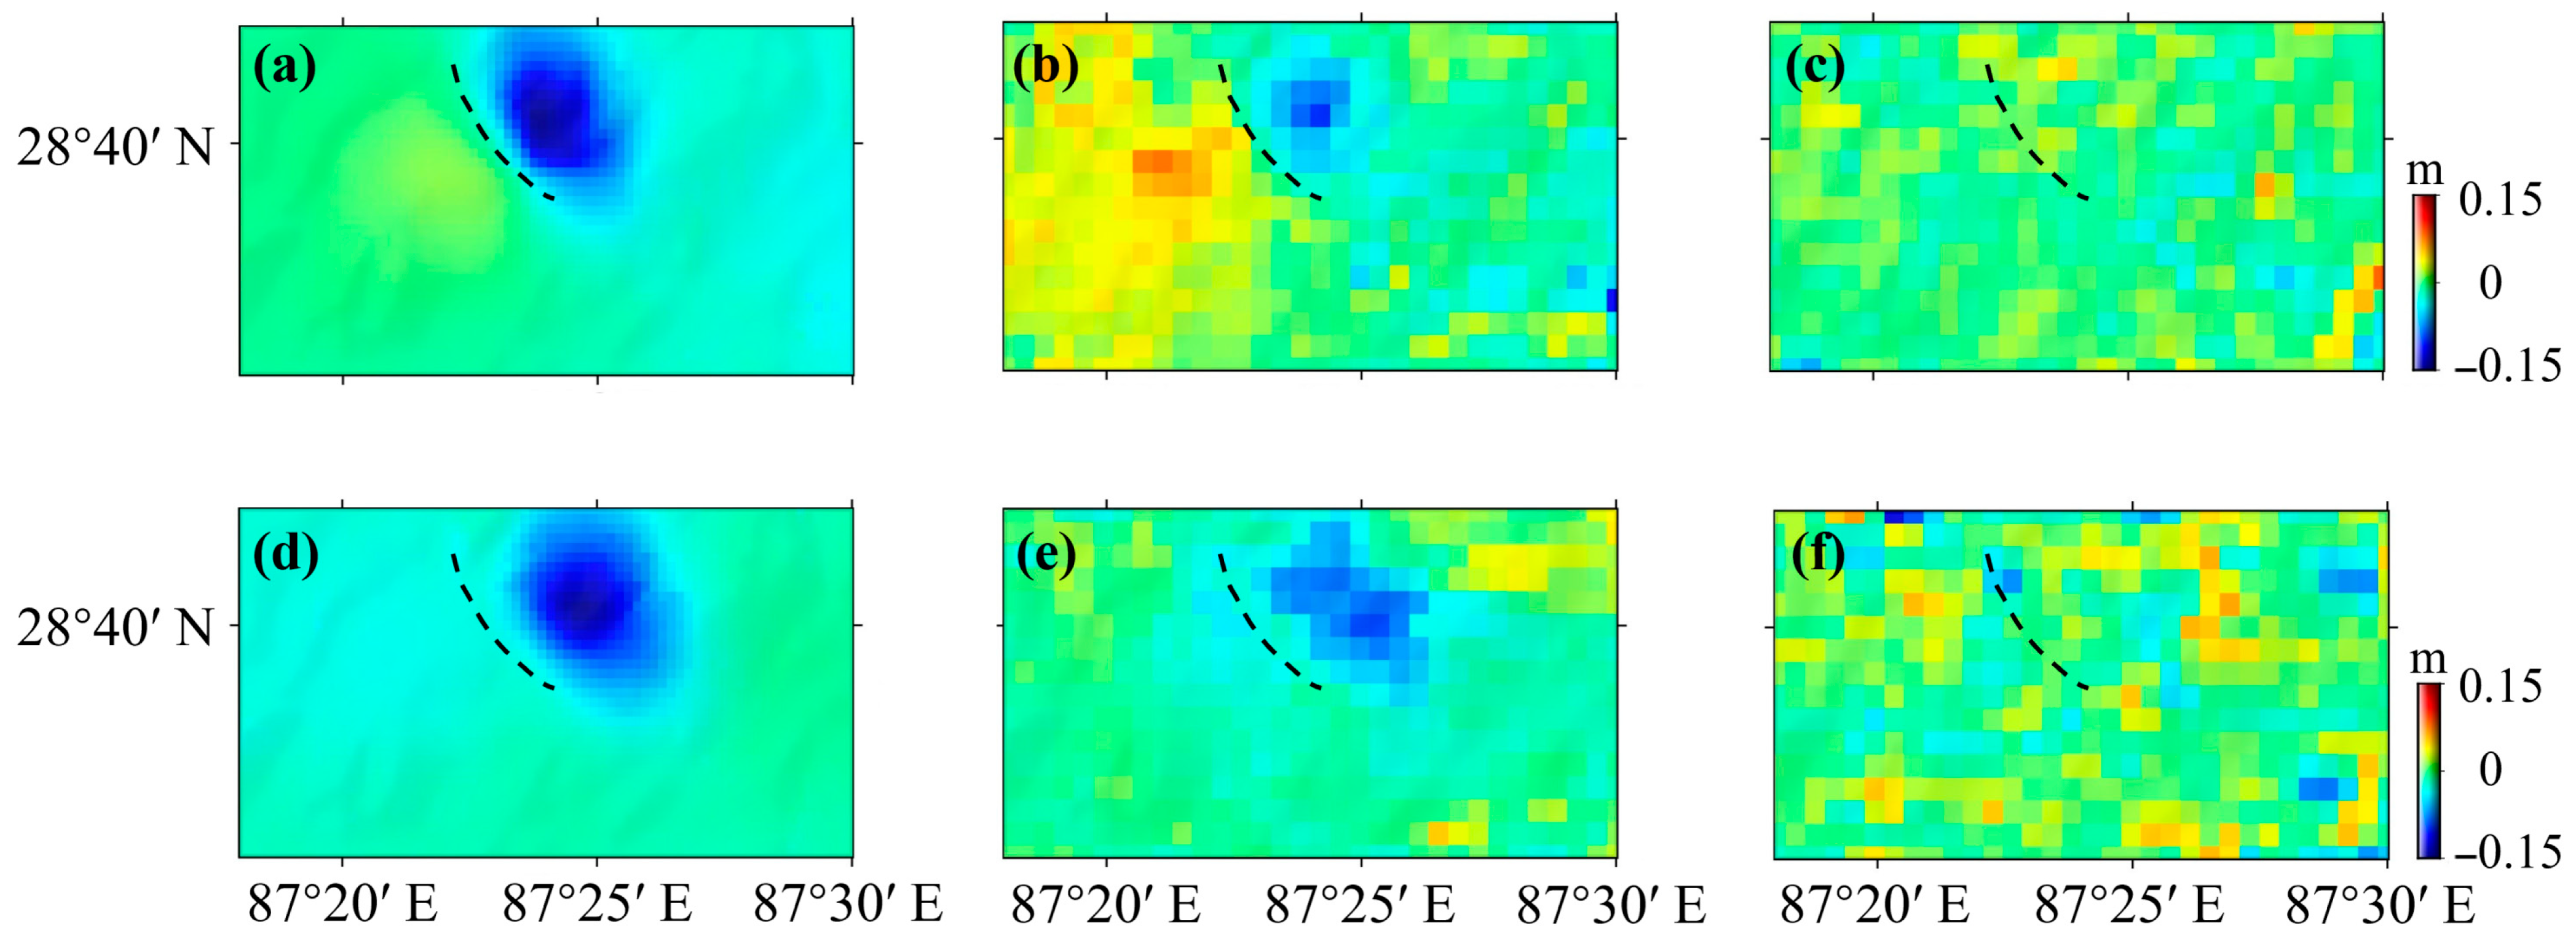
The slip distribution, combined with the motion direction, clearly indicates that these earthquakes are typical normal-fault earthquakes. The 2020 Dingri earthquake has a rupture length of 6 km and a width of 4 km, and the slip distribution mainly concentrates at a depth of 1–5.5 km, with a maximum slip of 1.3 m at about 3.55 km below the surface (Figure 2). The seismic moment released by the 2020 Dingri earthquake is about 6.53 × 10¹⁷ N·m, equivalent to an Mw 5.81 earthquake. Figure 3 shows the residual, which represented the difference between the observed and modeled data, with a root-mean-square error (RMSE) of approximately 1.25 cm for the ascending track and 1.31 cm for the descending track. As for the 2025 Dingri earthquake, the F1 fault exhibits a rupture length of approximately 40 km and a width of about 14.5 km, with slip primarily at depths from 2 km to 9 km. A maximum slip of 5.1 m is observed on the F1 fault at a depth of about 4.5 km (Figure 2). The F2 fault has a rupture length of 10 km and a maximum slip of 0.46 m at a depth of about 2.5 km. The seismic moment released by the 2025 Dingri earthquake is about 2.82 × 10¹⁹ N·m, equivalent to an Mw = 6.9 earthquake. The reliability of the inversion results is confirmed with the small RMSE values, which are approximately 1.9 cm for ascending and 2.8 cm for descending (Figure 3).
Figure 3. (ac) the observation, model, and residual values of the ascending track for the 2020 Dingri earthquake; (df) the observation, model, and residual values of the descending track for the 2020 Dingri earthquake; (gi) the observation, model, and residual values of the ascending track for the 2025 Dingri earthquake; and (jl) the observation, model, and residual value of the descending track for the 2025 Dingri earthquake.
Geosciences 16 00363 g003

4. Results and Discussion

4.1. The Co-Seismic Displacements

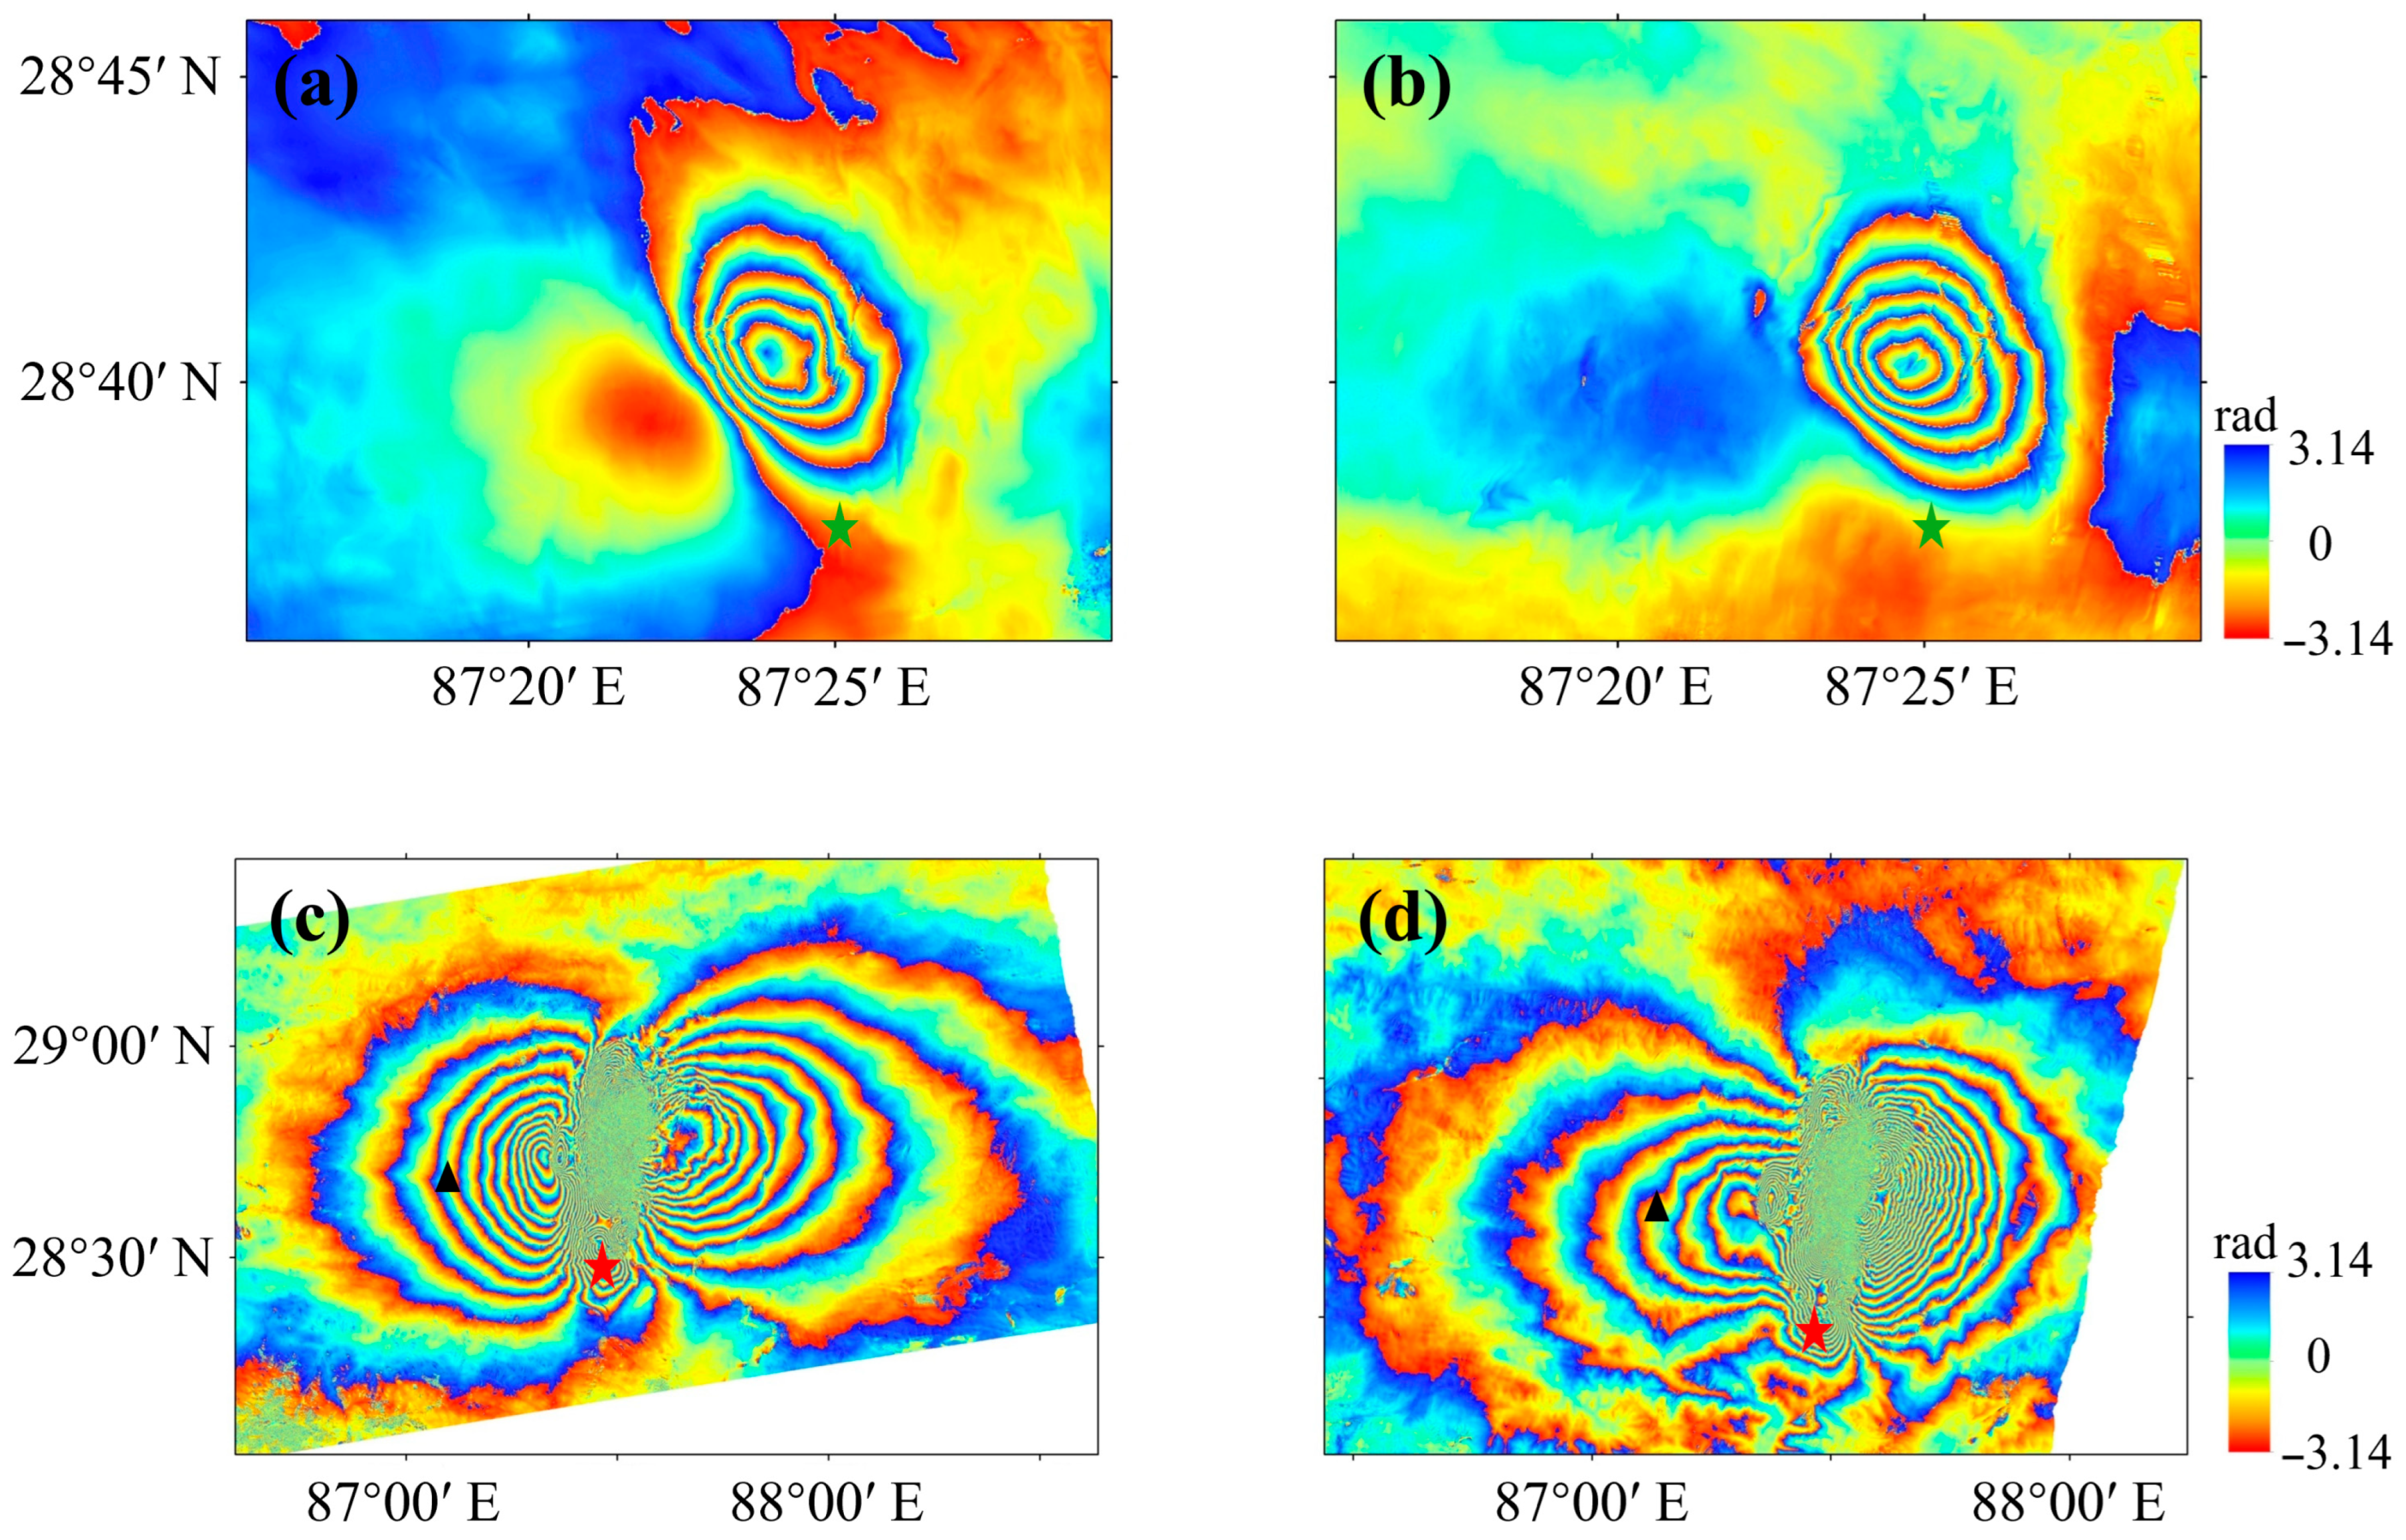
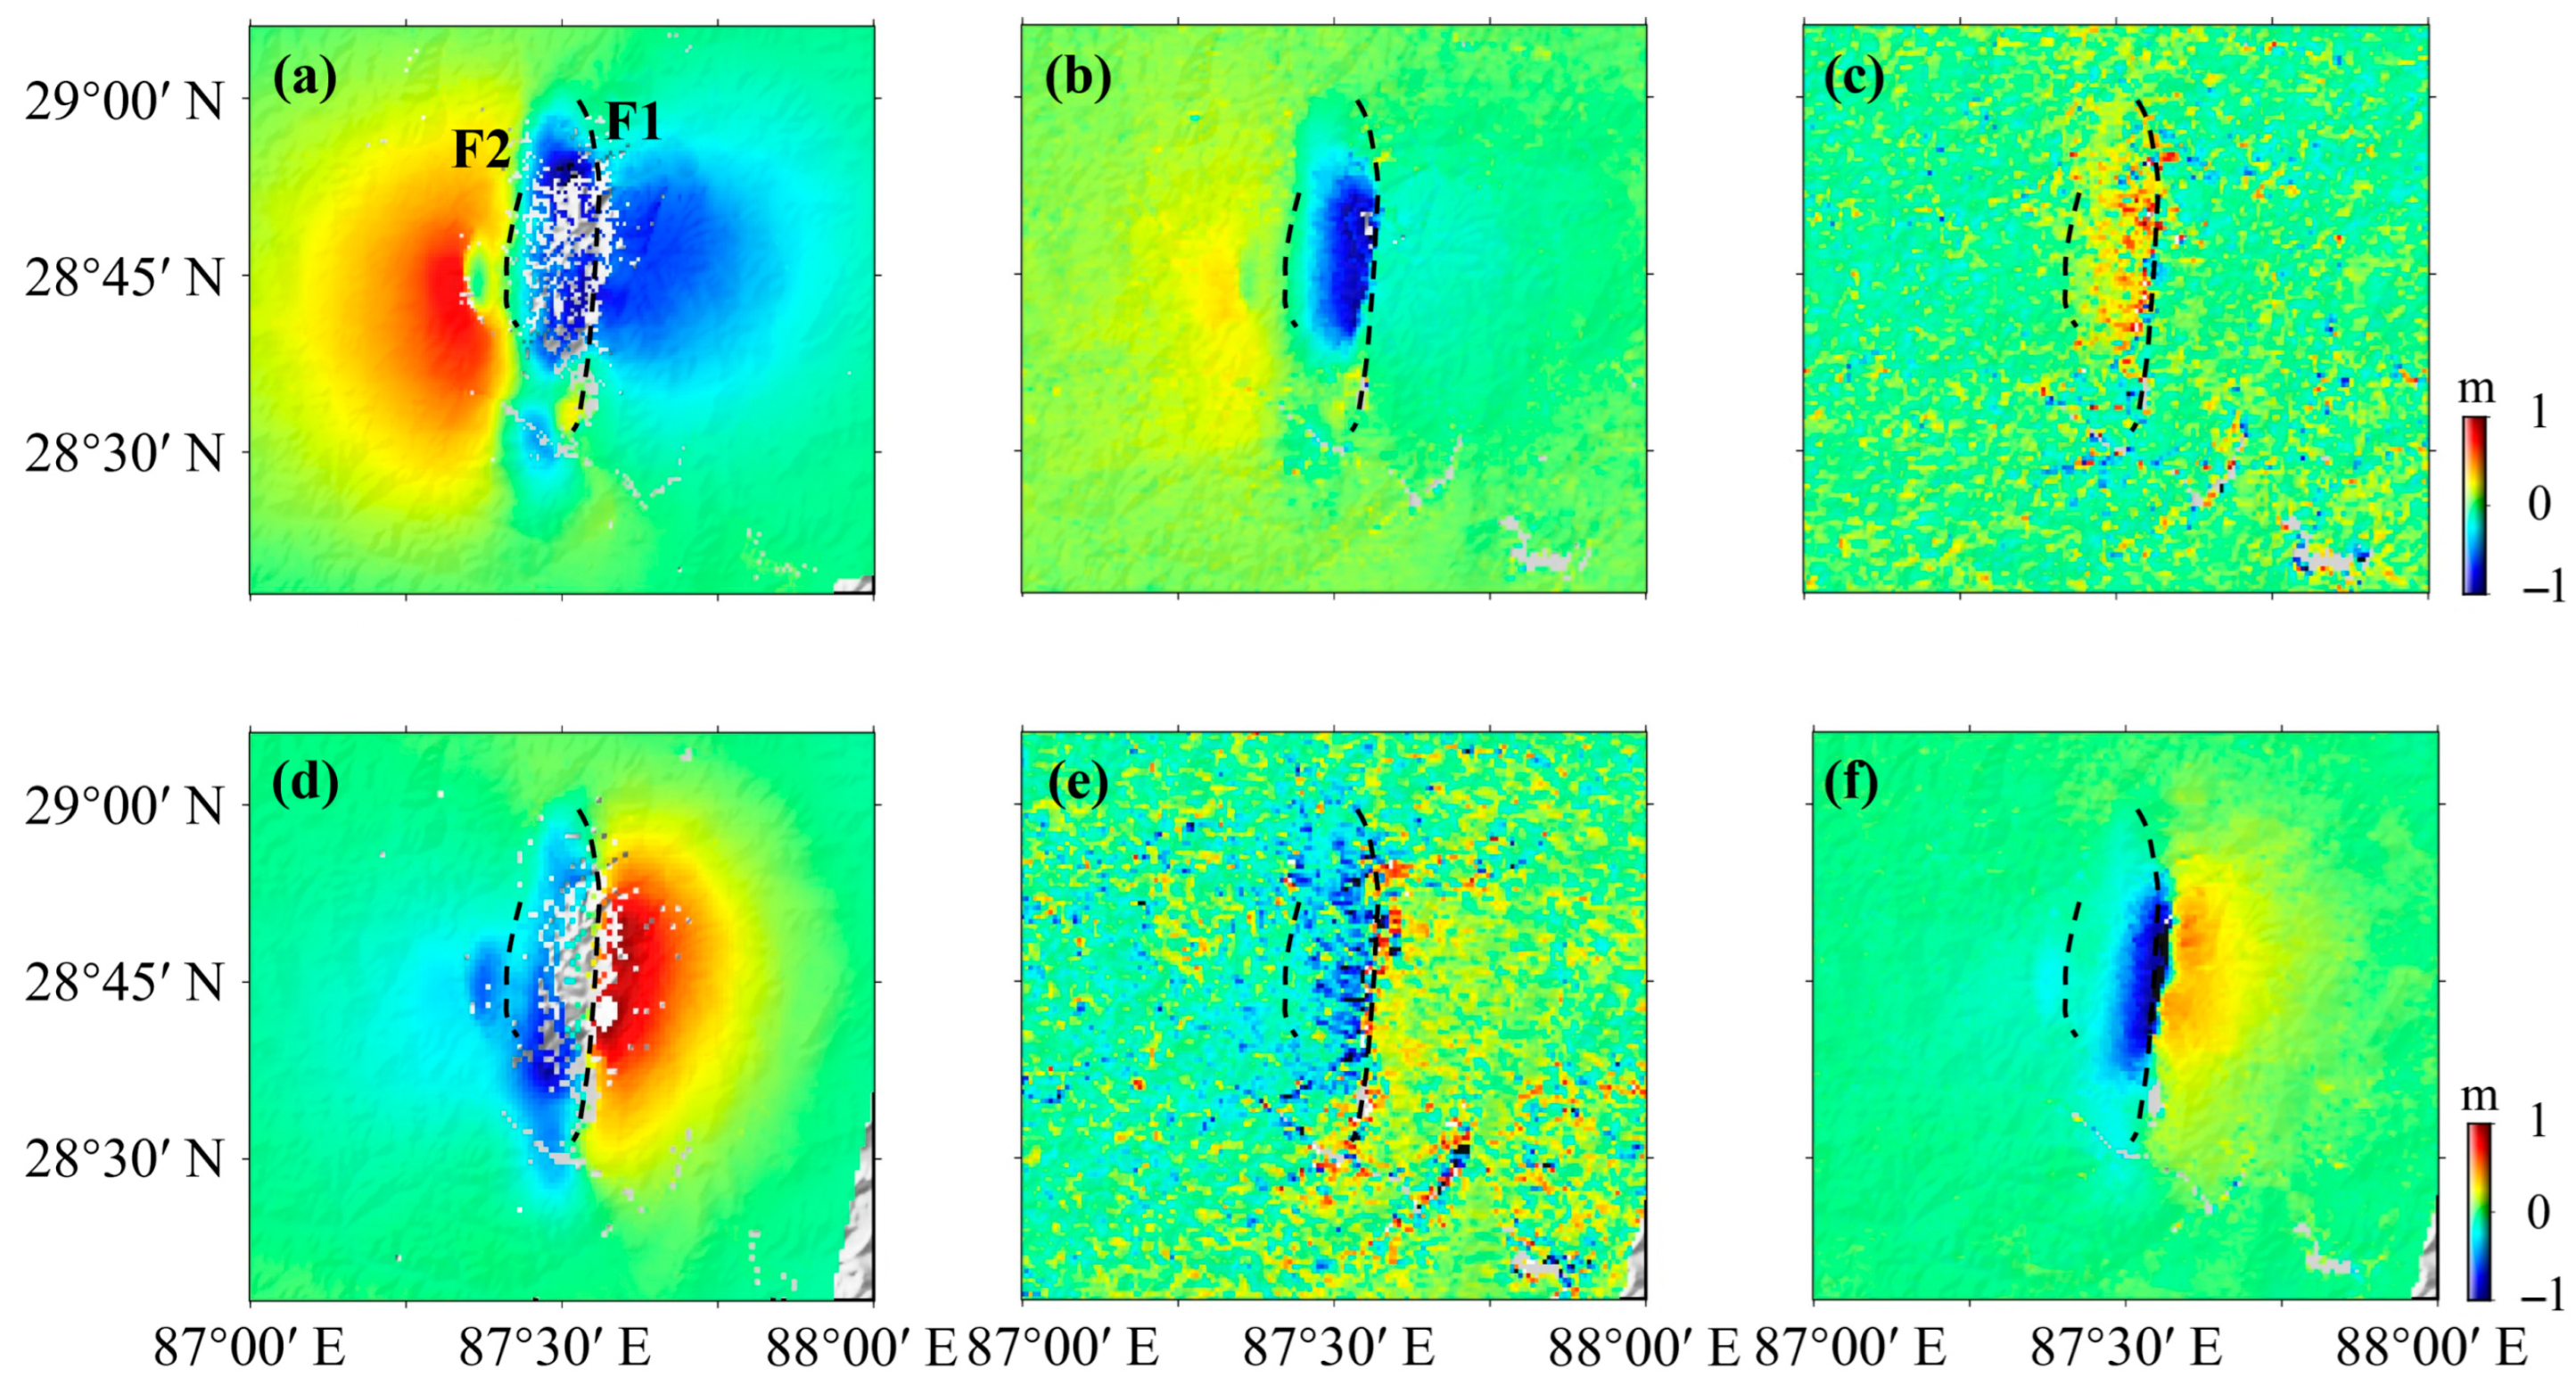
The 2020 Dingri earthquake produces distinct interferometric fringes, yet surface deformation is limited due to its moderate magnitude. In normal-fault earthquakes, the hanging wall subsides and the footwall uplifts. In other words, the right side of the surface rupture line subsides, while the left side uplifts (Figure 2). For the DInSAR method, the ascending displacements are between −13.3 cm and 2.3 cm, while those in the descending track are between −12.6 cm and 1.1 cm. For the POT method, the ascending displacements are between −14.2 cm and 3.5 cm, while those in the descending track vary between −13.8 cm and 2.2 cm. For the 2025 Dingri earthquake, the displacement map clearly shows two co-seismic rupture traces that align with graben-forming fault systems (Figure 6). The presence of significant incoherence zones along the fault ruptures further confirms the dominance of vertical displacement in normal faulting, with the hanging wall subsiding relative to the footwall. The left side of the surface rupture line F2 experiences uplift, while the right side undergoes subsidence. Based on extensive field investigations and high-resolution UAV aerial surveys, the peak vertical displacement reaches nearly 3 m (265 ± 27 cm) in Gurong village, identified by a black triangle (Figure 4) [40]. Most of the ascending displacement is concentrated on the west side of the Dengmecuo fault, covering an area of about 50 km long and 25 km wide. For the DInSAR method, the displacement map is not symmetrical across the fault and the eastern side experienced smaller shifts than the western side, with maximum displacements of −128 cm and 45 cm, respectively. Moreover, for the POT method, the descending displacement ranges from −89 cm to 56 cm, proving to be less than those of the ascending displacement in the azimuth direction. The ascending displacements are between −131 cm and 57 cm and those in descending track are between −95 cm and 69 cm in the range direction. Although interferograms present a distinct butterfly shape, one side of the fault is a subsiding area, while the other side is an uplifting area. Furthermore, in the slip distribution, the rake angle of the fault is close to 90°, indicating that the earthquake is a normal-fault earthquake (Table 2) (Figure 4, Figure 5 and Figure 6).
Figure 4. The interferograms of two Dingri earthquakes: (a) the ascending interferogram of the 2020 Dingri earthquake; (b) the descending interferogram of the 2020 Dingri earthquake; (c) the ascending interferogram of the 2025 Dingri earthquake; (d) the descending interferogram of the 2025 Dingri earthquake. The green star indicates the epicenters of the 2020 Dingri earthquakes. The red star indicates the epicenters of the 2025 Dingri earthquakes. The black triangle indicates Gurong Village.
Geosciences 16 00363 g004
Figure 5. The displacement field of the 2020 Dingri earthquake: (a) the ascending displacements in LOS; (b) the ascending displacement in range direction; (c) the ascending displacement in azimuth direction; (d) the descending displacements in LOS; (e) the descending displacement in the range direction; and (f) the descending displacement in the azimuth direction. The black dashed lines indicate surface rupture traces.
Geosciences 16 00363 g005
Figure 6. The displacement field of the 2025 Dingri earthquake: (a) the ascending displacements in LOS; (b) the ascending displacement in the range direction; (c) the ascending displacement in the azimuth direction; (d) the descending displacements in LOS; (e) the descending displacement in the range direction; and (f) the descending displacement in the azimuth direction. F1 and F2 are two surface rupture traces indicated by black dashed lines.
Geosciences 16 00363 g006

4.2. The Strain Rate Field

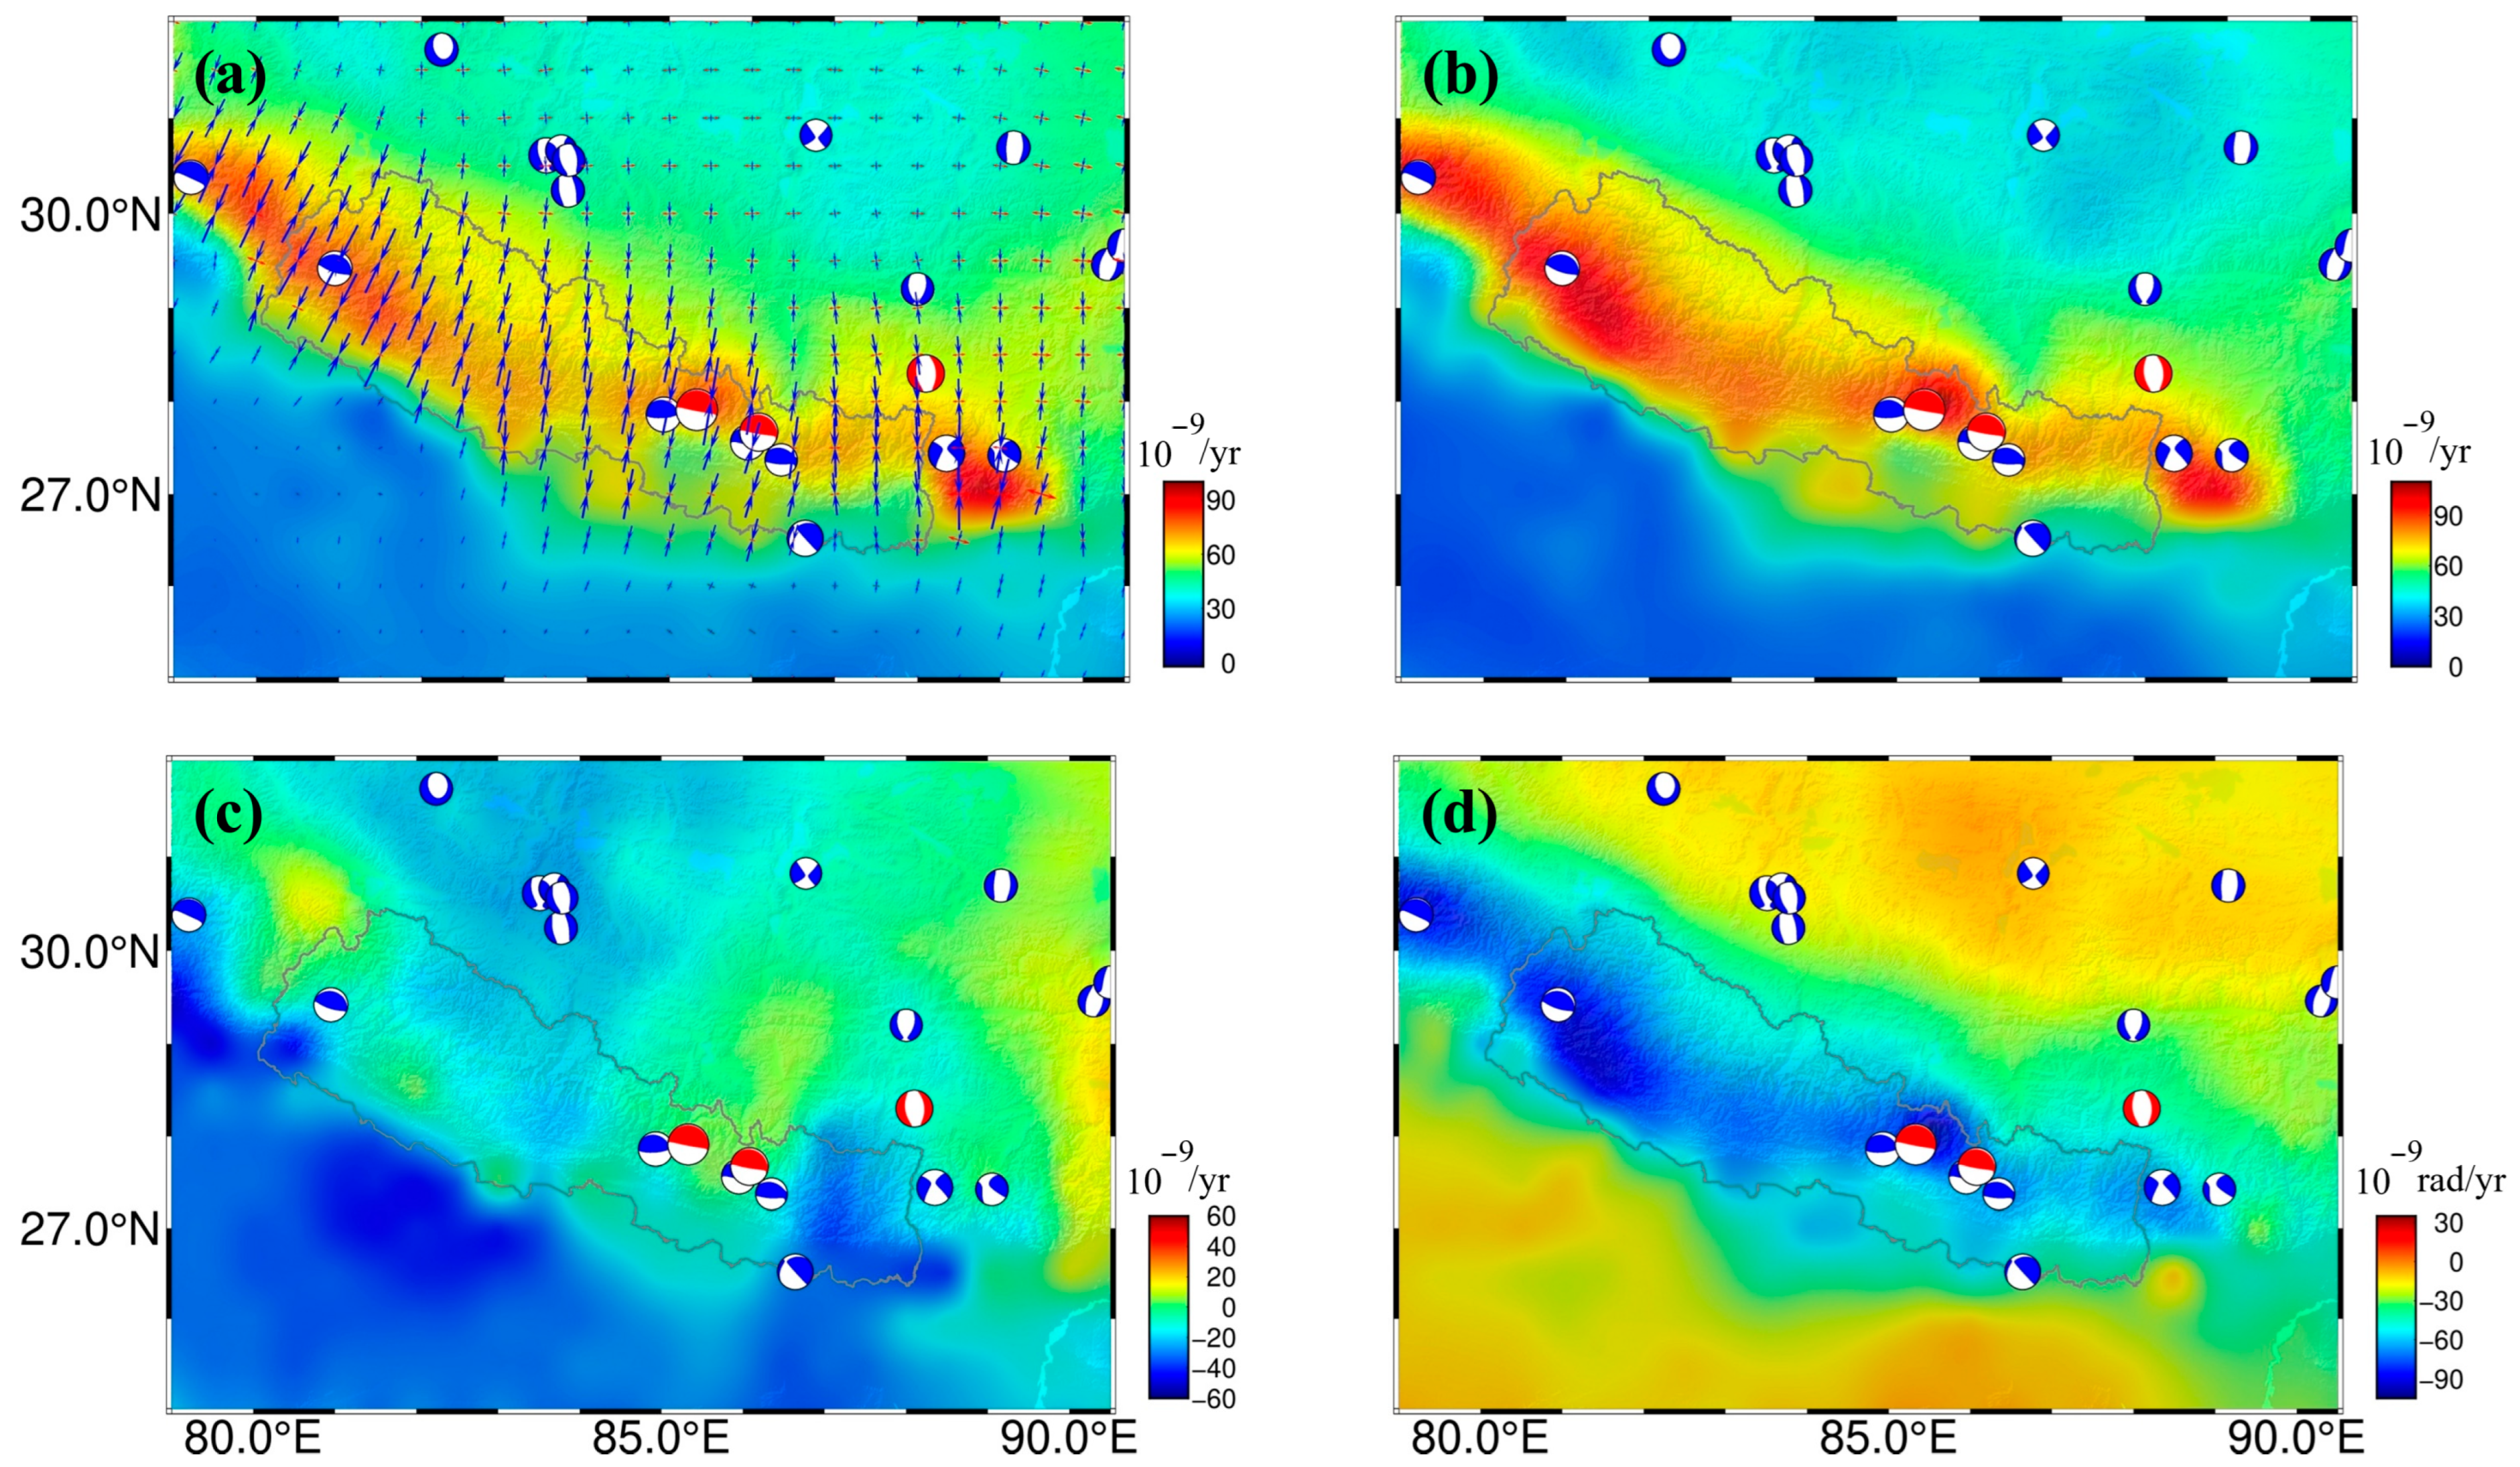
For the 2025 Dingri earthquake, the maximum shear strain at the epicenter is 25 nstrain/yr (Figure 7). The maximum principal strain and the second invariant at the epicenter are approximately 55 nstrain/yr [41]. This indicates that both the overall deformation intensity (second invariant) and the degree of compression (maximum principal strain) in this region were very high. The rotation rate is approximately −10 nstrain/yr, indicating a clockwise rotation of the block (Figure 7). Intense clockwise rotation can generate trans-tensional effects within the fault zone. The dilatation rate at the epicenter in 2025 is approximately −40 nstrain/yr, indicating that the crust in this area is undergoing contraction (Figure 7). This high contraction rate leads to a rapid decrease in crustal volume. Due to the Poisson’s ratio effect, horizontal contraction can be converted into vertical extension or generate enormous normal pressure on the fault plane. This facilitates fault activity and increases the fault locking, with an energy accumulation rate far exceeding that of the surrounding areas. The crust near the epicenter is being compressed at an extremely high rate. This compression increases the frictional resistance on both sides of the fault, keeping the fault in a locked state and providing conditions for strain accumulation [42]. When this energy is superimposed with the −40 nstrain/yr contraction rate, this rotation is more likely to produce a “tightening” effect, further increasing friction. Strain accumulation is confined within a rapidly contracting and rotationally incongruent locked zone. Once the frictional limit is exceeded, a considerable amount of energy can be released.
Figure 7. (a) the maximum shear strain and principal strain; (b) the second invariant; (c) the rotation rate; (d) the dilatation. The gray line indicates the Nepal earthquake. The red and blue beach balls indicate the focal mechanism. The crossed arrows indicate shear strain.
Geosciences 16 00363 g007

4.3. Three-Dimensional Displacement

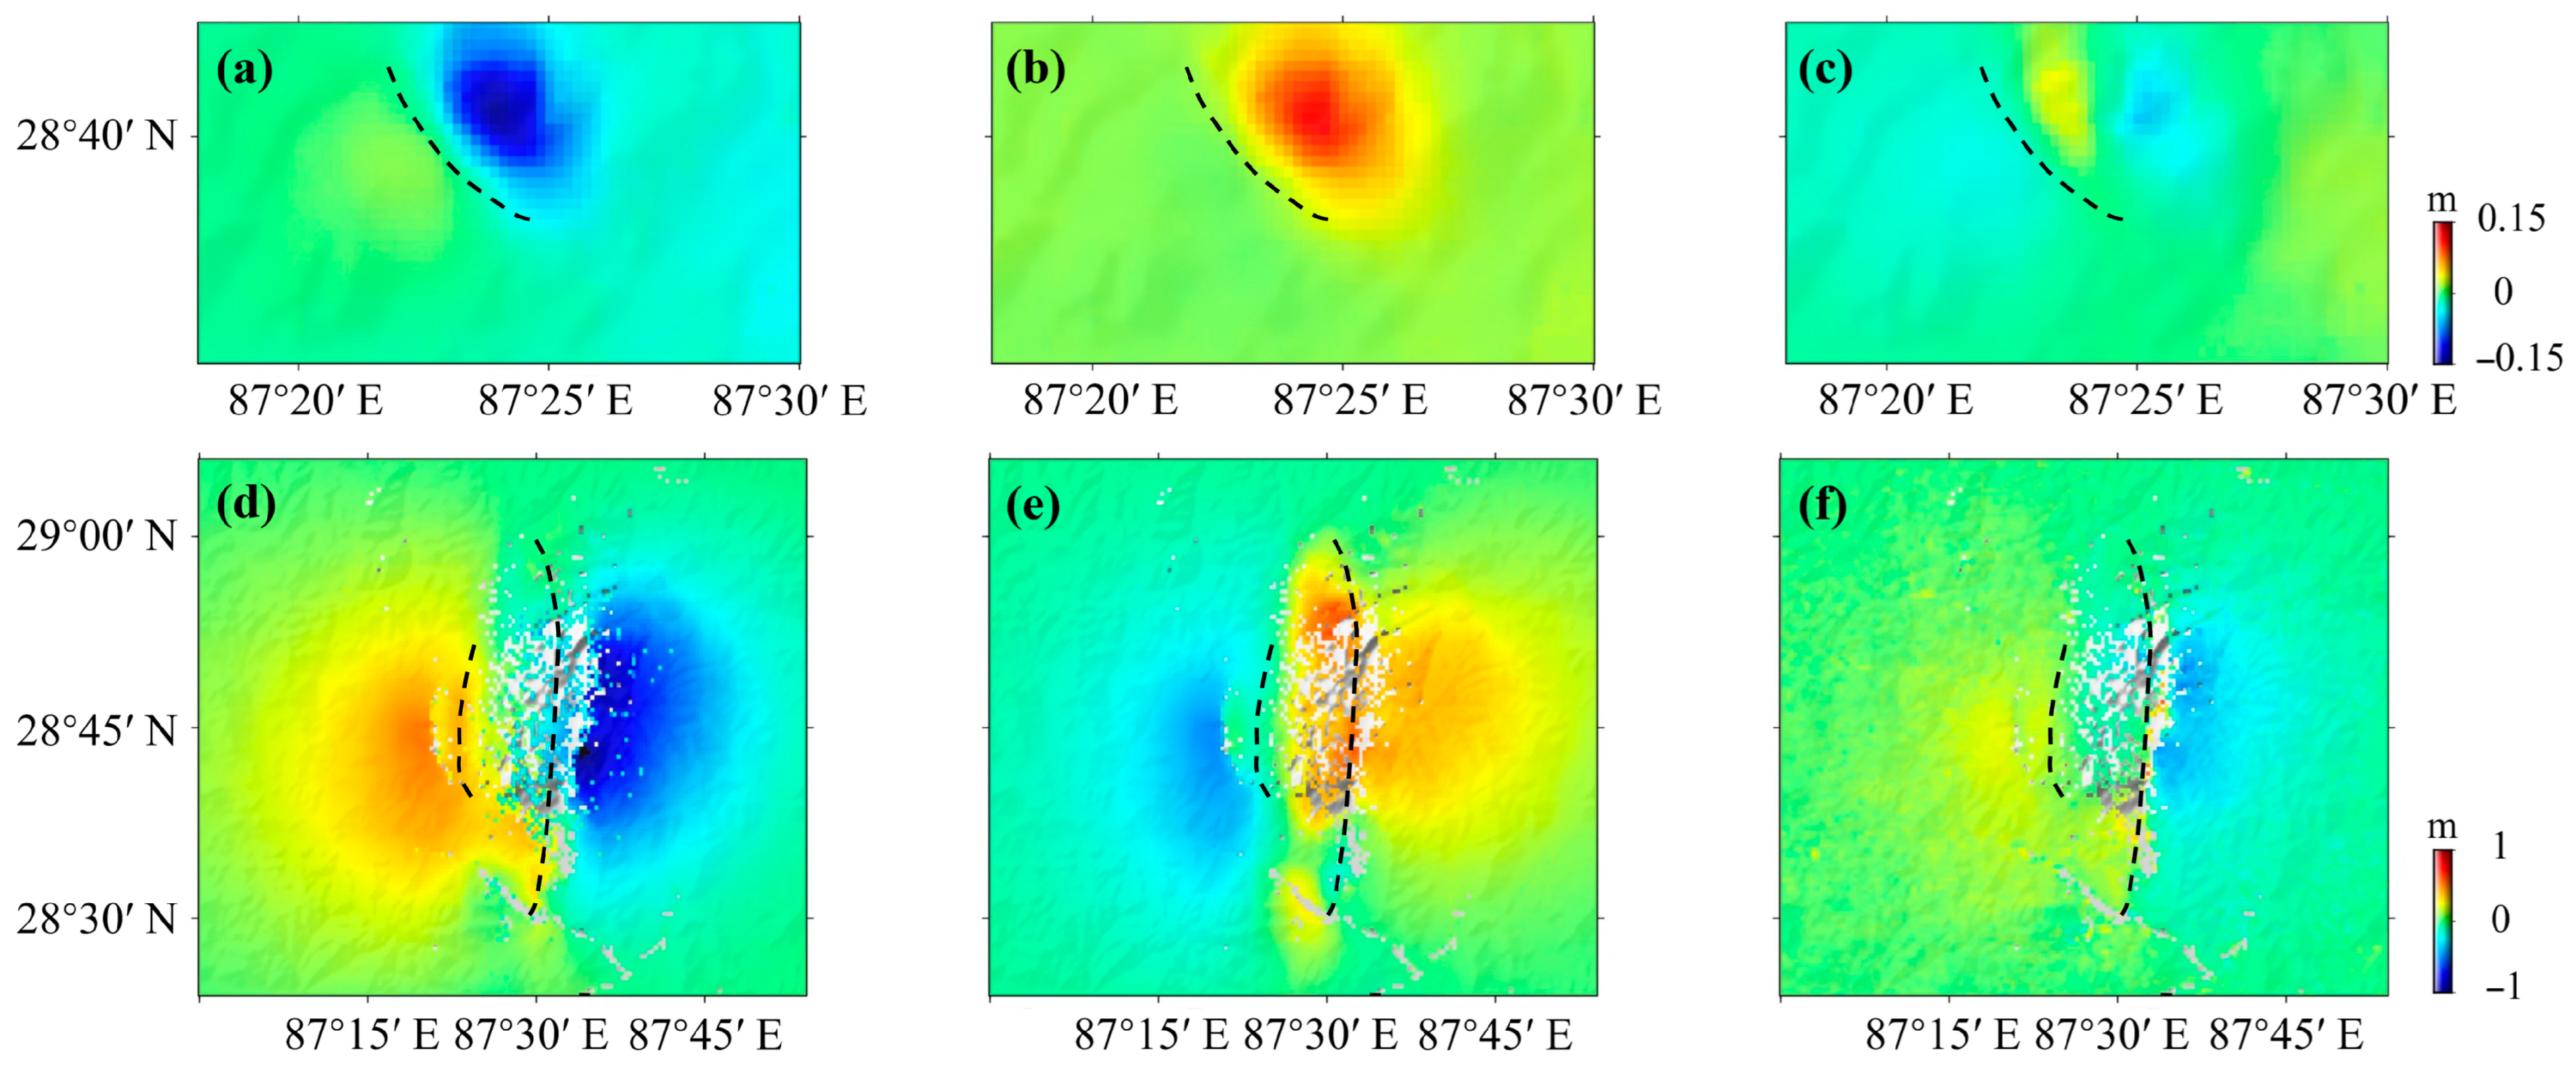
The three-dimensional displacements conclusively demonstrate that the two Dingri earthquakes are normal-fault earthquakes. The west side is the hanging wall of the fault, which uplifts during the earthquake, while the east side is the footwall, which induces subsidence during the earthquake. Especially for the 2025 Dingri earthquake, it is difficult to judge whether the earthquake belongs to the category of normal-fault earthquakes from the deformation field and interferograms alone. Three-dimensional displacements provide a reference for accurately distinguishing earthquake types and more vividly expressing earthquake structures. The minimum displacement is 4 cm in the N-S direction, less than 12 cm in the vertical direction, and 14 cm in the E-W direction for the 2020 Dingri earthquake (Figure 8). In contrast, the maximum displacement is 91 cm in the E-W direction, greater than 73 cm in the vertical direction, and 39 cm in the N-S direction for the 2025 Dingri earthquake (Figure 8). It is necessary to assess the reliability of the data by calculating the variance component with 46 mm in the N-S direction, 22 mm in the vertical direction, and 18 mm in the E-W direction for the 2020 Dingri earthquake. When it comes to the 2025 Dingri earthquake, the variance is 31 mm in the E-W direction, 39 mm in the vertical direction, and 76 mm in the N-S direction. Therefore, these results demonstrate the reliability of the inversion.
Figure 8. The three-dimensional displacement of two Dingri earthquakes: (a) the displacements in the E-W direction of the 2020 Dingri earthquake; (b) the displacements in the N-S direction of the 2020 Dingri earthquake; (c) the displacements in the vertical direction of the 2020 Dingri earthquake; (d) the displacements in the E-W direction of the 2025 Dingri earthquake; (e) the displacements in the N-S direction of the 2025 Dingri earthquake; (f) the displacements in the vertical direction of the 2025 Dingri earthquake. The black dashed lines indicate surface rupture traces.
Geosciences 16 00363 g008

4.4. Coulomb Stress Changes

The epicenter is located in the stress-release area after the earthquake, indicating that the earthquake released a lot of energy, shown in Figure 8. After an earthquake, the stress builds up again, and if the stress exceeds a certain limit or the fault system becomes unstable, an earthquake could also be triggered. There is a significant correlation between the Coulomb stress changes and the seismic hazard. The Coulomb stress changes of four periods following the 2020 Dingri earthquake show that the epicenters of the 2025 Dingri earthquake were situated within loading zones. The maximum Coulomb stress change of 5 years after the seismic event is 10,700 Pa, exceeding the earthquake-triggering threshold, which further verifies the triggering effect. Similarly, the surface rupture of the 2025 Dingri earthquake extends 40 km in length and 15 km in width along the Dengmecuo fault. Although the seismogenic region of the 2020 Dingri earthquake is less than 0.5° × 0.5°, the seismic activity is relatively intense and located on a high-stress loading region. The earthquake is a normal-fault earthquake dominated by tension, which provides an early omen for the 2025 Dingri earthquake (Figure 9). Therefore, the 2020 Dingri earthquake is believed to have had trigger effects on the 2025 Dingri earthquake.
Figure 9. (a) the co-seismic Coulomb stress changes for the 2020 Dingri earthquake; (b) the 1-year post-seismic Coulomb stress changes for the 2020 Dingri earthquake; (c) the 3-year post-seismic Coulomb stress changes for the 2020 Dingri earthquake; (d) the 5-year post-seismic Coulomb stress changes for the 2020 Dingri earthquake; (e) the co-seismic Coulomb stress changes for the 2025 Dingri earthquake; (f) parameters of the layered crustal model. The green star denotes the epicenter of the 2020 Dingri earthquakes. The red star denotes the epicenter of the 2025 Dingri earthquakes. The black line denotes the Dengmecuo fault.
Geosciences 16 00363 g009

4.5. The Fault Locking and Slip Deficit

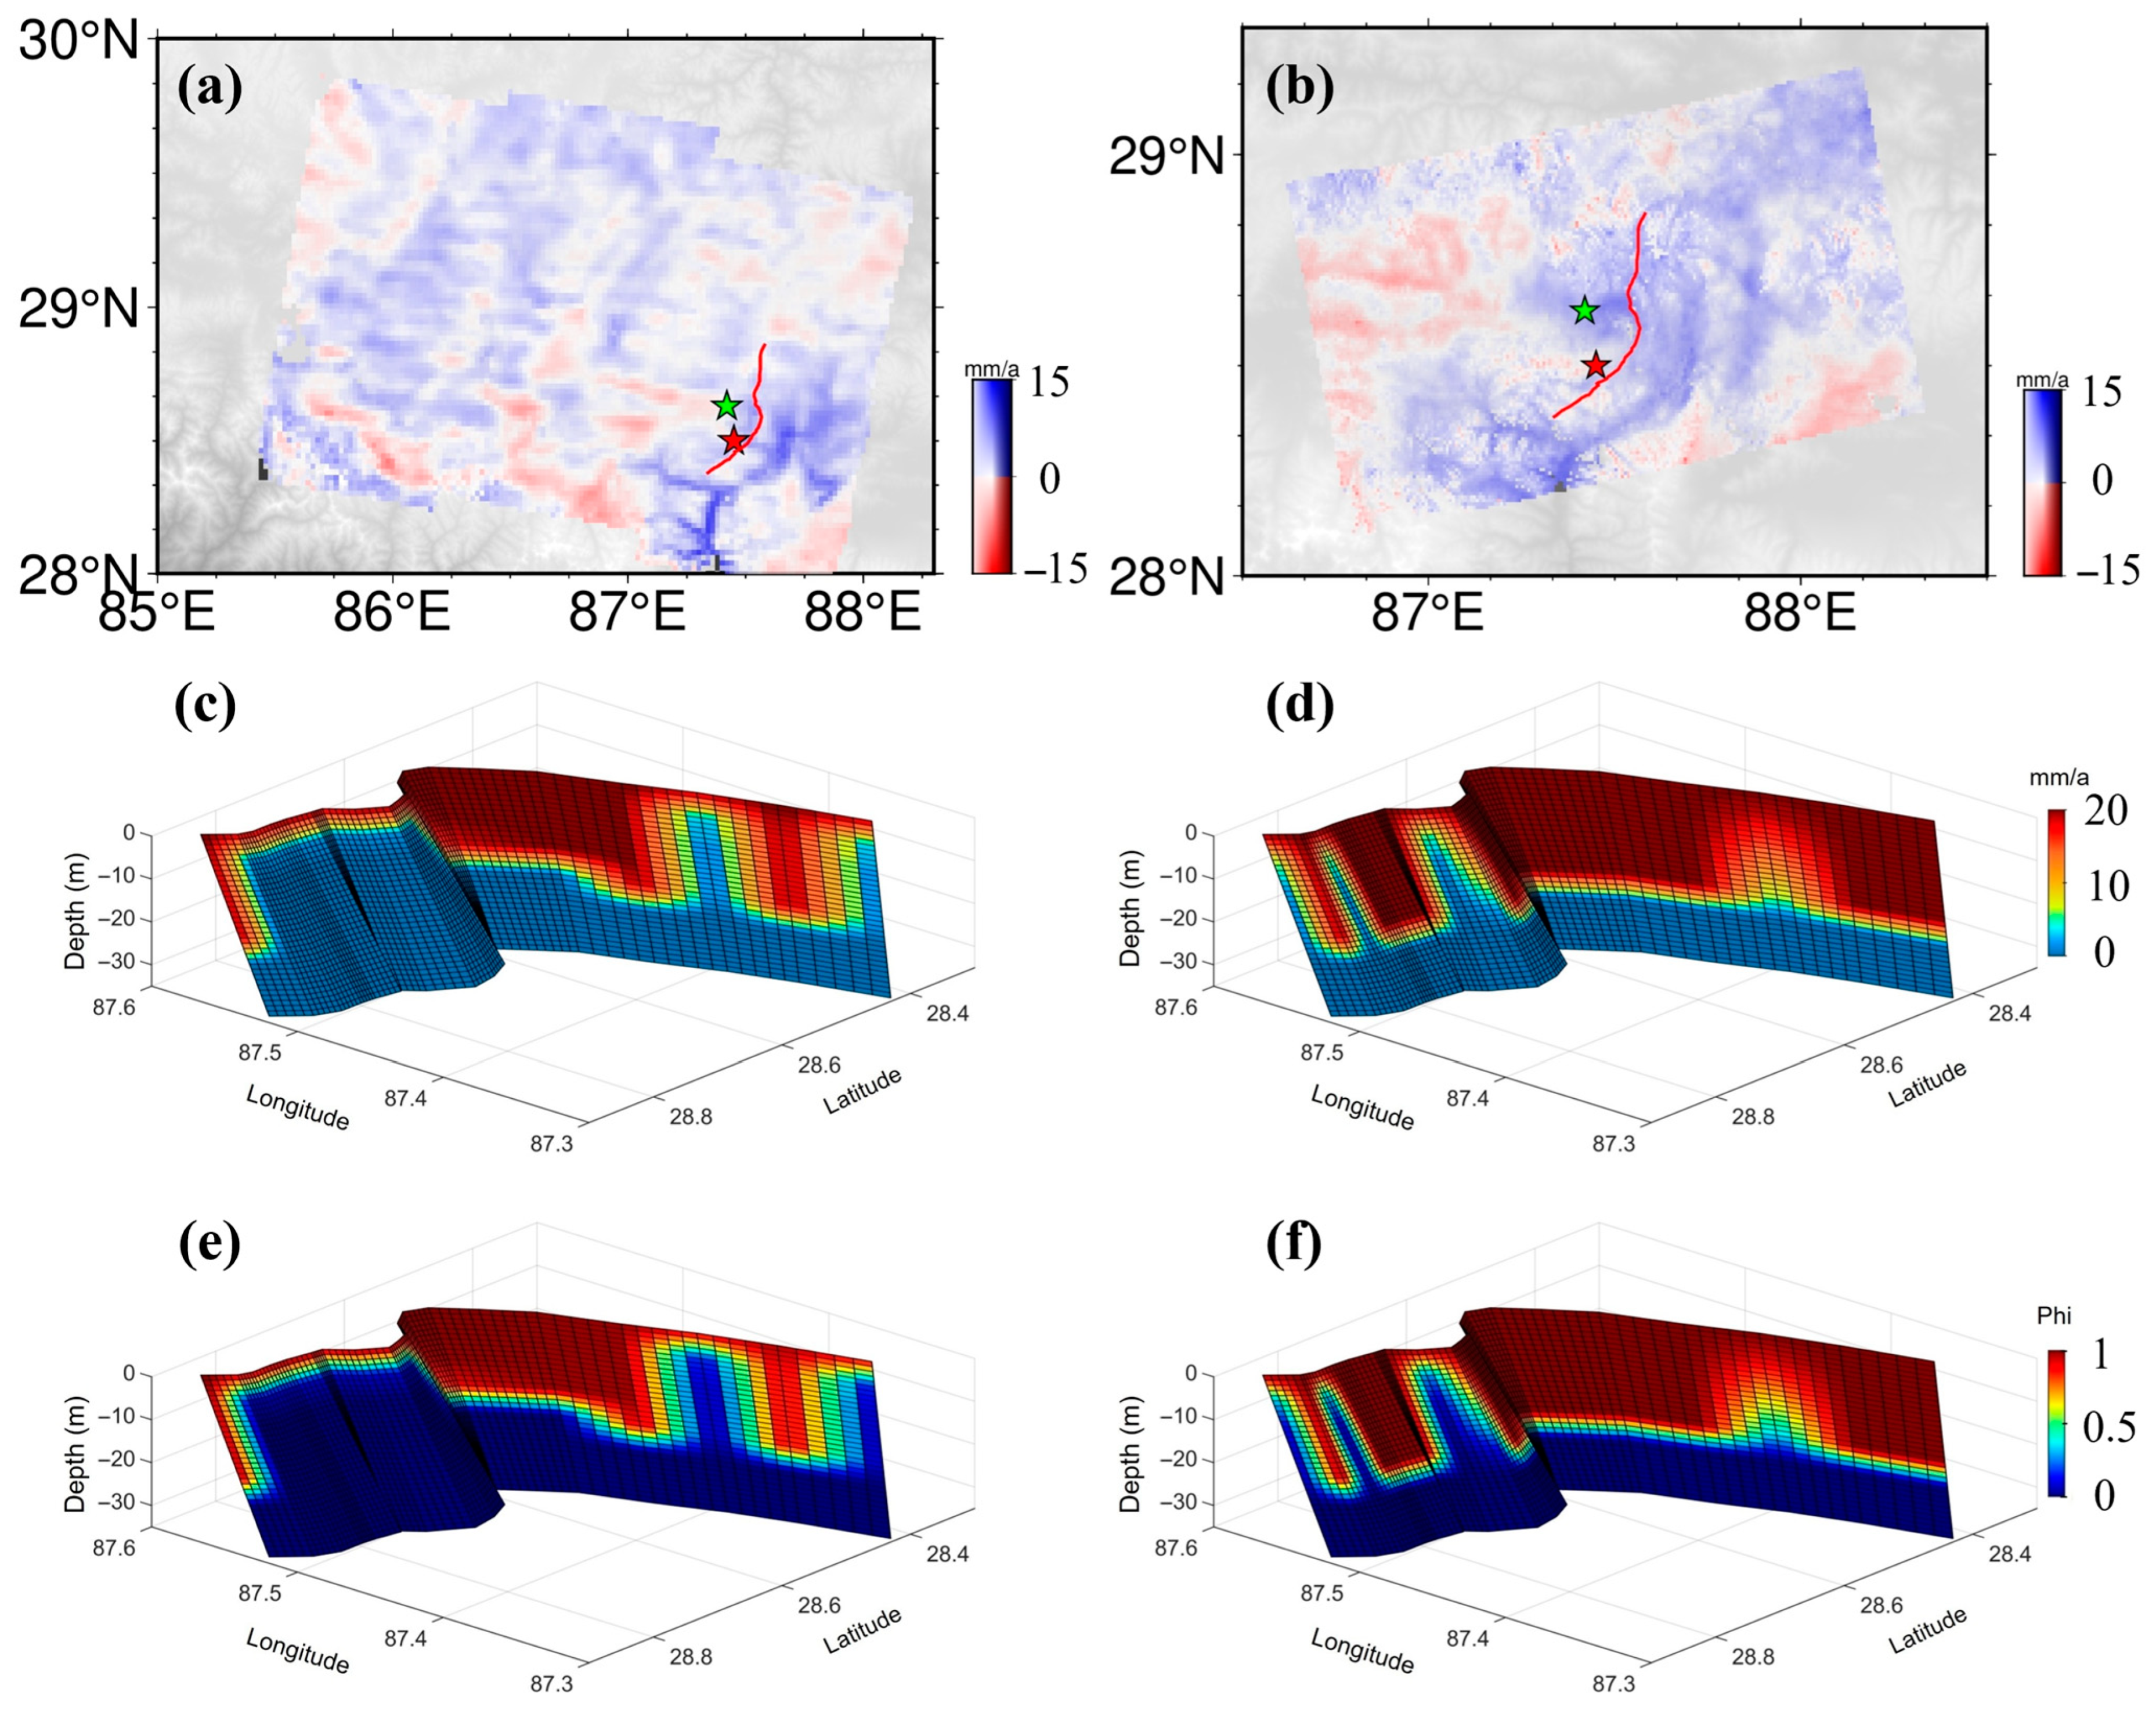
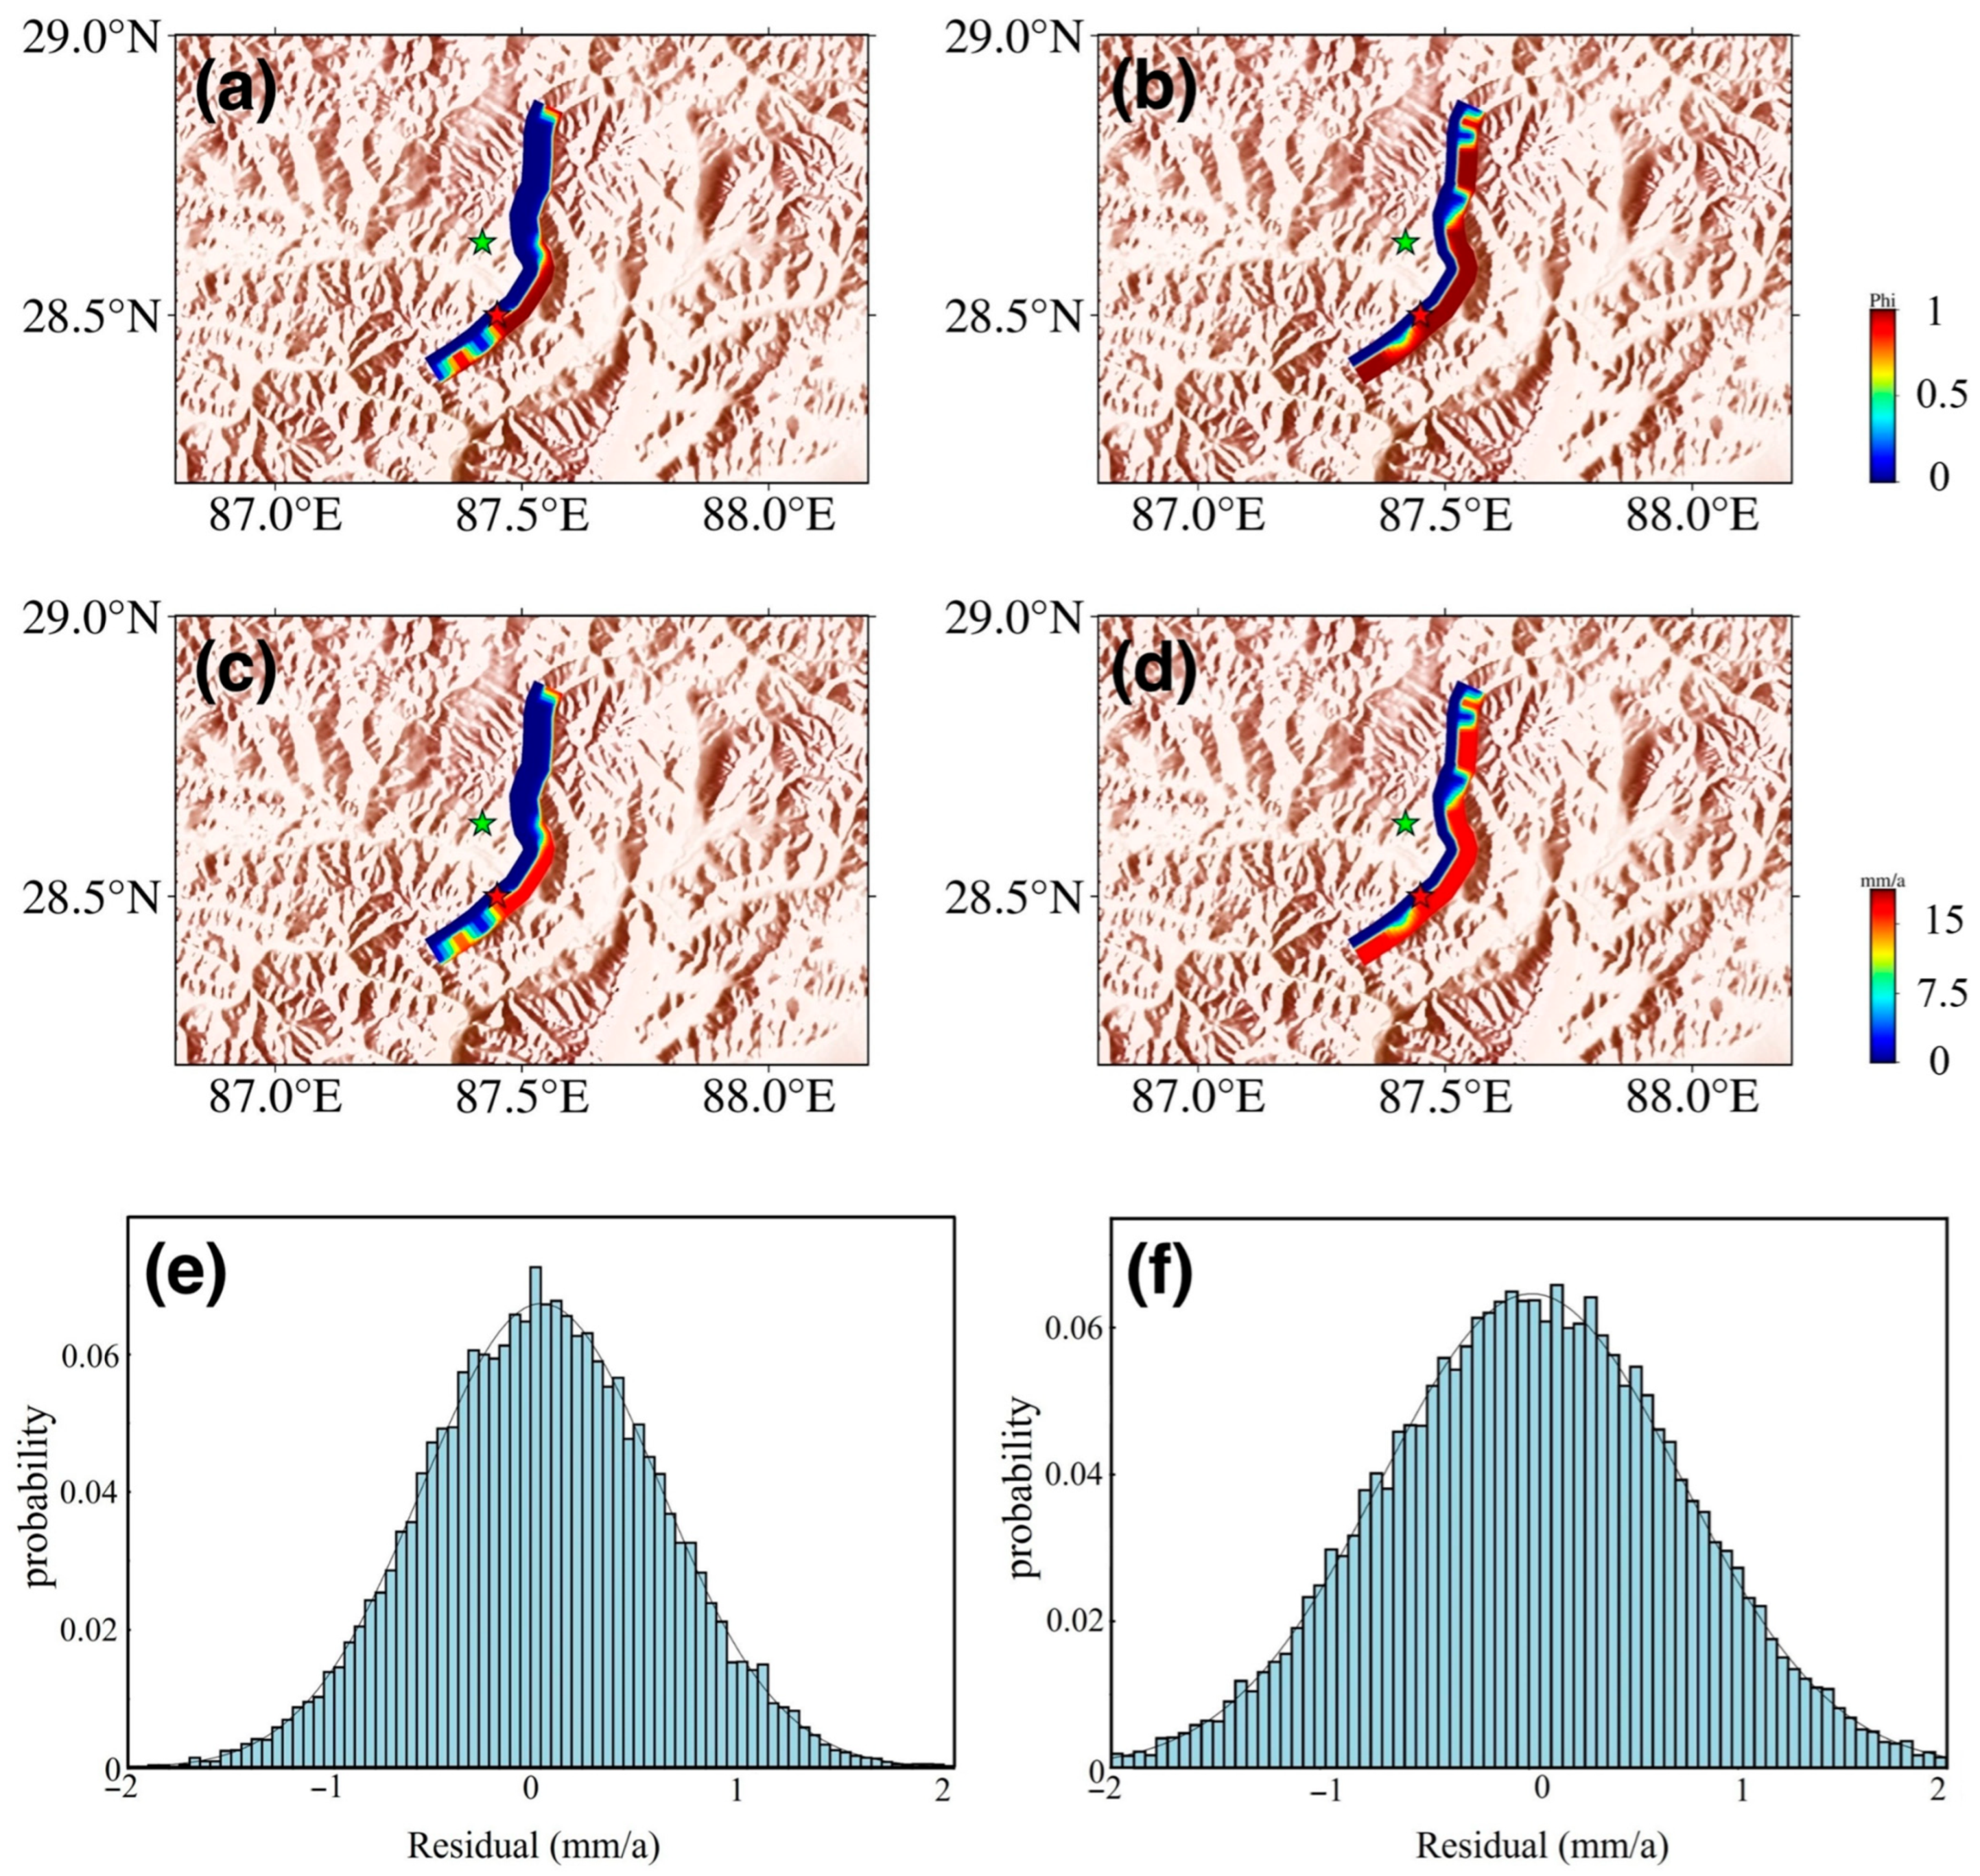
Since the 2020 Dingri earthquake, the surface along the Dengmecuo fault has been uplifted at about 13.8 mm/yr for the ascending track and 14.4 mm/yr for the descending track (Figure 10). The two-dimensional fault locking and slip deficits are also reached to more clearly visualize the spatial distribution of fault locking and slip deficit along the Dengmecuo fault (Figure 11). The Phi near the epicenter of the 2025 Dingri earthquake is close to 1, with a locking depth of about 25 km for the ascending track and about 30 km for the descending track, indicating complete fault locking (Figure 10). In other words, the southern part of the Dengmecuo fault has been fully locked, indicating a high probability of future earthquakes. Moreover, the maximum slip deficit rate is about 11.2 mm/yr for the ascending track and about 13.5 mm/yr for the descending track, which is near the epicenter of the 2025 Dingri earthquake. According to the seismic moment calculation formula, the maximum seismic moment is 1.22 × 10¹⁹ N·m along the Dengmecuo fault for the ascending track data, equivalent to an Mw 6.69 earthquake. Meanwhile, that for the descending track is about 1.91 × 10¹⁹ N·m, equivalent to an Mw 6.82 earthquake. To validate data reliability, we conducted statistical tests, which verified the data consistency through histograms and normal distribution curves (Figure 11). Consequently, the performed fault inversion for the Dengmecuo fault following the 2020 Dingri earthquake indicates that the 2020 Dingri earthquake likely triggered the 2025 Dingri earthquake.
Figure 10. (a) the ascending deformation rates; (b) the descending deformation rates; (c) the ascending three-dimensional slip deficit; (d) the descending three-dimensional slip deficit; (e) the ascending three-dimensional fault locking; (f) the descending three-dimensional fault locking. The green star denotes the epicenter of the 2020 Dingri earthquakes. The red star denotes the epicenter of the 2025 Dingri earthquakes. The red line indicates the Dengmecuo fault.
Geosciences 16 00363 g010
Figure 11. (a) the ascending two-dimensional fault locking; (b) the descending two-dimensional fault locking; (c) the ascending two-dimensional slip deficit; (d) the descending two-dimensional slip deficit; (e) the statistical histogram of the root-mean-square-error (RMSE); (f) the statistical histogram of the root-mean-square-error (RMSE). The green star denotes the epicenter of the 2020 Dingri earthquakes. The red star denotes the epicenter of the 2025 Dingri earthquakes.
Geosciences 16 00363 g011

4.6. Uncertainty and Sensitivity Analysis

Five years of post-seismic time-series deformation (2020–2025) show a maximum fault deformation rate of 13.8 mm/yr along the Dengmecuo fault (Figure 11). This study uses fault locking and slip deficit to evaluate earthquake potential from a complementary perspective. Quantitative assessment of seismic hazard relies on two crucial approaches, including modeling stress changes from co-seismic rupture, post-seismic relaxation, and long-term fault behavior through inter-seismic geodetic inversions of slip deficit and fault locking (Figure 10 and Figure 11) [43]. The earthquake potential of a fault system is determined by both local fault mechanics and stress interactions in nearby seismogenic zones [44]. Coulomb stress changes encompass co-seismic and post-seismic components, correlated with crustal deformation [45]. The co-seismic Coulomb stress changes of the 2020 Dingri earthquake indicate significant energy release, whereas the five-year post-seismic Coulomb stress changes demonstrate stress accumulation near the epicenter. When this accumulated energy reaches a critical point, it could signal impending seismic failure. Relying solely on Coulomb stress changes is insufficient for accurate seismic hazard assessment [46].
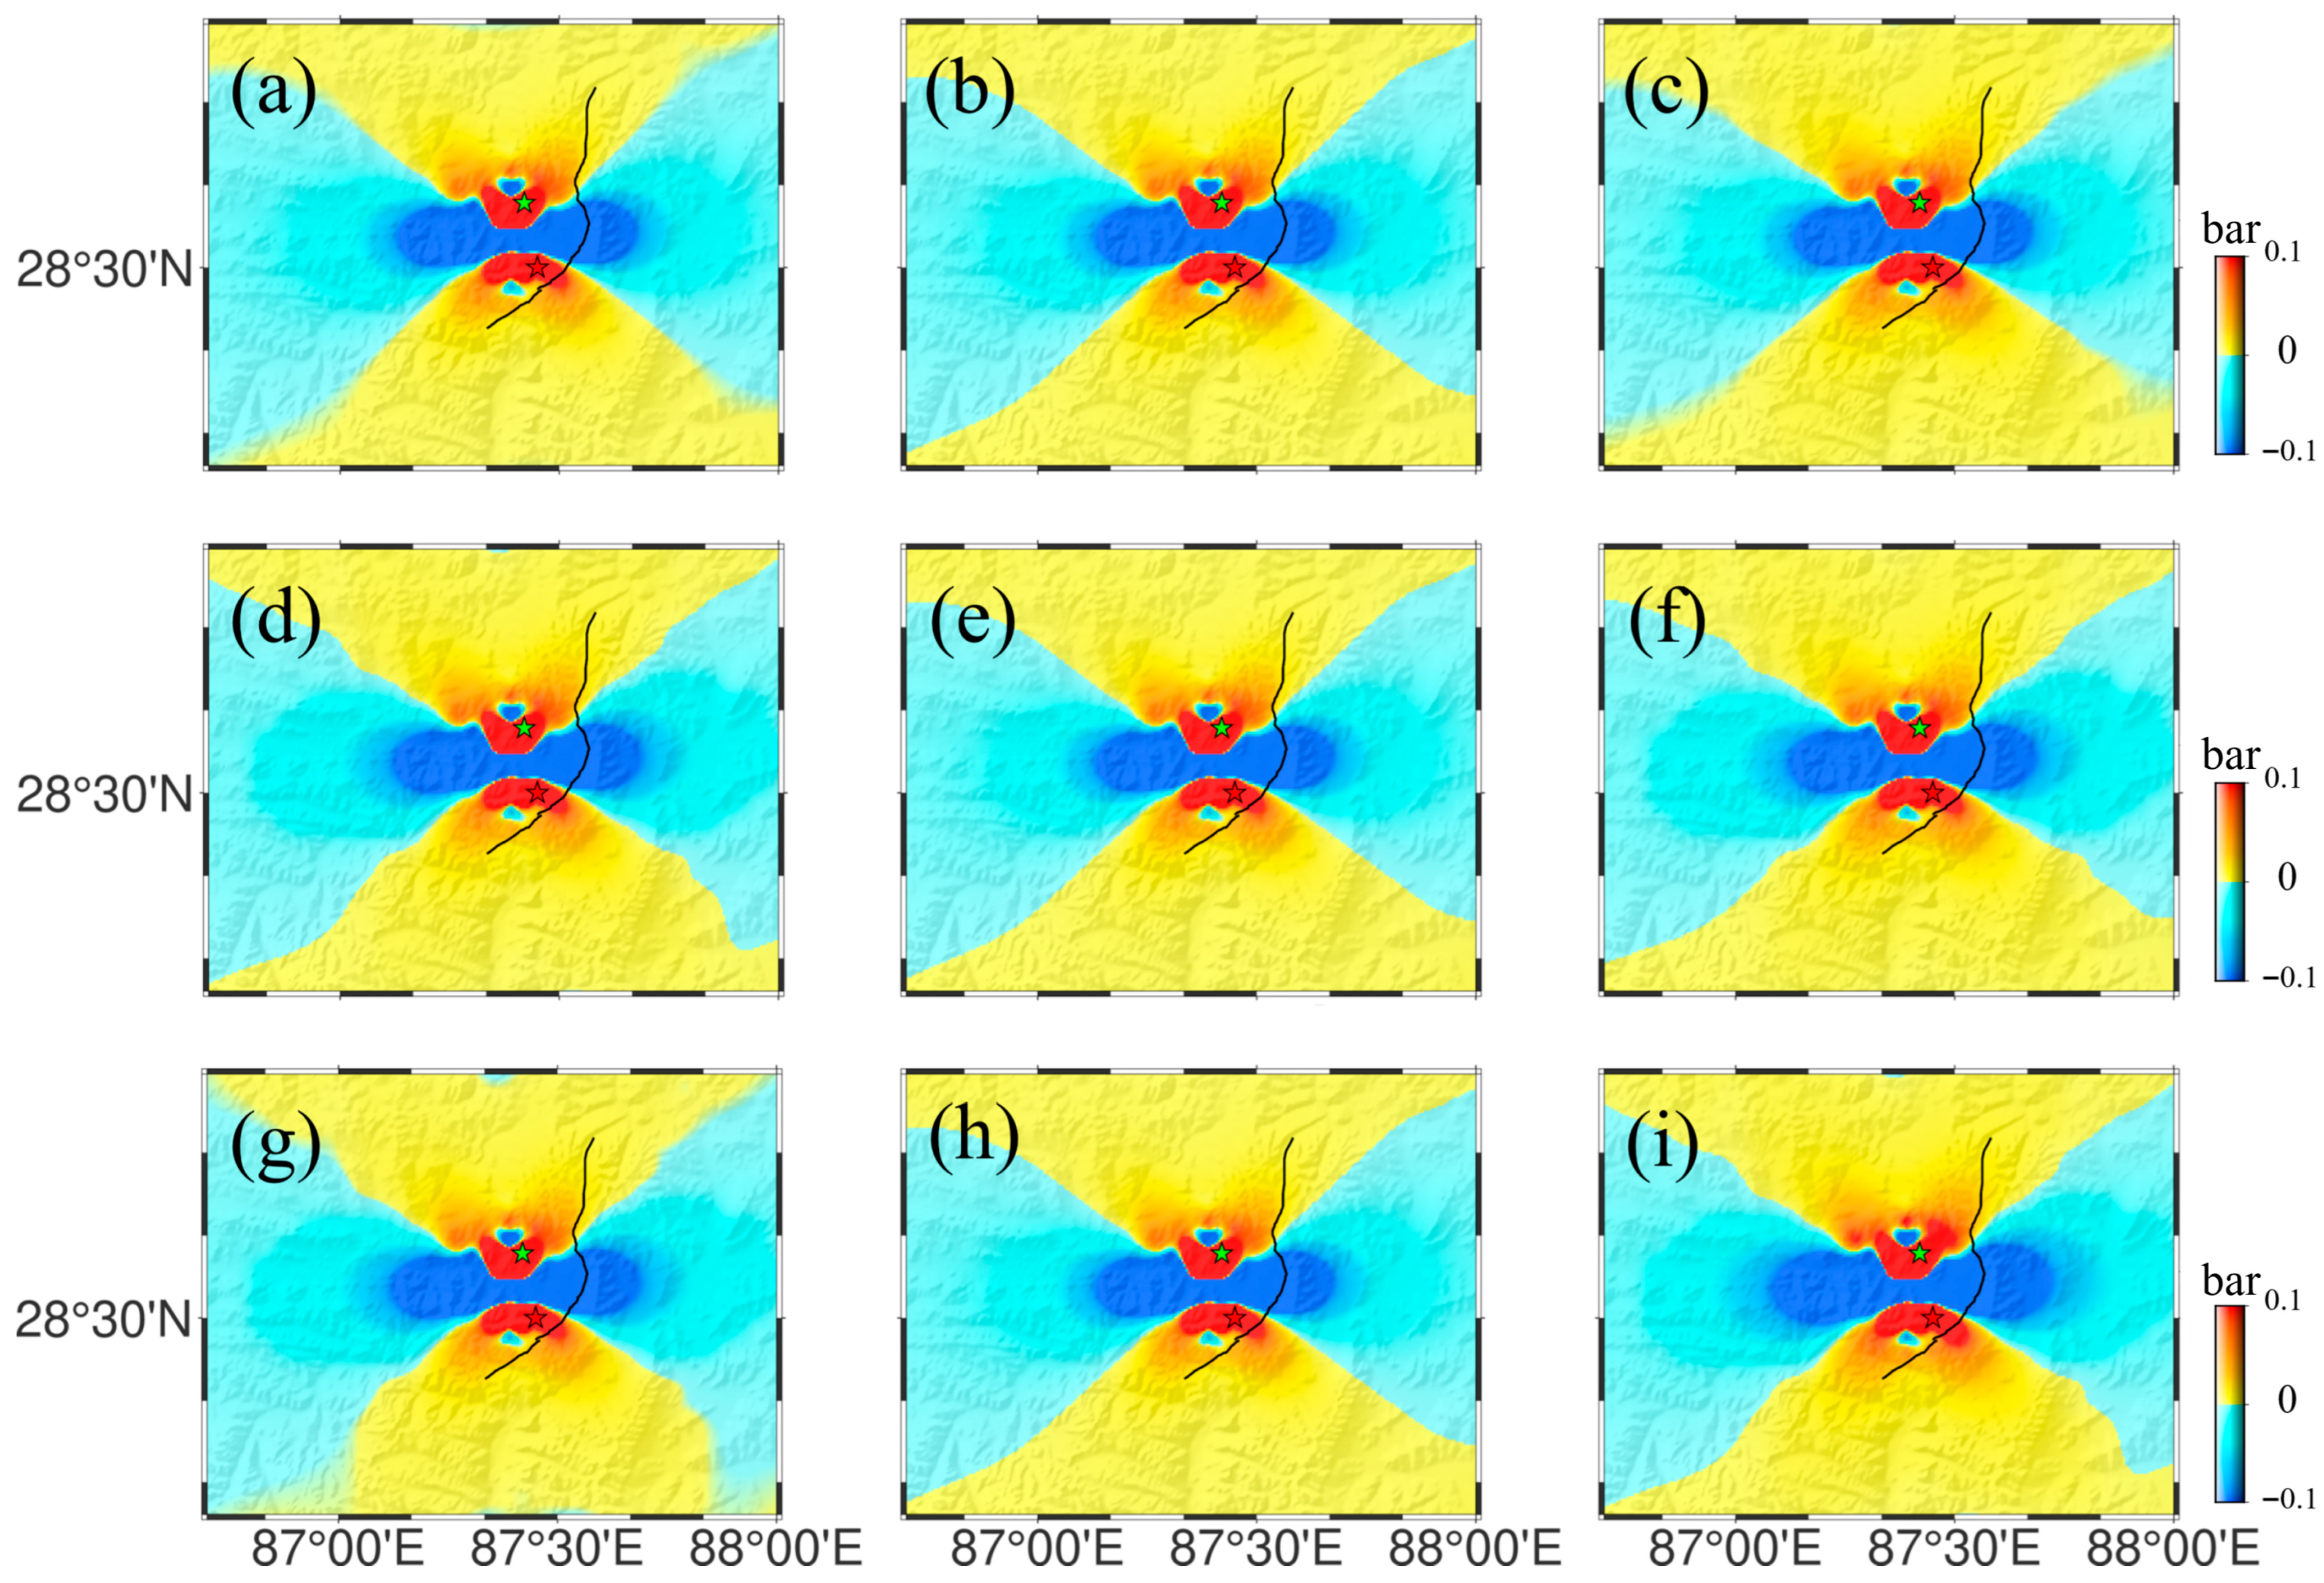
Friction coefficient is a core parameter for Coulomb stress changes, as different friction coefficients affect the Coulomb stress change; typically, however, the diverse results do not alter the properties of the regions, namely, the transition between loading and unloading zones (Figure 12) [47]. To quantify the influence of the friction coefficient on Coulomb stress changes, this study kept other parameters constant and set the friction coefficient to 0.2, 0.4, and 0.6, respectively, to investigate differences in Coulomb stress changes (Figure 12). As the friction coefficient increased from 0.2 to 0.6, the Coulomb stress changes were 10,200 Pa, 10,700 Pa, and 10,900 Pa, respectively. Although the increased Coulomb stress changes is relatively small, the Coulomb stress changes at a friction coefficient of 0.2 still exceed the triggering threshold. The epicenters influenced by the different friction coefficients are all located in stress-release zones. This indicates that variations of the friction coefficient did not change the stress loading and unloading zones.
Figure 12. The Coulomb stress changes for diverse parameters: (a) the Coulomb stress changes with a friction coefficient of 0.2; (b) the Coulomb stress changes with a friction coefficient of 0.4; (c) the Coulomb stress changes with a friction coefficient of 0.6; (d) the Coulomb stress changes with a viscosity of 1 × 10¹⁹ Pa·s; (e) the Coulomb stress changes with a viscosity of 1 × 10²⁰ Pa·s; (f) the Coulomb stress changes with a viscosity of 1 × 10²¹ Pa·s; (g) the Coulomb stress changes with fault parameters of GCMT; (h) the Coulomb stress changes with fault parameters of the 2020 Dingri earthquake; (i) the Coulomb stress changes with fault parameters of USGS. The green star denotes the epicenter of the 2020 Dingri earthquakes. The red star denotes the epi-center of the 2025 Dingri earthquakes. The black line denotes the Dengmecuo fault.
Geosciences 16 00363 g012
Moreover, co-seismic surface rupture generates stress changes, while the viscoelastic relaxation effect in the lower crust and upper mantle also induces stress variations, thereby influencing stress transfer on surrounding faults (Figure 12) [48]. To examine the impact of different viscosity coefficients on Coulomb stress changes, this study adopted viscosity coefficients of 1 × 10¹⁹ Pa·s, 1 × 10²⁰ Pa·s and 1 × 10²¹ Pa·s, corresponding to different layered rheological models. When the viscosity coefficient is 1 × 10¹⁹ Pa·s, the Coulomb stress change at the epicenter of 2025 Dingri earthquake is 10,900 Pa. When the viscosity coefficient is 1 × 10²⁰ Pa·s the Coulomb stress change is 10,700 Pa. The increase in the viscosity coefficient suppresses the flow of the viscoelastic medium, resulting in a reduction in stress transferred from the deep rheological layer to the seismogenic fault, thereby decreasing the Coulomb stress changes. When the viscosity coefficient is 1 × 10²¹ Pa·s, the Coulomb stress change is 11,000 Pa. This indicates that the rheological properties of the upper mantle have a limited influence on the upper crust. Therefore, different viscosity coefficients lead to minor variations in stress with all the Coulomb stress changes at the epicenter of the 2025 Dingri earthquake consistently exceeding the triggering threshold.
Furthermore, the diverse fault parameters of the receiving fault directly influence the Coulomb stress changes on the fault plane (Figure 12) [49]. Focal mechanism solutions are obtained by different institutions (Table 2). To validate the sensitivity of fault parameters to Coulomb stress changes, this study additionally calculated Coulomb stress changes based on focal mechanisms from the GCMT and USGS. The results indicate that, overall, the Coulomb stress changes derived from different fault parameters are consistent, with variations only occurring at the margins of the stress distribution. The epicenter of the 2025 Dingri earthquake is located entirely within the stress loading zone. The Coulomb stress changes calculated at the epicenter with the USGS and GCMT solutions are 9800 Pa and 10,500 Pa, respectively. This suggests that the receiving fault parameters adopted in this paper are within a reasonable range, thereby verifying the robustness of the results.
Many studies have examined the 2025 Dingri earthquake, and the focal mechanism exhibited similarities [6,50,51,52]. The surface rupture length ranges from 32 to 40 km, and the depth range is 16–36 km. In this study, we obtained a surface rupture length of 40 km and a depth of 20 km. The maximum slip distribution ranges from 3.5 to 6 m at depths of 2–12 km. In this study, the maximum slip is 5.1 m at a surface depth of 4.5 km. The seismic moment ranges from 4.03 × 10¹⁹–5.01 × 10¹⁹. In this study, the seismic moment is 2.82 × 10¹⁹, which is slightly lower than the aforementioned results. Although these findings differ slightly from those in Table 2, they are still credible. Moreover, the fault locking and slip deficit from ascending and descending tracks are consistent. In the northern segment of the Dengmecuo fault, the fault locking depth from the ascending track is approximately 5 km, while that from descending track is about 20 km. In contrast, on the southern side of the fault, the locking depths from both datasets are similar, at approximately 30 km. Notably, the fault is in a strongly locked state around the epicenter of the two Dingri earthquakes. The seismic moment from fault inversion is smaller than that from slip distribution (Table 2). Moreover, the clock-advance of approximately 6.5 years is calculated with a shear modulus of 30 GPa, a GNSS strain rate of 55 nstrain/yr, and a Coulomb stress change of 10,700 Pa. If the 2020 Dingri earthquake advances the earthquake by about 6.5 years, this implies that the earthquake might have originally been expected to occur around mid-2026. The actual Dingri earthquake occurred in 2025, indicating an actual advance of about 5 years. This calculated value (6.5 years) is relatively close to the actual observation (approximately 5 years), with an error of less than 1.5 years. Such an error is acceptable in simplified calculations and supports the view that the 2020 Dingri earthquake played a triggering role on the 2025 Dingri earthquake. While long-term probabilistic models like the GEM Global Seismic Hazard Mosaic provide valuable regional context, the short-term triggering mechanisms evaluated here require physics-based stress transfer analysis, as probabilistic frameworks are not designed to resolve event-specific interactions on the 5-year timescale [53].

5. Conclusions

Both the 2020 and the 2025 Dingri earthquakes are normal-fault earthquakes, with maximum co-seismic displacements of 14.2 cm and 131 cm, respectively. Three-dimensional displacement further verifies that both earthquakes are normal-fault types, with the greatest displacement along the E-W direction and the least displacement along the N-S direction. For the 2020 Dingri earthquake, the surface rupture is approximately 6 km in length and 4 km in width, with a majority slip at a depth of 2–4.5 km and a maximum slip of 1.3 m at a depth of roughly 3.55 km. The 2025 Dingri earthquake (F1) exhibits a substantially larger rupture, approximately 40 km long and 14.5 km wide. The slip primarily takes place at a depth of 2–9 km, with a maximum slip of 5.1 m at a depth of about 4.5 km. The F2 has a maximum displacement of about 0.46 m at a depth of 2.5 km. Since the 2020 Dingri earthquake, the surface along the Dengmecuo fault has been uplifting at a rate of approximately 14.4 mm/yr, which is considered a prerequisite for the 2025 Dingri earthquake. Five years after the 2020 Dingri earthquake, the maximum Coulomb stress change was 10,700 Pa, exceeding the triggering threshold for seismic activity. Furthermore, the maximum seismic moment of Mw 6.69 from fault inversion is smaller than the seismic moment of Mw = 6.9. Before the 2025 Dingri earthquake, the fault locking and slip deficit in the epicenter vicinity provide additional evidence for the likelihood of an imminent seismic. Therefore, these findings suggest that the 2020 Dingri earthquake probably triggered the 2025 Dingri earthquake.

Supplementary Materials

The following supporting information can be downloaded at: https://www.mdpi.com/article/10.3390/geosciences16090363/s1, Figure S1. The statistical distribution of optimal fault parameters for the 2020 seismic event derived from GBIS (Geodetic Bayesian Inversion Software). Figure S2. The statistical distribution of optimal fault parameters for the 2025 seismic event derived from GBIS (Geodetic Bayesian Inversion Software). Refs [54,55] are cited in Supplementary Materials file.

Author Contributions

W.W. contributed methodology, developed the software, and wrote the manuscript. J.Y. downloaded the data and checked the paper. All authors have read and agreed to the published version of the manuscript.

Funding

This study is supported by the Natural Science Basic Research Program of Shaanxi (Program No. 2024JC-YBQN-0348).

Data Availability Statement

Copernicus Open Access Hub is at https://copernicus.eu (accessed on 1 January 2026).

Acknowledgments

We would like to thank the ASF Earth Data Search, the ArcGIS (10.8) software, the Gamma (20231201) software from the Swiss GAMMA Remote Sensing AG, and the General Mapping Tool (GMT) (6.6) software.

Conflicts of Interest

The authors declare no conflicts of interests.

References

  1. Liu, J.-H.; Hu, J.; Li, Z.-W.; Zhu, J.-J.; Sun, Q.; Gan, J. A method for measuring 3-D surface deformations with InSAR based on strain model and variance component estimation. IEEE Trans. Geosci. Remote Sens. 2017, 56, 239–250. [Google Scholar] [CrossRef] [Scilit]
  2. Dal Zilio, L.; Hetényi, G.; Hubbard, J.; Bollinger, L. Building the Himalaya from tectonic to earthquake scales. Nat. Rev. Earth Environ. 2021, 2, 251–268. [Google Scholar] [CrossRef] [Scilit]
  3. Liu, Q.; Hua, J.; Zhang, Y.; Gong, W.; Zang, J.; Zhang, G.; Li, H. Geodetic observations and seismogenic structures of the 2025 mw 7.0 Dingri earthquake: The largest normal faulting event in the southern Tibet rift. Remote Sens. 2025, 17, 1096. [Google Scholar] [CrossRef] [Scilit]
  4. Zhao, B.; Huang, Y.; Zhang, C.; Wang, W.; Tan, K.; Du, R. Crustal deformation on the Chinese mainland during 1998–2014 based on GPS data. Geod. Geodyn. 2015, 6, 7–15. [Google Scholar] [CrossRef] [Scilit]
  5. Garthwaite, M.C.; Wang, H.; Wright, T.J. Broadscale interseismic deformation and fault slip rates in the central Tibetan Plateau observed using InSAR. J. Geophys. Res. Solid Earth 2013, 118, 5071–5083. [Google Scholar] [CrossRef] [Scilit]
  6. Yu, C.; Li, Z.; Hu, X.; Song, C.; Li, S.; Liu, H.; Li, J.; Han, B.; Liu, Z.; Liu, M. Source parameters and induced hazards of the 2025 Mw 7.1 Dingri earthquake on the southern Tibetan plateau (Xizhang), China, as revealed by imaging geodesy. J. Earth Sci. 2025. [Google Scholar] [CrossRef] [Scilit]
  7. Yao, J.; Yao, X.; Wang, Y.; Zhao, Z.; Liu, X. Current active fault distribution and slip rate along the middle section of the Jiali-Chayu fault from Sentinel-1 InSAR observations (2017–2022). Earth Planets Space 2024, 76, 21. [Google Scholar] [CrossRef] [Scilit]
  8. Yin, J.; Yao, H.; Yang, H.; Liu, J.; Qin, W.; Zhang, H. Frequency-dependent rupture process, stress change, and seismogenic mechanism of the 25 April 2015 Nepal Gorkha M w 7.8 earthquake. Sci. China Earth Sci. 2017, 60, 796–808. [Google Scholar] [CrossRef] [Scilit]
  9. Fan, W.; Shearer, P.M. Detailed rupture imaging of the 25 April 2015 Nepal earthquake using teleseismic P waves. Geophys. Res. Lett. 2015, 42, 5744–5752. [Google Scholar] [CrossRef] [Scilit]
  10. Sreejith, K.; Sunil, P.; Agrawal, R.; Saji, A.P.; Ramesh, D.; Rajawat, A. Coseismic and early postseismic deformation due to the 25 April 2015, Mw 7.8 Gorkha, Nepal, earthquake from InSAR and GPS measurements. Geophys. Res. Lett. 2016, 43, 3160–3168. [Google Scholar] [CrossRef] [Scilit]
  11. Sun, L.; Wang, L.; Xu, G.; Wu, Q. A new method of variational Bayesian slip distribution inversion. J. Geod. 2023, 97, 10. [Google Scholar] [CrossRef] [Scilit]
  12. Bilham, R.; Gaur, V.K.; Molnar, P. Himalayan seismic hazard. Science 2001, 293, 1442–1444. [Google Scholar] [CrossRef] [Scilit]
  13. Zha, X.; Dai, Z. Using geodetic data to calculate stress changes on faults in the Tibetan Plateau caused by the 2015 Mw7. 8 Nepal earthquake. J. Asian Earth Sci. 2017, 133, 38–45. [Google Scholar] [CrossRef] [Scilit]
  14. Feng, G.; Li, Z.; Shan, X.; Zhang, L.; Zhang, G.; Zhu, J. Geodetic model of the 2015 April 25 M w 7.8 Gorkha Nepal Earthquake and M w 7.3 aftershock estimated from InSAR and GPS data. Geophys. J. Int. 2015, 203, 896–900. [Google Scholar] [CrossRef] [Scilit]
  15. Vajedian, S.; Aflaki, M.; Mousavi, Z.; Ghods, A.; Walker, R.; Maurer, J. Seismotectonic modeling of the 2017 Hojedk (Kerman) earthquake sequence from joint inversion of InSAR and offset tracking techniques. Remote Sens. Environ. 2023, 288, 113461. [Google Scholar] [CrossRef] [Scilit]
  16. He, L.; Feng, G.; Hu, J.; Xu, W.; Liu, J.; Li, Z.; Feng, Z.; Wang, Y.; Lu, H. Surface displacement and source model separation of the two strongest earthquakes during the 2019 Ridgecrest sequence: Insights from InSAR, GPS, and optical data. J. Geophys. Res. Solid Earth 2022, 127, e2021JB022779. [Google Scholar] [CrossRef] [Scilit]
  17. Cosenza-Muralles, B.; DeMets, C.; Márquez-Azúa, B.; Sánchez, O.; Stock, J.; Cabral-Cano, E.; McCaffrey, R. Co-seismic and post-seismic deformation for the 1995 Colima–Jalisco and 2003 Tecomán thrust earthquakes, Mexico subduction zone, from modelling of GPS data. Geophys. J. Int. 2022, 228, 2137–2173. [Google Scholar] [CrossRef] [Scilit]
  18. Zhang, X.; Li, Z.; Liu, Z. Reduction of atmospheric effects on InSAR observations through incorporation of GACOS and PCA into small baseline subset InSAR. IEEE Trans. Geosci. Remote Sens. 2023, 61, 5209115. [Google Scholar] [CrossRef] [Scilit]
  19. Liang, S.; Gan, W.; Shen, C.; Xiao, G.; Liu, J.; Chen, W.; Ding, X.; Zhou, D. Three-dimensional velocity field of present-day crustal motion of the Tibetan Plateau derived from GPS measurements. J. Geophys. Res. Solid Earth 2013, 118, 5722–5732. [Google Scholar] [CrossRef] [Scilit]
  20. Pan, Y.; Shen, W.-B.; Shum, C.; Chen, R. Spatially varying surface seasonal oscillations and 3-D crustal deformation of the Tibetan Plateau derived from GPS and GRACE data. Earth Planet. Sci. Lett. 2018, 502, 12–22. [Google Scholar] [CrossRef] [Scilit]
  21. National GNSS Velocity Field Dataset. 2025. Available online: https://data.earthquake.cn (accessed on 7 March 2026).
  22. Pietrolungo, F.; Lavecchia, G.; Madarieta-Txurruka, A.; Sparacino, F.; Srivastava, E.; Cirillo, D.; de Nardis, R.; Andrenacci, C.; Bello, S.; Parrino, N. Comparison of crustal stress and strain fields in the Himalaya–Tibet region: Geodynamic implications. Remote Sens. 2024, 16, 4765. [Google Scholar]
  23. Gan, W.; Zhang, P.; Shen, Z.K.; Niu, Z.; Wang, M.; Wan, Y.; Zhou, D.; Cheng, J. Present-day crustal motion within the Tibetan Plateau inferred from GPS measurements. J. Geophys. Res. Solid Earth 2007, 112, B08416. [Google Scholar] [CrossRef] [Scilit]
  24. Hu, J.; Li, Z.; Ding, X.; Zhu, J.; Zhang, L.; Sun, Q. Resolving three-dimensional surface displacements from InSAR measurements: A review. Earth-Sci. Rev. 2014, 133, 1–17. [Google Scholar] [CrossRef] [Scilit]
  25. Sumy, D.F.; Cochran, E.S.; Keranen, K.M.; Wei, M.; Abers, G.A. Observations of static Coulomb stress triggering of the November 2011 M5. 7 Oklahoma earthquake sequence. J. Geophys. Res. Solid Earth 2014, 119, 1904–1923. [Google Scholar] [CrossRef] [Scilit]
  26. Wang, R.; Lorenzo-Martín, F.; Roth, F. PSGRN/PSCMP—A new code for calculating co-and post-seismic deformation, geoid and gravity changes based on the viscoelastic-gravitational dislocation theory. Comput. Geosci. 2006, 32, 527–541. [Google Scholar] [CrossRef] [Scilit]
  27. Toda, S.; Stein, R.S.; Lin, J. Widespread seismicity excitation throughout central Japan following the 2011 M= 9.0 Tohoku earthquake and its interpretation by Coulomb stress transfer. Geophys. Res. Lett. 2011, 38, L00G03. [Google Scholar] [CrossRef] [Scilit]
  28. Lanari, R.; Berardino, P.; Bonano, M.; Casu, F.; Manconi, A.; Manunta, M.; Manzo, M.; Pepe, A.; Pepe, S.; Sansosti, E. Surface displacements associated with the L’Aquila 2009 Mw 6.3 earthquake (central Italy): New evidence from SBAS-DInSAR time series analysis. Geophys. Res. Lett. 2010, 37, L20309. [Google Scholar] [CrossRef] [Scilit]
  29. Jiang, K.; Xu, W.; Xie, L. Unwrap intractable C-band coseismic interferograms: An improved SNAPHU method with range offset gradients as prior information. J. Geophys. Res. Solid Earth 2024, 129, e2024JB028826. [Google Scholar] [CrossRef] [Scilit]
  30. Henriquet, M.; Kordic, B.; Métois, M.; Lasserre, C.; Baize, S.; Benedetti, L.; Spelić, M.; Vukovski, M. Rapid remeasure of dense civilian networks as a game-changer tool for surface deformation monitoring: The case study of the Mw 6.4 2020 Petrinja Earthquake, Croatia. Geophys. Res. Lett. 2022, 49, e2022GL100166. [Google Scholar] [CrossRef] [Scilit]
  31. Woods, K.; Wallace, L.M.; Williams, C.A.; Hamling, I.J.; Webb, S.C.; Ito, Y.; Palmer, N.; Hino, R.; Suzuki, S.; Savage, M.K. Spatiotemporal evolution of slow slip events at the offshore Hikurangi Subduction Zone in 2019 using GNSS, InSAR, and seafloor geodetic data. J. Geophys. Res. Solid Earth 2024, 129, e2024JB029068. [Google Scholar] [CrossRef] [Scilit]
  32. Amighpey, M.; Voosoghi, B.; Motagh, M. Deformation and fault parameters of the 2005 Qeshm earthquake in Iran revisited: A Bayesian simulated annealing approach applied to the inversion of space geodetic data. Int. J. Appl. Earth Obs. Geoinf. 2014, 26, 184–192. [Google Scholar] [CrossRef] [Scilit]
  33. Gephart, J.W.; Forsyth, D.W. An improved method for determining the regional stress tensor using earthquake focal mechanism data: Application to the San Fernando earthquake sequence. J. Geophys. Res. Solid Earth 1984, 89, 9305–9320. [Google Scholar] [CrossRef] [Scilit]
  34. Li, Y.; Song, X.; Shan, X.; Qu, C.; Wang, Z. Locking degree and slip rate deficit distribution on MHT fault before 2015 Nepal Mw 7.9 earthquake. J. Asian Earth Sci. 2016, 119, 78–86. [Google Scholar] [CrossRef] [Scilit]
  35. Zhao, X.; Zhou, L.; Xu, C.; Jiang, G.; Feng, W.; Wen, Y.; Fang, N. Modified Bayesian method for simultaneously imaging fault geometry and slip distribution with reduced uncertainty, applied to 2017 Mw 7.3 Sarpol-e Zahab (Iran) earthquake. J. Geod. 2024, 98, 106. [Google Scholar] [CrossRef] [Scilit]
  36. Liu, X.; Deng, D.; Jia, Z.; Liu-Zeng, J.; Mo, X.; Huang, Y.; Ruan, Q.; Liu, J. Refined coseismic slip model and surface deformation of the 2021 Maduo Earthquake: Implications for sensitivity of rupture behaviors to geometric complexity. Remote Sens. 2024, 16, 713. [Google Scholar] [CrossRef] [Scilit]
  37. Zhao, D.; Qu, C.; Bürgmann, R.; Gong, W.; Shan, X.; Qiao, X.; Zhao, L.; Chen, H.; Liu, L. Large-scale crustal deformation, slip-rate variation, and strain distribution along the Kunlun Fault (Tibet) from Sentinel-1 InSAR observations (2015–2020). J. Geophys. Res. Solid Earth 2022, 127, e2021JB022892. [Google Scholar] [CrossRef] [Scilit]
  38. Chen, H.; Qu, C.; Zhao, D.; Ma, C.; Shan, X. Rupture kinematics and coseismic slip model of the 2021 Mw 7.3 Maduo (China) earthquake: Implications for the seismic hazard of the Kunlun fault. Remote Sens. 2021, 13, 3327. [Google Scholar] [CrossRef] [Scilit]
  39. Amey, R.; Hooper, A.; Walters, R. A Bayesian method for incorporating self-similarity into earthquake slip inversions. J. Geophys. Res. Solid Earth 2018, 123, 6052–6071. [Google Scholar] [CrossRef] [Scilit]
  40. Shao, Y.; Wang, A.; Liu, J.; Wang, W.; Han, L.; Xing, L. Preliminary investigation on surface rupture and coseismic displacement of the January 7, 2025 Dingri earthquake in Xizang. Earth Sci. 2025, 50, 1677–1695. [Google Scholar]
  41. Hao, M.; Li, Y.; Zhuang, W. Crustal movement and strain distribution in East Asia revealed by GPS observations. Sci. Rep. 2019, 9, 16797. [Google Scholar] [CrossRef] [Scilit] [PubMed]
  42. Frohling, E.; Szeliga, W. GPS constraints on interplate locking within the Makran subduction zone. Geophys. Suppl. Mon. Not. R. Astron. Soc. 2016, 205, 67–76. [Google Scholar] [CrossRef] [Scilit]
  43. McCloskey, J.; Nalbant, S.S.; Steacy, S. Earthquake risk from co-seismic stress. Nature 2005, 434, 291. [Google Scholar] [CrossRef] [Scilit]
  44. Hardebeck, J.L. Coseismic and postseismic stress rotations due to great subduction zone earthquakes. Geophys. Res. Lett. 2012, 39, L21313. [Google Scholar] [CrossRef] [Scilit]
  45. Shan, B.; Zheng, Y.; Liu, C.; Xie, Z.; Kong, J. Coseismic Coulomb failure stress changes caused by the 2017 M 7.0 Jiuzhaigou earthquake, and its relationship with the 2008 Wenchuan earthquake. Sci. China Earth Sci. 2017, 60, 2181–2189. [Google Scholar] [CrossRef] [Scilit]
  46. Cocco, M.; Rice, J.R. Pore pressure and poroelasticity effects in Coulomb stress analysis of earthquake interactions. J. Geophys. Res. Solid Earth 2002, 107, ESE 2–1–ESE 2–17. [Google Scholar] [CrossRef] [Scilit]
  47. Yang, G.; Yu, S.; Lei, D.; Wu, J.; Cai, Y. InSAR Coseismic Deformation, Fault Slip Inversion and Coulomb Stress Evolution of the Qinghai Menyuan Earthquake on January 8, 2022, China. Izv. Phys. Solid Earth 2023, 59, 1113–1124. [Google Scholar] [CrossRef] [Scilit]
  48. Decriem, J.; Árnadóttir, T. Transient crustal deformation in the South Iceland Seismic Zone observed by GPS and InSAR during 2000–2008. Tectonophysics 2012, 581, 6–18. [Google Scholar] [CrossRef] [Scilit]
  49. Ding, Y.; Liu, X.; Dai, X.; Yin, G.; Yang, Y.; Guo, J. D-InSAR-based analysis of slip distribution and coulomb stress implications from the 2024 Mw 7.01 Wushi Earthquake. Remote Sens. 2024, 16, 4319. [Google Scholar] [CrossRef] [Scilit]
  50. Liang, D.; Xu, Y.; Ding, Q.; Shu, C.; Zhang, X.; Qin, Y.; Wu, W.; Meng, Z. Coseismic Slip and Early Postseismic Deformation Characteristics of the 2025 Mw 7.0 Dingri Earthquake. Remote Sens. 2026, 18, 239. [Google Scholar] [CrossRef] [Scilit]
  51. Yang, G.; Zha, Y.; Yu, S.; Lei, D.; Hu, Q.; Wu, J. InSAR coseismic deformation, fault slip inversion and coulomb stress evolution of the Xizang Dingri earthquake on January 7, 2025, China. J. Seism. 2025, 29, 1829–1849. [Google Scholar] [CrossRef] [Scilit]
  52. Zhao, X.; Xiao, Z.; Wang, W.; Li, J. Along-strike variation of the unilateral rupture of the 2025 Mw7. 1 Dingri, Xizang earthquake: One of the shallowest M7+ normal-faulting events on the Tibetan Plateau. Geophys. Res. Lett. 2025, 52, e2025GL119397. [Google Scholar] [CrossRef] [Scilit]
  53. Pagani, M.; Monelli, D.; Weatherill, G.; Danciu, L.; Crowley, H.; Silva, V.; Henshaw, P.; Butler, L.; Nastasi, M.; Panzeri, L. OpenQuake engine: An open hazard (and risk) software for the global earthquake model. Seismol. Res. Lett. 2014, 85, 692–702. [Google Scholar] [CrossRef] [Scilit]
  54. Okada, Y. Surface deformation due to shear and tensile faults in a half-space. Bull. Seismol. Soc. Am. 1985, 75, 1135–1154. [Google Scholar] [CrossRef] [Scilit]
  55. Okada, Y. Internal deformation due to shear and tensile faults in a half-space. Bull. Seismol. Soc. Am. 1992, 82, 1018–1040. [Google Scholar] [CrossRef] [Scilit]

Table 1. The Satellite parameters for the 2020 and 2025 Dingri earthquakes.
EarthquakeSatelliteTrackPathReferenceSecondary
2020 Dingri earthquakeSentinel-1AAscending122020030820200320
2020 Dingri earthquakeSentinel-1ADescending1212020031620200328
2025 Dingri earthquakeSentinel-1AAscending122025010520250117
2025 Dingri earthquakeSentinel-1ADescending1212025010120250113
Table 2. The diverse focal mechanisms of two Dingri earthquakes.
EarthquakeInstitutionLongitude/°Latitude/°Depth/kmStrike/°Dip/°Rake/°Mw
2020 Dingri earthquakeGFZ87.3328.651318540−665.7
IPCG87.3228.6716248−975.8
GCMT87.4228.511218447−775.7
USGS87.30828.591018042−775.7
CENC87.4228.631217070−1065.9
this paper87.4428.591116855−835.8
2025 Dingri earthquakeUSGS87.3628.6311.518749−787.1
GCMT87.4728.561217348−927.1
IPGP87.3629.631419644−647.16
this paper87.4528.5918651−816.9
Disclaimer/Publisher’s Note: The statements, opinions and data contained in all publications are solely those of the individual author(s) and contributor(s) and not of MDPI and/or the editor(s). MDPI and/or the editor(s) disclaim responsibility for any injury to people or property resulting from any ideas, methods, instructions or products referred to in the content.