Article

Characteristics and Sources of Ore-Forming Fluids in the Hailijin Uranium Deposit, Songliao Basin


1
National Key Laboratory of Uranium Resources Exploration-Mining and Nuclear Remote Sensing, Beijing 100029, China
2
Beijing Research Institute of Uranium Geology, Beijing 100029, China
3
No. 243 Geological Party of China National Nuclear Corporation, Chifeng 024006, China
*
Authors to whom correspondence should be addressed.
Geosciences 2026, 16(8), 301; https://doi.org/10.3390/geosciences16080301

Submission received: 27 May 2026 / Revised: 7 July 2026 / Accepted: 8 July 2026 / Published: 28 July 2026
(This article belongs to the Special Issue Isotope Geochemistry: New Techniques and Applications)

Abstract

The Hailijin uranium (U) deposit is one of the super-large U-deposits recently discovered in the Qianjiadian ore field, southwestern Songliao Basin. The ore bodies are mainly hosted in the lower member sandstones of the Upper Cretaceous Yaojia Formation and occur as multilayered tabular bodies. The nature and source of the ore-forming fluids remain unclear, limiting the understanding of the genetic type of the deposit. This study integrated drill-core observation, mineralogy, whole-rock geochemistry, in situ pyrite trace elements and sulfur isotopes, fluid-inclusion, and Raman spectroscopy to constrain ore-forming fluids. The host sandstones experienced hematitization, limonitization, carbonate cementation, clay alteration, sulfidation and bleaching. Pitchblende and coffinite occur as submicron grains in dissolution pores of quartz and feldspar, on clay-mineral surfaces and within mobile organic matter (OM), commonly associated with pyrite and sphalerite. The ores and gray mineralized sandstones are enriched in U, Mo, Re, Co, Ni, Zn and Pb, and syn-ore pyrite shows positive correlations between U and As, Mo, Cu, Zn, Se and Sb. Mineralization-related fluid-inclusion assemblages occur mainly in syn-ore dolomite/ankerite cements and in secondary trails along microfractures in detrital quartz; they yield homogenization temperatures of 130–190 °C and salinities of 3–8 wt.% NaCl eq., higher than the normal burial temperature of the basin (80–90 °C), especially meteoric fluid. Raman and gas-chromatographic analyses indicate carbonaceous matter, CH4, CO2, H2 and minor O2. Pyrite δ34S values of −49.24‰ to −23.1‰ indicate isotopically light reduced sulfur ultimately related to microbial sulfate reduction and/or thermal decomposition of sulfur-bearing OM, whereas thermochemical sulfate reduction was unlikely to be dominant. Therefore, the ore-forming fluid is interpreted as a low-temperature, low-salinity organic-rich fluid, most likely derived from U-enriched source rocks at depth, and the uranium mineralization is closely associated with the exudation of such deep-derived organic fluids.

1. Introduction

The Songliao Basin, located in northeastern China, is one of the largest and most productive Cretaceous-Cenozoic continental sedimentary basins worldwide [1]. Renowned for its vast energy resources, including oil, natural gas, and coal, the basin has also emerged as a premier province for sandstone-type uranium mineralization in recent decades [2,3]. Specifically, the southwestern part of the basin—encompassing the Kailu Depression and the Western Slope—has become a focal point for uranium exploration. Significant discoveries, such as the Qianjiadian, Baolongshan, and Dalin deposits, have been discovered to establish this region as a critical component of China’s “northeastern uranium ore field”. The recently discovered Hailijin uranium deposit is a super-large deposit situated in this prolific field. The Hailijin deposit is primarily hosted within the lower member of the Upper Cretaceous Yaojia Formation and shown as multilayered tabular. The ore-bearing strata consist of a unique fluvial “red-mottled” sedimentary sequence. A defining characteristic of the Hailijin deposit is its spatial architecture: the uranium mineralization is hosted within grayish sandstones that are vertically sandwiched between primary red oxidized layers—a configuration often described as “two red layers enclosing one gray body”. The tabular ore bodies appear “suspended” within these epigenetic reduced sandstones, presenting a distinct difference from the traditional roll-front or interlayer oxidation models commonly observed in other sandstone-type deposits [4,5].
Previous studies on the Hailijin deposit and its neighboring areas have primarily focused on regional geological settings, stratigraphic correlation, geochronology and basic mineralogical descriptions. Some researchers have attributed the formation of the ore-controlling gray sandstones to the infiltration of meteoric oxidizing fluids, while others have noted the potential influence of deep-seated reducing agents [4,6,7], and some researchers have also evaluated the mineability of the ore-bearing sandstones [8,9,10]. However, the specific nature, temperature, and provenance of the ore-forming fluids remain poorly constrained. In particular, the source of the reducing fluids responsible for the epigenetic decoloration of the primary red beds and the subsequent precipitation of uranium is still a subject of intense debate. Whether these fluids originated from the upward migration of deep hydrocarbons, hydrothermal activity, or local OM degradation remains an unresolved scientific question [11]. To address these knowledge gaps, this study presents a comprehensive investigation into the characteristics and sources of the ore-forming fluids in the Hailijin uranium deposit. By integrating detailed drill-core observations with advanced analytical techniques—including mineralogy, petrogeochemistry, fluid inclusion microthermometry, and stable isotope (C, S) geochemistry to constrain and characterize the ore-forming fluid and associated processes. The primary objectives are to: (1) determine the physicochemical properties and origin of the mineralizing fluids; (2) clarify the genetic relationship between the “red-mottled” formation and the epigenetic reduction; and (3) identify the genetic type of U-mineralization for the Hailijin deposit. This research not only enhances our understanding of the complex fluid systems in the Songliao Basin but also provides theoretical guidance for the exploration of sandstone-type uranium deposits hosted in similar red-mottled sedimentary environments globally.

2. Geological Setting

2.1. Regional Geological Characteristics

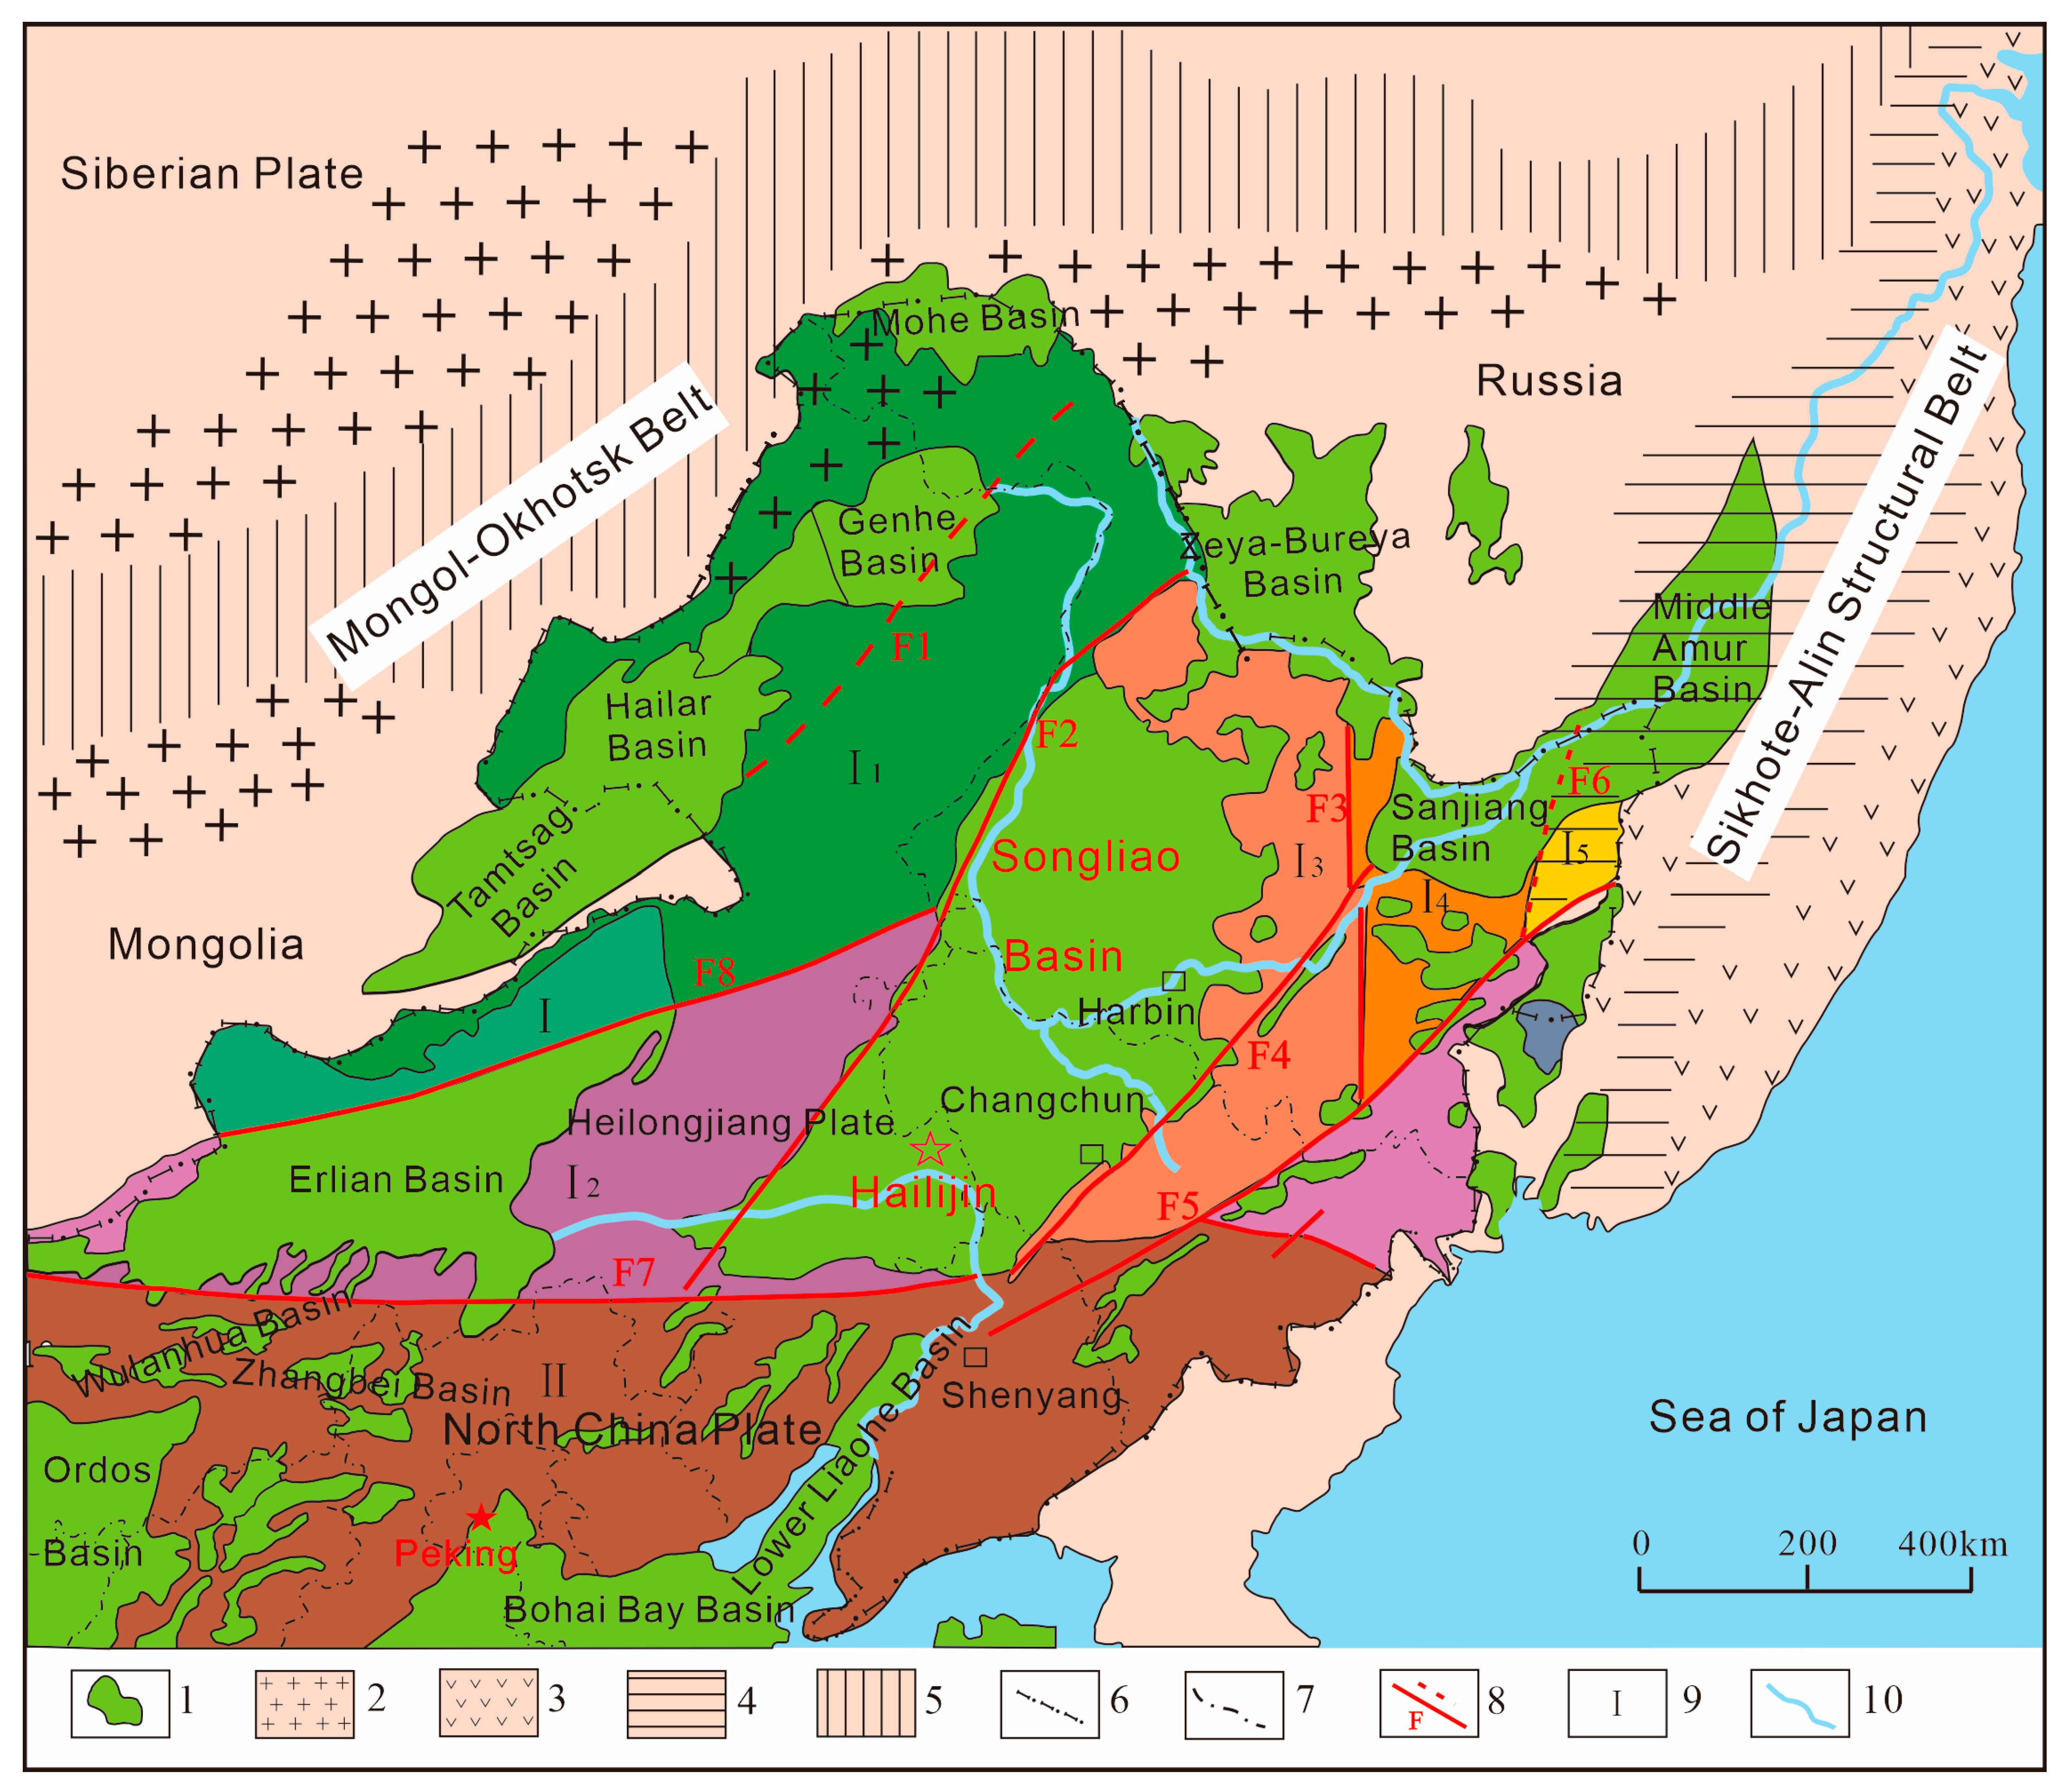
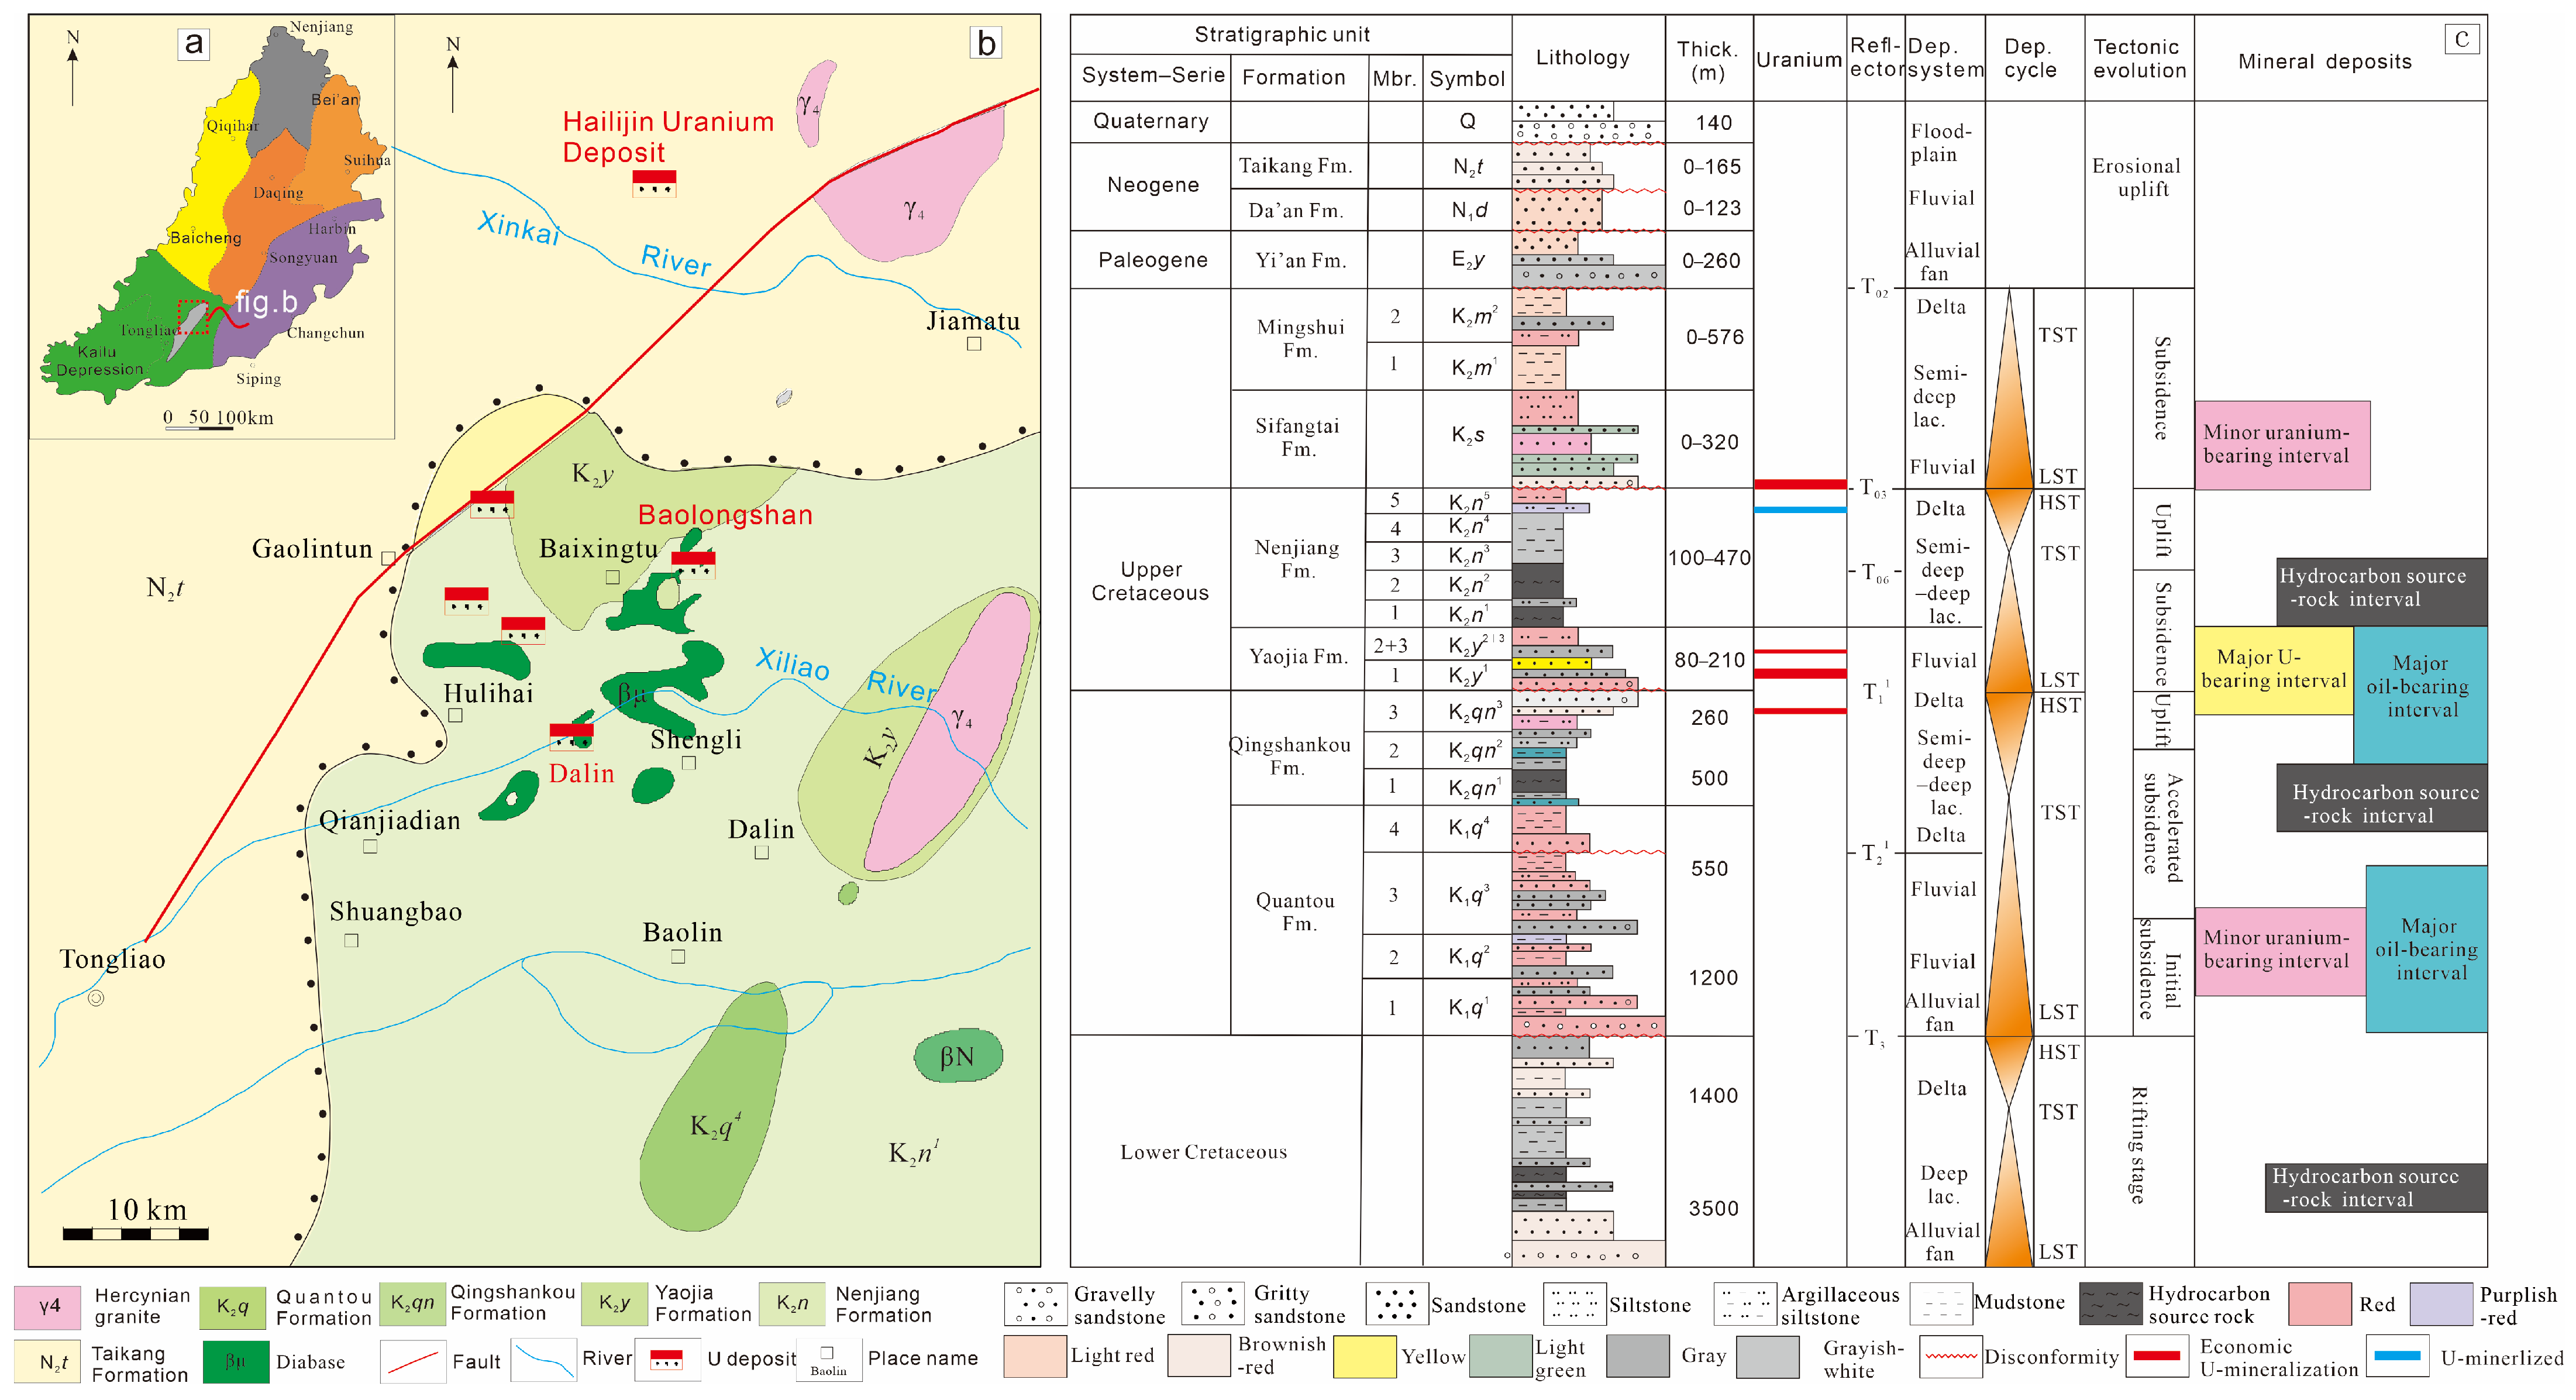
The Songliao Basin is a Mesozoic continental rift-depression basin developed upon a cratonic basement, strategically located at the intersection of the Paleo-Asian, Mongol-Okhotsk, and Paleo-Pacific tectonic domains. Its structural framework is governed by peripheral plate dynamics: it connects to the Siberian Plate via the Mongol-Okhotsk suture zone to the north and to the Pacific Plate through the Sikhote-Alin orogenic belt to the east (Figure 1) [12,13,14]. The basin primarily rests on the Songnen Block, with its southern margin extending onto the northern accretionary belt of the North China Craton. Numerous large- to medium-sized uranium deposits have been discovered in the southwestern Songliao Basin, including the Qianjiadian, Dalin, Hailijin, Baolongshan, and Hulihai deposits (Figure 2a), and this area has now become one of the most important uranium ore fields in China.
As a vast Meso-Cenozoic superimposed basin in the eastern Central Asian Orogenic Belt, it features a basement of Paleozoic metamorphic rocks and Mesozoic acidic igneous rocks, overlain by a thick sequence of Cretaceous–Cenozoic clastic cover and a predominant NE–NNE trending fault system [2]. Internally, the basin is partitioned into six primary structural units, including the Central Depression and Western Slope, and has evolved through three distinct stages: Early Cretaceous syn-rift extension, Late Cretaceous post-rift thermal subsidence, and terminal Cretaceous structural inversion [14,15]. The regional stratigraphic sequence consists of a basement and a Mesozoic–Cenozoic cover composed mainly of Cretaceous, Paleogene, and Neogene sequences. In the Lower Cretaceous, three sets of hydrocarbon source rocks are developed, including the Shahai, Jiufotang, and Fuxin formations, whereas U-mineralization has been identified in the Upper Cretaceous Qingshankou, Yaojia, Nenjiang, and Sifangtai formations (Figure 2c). Notably, the fluvial-deltaic “red-mottled” formation in the lower member of the Yaojia Formation serves as the primary economic uranium mineralization. The spatial architecture of the ore-bearing strata is jointly controlled by the underlying dark lacustrine reducing basement of the Qingshankou Formation and regional tectonic restructuring, collectively forming the unique geological framework for sandstone-type uranium mineralization in the Hailijin deposit.

2.2. Geological Characteristics of Ore Deposits

The Hailijin large uranium deposit is situated within the Qianjiadian uranium ore field in the Kailu Depression, southwestern Songliao Basin (Figure 2). Its tectonic setting, located on the northern wing of the Baolongshan tectonic window, is governed by a pre-Mesozoic basement fault system. The burial configuration of the strata follows a ‘northwest-high and southeast-low’ pattern, with a basement of Paleozoic low-grade metamorphic rocks overlain by a continuous Cretaceous-to-Cenozoic continental sedimentary cover (Figure 2c), including the Quantou, Qingshankou, Yaojia, Nenjiang, Mingshui and Sifangtai Formations. The regional structural framework is dominated by NE-trending fault zones, notably the major basin-controlling structure in the southeast, the Tongliao-Anguang basement fault (Figure 2b). This structure manifests as a typical listric normal fault, defines the eastern boundary of the Qianjiadian single-faulted half-graben, establishing a dual ‘syn-rift and post-rift’ stratigraphic architecture. During the terminal Nenjiang Movement, regional compression triggered localized tectonic inversion along the main fault, resulting in anticlinal uplift in the hanging wall and associated step-like thrusting. Concurrently, parallel branch normal faults and strike-slip faults served as critical conduits for the migration of mineralizing fluids [16].
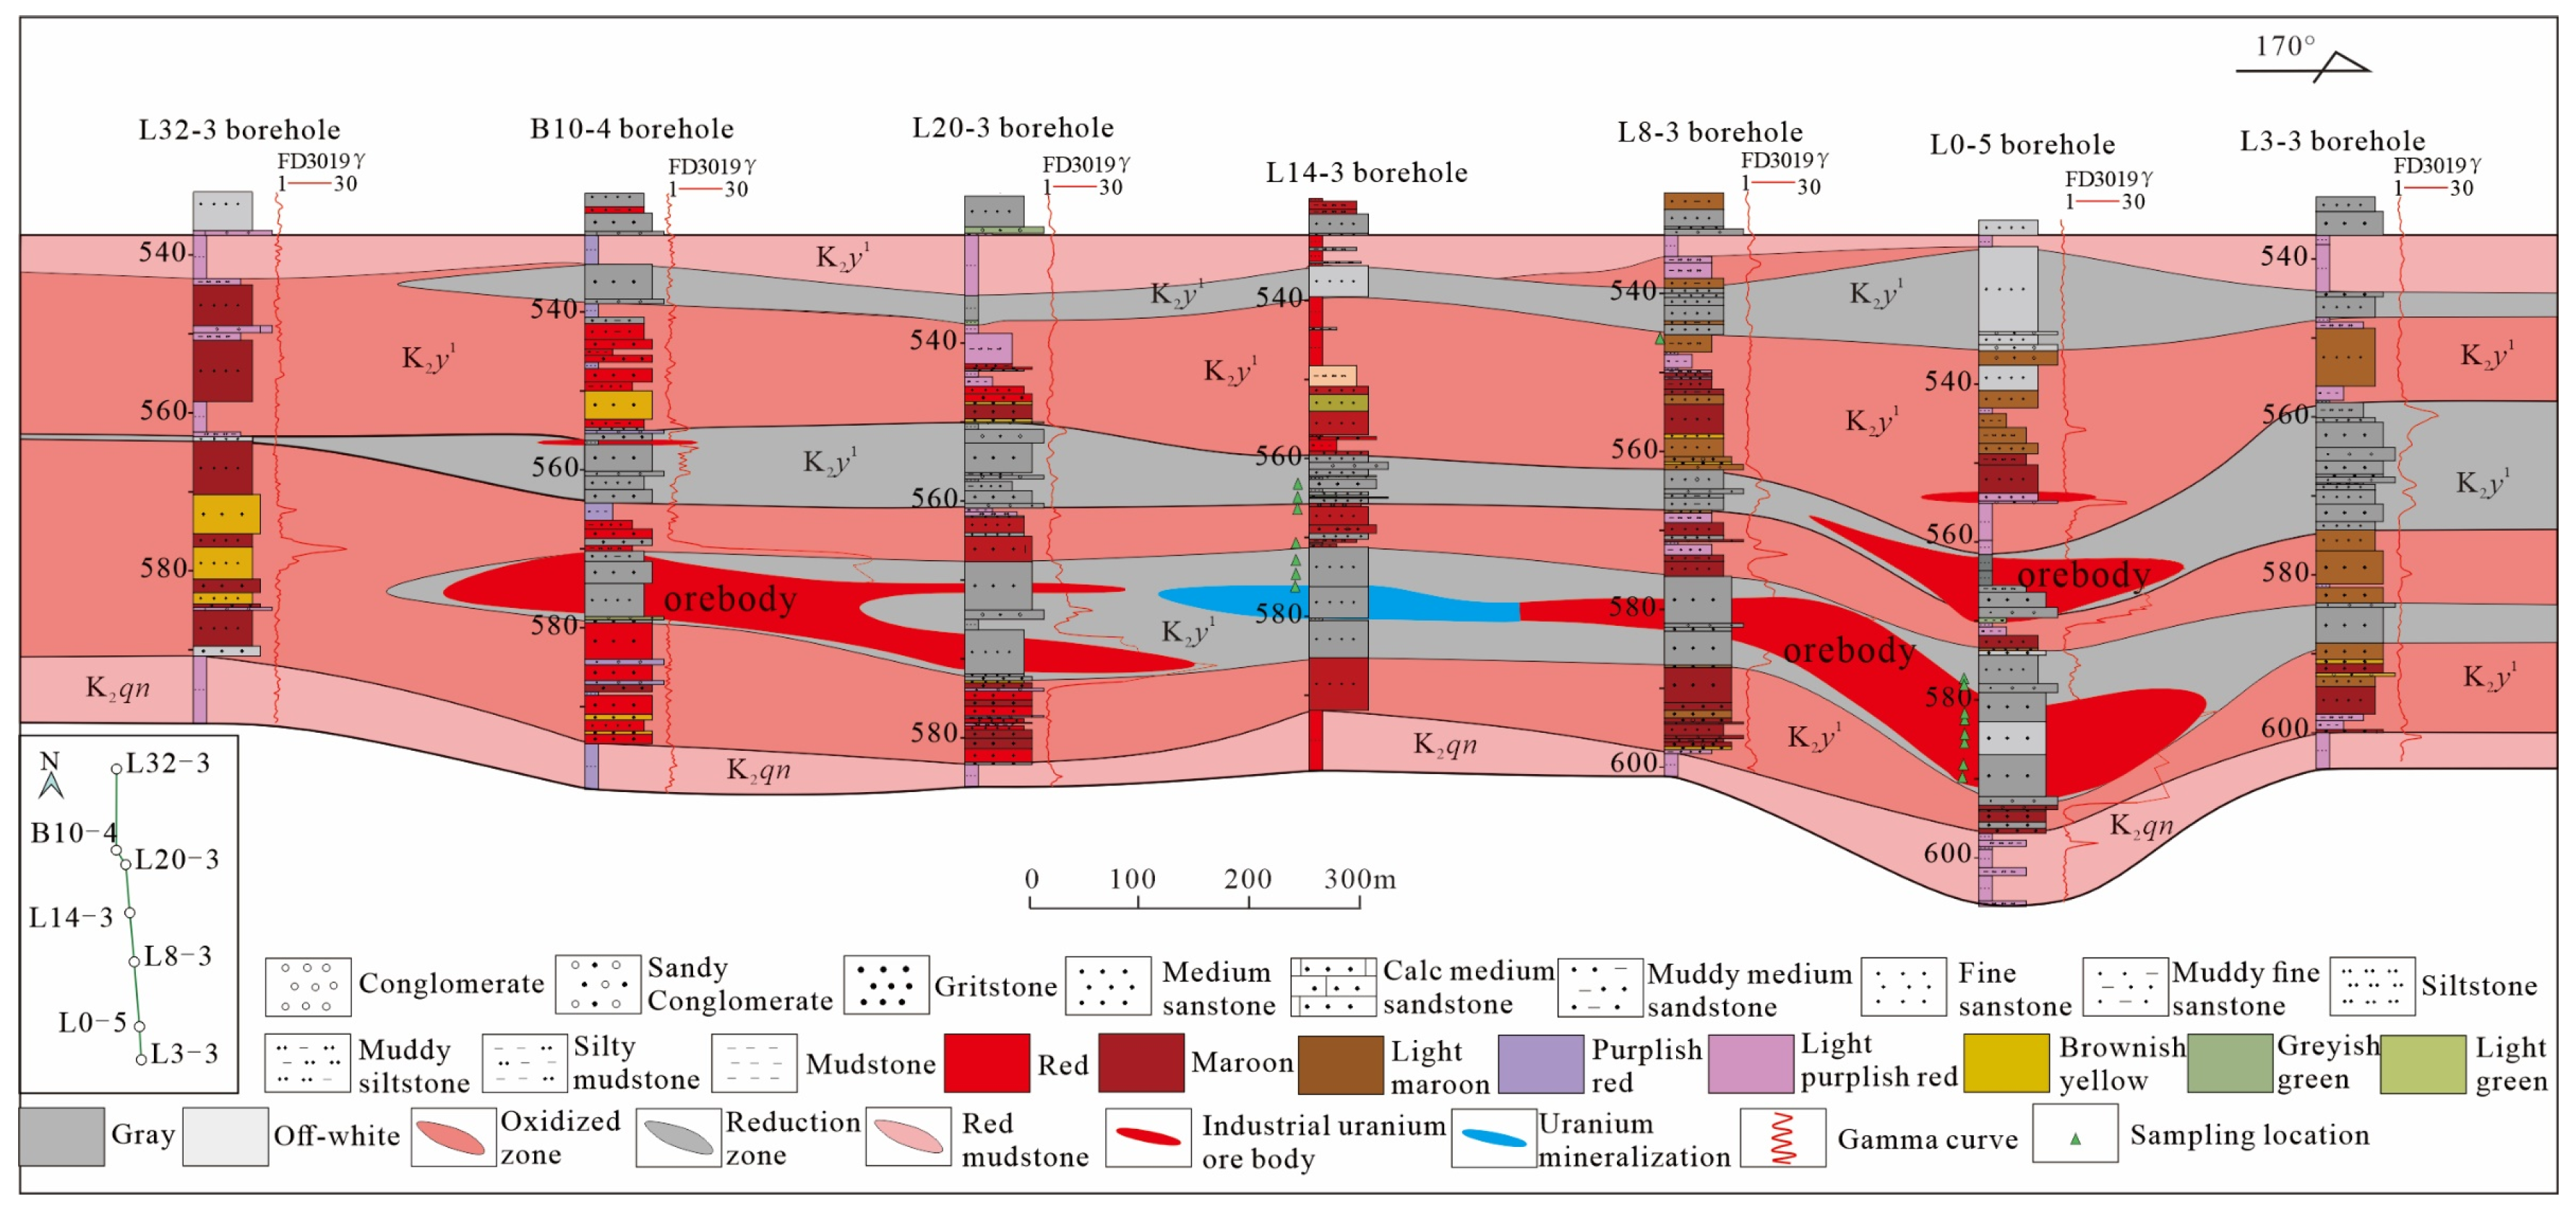
The U-mineralization zone in the Hailijin uranium deposit strikes approximately north–south, with a length of about 4.5 km and a width ranging from 0.6 to 2 km. The ore bodies also strike approximately north–south and occur at depths between 549 and 622 m, with individual ore layers ranging in thickness from 0.1 to 18.8 m, and shown as multilayered tabular (Figure 3).
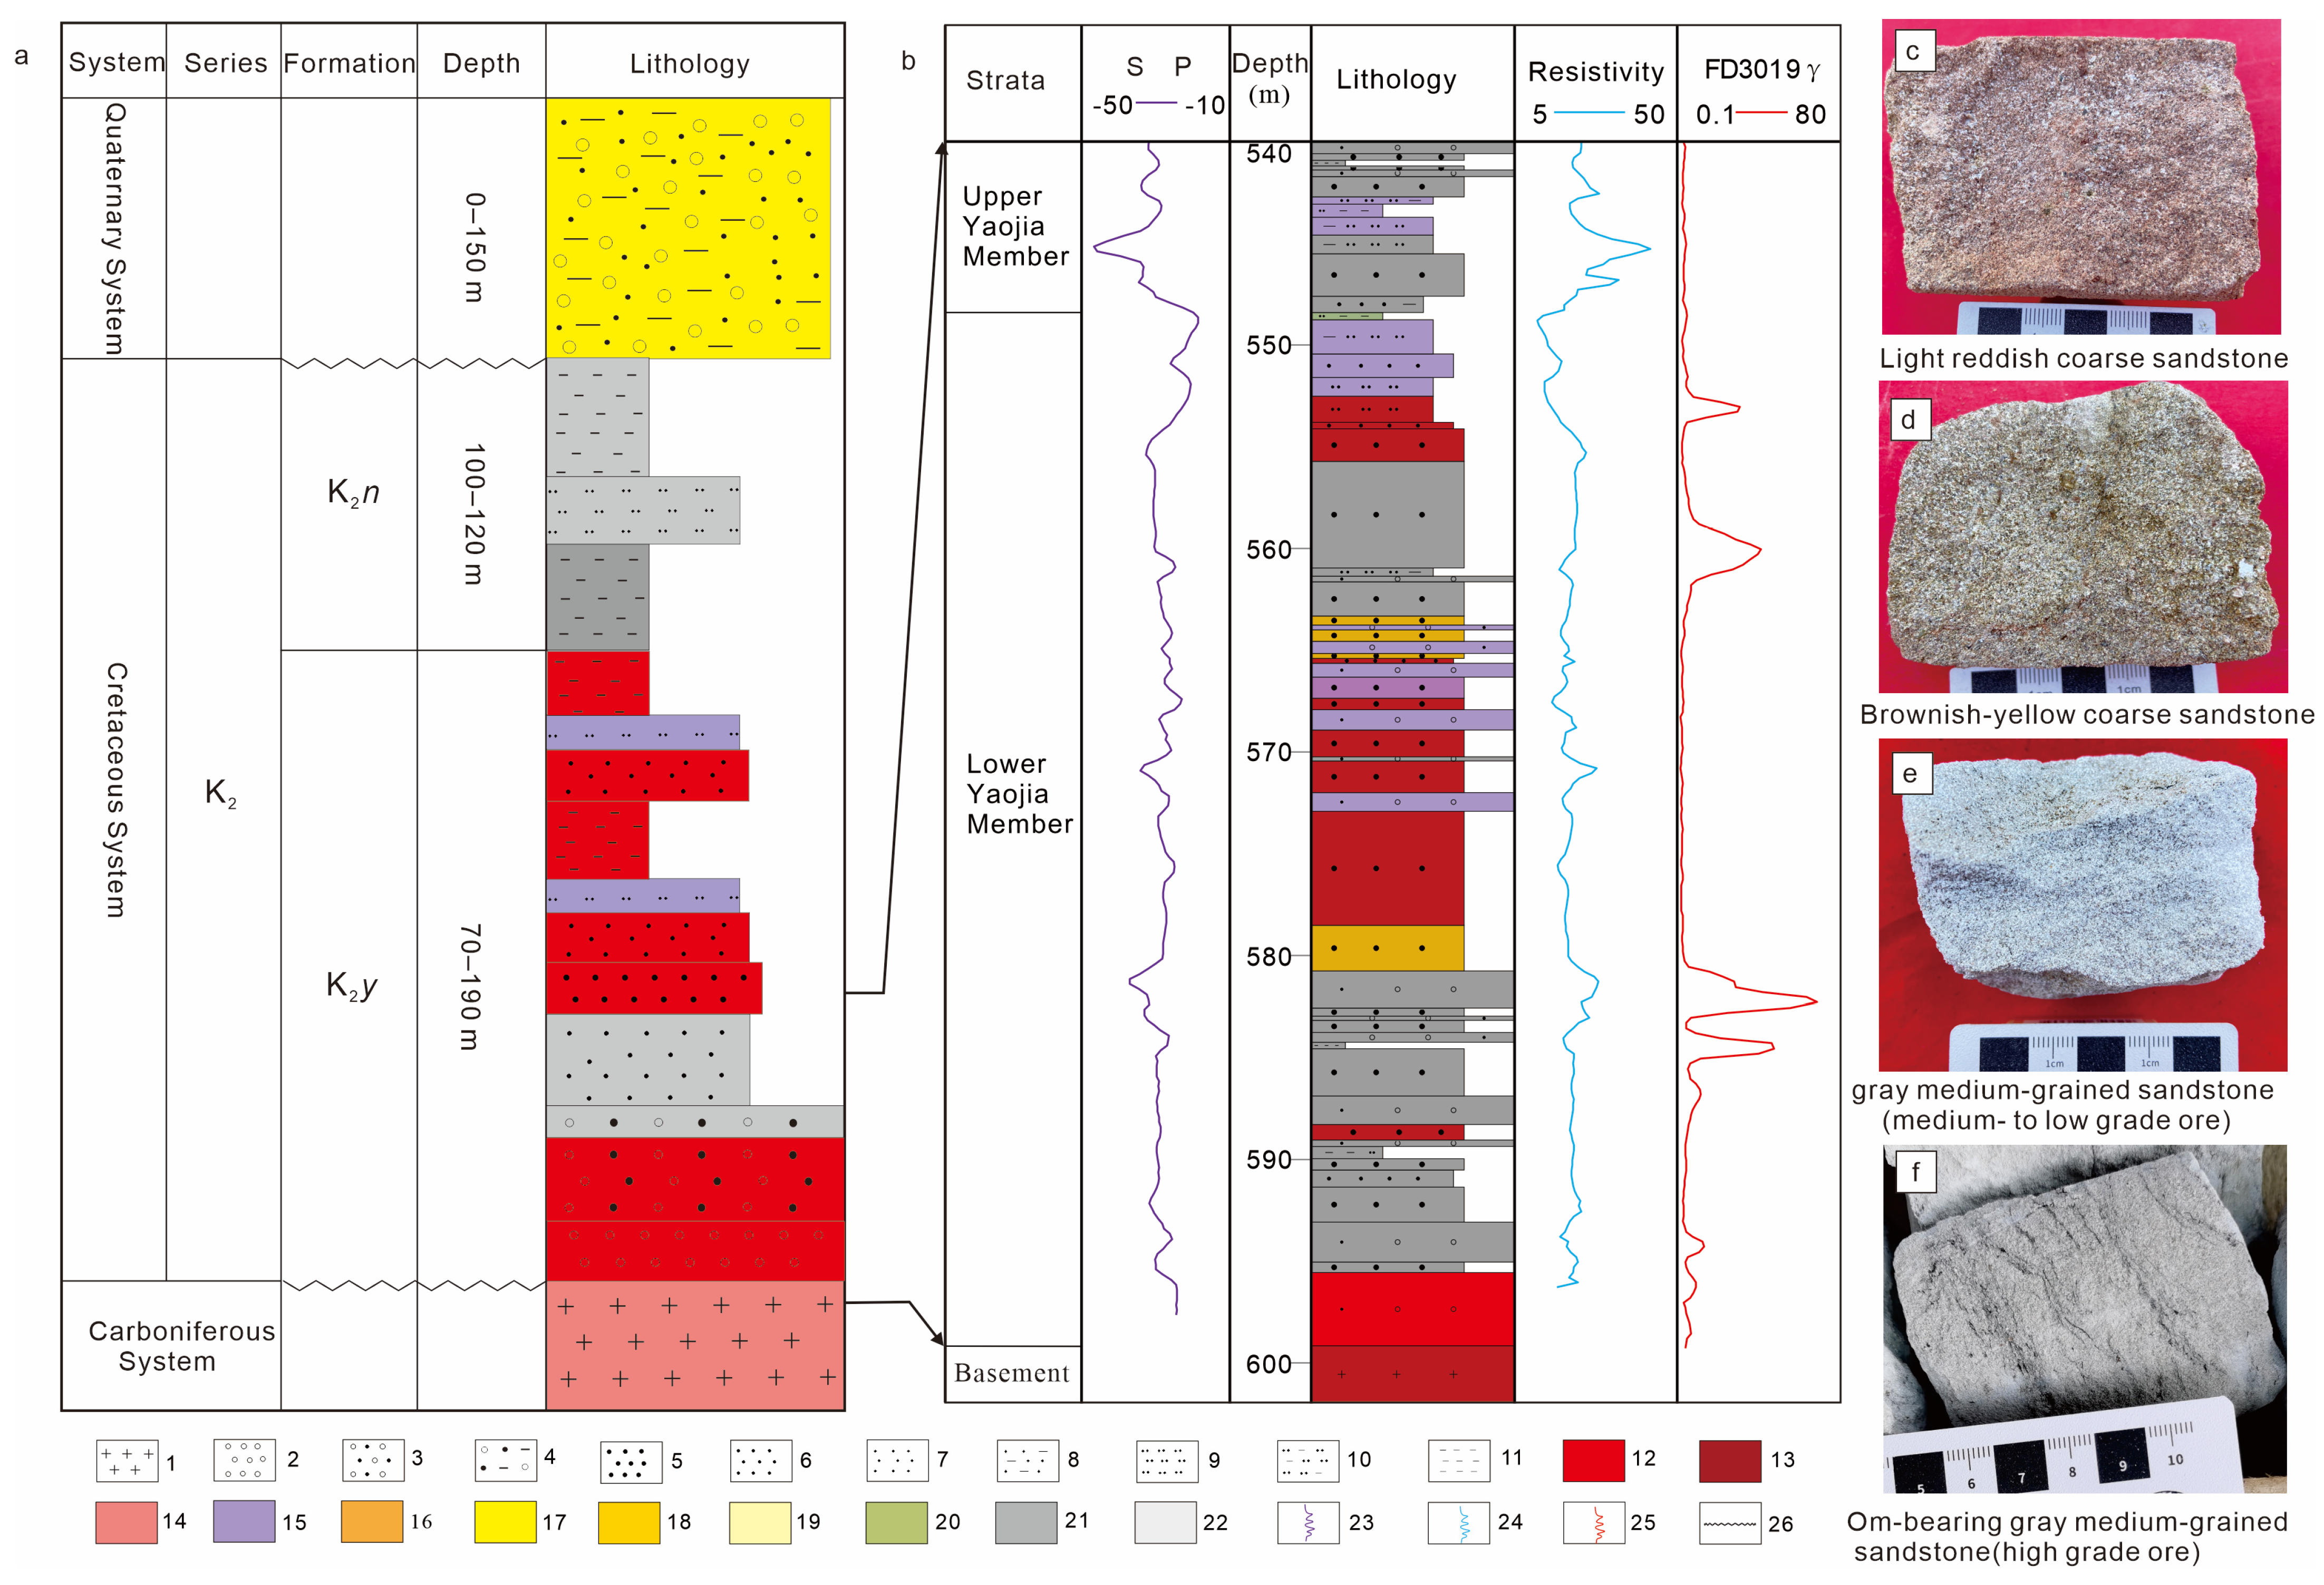
The U-mineralization is exclusively hosted within the lower member of the Upper Cretaceous Yaojia Formation (K2y1), a braided river “red-mottled” sedimentary formation. Vertically, this formation displays a well-developed multi-cyclical sequence: the base comprises alluvial fan facies (conglomerates and glutenites), the middle consists of channel subfacies dominated by mid-channel bar microfacies (medium-to-fine sandstones), and the top transitions into floodplain subfacies characterized by purplish-red mudstones. This porous and heterogeneous channel-fill sequence provided an ideal reservoir for fluid migration and subsequent U precipitation (Figure 4a,b). A hallmark of the Hailijin deposit is its vertical ‘two reddish layers enclosing one grayish layer’ configuration (Figure 3). The ore-controlling grayish sandstones (with sand-to-shale ratios of 10–60%) appear as beaded, patchy, or lenticular units ‘suspended’ within thick primary red oxidized sandstones. This unique spatial architecture underscores the intensive epigenetic modification of primary red beds by localized reducing fluids during the metallogenic period.
The grade of U-ores varies from 0.02231% to 37.75%, with an average grade of 0.3963%. The unmineralized sandstones are predominantly red to reddish gray and brownish-yellow (Figure 4c,d), with minor grayish white varieties, whereas the mineralized sandstones are characterized by light gray to dark gray colors (Figure 4e,f). A notable diagnostic feature of the high grade mineralized sandstones is the presence of veinlet-like or disseminated OM infillings (Figure 4f), together with the occurrence of fine-grained pyrite.

3. Sampling and Methods

(1)
Sampling
Forty drill core samples were collected from different boreholes at the Hailijin deposit, consisting of 22 U-mineralized sandstone samples and 18 non-mineralized samples (Table 1), the approximate locations of the samples are shown in Figure 3. The mineralized sandstones exhibit uranium contents generally in the range of 60–600 ppm based on chemical analyses, and are lithologically characterized by gray to dark gray medium- and fine-grained sandstones. The non-mineralized sandstones, by contrast, show uranium contents typically between 2 and 20 ppm, and are composed predominantly of red to grayish white medium- to fine-grained sandstones and mudstones.
(2)
Elemental analyses
Whole-rock major and trace element analyses were conducted after samples crushed into 200 mesh (Φ < 0.075 mm). Major elements were determined by X-ray fluorescence (XRF) spectrometry on fused-glass disks using an Axios-mAX wavelength-dispersive X-ray spectrometer (Panalytical, Almelo, The Netherlands). Trace elements were analyzed by inductively coupled plasma mass spectrometry (ICP-MS) using an ELEMENT XR mass spectrometer (Thermo Fisher, Waltham, MA, USA) following complete sample dissolution.
In situ trace element analyses of pyrite were performed using laser ablation-inductively coupled plasma-mass spectrometry (LA-ICP-MS) at Kehui Testing (Tianjin) Technology Co., Ltd. (Tianjin, China) The analytical system comprised an RESOlution 193 nm excimer laser ablation system (ASI, Helidon, Australia) coupled with an PQMS ICP-MS (Analytik, Jena, Germany). Analyses were conducted in a single-point ablation mode with a spot diameter of 38 μm, a repetition rate of 5 Hz, and a laser fluence of approximately 5 J/cm2. High-purity helium was utilized as the carrier gas to transport the ablated aerosol to the mass spectrometer.
(3)
Mineralogical characterization
Mineralogical investigations, focusing on the determination of paragenetic sequences and alteration patterns, were conducted using a VEGA3 (TESCAN, Brno, Czech Republic) scanning electron microscope (SEM) equipped with an EDAX TEAM energy-dispersive X-ray spectrometer (EDS,) (AMETEK, Baldwin Park, CA, USA). Back-scattered electron (BSE) imaging and EDS elemental mapping were performed at an accelerating voltage of 20 kV, a beam intensity of 15 μA, and a working distance of 13 mm. For elemental composition analysis, the EDS system was operated with a single-point acquisition time of 200 μs, maintaining an input count rate exceeding 20,000 counts per second (CPS) and a dead time of less than 30%.
(4)
Raman and infrared analysis of OM
Following the microscopic identification of OM closely associated with uranium in the ore, laser Raman spectroscopy and infrared spectroscopy were employed for its characterization. The laser Raman analysis was carried out on an Evolution-type laser Raman microscope system (HORIBA, Tokyo, Japan). Spectra were calibrated using a silicon wafer with the standard value of 520.7 cm−1. Raman spectra were excited by a 532 nm YAG laser at a resolution of 1 cm−1 with the following parameters: 100× objectives, a grating of 1800 gr/mm, a scanning range between 100 cm−1 and 2000 cm−1, a single-point gaining speed of 8 s. Data processing and spectral manipulation were performed using Labspec 6 software from HORIBA. Infrared spectra were obtained using the LUMOS Micro-FTIR (Bruker, Karlsruhe, Germany) in attenuated total reflectance (ATR) mode. Analyses were conducted after 64 scans with a scanning range between 4000 and 640 cm−1 and a resolution of 4 cm−1. Data processing and spectral manipulation, including smoothing, baseline adjustment, normalization, and band component analysis, were performed using OPTU 7.5 software.
(5)
Fluid inclusion analysis
Fluid inclusion (FI) analyses were conducted on doubly polished thin sections (200–300 μm thick). Initial petrographic observations and FI classifications were performed using a DM4500 microscope (Leica MICROSYSTEMS, Wetzlar, Germany). Microthermometric measurements were carried out using a THMSG600 (Linkam, Manchester, UK) heating-cooling stage mounted on a DM2500 microscope (Leica MICROSYSTEMS, Wetzlar, Germany). The stage was calibrated prior to analysis, yielding an estimated precision of ±0.1 °C for freezing/melting temperatures and ±2.0 °C for homogenization temperatures. During the measurements, the heating and cooling rates were generally maintained between 1.0 °C/min and 5.0 °C/min. To ensure data accuracy, the rate was strictly reduced to <0.3 °C/min near low-temperature phase transitions (e.g., final ice melting) and kept below 1.0 °C/min approaching total homogenization. Final ice melting temperatures (Tm-ice) were converted to salinities, expressed as weight percent NaCl equivalent (wt.% NaCl eq.), using the equation of Bodnar [17].
The compositions analysis was determined using a LabRAM HR Evolution confocal micro-Raman spectrometer (HORIBA, Tokyo, Japan), the analytical parameters employed were largely identical to those described for the OM testing method above, except that the scanning range was adjusted to 100–4000 cm−1.
Furthermore, the bulk gas compositions of FIs in quartz were analyzed using gas chromatography combined with the thermal decrepitation method. Initially, approximately 10 g of the ore-bearing sandstone samples from the Hailijin deposit were crushed and sieved to a 40–60 mesh (0.425 mm < Φ < 0.25 mm) fraction. The sieved samples were treated with dilute hydrochloric (HCl) and nitric (HNO3) acids to completely dissolve the carbonate minerals. After thorough washing and drying, pure quartz grains were hand-picked under a binocular microscope. The gas analysis of the decrepitated inclusions was subsequently performed on a Clarus 600 (PerkinElmer, Norwalk, USA) gas chromatograph, utilizing high-purity argon (Ar) as the carrier gas.
(6)
Isotope analyses
In situ sulfur isotope analysis of pyrite was performed on a Thermo Fisher Scientific (Waltham, MA, USA) Neoma multi-collector inductively coupled plasma mass spectrometer (MC-ICP-MS), which was coupled with an RESOlution 193 nm excimer laser ablation system (ASI, Helidon, Australia). Laser ablation measurements were carried out on pre-screened pyrite grains in single-spot mode, with a laser spot diameter of 20–30 μm, a repetition rate of 6 Hz, and a laser fluence of 3 J/cm2. High-purity helium was adopted as the carrier gas to deliver ablated aerosols into the mass spectrometer. The 32S and 34S ion signals were synchronously acquired in static Faraday cup mode, with a single-point integration time of 0.131 s. Sulfur isotope ratios are expressed in the conventional delta notation (δ34S) relative to the Vienna Cañon Diablo Troilite (V-CDT) international standard. Instrumental mass discrimination was corrected via the standard-sample bracketing method using certified pyrite reference materials (e.g., Pyrite-1 and WS-1). These experiments were completed at Kehui Testing (Tianjin) Technology Co., Ltd.
All the above analyses were performed at Beijing Research Institute of Uranium Geology (BRIUG), unless otherwise stated.

4. Results

4.1. Petrology and Mineralogy

4.1.1. Petrology and Alteration

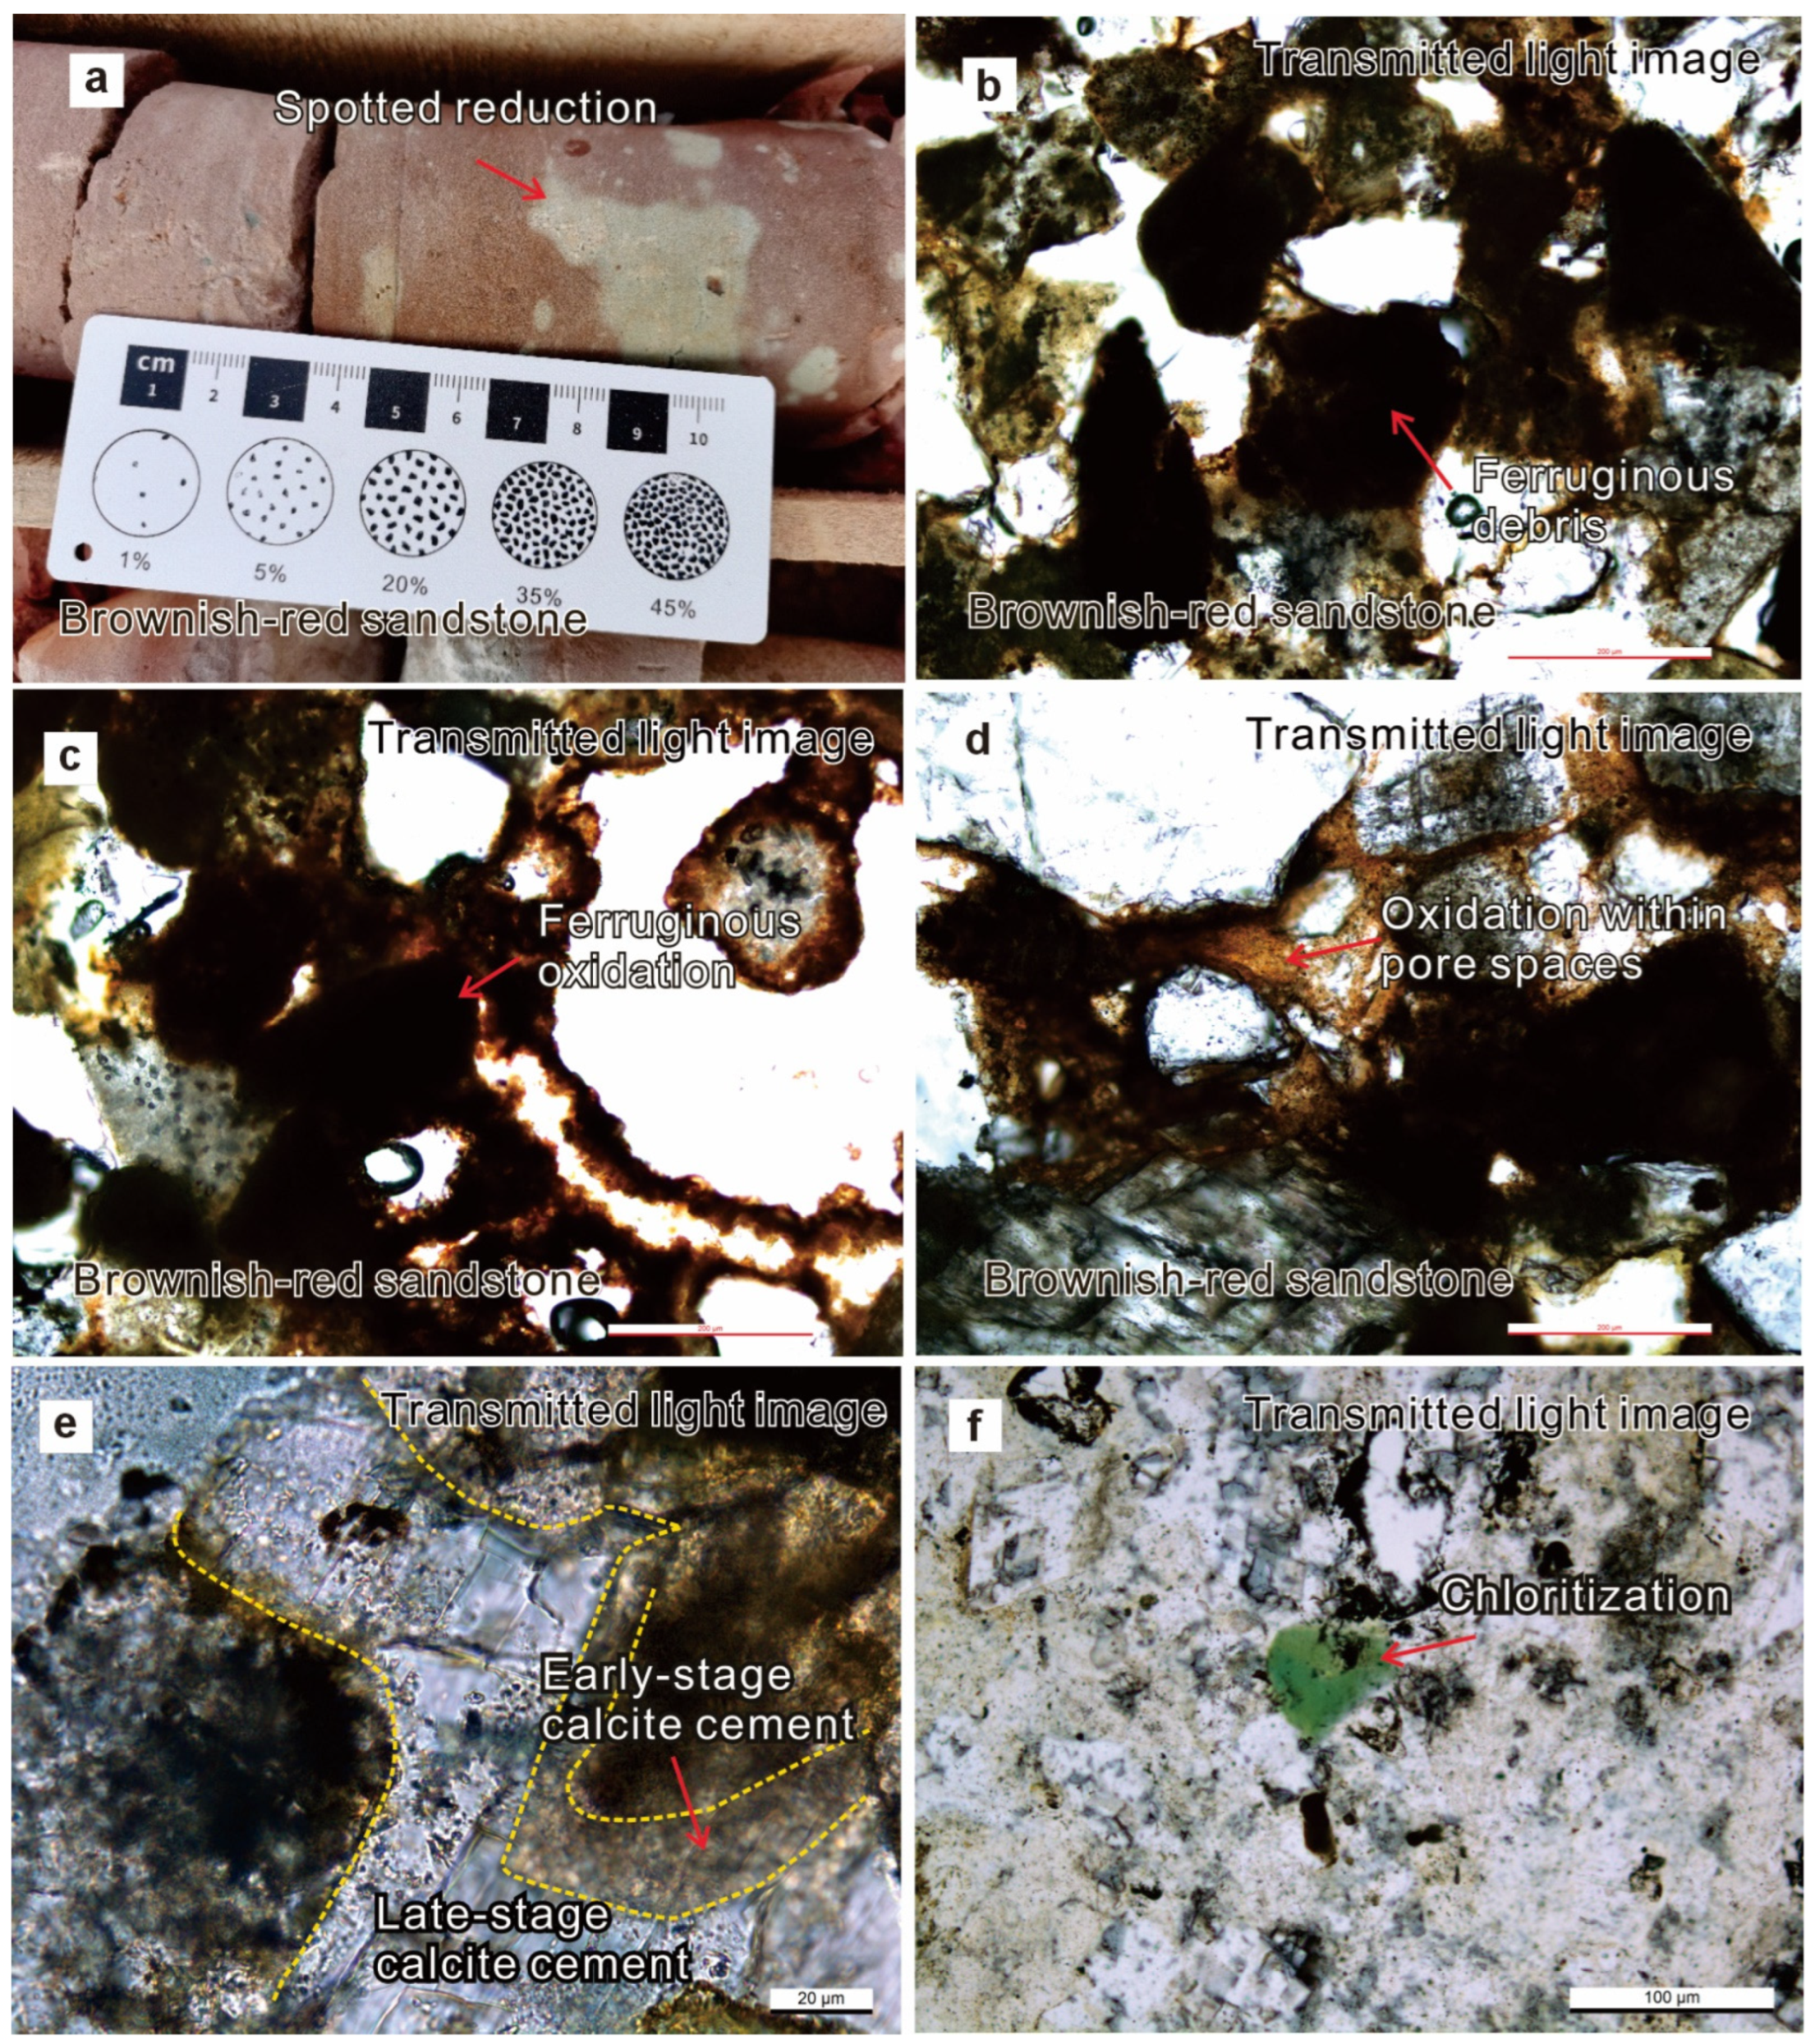
The ore-bearing strata of the Hailijin uranium deposit are predominantly composed of (light) red, brownish-red, and reddish-yellow medium-to-fine grained sandstones, followed by (light) gray to gray-white medium-to-fine grained sandstones and minor coarse sandstones (Figure 4c–f). Additionally, the sequence includes red and gray mudstones deposited in a floodplain environment. Drill-core observations indicate that the brownish-red sandstones of the Yaojia Formation, situated in the upper and lower sections of the ore body, have undergone varying degrees of alteration and modification, frequently exhibiting gray and grayish-green mottling (Figure 5a). Microscopic investigations reveal that the intergranular pores within the altered brownish-red sandstones have been largely modified, with the matrix typically appearing gray or grayish green (Figure 5b). Notably, many detrital grains retain their primary dark-red oxidation rinds (Figure 5b,c), and only a small fraction of the intergranular matrix preserves its early brownish-red oxidation color (Figure 5d). These features suggest that the reddish sandstones of the Yaojia Formation were originally deposited under primary arid and hot climatic conditions.
According to the mineralogical analysis, the primary alteration types in the ore-bearing sandstones of the Hailijin uranium deposit consist of hematitization, limonitization, carbonatization, and sulfidation. The common occurrence of reddish-brown limonite and hematite infilling the inner margins of detrital grains (Figure 5c,d) indicates a hot and arid sedimentary environment during the early diagenetic stage. Based on the cross-cutting relationships and microscopic characteristics of various authigenic minerals, a comprehensive paragenetic sequence for the Hailijin deposit is proposed: an initial stage of limonitization and hematitization (Figure 5c,d), followed by early-stage recrystallized calcite and dolomite cementation (Figure 5e); the subsequent infilling of pore spaces by chlorite, illite, and their mixed-layer clays; a critical syn-ore stage involving the precipitation of uranium minerals and associated sulfides (e.g., pyrite, sphalerite, ankerite or calcite); and a terminal stage characterized by the development of late-stage euhedral dolomite/calcite cements, chloritization, and hydromicaization (Figure 5f).

4.1.2. Occurrence Characteristics of U-Minerals

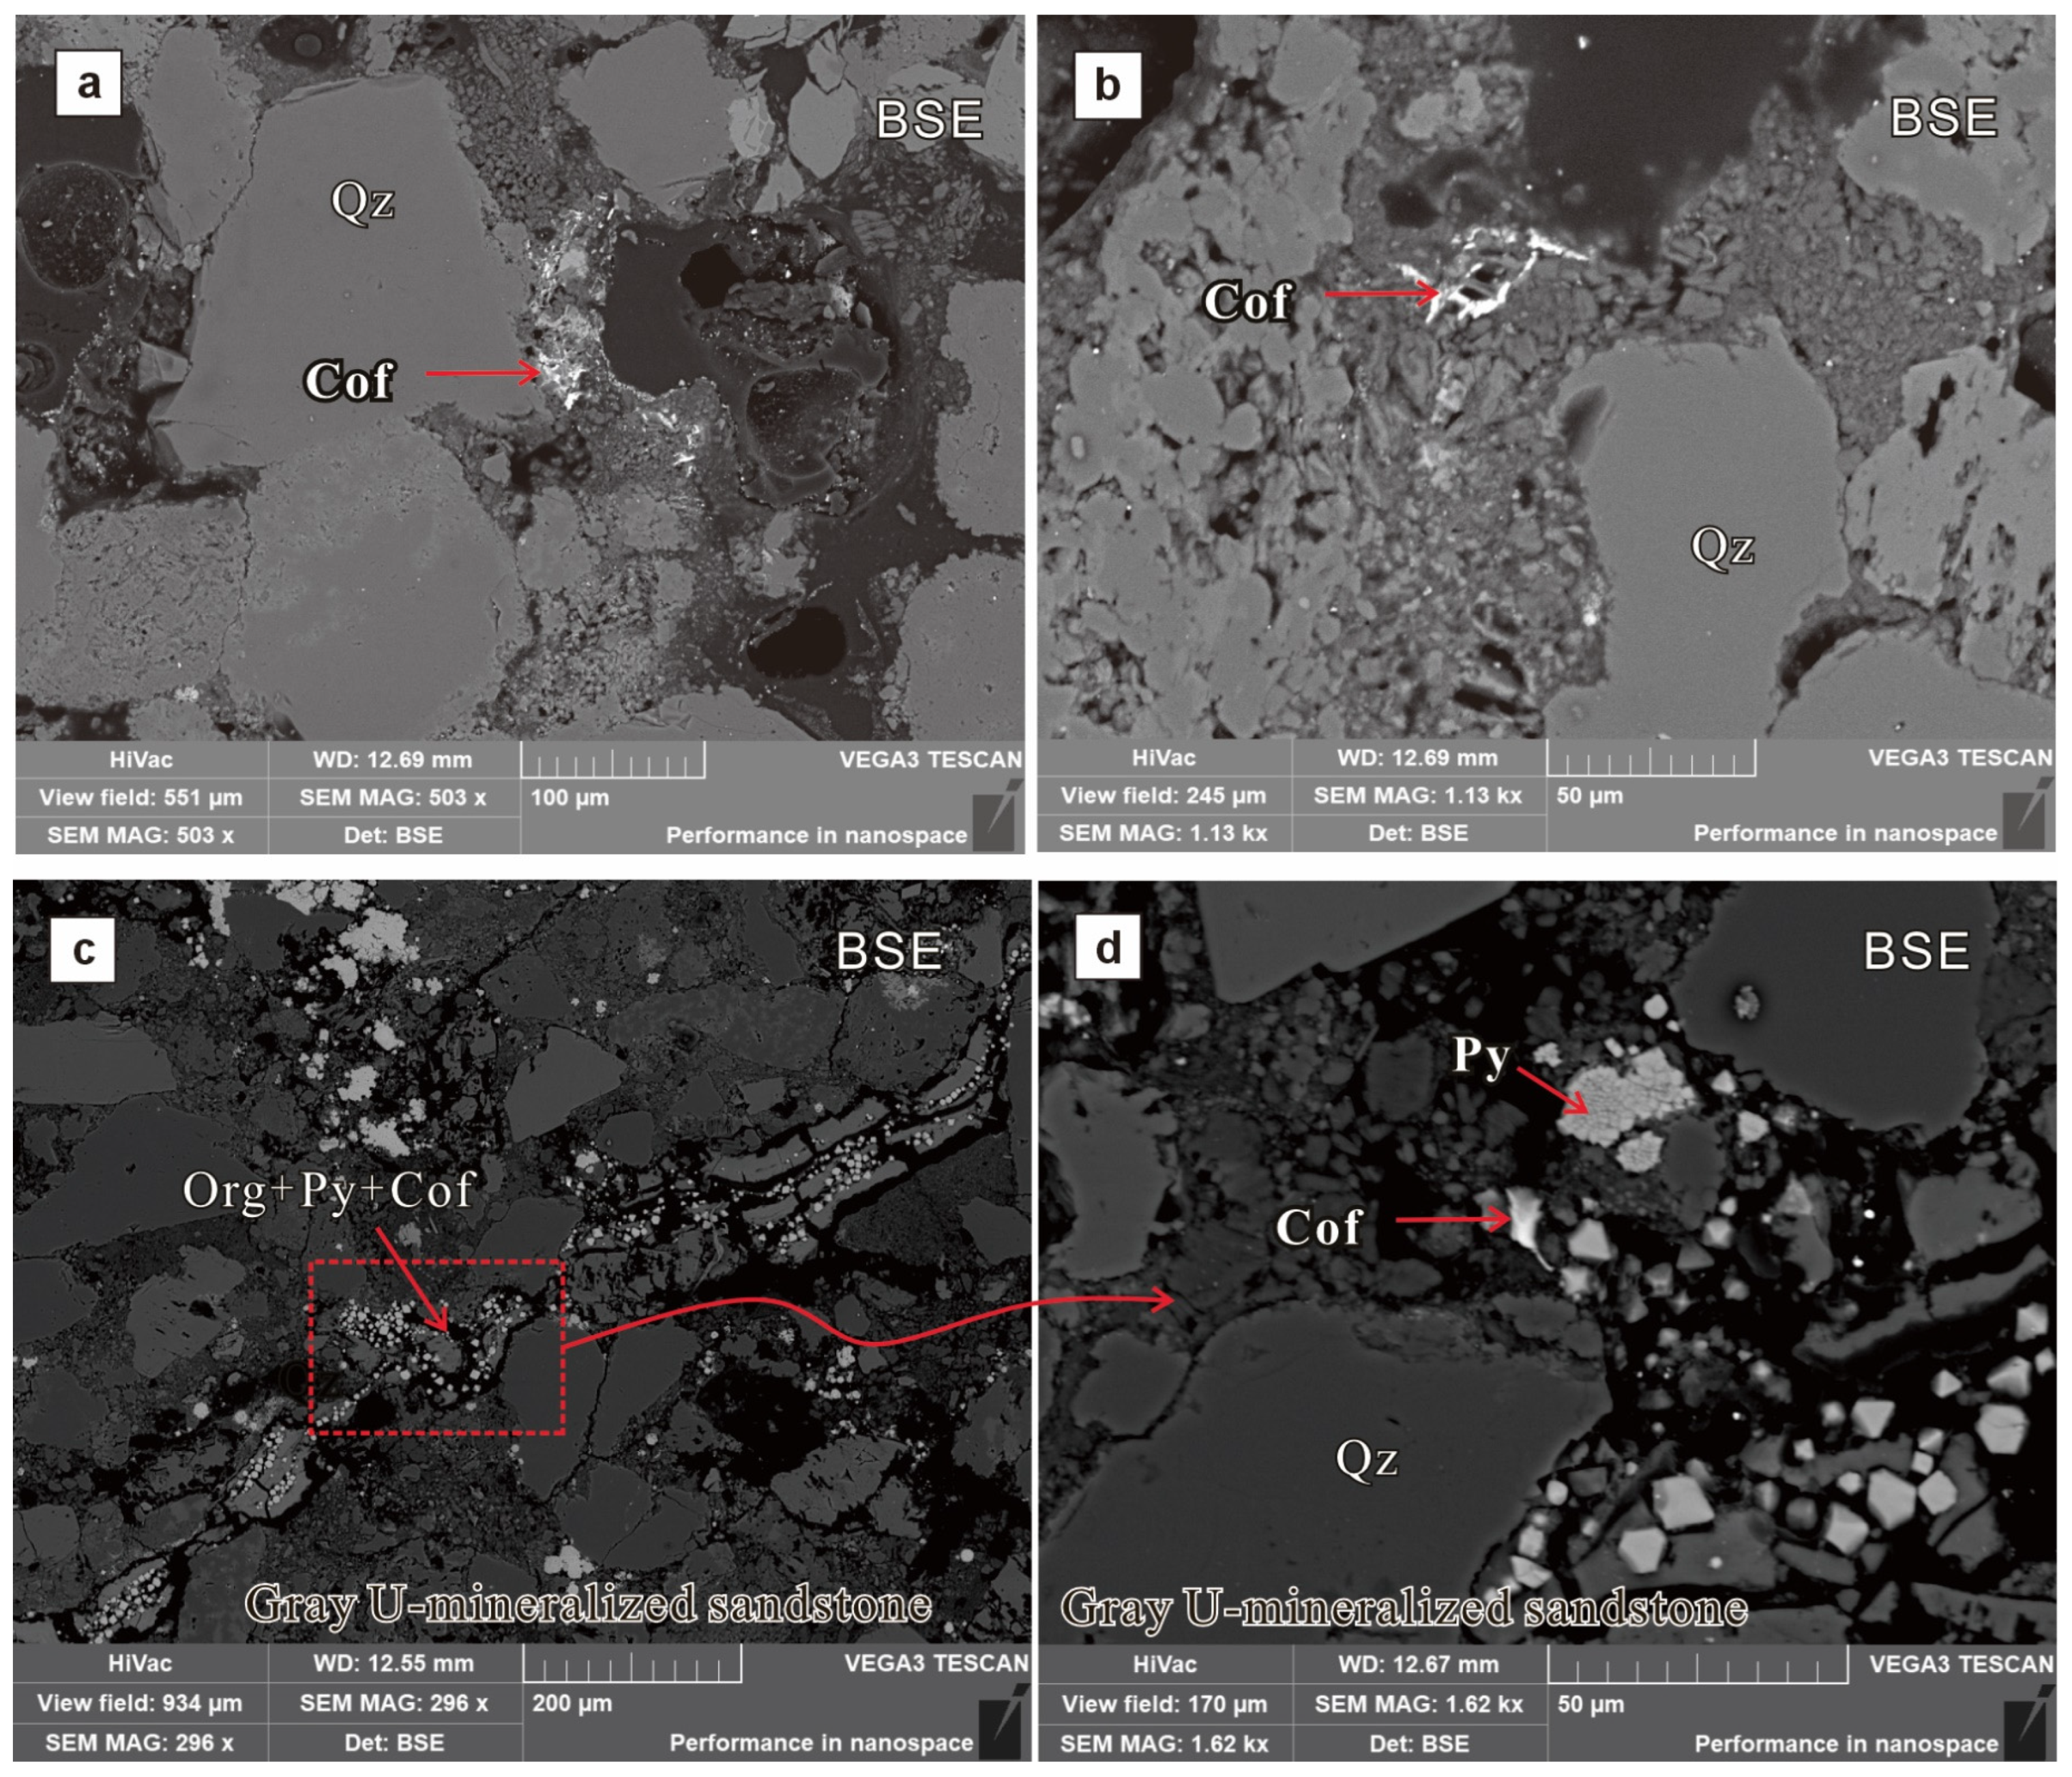
In the Hailijin U-deposit, the U-minerals are generally ultra-fine-grained, typically less than 1 μm. These minerals predominantly occur as disseminated spots or aggregates on the surfaces and within the dissolution pores of detrital minerals (e.g., quartz and feldspar) (Figure 6a,b), as well as on the surfaces of clay minerals and within “fluidic” OM (Figure 6c,d). The U-mineralization is dominated by pitchblende and coffinite, which are intimately associated with pyrite, OM, and sphalerite. Notably, these U-minerals frequently contain a certain amount of titanium (Ti), indicating that the ore-forming fluids were enriched not only in uranium but also in elements such as Ti, Fe, and Zn.

4.1.3. Characteristics of Organic Matter

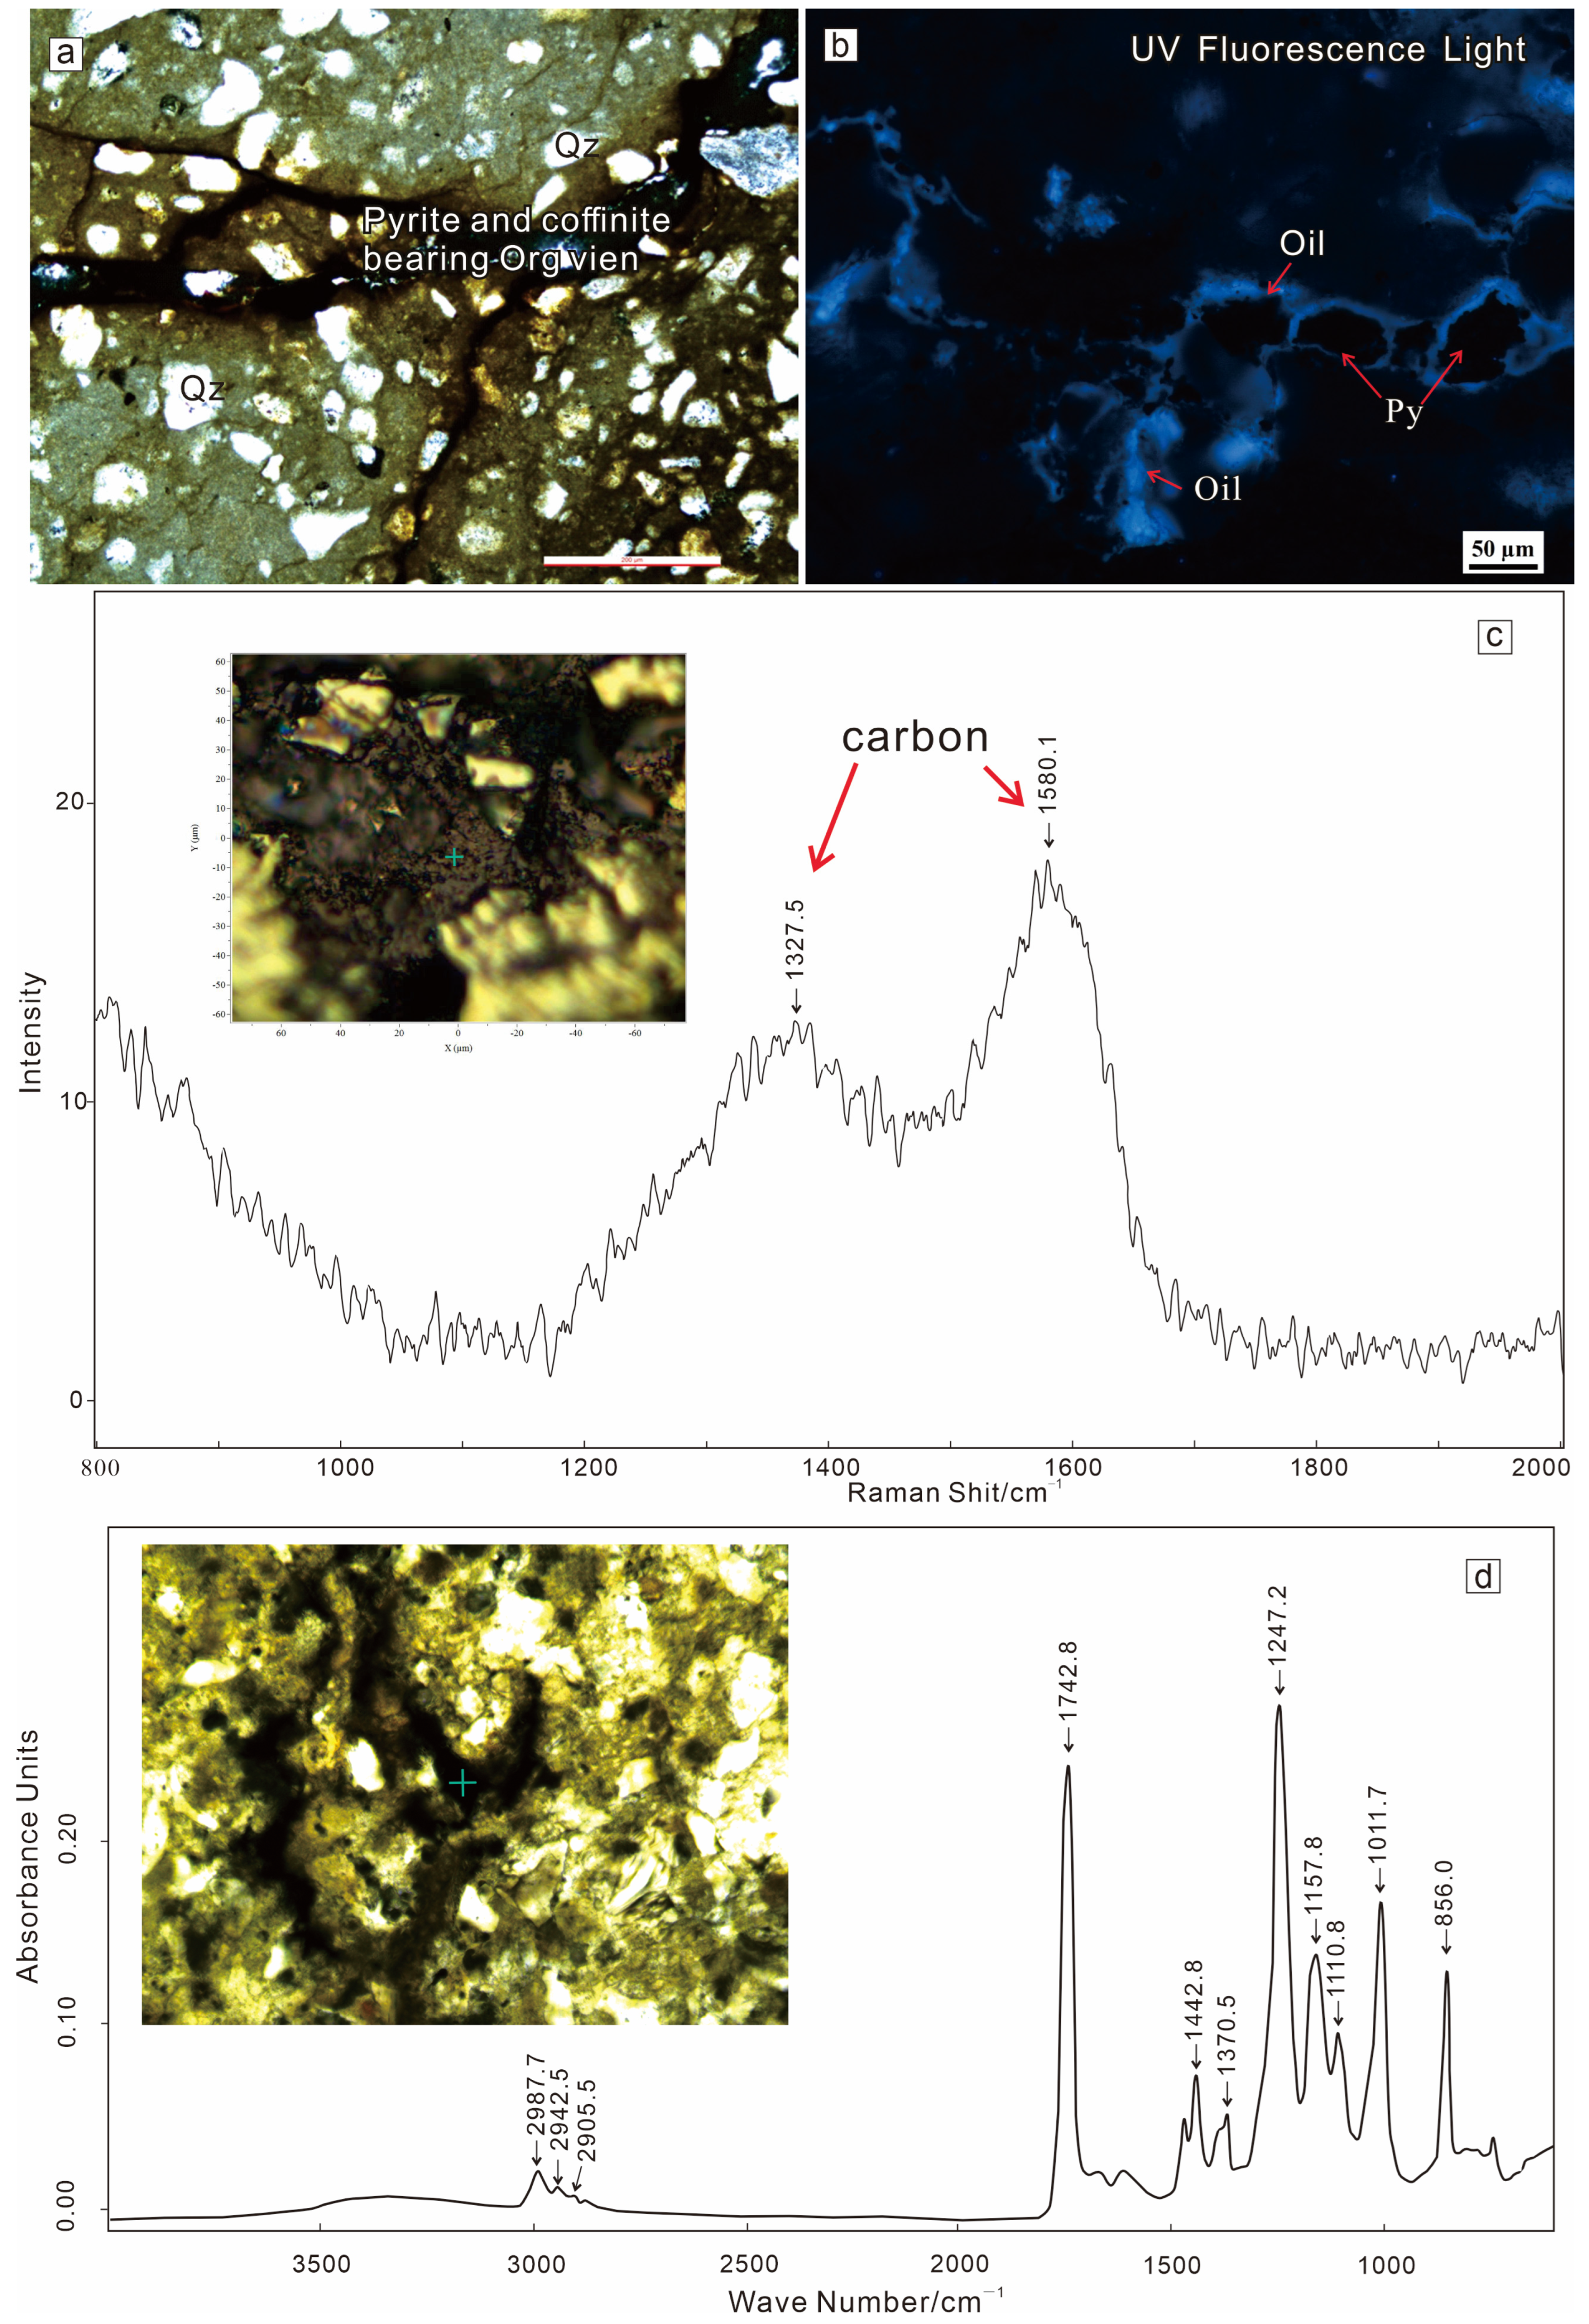
In drill core samples, certain U-enriched ores host fine vein-like and filamentous OM (Figure 4f). Microscopic examination shows that this OM occurs as irregular disseminations within the intergranular pores of mineral grains, ranging in width from a few microns to over one hundred microns (Figure 7a,b), and some OM displays intense blue fluorescence when exposed to ultraviolet (UV) light. Under reflected light, abundant fine framboidal pyrite is readily discernible within the OM. SEM observations further reveal that U minerals are preferentially distributed around OM and pyrite. (Figure 6c,d). Laser Raman spectroscopy analysis of the OM shows distinct characteristic peaks of carbonaceous materials, with the D band at ~1350 cm−1 and the G band at ~1580 cm−1 (Figure 7a). Micro Fourier transform infrared (FTIR) spectroscopy analysis reveals that the OM exhibits characteristic peaks at approximately 856, 1011, 1100, 1157, 1247, 1370, 1442, 1742, 2909, 2942 and 2987 cm−1, corresponding to C-O groups and methyl groups, respectively. Peaks at the bands from 820 to 860 cm−1 indicate the stretching vibrations of aromatic hydrocarbons, peaks from 1011 to 1100 cm−1 correspond to the C-O bending vibrations of alcohols and ethers, peaks near 1250 cm−1 indicate the C-O stretching vibration of carboxylic acid functional groups, while those around 1370 cm−1 are attributed to the bending vibrations of -CH2 and -CH3 groups or the asymmetric stretching vibrations of COO− groups of aromatic hydrocarbons, 1370 and 1442 cm−1 correspond to the deformation vibration of C-H bonds in the aliphatic group, and 1600 cm−1 corresponds to the stretching vibration of C=C bonds in the benzene ring, 1740 cm−1 corresponds to the C-O stretching vibration in aromatic compounds. Additionally, peaks at the bands from 2909 to 2988 correspond to the stretching vibration of methyl and methylene groups in the aliphatic group.

4.2. Geochemical Characteristics of Elements

4.2.1. Major and Trace Elements

The major element compositions of the U-hosted sandstones in the Yaojia Formation of the Hailijin U deposit are characterized by generally high contents of SiO2 (70.1–81.5 wt.%, mean of 78.84%) and Al2O3 (8.3–13.5 wt.%, mean of 10.59%). Other major oxides include MgO (0.26–1.12 wt.%), CaO (0.31–2.39 wt.%), TiO2 (0.21–0.63 wt.%), and P2O5 (0.05–0.13 wt.%). The SiO2/Al2O3 ratios of these sandstones range from 5.19 to 9.33, with an average of 7.41 (Table 2), which is consistent with the typical geochemical characteristics of arkose. The Fe3 + /Fe2+ ratios are significantly lower within the ore-bearing segments, concentrated between 0.19 and 0.47, with an average of 0.37 (n = 9), underscoring a robust reducing environment during mineralization, conversely, the ratios for the non-mineralized sandstones and mudstones range from 0.12 to 5.08, with an average of 1.37 (n = 12) (Table 2).
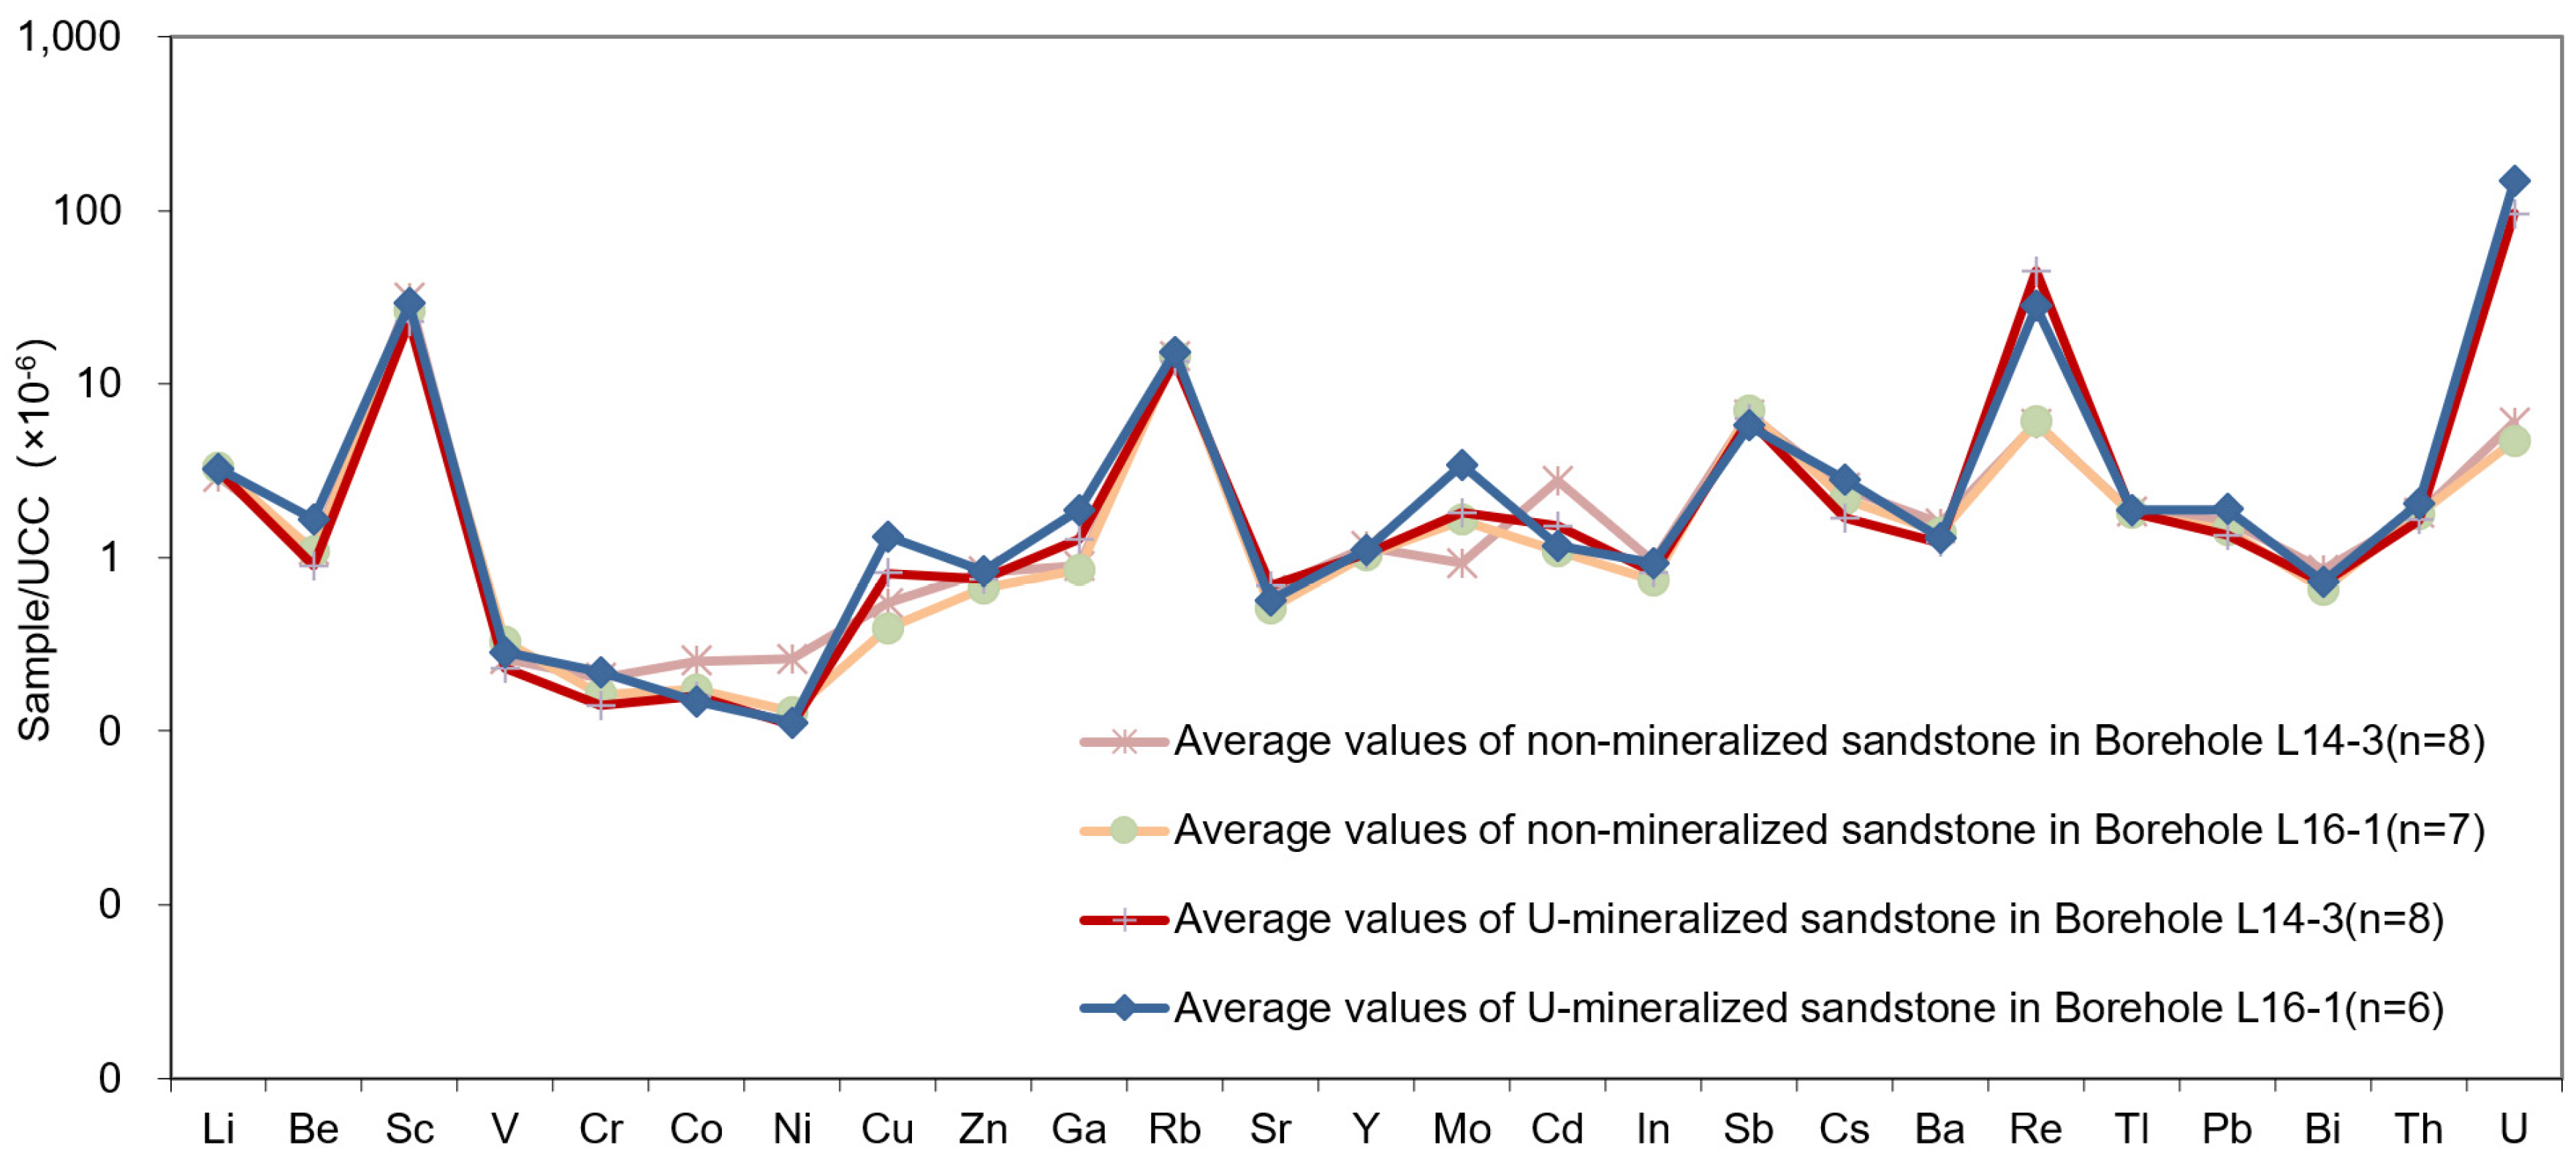
In total, 25 trace elements and 14 rare earth elements (REE) were analyzed on U-mineralized and non-mineralized sandstone; these data were used to construct spider diagrams showing the variations in relevant elements (Figure 8 and Figure 9). The trace elements analysis shows that the U-hosted sandstones are markedly enriched in U, Re, Mo, Sc, Ga, Rb, Sb (Figure 8). Compared to non-mineralized reddish oxidized sandstones and weakly reduced sandstones (e.g., light red or reddish yellow), the U-mineralized grayish sandstones exhibit significant enrichment in U, Re, Mo, and slight enrichment in Cu, Zn, Ga, Pb elements, with the highest concentrations occurring in the rich U-ore samples. Notably, the U and Re content in the ore-bearing gray sandstones is by tens to hundreds of times higher than that in the primary reddish oxidized sandstones. Meanwhile, the contents of Mo, Ni, Cu, Zn, and Pb also show a certain degree of enrichment. These geochemical patterns suggest that the ore-forming fluids of the Hailijin deposit were significantly enriched in U, Re, Mo, Cu, Zn, Ga, Pb. Generally, elements such as Mo, Zn, Cu, and Pb are diagnostic of deep-seated fluids. Consequently, these trace element signatures indicate that the nature of the ore-forming fluids in the Hailijin deposit differs from those involved in traditional interlayer oxidation processes, involving a distinct influx of U, Re, Mo, Pb, Zn, and Cu.
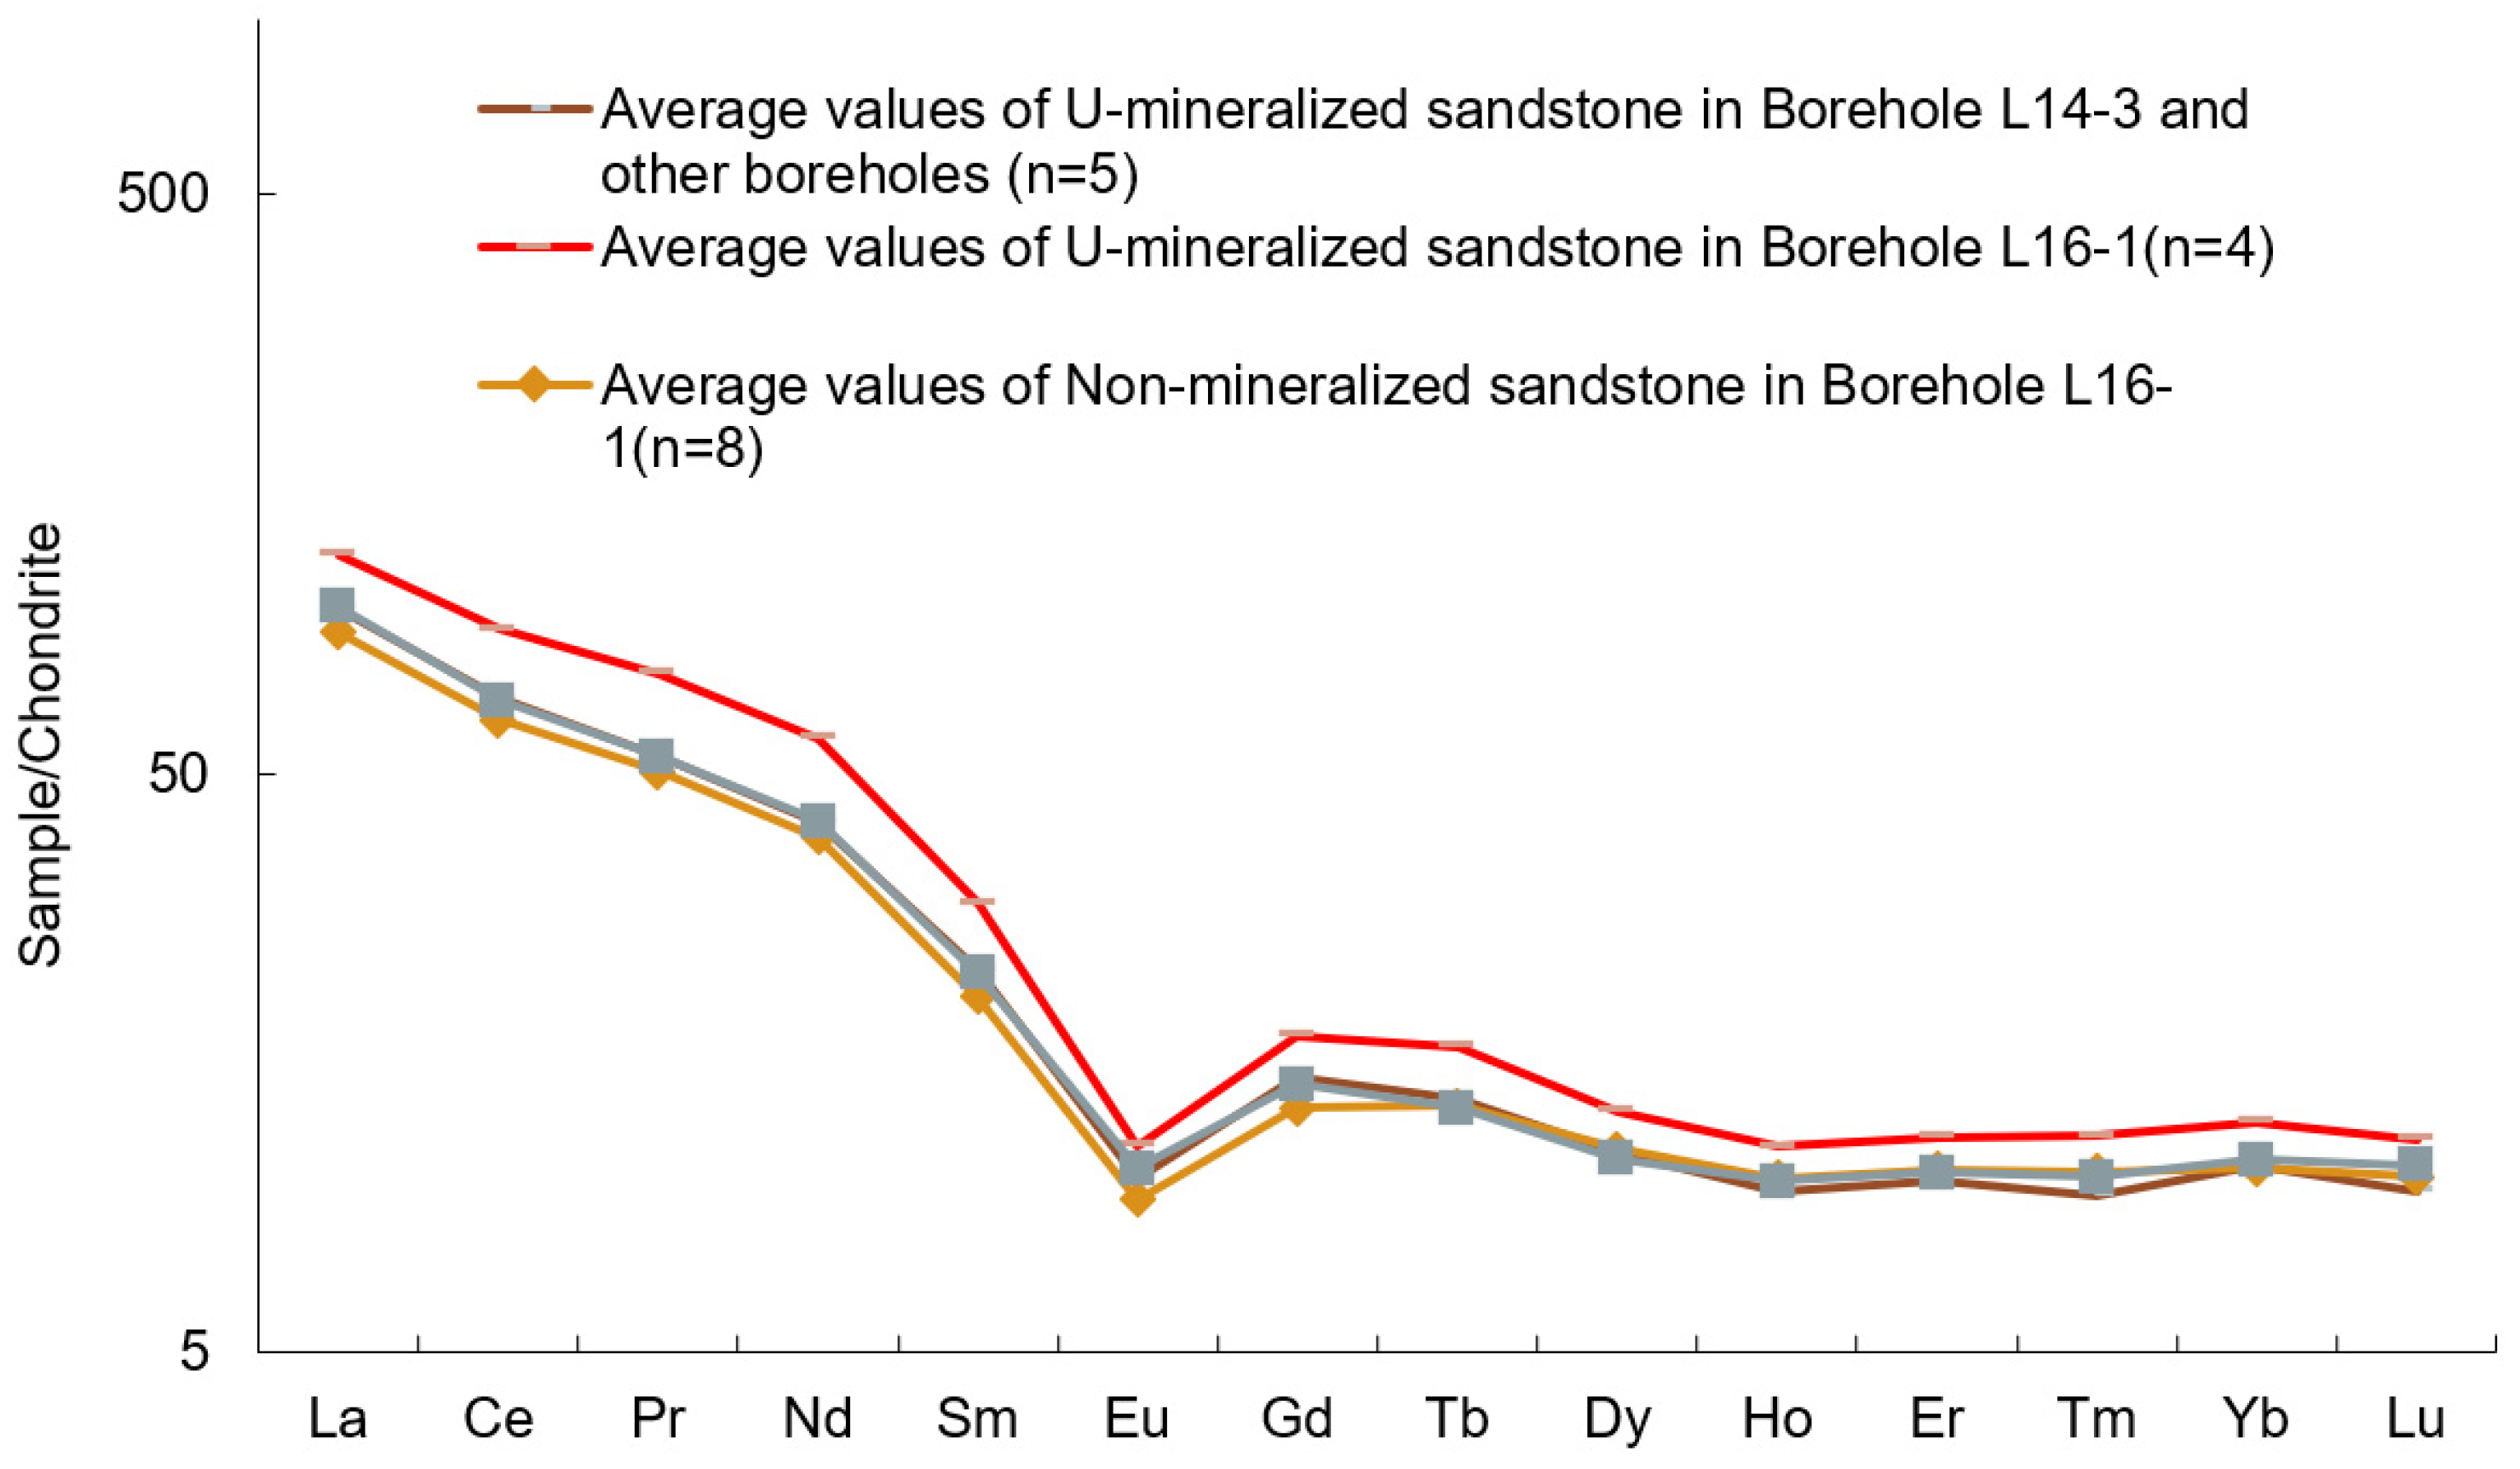
The rare earth element (REE) analysis indicates that the total REE concentrations (∑REE) in the Hailijin uranium deposit samples exhibit a relatively narrow range, varying from 122.4 ppm to 262.4 ppm (10−6). Overall, the ∑REE in U-mineralized sandstones is slightly higher than that in non- mineralized sandstones. The ratios of light rare earth elements to heavy rare earth elements (LREE/HREE) generally range between 11 and 18. Both U-mineralized and non-mineralized sandstones are characterized by relative enrichment in LREEs and depletion in HREEs. Their chondrite-normalized REE patterns display a distinct “right-sloping” trend, accompanied by ubiquitous negative δEu anomalies (Figure 9). Notably, the REE distribution patterns of the U-mineralized sandstones are highly consistent with those of the non- mineralized sandstones, showing negligible variation between the two groups.

4.2.2. In Situ Trace Elements of Pyrite

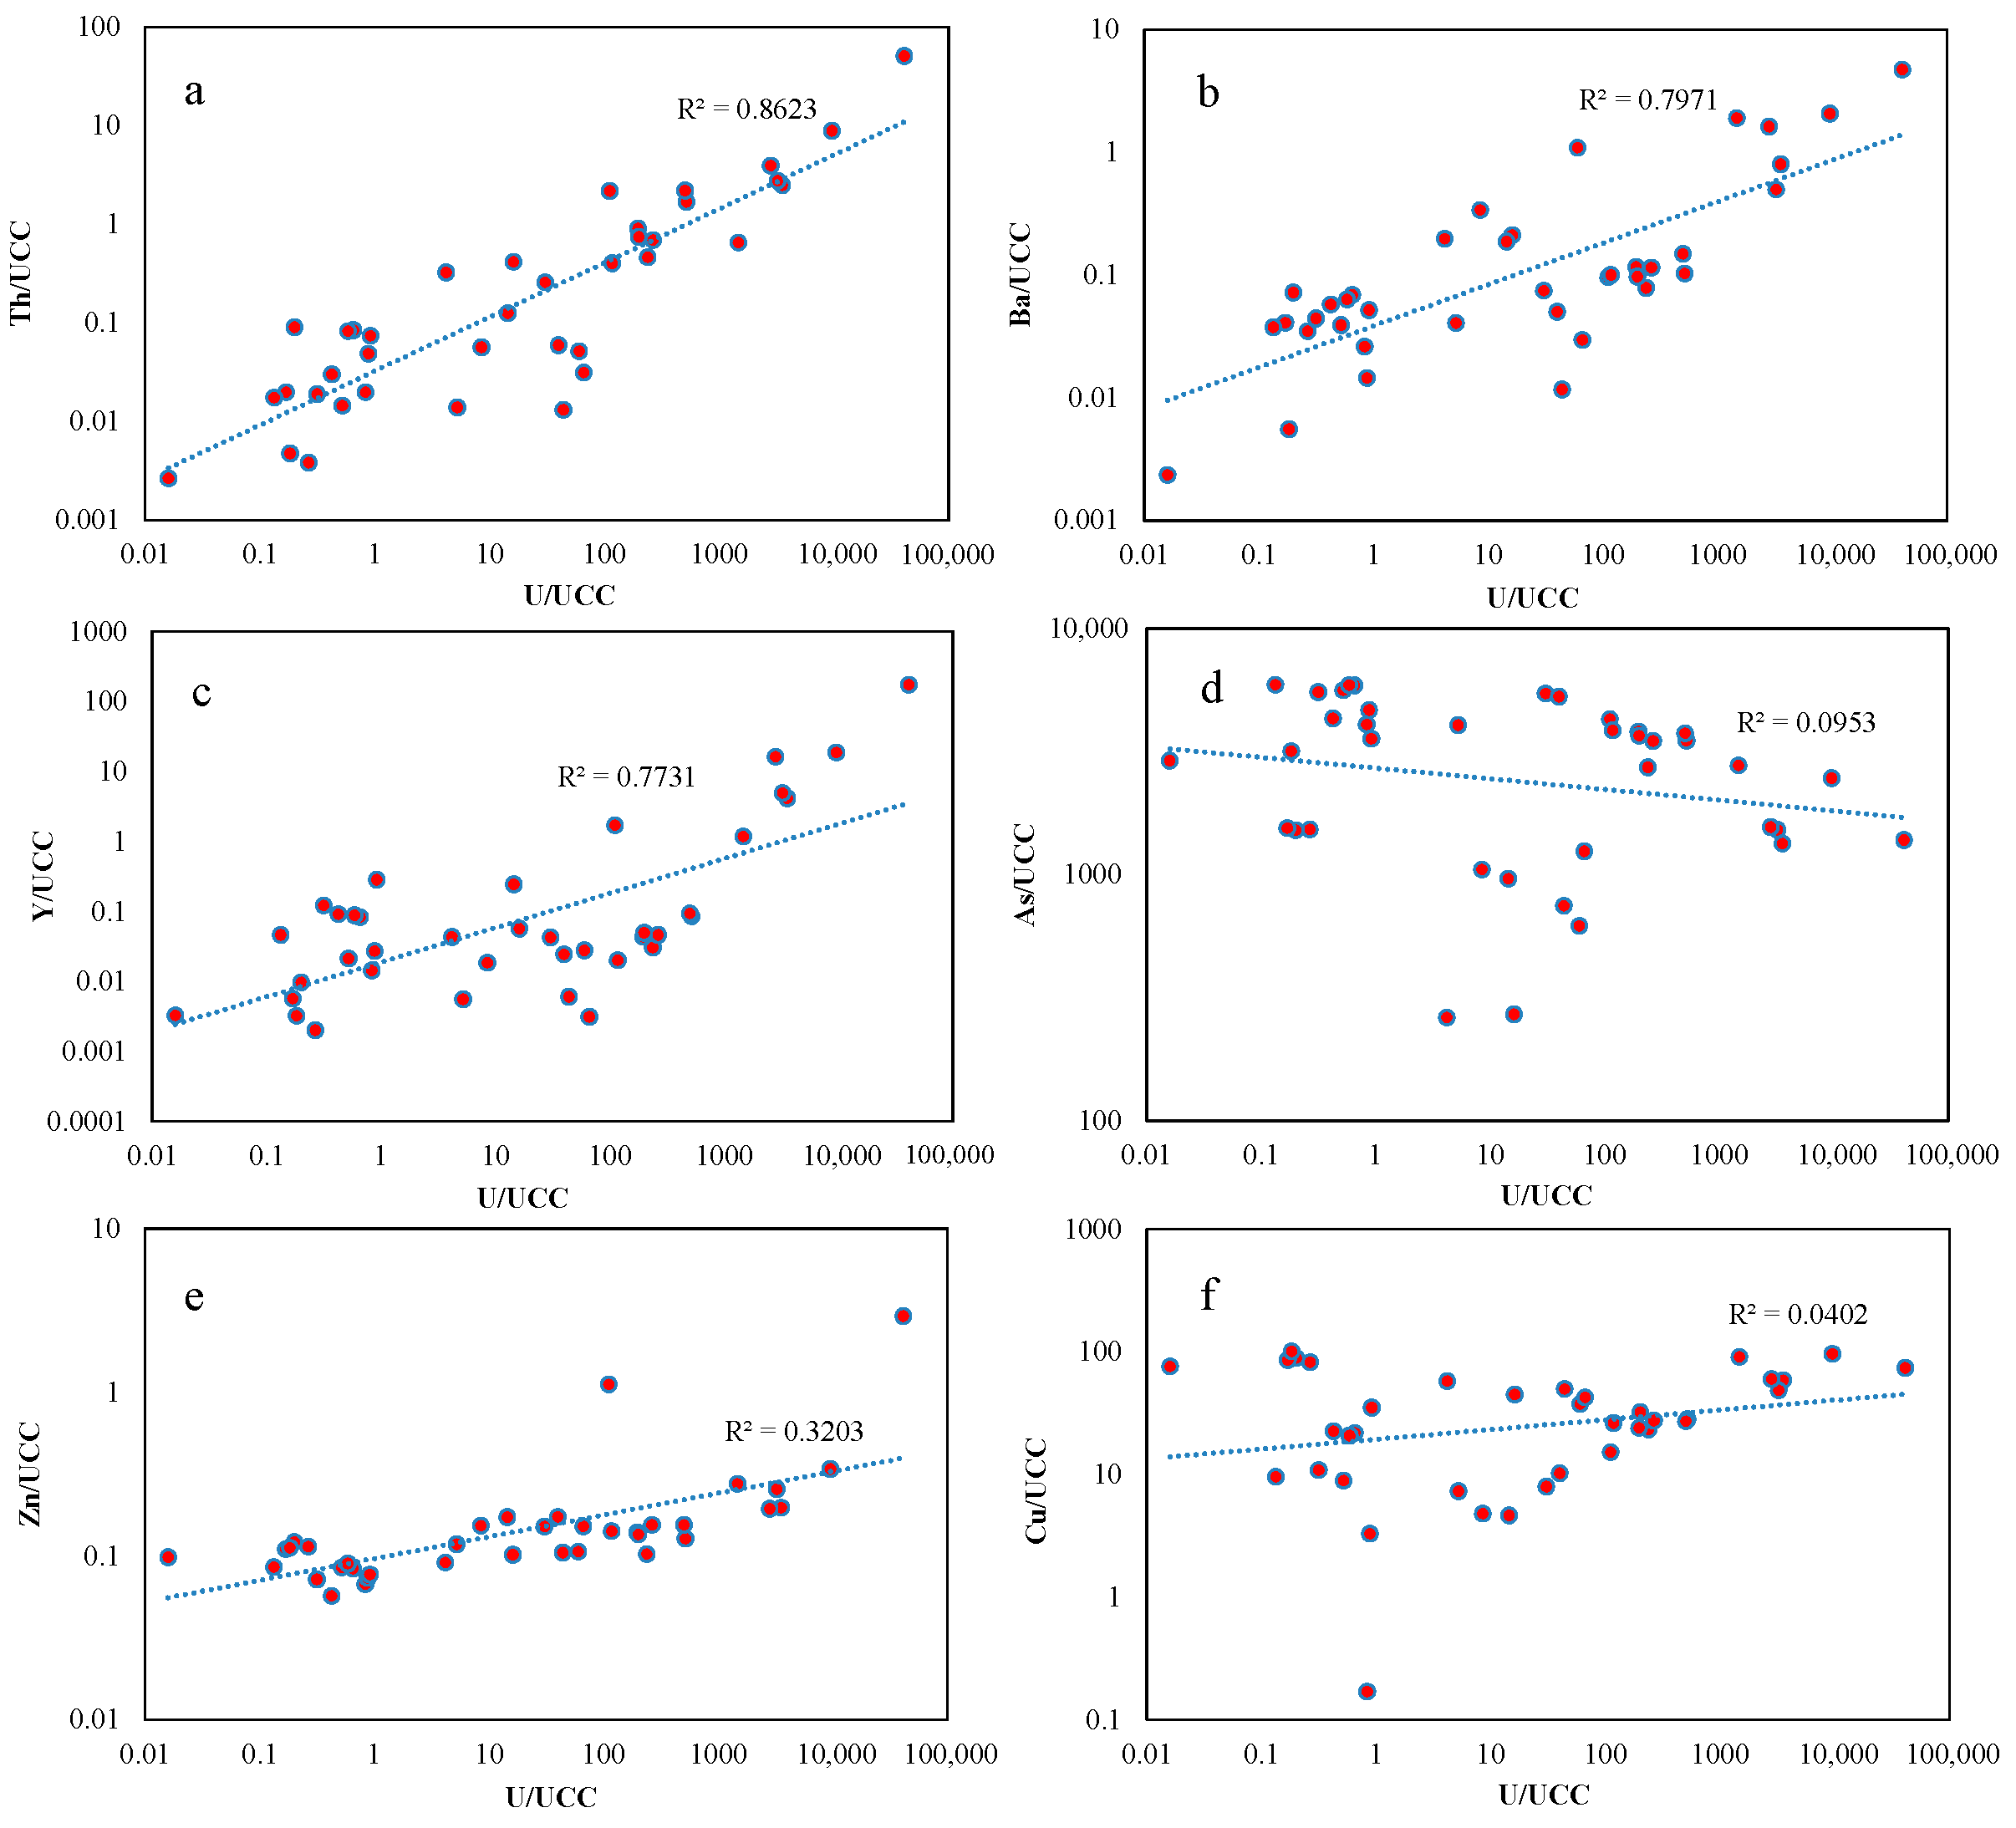
In situ LA-ICP-MS trace element analyses were conducted on syn-ore pyrites from the U-hosted sandstones of the Hailijin deposit to investigate the primary elemental enrichment assemblages during U-mineralization. The results reveal that U exhibits strong positive correlations with elements such as As, Ba, Th, Mo, Y, Cu, Zn, Se, and Sb within the syn-ore pyrites (Figure 10). Furthermore, the spatial concentration profiles from the rim to the core of individual pyrite grains display a distinct decreasing trend for elements including As, Mo, Se, and Sb. These geochemical signatures indicate that the ore-forming fluids were highly enriched in U, Fe, S, As, Ba, Mo, Cu, and Zn. Given that these elements possess strong chalcophile affinities and are typically difficult to precipitate and concentrate solely from meteoric waters, it is inferred that the ore-forming fluids of the Hailijin U deposit likely originated from deep-seated reducing fluids.

4.3. Fluid Inclusion

4.3.1. Fluid Inclusion Petrography

Petrographic observations reveal that the transparent to translucent minerals within the uranium ores of the Hailijin deposit are predominantly detrital quartz, accompanied by minor amounts of diagenetic and syn-ore dolomite cements. Based on the established paragenetic sequence, fluid inclusion petrography was systematically conducted on minerals from various alteration stages.
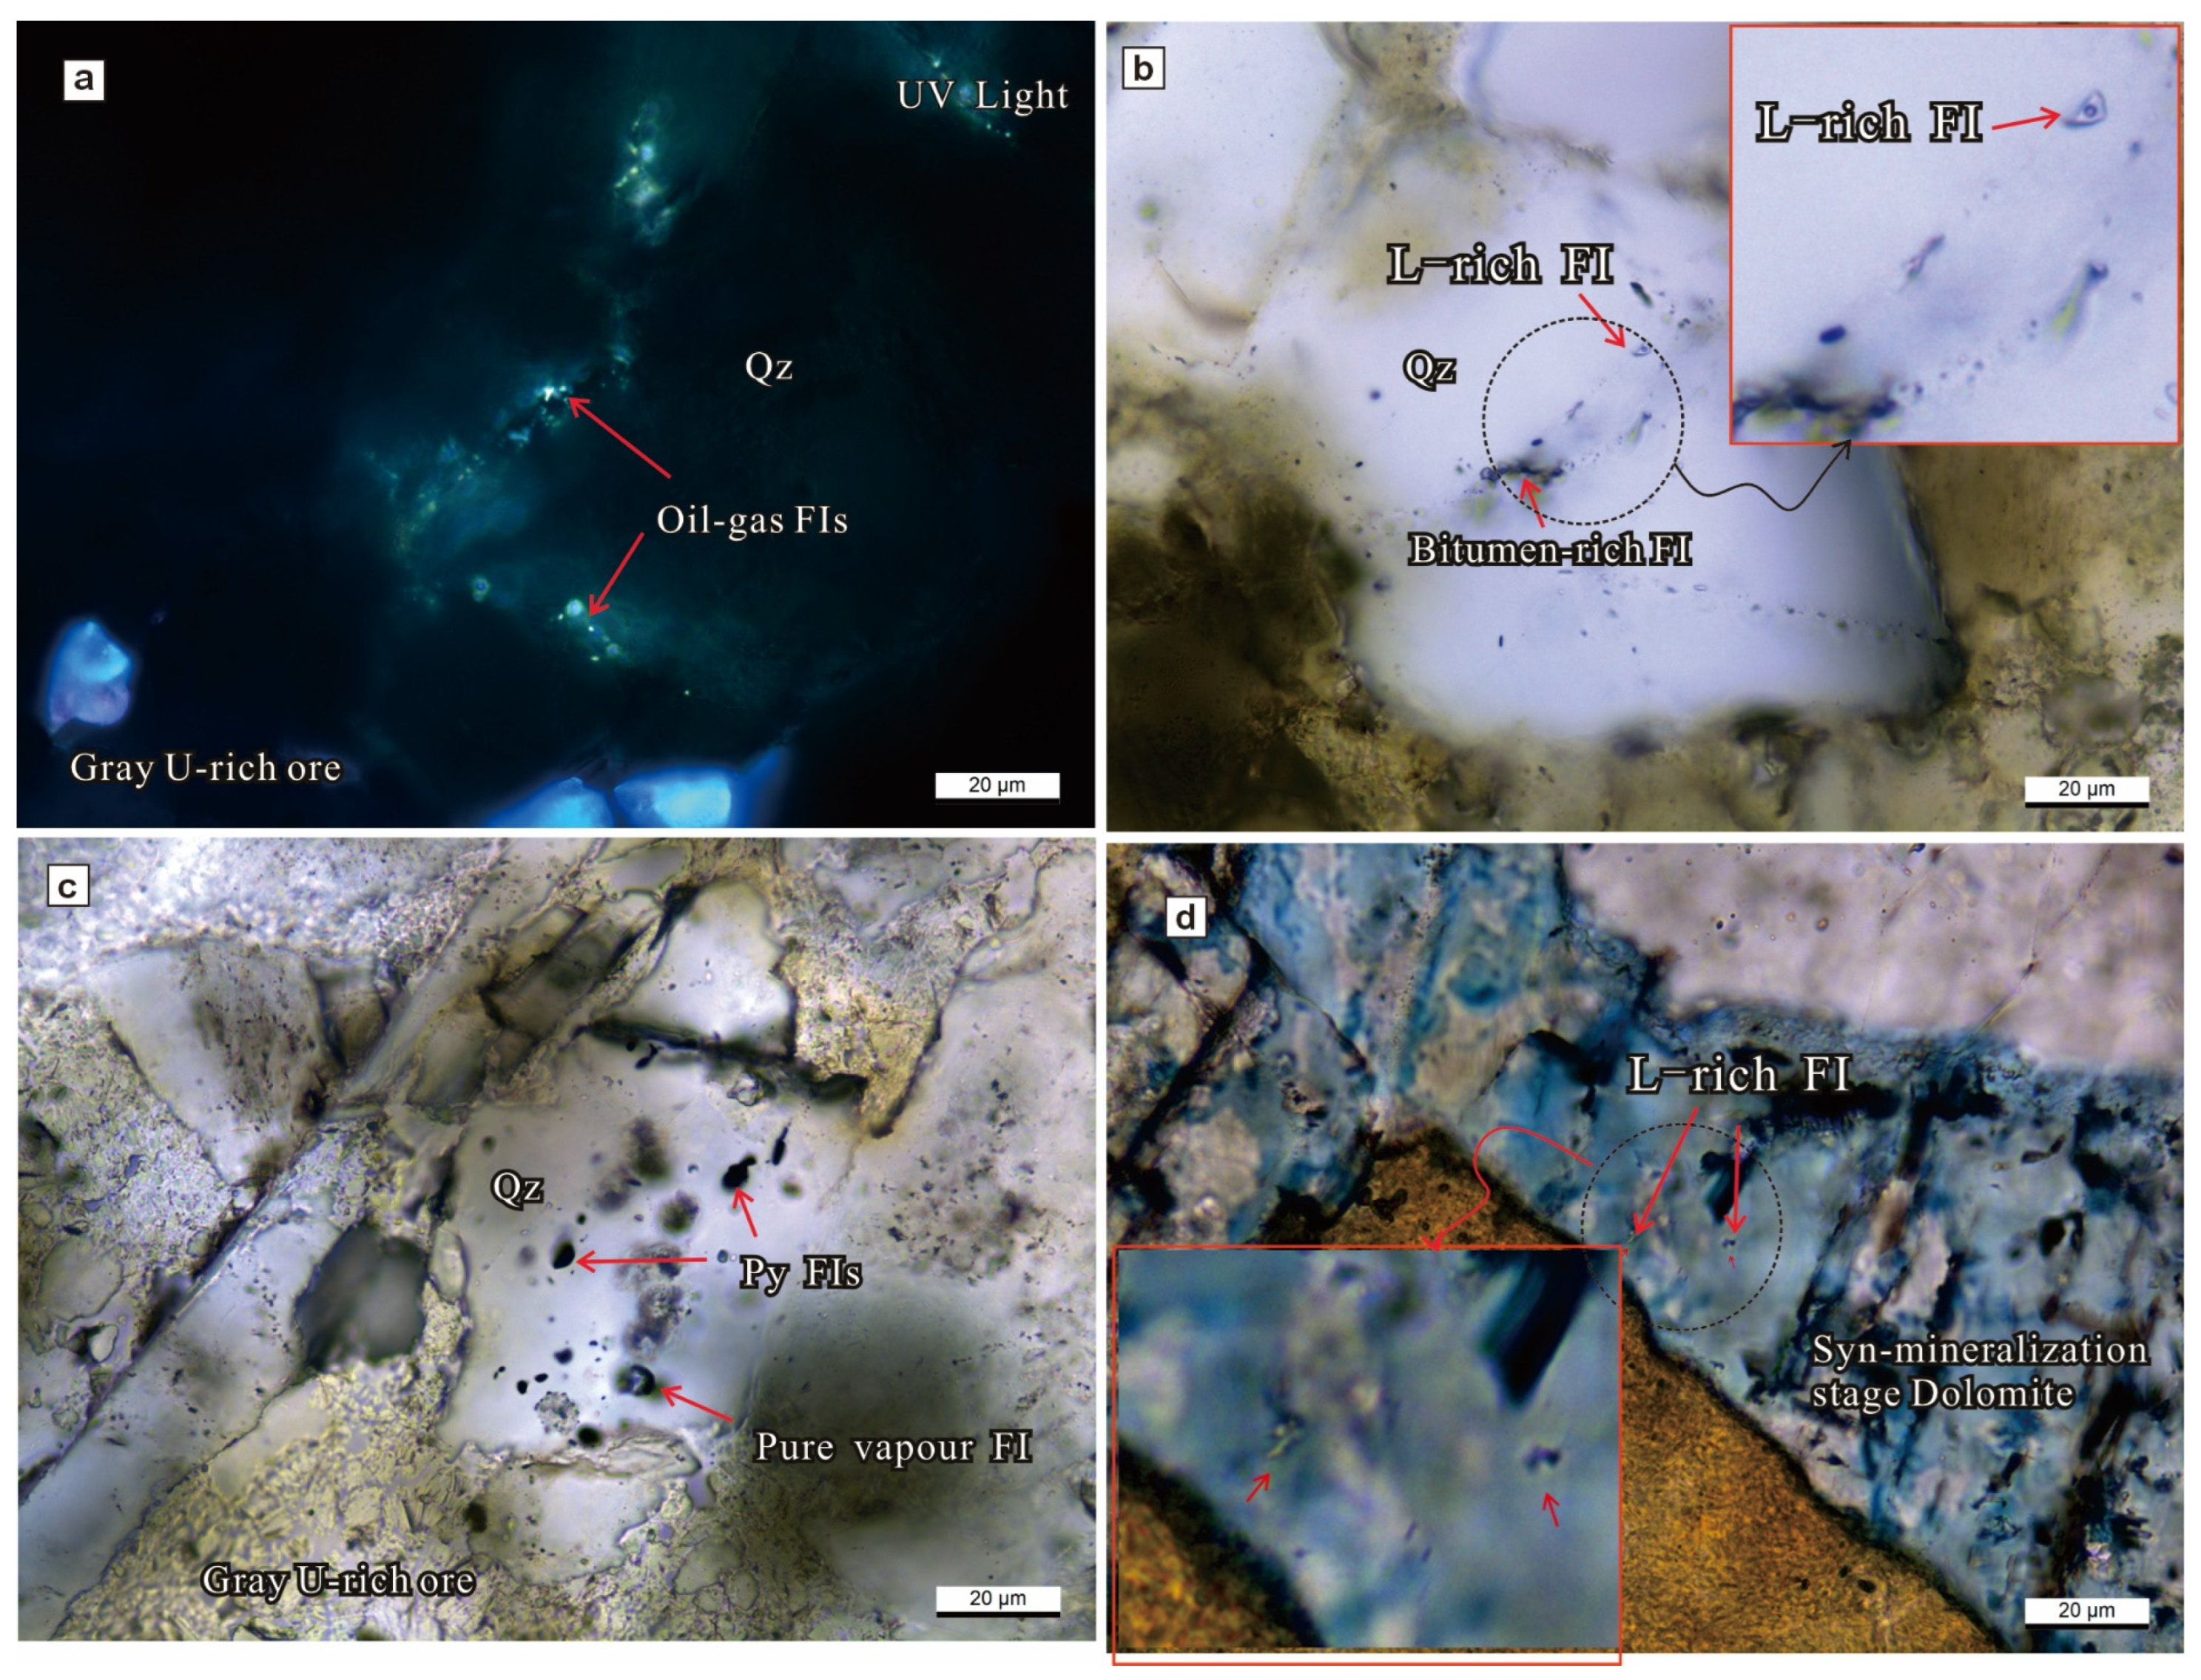
Uranium mineralization in the Hailijin deposit is intimately associated with “fluidic” OM (Figure 11a). Within the ore-bearing sandstones, primary transparent minerals comprise detrital quartz and feldspar. Notably, some of these detrital grains host gas-liquid and liquid hydrocarbon (or bitumen) inclusions. These inclusions are typically distributed in bands along microfractures or dissolution pores within the quartz grains and exhibit light blue fluorescence under ultraviolet light (Figure 11b), indicating that the host sandstones underwent a history of hydrocarbon fluid charging and migration. Furthermore, pyrite inclusions, bitumen-rich inclusions, and gas inclusions are observed aligning along microfractures within the detrital grains (Figure 11c,d). Locally, these are observed coexisting with two-phase liquid-rich aqueous inclusions. This specific assemblage represents mineralization-related inclusions, providing direct insights into the nature of the uranium ore-forming fluids. The sizes of these inclusions vary from 3 to 10 μm, and their morphologies are predominantly rounded, elongated, or irregular.

4.3.2. Fluid Inclusion Compositions

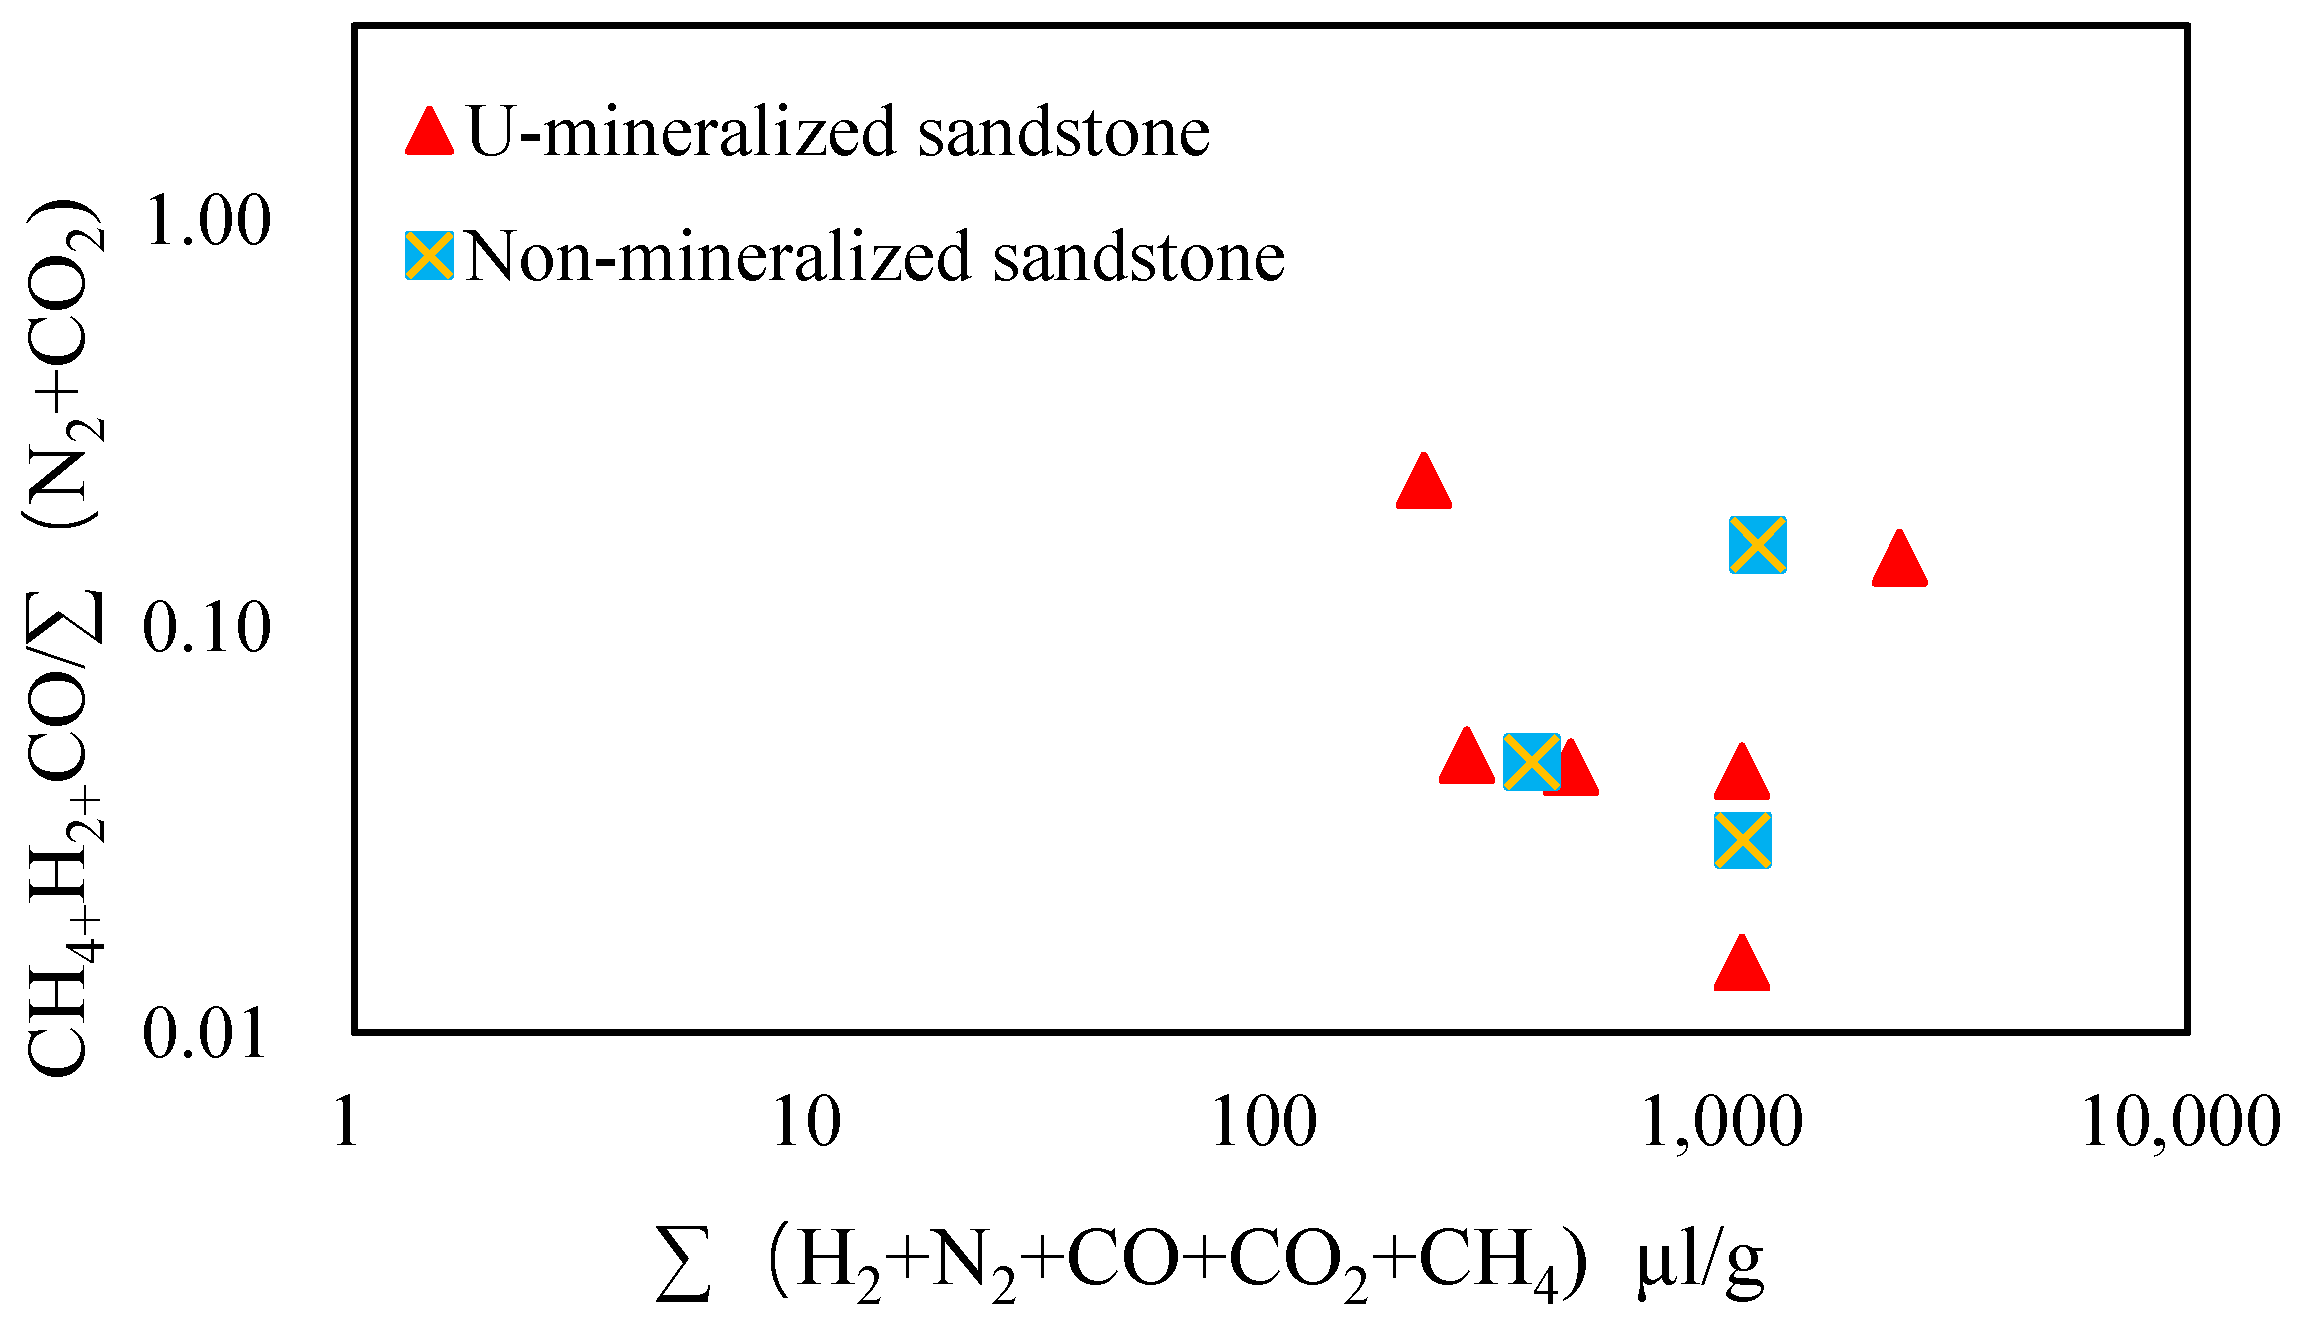
Laser Raman spectroscopic analyses reveal that the black ‘materials’ distributed in bands along the microfractures crosscutting detrital quartz grains in the ore-bearing sandstones of the Hailijin deposit mainly comprise two categories: pyrite (or iron oxides) and carbonaceous matter (representing the cracking products of organic fluids). The volatile components of the syn-ore fluid inclusions within the detrital quartz grains are characterized by carbonaceous matter, CH4, and minor O2. Notably, the gas compositions within the dolomite cements from various stages could not be detected due to intense fluorescence interference. Analysis of gas compositions of fluid inclusions in quartz selected from the ore-hosting sandstones, extracted using the decrepitation method by gas chromatography, indicates that the U-mineralized sandstones are characterized by higher contents of reducing gases (CH4, H2, and CO) and lower contents of oxidizing gases (CO2 and O2) (Figure 12).

4.3.3. Temperature and Salinity of Fluid Inclusions

Within the detrital quartz grains of the ore-bearing gray sandstone, fluid inclusions commonly occur in the form of gas-liquid hydrocarbons and liquid hydrocarbons (or bitumen) along microfractures or solution pores, often displaying pale blue fluorescence (Figure 11a–c). Pyrite inclusions and a small number of brine-rich liquid inclusions are also observed (Figure 11b). Laser Raman analysis of the bitumen-rich inclusions reveals that the main components consist of OM. During the mineralization period, the ankerite cement is characterized by significant development of pyrite inclusions and a small number of liquid-rich inclusions, with a gas-liquid ratio ranging from 2% to 5% (Figure 11d). These fluid inclusions are trapped during the mineralization phase, thereby providing direct information regarding the nature of the ore-forming fluids. In contrast, the post-ore (late-stage) dolomite cements host only sparse monophase liquid inclusions and liquid-rich aqueous inclusions with vapor fractions of less than 1%.
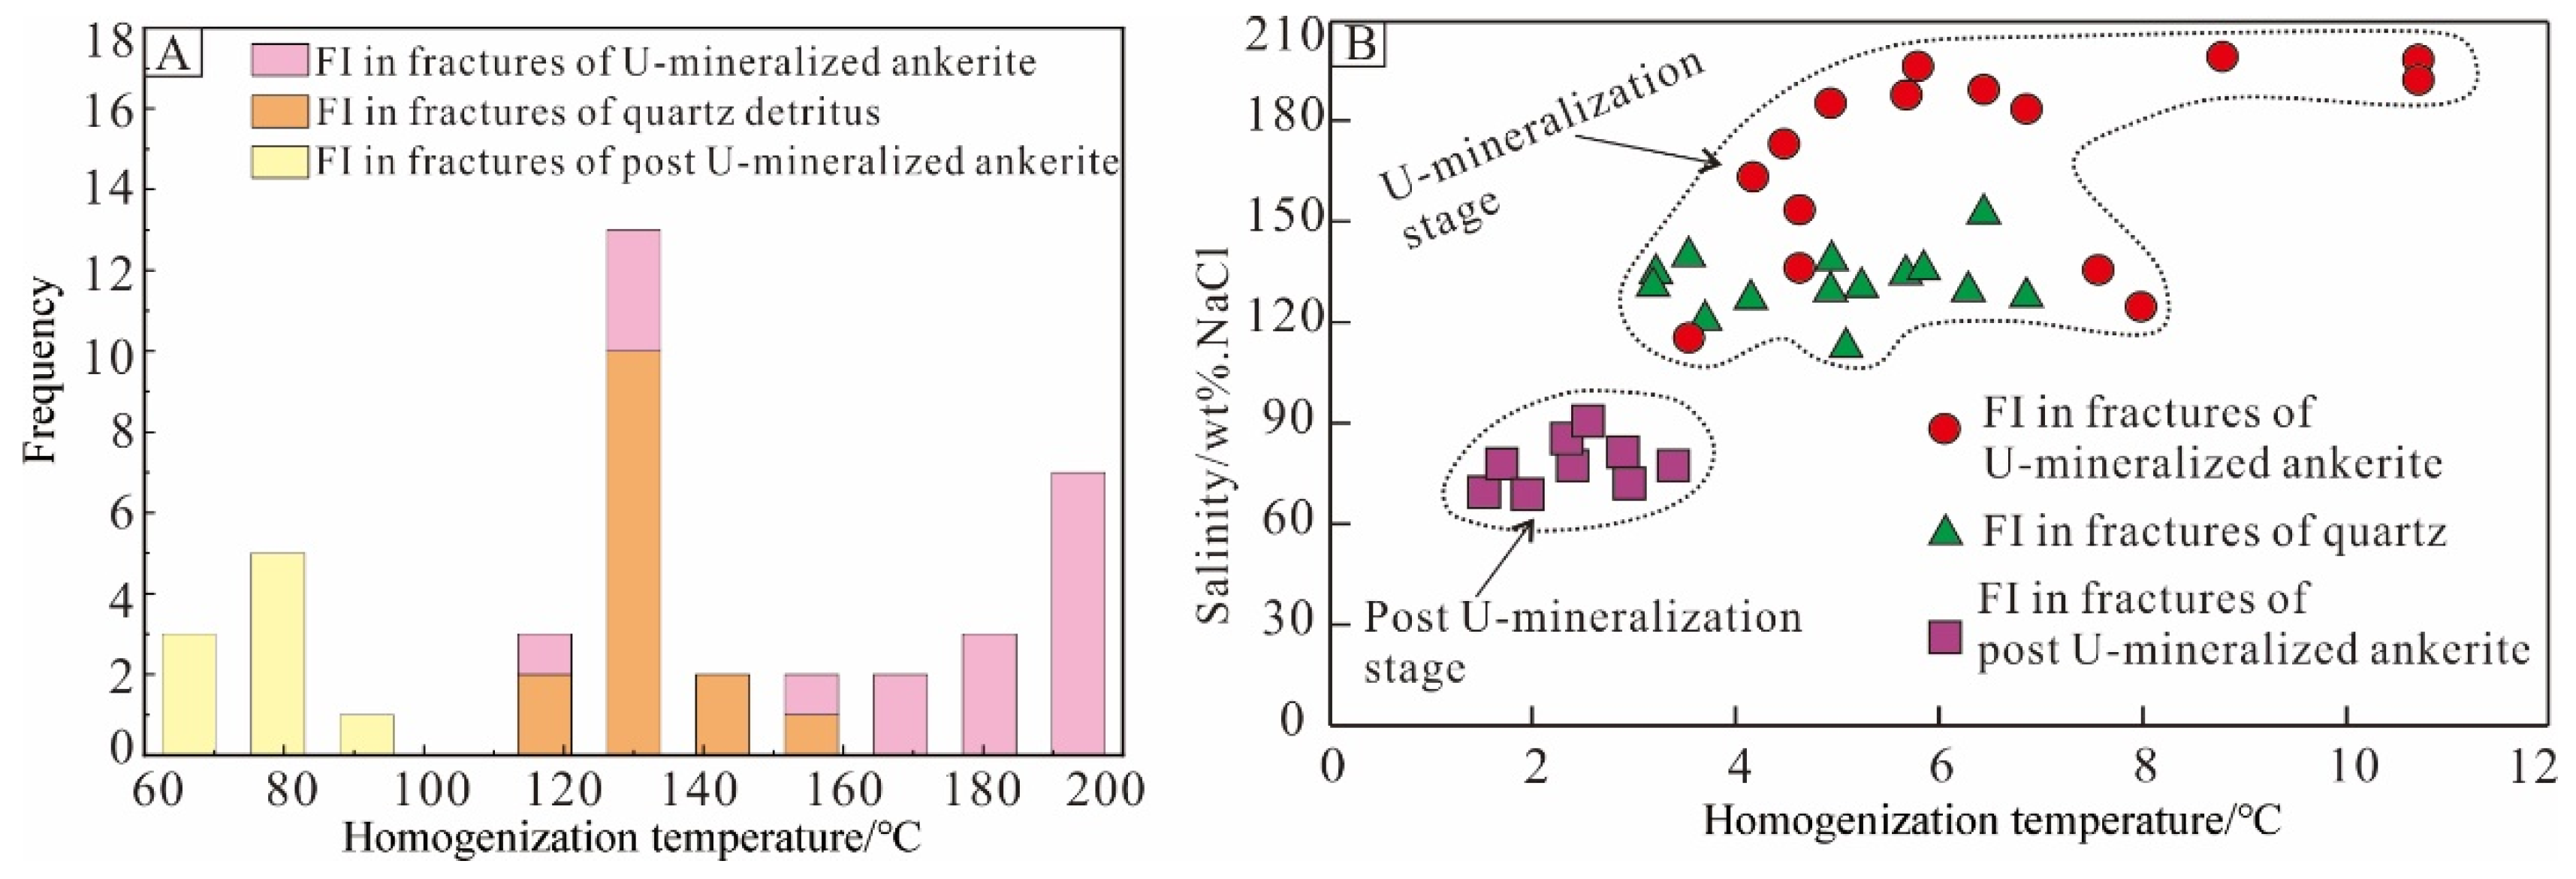
The microthermometric results for selected typical fluid inclusions are summarized in Table 3, based on which homogenization temperature (Th) histograms and temperature -salinity scatter plots were constructed (Figure 13). The Th histograms (Figure 13A) illustrate that the primary liquid-rich aqueous inclusions, which occur in clusters within the syn-ore dolomite cements rich in pyrite and OM, yield homogenization temperatures primarily concentrated between 163 °C and 190 °C, with salinities ranging from 2% to 8 wt.% NaCl eq. Meanwhile, the aqueous inclusions distributed along microfractures at the margins of detrital quartz, coexisting with pyrite and OM, exhibit temperature values between 122 °C and 153 °C, with salinities of 3% to 8 wt.% NaCl eq. Collectively, these data suggest that the uranium mineralization temperatures were mainly concentrated between 130 °C and 190 °C, with salinities ranging from 3% to 8 wt.% NaCl eq. Notably, this temperature range represents highly favorable conditions for the generation of organic acids from OM in source rocks. During the late diagenetic stage, the temperature of primary liquid-rich inclusions within the massive dolomite cements decreased to 69–90 °C, with salinities degrading to 2–4 wt.% NaCl eq.
The temperature–salinity scatter plots (Figure 13B) provide a further intuitive representation of the fluid evolution trajectory. Previous studies have indicated that the maximum burial depth of the Cretaceous strata in the southern Songliao Basin does not exceed 1500 m [18]. Assuming the maximum geothermal gradient of 3.5–4.0 °C/100 m for the Cretaceous in the study area, the normal formation temperature at maximum burial would only be 80–90 °C (which is consistent with the late diagenetic fluid temperatures). Compared to the normal diagenetic evolution background and the early-to-middle stage fluids, the fluid temperatures and salinities within the syn-ore alteration minerals exhibit an anomalously significant increase. This thermal anomaly indicates that the uranium-bearing ore-forming fluids were not merely basin formation waters; rather, they likely originated from the upwelling of deep-seated thermal fluids or were closely associated with Early Cretaceous regional tectono-thermal events. Furthermore, these thermal fluids were rich in low-maturity macromolecular OM and abundant hydrocarbon compounds.

4.4. In Situ Sulfur Isotope Analysis of Pyrite

Based on detailed mineralogical and petrographical investigations, in situ micro-scale sulfur isotope analyses of pyrite paragenetic with uranium minerals in the Hailijin deposit were conducted using LA-ICP-MS; the analytical results are summarized in Table 4. The data indicate that the δ34S values of pyrite within the mineralized sandstones of the Hailijin deposit range from −49.24‰ to −23.1‰, with a mean value of −41.9‰ (n = 16). These values are characterized by a significant depletion in δ34S. Generally speaking, the sulfur isotope compositions in the southwestern Songliao Basin are notably light, falling within the isotopic range of petroleum-derived and biogenic sulfur [19,20,21,22,23].
In natural systems, reduced sulfur (primarily as H2S) originates from magmatic sources (δ34S = 0 ± 5‰) as well as three common secondary processes: bacterial sulfate reduction (BSR), thermochemical sulfate reduction (TSR), and thermal decomposition of sulfur-bearing OM (TDS) [24,25]. Sulfur isotope fractionation induced by BSR typically ranges from 4‰ to 46‰ [26,27,28,29,30], reaching a maximum of 65‰, with δ34S values being predominantly negative [28,31]. This process generally occurs in surface or near-surface environments where bacteria can proliferate extensively (typically at temperatures < 80 °C). Fractionation produced by TSR is relatively minor, mostly between 0‰ and 10‰, with δ34S values generally ranging from 0‰ to 30‰ [32,33]; this process typically proceeds at temperatures exceeding 100–140 °C [24]. δ34S values derived from TDS primarily range between −19‰ and 30‰ and usually occur at temperatures >50 °C.
In summary, the syn-ore pyrite in the Hailijin uranium deposit exhibits distinctly negative δ34S values that become increasingly lighter toward the grain margins, which is consistent with sulfur sources derived from microbial processes (BSR) or the cracking of sulfur-bearing OM [34,35,36]. Consequently, the sulfur source during the uranium mineralization process is closely linked to BSR or TDS, suggesting a potential genetic relationship with deep-seated organic fluids associated with ‘exudative’ processes [5,37].

5. Discussion

5.1. Characteristics of the Ore-Forming Fluids

Petrographic investigations reveal the extensive development of veinlet and disseminated ‘mobile’ OM within the ore-bearing sandstones. These OMs are commonly paragenetic with framboidal and fine-grained pyrite veinlets. Intense pale blue fluorescence observed along the margins of these veinlets suggests OM fractionation, which produced dark-brown solid bitumen with macromolecular structures and light oils with low-molecular-weight structures. SEM-EDS analysis further identifies extremely fine acicular and short-prismatic coffinite within the pyrite-bearing organic veinlets. In contrast, U minerals and pyrite are absent in zones distal to the OM. These spatial relationships indicate that the formation of U and pyrite was intimately linked to the migration of ‘mobile’ organic fluids, suggesting that the ore-forming fluid was an organic-rich medium enriched in U, S, and Fe [11]. Microscopic observation and Raman spectroscopic analysis indicate that the OM is closely related to uranium mineralization [11,34,38], the micro-infrared spectroscopic analysis results indicate that the ore-bearing OM is a complex OM rich in carbonyl, carboxyl, methyl and methylene groups.
The syn-ore fluid inclusion assemblage (FIA) is characterized by bitumen-rich, iron-rich, and liquid-rich aqueous fluid inclusions, along with minor hydrocarbon inclusions exhibiting intense pale blue fluorescence. Micro-laser Raman spectroscopy identifies the solid phase within these inclusions as predominantly carbonaceous, with a few gas phases dominated by CH4 and minor O2. Gas chromatography of quartz separates further reveals that the gas components consist mainly of CO2 and H2, supplemented by certain amounts of N2 and CH4. Notably, U-mineralized sandstones are relatively enriched in reducing -member gas components (CH4-CO-H2), whereas non-mineralized sandstones are more enriched in oxidizing end-member components (N2-CO2). The U-ores host abundant disseminated OM inclusion, which Raman spectroscopic analysis identifies as having low thermal maturity and a high degree of structural disorder. Microthermometric results indicate that the peak homogenization temperatures (Th) of the syn-ore fluids range from 130 °C to 190 °C, with salinities of 3–8 wt.% NaCl eq. Theoretically, the ambient temperature reached at maximum burial prior to mineralization was approximately 80–90 °C. The fact that the syn-ore fluid temperatures are significantly higher than this maximum burial temperature indicates a pronounced thermal anomaly during the mineralization stage, which could be linked to the mafic diabase intrusions in the study area (Figure 2).
Trace element analysis of syn-ore pyrite reveals distinct positive correlations between U and elements such as As, Ba, Th, Mo, Y, Cu, Zn, Se, and Sb (Figure 10). Furthermore, concentrations of As, Mo, Se, and Sb exhibit a clear decreasing trend from the rim to the core of the pyrite grains. These geochemical signatures indicate that the ore-forming fluids were enriched in U, Fe, S, As, Ba, Mo, Cu, and Zn.
In summary, the results suggest that the ore-forming fluid of the Hailijin uranium deposit was an organic-rich, low-temperature, and low-salinity medium. This fluid was enriched in U, Fe, S, As, Ba, Mo, Cu and Zn. The peak fluid temperatures (130–190 °C) were significantly higher than the ambient temperatures at maximum burial, underscoring the influence of exogenous thermal fluids during the mineralization process.

5.2. Origin of Ore-Forming Fluids

OM characterization indicates that the veinlet-disseminated OM within the ore-bearing sandstones of the Hailijin deposit, southern Songliao Basin, is neither charred debris nor typical bitumen. Instead, it consists of complex macromolecular organic compounds characterized by functional groups such as methyl, methylene, carbonyl and carboxyl [1]. The residual OM in the host sandstones is predominantly derived from lower aquatic organisms, with minor contributions from higher terrestrial plants. Its biomarker assemblages are highly comparable to those of the Lower Cretaceous Jiufotang Formation source rocks in the region, suggesting that the OM in the Yaojia Formation host sandstones likely originated from the Jiufotang Formation [1]. Furthermore, sulfur isotope signatures of syn-ore pyrite are consistent with either the thermal decomposition of sulfur-bearing OM (TDS) or bacterial sulfate reduction (BSR). These results imply that the sulfur source was associated with microbial activity or organic cracking, potentially triggered by the ‘exudation’ of deep-seated organic fluids [11,39,40,41].
Collectively, a suite of geological and geochemical evidence demonstrates that the U-bearing ore-forming fluid in the Hailijin deposit was a medium enriched in ‘mobile’ macromolecular OM and mineralizing elements such as U, Fe, Cu, and Zn. Given that these chalcophile elements are difficult to precipitate or concentrate in meteoric waters or by redox processes, it is inferred that the ore-forming fluids likely originated from deep-seated reducing fluids. Both the OM and the metallic components in these fluids were primarily derived from the Lower Cretaceous Jiufotang Formation source rocks, accompanied by a significant thermal anomaly during the mineralization stage.

5.3. Evolution of Ore-Forming Fluids

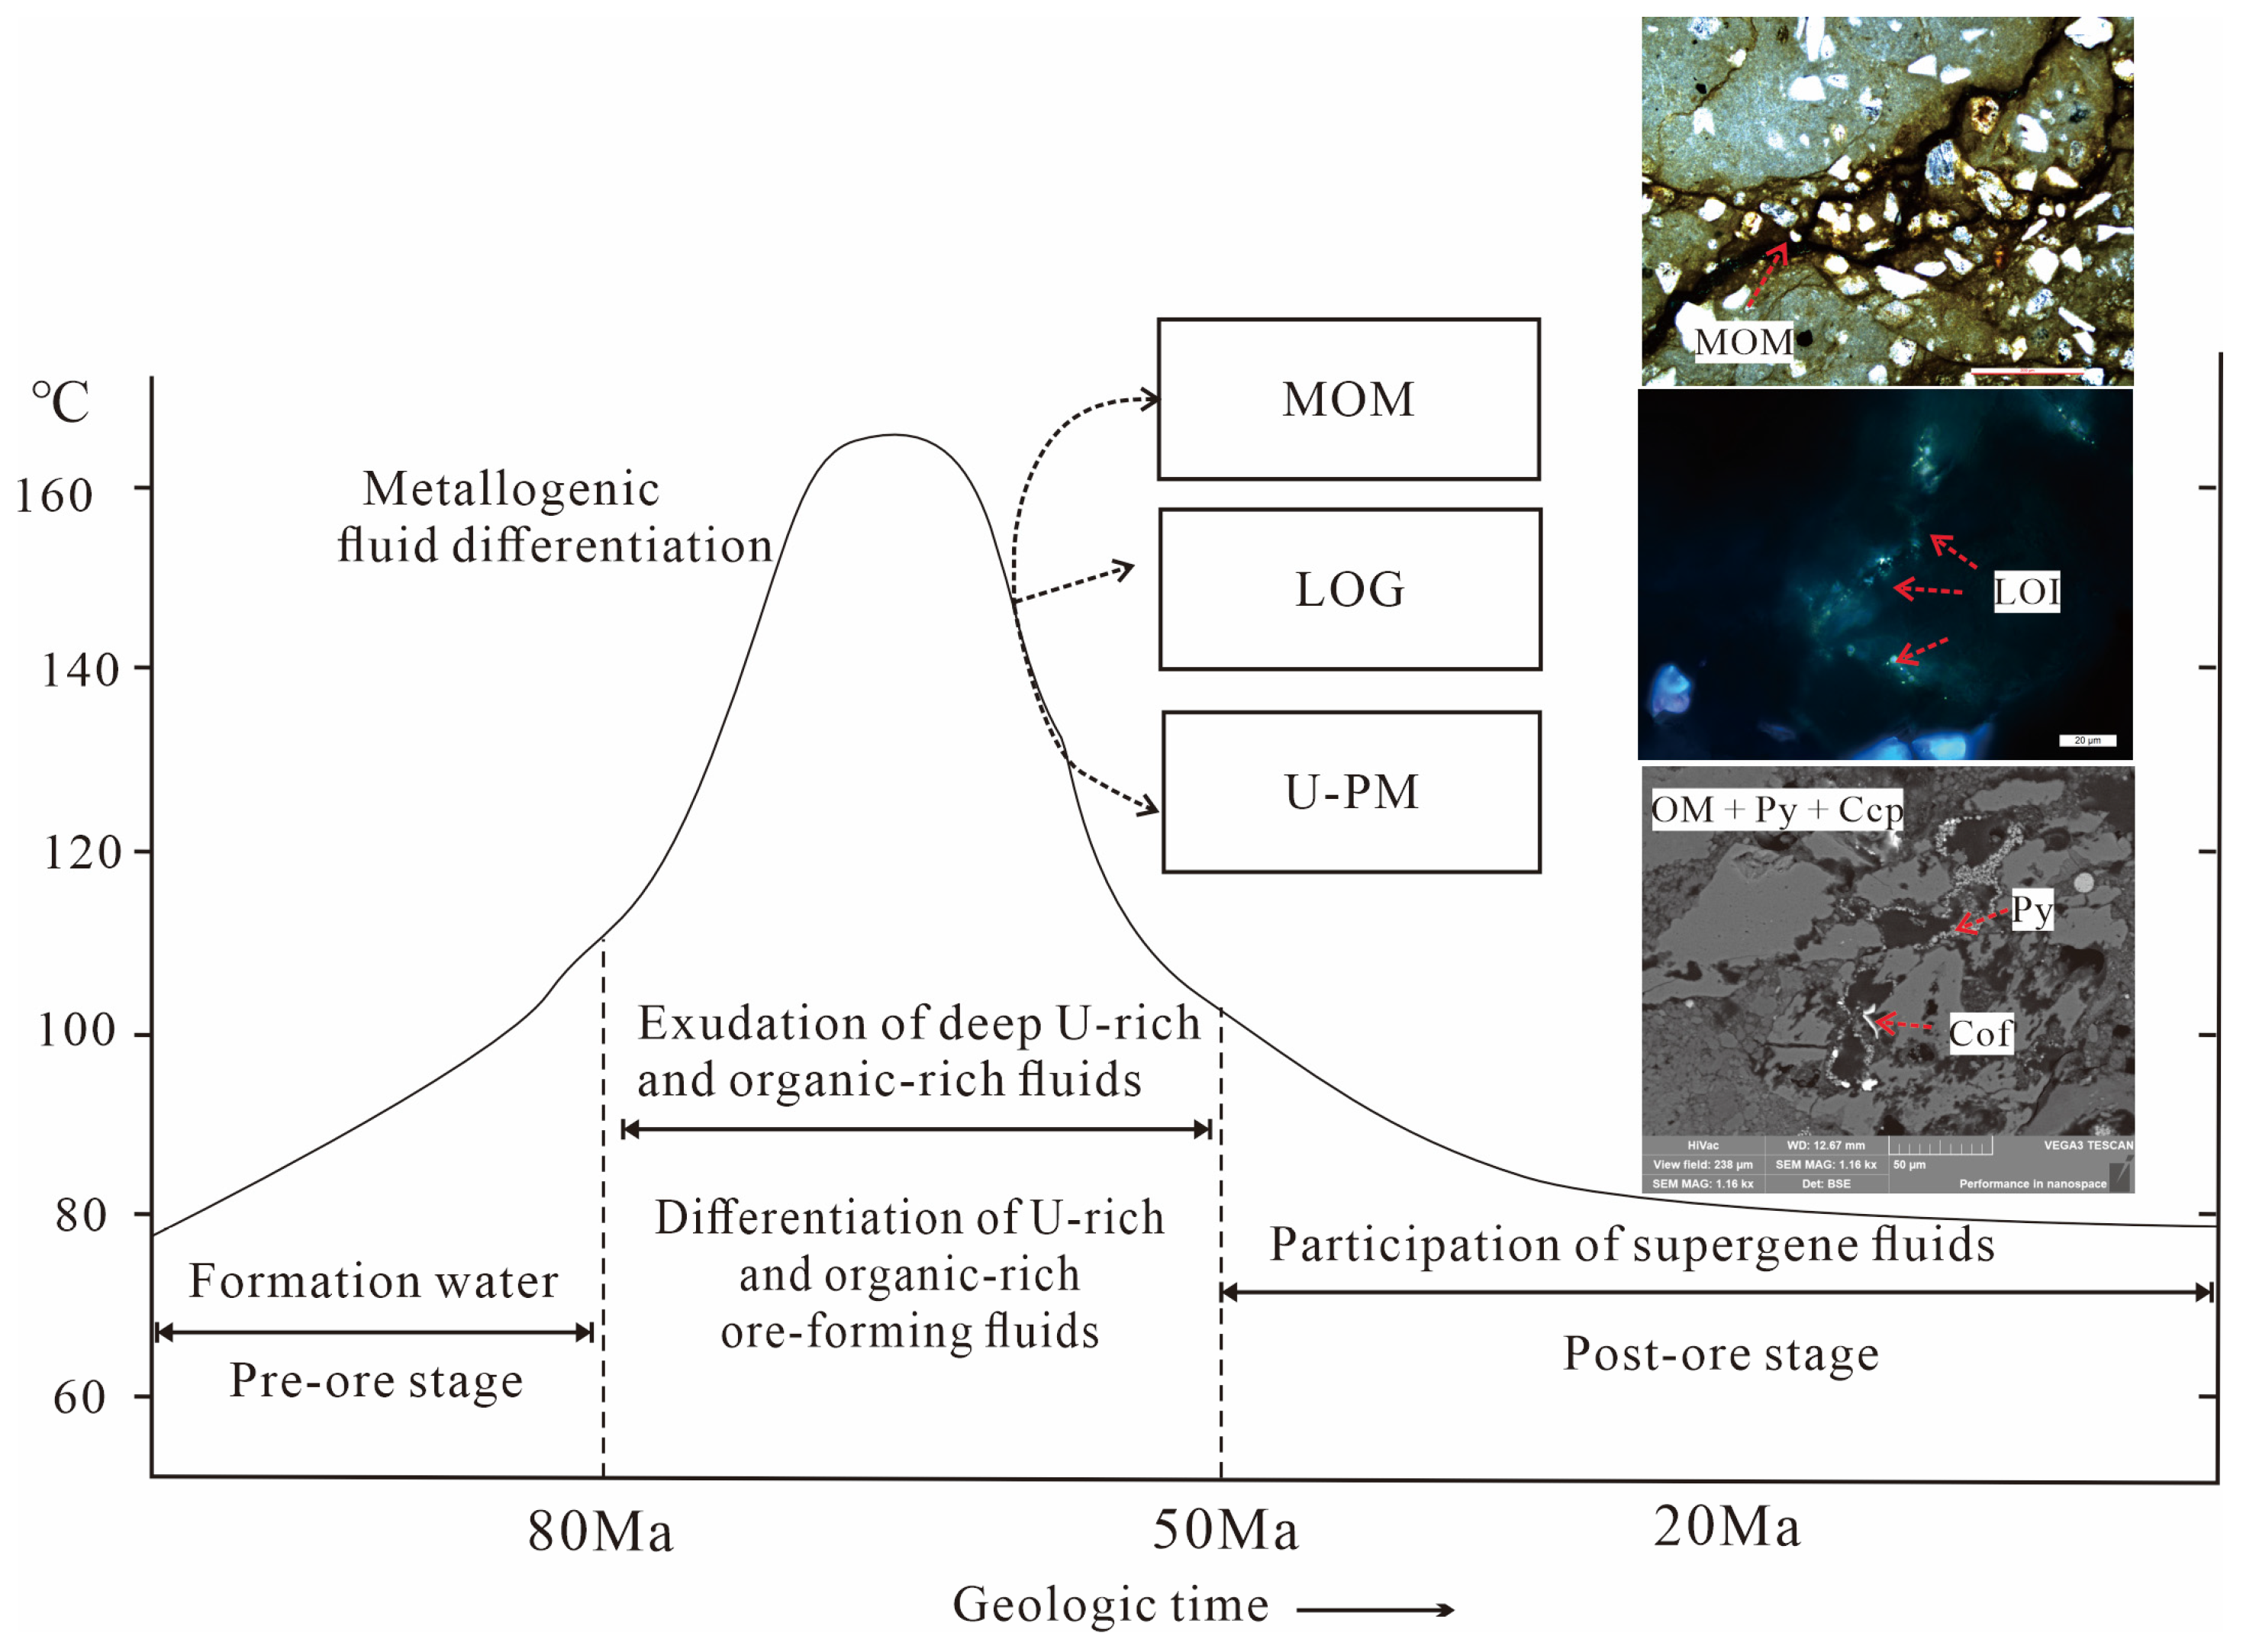
Based on burial history data from the southwestern Songliao Basin, the maximum burial depth of the Yaojia Formation is approximately 1500 m [18]. Influenced by regional magmatic activity during the Cretaceous and Paleocene, the geothermal gradient typically ranges from 3.5 °C to 4.0 °C/100 m [3]. Accordingly, the calculated maximum burial temperature for the Cretaceous strata is estimated to be between 80 °C and 90 °C. Tian et al.’s study on the early-stage quartz overgrowths in the Dalin uranium deposit also confirmed that the quartz overgrowths formed during the burial stage at a temperature of approximately 85 °C [1], which corresponds precisely to the fluid temperature during the maximum burial stage of the Yaojia Formation. In contrast, the peak temperatures of the syn-ore fluids are concentrated between 130 °C and 180 °C, indicating a significant thermal increase during the mineralization stage. This phenomenon is likely associated with regional thermal events during the Late Cretaceous to Paleocene. Furthermore, the fluids were enriched in hydrocarbons and low-maturity macromolecular OM. Following the mineralization stage [42], the host sandstones underwent extensive carbonate cementation. The Temperature of late-stage dolomite cement is generally below 90 °C, suggesting a subsequent decline in fluid temperature post-mineralization. Synthesizing these findings and previous U geochronological data with a major cluster spanning 80 to 50 Ma [6], this study proposes an evolution model for the ore-forming fluids of the Hailijin uranium deposit in the southern Songliao Basin (Figure 14). The model suggests that deep-seated, ‘exudative’ organic-rich fluids were involved in large U mineralization during the period from 80 Ma to 50 Ma.

5.4. Implications of Fluid Evolution for Uranium Mineralization

As established earlier, multiple lines of evidence—including the composition of mineralizing substances, the physicochemical properties of ore-forming fluids, the characterization and molecular geochemical correlation of OM, and sulfur stable isotope data—consistently support the conclusion that both the mineralizing materials and the organic-rich fluids predominantly originated from the Lower Cretaceous Jiufotang Formation source rocks. Specifically, the Jiufotang source rocks expelled organic acids, mineralizing elements, and water concurrently with hydrocarbon generation and migration.
Consequently, this study proposes that under specific temperature (>100 °C) and pressure conditions, the Jiufotang source rocks initiated the large expulsion of organic acids and mineralizing elements (e.g., U, Pb, Zn, and Fe). These metallic elements subsequently coordinated (via complexation or chelation) with organic acids enriched in functional groups such as carboxyl (-COOH) and hydroxyl (-OH). This process led to the formation of complex, nano-structured organic compound colloids that migrated freely within the fluid phase. U likely migrated primarily in its tetravalent form (U4+), although the presence of hexavalent uranium (UO22+) species cannot be ruled out [43,44]. The general chemical interaction can be summarized as follows: 2R-COOH + U4+ + O2/UO22+ → RCOO-(UO2)-OOCR + 2H+ [45,46,47].
Research indicates that the Cretaceous U-mineralization in the southwestern Songliao Basin is primarily hosted within the Upper Cretaceous Yaojia (K2y) and Qingshankou (K2qn) Formations, with minor occurrences in the Nenjiang (K2n) and Sifangtai (K2s) Formations. The ore-bearing sandstones generally consist of a suite of braided river facies characterized by red-variegated sedimentary successions. Given the presence of thick, overlying red mudstones in the Yaojia Formation and the relative scarcity of carbonaceous debris within the host sandstones, adsorption-induced mineralization by carbonaceous matter or peat can be fundamentally excluded. Fluid inclusion studies demonstrate that the ore-forming fluid of the Hailijin deposit was a low-temperature, organic-rich medium significantly enriched in ‘mobile’ OM. The temperature during the mineralization stage was notably higher than that of the pre- and post-ore periods, exhibiting a distinct thermal anomaly. Uranium likely migrated as tetravalent species in the form of organic complex and colloids within these organic-rich fluids.
Consequently, this study proposes that the precipitation of uranium in the red mottled sandstones of the southwestern Songliao Basin was primarily driven by the oxidation, decomposition, and fractionation of U-rich organic fluids within an oxidizing environment. As the ore-forming fluids migrated into shallow, oxidizing sandstone aquifers, changes in temperature, pressure, and oxygen fugacity (fO2) destabilized the U-rich organic complex, leading to their decomposition. The ore-forming metals preferentially co-precipitated with polar macromolecular OM enriched in functional groups. Upon the exhaustion of these polar organic substances, the mineralizing materials subsequently attached to substrates with high specific surface areas, such as clay minerals. This model of oxidative decomposition of U-rich OM is corroborated by laser Raman spectroscopic analysis. Bitumen-rich inclusions, gaseous O2, and pyrite were simultaneously identified within the same generation of micro-fractures in quartz grains from high-grade ores. Furthermore, the significant decline in fluid temperature following the mineralization stage (from approximately 180 °C to 70 °C) suggests that cooling was another critical factor in reducing uranium solubility and triggering its precipitation.
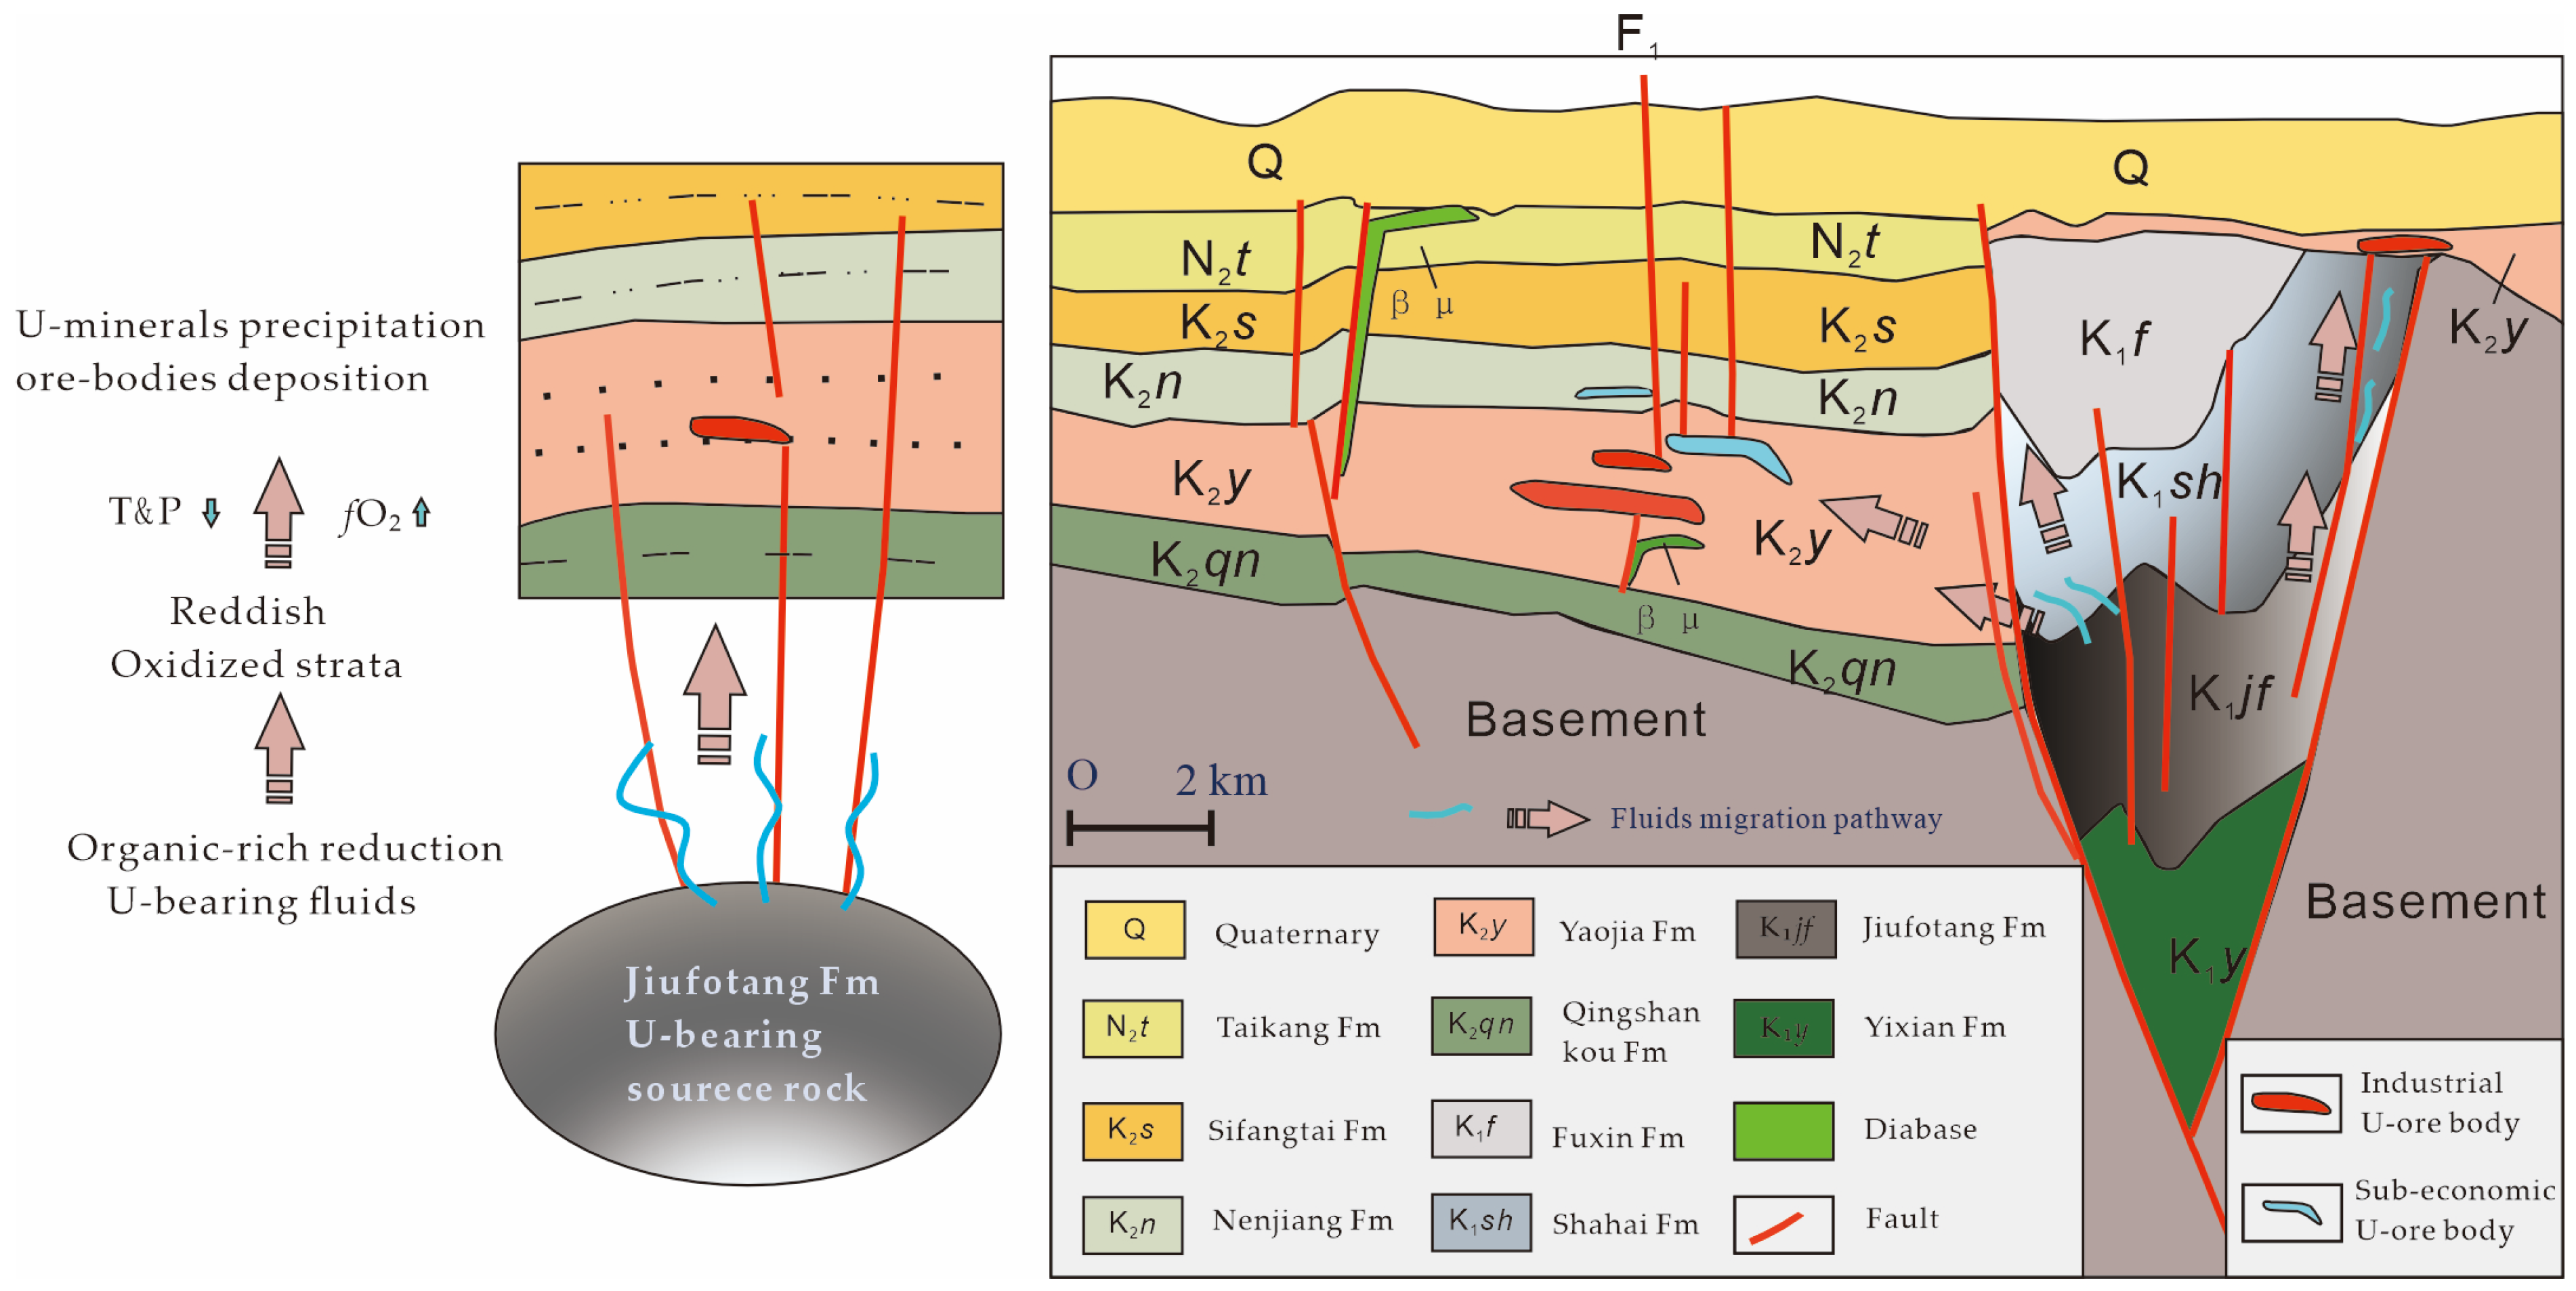
The syn-ore alteration mineral assemblage of the Hailijin uranium deposit comprises chlorite, uranium minerals, pyrite, sphalerite, and dolomite. The ore-forming fluid was a low-temperature, U-rich, and organic-rich medium, dominated by an aqueous phase and characterized by an abundance of ‘mobile’ OM. As these fluids encountered the oxygen-rich red-variegated sandstones, they underwent oxidation, decomposition, and fractionation, triggering the precipitation of metal sulfides (e.g., pyrite and sphalerite), U-minerals (e.g., coffinite and pitchblende), and macromolecular polymeric OM. Simultaneously, the light-to-medium organic fractions (low-molecular-weight organic acids, light oils, and natural gas) generated through the decomposition and fractionation of the ore-forming fluid dissipated into the host strata. These reducing organic components reacted with the red-variegated sandstone successions, leading to the reduction and ‘bleaching’ of the original red oxidized sandstones associated with the mineralization zones. Consequently, the red sandstones were altered to various shades of gray, grayish-white, and brownish-yellow, while the aqueous fluids were expelled into the peripheral sandstones surrounding the ore bodies. Integrating the regional geological evolution with the results obtained from this study, a conceptual model for the ore-forming fluid processes of the Hailijin U deposit is proposed, and its schematic representation is presented in Figure 15.

6. Conclusions

This study presents a comprehensive investigation of the Hailijin U deposit in the southwestern Songliao Basin, integrating fluid inclusion microthermometry, in situ sulfur isotope analysis, organic geochemistry, and regional geological constraints to elucidate the origin, migration, and precipitation mechanisms of U-mineralization. The following conclusions are drawn:
1. The ore-forming fluids of the Hailijin U deposit are characterized as low-temperature, low-salinity, reducing fluids significantly enriched in ‘mobile’ OM. Fluid inclusion microthermometry yields homogenization temperatures predominantly ranging from 130 to 190 °C, with salinities of 3–8 wt.% NaCl eq., values substantially higher than the regional normal burial temperature (80–90 °C) and especially meteoritic fluids.
2. In situ sulfur isotope and organic matter signatures suggest that both the ore-forming fluids and metallogenic components were predominantly derived from the deep-seated Lower Cretaceous Jiufotang Formation hydrocarbon source rocks. During hydrocarbon generation and expulsion, these source rocks synchronously released organic acids, U, and other ore-forming elements (e.g., Cu, Mo, and Zn), thereby furnishing the essential material inventory for U-mineralization.
3. Uranium was primarily transported as organic complexes or nano-scale organic colloids within the organic-rich reducing fluids. Following upward migration of these deep-sourced fluids along fault systems via exudation and their subsequent ingress into the oxidized reddish sandstones of the Yaojia Formation, destabilization of the U-bearing organic complexes was triggered by coupled changes in physicochemical conditions—including temperature decline, redox gradient shifts, and oxidative decomposition of organic ligands. This process induced the concomitant precipitation of uranium minerals (e.g., coffinite and uraninite) alongside pyrite, sphalerite, and other sulfides, ultimately leading to the formation of economically viable ore bodies.

Author Contributions

Sample collection, Z.L., M.T., J.N. and J.C.; data curation, M.T., M.L. and J.W.; writing—original draft preparation, Z.L. and M.T.; Data processing and editing, M.L. and L.Q.; supervision, Z.L.; project administration Z.L., J.C. and L.Q.; funding acquisition, Z.L. All authors have read and agreed to the published version of the manuscript.

Funding

This research was funded by the National Natural Science Foundation of China (Ye Qisun Fund), grant number U2341292, China National Nuclear Corporation Basic Research Project grant number JCYJ2302, Independent scientific research project of China Nuclear Corporation, grant number QNYC2402.

Data Availability Statement

The original contributions presented in this study are included in the article. Further inquiries can be directed to the corresponding authors.

Acknowledgments

The authors would like to thank the anonymous reviewers for their constructive comments and insightful suggestions, which significantly improved the quality of this manuscript. We also appreciate the editor and the editorial office for their efficient handling and professional assistance during the review process.

Conflicts of Interest

Jun Ning and Jianfang Cai are employees of Geological Party No. 243, China National Nuclear Corporation. This employment relationship is disclosed for transparency and did not inappropriately influence the conduct, interpretation, or reporting of the study. The authors declare no other conflicts of interest.

References

  1. Tian, M.; Li, Z.; Jia, L.; Liu, J.; Ning, J.; Li, J. Epigenetic Alteration of the Hailijin Sandstone-Hosted Uranium Deposit and Its Indications on Uranium Metallogenesis in the Songliao Basin, NE China. Minerals 2025, 15, 393. [Google Scholar] [CrossRef]
  2. Li, Z.; Chen, J.; Zou, H.; Wang, C.; Meng, Q.; Liu, H.; Wang, S. Mesozoic–Cenozoic Tectonic Evolution and Dynamics of the Songliao Basin, NE Asia: Implications for the Closure of the Paleo-Asian Ocean and Mongol-Okhotsk Ocean and Subduction of the Paleo-Pacific Ocean. Earth-Sci. Rev. 2021, 218, 103471. [Google Scholar] [CrossRef]
  3. Song, Y.; Ren, J.; Liu, K.; Shen, C.; Stepashko, A. Post-Rift Anomalous Thermal Flux in the Songliao Basin, NE China, as Revealed from Fission Track Thermochronology and Tectonic Analysis. Palaeogeogr. Palaeoclimatol. Palaeoecol. 2018, 508, 148–165. [Google Scholar] [CrossRef]
  4. Yan, Z.; Zhang, W.; Xia, F.; Yin, S.; Fu, J.; Ning, J.; Zhang, X.-N.; Zang, Y.; Duan, J. Uranium Pre-Concentration in Sandstone-Hosted U Deposits: A Case Study from the Hailijin Ore Field, SW Songliao Basin, NE China. Ore Geol. Rev. 2023, 161, 105661. [Google Scholar] [CrossRef]
  5. Cuney, M.; Mercadier, J.; Bonnetti, C. Classification of Sandstone-Related Uranium Deposits. J. Earth Sci. 2022, 33, 236–256. [Google Scholar] [CrossRef]
  6. Lin, X.; Qin, M.; Jia, L.; Tian, M.; Xing, Z.; Zhang, Y. U-Pb Isochron Age Calculation and Related Issues in Sandstone-Hosted Uranium Deposits: A Case Study from the Hailijin Uranium Deposit, Songliao Basin, China. Ore Geol. Rev. 2026, 192, 107248. [Google Scholar] [CrossRef]
  7. Hu, X.; Rong, H.; Kang, S.; Ning, J.; Tang, G.; Zhang, L.; Ma, S. Genesis of Ankerite and Its Relationship with Uranium Mineralization in the Hailijin Uranium Deposit, Southern Songliao Basin, China. Ore Geol. Rev. 2026, 189, 107130. [Google Scholar] [CrossRef]
  8. Wang, J.; Niu, Q.; Wang, W.; Liu, Y.; Lu, T.; Pan, J.; Wang, Z.; Yuan, W.; Huang, Y.; Yuan, X.; et al. Fracture Propagation Mechanism and CO2+O2 In-Situ Leaching Effect of Low-Permeability Sandstone-Type Uranium Deposits under Millisecond Blasting. Nucl. Eng. Technol. 2026, 58, 104461. [Google Scholar] [CrossRef]
  9. Niu, Q.; Wang, J.; He, J.; Chang, J.; Shi, X.; Wang, W.; Yuan, W.; Wang, Q.; Liang, X.; Zheng, Y.; et al. Inversion and Optimization of CO2+O2 in Situ Leaching of Blasting-Stimulated Sandstone-Type Uranium Deposits. Phys. Fluids 2025, 37, 036639. [Google Scholar] [CrossRef]
  10. Wang, W.; Liang, X.; Niu, Q.; Wang, Q.; Zhuo, J.; Su, X.; Zhou, G.; Zhao, L.; Yuan, W.; Chang, J.; et al. Reformability Evaluation of Blasting-Enhanced Permeability in in Situ Leaching Mining of Low-Permeability Sandstone-Type Uranium Deposits. Nucl. Eng. Technol. 2023, 55, 2773–2784. [Google Scholar] [CrossRef]
  11. Cumberland, S.A.; Douglas, G.; Grice, K.; Moreau, J.W. Uranium Mobility in Organic Matter-Rich Sediments: A Review of Geological and Geochemical Processes. Earth-Sci. Rev. 2016, 159, 160–185. [Google Scholar] [CrossRef]
  12. Zorin, Y.A. Geodynamics of the Western Part of the Mongolia–Okhotsk Collisional Belt, Trans-Baikal Region (Russia) and Mongolia. Tectonophysics 1999, 306, 33–56. [Google Scholar] [CrossRef]
  13. Wang, F.; Zhou, X.-H.; Zhang, L.-C.; Ying, J.-F.; Zhang, Y.-T.; Wu, F.-Y.; Zhu, R.-X. Late Mesozoic Volcanism in the Great Xing’an Range (NE China): Timing and Implications for the Dynamic Setting of NE Asia. Earth Planet. Sci. Lett. 2006, 251, 179–198. [Google Scholar] [CrossRef]
  14. Wang, P.; Mattern, F.; Didenko, N.; Zhu, D.; Singer, B.; Sun, X. Tectonics and Cycle System of the Cretaceous Songliao Basin: An Inverted Active Continental Margin Basin. Earth-Sci. Rev. 2016, 159, 82–102. [Google Scholar] [CrossRef]
  15. Zhang, P.; Li, Z.; He, D.; Zhang, X.; Liu, J.; Fang, H. The Deep Structure of the Western Slope of the Songliao Basin and Its Implications for the Evolution of the Paleo-Asian Ocean (Eastern Segment). Appl. Sci. 2026, 16, 3202. [Google Scholar] [CrossRef]
  16. Zhao, Y.; Hou, H.; An, D.; Fu, W.; Zhang, J.; Gao, Y.; Ma, F. Sequence Stratigraphic, Resource Potential, and Global Cretaceous Event Linkage of the Shahezi Formation in the Xujiaweizi Fault Depression: New Insights from Well SK2. Geosciences 2026, 16, 123. [Google Scholar] [CrossRef]
  17. Bodnar, R.J. Revised equation and table for determining the freezing point depression of H2O–NaCl solutions. Geochim. Cosmochim. Acta 1993, 57, 683–684. [Google Scholar] [CrossRef]
  18. Wei, H.; Liu, J.; Meng, Q. Structural and Sedimentary Evolution of the Southern Songliao Basin, Northeast China, and Implications for Hydrocarbon Prospectivity. AAPG Bull. 2010, 94, 533–566. [Google Scholar] [CrossRef]
  19. Gregory, D.D.; Large, R.R.; Halpin, J.A.; Baturina, E.L.; Lyons, T.W.; Wu, S.; Danyushevsky, L.; Sack, P.J.; Chappaz, A.; Maslennikov, V.V.; et al. Trace Element Content of Sedimentary Pyrite in Black Shales. Econ. Geol. 2015, 110, 1389–1410. [Google Scholar] [CrossRef]
  20. Seal, R.R. Sulfur Isotope Geochemistry of Sulfide Minerals. Rev. Mineral. Geochem. 2006, 61, 633–677. [Google Scholar] [CrossRef]
  21. Steadman, J.A.; Large, R.R.; Olin, P.H.; Danyushevsky, L.V.; Meffre, S.; Huston, D.; Fabris, A.; Lisitsin, V.; Wells, T. Pyrite Trace Element Behavior in Magmatic-Hydrothermal Environments: An LA-ICPMS Imaging Study. Ore Geol. Rev. 2021, 128, 103878. [Google Scholar] [CrossRef]
  22. Abudukeyumu, A.; Song, H.; Chi, G.; Li, Q.; Zhang, C. Quaternary Uranium Mineralization in the Qaidam Basin, Northern Tibetan Plateau: Insights from Petrographic and C-O Isotopic Evidences. Ore Geol. Rev. 2022, 140, 104628. [Google Scholar] [CrossRef]
  23. Ingles, C.; Mavrogenes, J.; Wang, Y.; Cherdantseva, M.; Saxey, D.; Fougerouse, D. Biogenic Sphalerite Signatures and pH-Dependent Precipitation Pathways. Appl. Geochem. 2026, 197, 106677. [Google Scholar] [CrossRef]
  24. Cai, C.; Li, H.; Li, K.; Wang, D. Thermochemical Sulfate Reduction in Sedimentary Basins and beyond: A Review. Chem. Geol. 2022, 607, 121018. [Google Scholar] [CrossRef]
  25. Yue, L.; Jiao, Y.; Fayek, M.; Wu, L.; Rong, H. Micromorphologies and Sulfur Isotopic Compositions of Pyrite in Sandstone-Hosted Uranium Deposits: A Review and Implications for Ore Genesis. Ore Geol. Rev. 2021, 139, 104512. [Google Scholar] [CrossRef]
  26. Habicht, K.S.; Canfield, D.E.; Rethmeier, J. Sulfur Isotope Fractionation during Bacterial Reduction and Disproportionation of Thiosulfate and Sulfite. Geochim. ET Cosmochim. Acta 1998, 62, 2585–2595. [Google Scholar] [CrossRef]
  27. Canfield, D.E.; Thamdrup, B. Fate of Elemental Sulfur in an Intertidal Sediment. FEMS Microbiol. Ecol. 1996, 19, 95–103. [Google Scholar] [CrossRef]
  28. Habicht, K.S.; Canfield, D.E. Sulfur Isotope Fractionation during Bacterial Sulfate Reduction in Organic-Rich Sediments. Geochim. ET Cosmochim. Acta 1997, 61, 5351–5361. [Google Scholar] [CrossRef] [PubMed]
  29. Lu, S.; Ning, Y.; Xiao, L.; Huang, K.; Chen, S.; Zhu, X.; He, H.; Yu, M. Elemental Geochemical Analysis for the Gold–Antimony Segregation in the Gutaishan Deposit: Insights from Stibnite and Pyrite. Geosciences 2025, 15, 462. [Google Scholar] [CrossRef]
  30. Machel, H.G. Bacterial and Thermochemical Sulfate Reduction in Diagenetic Settings—Old and New Insights. Sediment. Geol. 2001, 140, 143–175. [Google Scholar] [CrossRef]
  31. Canfield, D.E. Biogeochemistry of Sulfur Isotopes. Rev. Mineral. Geochem. 2001, 43, 607–636. [Google Scholar] [CrossRef]
  32. Wang, P.; Xie, X.; Frank, M.; Ren, Y.; Zhu, D.; Sun, X. The Cretaceous Songliao Basin: Volcanogenic Succession, Sedimentary Sequence and Tectonic Evolution, NE China. Acta Geol. Sin.-Engl. Ed. 2007, 81, 1002–1011. [Google Scholar] [CrossRef]
  33. Zhu, Z.; Cook, N.; Yang, T.; Ciobanu, C.; Zhao, K.; Jiang, S. Mapping of Sulfur Isotopes and Trace Elements in Sulfides by LA-(MC)-ICP-MS: Potential Analytical Problems, Improvements and Implications. Minerals 2016, 6, 110. [Google Scholar] [CrossRef]
  34. Bralia, A.; Sabatini, G.; Troja, F. A Revaluation of the Co/Ni Ratio in Pyrite as Geochemical Tool in Ore Genesis Problems. Mineral. Depos. 1979, 14, 353–374. [Google Scholar] [CrossRef]
  35. Bau, M. Rare-Earth Element Mobility during Hydrothermal and Metamorphic Fluid-Rock Interaction and the Significance of the Oxidation State of Europium. Chem. Geol. 1991, 93, 219–230. [Google Scholar] [CrossRef]
  36. Abraitis, P.K.; Pattrick, R.A.D.; Vaughan, D.J. Variations in the Compositional, Textural and Electrical Properties of Natural Pyrite: A Review. Int. J. Miner. Process. 2004, 74, 41–59. [Google Scholar] [CrossRef]
  37. Li, Z.; Liu, W.; Li, W.; Li, X.; Qin, M.; Cai, Y.; Zhang, Y.; He, S.; Wu, Q.; Qiu, L.; et al. Exudative metallogeny of the Hadatu sandstone-type uranium deposit in the Erlian Basin, Inner Mongolia. Geol. China 2022, 49, 1009–1047. [Google Scholar]
  38. Keith, M.; Häckel, F.; Haase, K.M.; Schwarz-Schampera, U.; Klemd, R. Trace Element Systematics of Pyrite from Submarine Hydrothermal Vents. Ore Geol. Rev. 2016, 72, 728–745. [Google Scholar] [CrossRef]
  39. Yan, D.; Zhu, R.; Liu, W.; Liu, R.; Shou, H.; Cheng, X.; Cai, Y.; Lei, Z.; Deng, P.; Peng, Y. Metallogenic Characteristics and Models of Sandstone-Type Uranium Deposits in China. Ore Geol. Rev. 2024, 166, 105937. [Google Scholar] [CrossRef]
  40. Hanly, A.J.; Kyser, T.K.; Hiatt, E.E.; Marlatt, J.; Foster, S. The Uranium Mineralization Potential of the Paleoproterozoic Sioux Basin and Its Relationship to Other Basins in the Southern Lake Superior Region. Precambrian Res. 2006, 148, 125–144. [Google Scholar] [CrossRef]
  41. Zhang, F.; Jiao, Y.; Wu, L.; Rong, H. Roles of Dispersed Organic Matters in Sandstone-Type Uranium Mineralization: A Review of Geological and Geochemical Processes. Ore Geol. Rev. 2021, 139, 104485. [Google Scholar] [CrossRef]
  42. Cai, C.; Dong, H.; Li, H.; Xiao, X.; Ou, G.; Zhang, C. Mineralogical and Geochemical Evidence for Coupled Bacterial Uranium Mineralization and Hydrocarbon Oxidation in the Shashagetai Deposit, NW China. Chem. Geol. 2007, 236, 167–179. [Google Scholar] [CrossRef]
  43. Bailey, E.H.; Mosselmans, J.F.W.; Schofield, P.F. Uranyl-Citrate Speciation in Acidic Aqueous Solutions—An XAS Study between 25 and 200 °C. Chem. Geol. 2005, 216, 1–16. [Google Scholar] [CrossRef]
  44. Bone, S.E.; Dynes, J.J.; Cliff, J.; Bargar, J.R. Uranium(IV) Adsorption by Natural Organic Matter in Anoxic Sediments. Proc. Natl. Acad. Sci. USA 2017, 114, 711–716. [Google Scholar] [CrossRef] [PubMed]
  45. Fox, A.R.; Bart, S.C.; Meyer, K.; Cummins, C.C. Towards Uranium Catalysts. Nature 2008, 455, 341–349. [Google Scholar] [CrossRef] [PubMed]
  46. Song, H.; Ni, S.; Chi, G.; Zhang, C.; Hou, M.; Liu, H.; Wang, G.; Yan, W. Systematic Variations of H-O-C Isotopes in Different Alteration Zones of Sandstone-Hosted Uranium Deposits in the Southern Margin of the Yili Basin (Xinjiang, China): A Review and Implications for the Ore-Forming Mechanisms. Ore Geol. Rev. 2019, 107, 615–628. [Google Scholar] [CrossRef]
  47. Yin, S.; Yan, Z.; Fu, J.; Zhang, W.; Liu, H.; Xia, F.; Wang, Q. Polymorphic Transformations of Titanium Oxides Contribute to Economic Uranium Mineralization in Sandstone. Geology 2024, 52, 481–485. [Google Scholar] [CrossRef]
Figure 1. Regional tectonic setting of the Songliao Basin (modified after [12]). 1—basin; 2—Mongol–Okhotsk magmatic belt; 3—East Sikhote-Alin volcanic belt; 4—Sikhote-Alin belt; 5—Mongol-Okhotsk belt; 6—national boundary; 7—provincial boundary; 8—fault: F1—Tayuan-Xiguitu fault belt, F2—Nenjiang fault belt, F3—Mudanjiang fault belt, F4—Jiamusi-Yitong fault belt, F5—Dunhua-Mishan fault belt, F6—Lower Heilongjiang fault belt, F7—Xar Moron River fault belt, F8—Hegenshan fault belt; 9—tectonic units: I—Heilongjiang Plate, I1—Erguna-Hinggan block, I2—Ondor Sum-Hegenshan continental margin accretionary belt, I3—Songliao-Zhangguangcailing micro-plate, I4—Jiamusi micro-plate, I5—Nadanhada continental margin accretionary belt, II—North China Plate; 10—water system.
Geosciences 16 00301 g001
Figure 2. Geological map of the Qianjiadian ore-field area and the stratigraphic column of the study area (modified after [1]). (a) Tectonic location of the Qianjiadian U ore field; (b) geological map of the Qianjiadian U ore field; (c) stratigraphic column of the Qianjiadian U ore field.
Geosciences 16 00301 g002
Figure 3. Cross-section showing the morphology of ore bodies along a north–south-oriented drill-hole profile at the Hailijin uranium deposit (modified after [1]).
Geosciences 16 00301 g003
Figure 4. Lithologic column (a), lithologic column of ore-bearing beds (b) and photos of typical cores (cf) in the Hailijin uranium deposit. 1—granite; 2—conglomerate; 3—sandy conglomerate; 4—muddy conglomerate; 5—coarse sandstone; 6—medium sandstone; 7—fine sandstone; 8—argillaceous fine sandstone; 9—siltstone; 10—argillaceous siltstone; 11—mudstone; 12—red; 13—brownish red; 14—orange red; 15—purplish red; 16—brownish yellow; 17—yellow; 18—yellowish brown; 19—light yellow; 20—light green; 21—gray; 22—grayish white; 23—spontaneous potential; 24—resistivity; 25—quantitative γ; 26—unconformity surface.
Geosciences 16 00301 g004
Figure 5. Drill-core photographs of the brownish-red sandstones and microscopic characteristics of alteration minerals from the Hailijin uranium deposit.
Geosciences 16 00301 g005
Figure 6. Microscopic features of U-minerals in the Hailijin U-deposit. (a) Disseminated U-minerals occurring on the surface of detrital quartz grains; (b) U- minerals occurring within dissolution pores of detrital feldspar and quartz; (c) U-minerals occurring on the surfaces of clay minerals; (d) U-minerals occurring within fluidic organic matter (OM). Qz = quartz; Cof = coffinite; Org = organic matter; Py = pyrite; BSE = backscattered electron image; BSE images a to d are captured by scanning electron microscope (SEM).
Geosciences 16 00301 g006
Figure 7. Raman spectrum and infrared spectrum of organic matter (OM) associated with U mineralization in the Hailijin uranium deposit. (a) Optical image showing pyrite- and coffinite-bearing organic matter; (b) UV fluorescence image showing oil-bearing organic matter and pyrite; (c) Raman spectrum of organic matter; (d) Infrared spectrum of organic matter. The green plus signs indicate the analytical positions for Raman and infrared spectroscopy. Py = pyrite.
Geosciences 16 00301 g007
Figure 8. Trace element spider diagram for the U-hosted sandstones in the Hailijin U- deposit. UCC = mean abundance of the upper continental crust.
Geosciences 16 00301 g008
Figure 9. REE distribution patterns of the mineralized and non-mineralized sandstones in the Hailijin U deposit.
Geosciences 16 00301 g009
Figure 10. Elemental correlation diagrams for syn-ore pyrite from the Hailijin U deposit. UCC = average abundance of the upper continental crust. (a) Th to U correlation diagram; (b) Ba to U correlation diagram; (c) Y to U correlation diagram; (d) As to U correlation diagram; (e) Zn to U correlation diagram; (f) Cu to U correlation diagram; The dotted lines represent linear regression trends, UCC = upper continental crust.
Geosciences 16 00301 g010
Figure 11. Micropetrographic characteristics of fluid inclusions in the Hailijin uranium deposit. (ac)—Oil-gas fluid inclusion, liquid-rich fluid inclusion and pyrite-rich fluid inclusion in gray sandstone ores distributed in a banded form along the quartz surface fractures. (d)—Pyrite-rich fluid inclusion and liquid-rich fluid inclusion occur on the surface of the ankerite cement during the mineralization period, these fluid inclusions were captured during the uranium mineralization period and can indicate mineralization information. Photograph (a) was taken under the UV fluorescence, photograph (bd) were taken under plane-polarized light. Py = pyrite, Qz = quartz, Fis = fluid inclusions, L-rich FI = Liquid rich fluid inclusion.
Geosciences 16 00301 g011
Figure 12. Compositional relationship diagrams of fluid inclusion gases in quartz separates from the ore-bearing sandstones of the Hailijin uranium deposit.
Geosciences 16 00301 g012
Figure 13. Homogenization temperature distribution histogram (A) and temperature to salinity scatter diagram of fluid inclusions in the Hailijin uranium deposit (B).
Geosciences 16 00301 g013
Figure 14. Schematic model for the evolution of ore-forming fluids in the Hailijin uranium deposit. MOM—Macromolecular organic matter; LOG: Light oil and gas; U-PM—Uranium-polymetallic ore-forming materials; LOI: Light oil inclusions; OM + Py + Ccp—Association of organic matter, pyrite, and chalcopyrite; Cof—Coffinite.
Geosciences 16 00301 g014
Figure 15. Schematic conceptual model illustrating the deep-sourced fluid-controlled mineralization processes of the Hailijin U deposit.
Geosciences 16 00301 g015
Table 1. Detailed information of the samples from Hailijin U deposit of this study.
Sample IDLithologyDepth/mSample IDLithologyDepth/m
L0-2-1Gy M-gd ST565L16-1-6 *Gy M-gd ST558.0
L0-2-5Gy F-gd ST572L16-1-7 *Gy M-gd ST559.6
L0-2-25 *Gy M-gd ST597L16-1-8 *Gy F-gd ST562.5
L0-5-3Rd M-gd ST590.5L16-1-9Gy-Wt M-gd ST566.8
L0-5-4Gy F-gd ST589.5L12-6-10Gy-Wt M-gd ST572.3
L0-5-7 *Gy M-gd ST587.5L12-6-11Gy-Wt C-gd ST576.6
L0-5-8 *Gy M-gd ST586.5L14-3-26Rd F-gd ST547.13
L0-5-9 *Gy M-gd ST585.3L14-3-28Gy F-gd ST564.1
L0-5-10Gy M-gd ST580.3L14-3-29Gy F-gd ST565.1
L1-1 *D-Gy M-gd ST572L14-3-34 *Gy F-gd ST570.1
L1-2 *Gy M-gd ST573L14-3-35 *Gy F-gd ST575.0
L1-4 *Gy M-gd ST578.6L14-3-36 *Gy F-gd ST575.5
L1-7Gy-Wt M-gd ST579.66L4-5-9Rd F-gd ST595.5
L1-8Gy-Wt M-gd ST580.6L4-5-12Rd F-gd ST557.3
L1-17 *D-Gy M-gd ST584.3L2-1 *Gy M-gd ST578
L16-1-1Rd F-gd ST541.3L2-2 *Gy M-gd ST587
L16-1-2Rd F-gd ST548.7L2-3 *Gy M-gd ST589
L16-1-3Rd F-gd ST552.0L2-9 *Gy C-gd ST590.2
ZKL-13 *Gy M-gd ST580.3L3-1 *D-Gy M-gd ST601.35
ZKL-17 *Gy M-gd ST584.3L3-2 *D-Gy M-gd ST602.78
Note: Samples marked with an asterisk (*) are mineralized sandstones; the remainder are unmineralized. Rd = Reddish; Gy = Greyish; Gy-Wt = Greyish white; D-Gy = dark grayish; C-gd = coarse-grained; M-gd = medium-grained; F-gd = fine-grained; ST = sandstone.
Table 2. Major elements of U-hosted sandstone of Hailijin U deposit (Unit of %).
Sample.IDLithologySiO2TiO2Al2O3Fe2O3FeOMnO2MgOCaONa2OK2OP2O5LOIFe3+/Fe2+
L16-1-1Rd F-gd ST76.130.4512.141.22 0.480.020.4060.520.5173.490.0944.582.29
L16-1-2Rd F-gd ST72.330.53611.982.82 0.50.0410.7451.220.4793.310.16.25.08
L16-1-3Rd F-gd ST75.60.39911.091.23 0.710.0320.6121.320.3973.380.0745.261.56
L16-1-6 *Gy M-gd ST76.240.36511.210.40 0.850.0170.5081.070.3043.40.0765.530.42
L16-1-7 *Gy M-gd ST78.370.3110.170.38 0.890.0230.4911.050.2693.270.0794.720.38
L16-1-9Gy-Wt M-gd ST76.20.2129.40.58 1.290.1810.9392.170.2973.340.0645.390.40
L16-1-10Gy-Wt M-gd ST76.350.33110.720.40 1.060.0220.7671.580.2883.40.0594.930.34
L16-1-11Gy-Wt C-gd ST75.790.3129.810.48 1.050.0280.9392.070.2793.120.0686.080.41
L14-3-26Rd F-gd ST74.690.5612.92.42 0.450.0270.4260.5190.4913.470.1114.094.85
L14-3-28Gy F-gd ST71.860.54811.871.70 2.90.220.8370.8590.3123.080.0995.850.53
L14-3-29Gy F-gd ST70.050.63513.511.41 0.930.0681.081.920.5313.220.1336.611.37
L14-3-34Gy F-gd ST78.40.32510.090.31 0.690.0920.6021.440.2513.230.0924.410.41
L14-3-35 *Gy F-gd ST74.220.2519.970.48 1.480.0311.122.390.2523.240.0566.280.29
L14-3-36 *Gy F-gd ST77.390.3199.580.39 1.060.0250.8871.890.32.930.0665.130.33
ZKL-17 *Gy M-gd ST80.750.2529.450.17 0.510.0120.2590.4380.3283.530.0732.80.30
ZKL-13 *Gy M-gd ST80.640.2419.190.50 0.730.0160.4740.9850.2833.170.0713.580.62
L2-1 *Gy M-gd ST79.50.2258.270.78 1.590.0320.6991.290.2752.840.0884.360.44
L2-2 *Gy M-gd ST79.950.2468.560.86 1.850.0360.6120.7070.2722.760.0974.10.42
L0-2-1Gy M-gd ST790.4411.90.17 0.60.0190.2580.3070.3093.550.0813.230.25
L0-2-5Gy F-gd ST78.60.29911.10.12 0.860.0180.440.9510.3743.510.0753.640.12
L0-2-25 *Gy M-gd ST81.50.2429.390.12 0.530.0120.3850.8760.2883.30.113.070.20
Note: LOI = loss on ignition, * indicates U-mineralized sandstone samples.
Table 3. Microthermometric results of fluid inclusions from the Hailijin uranium deposit.
SampleLithologySpotHost MineralFI TypeSize (μm)Th
(°C)
Tm-ice
(°C)
Salinity
(wt.% NaCl eq.)
ZKL-13dark gray medium- to coarse-grained sandstone (ore)1Dolomite cementAqueous inclusion6 × 3136−2.84.65
2Dolomite cementAqueous inclusion3 × 4153−2.84.65
3Dolomite cementAqueous inclusion3 × 5135−4.87.59
4Detrital quartzAqueous inclusion7 × 12129−34.96
ZKL0-5Gray medium-to coarse-grained sandstone (ore)1Detrital quartzAqueous inclusion3 × 6130−3.25.26
2Detrital quartzAqueous inclusion4 × 6121
3Detrital quartzAqueous inclusion7 × 5127−4.36.88
4Detrital quartzAqueous inclusion4 × 6135−3.55.71
5Detrital quartzAqueous inclusion4 × 3127−2.54.18
ZKL2-2Gray medium-grained sandstone (ore)1Detrital quartzAqueous inclusion7 × 10137−4.16.59
ZKL3-2Gray medium-grained sandstone (ore)1Detrital quartzAqueous inclusion4 × 6127.3−2.84.65
2Detrital quartzAqueous inclusion4 × 994−1.93.23
3Detrital quartzAqueous inclusion4 × 594−1.93.23
4Detrital quartzAqueous inclusion4 × 598−34.96
5Detrital quartzAqueous inclusion3 × 698−2.13.55
6Detrital quartzAqueous inclusion4 × 6129−3.96.3
7Detrital quartzAqueous inclusion9 × 6112−3.16.45
8Detrital quartzAqueous inclusion7 × 5152
9Detrital quartzAqueous inclusion4 × 5135−3.65.86
ZKL2-1Gray medium-grained sandstone (ore)1Detrital quartzAqueous inclusion4 × 6143−36.45
2Detrital quartzAqueous inclusion8 × 595−2.64.34
3Detrital quartzAqueous inclusion8 × 5168−3.96.3
ZKL1-7Gray-white medium- grained sandstone(non-mineralized)1Dolomite cementAqueous inclusion8 × 1390−1.52.57
2Dolomite cementAqueous inclusion8 × 583−1.93.23
3Dolomite cementAqueous inclusion9 × 569
4Dolomite cementAqueous inclusion10 × 1575
5Dolomite cementAqueous inclusion20 × 2577−2.03.39
6Dolomite cementAqueous inclusion12 × 1872−1.72.9
7Dolomite cementAqueous inclusion10 × 878−1.72.9
8Dolomite cementAqueous inclusion12 × 1570
9Dolomite cementAqueous inclusion17 × 1580−5.48.41
10Dolomite cementAqueous inclusion8 × 573−1.11.91
11Dolomite cementAqueous inclusion3 × 573−11.74
ZKL2-9Gray medium-to coarse-grained sandstone (ore)1Dolomite cementAqueous inclusion8 × 13188−0.50.88
2Dolomite cementAqueous inclusion9 × 5199−1.62.74
3Dolomite cementAqueous inclusion7 × 5189−1.01.74
4Dolomite cementAqueous inclusion3 × 5185−1.01.74
5Dolomite cementAqueous inclusion3 × 5115−5.18
6Dolomite cementAqueous inclusion3 × 3124−5.18
7Dolomite cementAqueous inclusion8 × 12195−3.65.86
8Dolomite cementAqueous inclusion3 × 4194−3.65.86
9Dolomite cementAqueous inclusion11 × 8183−2.33.87
10Dolomite cementAqueous inclusion3 × 6163−1.52.57
11Dolomite cementAqueous inclusion3 × 4173−2.74.49
12Dolomite cementAqueous inclusion4 × 595−7.210.73
13Dolomite cementAqueous inclusion8 × 13102−7.210.73
14Dolomite cementAqueous inclusion15 × 12218−0.50.88
Notes: FI—fluid inclusion; Th—total homogenization temperature; Tm-ice—final ice melting temperature; wt.% NaCl eq.—weight percent NaCl equivalent; ore—ore-bearing sandstone.
Table 4. In situ sulfur isotope compositions of pyrite from the Hailijin U deposit.
StratigraphySpot IDδ34SV-CDT (‰)Spot IDδ34SV-CDT (‰)
Upper Cretaceous Yaojia FormationL12-6-4-1−44.6 L0-2-25-4−43.3
L12-6-4-2−49.1 L0-2-25-5−44.5
L12-6-4-3−49.2 L0-2-25-6−44.1
L12-6-3-1−46.6 L0-5-1−36.4
L12-6-3-2−48.3 L0-5-2−45.7
L0-2-25-1−26.5 L0-5-3−45.2
L0-2-25-2−36.5 L0-5-4−47.3
L0-2-25-3−23.1 L0-5-5−40.7
Disclaimer/Publisher’s Note: The statements, opinions and data contained in all publications are solely those of the individual author(s) and contributor(s) and not of MDPI and/or the editor(s). MDPI and/or the editor(s) disclaim responsibility for any injury to people or property resulting from any ideas, methods, instructions or products referred to in the content.