Article

ESR Dating of Silica Sinter and Travertine in Southern Tibet: Implications for Paleoclimate-Related Deposition


1
Institute of Geomechanics, Chinese Academy of Geological Sciences, Beijing 100081, China
2
Key Laboratory of Neotectonic Movement and Geohazard, Ministry of Natural Resources, Beijing 100081, China
3
Research Center of Neotectonism and Crustal Stability, China Geological Survey, Beijing 100081, China
4
Zhuji Middle School, Shaoxing 311800, China
5
School of Engineering and Technology, China University of Geosciences, Beijing 100083, China
*
Author to whom correspondence should be addressed.
Geosciences 2026, 16(7), 292; https://doi.org/10.3390/geosciences16070292
Submission received: 12 May 2026 / Revised: 13 July 2026 / Accepted: 14 July 2026 / Published: 16 July 2026

Abstract

In southern Tibet, tectonic extension has created north–south rift systems that host hydrothermal zones with episodic silica sinter and travertine deposition. Earlier researchers usually attributed these deposits to hydrothermal activity driven by regional tectonics. However, the timing of deposition and its possible climatic controls remain poorly constrained. In this study, we dated six samples from the Targejia geothermal field and the Xiakangjian hot spring area using electron spin resonance (ESR), and evaluated ESR signal stability, dose response, and irradiation effects to assess age reliability. The new ages range from 209 to 49 kyr. When combined with 108 published ages, they indicate repeated sinter and travertine formation over the past 720 kyr. The dated deposits are concentrated in several intervals, especially during the last 100 kyr, and some age clusters occur near warm and humid stages. These patterns suggest that tectonics controlled where hydrothermal systems developed, whereas climate-related changes in recharge, meltwater supply, permafrost thaw, and water–rock interaction may have affected when deposition was more active. Because the compiled ages come from different methods and have uneven uncertainties, this climate link remains provisional and needs testing with additional samples dated by consistent protocols.

1. Introduction

Silica sinter is a siliceous deposit precipitated from hot water in high-temperature hot springs and geysers [1,2,3]. Travertine is a type of calcium carbonate deposit formed from warm to hot spring waters saturated with calcium bicarbonate (Ca(HCO3)2), distinct from calcareous tufa which forms under ambient-temperature conditions [1,2,3,4,5]. Such deposits commonly form where groundwater emerges at the surface in hydrothermal areas, which are distributed in geothermal fields associated with faults in extensional tectonic regimes [6,7]. Influenced by variations in hydrothermal temperature, atmospheric pressure, and ambient humidity, the formation rate, thickness, and scale of silica sinter and travertine deposits vary over different periods. Consequently, sinters (encompassing both silica sinter and travertine) have been recognized as reliable archives of environmental, geochemical, tectonic, and biological changes in the geological record [8,9,10,11,12,13,14].
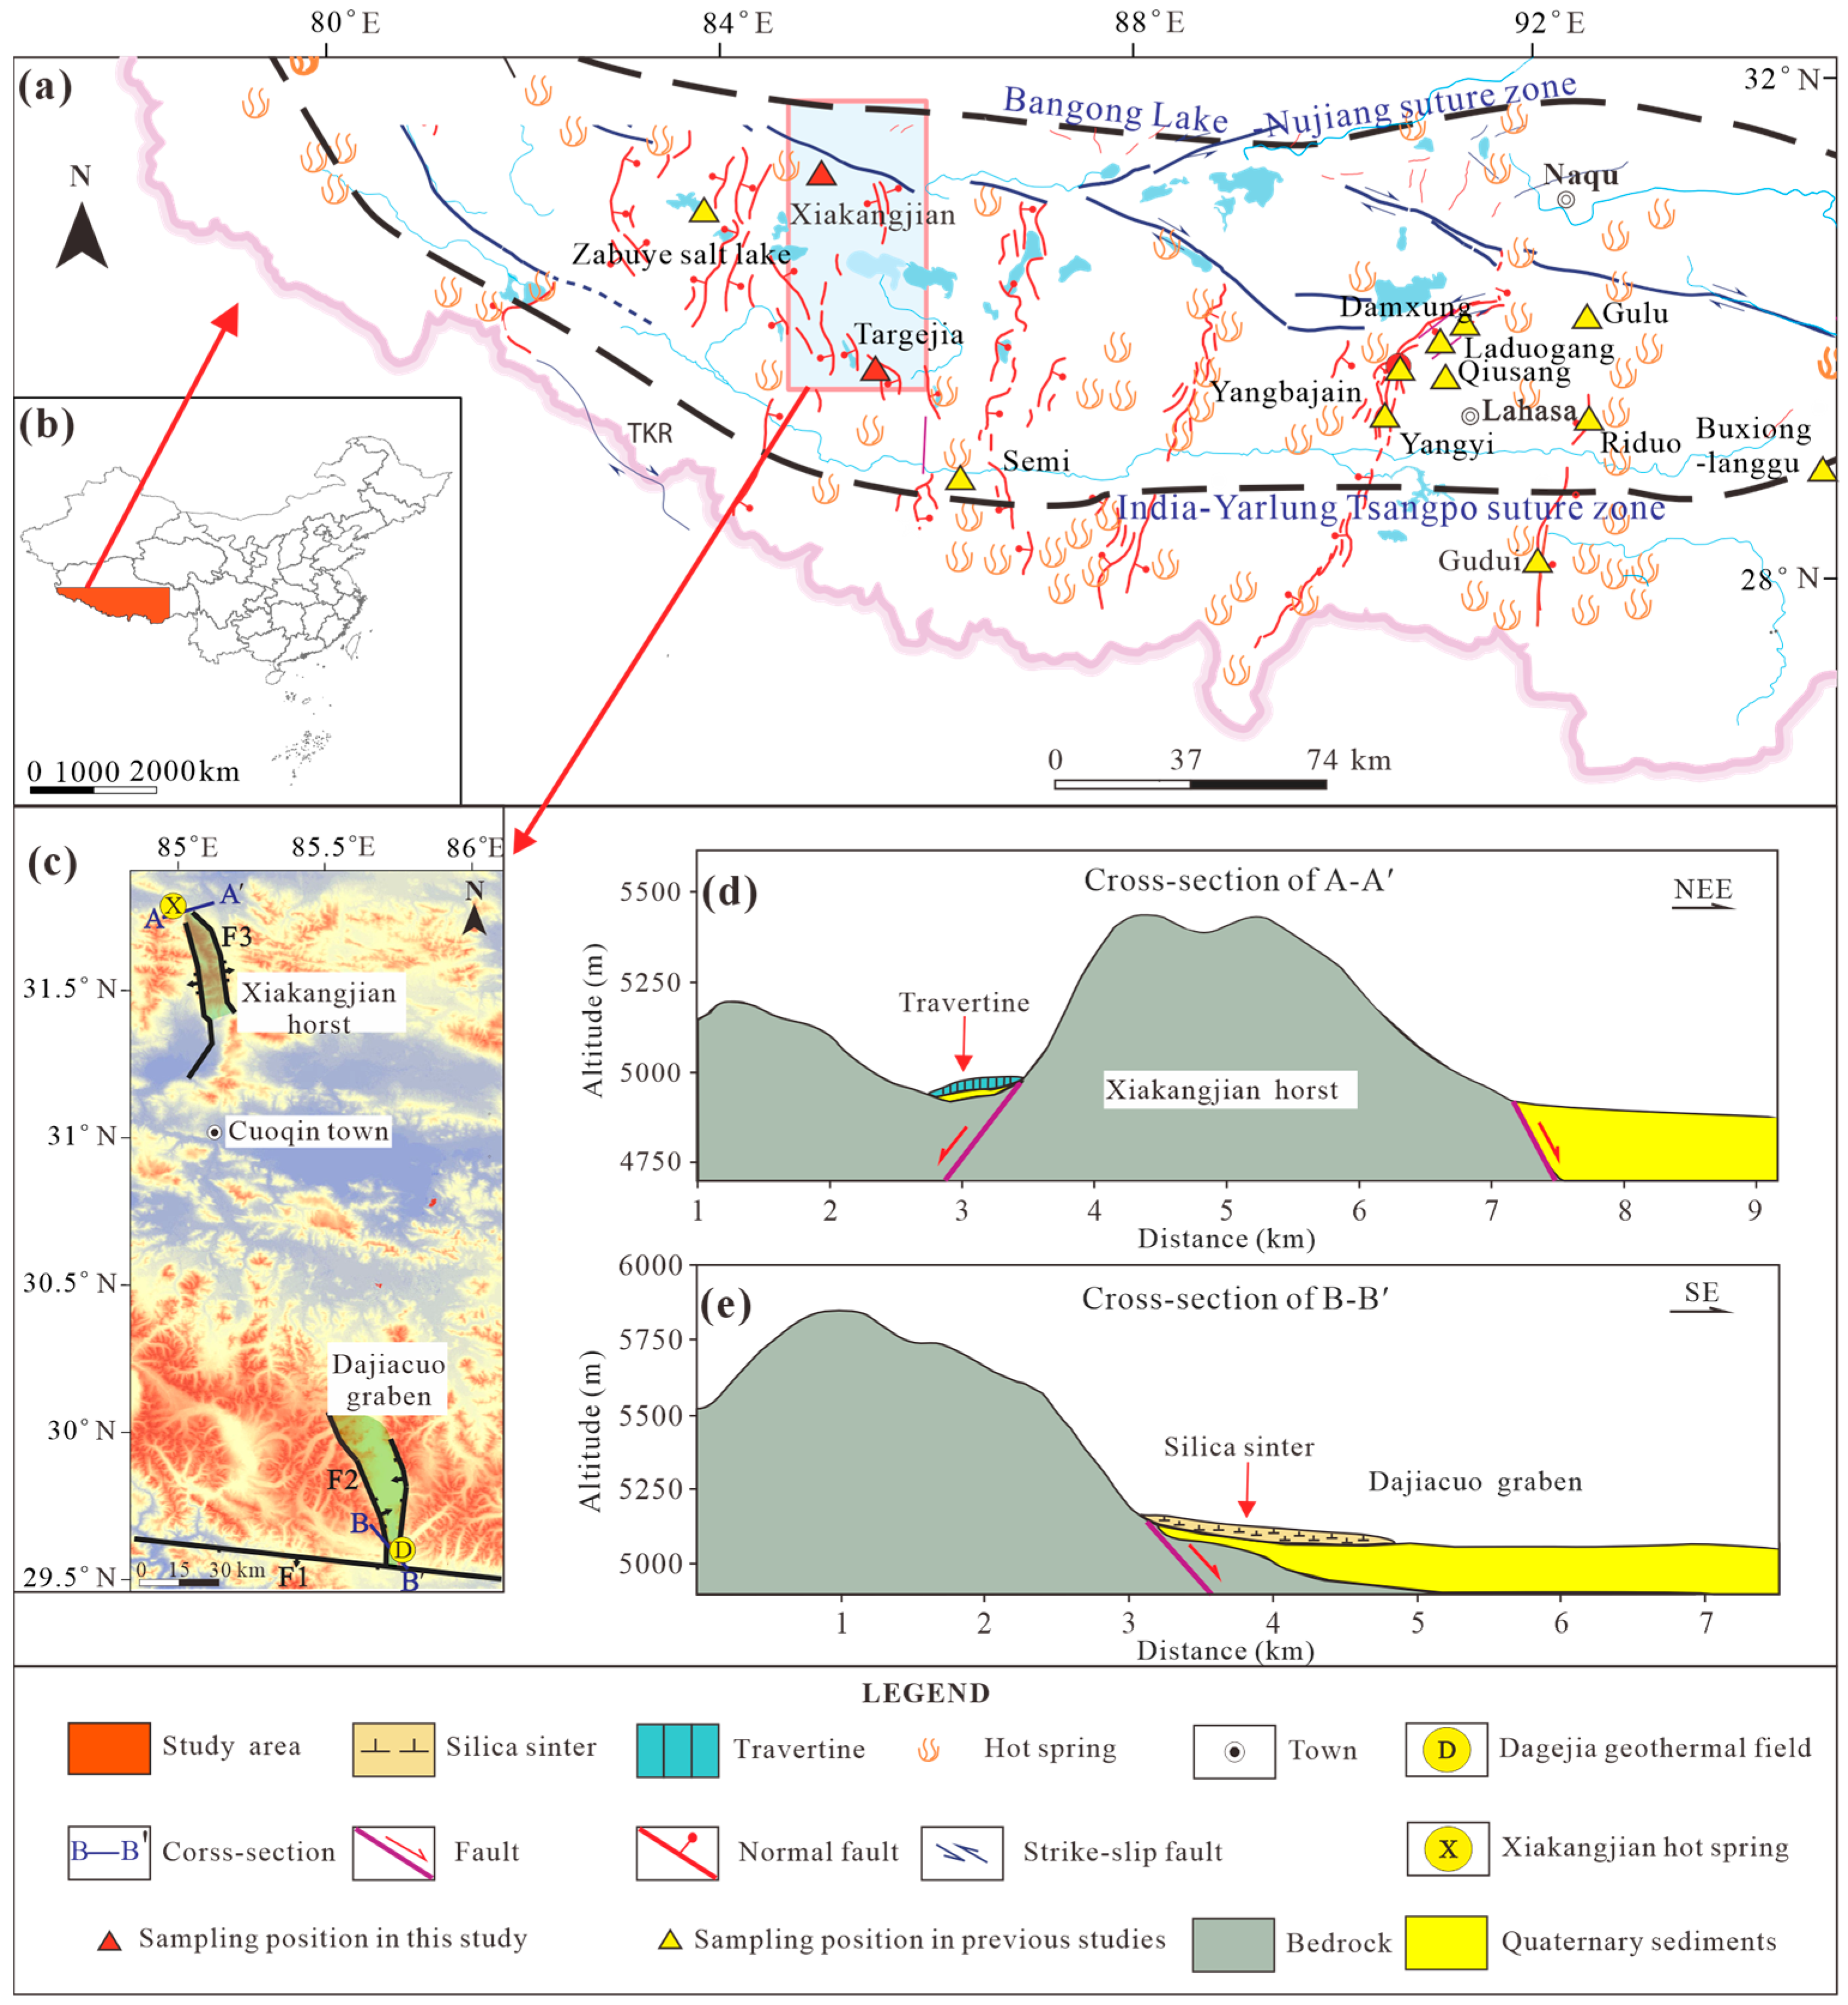
The Tibetan Plateau is located in the collision orogenic belt between the Indian and Eurasian plates. It is characterized by the most elevated and extensive high topography on Earth, intense tectonism related to the India–Eurasia collision, and a large number of geothermal fields [15,16,17]. These geothermal fields host a variety of thermal manifestations, including hydrothermal explosion craters, geysers, thermal springs, mud pots, and fumaroles [18,19,20]. They are spatially controlled by a series of NS-trending normal faults and associated grabens in the plateau’s hinterland, which define the typical horst-and-graben structure of the region. Silica sinter, travertine, and other mineral precipitates occur at hydrothermal spring sites within these zones [21,22]. Over the past decades, many aspects of sinters on the Tibetan Plateau have been studied, including tectonic mechanisms [6], chronologies of hydrothermal activity [6,19,23,24], and hydrothermal mineralization features [25,26]. In southern Tibet, geysers primarily develop near plutonic intrusions and are commonly situated on one side of a valley (Figure 1). The development of geysers reflects not only structural control by faults but also a shallow subsurface water supply system [18], which may have been influenced in the past by precipitation, snowmelt, lake-level changes, and permafrost thaw. Relating the deposition of silica sinter and travertine sequences to paleoclimate change remains a fundamental unresolved question.
A major challenge in extracting paleoclimatic information from silica sinter and travertine is obtaining their absolute ages. Previous studies have applied various dating methods, including 14C dating [27,28], uranium-series dating [28,29,30,31], electron spin resonance (ESR) dating [32,33,34,35,36], and other techniques [28,37,38,39,40]. 14C and uranium-series are the two most commonly used methods for sinter dating, yet both suffer from notable limitations. 14C dating is restricted to ages younger than ~50 kyr, and it is readily affected by microbial fixation of dissolved inorganic carbon, which can produce apparently older ages [28]. Uranium-series dating can be applied to travertines as old as ~600 kyr [39], but low uranium concentrations and low U/Th ratios often lead to large uncertainties for some sinters [28,29]. Compared with these two methods, ESR dating offers the advantages of a wide range of suitable materials and a longer dating range (up to ~2.58 Ma) [41,42,43]. Accordingly, ESR dating has been widely used to date sinters in southern Tibet, including those from the Dangxiong, Yangyi, Yangbajain, and other large-scale geothermal fields [19,23,24,44,45,46].
However, the ESR dating method also faces several technical difficulties and challenges. First, silica sinter is composed of various minerals, and its ESR spectrum consists of a mixture of multiple complex signals. Selecting a reliable ESR dating signal with good dosimetric properties (signal intensity expressed in arbitrary units, a.u.) is therefore vital for accurate dating [32,41,47,48,49,50,51]. Second, the laboratory irradiation dose rate can directly affect the dose–response curve of the ESR signal and may even cause signal saturation, thereby influencing the estimation of the equivalent dose, especially in younger samples [52,53]. In addition, the thermal stabilities of various ESR dating centers in silica sinters and travertines differ. Annealing experiments on thirteen geyserite samples demonstrated that the ESR signal at g = 2.0106 was completely annealed after heating at 210 °C for 30 min and could not be regenerated via γ-irradiation [45]. The thermal behavior of the E′-type signal fundamentally depends on the sample’s mineral assemblage, with the low-temperature contribution dominated by amorphous opal and the high-temperature contribution by crystalline quartz and feldspar in polymineralic geyserite [45]. In a thermal behavior investigation of travertine, the signal at g = 2.0040 declines to undetectable levels at 350 °C, showing higher thermal stability compared with the g = 2.0000 signal that fades beyond detection at 210 °C [54]. Annealing at 143 °C can effectively remove unstable interfering signals in some samples, whereas high-temperature annealing at 260 °C introduces new interfering signals. Further research has focused on the thermal stability of the ESR signal at g = 2.0006 in carbonates [54,55,56]. The complex mineral composition of sinter and the geothermal environments in which it forms make thermal stability studies particularly challenging. Finally, it remains unclear whether travertine behaves as an open system for U-series elements. One view holds that travertine hardens soon after formation and that uranium (U) is unlikely to be removed after deposition in hot-spring environments, resulting in a closed system. However, during initial formation, detrital contamination can introduce 232Th [25,28]. Another perspective suggests that weathering processes such as carbonate dissolution and reprecipitation can open the U-series system, introducing aluminosilicates, limestone particles, and organic matter, all of which increase the total amount of U-series nuclides [31]. Assessing whether the U-series system remains closed is therefore essential for accurate dose rate calculation in travertine ESR dating.
In this study, we performed ESR dating of silica sinter and travertine from the rift valley in southern Tibet. Our objectives are to (1) evaluate the reliability of ESR dating for sinter deposits; (2) establish a new ESR chronology for sinter deposits in southern Tibet; and (3) explore the relationship between paleoclimate change and sinter formation.

2. Geological Setting

The Tibetan Plateau has experienced intense tectonic deformation since the Paleozoic, resulting in an assemblage of accreted terranes separated by suture zones [17,57]. The study area lies within the Gangdise–Lhasa block, which is bounded by the Bangong–Nujiang suture zone to the north and the Indus–Yarlung Zangbo suture zone to the south (Figure 1a,b). This block hosts numerous hydrothermal fields. The Xiakangjian hot spring area (85.01° E, 30.77° N) and the Targejia geothermal field (85.75° E, 29.61° N) are situated in the central and western parts of the block, respectively (Figure 1a,c). The locations of the Xiakangjian horst and the Targejia graben are shown in Figure 1c; their cross-sections are presented in Figure 1d and 1e, respectively. Silica sinter and travertine in both areas are deposited adjacent to normal faults.
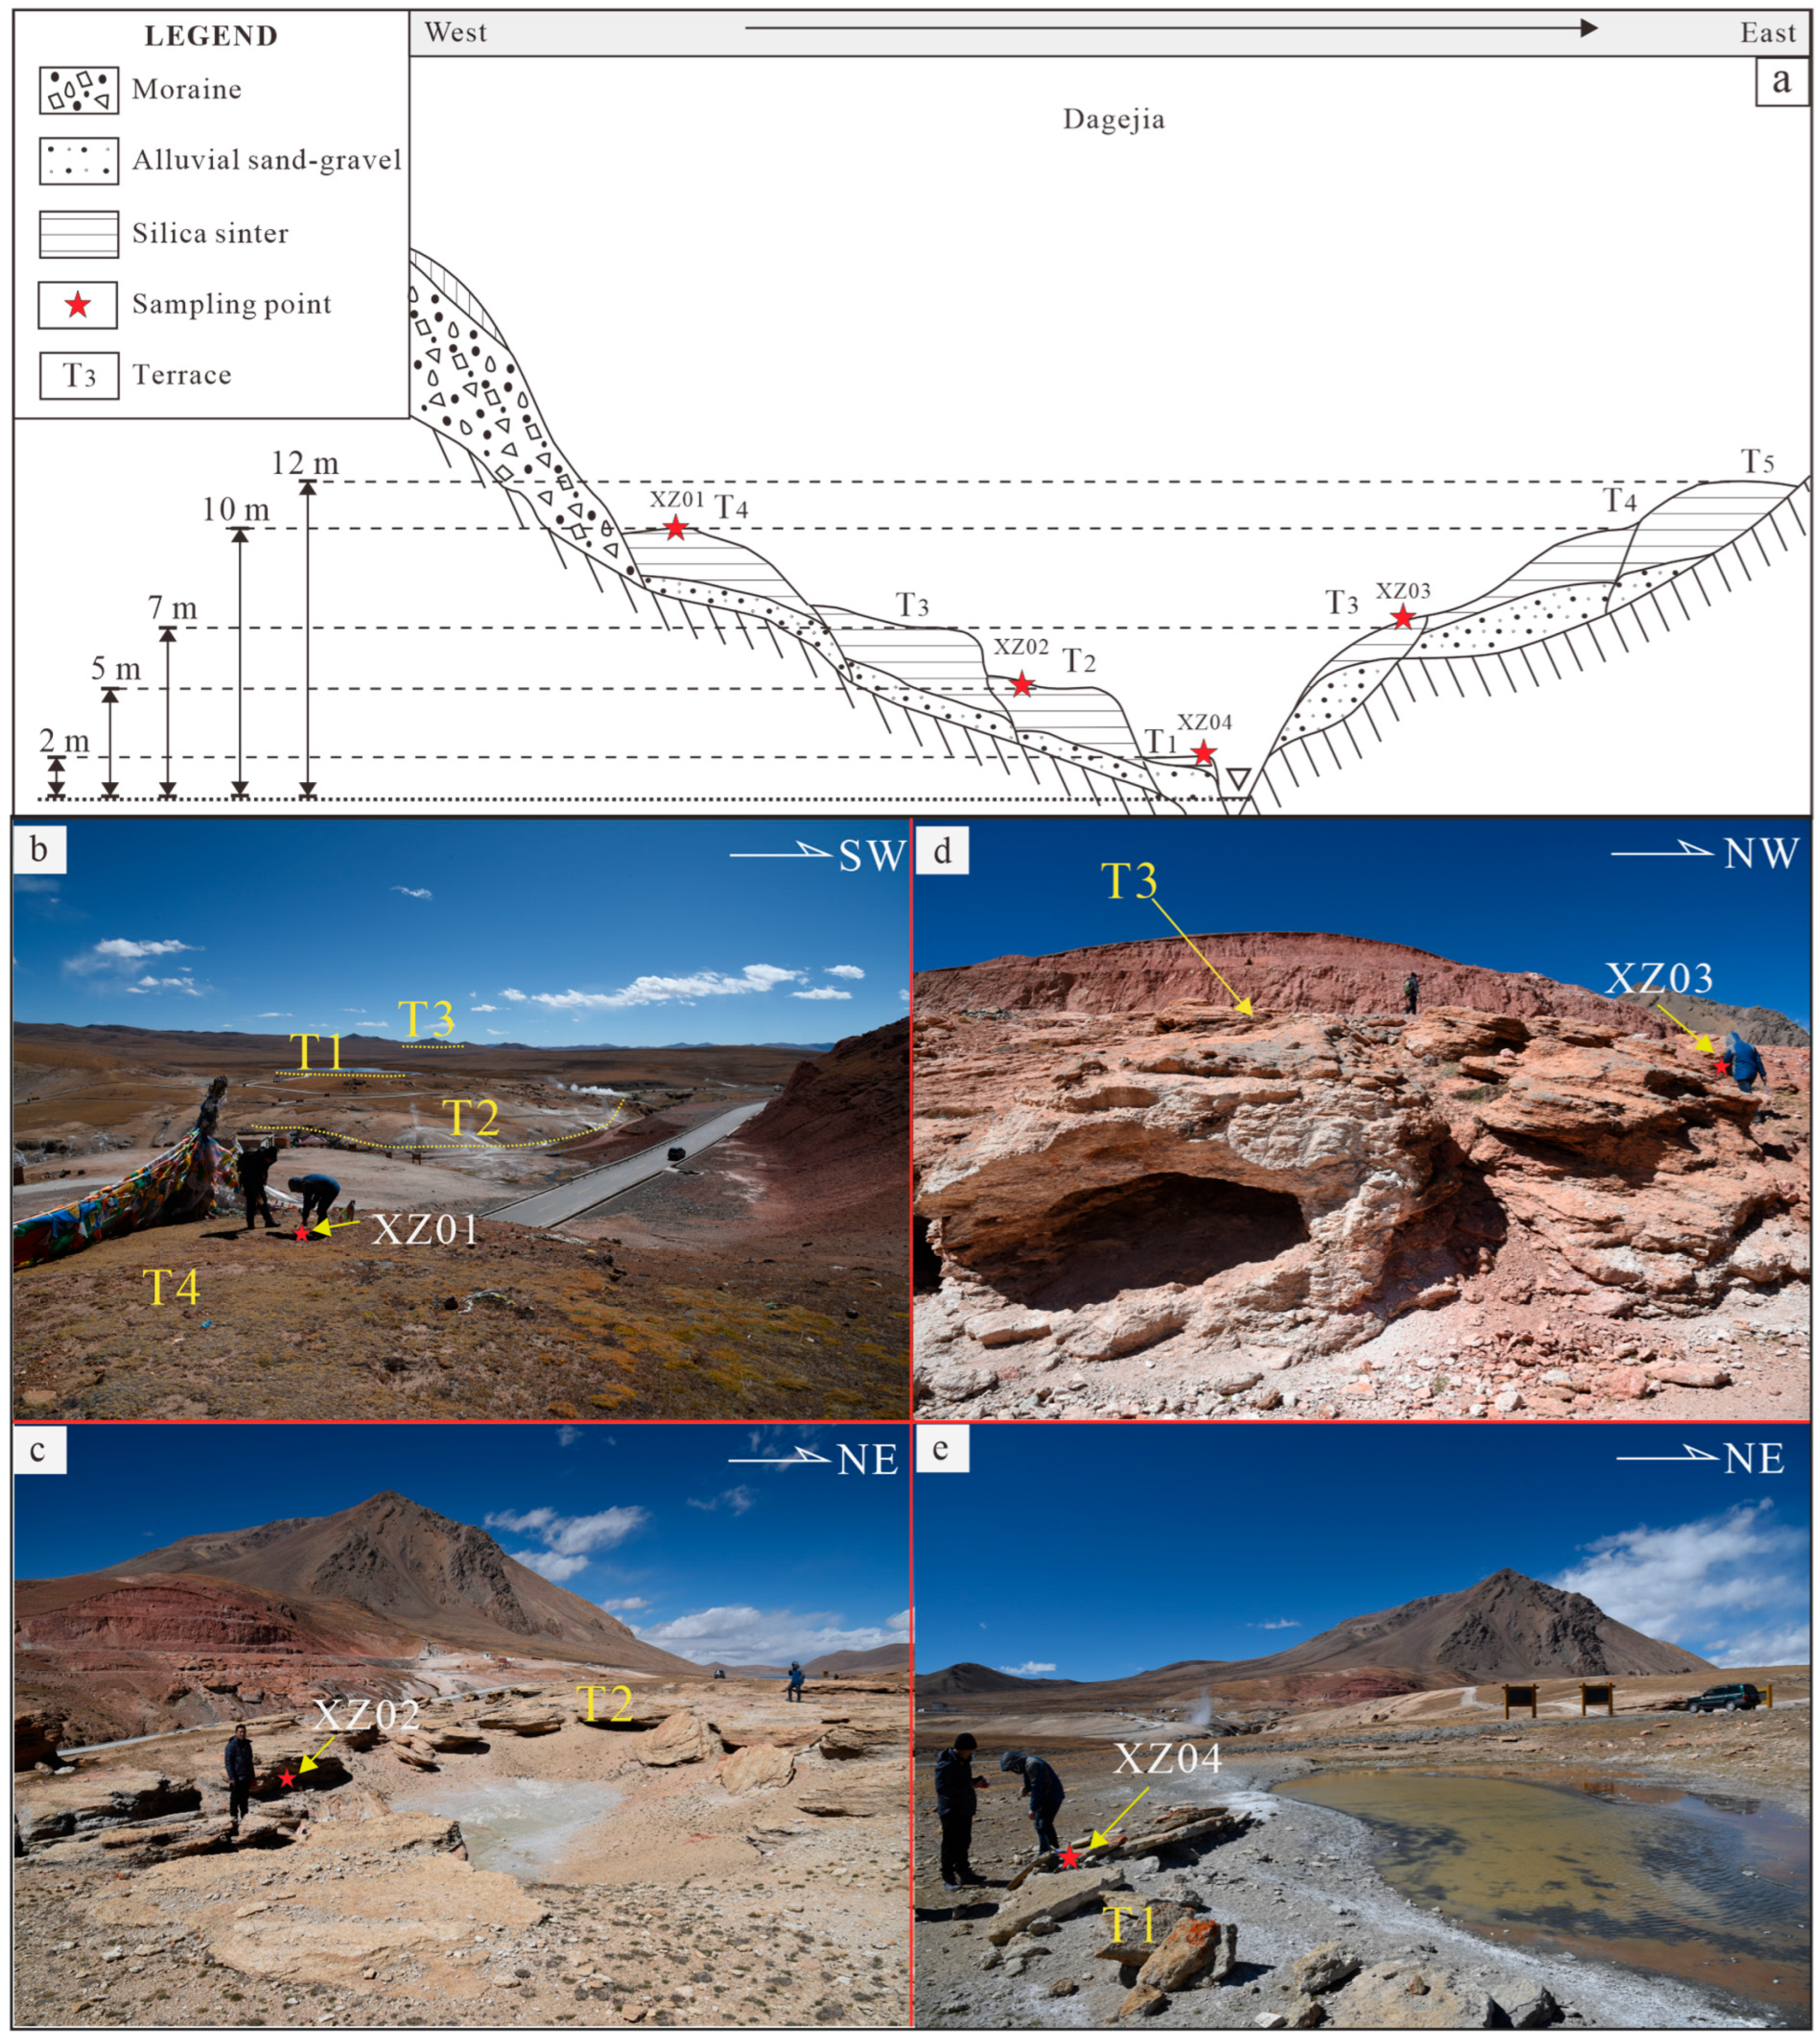
The Targejia geothermal field is located in Xigaze City, southern Tibet, at an altitude of 4970–5140 m a.s.l. It lies on the margin of a small NS-trending graben basin formed by the normal fault (F2) south of Dajiacuo, and is bordered to the south by the Bangdega–Lamayejia fault (F1) (Figure 1c). The Targejia hot spring is exposed in the Changmaqu River valley, which is flanked by five orders of terraces (T1–T5) (Figure 2). Silica sinters of varying color and physical character are deposited on the terrace surfaces. The terraces show distinct geomorphic and sedimentary characteristics. The fifth terrace (T5), standing 12 m above the river, contains only minor silica sinter, which is predominantly infilled within fractures of glacial till. By contrast, the fourth terrace (T4) has a tabular geometry with a maximum stratigraphic thickness of ~2–3 m, overlying fluvial sediments of the underlying terrace sequence. The third terrace (T3) features widely distributed siliceous sinter, up to 3 m in height, and is distinguished by an extensive siliceous sinter apron with a maximum vertical relief of 2 m, reflecting deposition in a structurally controlled sedimentary environment. Similarly, the second terrace (T2) is characterized by siliceous sinter horizontally overlying loose sediments with a thickness of ~1–2 m. In contrast, the first terrace (T1) displays a condensed stratigraphic sequence, with a sheet-like sinter layer less than 0.5 m thick that directly overlies active channel sands, indicative of recent depositional processes.
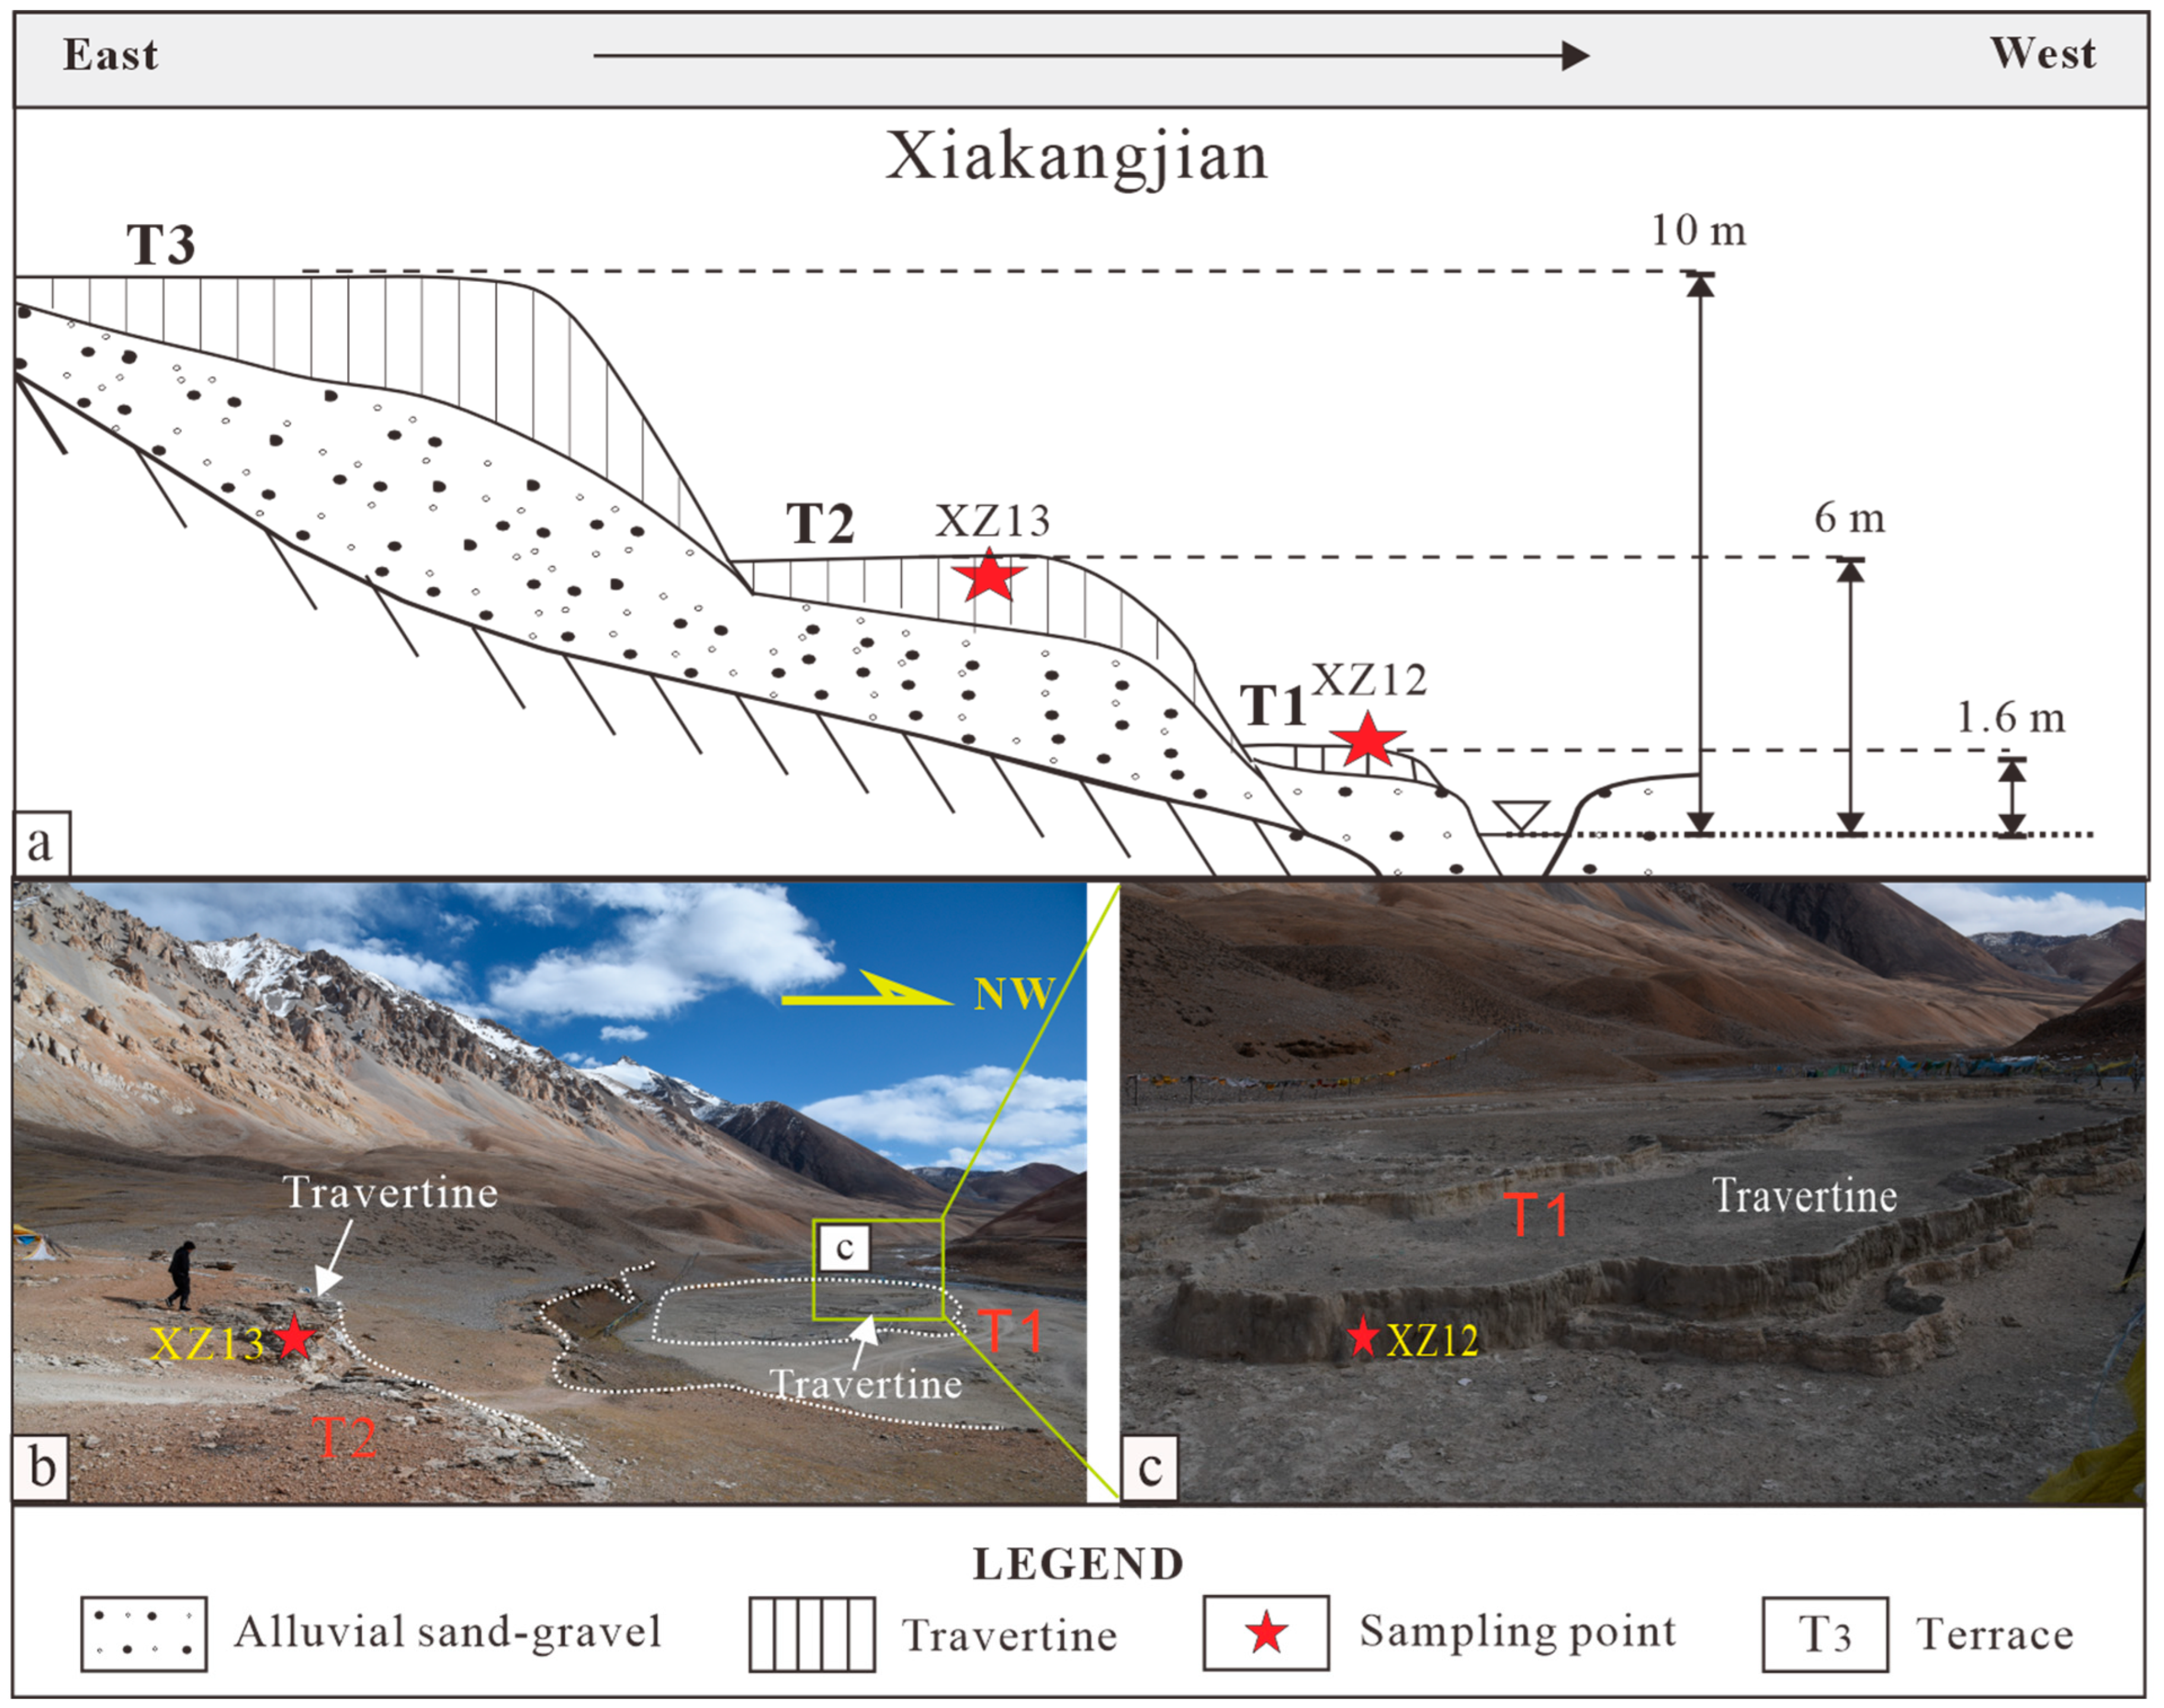
The Xiakangjian hot spring is located in Gerze County at an elevation of approximately 4500 m (Figure 1c,d). It lies on the west side of the Xiakangjian horst, at the northern end of the Zhongba–Daxiong rift. In response to the normal fault (F3), a broom-shaped normal fault group developed on the western side of the Xiakangjian fault block converges at this location and cuts Pleistocene and Holocene moraine and slope deposits, creating prominent evidence of multi-stage activity [58]. The hot spring emerges from alluvium on the east side of the valley without any distinct vent. The spring area extends along the valley and has formed a series of terraces. Three silica-sedimentary terraces (T1 –T3) have developed along the normal faults of the Xiakangjian graben (Figure 3). On the floodplain (T1), a sinter platform rises about 1.6 m above the river, while T2 and T3 stand approximately 6 m and 10 m above the river, respectively. On the T2 terrace, travertine is deposited in layers, lying on and covered by loose sediments, while T3 is a typical travertine terrace, approximately 1 m high and widely distributed on the floodplain surface.

3. Materials and Methods

3.1. Sampling

For this study, six samples were taken from the two areas: four silica sinter samples from the Targejia geothermal field and two travertine samples from the Xiakangjian valley (Table 1). The sampling strategy targeted different terrace levels and lithologies to evaluate ESR dating applicability across the main sinter varieties in the region. At least six groups of silica sinters and travertines were identified during field investigation, following the classification scheme of [25].
From Targejia, four silica sinter samples were collected from these terraces (Figure 2). The brick-red sample XZ01 was taken from the top of the sinter platform on the fourth terrace (T4) at a stratigraphic depth of 0.3 m below the modern surface (Figure 2b). Sample XZ03, which is grayish-white, was obtained from the southern piedmont fault zone at a burial depth of 0.6 m (Figure 2d). The yellowish sample XZ02 was collected from the sinter platform on the second terrace (T2) on the river’s east bank, at a subsurface depth of 0.4 m (Figure 2c). Sample XZ04, grayish-green to greyish-yellow in color, was collected near the sinter platform formed on the first terrace (T1) on the north bank of the river (Figure 2e). During fieldwork, we collected the interior parts of the silica sinter using a hammer. To provide sufficient material for chronological dating, the collected samples were roughly the size of half a standard brick.
From Xiakangjian, two travertine samples were collected (Figure 3). Sample XZ13 was collected from T1 at a burial depth of 0.6 m and sample XZ12 was obtained from T2, widely distributed on the floodplain surface. The sampling method for travertine is the same as that for silica sinter, described earlier and not repeated here.
Although six samples represents a limited number, they were deliberately chosen to cover the two principal lithologies (silica sinter and travertine) and distinct terrace positions, thus providing a preliminary but reasonable test of ESR dating applicability across the main sinter types in the region.

3.2. Sample Preparation and ESR Measurement

The pretreatment and ESR measurement were carried out in the ESR Dating Laboratory, Key Laboratory of Neotectonic Movement and Geological Hazards, Institute of Geomechanics, Chinese Academy of Geological Sciences.
In the laboratory, the outer 2 mm layer of each bulk sample was removed to eliminate the influence of alpha and beta radiation [33]; the remaining material was ground and sieved to a size fraction of 125–250 μm. Silica sinter and travertine samples were treated differently. For silica sinter, 10% hydrochloric acid and 10% hydrogen peroxide were used to remove carbonates and organic matter, respectively. The samples were then treated with 40% hydrofluoric acid for at least 40 min to dissolve feldspars, followed by washing with 10% hydrochloric acid and deionized water, and then dried. Travertine samples were treated with 5% hydrochloric acid for 1 min to eliminate unstable ESR signals induced by grinding [33,59].
They were subsequently rinsed with distilled water until neutral and dried at low temperature. After magnetic separation, each dried sample was split into ten equal aliquots. One aliquot was retained to measure the natural ESR signal, while the remaining nine were irradiated using a 60Co source at the China Institute of Atomic Energy. The nine aliquots received the following doses (dose rate: 30 Gy/min): 201, 407, 788, 1354, 1961, 2835, 3680, 5239, and 7084 Gy.
ESR measurements were conducted after the irradiated samples had been stored for two weeks to allow short-lived signals generated during irradiation to decay [60]. Measurements were performed using a Bruker EMXplus-6/1 X-band paramagnetic resonance spectrometer (Bruker Corporation, Karlsruhe, Germany) equipped with a standard rectangular ER 4102ST cavity (Bruker Corporation, Karlsruhe, Germany). To maintain constant experimental conditions over time, the temperature of the water circulating through the magnet was stabilized at 18 °C with a water-cooled Zhonghe BLKII-2FF-R chiller, (Zhonghe Instrument Co., Ltd., Beijing, China) and the room temperature was held at 20 °C by an air-conditioning unit. Low-temperature measurements (~90 K) were carried out using an ER 4141VT Digital Temperature Control System with liquid-nitrogen cooling (Bruker Corporation, Karlsruhe, Germany). All acquisition parameters, including cavity temperature, were automatically saved together with the ESR spectrum [61,62].
The relevant parameters and acquisition settings are as follows: The typical ESR spectra of silica sinter and travertine were obtained and analyzed. For silica sinter, the microwave frequency was set to ~9.4 GHz, the central field to 3348 G, and the scan width to 100 G. The microwave power was 1 mW, the modulation amplitude was 1 G, and the field modulation frequency was 100 kHz. A scan time of 10.24 s, a conversion time of 16.02 ms, a time constant of 0.01 ms, and a number of points of 2500 were used. The temperature was maintained at 18–20 °C. The signal evaluated for ESR dating had a g-value of 2.0017 based on the ESR spectra of silica sinter. For travertine, the microwave frequency was also ~9.4 GHz, the central field was 3380 G, and the scan width was 750 G. The microwave power was reduced to 0.2 mW, the modulation amplitude was 1 G, and the field modulation frequency remained 100 kHz. The scan time was 10.49 s, conversion time 5.33 ms, time constant 0.01 ms, and the number of points 7500. The temperature was similarly maintained at 18–20 °C, and the dated signal corresponds to a g-value of 2.0034 based on the ESR spectra of travertine. To account for the azimuthal dependence of the ESR signal, which can be affected by sample heterogeneity, all signal intensities were calculated as the mean of at least three measurements taken at different sample orientations; for each measurement, the sample tube was rotated by approximately 120° inside the microwave cavity. This approach minimizes the influence of any directional bias in the sample’s magnetic properties.
Equivalent doses (De) were determined using the multiple aliquot additive dose method, a technique widely employed for accurate dose assessment in ESR dating studies [63,64,65,66]. ESR equivalent dose estimation for silica sinter and travertine was based on a single saturating exponential (SSE) function, as described [61,63,67]. The equivalent dose (De) was calculated from ten data points, comprising the natural ESR signal from an unirradiated aliquot and the signals from nine aliquots irradiated with increasing doses (201, 407, 788, 1354, 1961, 2835, 3680, 5239, and 7084 Gy). The experimental data were fitted using Microcal OriginPro 2021 software (OriginLab Corporation, Northampton, MA, USA), which applies an iterative Levenberg–Marquardt (L–M) algorithm through chi-square minimization [68]. Data were weighted by the inverse of the squared ESR intensity [61,63].
To evaluate the thermal stability of the ESR signals used for dating, annealing experiments were performed on two natural samples (XZ01 for silica sinter and XZ12 for travertine). Aliquots of each sample were heated at temperatures ranging from 20 °C to 300 °C (XZ01) and from 20 °C to 350 °C (XZ12) for 15 min at each step. After each heating step, the ESR signal intensities of the centers at g = 2.0017 (silica sinter) and g = 2.0034 (travertine) were measured.

3.3. Dose Rate Estimation

The environmental dose rate was determined using multiple analytical techniques. Concentrations of uranium and thorium were measured on powdered sample material by inductively coupled plasma mass spectrometry (ICP-MS; Thermo Scientific ELEMENT XR, Thermo Fisher Scientific GmbH, Bremen, Germany), while potassium content was determined by atomic absorption spectroscopy (AAS; Hitachi Z-2000 polarized Zeeman atomic absorption spectrophotometer, Hitachi High-Tech Corporation, Naka, Ibaraki, Japan). All analyses were carried out at the Analytical Laboratory of the Beijing Research Institute of Uranium Geology.
For dose rate and age calculations, we used the Dose Rate and Age Calculator (DRAC) v1.2 tool [69] (freely accessible online at www.aber.ac.uk/alrl/drac accessed on 5 February 2024). In applying this software, we considered several key parameters, including burial depth, moisture content, chemical etching (grain surface removal), cosmic dose rate, and alpha efficiency. The moisture content of all samples was determined by heating them at 60 °C for approximately 24 h; after drying, the moisture content was calculated as the weight difference before and after drying divided by the mass of the dried sample [70]. The cosmic-ray contribution to the dose rate was calculated based on the geomagnetic latitude, burial depth, and elevation of the sample site [70,71]. Dose rate conversion factors were derived following the method of [72]. For chemical etching, it was assumed that a uniform layer of 8 ± 4 μm was removed from all grains [73]. Based on the assessment of alpha efficiency in coarse-grained quartz for ESR dating by [74], we selected an a-value of 0.07 ± 0.01 for silica sinter. In line with [32,75], an alpha efficiency of 0.2 ± 0.02 was chosen for travertine. Additionally, we adopted an internal dose rate of 0.05 ± 0.03 Gy/kyr for silica sinter and 0.12 ± 0.02 Gy/kyr for travertine as reasonably accurate estimates, based on the findings of [74,76]. Considering that some samples were collected from shallow depths (~30 cm), we assessed the contribution of gamma radiation from the surrounding environment using DRAC v1.2. All these parameters were systematically validated to ensure consistency with methodological standards in geochronological research, thereby enhancing the reliability of dose rate calculations for ESR dating applications.

3.4. Mineral Composition

Mineral composition and textural features of the sinter samples were determined using a combination of binocular microscope observation and petrographic thin-section analysis under a polarizing microscope, using both plane-polarized and cross-polarized light. The observations focused on grain morphology, size distribution, mineral assemblages, and textural relationships (e.g., clastic vs. cryptocrystalline textures, matrix/cement relationships, and lamination structures). In addition, X-ray powder diffraction using a PANalytical X’Pert Pro Diffractometer (Malvern Panalytical B.V., Almelo, The Netherlands) with a Cu tube at 40 kV and 20 mA. The diffraction data were recorded at 293 K with a step size of 0.02° and a span speed of 2.4°/min in the 2θ range of 5–70°. The percentages of clay minerals in each sample were determined through the peak areas of mineral presence, with the use of specific correction parameters.

4. Results

4.1. Mineral Composition and Texture of the Sinter Samples

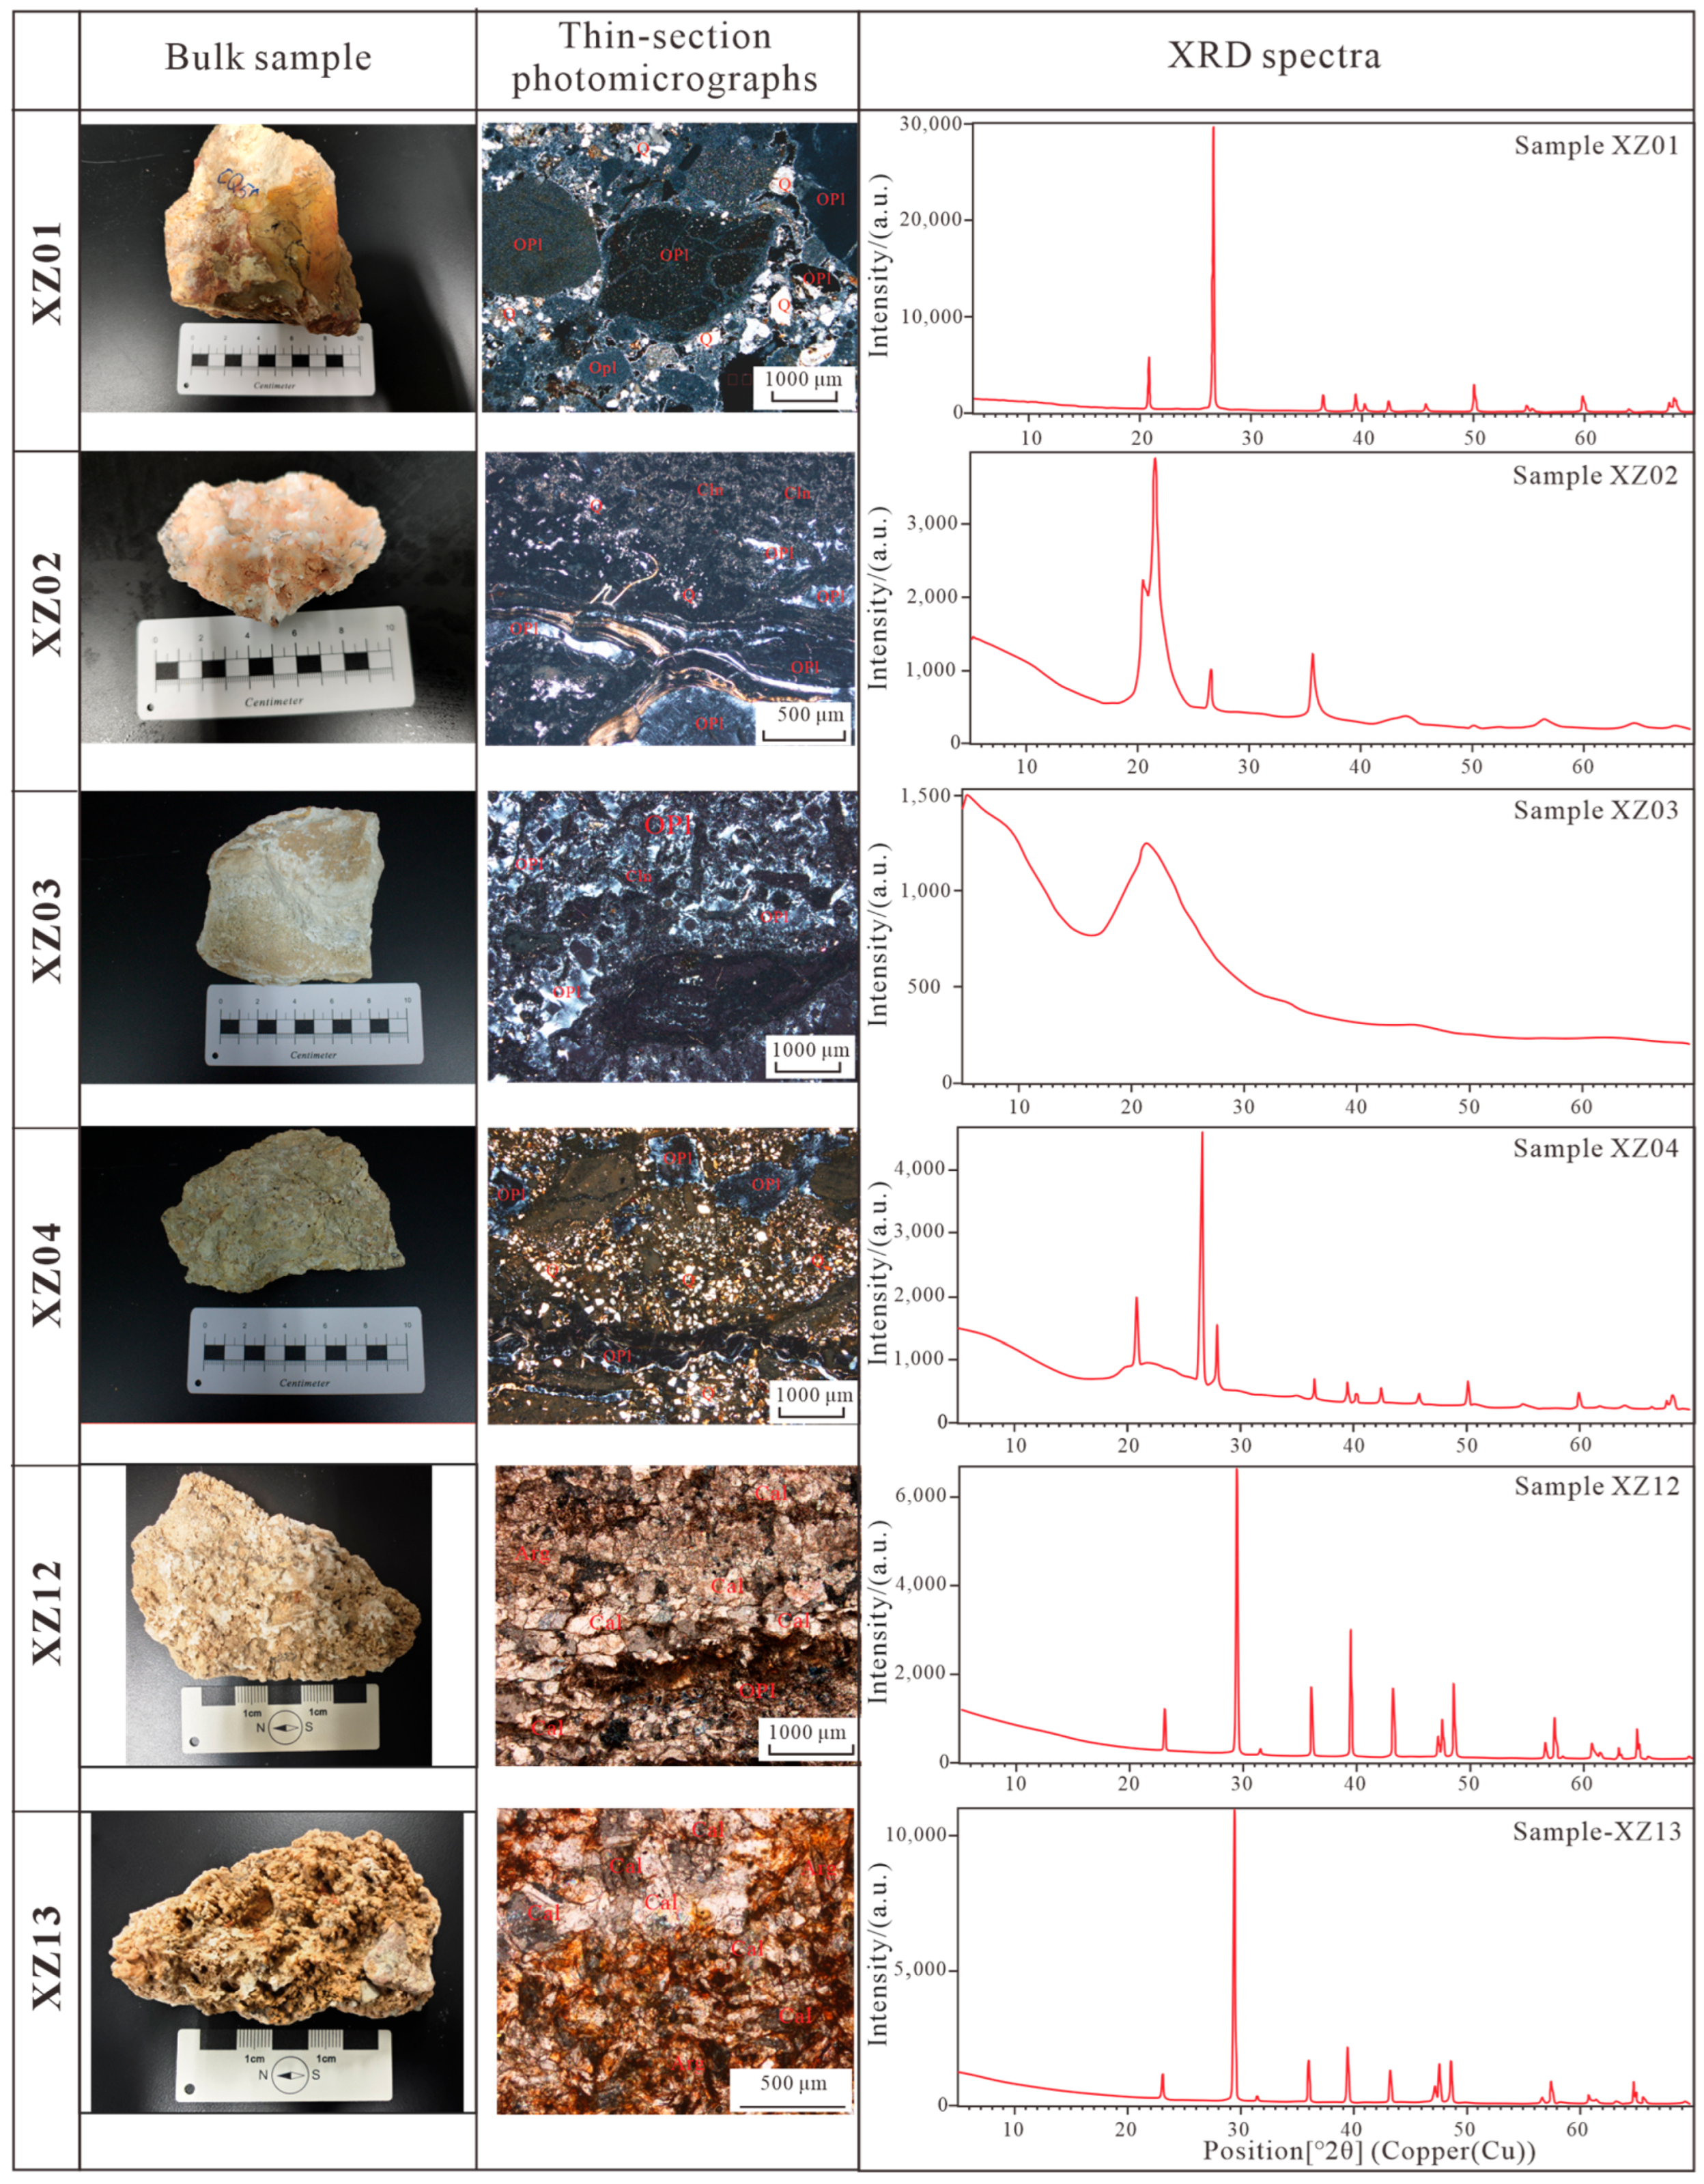
The mineral compositions of all samples, determined by microscopic observation and X-ray powder diffraction, are presented in Figure 4. The samples display diverse mineral structures and components, which are described individually below.

4.1.1. Mineral Composition of Silica Sinter

The silica sinter samples (XZ01, XZ02, XZ03, and XZ04) display distinct textural and structural features, yet they are all dominated by opal and quartz as the principal mineral components (Figure 4). The four samples show significant differences in mineral assemblage, particle morphology, grain size distribution, and secondary mineral content, as detailed below.
XZ01 and XZ04 share similar lithological characteristics: both display a clastic texture and massive structure and are composed predominantly of sand- to granule-sized clastic particles. These clasts are mainly derived from the erosional products of pre-existing sinter material and fragments of adjacent bedrock, with opal clasts as the primary constituent and subordinate quartz clasts, most of which exhibit angular morphologies. In XZ01, opal occurs as anhedral grains (0.26–2.5 mm) that are larger than the quartz grains and range from subrounded to subangular. Quartz is present as anhedral grains (0.11–0.5 mm) and occasionally as granular aggregates that fill interstices between coarse opal clasts, acting as a cement. Additionally, the matrix additionally contains a minor amount of fine-grained recrystallized calcite with alternating white and brown laminations, occurring as interstitial material. X-ray diffraction (XRD) analysis of XZ01 indicates a quartz content of 99%; thin-section examination, however, reveals that this quartz fraction comprises approximately 60% opal and 37% primary quartz. XZ04 exhibits comparable opal and quartz characteristics: opal grains (0.25–3.64 mm) are generally coarser than quartz grains (0.05–0.25 mm), both minerals are predominantly subangular to angular. In XZ04, the quartz occurs as cement that binds the coarse opal clasts, with a basal cement texture. Notably, XRD results for XZ04 yield 82.8% opal, together with 17.2% plagioclase within the matrix.
In contrast, XZ02 and XZ03 are characterized by cryptocrystalline textures; XZ02 displays a laminated structure, whereas XZ03 combines laminated and granular structures (Figure 4). The primary mineral assemblage of XZ02 consists of opal, chalcedony, and a small amount of quartz clastic particles. The opal is cryptocrystalline, and under high-power microscopy colloidal opal is distributed in distinct layers. Locally, granular quartz cemented by opal can be identified, and the cryptocrystalline material forms continuous, dense laminations. Toward the outer parts of the sample, continuous laminations and dendritic structures are more extensively developed, although some outer laminae appear disrupted by later vitreous veins related to hydrothermal jetting. Quartz in XZ02 occurs as irregular, predominantly recrystallized grains with a fine particle size range of 0.01–0.04 mm. Thin section analysis indicates that 89% of this quartz is derived from opal, while 11% originates from primary quartz. XRD analysis further reveals poor crystallinity of the mineral phases, with quartz and cristobalite as the dominant components within opal-CT—an intermediate phase in the diagenetic transformation from amorphous opal-A to microcrystalline quartz—rather than as pure high-temperature cristobalite [2]. This is consistent with the early diagenetic ordering of silica phases commonly observed in siliceous sinter deposits [1,45]. The possible presence of other silica polymorphs requires further confirmation.
The mineral composition of XZ03 comprises opal, dark fine-grained particles, and minor chalcedony. Cryptocrystalline opal fills interstices between detrital grains and acts as a basal cement. Fine-grained particles are mostly elongated and irregular in shape, with a particle size range of 0.12–0.92 mm (locally up to several millimeters); they appear dark under the microscope and are cemented by bright, cohesive cryptocrystalline opal with distinct crystal boundaries. The chalcedony in XZ03 also exhibits a cryptocrystalline texture, and local inner rings show radial and chromatic patterns. XRD analysis confirms the dominantly amorphous opal-A composition of XZ03, and thin section examination demonstrates that approximately 79% of its quartz is opal-derived, with 3% originating from primary chalcedony.

4.1.2. Mineral Composition of Travertine

The two travertine samples (XZ12 and XZ13) exhibit similar petrographic features. Following the travertine lithofacies classification of [77], they can be described as abiotic crystalline crusts, characterized by crystalline and laminated textures and consisting predominantly of calcite with minor aragonite and opal. Calcite occurs as anhedral grains (xenomorphic granular), with a grain size of 0.18–0.68 mm. Aragonite occurs as columnar and acicular crystals, 0.12–0.48 mm in size. Opal is non-cryptocrystalline (opal-A) and fills interstices between aragonite and calcite grains. The travertine samples XZ12 and XZ13 are relatively pure, with calcite contents reaching up to 99%.

4.2. The Characteristic of ESR Signals

4.2.1. Various Types of ESR Centers

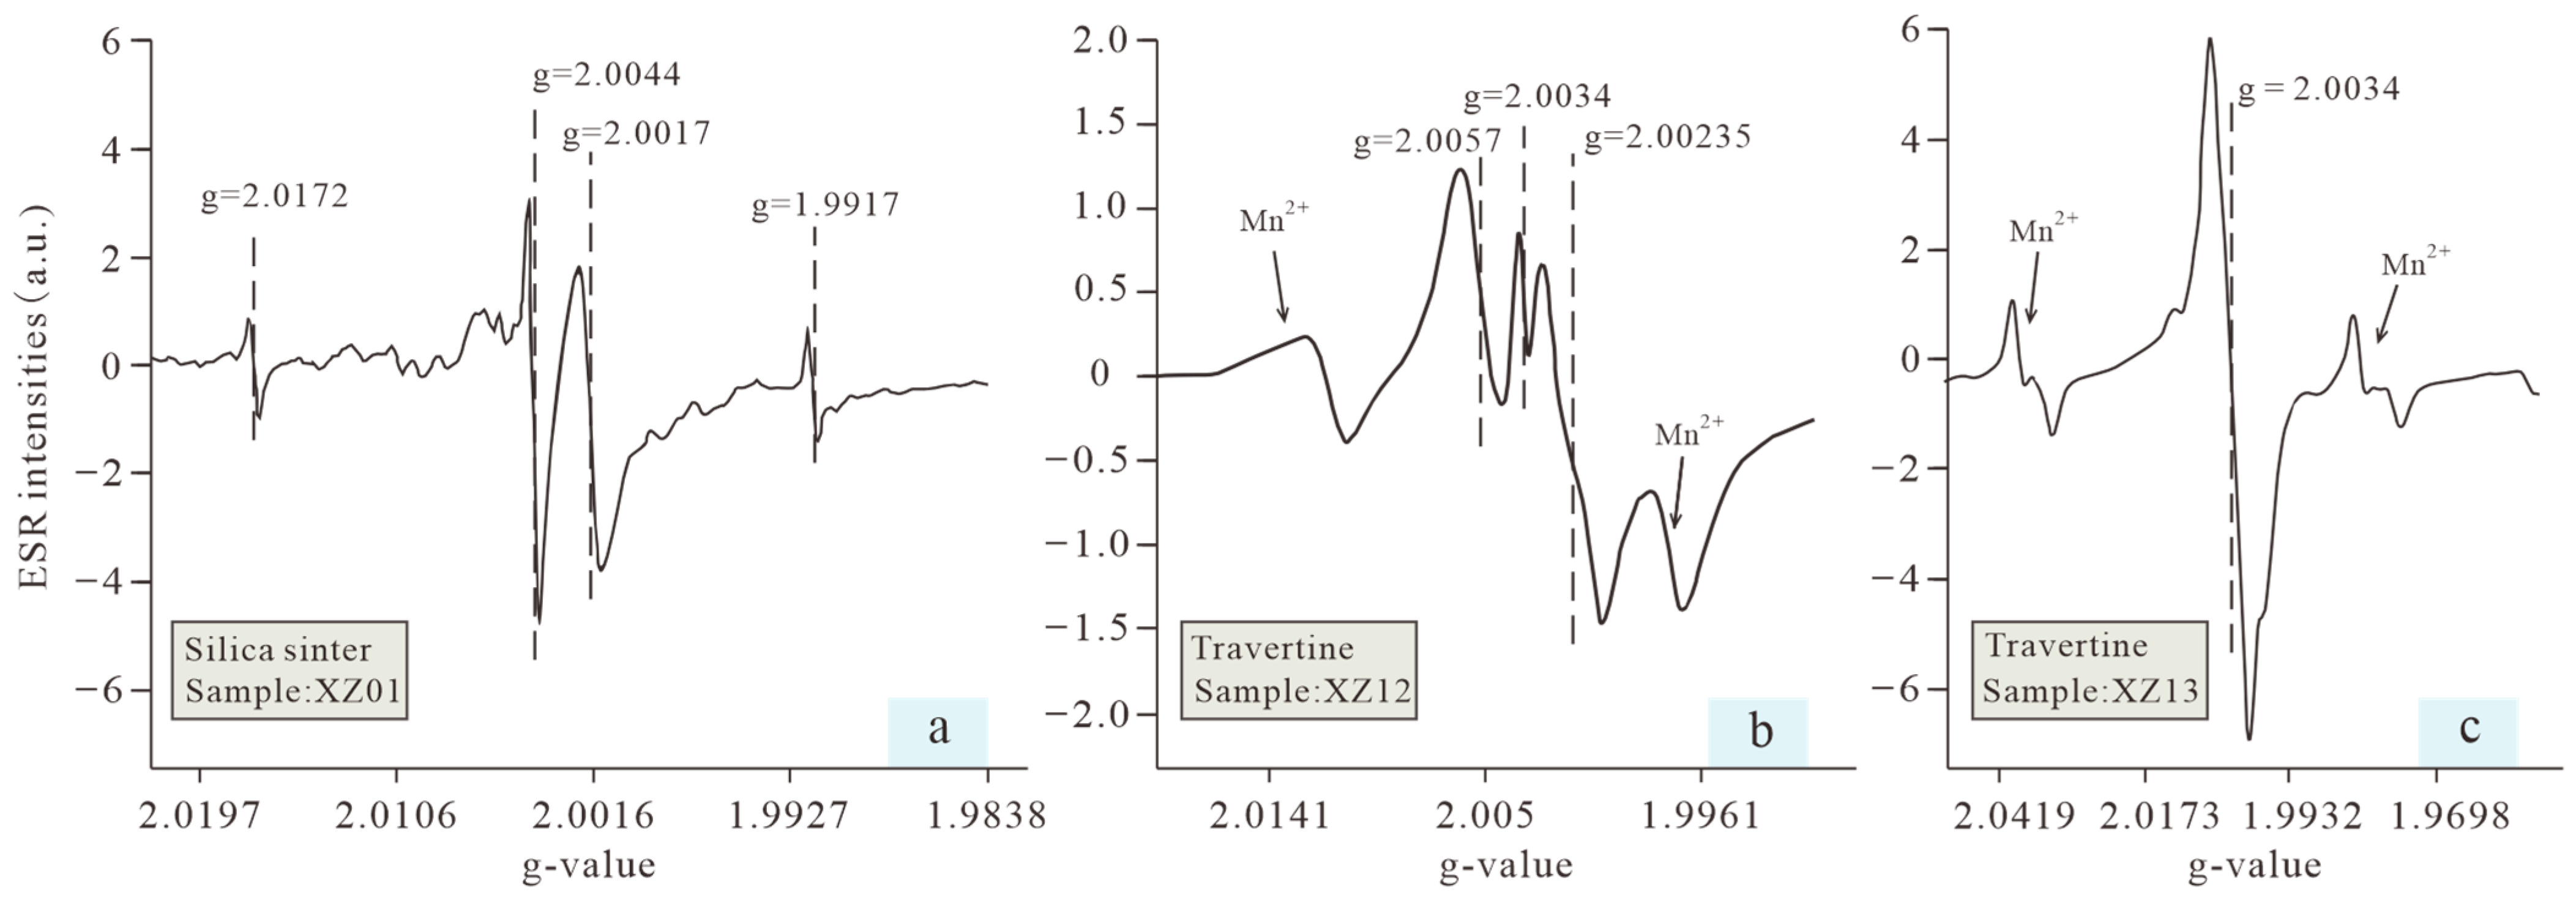
Three typical ESR spectra of silica sinter and travertine are presented in Figure 5. The silica sinter spectra display four sets of signals at g = 2.0172, g = 2.0044, g = 2.0017, and g = 1.9917 (Figure 5a). With the exception of the signal at g = 2.0017, the other ESR centers are all attributable to residual organic matter in the sample [33]. Consequently, the ESR center at g = 2.0017 was selected as the dating signal for the sinter samples. The two travertine samples, XZ12 and XZ13, exhibit different ESR spectra. The spectrum of XZ12 contains three types of signals: a signal at g = 2.0034 generated by HCO32− radicals, a broad signal at g = 2.00235 generated by free radicals, and a signal at g = 2.0057 associated with rotating SO2 radicals (Figure 5b) [33,78,79]. The spectrum of XZ13 is dominated by a single peak at g = 2.0034 (Figure 5c). More than 500 speleothem samples have been examined and showed that the ESR signal at g = 2.0058 is insensitive to artificial γ-irradiation [33]. By contrast, the ESR signal at g = 2.0034 is better suited for dating because of its high resolution and stability [33,80]. The ESR signal at g = 2.0006 is also widely used in travertine dating [50,56,80,81,82], but in the present samples it is overlapped by the signal at g = 2.00235 and therefore cannot be measured accurately. For this reason, the ESR signal at g = 2.0034 was chosen as the dating center for the travertine samples.

4.2.2. Effect of Additional Dose

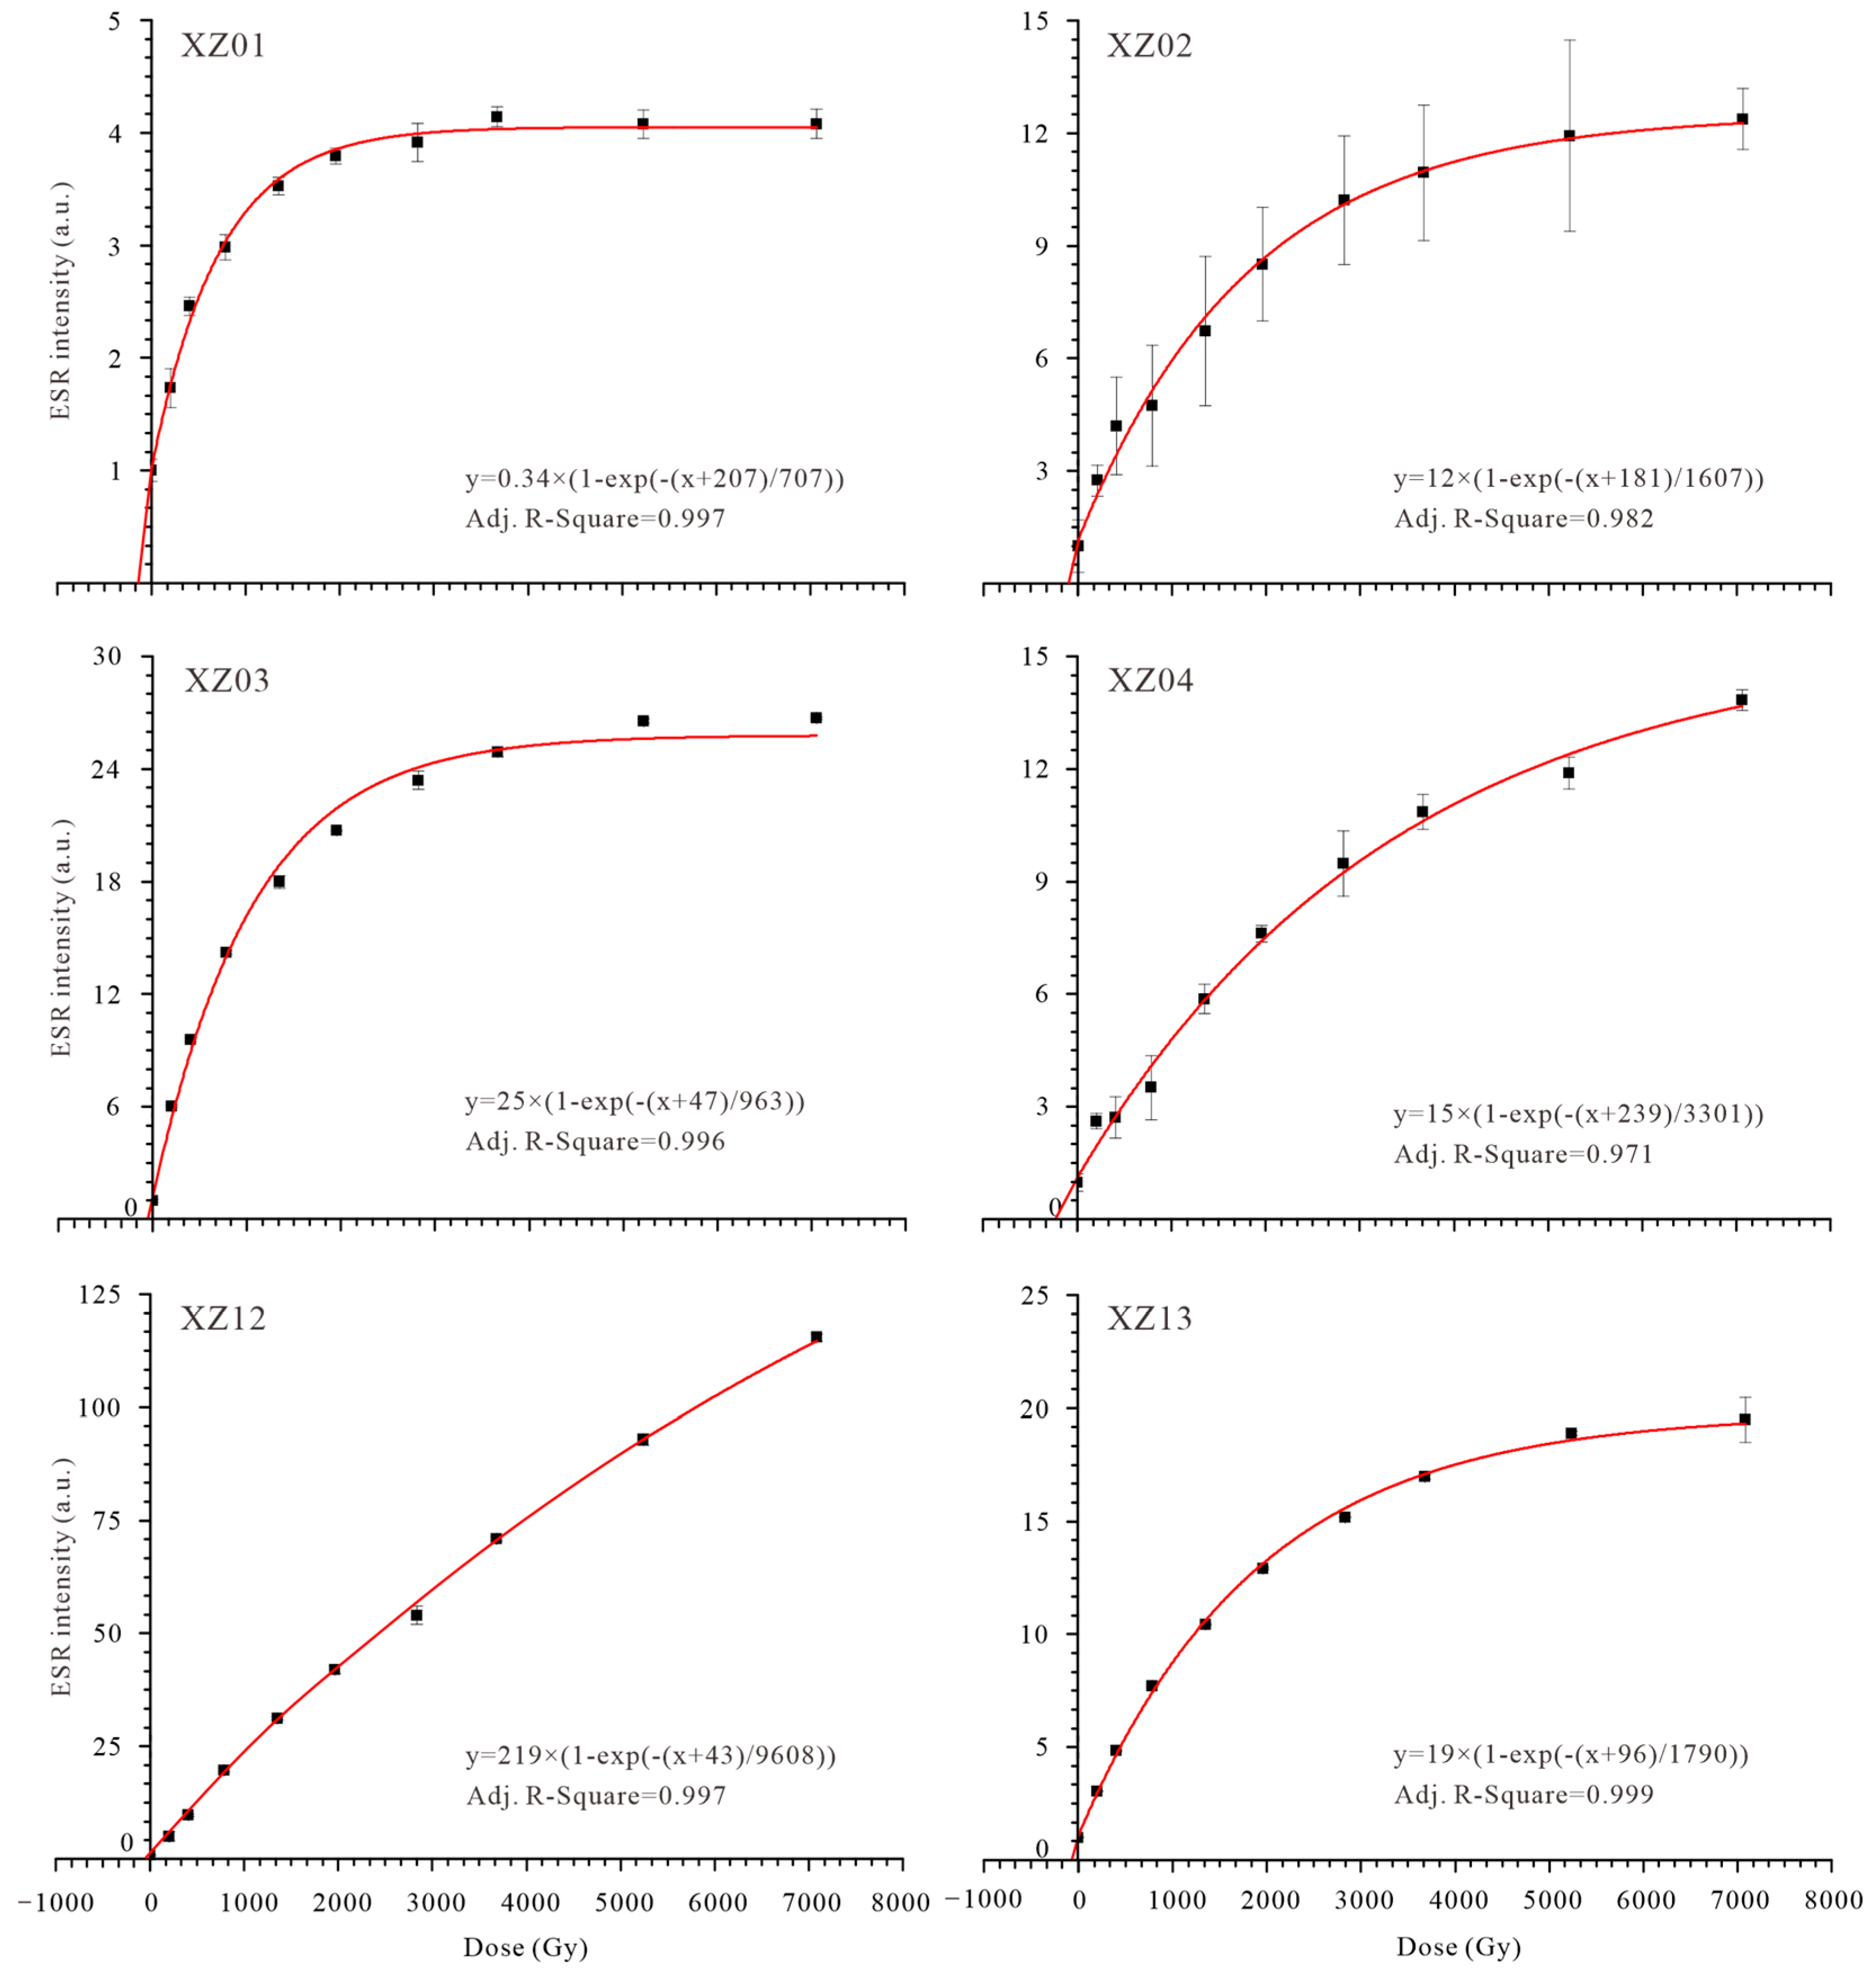
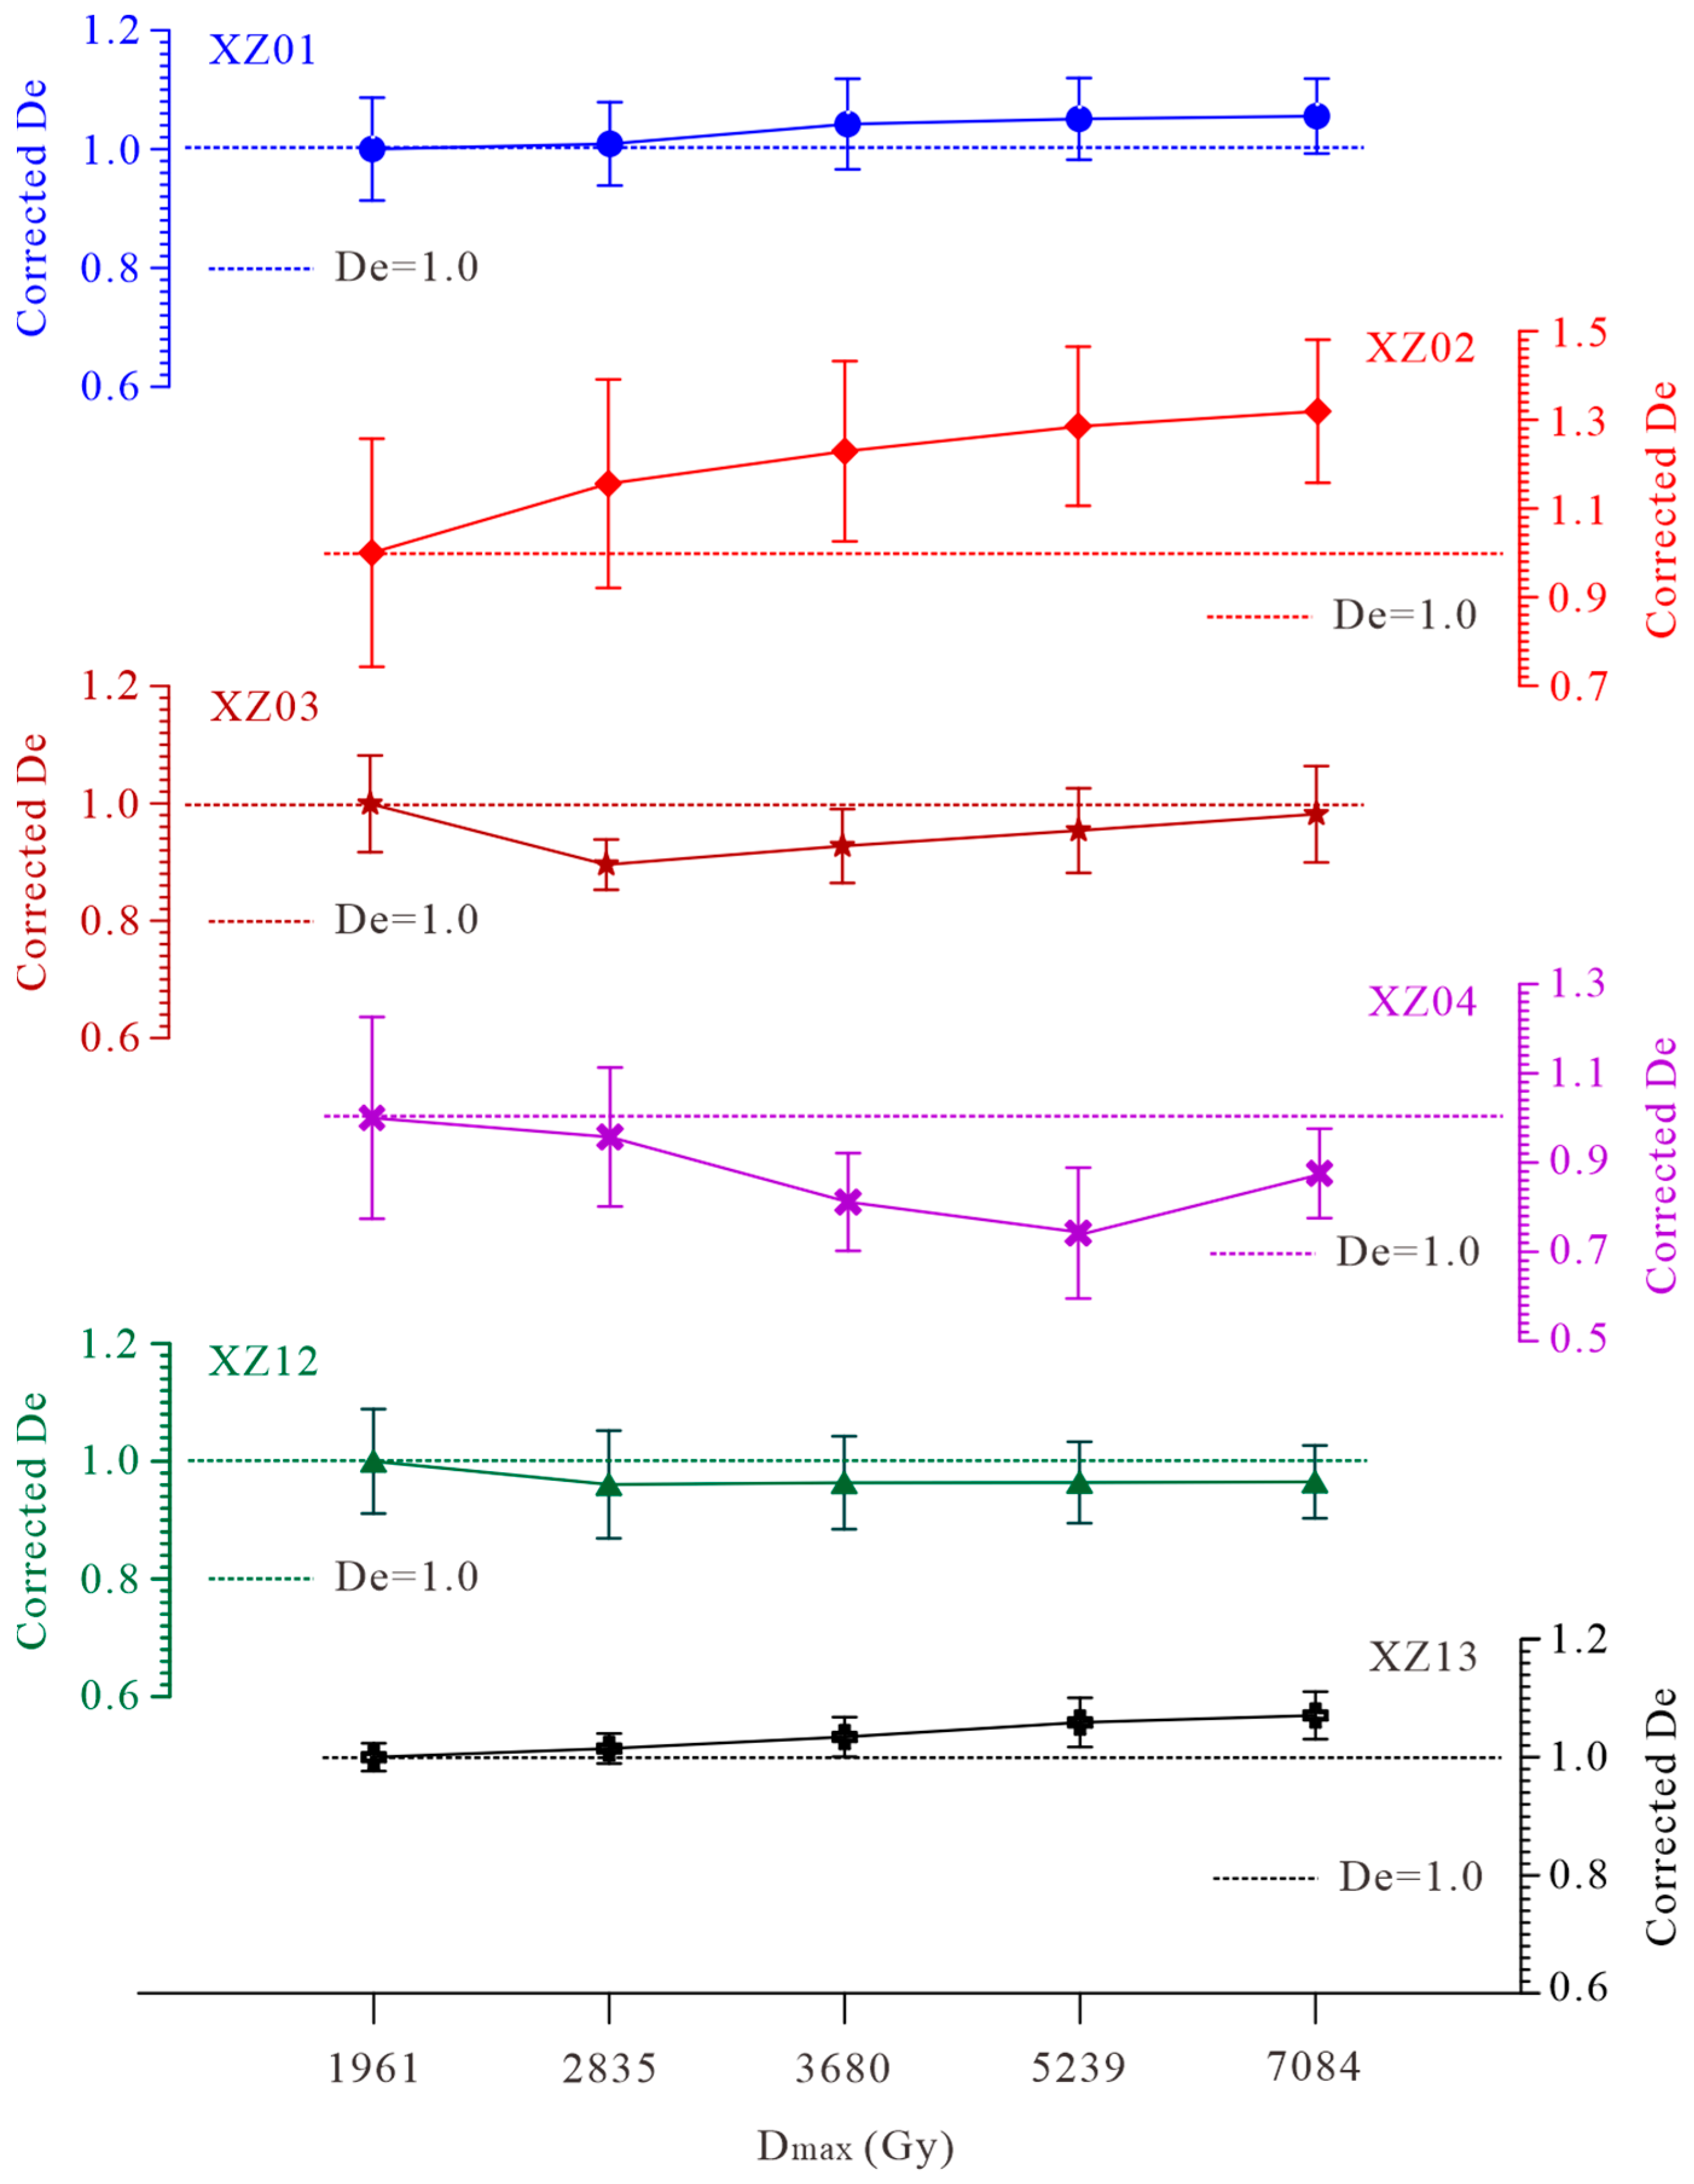
In ESR dating, choosing an appropriate radiation dose is critical. Compared with the low natural dose rates typical of geological environments, prolonged irradiation at a dose rate of 30 Gy/min using a 60Co source may induce radiation damage in the samples. Moreover, high additional doses can readily cause saturation of the ESR signal or changes in sensitivity, leading to large uncertainties [62,83,84,85]. Previous work has examined the dependence of the equivalent dose (De) on the applied dose and has shown that the maximum added dose (Dmax) should be chosen according to the saturation level, typically in the range of 5–10 times De [33,47,86,87]. In this study, we assessed the influence of the laboratory irradiation dose on the De values. Dose–response curves are shown in Figure 6, and the De values obtained for different Dmax values (1961, 2835, 3680, 5239, and 7084 Gy) are listed in Table 2. For each sample, all De values were then normalized by dividing them by the De derived from the 0–1961 Gy dose range. The normalized De values are plotted against the additional dose range in Figure 7. Based on the comprehensive dataset and analytical results, we identified the most reliable De for each sample to be used in subsequent analyses.
We calculated De values for all samples using the ten data points across the 0–7084 Gy dose range; all De values are below 250 Gy, with two samples yielding values of less than 50 Gy. To evaluate the influence of Dmax on De, we compared the De values obtained for each sample using different Dmax values. For samples XZ01, XZ03, and XZ13, we adopted the De corresponding to Dmax = 1961 Gy. Their dose–response curves show that the ESR intensity saturates at higher additional doses, which is especially evident for XZ01 (Figure 6). In contrast, sample XZ12 has a low De and does not display saturation. When the 0–1961 Gy dose range was used, the resulting De is 45 Gy, whereas for all other dose ranges the De is consistently 43 Gy. We therefore consider the De from the 0–1961 Gy interval to be less accurate because it relies on only six data points, leading to a larger error; a greater number of data points is required to obtain more precise De values. Accordingly, we selected 43 ± 3 Gy as the De for XZ12. Sample XZ02 illustrates the effect of data dispersion: with six data points in the 0–1961 Gy range, the De values displayed larger errors (Table 2). Since the dose–response curve of XZ02 does not saturate even at Dmax = 7084 Gy (Figure 6), more data points were used to improve accuracy. We applied the same approach to determine the De for XZ04. Figure 7 provides a more intuitive picture of the impact of Dmax on De. Overall, Dmax has little influence on the De values for most samples (XZ01, XZ03, XZ12, and XZ13): all De values calculated from Dmax = 1961 Gy to Dmax = 7084 Gy agree within error. In other words, the choice of Dmax does not introduce significant fitting bias.
In summary, Dmax had only a minor influence on the De values for most samples in this study. The selection of the most appropriate De was based on three factors: Dmax, the saturation point of the dose–response curve, and the scatter of the data points.

4.2.3. Thermal Stability of Paramagnetic Center in Silica Sinter (g = 2.0017) and Travertine (g = 2.0034)

In the present study, the silica sinter and travertine samples were collected from terrestrial thermal spring deposits. In the studied hydrothermal systems, subsurface water temperatures can reach up to 150 °C at depth and before emerging at the surface [88]. Sinter deposits must therefore have been subjected to prolonged heating during their formation. We first investigated how the thermal history influences the paramagnetic centers in these deposits. To identify a stable paramagnetic center suitable for ESR dating, we conducted annealing experiments to evaluate the thermal stabilities of the centers at g = 2.0017 in silica sinter and g = 2.0034 in travertine.
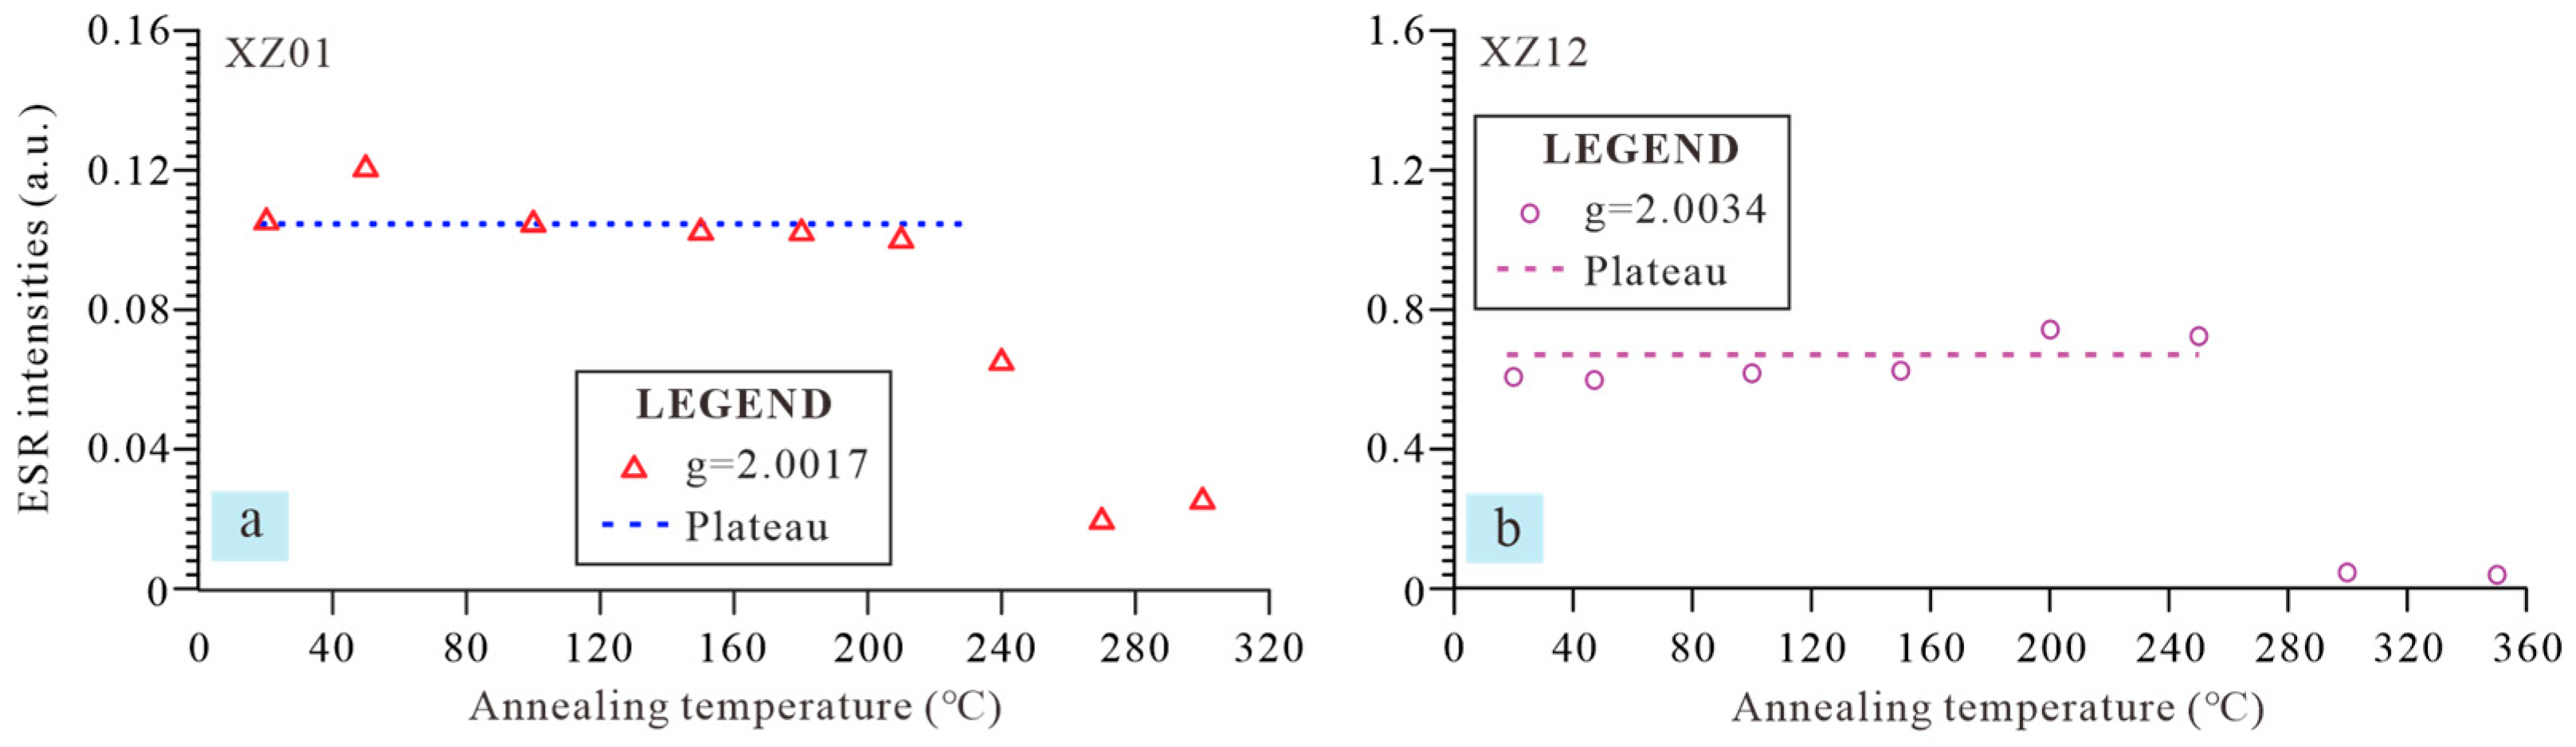
The thermal stability results are shown in Figure 8. For XZ01, the ESR signal intensity remained stable between 20 and 210 °C (Figure 8a). Heating to 240 °C, however, caused a decrease in intensity. At 270 and 300 °C, the signal stabilized again at a lower intensity. Sample XZ12 displayed similar behavior: the ESR signal at g = 2.0034 was stable up to 250 °C (Figure 8b).
Previous studies have shown that silica sinter forms across a broad temperature range [89,90,91]. Silica sinter deposition is typically linked to high-temperature geothermal fluids, especially where natural discharges reach 75–100 °C [90]. Opaline sinter can form at temperatures up to 140 °C, whereas quartz formation is favored at higher temperatures but may occur below 100 °C under specific conditions of supersaturation and precipitation [89]. Sinters in moderate geothermal systems are thought to have formed at temperatures of about 150–165 °C [91]. Travertine, in contrast, is generally thought to accumulate in low-temperature (<82 °C) geothermal settings [4,92]. Taken together, these findings and our own results indicate that the ESR centers at g = 2.0017 in silica sinter and g = 2.0034 in travertine are suitable for ESR dating, given their demonstrated thermal stability over the 20–210 °C range.

4.3. ESR Ages

The ESR analytical results are presented in Table 3, including the De value, environmental dose rate, and ESR ages. In the Targejia geothermal field, the four silica sinter samples yielded ages ranging from 209 to 49 kyr. XZ02, collected from T2, is the oldest sample, with an ESR age of 209 ± 38 kyr. The age of XZ04, deposited on T1, is 191 ± 21 kyr. The youngest sample, XZ03 (T3), gave an ESR age of 49 ± 5 kyr. Sample XZ01, from T4, is dated to 125 ± 12 kyr.
In the Xiakangjian hot spring, the two travertine samples XZ12 and XZ13 gave ages of 64 ± 6 kyr and 125 ± 9 kyr, respectively, in agreement with their stratigraphic positions.
All samples, including both silica sinter and travertine, show low annual dose rates, ranging from 0.67 to 1.53 Gy/kyr (Table 3). Similar low dose rate values have been reported for sinter deposits from other areas on the Tibetan Plateau, including the Gulu, Targejia, and Semi areas [6,25,45].

5. Discussion

5.1. Reliability Analysis of ESR Ages

All sinter samples used for ESR dating in this study yield high-resolution ESR signals. The dating centers at g = 2.0017 for silica sinter and g = 2.0034 for travertine were selected based on the analysis of their ESR spectra and thermal stability. Each dating signal increases steadily over the chosen additional dose range, with no evidence of radiation saturation or microwave power saturation. The resulting De values are fitted with high precision, as indicated by adjusted R2 values greater than 0.99.
The results show that most ESR ages of sinter and travertine samples are consistent with their stratigraphic positions, especially in the Xiakangjian hot spring area. In the Targejia geothermal field, the ESR ages of samples XZ01 and XZ03, collected from T4 and T3 respectively, match the terrace formation sequence. However, the ESR ages obtained for XZ02 and XZ04 are relatively older than those of XZ01 and XZ03 and are incompatible with the terrace chronology. Two main factors may account for this discrepancy. First, the dating of XZ02 and XZ04 may be less accurate because of mineral admixtures, as observed under a polarizing microscope (Figure 4). In rock sample XZ02, variations in mineral crystallinity and impurities can generate a range of ESR signals in response to the added dose (Figure 6). For XZ04, the quartz ESR signal may be contaminated by the signal from residual plagioclase, leading to an artificially steep growth of the ESR signal with increasing dose and potentially skewing the resulting ESR age. Unfortunately, low uranium concentrations precluded independent U-series dating of these problematic samples, which would have helped verify the ESR results. At present, therefore, the accuracy of the ESR ages for XZ02 and XZ04 cannot be assessed definitively. A second possible factor is physical mixing driven by hydrothermal activity. Sinter deposition is multi-stage, and older sinter fragments can be reincorporated into younger deposits [6]; additionally, dissolution of sinter by meteoric water can release opal that is transported to a different stratigraphic position [28]. Previous dating of silica sinters has likewise yielded ages out of stratigraphic order, not only with ESR [45] but also with 14C [8,28], uranium-series [25,28], and 10Be dating [28]. These age reversals suggest that our understanding of sinter formation and deposition remains incomplete. Detailed U-series dating of the Qiusang travertine in southern Tibet identified several zones with distinct depositional phases [11]; even within a single zone, ages spanned a wide range, for example in their Zone 6 where corrected ages varied from 129.5 ± 2.1 kyr to 628.6 ± 149.5 kyr. A similar pattern has been observed in other geothermal regions of southern Tibet, including the Gulu, Yangyi, and Targejia fields. This indicates that sinter depositional phases are complex and yield widely dispersed ages. A depositional phase spanning 403–202 kyr was documented in the Targejia field [25]; whether the formation of samples XZ02 and XZ04 falls within this interval remains to be confirmed with additional data.
Our ESR ages from the Targejia geothermal field differ significantly from those reported by [46]. Our ages range from 49 to 209 kyr, whereas those of [46] span 6.2 to 403.3 kyr, covering a much wider interval. Moreover, the youngest sample in our dataset (49 ± 5 kyr) is older than the youngest sample in [46]. These discrepancies may arise from several factors, including differences in sampling locations and applied methodologies. Additionally, the geomorphic positions of the samples in [46] are not clearly documented, which makes it difficult to compare their results directly with ours.
The samples XZ12 and XZ13 consist predominantly of carbonate, with calcite content reaching 99% and only minor amounts of aragonite and opal (Figure 4). This high-purity carbonate composition minimizes interference from impurities, ensuring strong and stable ESR signals. Consequently, the ESR ages obtained from these samples are more reliable and more accurately reflect their intrinsic geological characteristics.
We acknowledge that our ESR dating results are based on a limited number of samples (n = 6), which constrains the statistical robustness of the age interpretations, particularly for the Targejia geothermal field where age reversals were observed (samples XZ02 and XZ04). The six samples were selected to represent the two principal lithologies (silica sinter and travertine) and different terrace levels (T1–T4 in Targejia, and T1–floodplain in Xiakangjian), allowing a preliminary assessment of ESR dating applicability across the main sinter types in the study area. For four of the six samples (XZ01, XZ03, XZ12, and XZ13), the ESR ages are consistent with their stratigraphic positions, suggesting that the method can produce reliable ages for relatively pure materials with low detrital contamination. However, the two problematic samples (XZ02 and XZ04) highlight the limitations of the method when applied to mineralogically heterogenous materials. The primary aim of this study is therefore to evaluate the potential and limitations of ESR dating for sinter deposits, rather than to establish a definitive regional chronology. The observed age clusters and their possible climatic implications should be regarded as preliminary, requiring further testing with larger sample sets and additional independent dating.

5.2. The Age Controls of Sinter Formation in Southern Tibet

As noted above, the formation of silica sinter and travertine serves as an indicator of hydrothermal activity. To reconstruct the history of hydrothermal activity in southern Tibet, chronologies of sinter deposition have been established using ESR and uranium-series dating [6,10,11,19,23,25,26,44,46]. However, the chronology of hydrothermal activity remains controversial, largely due to the limited number of well-dated sinter samples and the complexity of sinter depositional processes.
In this study, the ESR ages of silica sinter and travertine from the Targejia geothermal field and the Xiakangjian hot spring area fall into three groups: 209–191 kyr, 125 kyr, and 64–49 kyr. Sinter and travertine deposits in several other geothermal areas of southern Tibet—including Gudui [19], Gulu [25,44,46], and Targejia [45]—also formed during these intervals. These ages point to episodes of hydrothermal activity and/or climate change.
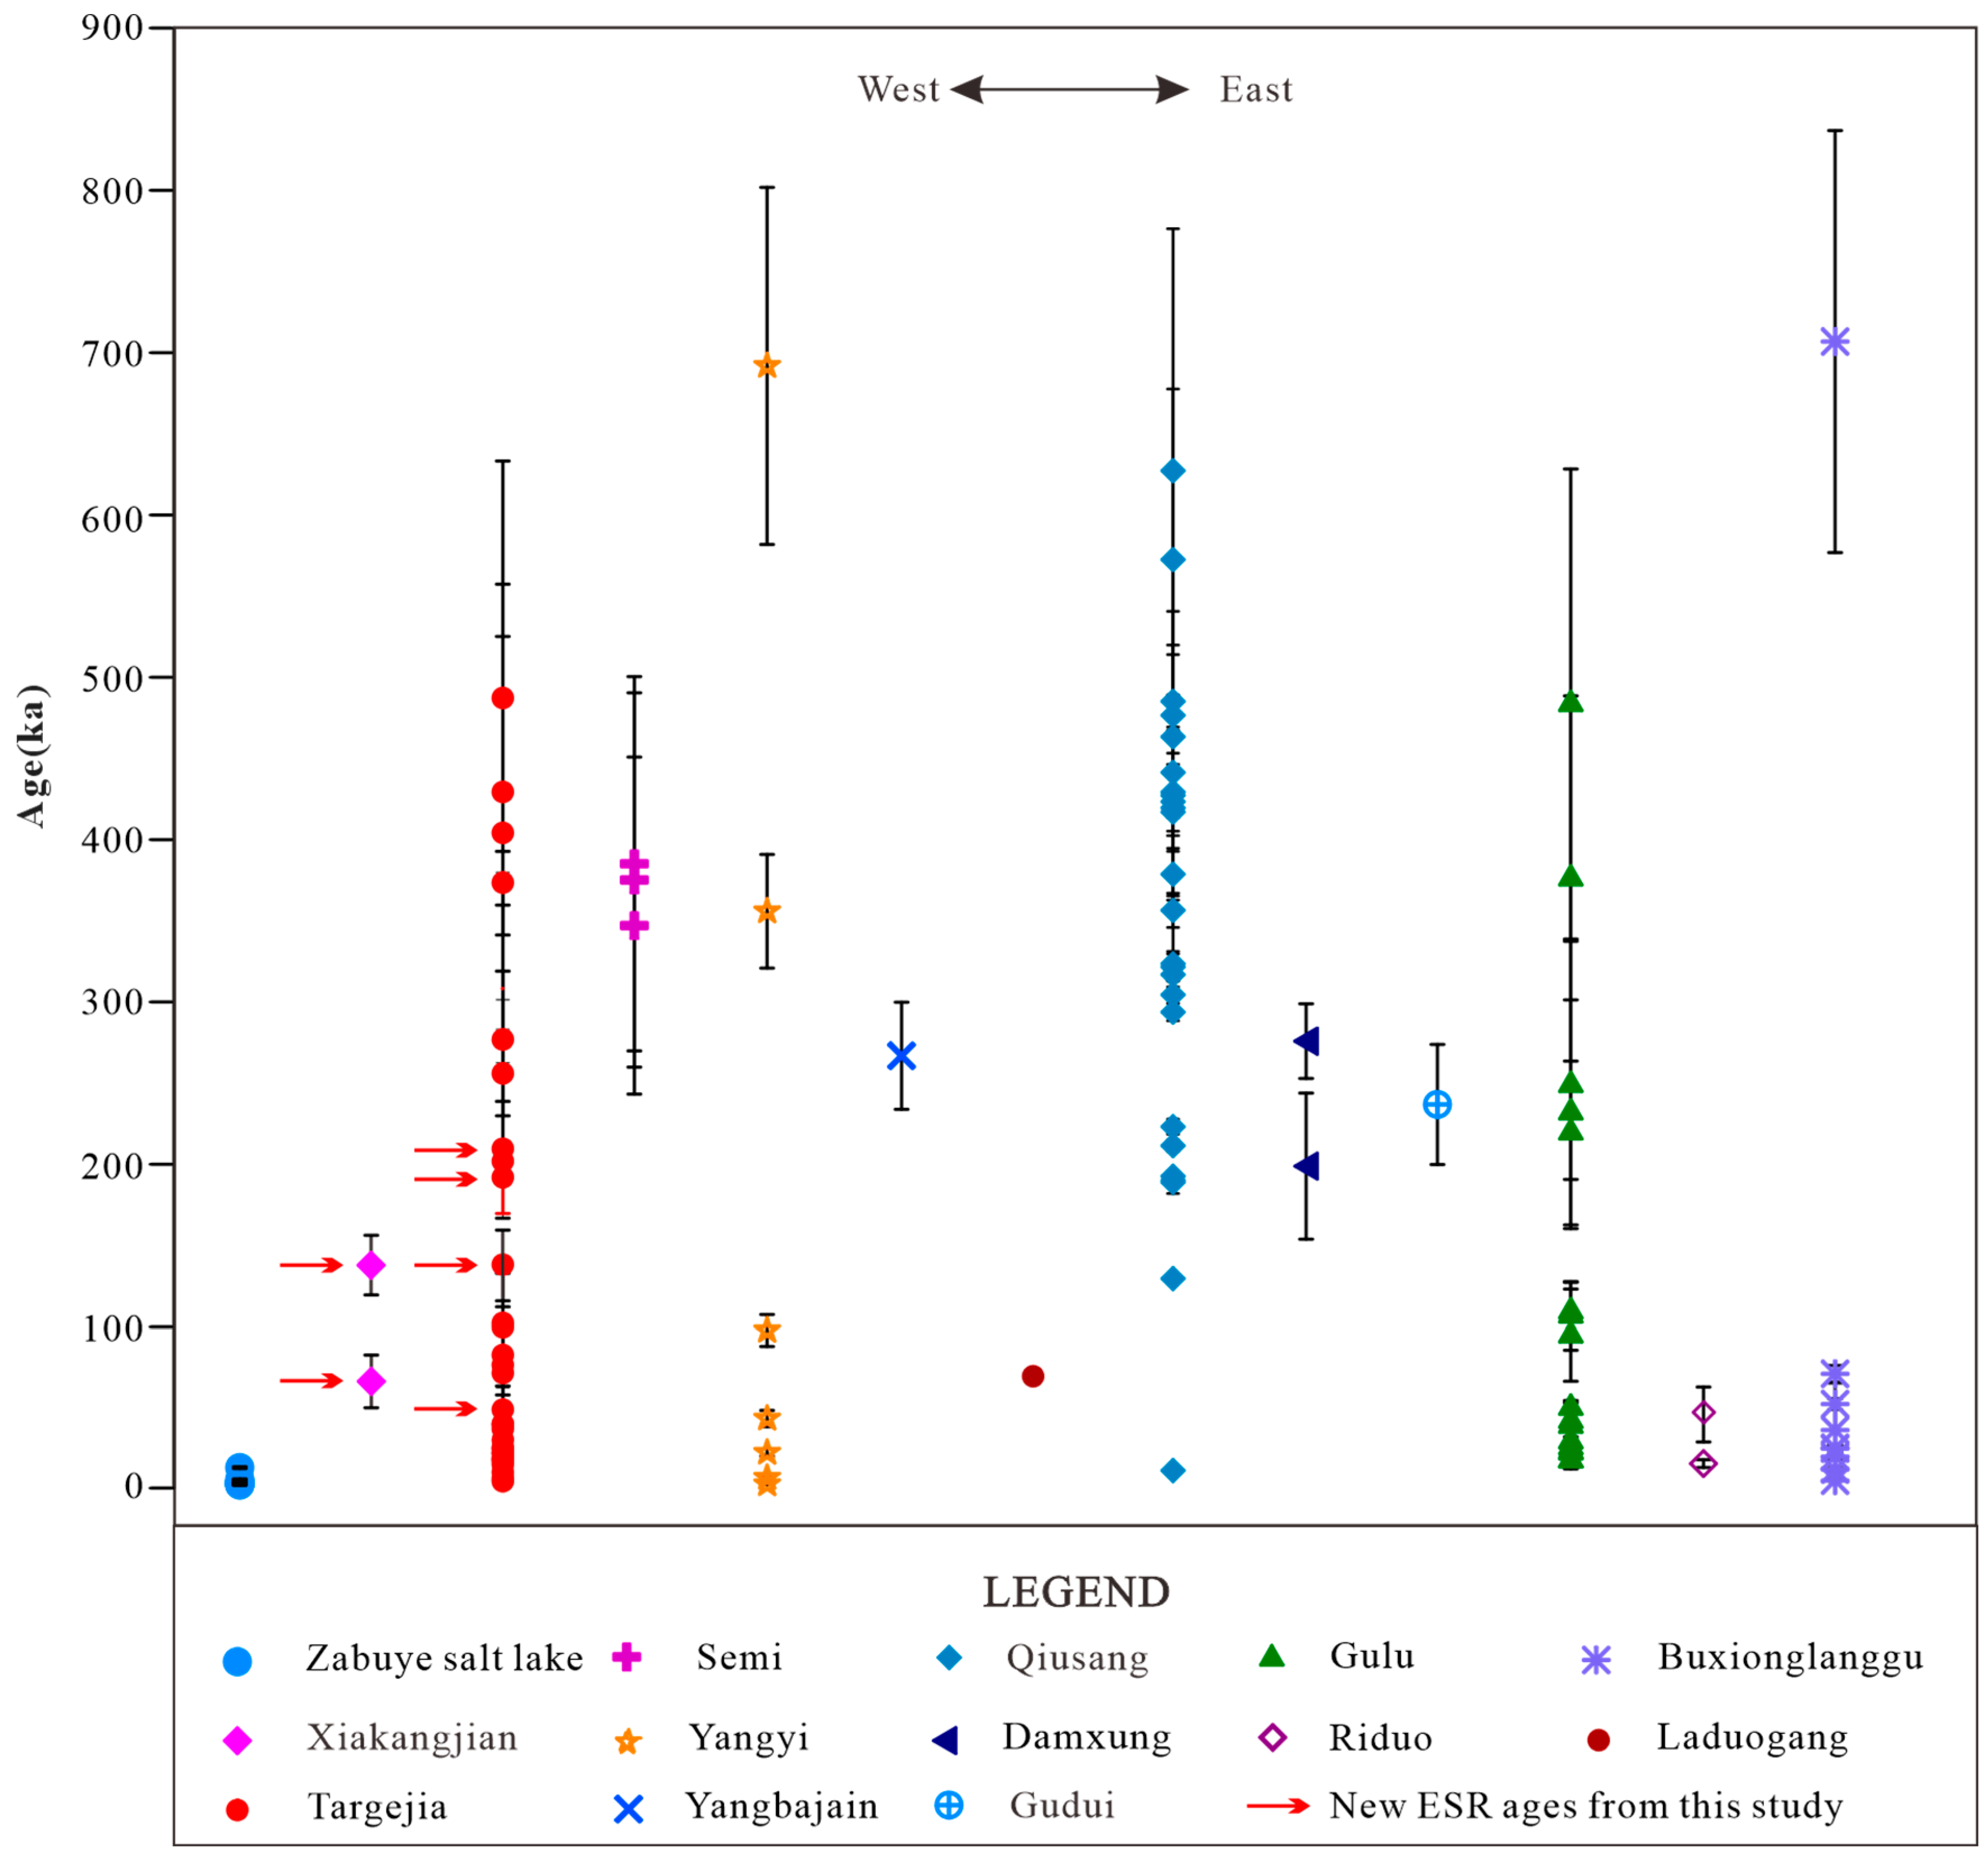
For most studies on silica sinter and travertine formation, it is challenging to obtain abundant ages from a single site or a small number of sites. Even within the same region, silica sinter and travertine typically yield disparate ages [11]. The limitations of a study confined to one geothermal field can be overcome by compiling results from multiple localities to build a regional-scale chronology of sinter formation. In this paper, 114 dates from sinter samples—including our own dates from twelve different areas—are compiled in Figure 9 [6,19,23,24,25,26,44,45]. Among them are 51 ESR ages and 63 uranium-series ages. Only four ages (573.7, 628.6, 691, and 706 kyr) exceed 500 kyr; the remaining dates are all younger than 500 kyr, with many clustering below 100 kyr.
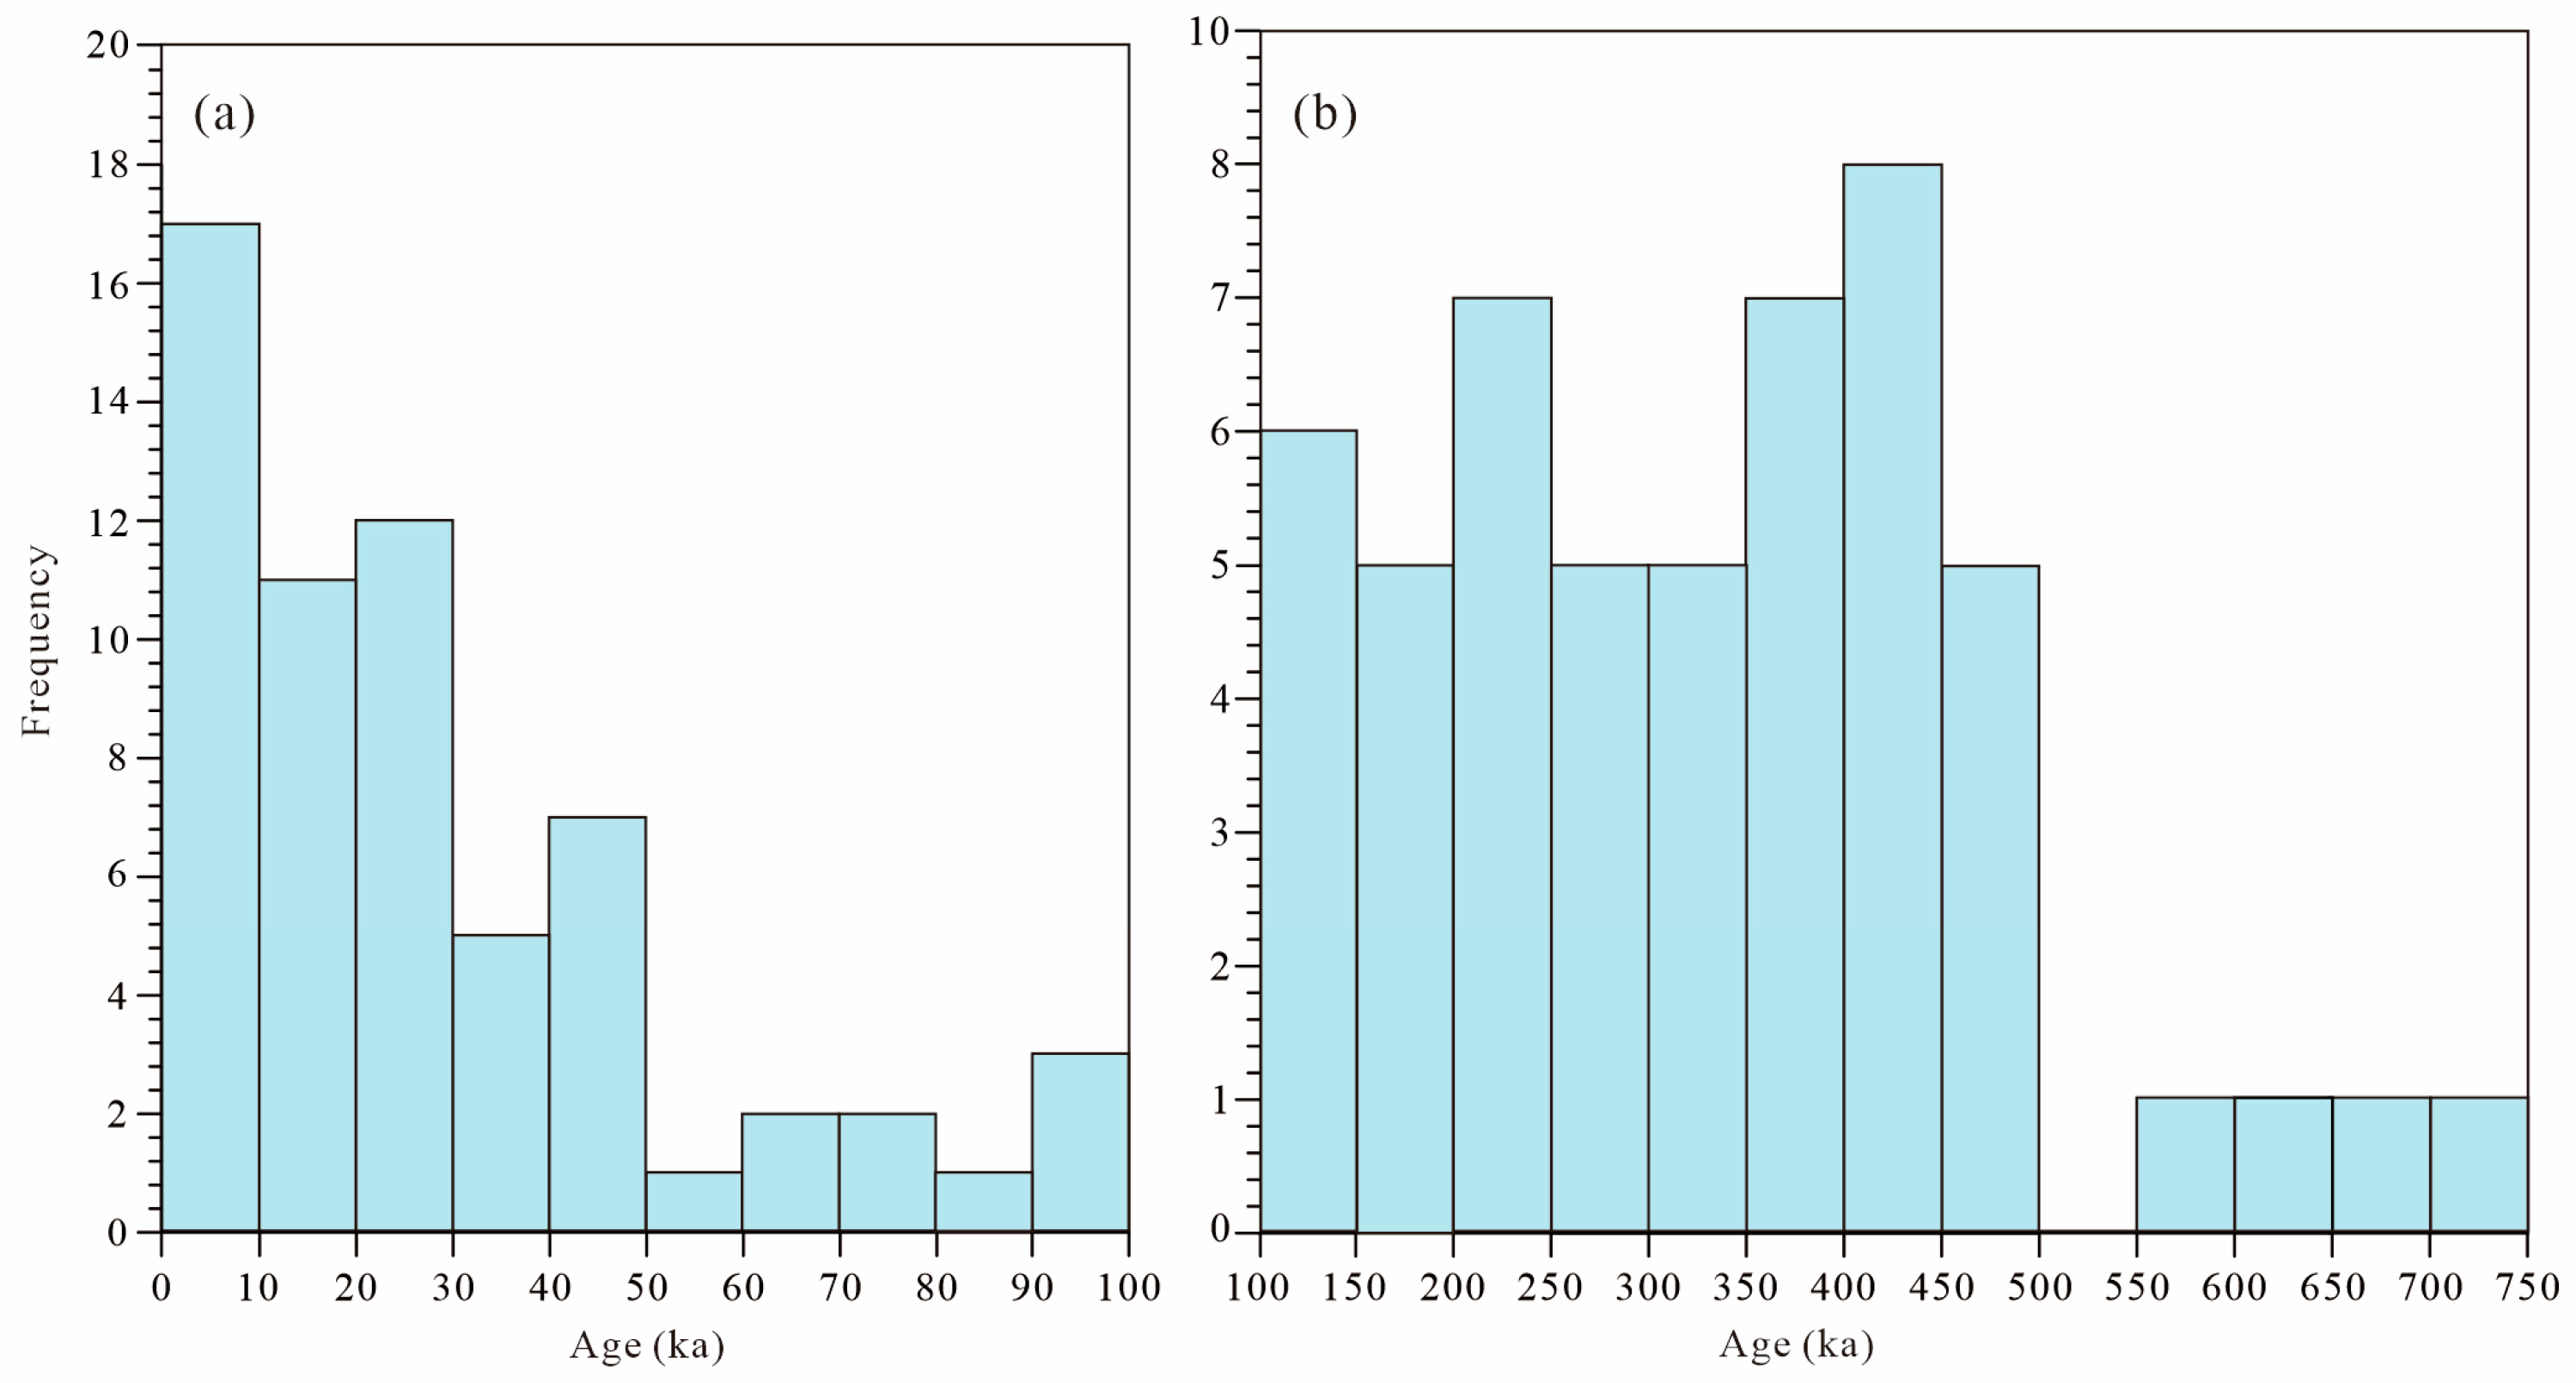
To provide a statistical basis for identifying temporal patterns of sinter deposition, we compiled all available ages (our six new ESR ages plus 108 published ages in previous studies) and grouped them into two time-intervals: 750–100 kyr and 100–0 kyr. Their frequency distributions are presented as histograms in Figure 10, using 50 kyr and 10 kyr bin widths, respectively. These intervals were chosen to better illustrate the data distribution patterns and to improve histogram clarity, rather than to correspond to specific geological periods. These histograms identify age clusters that may represent depositional episodes and provide the basis for comparison with paleoclimate records (Figure 10). As shown in Figure 10b, only four ages fall between 750 and 500 kyr. This does not necessarily imply reduced hydrothermal activity during that interval but may instead reflect post-depositional erosion (although eroded material would be expected to occur as clasts in younger deposits) or methodological limitations. By contrast, relatively more ages are concentrated in two older intervals (450–350 kyr and 250–200 kyr) and, notably, 85% of the ages younger than 100 kyr cluster between 50 and 0 kyr (Figure 10a). This frequency pattern indicates that sinter formation became considerably more widespread over the past 100 kyr.
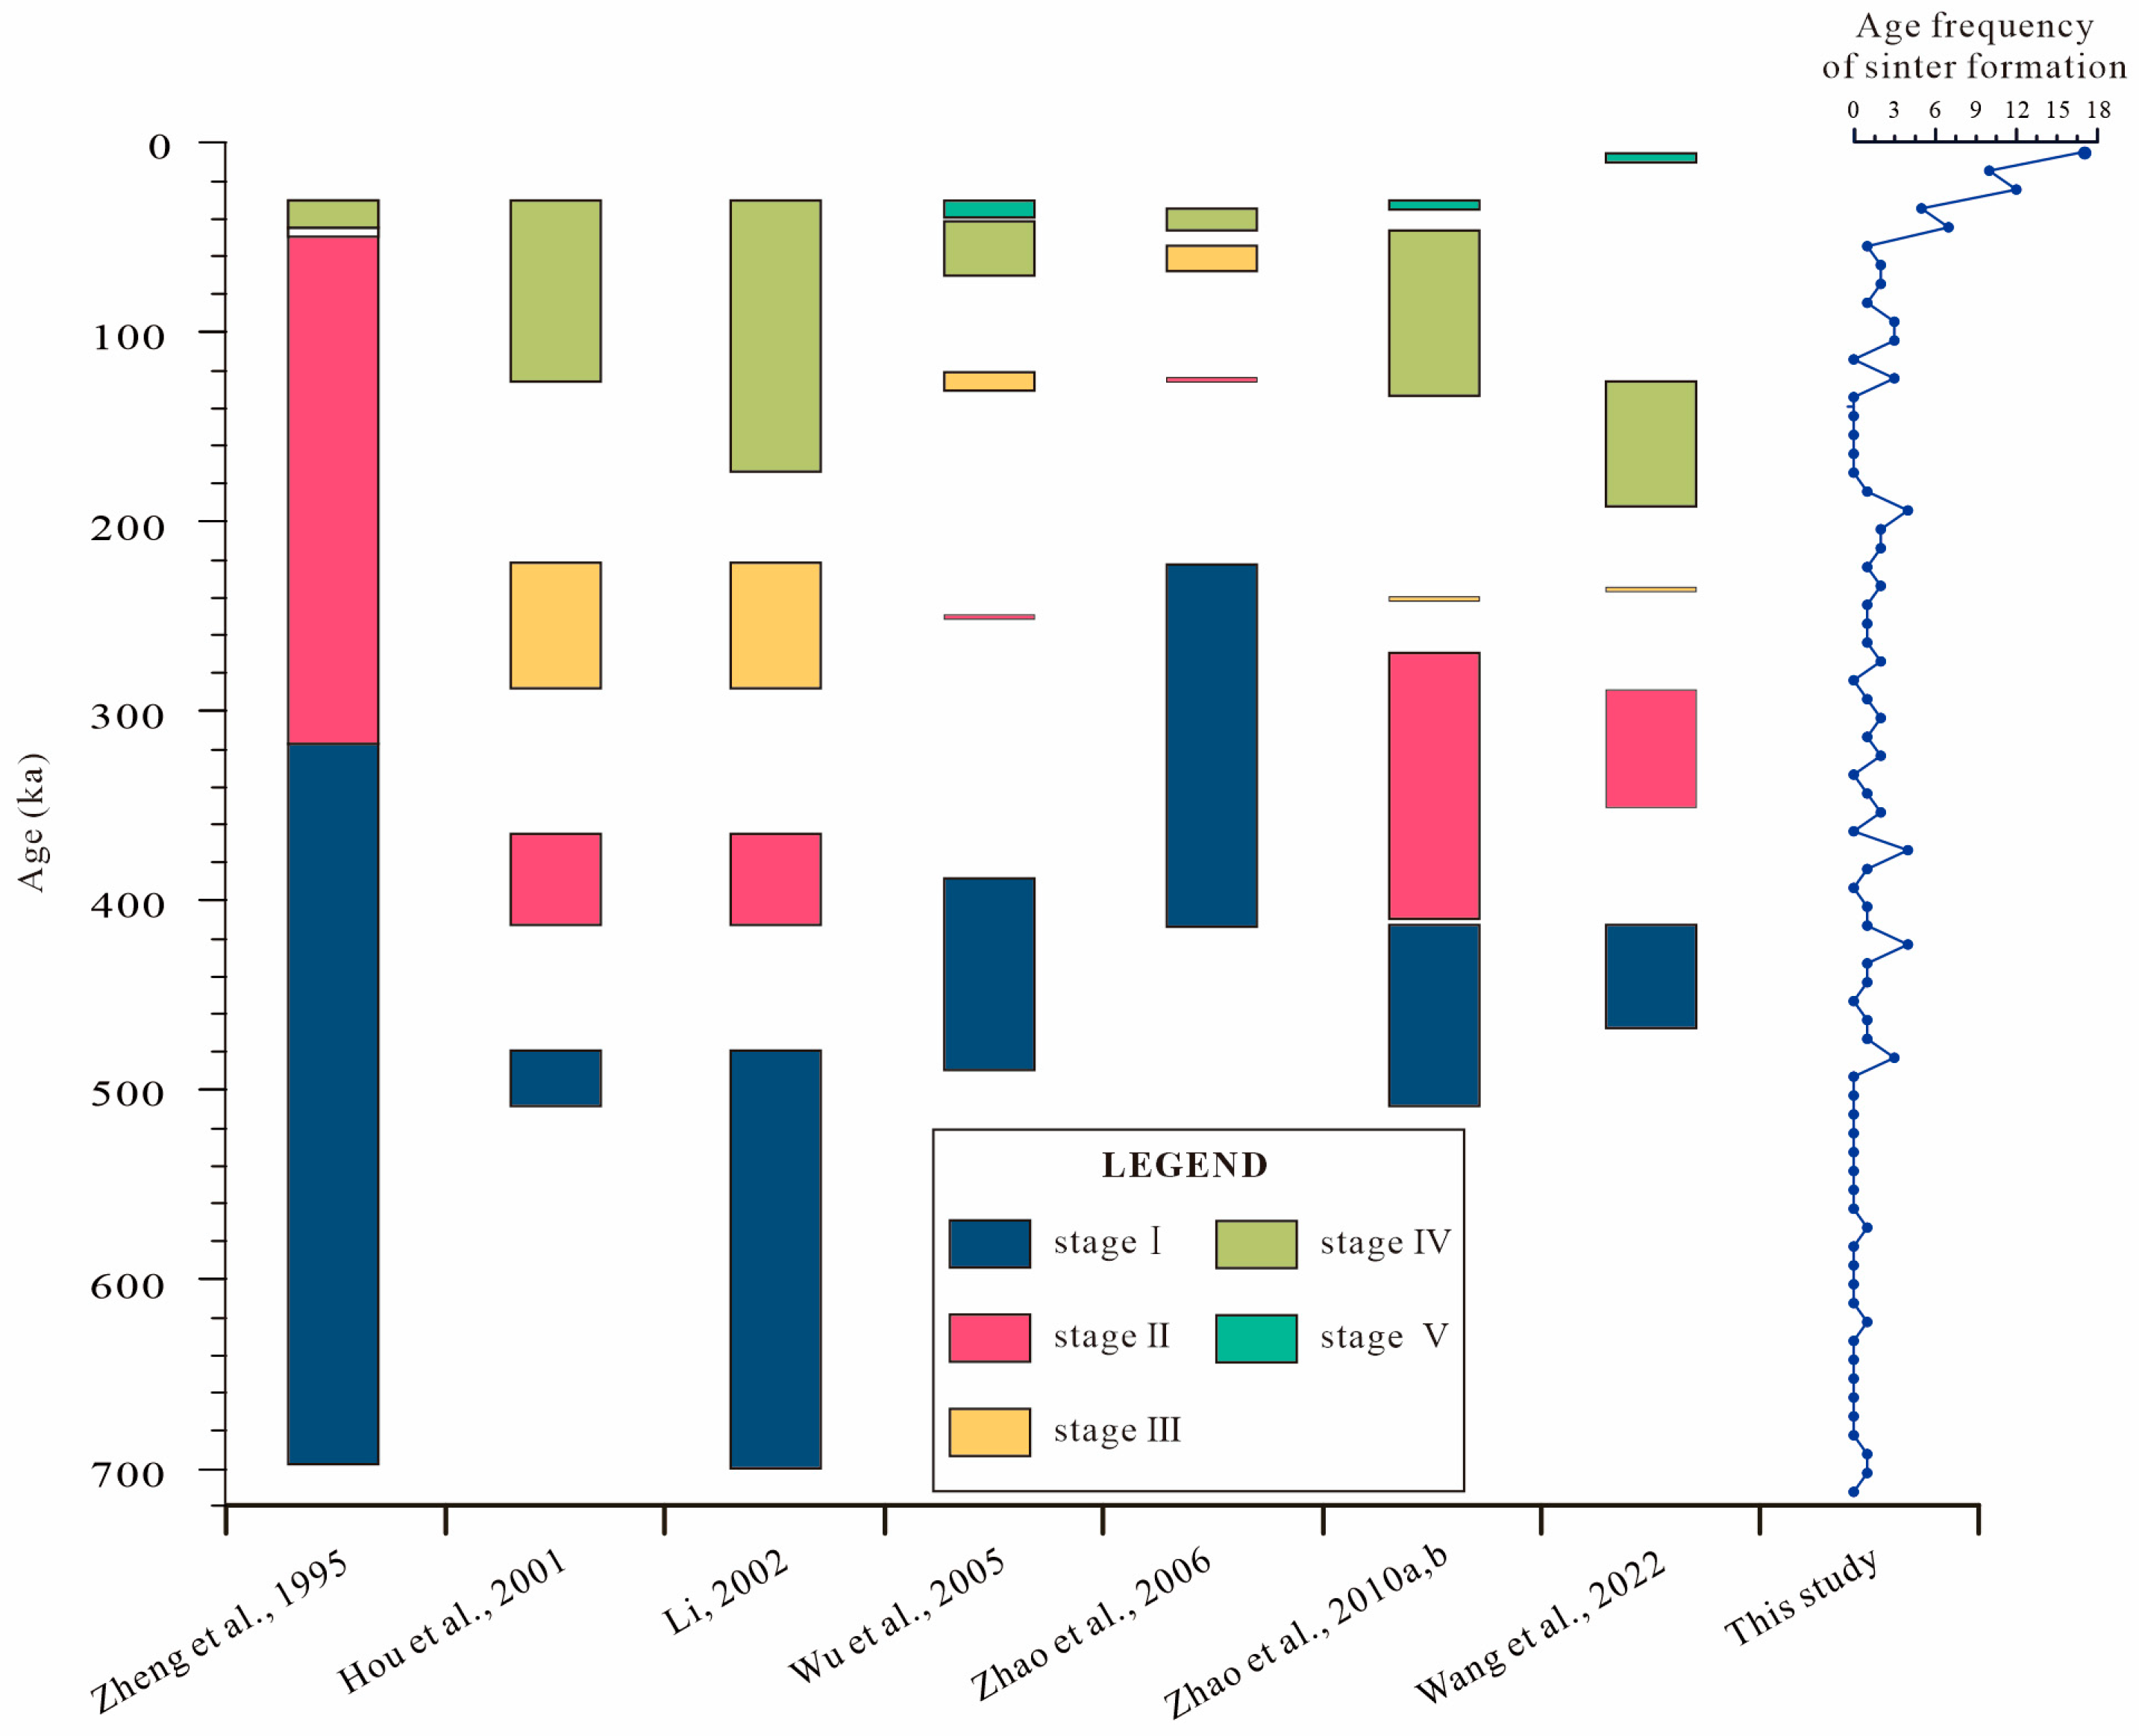
Over the past three decades, at least seven different reconstructions of the timing of hydrothermal activity in southern Tibet have been proposed, all based on ages of silica sinter and travertine [6,11,19,23,25,46,93]. The inferred periods of hydrothermal activity are summarized in Figure 11 (colored bars), where sinter and travertine formation is typically divided into four or five stages.
We interpret the discrepancies among these reconstructions as follows. First, some studies rely on only a few ages from a single area. Second, the onset of hydrothermal activity appears diachronous. Field observations indicate that the oldest silica sinters in the Gangdese belt are the most extensive and thickest [19]. Two ages (706 and 691 kyr) suggest that hydrothermal activity began at about 700 kyr [19]; however, this interpretation requires additional dating for confirmation, especially because the upper limit of uranium-series dating (~600 kyr; [39]) may compromise the accuracy of these older ages. Furthermore, representing the chronology of silica sinter and travertine using a boxplot is inappropriate. If sinter formation was influenced by paleoclimatic change, it could have occurred during any period, and a boxplot inevitably obscures details of paleoclimatic variation, limiting our ability to explore the underlying processes.
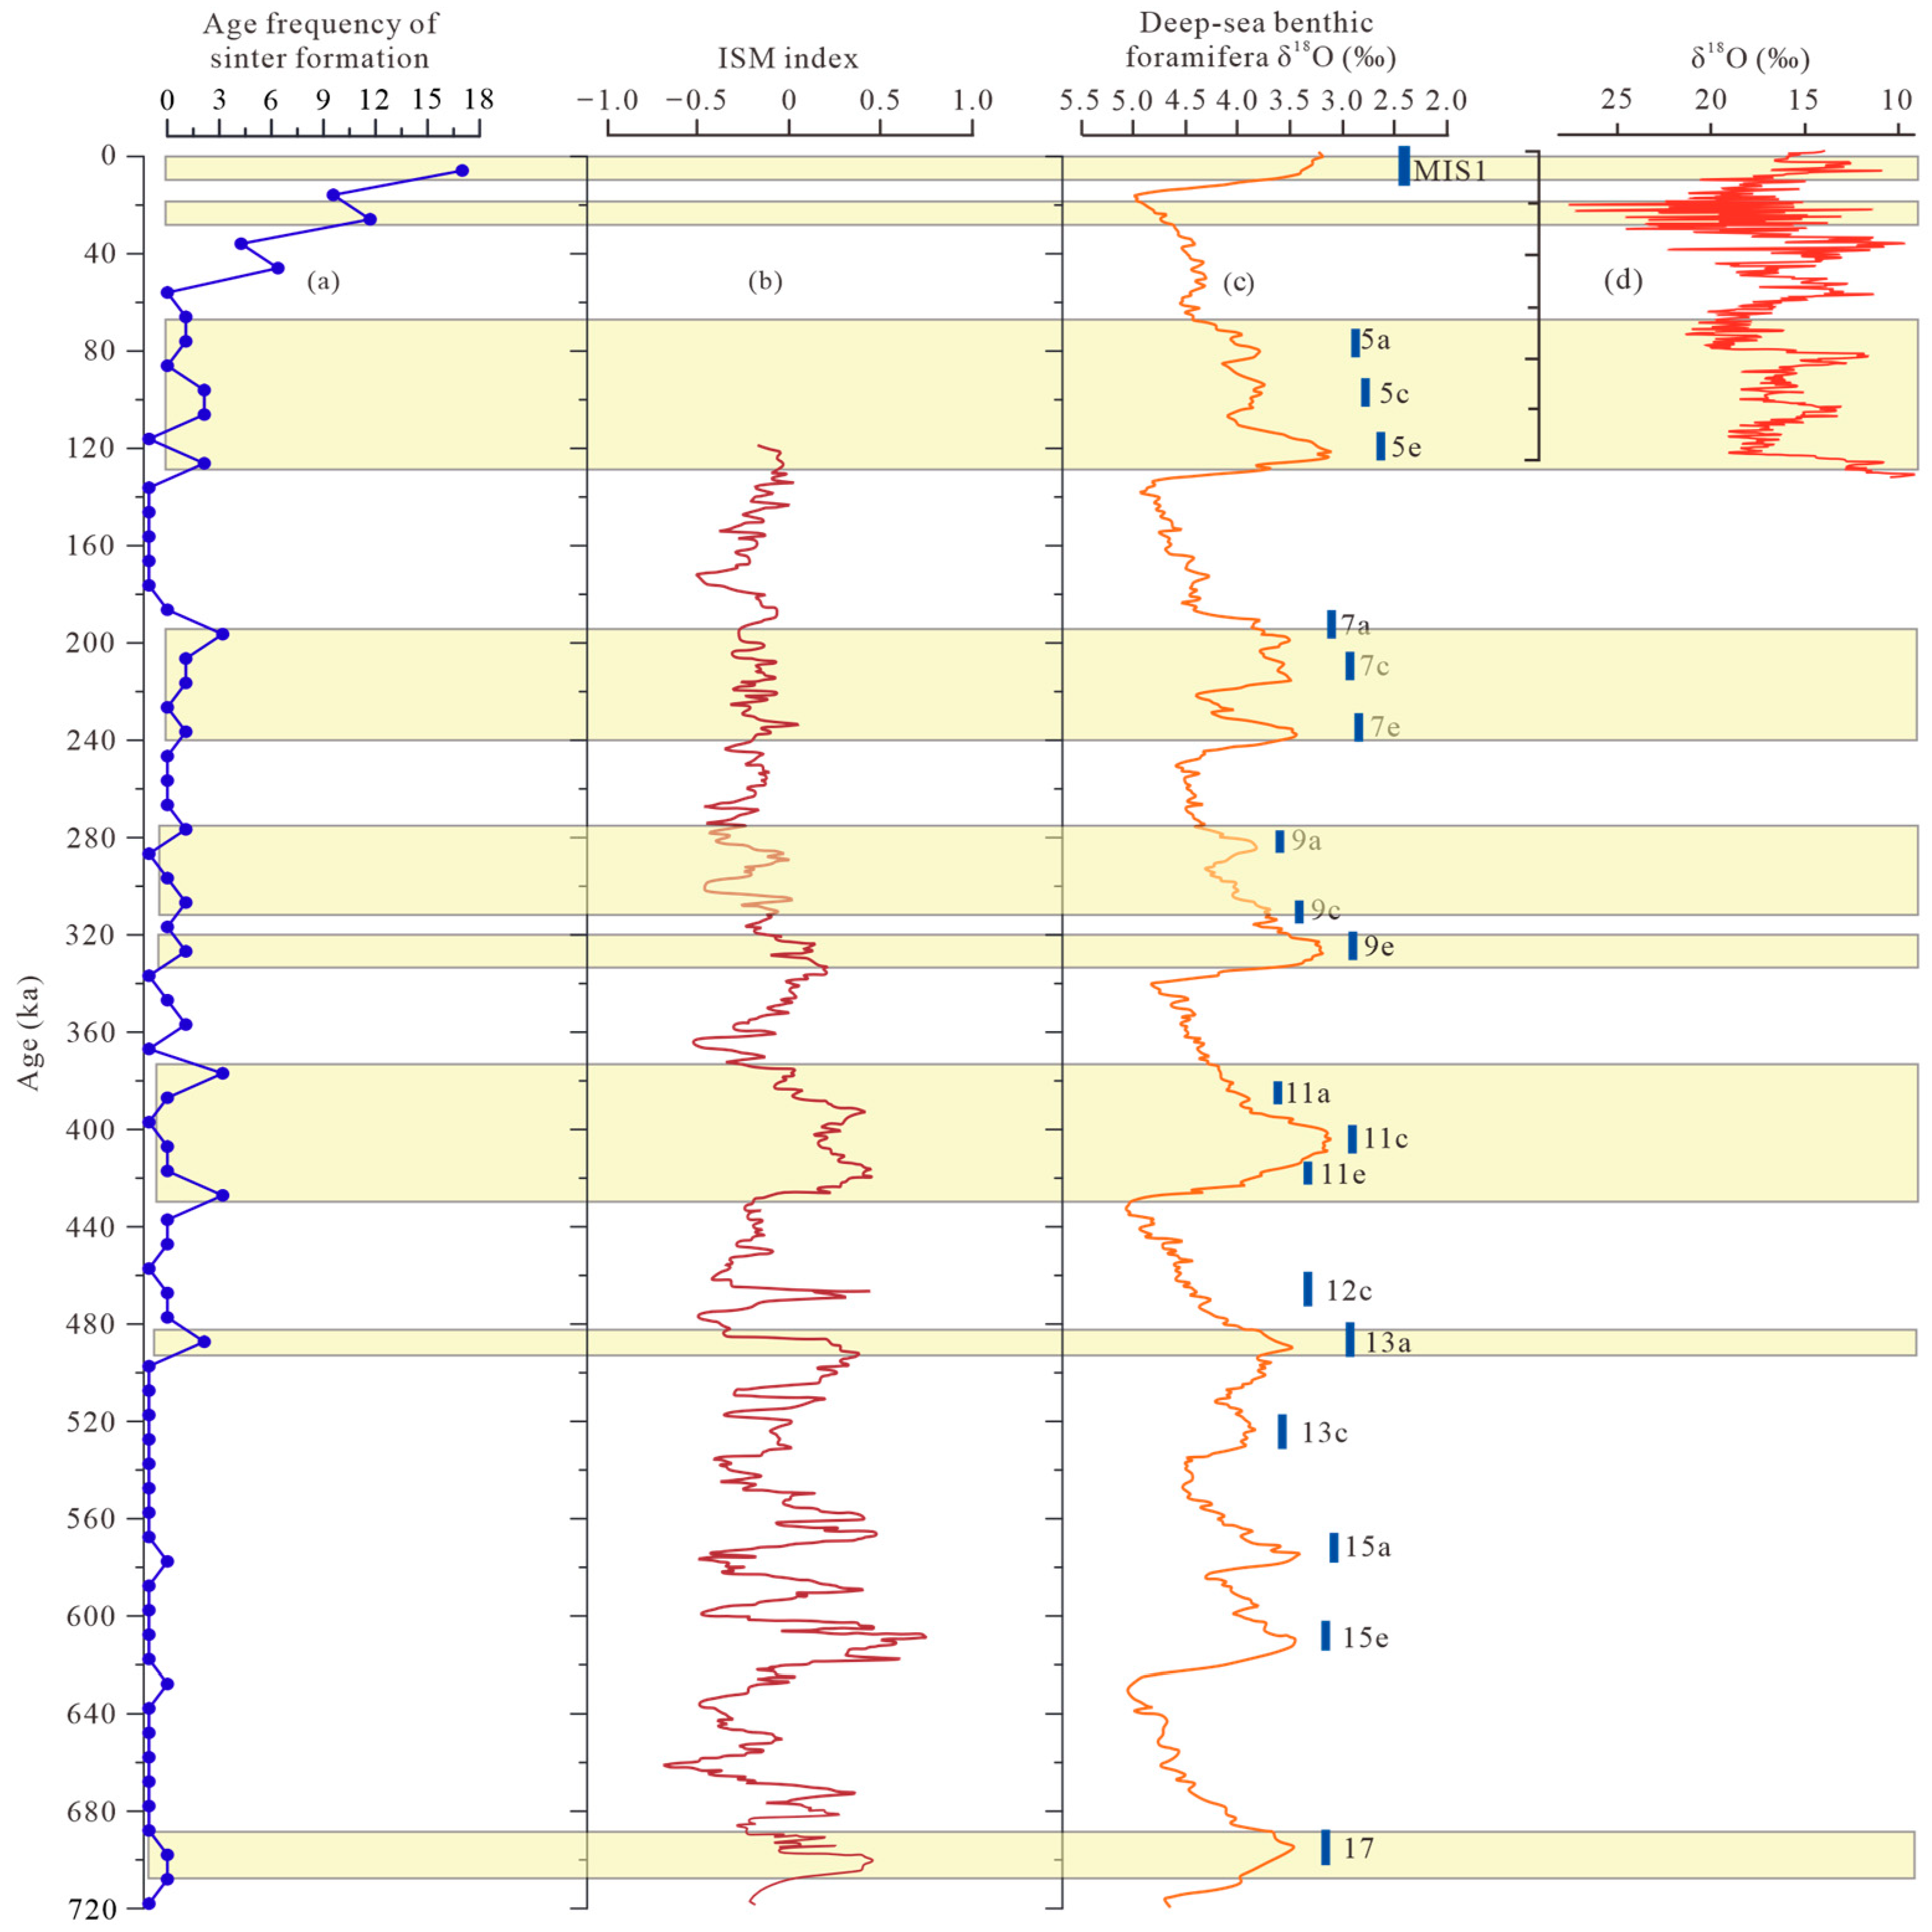
To reduce the influence of uneven sampling and method-specific uncertainty, we compiled the six new ESR ages together with 108 published ages and counted the number of ages in 10 kyr bins for the past 720 kyr. The blue curve in Figure 12 therefore represents age frequency rather than a continuous depositional-rate curve. Intervals with more ages are interpreted as periods when sinter deposition and/or preservation was more common across the compiled sites, whereas intervals with few ages indicate weaker depositional evidence or poorer preservation. The record shows repeated sinter formation since 720 kyr, with most dated deposits younger than 100 kyr. Several higher-frequency intervals correspond broadly to warm and humid interglacial stages, but the comparison is used here only to identify broad temporal clustering. Relative to the stage-based summary in Figure 11, the frequency curve provides a finer view of when dated sinter deposits are concentrated, without requiring the data to be assigned to predefined climatic stages.
It should be acknowledged that the compiled dataset used for the frequency analysis includes ages obtained by different dating methods (ESR, U-series, and radiocarbon), each with its own inherent limitations. As discussed in the Introduction, each dating method has its own limitations. Nevertheless, the observation that similar age clusters recur across multiple sites and independent dating methods suggests that these clusters are unlikely to be purely methodological artefacts. Rather, they appear to reflect genuine episodes of enhanced sinter formation, at least at the scale of broad temporal patterns. We therefore use the compiled data primarily to identify such coarse-scale clusters, not as a precise chronological framework. Our paleoclimatic inference based on these patterns is thus preliminary and will require further testing with additional independently dated samples.

5.3. Relationship Between Paleoclimatic Change and Sinter Formation

Previous studies on hydrothermal deposits in southern Tibet have primarily emphasized tectonic control of sinter formation [6,19,94]. While tectonics clearly governs the spatial distribution of hydrothermal systems, climatic factors may also have influenced the timing of sinter deposition. Atmospheric precipitation has been considered the primary water source for hydrothermal systems in this region [19], and the link between travertine development and climatic change has been examined at Qiusang, where monsoon-driven groundwater recharge was suggested to directly influence travertine formation [11]. Seasonal growth differences in sinters further indicate sensitivity to temperature and precipitation [1,95,96,97,98].
We compared the compiled sinter age-frequency curve with independent paleoclimate records to evaluate whether the timing of sinter formation shows a regional climatic signal (Figure 12). Nine age clusters can be recognized in the frequency curve. Several of them occur near interglacial intervals marked by stronger Indian Summer Monsoon activity and/or lower benthic delta18O values. For example, clusters around ~125 kyr, ~80 kyr, and ~10 kyr occur near MIS 5, MIS 4/3, and MIS 1, respectively. Between 720 and 100 kyr, six higher-frequency intervals also fall close to warm and humid stages. In addition, 52.6% of the compiled ages are younger than 100 kyr, with clusters at 100–70 kyr, 30–20 kyr, and 10–0 kyr.
Figure 12. Visual comparison of sinter age frequency with paleoclimate records. (a) Age-frequency histogram of all compiled sinter ages (binned at 10 kyr), showing the number of ages per bin. The data include our six new ESR ages and 108 published ages [6,11,19,23,25,26,46,92]. (b) Indian Summer Monsoon index from Heqing [99]. (c) Benthic δ18O stack (LR04) [100]. (d) Guliya ice core δ18O record over the past 125 kyr [101,102]. The figure is intended for visual inspection of broad temporal patterns only.
Geosciences 16 00292 g012
These temporal associations suggest that climate may have influenced the timing of sinter deposition, although the mechanism cannot be tested directly with the present dataset. Warmer and wetter intervals could increase precipitation, meltwater input, and groundwater recharge, thereby strengthening hydrothermal circulation and promoting silica or carbonate precipitation [11,103,104]. Changes in temperature, water supply, permafrost thaw, water–rock interaction, and CO2 flux may also affect mineral solubility and spring discharge, which are relevant to sinter formation [14,96,97,105,106].
This interpretation should be treated as preliminary. The compiled ages were obtained by different dating methods and have different uncertainties, and the number of independently dated samples is still too small for a formal statistical test. Preservation bias and sampling intensity may also affect the apparent age clusters. We therefore use the climate comparison as contextual evidence for a possible association, not as proof of a causal relationship. Additional samples dated with more consistent methods are needed to test the proposed climate-sinter link.

6. Conclusions

Based on the newly obtained ESR dating results for Middle–Late Quaternary silica sinter and travertine in southern Tibet, together with the analysis of previously published ages, we draw the following conclusions:
(1) For ESR dating of silica sinter and travertine, accurate ages can be obtained by analyzing the ESR spectra, evaluating the thermal stability of the ESR centers, and assessing the influence of laboratory irradiation.
(2) In this study, sinter samples collected from the Targejia geothermal field and the Xiakangjian hot spring area in southern Tibet were deposited between 209 and 49 kyr.
(3) Combining our new dating results with previously published ages, we constructed a chronology of silica sinter and travertine formation spanning the past 720 kyr. The age-frequency distribution shows that most ages cluster in the past 100 kyr, with several peaks broadly corresponding to warm and humid interglacial intervals. This temporal pattern suggests that climate may have played a role in modulating the timing of sinter deposition, in addition to the tectonic controls that govern their spatial distribution. However, given the limitations of the compiled dataset (different dating methods, variable uncertainties, and limited sample size), this interpretation remains preliminary and requires further testing with additional independently dated samples.

Author Contributions

Conceptualization, methodology, writing—original draft preparation and review and editing, and funding acquisition, T.L.; data curation and visualization: S.W.; investigation and data curation, Z.W. and K.W.; review and data curation, M.L. All authors have read and agreed to the published version of the manuscript.

Funding

This research was funded by the Basic Science Foundation of Geomechanics, grant numbers DZLXJK202513 and DZLXJK202301.

Data Availability Statement

Data will be available upon request.

Acknowledgments

We thank the Editor and three anonymous reviewers for their constructive comments and suggestions, which have greatly improved our manuscript. Special thanks are extended to Yang Gao for participating in the field sampling work and providing valuable help during the research.

Conflicts of Interest

The authors declare no conflicts of interest.

Abbreviations

The following abbreviations are used in this manuscript:
DeEquivalent dose
DmaxMaximum added dose

References

  1. Ford, T.D.; Pedley, H.M. A review of tufa and travertine deposits of the world. Earth-Sci. Rev. 1996, 41, 117–175. [Google Scholar] [CrossRef]
  2. Jones, B. Siliceous sinters in thermal spring systems: Review of their mineralogy, diagenesis, and fabrics. Sediment. Geol. 2021, 413, 1–28. [Google Scholar] [CrossRef]
  3. Rowe, M.C.; Campbell, K.A.; Hamilton, A.; Jiang, Y.; Pelser, J.; Murphy, B.; Martin, R.; Mackenzie, K.M.; Stallard, D.A.; Lyon, B.; et al. Life and death of a sinter archive: Evolution of siliceous hot-spring deposits (Holocene) on the dynamic Paeroa Fault at Te Kopia, Taupo Volcanic Zone, New Zealand. J. Volcanol. Geotherm. Res. 2025, 465, 108380. [Google Scholar] [CrossRef]
  4. Pentecost, A. Travertine; Springer: Dordrecht, The Nethelands, 2005; pp. 1–448. [Google Scholar]
  5. Brogi, A.; Capezzuoli, E.; Buracchi, E.; Branca, M. Tectonic control on travertine and calcareous tufa deposition in a low-temperature geothermal system (Sarteano, Central Italy). J. Geol. Soc. 2012, 169, 461–476. [Google Scholar] [CrossRef]
  6. Hou, Z.Q.; Li, Z.Q.; Qu, X.M.; Gao, Y.F.; Hua, L.C.; Zhen, M.P.; Li, S.R.; Yuan, W.M. Uplift processes of the Tibetan Plateau since 0.5 Ma: Evidence from hydrothermal activity in Gangdese belt. Sci. China Earth Sci. 2001, 31, 27–33. [Google Scholar]
  7. Croci, A.; Della Porta, G.; Capezzuoli, E. Depositional architecture of a mixed travertine-terrigenous system in a fault-controlled continental extensional basin (Messinian, Southern Tuscany, Central Italy). Sediment. Geol. 2016, 332, 13–39. [Google Scholar] [CrossRef]
  8. Lynne, B.Y.; Campbell, K.A.; Moore, J.; Browne, R.L. Origin and evolution of the Steamboat Springs silica sinter deposit, Nevada, U.S.A. Sediment. Geol. 2008, 210, 111–131. [Google Scholar] [CrossRef]
  9. Brogi, A.; Capezzuoli, E.; Aqué, R.; Branca, M.; Voltaggio, M. Studying travertines for neotectonics investigations: Middle–Late Pleistocene syn-tectonic travertine deposition at Serre di Rapolano (Northern Apennines, Italy). Int. J. Earth Sci. 2010, 99, 1383–1398. [Google Scholar] [CrossRef]
  10. Wang, Z.J.; Meyer, M.C.; Hoffmann, D.L. Sedimentology, petrography and early diagenesis of a travertine-colluvium succession from Chusang (southern Tibet). Sediment. Geol. 2016, 34, 218–236. [Google Scholar] [CrossRef]
  11. Wang, Z.J.; Yin, J.J.; Cheng, H.; Ning, Y.F.; Meyer, M.C. Climatic controls on travertine deposition in southern Tibet during the late Quaternary. Palaeogeogr. Palaeoclimatol. Palaeoecol. 2022, 589, 110852. [Google Scholar] [CrossRef]
  12. Tao, P.; Shao, M.Y.; Zeng, S.B.; Bao, Q.; Rasheed, M.A.; Shi, L.X.; Zhang, Y.R.; Liu, Z.H. Drivers and environmental effects of tufa/travertine deposition: A review. Appl. Geochem. 2026, 203, 106791. [Google Scholar] [CrossRef]
  13. Qiu, S.B.; Wang, F.D.; Dong, F.Q.; Tian, F.; Zhao, X.Q.; Dai, Q.W.; Li, Q.F.; Zhu, Y.Y.; Wang, Y.W. Sedimentary evolution of the Dawan travertines and their geological environmental significance, Huanglong, China. Depos. Rec. 2021, 8, 251–265. [Google Scholar] [CrossRef]
  14. Deev, E.V.; Kokh, S.N.; Dublyansky, Y.; Sokol, E.V.; Scholz, D.; Rusanov, G.; Reutsky, V.N. Tavertines of the South-Eastern Gorny Altai (Russia): Implications for paleoseismology and paleoenvironmental conditions. Minerals 2023, 13, 259. [Google Scholar] [CrossRef]
  15. Garzanti, E. Stratigraphy and sedimentary history of the Nepal Tethys Himalaya passive margin. J. Asian Earth Sci. 1999, 17, 805–827. [Google Scholar] [CrossRef]
  16. Yin, A. Cenozoic evolution of the Himalayan Orogen as constrained by along strike variations of structural geometry, exhumation history, and foreland sedimentation. Earth-Sci. Rev. 2006, 76, 1–134. [Google Scholar] [CrossRef]
  17. Li, D.W. Temporal-spatial structure of intraplate uplift in the Qinghai-Tibet Plateau. Acta Geol. Sin. (Engl.) 2010, 84, 105–134. [Google Scholar] [CrossRef]
  18. Tong, W.; Zhang, M.T.; Zhang, Z.F.; Liao, Z.J.; You, M.Z.; Zhu, M.X.; Guo, G.Y.; Liu, S.B. Geothermal Resources in the Tibet; Sciences Press: Beijing, China, 1981; pp. 1–170. [Google Scholar]
  19. Li, Z.Q. Present Hydrothermal Activities During Collisional Orogenics of the Tibetan Plateau. Doctoral Thesis, Chinese Academy of Geological Sciences, Beijing, China, 2002. [Google Scholar]
  20. Wang, P.; Chen, X.H.; Shen, L.C.; Xiao, Q.; Wu, X.Q. Reservoir temperature of geothermal anomaly area and its environmental effect in Tibet. China Geol. 2016, 43, 1429–1438. [Google Scholar] [CrossRef]
  21. Lü, Y.Y.; Zheng, M.P.; Zhao, P.; Xu, R.H. Geochemical processes and origin of boron isotopes in geothermal water in the Yunnan-Tibet geothermal zone. Sci. China Earth Sci. 2014, 57, 2934–2944. [Google Scholar] [CrossRef]
  22. Wang, G.C.; Cao, K.; Wang, A.; Shen, T.Y.; Zhang, K.X.; Wang, L.Q. On the geodynamic mechanism of episodic uplift of the Tibetan Plateau during the Cenozoic era. Acta Geol. Sin. (Engl.) 2014, 88, 699–716. [Google Scholar] [CrossRef]
  23. Zhao, Y.Y.; Zhao, X.T.; Ma, Z.B.; Deng, J. Chronology of the Gulu hot spring cesium deposit in Nagqu, Tibet and its Geological Significance. Acta Geol. Sin. (Engl.) 2010, 84, 211–220. [Google Scholar]
  24. Wang, X. The Geochemical Characteristic and Indicating Meaning of Sinters in the Yangyi Geothermal Field, Tibet. Doctoral Thesis, Chinese Academy of Geological Sciences, Beijing, China, 2018. [Google Scholar]
  25. Zhao, Y.Y.; Nie, F.J.; Hou, Z.Q.; Li, Z.Q.; Zhao, X.T.; Ma, Z.B. Geological characteristics and formation age of hot spring cesium deposit in Targejia area, Tibet. Miner. Depos. 2006, 25, 281–291. [Google Scholar] [CrossRef]
  26. Zhao, Y.Y.; Cui, Y.B.; Zhao, X.T. Geological and geochemical features and significance of travertine in travertine-island from Zhabuye salt lake, Tibet, China. Geol. Bull. China 2010, 29, 124–141. [Google Scholar] [CrossRef]
  27. Slagter, S.; Reich, M.; Munoz-Saez, C.; Southon, J.; Morata, D.; Barra, F.; Gong, J.; Skok, J.R. Environmental controls on silica sinter formation revealed by radiocarbon dating. Geology 2019, 47, 330–334. [Google Scholar] [CrossRef]
  28. Churchill, D.M.; Manga, M.; Hurwitz, S.; Peek, S.; Licciardi, J.M.; Paces, J.B. Dating silica sinters (geyserite): A cautionary tale. J. Volcanol. Geotherm. Res. 2020, 402, 106991. [Google Scholar] [CrossRef]
  29. Sankovitch, L.; Munoz-Saez, C.; Hudson, A.M.; Godfrey, L.; Thompson, J.M. Applying U-Th disequilibrium for dating siliceous sinters. J. Volcanol. Geotherm. Res. 2025, 462, 108324. [Google Scholar] [CrossRef]
  30. Auler, A.S.; Smart, P.L. Late Quaternary paleoclimate in semiarid northeastern Brazil from U-series dating of travertine and water-table speleothems. Quat. Res. 2001, 55, 159–167. [Google Scholar] [CrossRef]
  31. Mallick, R.; Frank, N. A new technique for precise uranium-series dating of travertine micro-samples. Geochim. Cosmochim. Acta 2002, 66, 4261–4272. [Google Scholar] [CrossRef]
  32. Grün, R.; Schwarcz, H.P.; Ford, D.C.; Hentzsch, B. ESR dating of spring deposited travertines. Quat. Sci. Rev. 1988, 7, 429–432. [Google Scholar] [CrossRef]
  33. Grün, R. Electron spin resonance (ESR) dating. Quat. Int. 1989, 1, 65–109. [Google Scholar] [CrossRef]
  34. Grün, R. Potential and problems of ESR dating. Nucl. Tracks Radiat. Meas. 1991, 143–153. [Google Scholar] [CrossRef]
  35. Grün, R. Electron spin resonance dating. In Chronometric Dating in Archaeology, 2nd ed.; Taylor, R.E., Aitken, M.J., Eds.; Springer: New York, NY, USA, 1997; pp. 217–260. [Google Scholar]
  36. Skinner, A.R. ESR dating: Is it still an ‘experimental’ technique? Appl. Radiat. Isot. 2000, 52, 1311–1316. [Google Scholar] [CrossRef] [PubMed]
  37. Neymark, L.A.; Amelin, Y.; Paces, J.B.; Peterman, Z.E. U-Pb ages of secondary silica at Yucca Mountain, Nevada: Implications for the paleohydrology of the unsaturated zone. Appl. Geochem. 2002, 17, 709–734. [Google Scholar] [CrossRef]
  38. Neymark, L.A.; Paces, J.B. Ion-probe U–Pb dating of authigenic and detrital opal from Neogene-Quaternary alluvium. Earth Planet. Sci. Lett. 2013, 361, 98–109. [Google Scholar] [CrossRef]
  39. Dorale, J.A.; Edwards, R.L.; Alexander, E.C.; Shen, C.C.; Richards, D.A.; Cheng, H. Uranium-Series Dating of Speleothems: Current Techniques, Limits, and Applications; Springer: New York, NY, USA, 2004; pp. 177–197. [Google Scholar]
  40. Li, B.; Li, Y.M.; Pang, Z.H.; Huang, T.M.; Gao, B.B. Dating methods for travertine and siliceous sinter in geothermal systems: Progress and applications. Coal Geol. Explor. 2024, 52, 14–25. [Google Scholar] [CrossRef]
  41. Ikeya, M. New Applications of Electron Spin Resonance: Dating, Dosimetry and Microscopy; World Scientific: Singapore, 1993; pp. 1–520. [Google Scholar]
  42. Jonas, M. Concepts and methods of ESR dating. Radiat. Meas. 1997, 27, 943–973. [Google Scholar] [CrossRef]
  43. Bassiakos, Y. Assessment of the lower ESR dating range in Greek speleothems. J. Radioanal. Nucl. Chem. 2001, 247, 629–633. [Google Scholar] [CrossRef]
  44. Chen, Y.J.; Brumby, S.; Gao, J. A preliminary study on the history of hydrothermal activities occurred in Southern Tibetan. Hydrogeol. Eng. Geol. 1992, 19, 18–21. [Google Scholar]
  45. Chen, Y.J.; Gao, J.C.; Feng, J.J. ESR dating of geyserites from intermittent geyser sites on the Tibetan Plateau. Appl. Radiat. Isot. 1993, 44, 207–213. [Google Scholar] [CrossRef]
  46. Zheng, M.P.; Wang, Q.X.; Duo, J.; Liu, J. A New Type of Hydrothermal Deposit-Cesium-Bearing Geyserite in Tibet; Geology Press: Beijing, China, 1995; pp. 1–105. [Google Scholar]
  47. Rink, W.J. Electron spin resonance (ESR) dating and ESR applications in Quaternary science and archaeometry. Radiat. Meas. 1997, 27, 975–1025. [Google Scholar] [CrossRef]
  48. Toyoda, S.; Voinchet, P.; Christophe Falguères, C.; Dolo, J.M.; Laurent, M. Bleaching of ESR signals by the sunlight: A laboratory experiment for establishing the ESR dating of sediments. Appl. Radiat. Isot. 2000, 52, 1357–1362. [Google Scholar] [CrossRef] [PubMed]
  49. Duval, M.; Arnold, L.J.; Rixhon, G. Electron spin resonance (ESR) dating in Quaternary studies: Evolution, recent advances and applications. Quat. Int. 2020, 556, 1–10. [Google Scholar] [CrossRef]
  50. Ji, H.; Liu, C.R.; Zhang, P.Q. The upper dating limit of the ESR signal at g = 2.0006 in recrystallized carbonates. Radiat. Meas. 2022, 157, 106830. [Google Scholar] [CrossRef]
  51. Li, Y.W.; Wei, C.Y.; Li, C.A.; Guo, R.J.; Liu, C.R.; Zhang, Y.F. Application and evaluation of multiple-centres ESR dating of Pliocene-Quaternary fluvial sediments: A case study from the Zhoulao core from the Jianghan Basin, middle Yangtze River basin, China. Quat. Geochronol. 2022, 70, 101297. [Google Scholar] [CrossRef]
  52. Mahmud, H.H.; Mansour, A.; Ezz-eldin, F.M. Generation and bleaching of E′-centers induced in a-SiO2 by γ-irradiation. J. Radioanal. Nucl. Chem. 2014, 302, 261–272. [Google Scholar] [CrossRef]
  53. Li, X.X.; Liu, C.R.; Ji, H.; Wei, C.Y. Response characteristics of travertine ESR signal to different artificial irradiation dose rates. Quat. Sci. 2022, 42, 1443–1449. [Google Scholar] [CrossRef]
  54. Barabas, M.; Mudelsee, M.; Walther, R.; Mangini, A.A. Dose-response and thermal behavior of the ESR signal at g = 2.006 in carbonates. Quat. Sci. Rev. 1992, 11, 173–179. [Google Scholar] [CrossRef]
  55. Bahain, J.J.; Yokoyama, Y.J.; Masaoudi, H.; Falgueres, C.; Laurent, M. Thermal behavior of ESR signals observed in various natural carbonates. Quat. Geochronol. 1994, 13, 671–674. [Google Scholar] [CrossRef]
  56. Ji, H.; Liu, C.R.; Wei, C.Y.; Yin, G.M. Optical bleaching and thermal stability of ESR signals in fault-related carbonates. Radiat. Phys. Chem. 2024, 218, 111584. [Google Scholar] [CrossRef]
  57. Chang, C.F.; Pan, Y.S.; Sun, Y.Y. The Tectonic Evolution of Qinghai-Tibet Plateau: A Review. In Tectonic Evolution of the Tethyan Region; NATO ASI Series; Springer: Dordrecht, The Netherlands, 1989; Volume 259, pp. 415–476. [Google Scholar]
  58. Tao, X.F.; Liu, D.Z.; Zhu, L.D. Tectonic landform characteristics and formation mechanism of Xiakangjian Jokul in Tibet, China. J. Chengdu Univ. Technol. (Sci. Technol. Ed.) 2004, 31, 129–132. [Google Scholar]
  59. Liu, X. ESR dating and its geological significance of travertine in the stone forest, Yunnan Province. Carsologica Sin. 1998, 17, 9–14. [Google Scholar]
  60. Jia, L.; Bao, J.F.; Yin, G.M.; Liu, J.W.; Li, J.P. Study on ESR signal centers and measurement conditions for dating of calcite. Seismol. Res. Lett. 2006, 28, 668–673. [Google Scholar]
  61. Duval, M.; Guilarte Moreno, V.; Grün, R. ESR dosimetry of fossil enamel: Some comments about measurement precision, Long-Term signal fading and dose-response curve fitting. Radiat. Prot. Dosim. 2013, 157, 463–476. [Google Scholar] [CrossRef] [PubMed]
  62. Duval, M.; Guilarte, V. ESR dosimetry of optically bleached quartz grains extracted from Plio-Quaternary sediment: Evaluating some key aspects of the ESR signals associated to the Ti-centers. Radiat. Meas. 2015, 78, 28–41. [Google Scholar] [CrossRef]
  63. Grün, R.; Brumby, S. The assessment of errors in past radiation doses extrapolated from ESR/TL dose-response data. Radiat. Meas. 1994, 23, 307–315. [Google Scholar] [CrossRef]
  64. Duval, M.; Grün, R.; Falguères, C.; Bahain, J.J.; Dolo, J.M. ESR dating of Lower Pleistocene fossil teeth: Limits of the single saturating exponential (SSE) function for the equivalent dose determination. Radiat. Meas. 2009, 44, 477–482. [Google Scholar] [CrossRef]
  65. Duval, M.; Arnold, L.J.; Guilarte, V.; Demuro, M.; Santonja, M.; Pérez-González, A. Electron spin resonance dating of optically bleached quartz grains from the Middle Palaeolithic site of Cuesta de la Bajada (Spain) using the multiple centres approach. Quat. Geochronol. 2017, 37, 82–96. [Google Scholar] [CrossRef]
  66. Tsukamoto, S.; Oppermann, F.; Autzen, M.; Richter, M.; Bailey, M.; Ankærgaard, C.; Jain, M. Response of the Ti and Al electron spin resonance signals in quartz to X-ray irradiation. Radiat. Meas. 2021, 149, 106676. [Google Scholar] [CrossRef]
  67. Tsukamoto, S.; Porat, N.; Ankjærgaard, C. Dose recovery and residual dose of quartz ESR signals using modern sediments: Implications for single aliquot ESR dating. Radiat. Meas. 2017, 106, 472–476. [Google Scholar] [CrossRef]
  68. Hayes, R.; Haskell, E.H.; Kenner, G.H. An assessment of the Levenberg-Marquardt fitting algorithm on saturating exponential data sets. Anc. TL 1998, 16, 57–62. [Google Scholar] [CrossRef]
  69. Durcan, J.A.; King, G.F.; Duller, G.A.T. DRAC: Dose Rate and Age Calculator for trapped charge dating. Quat. Geochronol. 2015, 28, 54–61. [Google Scholar] [CrossRef]
  70. Aitken, M.J. Thermoluminescence Dating; Academic Press: London, UK, 1985; pp. 1–359. [Google Scholar]
  71. Prescott, J.R.; Hutton, J.T. Cosmic ray contributions to dose rates for luminescence and ESR dating: Large depths and long-term time variations. Radiat. Meas. 1994, 23, 497–500. [Google Scholar] [CrossRef]
  72. Guérin, G.; Mericier, N.; Adamiec, G. Dose-rate conversion factors: Update. Anc. TL 2011, 29, 5–8. [Google Scholar] [CrossRef]
  73. Bell, W.T. Attenuation factors for the absorbed radiation dose in quartz inclusions for the thermoluminescence dating. Anc. TL 1979, 8, 2–13. [Google Scholar] [CrossRef]
  74. Bartz, M.; Arnold, L.J.; Spooner, N.A.; Demuro, M.; Campaña, I.; Rixhon, G.; Brückner, H.; Duval, M. First experimental evaluation of the alpha efficiency in coarse-grained quartz for ESR dating purposes: Implications for dose rate evaluation. Sci. Rep. 2019, 9, 19769. [Google Scholar] [CrossRef] [PubMed]
  75. Ikeya, M.O.K. ESR age of Pleistocene shells measured by radiation assessment. Geochem. J. 1984, 18, 11–17. [Google Scholar] [CrossRef]
  76. Bahain, J.J.; Yokoyama, Y.J.; Masaoudi, H.; Falgueres, C.; Laurent, M. ESR and U/Th dating methologies applied to carbonates from Southern Italy. In Proceedings of the 37th International Symposium on Archaeometry; Springer: Berlin/Heidelberg, Germany; Siena, Italy, 2011; pp. 481–488. [Google Scholar]
  77. Gandin, A.; Cpezzuoli, E. Travertine: Distinctive depositional fabrics of carbonates from thermal spring systems. Sedimentology 2014, 61, 264–290. [Google Scholar] [CrossRef]
  78. Serway, R.A.; Marshall, S.A. Electron Spin Resonance Absorption Spectra of CO3 and CO33− Molecule—Ions in Irradiated Single-Crystal Calcite. J. Chem. Phys. 1967, 46, 1949–1952. [Google Scholar] [CrossRef]
  79. Pirouelle, F.; Bahain, J.J.; Falguères, C.; Dolo, J.J. Study of the effect of a thermal treatment on the DE determination in ESR dating of speleothems. Quat. Geochronol. 2007, 2, 386–391. [Google Scholar] [CrossRef]
  80. Hennig, G.J.; Grün, R. ESR dating in quaternary geology. Quat. Sci. Rev. 1983, 2, 157–238. [Google Scholar] [CrossRef]
  81. Smith, B.W.; Smart, P.L.; Symons, C.R. ESR signals in a variety of speleothem calcites and their suitability for dating. Nucl. Tracks Radiat. Meas. 1985, 10, 837–844. [Google Scholar] [CrossRef]
  82. Liu, C.R.; Tian, Y.Y.; Ji, H.; Ma, X.; Wei, C.Y.; Dang, J.X.; Yin, G.M.; Zhou, Y.S.; Yuan, R.M. Chronology analysis of huge landslide based on ESR dating materials on sliding face in carbonate areas of south eastern Tibet. Quat. Geochronol. 2023, 76, 101442. [Google Scholar] [CrossRef]
  83. Euler, F.K.; Kahan, A. Radiation effects and anelastic loss in germanium-doped quartz. Phys. Rev. B Condens. Matter Mater. Phys. 1987, 35, 4351–4359. [Google Scholar] [CrossRef]
  84. Lawless, J.L.; Chen, R.; Lo, D.; Pagonis, V. A model for non-monotonic dose dependence of thermoluminescence (TL). J. Phys. Condens. Matter 2005, 17, 737–753. [Google Scholar] [CrossRef]
  85. Liu, C.R.; Ji, H.; Li, W.P.; Wei, C.Y.; Yin, G.M. The relationship between irradiation sensitivity of quartz Al and Ti centers and baking temperature by volcanic lava flow: Example of Datong volcanic group, China. Radiat. Meas. 2022, 157, 106823. [Google Scholar] [CrossRef]
  86. Grün, R.; Rhodes, E.J. On the selection of dose points for saturating exponential ESR/TL dose response curves. Anc. TL 1991, 9, 40–46. [Google Scholar] [CrossRef]
  87. Duval, M.; Grün, R. Are published ESR dose assessments on fossil tooth enamel reliable? Quat. Geochronol. 2016, 31, 19–27. [Google Scholar] [CrossRef]
  88. Guo, Q.; Wang, Y.; Liu, W. Hydrogeochemistry and environmental impact of geothermal waters from Yangyi of Tibet, China. J. Volcanol. Geotherm. Res. 2009, 180, 9–20. [Google Scholar] [CrossRef]
  89. White, D.E.; Brannock, W.W.; Murata, K.J. Silica in hot-spring waters. Geochim. Cosmochim. Acta 1956, 10, 27–59. [Google Scholar] [CrossRef]
  90. Campbell, K.A.; Guido, D.M.; Gautret, P.; Foucher, F.; Ramboz, C.; Westall, F. Geyserite in hot-spring siliceous sinter: Window on earth’s hottest terrestrial (paleo) environment and its extreme life. Earth-Sci. Rev. 2015, 148, 44–64. [Google Scholar] [CrossRef]
  91. Yap, L.; Ayling, B.; Hinz, N. Mapping sinter and travertine outcrops in the State of Nevada. Trans. Geotherm. Resour. Counc. 2018, 42, 996–1009. [Google Scholar]
  92. Fouke, B.W.; Farmer, J.D.; Des Marais, D.J.; Pratt, L.; Sturchio, N.C.; Burns, P.C.; Discipulo, M.K. Depositional facies and aqueous-solid geochemistry of travertine-depositing hot springs (Angel Terrace, Mammoth Hot Springs, Yellowstone National Park, USA). J. Sediment. Res. 2000, 70, 565–585. [Google Scholar] [CrossRef] [PubMed]
  93. Wu, Z.H.; Hu, D.G.; Wu, Z.H.; Zhao, X.T.; Wang, W.; Liu, Q.S.; Ye, P.S.; Zhou, C.J.; Wang, L.J.; Peng, H. Active Faults and Geological Hazards Along the Golmud-Lhasa Railway Across the Tibetan Plateau; Geological Publishing House: Beijing, China, 2005; pp. 60–87. [Google Scholar]
  94. Su, J.; Tan, H.; Chen, X. The groundwater deep circulation and large-scale geothermal deposition in response to the extension of the Yadong–Gulu rift, South Tibet, China. J. Volcanol. Geotherm. Res. 2020, 395, 106836. [Google Scholar] [CrossRef]
  95. Kano, A.; Matsuoka, J.; Kojo, T.; Fujii, H. Origin of annual laminations in tufa deposits, southwest Japan. Palaeogeogr. Palaeoclimatol. Palaeoecol. 2003, 191, 243–262. [Google Scholar] [CrossRef]
  96. Kawai, T.; Kano, A.; Matsuoka, J.; Ihara, T. Seasonal variation in water chemistry and depositional processes in a tufa-bearing stream in SW-Japan, based on 5 years of monthly observations. Chem. Geol. 2006, 232, 33–53. [Google Scholar] [CrossRef]
  97. Liu, Z.H.; Li, H.C.; You, C.F.; Wan, N.J.; Sun, H.L. Thickness and stable isotopic characteristics of modern seasonal climate-controlled sub-annual travertine laminas in a travertine-depositing stream at Baishuitai, SW China: Implications for paleoclimate reconstruction. Environ. Geol. 2006, 51, 257–265. [Google Scholar] [CrossRef]
  98. Liu, Z.H.; Li, H.C.; You, C.F.; Wan, N.J.; Sun, H.L. Wet-dry seasonal variations of hydrochemistry and carbonate precipitation rates in a travertine-depositing canal at Baishuitai, Yunnan, SW China: Implications for the formation of biannual laminae in travertine and for climatic reconstruction. Chem. Geol. 2010, 273, 258–266. [Google Scholar] [CrossRef]
  99. An, Z.S.; Clemens, S.C.; Shen, J.; Qiang, X.K.; Jin, Z.D.; Sun, Y.B.; Prell, W.L.; Luo, J.J.; Wang, S.M.; Xu, H.; et al. Glacial-Interglacial Indian summer monsoon dynamics. Science 2011, 333, 719–723. [Google Scholar] [CrossRef] [PubMed]
  100. Lisiecki, L.E.; Raymo, M.E. A Pliocene-Pleistocene stack of 57 globally distributed benthic δ18O records. Paleoceanography 2005, 20, PA1003. [Google Scholar] [CrossRef]
  101. Thompson, L.G.; Yao, T.D.; Davis, M.E.; Henderson, K.A.; Mosley-Thompson, E.; Lin, P.-N.; Synal, H.-A.; Cole-Dai, J.; Bolzan, J.F. Tropical climate instability: The last glacial cycle from a Qinghai-Tibetan Ice core. Science 1997, 276, 1821–1825. [Google Scholar] [CrossRef]
  102. Yao, T.D.; Thompson, L.G.; Shi, Y.F.; Qin, D.H.; Jiao, K.Q.; Yang, Z.H.; Tian, L.D.; Thompson, E.M. Climate variation since the Last Interglaciation recorded in the Guliya ice core. Sci. China Earth Sci. 1997, 40, 662–668. [Google Scholar] [CrossRef]
  103. Guo, Q.; Pang, Z.; Wang, Y.; Tian, J. Fluid geochemistry and geothermometry applications of the Kangding high-temperature geothermal system in eastern Himalayas. Appl. Geochem. 2017, 81, 63–75. [Google Scholar] [CrossRef]
  104. Uysal, I.T.; Ünal-İmer, E.; Shulmeister, J.; Zhao, J.-X.; Karabacak, V.; Feng, Y.-X.; Bolhar, R. Linking CO2 degassing in active fault zones to long-term changes in water balance and surface water circulation, an example from SW Turkey. Quat. Sci. Rev. 2019, 214, 164–177. [Google Scholar] [CrossRef]
  105. Pentecost, A. The Quaternary travertine deposits of Europe and Asia Minor. Quat. Sci. Rev. 1995, 14, 1005–1028. [Google Scholar] [CrossRef]
  106. Kawai, T.; Kano, A.; Hori, M. Geochemical and hydrological controls on biannual lamination of tufa deposits. Sediment. Geol. 2009, 213, 41–50. [Google Scholar] [CrossRef]
Figure 1. Overview of the study area (location shown by red rectangle) and sample sites in southern Tibet. (a) Locations of the sample sites and spatial distributions of NS-trending faults and hydrothermal activities (modified from [6]). (b) Regional location of the study area on the map of China, where the red highlighted patch marks the scope enlarged in subfigure (a). (c) Map shows the fault-related hot spring distributions in the studied area; (d) the cross-section of the Xiakangjian horst shows the travertine deposition; and (e) the cross-section of the Dajiacuo graben shows the silica sinter deposition.
Geosciences 16 00292 g001
Figure 2. River terraces and sampling sites in Targejia geothermal field. (a) The river terraces and sampling sites (modified from [25]); (b) relative position of the fourth terrace and sampling on the top of T4; (c) distribution form of silica sinter on T2 and the sampling site of XZ02; (d) distribution pattern of silica sinter on T3 and the sampling location of XZ03; and (e) distribution state of silica sinter on T1 and the place where XZ04 was sampled.
Geosciences 16 00292 g002
Figure 3. River terraces (T1–T3) and sampling sites in Xiakangjian hot spring. (a) The valley terrace profile and sampling sites; (b) field photos showing travertine distribution and sampling sites XZ13 (T2); (c) detailed field photo of the T1 travertine outcrop at sample XZ12.
Geosciences 16 00292 g003
Figure 4. Representative photographs of the bulk samples (XZ01, XZ02, XZ03, XZ04, XZ12, and XZ13), their thin-section photomicrographs (taken under a polarizing microscope), and corresponding XRD patterns. Q = quartz, OPl = opal, Arg = aragonite, Cal = calcite, Cln = chalcedony.
Geosciences 16 00292 g004
Figure 5. Representative ESR spectra and paramagnetic centers: (a) silica sinter sample XZ01; (b) travertine sample XZ12; and (c) travertine sample XZ13.
Geosciences 16 00292 g005
Figure 6. Dose–response curves of four silica sinter samples (XZ01, XZ02, XZ03, and XZ04) and of two travertine samples (XZ12 and XZ13).
Geosciences 16 00292 g006
Figure 7. Comparison of normalized De values for all samples. For each sample, all De results were normalized by dividing the De obtained at an additional dose of 0–1961 Gy.
Geosciences 16 00292 g007
Figure 8. Thermal stabilities of the paramagnetic center at g = 2.0017 of XZ01 (a) and at g = 2.0034 of XZ12 (b).
Geosciences 16 00292 g008
Figure 9. Summarized data of silica sinter and travertine ages in different sites in southern Tibet. New ESR ages obtained in this study are highlighted in red arrows.
Geosciences 16 00292 g009
Figure 10. Histogram showing distributions of silica sinter and travertine ages in 10 kyr step width from 100 kyr (a) and in 50 kyr step width from 750 to100 kyr (b). Different bin widths were chosen to optimize display for each interval.
Geosciences 16 00292 g010
Figure 11. Comparison of the age-frequency curve (blue) established in this study with previous stage-based chronologies (colored bars) of hydrothermal activity in southern Tibet [6,11,19,23,25,46,93]. The blue curve shows the number of ages per 10 kyr bin based on all compiled ages (our six new ESR ages plus 108 published ages). The colored bars represent the inferred periods of sinter/travertine deposition reported in previous studies, typically divided into four or five discrete stages. The horizontal axis represents age (kyr), and the vertical axis represents the frequency count for the blue curve only.
Geosciences 16 00292 g011
Table 1. Sample information and sampling positions.
Sample
Number
SamplesLithologyLocationTerraceHeight a
(m)
Burial Depth b
(m)
1XZ01Silica sinterTargejiaT4100.3
2XZ02Silica sinterTargejiaT370.4
3XZ03Silica sinterTargejiaT250.6
4XZ04Silica sinterTargejiaT120.3
5XZ12TravertineXiakangjianT11.60.7
6XZ13TravertineXiakangjianT260.6
a Height is relative to the water level of the Changmaqu River at the time of sampling (field campaign, 2022). b The burial depth refers to the burial depth of the sample below the modern surface.
Table 2. Comparison of different De values of the silica sinter and travertine samples based on different additional doses.
Sample0–1961 Gy0–2835 Gy0–3680 Gy0–5239 Gy0–7084 Gy
De
(Gy)
De Error
(%)
De
(Gy)
De Error
(%)
De
(Gy)
De Error
(%)
De
(Gy)
De Error
(%)
De
(Gy)
De Error
(%)
XZ01191 ± 178.70193 ± 147.02198 ± 157.62201 ± 146.88202 ± 136.31
XZ02111 ± 2925.72129 ± 3024137 ± 2820.33143 ± 2617.95147 ± 2416.14
XZ0339 ± 38.2135 ± 24.2736 ± 36.2737 ± 37.1839 ± 38.18
XZ04265 ± 6022.61253 ± 3915.57215 ± 2410.95196 ± 2914.67232 ± 2310.02
XZ1245 ± 48.8843 ± 49.1543 ± 37.9043 ± 36.9143 ± 36.19
XZ1390 ± 22.3791 ± 22.5593 ± 33.3795 ± 44.1896 ± 44.04
Table 3. Results of dose rate, De and ESR ages for silica sinter and travertine deposition.
SamplesDepth
(m)
U
(μg/g)
Th
(μg/g)
K
(%)
Water a
(%)
Cosmic Ray
(Gy/kyr)
De
(Gy)
Dose Rate
(Gy/kyr)
ESR Ages (kyr)
XZ010.30.663.850.550.030.43 ± 0.04191 ± 171.53 ± 0.06125 ± 12
XZ020.40.280.220.100.130.42 ± 0.04147 ± 240.71 ± 0.06209 ± 38
XZ030.60.090.440.270.180.43± 0.0439 ± 30.80 ± 0.0549 ± 5
XZ040.30.362.340.420.480.43 ± 0.04232 ± 231.22 ± 0.06191 ± 21
XZ120.70.360.280.040.060.39 ± 0.0443 ± 30.67 ± 0.0564 ± 6
XZ130.60.610.140.020.010.40 ± 0.0490 ± 20.72 ± 0.05125 ± 9
a Water content is expressed as % dry weight.
Disclaimer/Publisher’s Note: The statements, opinions and data contained in all publications are solely those of the individual author(s) and contributor(s) and not of MDPI and/or the editor(s). MDPI and/or the editor(s) disclaim responsibility for any injury to people or property resulting from any ideas, methods, instructions or products referred to in the content.