Article

Decoding the Geomechanical Memory of Deep Shales: Decoupling Extreme 3D Stress and Overpressure for Unconventional Engineering

1
State Key Laboratory of Continental Evolution and Early Life, Northwest University, Xi’an 710069, China
2
Department of Geology, Northwest University, Xi’an 710069, China
3
Research Institute of Petroleum Exploration and Development, Petro China Tarim Oilfield Company, Korla 841000, China
*
Author to whom correspondence should be addressed.
These authors contributed equally to this work.
Geosciences 2026, 16(7), 276; https://doi.org/10.3390/geosciences16070276
Submission received: 19 May 2026 / Revised: 14 June 2026 / Accepted: 2 July 2026 / Published: 6 July 2026
(This article belongs to the Section Geomechanics)

Abstract

Predicting present-day pore pressure and 3D in situ stress in ultra-deep fold-thrust belts is severely hindered by the inadequacies of traditional 1D vertical compaction models, which fail to account for massive lateral tectonic compression and continuous elastoplastic yielding. To overcome this, a 3D poro-elastoplastic analytical framework is developed based on the Modified Cam-Clay model to decode the irreversible “geomechanical memory” of deeply buried argillaceous rocks. Applied to the highly compressed Kelasu Thrust Belt, this method links volumetric strain with mean and deviatoric stresses in stress-invariant space to reconstruct the maximum paleo-pore pressure and 3D paleo-stress tensor during the Coulomb Failure Period (CFP). The quantitative decoupling reveals an extreme state of geopressure prior to macroscopic faulting (pore pressure ratio α = 0.85–0.89). Crucially, the mean stress surge is identified as the dominant driver, generating ~91% of the excess overpressure. Consequently, horizontal tectonic compression accounts for 80–90% of the total overpressure anomaly, fundamentally overturning the classical assumption that vertical undercompaction (10–20%) is the primary mechanism. Furthermore, it is demonstrated that during subsequent tectonic uplift, the heavily compacted, salt-capped mudstones follow an undrained unloading path; the reduction in lithostatic burden is almost entirely offset by fluid depressurization, maintaining a constant effective stress state. This physically decoupled framework provides a rigorous basis for optimizing pre-drill safe mud-weight windows, designing hydraulic fracturing in highly deviatoric stress regimes, and assessing caprock integrity for deep geo-energy storage.

1. Introduction

As global energy demand continues to rise, hydrocarbon exploration has increasingly shifted toward deep and ultra-deep domains, which have now become the primary battlefield for both conventional and unconventional resources (e.g., deep shale gas and tight oil) [1]. However, the economic and efficient development of these deep resources faces unprecedented geological and engineering challenges, particularly in strongly compressed tectonic settings like foreland fold-thrust belts. In these ultra-deep environments, operators frequently encounter extreme anomalous overpressure and highly anisotropic three-dimensional (3D) in situ stress fields (σH ≫ σh). These conditions trigger drilling hazards, including severe wellbore collapse and casing deformation, and they fundamentally restrict reservoir stimulation effectiveness [2,3].
To mitigate these engineering disasters, accurately predicting the present-day in situ stress and pore pressure is the essential prerequisite. Currently, conventional geomechanical evaluations primarily rely on well-logging data and basin modeling [4,5,6,7]. For pore pressure prediction, classical methods (e.g., Eaton’s method and porosity-depth trends) are built upon the assumption of uniaxial vertical compaction, deriving overpressure solely from undercompaction mechanisms under gravity [8,9]. For in situ stress evaluation, traditional methods typically employ linear poroelastic models combined with present-day logging data [10,11,12,13]. While these methods perform reasonably well in shallow, extensional, or hydrostatically compacted basins, their fundamental assumptions—vertical loading and purely linear elasticity—render them highly inadequate in strongly compressed thrust belts [9,14]. Existing models do not mathematically account for the massive pressure generation induced by horizontal tectonic squeezing (shear stress) and the complex 3D non-linear yielding behavior of rocks [14,15,16].
More importantly, the mechanical and physical properties of deep/ultra-deep mudstone/shales differ fundamentally from their shallow counterparts, rendering present-day data-driven predictions highly erroneous [17,18,19]. First, driven by deep high-temperature and high-stress environments, the mechanical behavior of mudstones/shales progressively transitions from brittle to brittle–ductile or fully ductile (plastic) [20,21]. Conventional linear elastic models completely fail to capture this massive plastic yielding and shear-induced compaction [22]. Second, in complex tectonic settings, deep argillaceous rocks deeply retain an irreversible “geomechanical memory”, which is physically recorded by the micro-cracks and permanent deformation left in the rock during past peak tectonic forces. The present-day porosity–permeability relationships, fracture characteristics, and overpressure magnitudes of these shales are not dictated by their current burial depth or present-day stress state; rather, they are irreversibly locked in by the maximum loading conditions experienced during the Coulomb Failure Period (CFP)—the historical tectonic stage when the rock mass reached macroscopic yield [23]. Due to subsequent tectonic uplift and stress relaxation, the present-day formation often exhibits a “paleo-high, present-low” geomechanical signature. Consequently, utilizing present-day poro-perm data or fracture densities to directly back-calculate current stress or pressure yields severe physical discrepancies. Therefore, rigorously decoding the extreme paleo-stress and paleo-pressure at the CFP is not merely a historical reconstruction; it is the absolute prerequisite for qualitatively characterizing present-day shale reservoir properties and quantitatively evaluating the current 3D stress and pressure fields.
The Kuqa Depression in the Tarim Basin serves as a world-class natural laboratory to investigate these extreme geomechanical phenomena. Characterized by multi-detachment structural models and intense polyphase tectonic superimposition (especially the strong Himalayan compression) [24], the Kuqa Depression hosts extraordinarily thick Triassic and Jurassic (T/J) mudstone/shale sequences [25]. They are high-quality source rocks and future critical targets for ultra-deep unconventional exploration. Despite their enormous resource potential, these deep T/J shales remain largely unpenetrated by current drilling campaigns due to their extreme depths. Consequently, unraveling the extreme stress and pressure characteristics of these deep mudstones and clarifying their geomechanical evolution trajectories during the subsequent uplift and exhumation stages is of paramount significance. Such forward-looking predictive work provides the indispensable theoretical and technical foundation for the future safe exploration and effective development of deep T/J shale oil and gas resources.
To address the aforementioned theoretical bottlenecks and engineering challenges, this study develops a poro-elastoplastic analytical framework based on Critical State Soil Mechanics and the Modified Cam-Clay (MCC) model [26]. Distinct from traditional 1D empirical compaction models, this framework treats deeply buried mudstones as continuous plastic media to achieve four primary objectives that represent key geomechanical innovations: First, we present the application of a complete MCC-based formulation to quantitatively decouple mean-stress-driven and shear-induced overpressures within a natural, ultra-deep fold-thrust belt. Second, under the concept of geomechanical memory—which, unlike traditional destructive and point-wise paleo-stress methods (e.g., Kaiser effect or acoustic emission), utilizes preserved geological signatures to reconstruct continuous stress pathways—we utilize a generalized flow rule combined with boundary conditions at the Coulomb Failure Period (CFP) to analytically reconstruct the full 3D paleo-stress tensor (σH, σh, σv). Third, we quantitatively partition the contributions of vertical compaction versus horizontal tectonic compression, demonstrating that tectonic squeezing contributes 80–90% of the overpressure anomaly in the Kelasu Thrust Belt. Fourth and finally, we establish a well-calibrated Cretaceous geomechanical proxy and clarify its undrained unloading behavior during tectonic exhumation, providing a transferable workflow that can be extrapolated to deeper, undrilled Triassic–Jurassic unconventional targets. Ultimately, this integrated framework provides a rigorous, physically based foundation for optimizing pre-drill safe mud-weight windows (SMWWs) and designing hydraulic fracturing operations in highly active tectonic regimes.

2. Geomechanical Setting

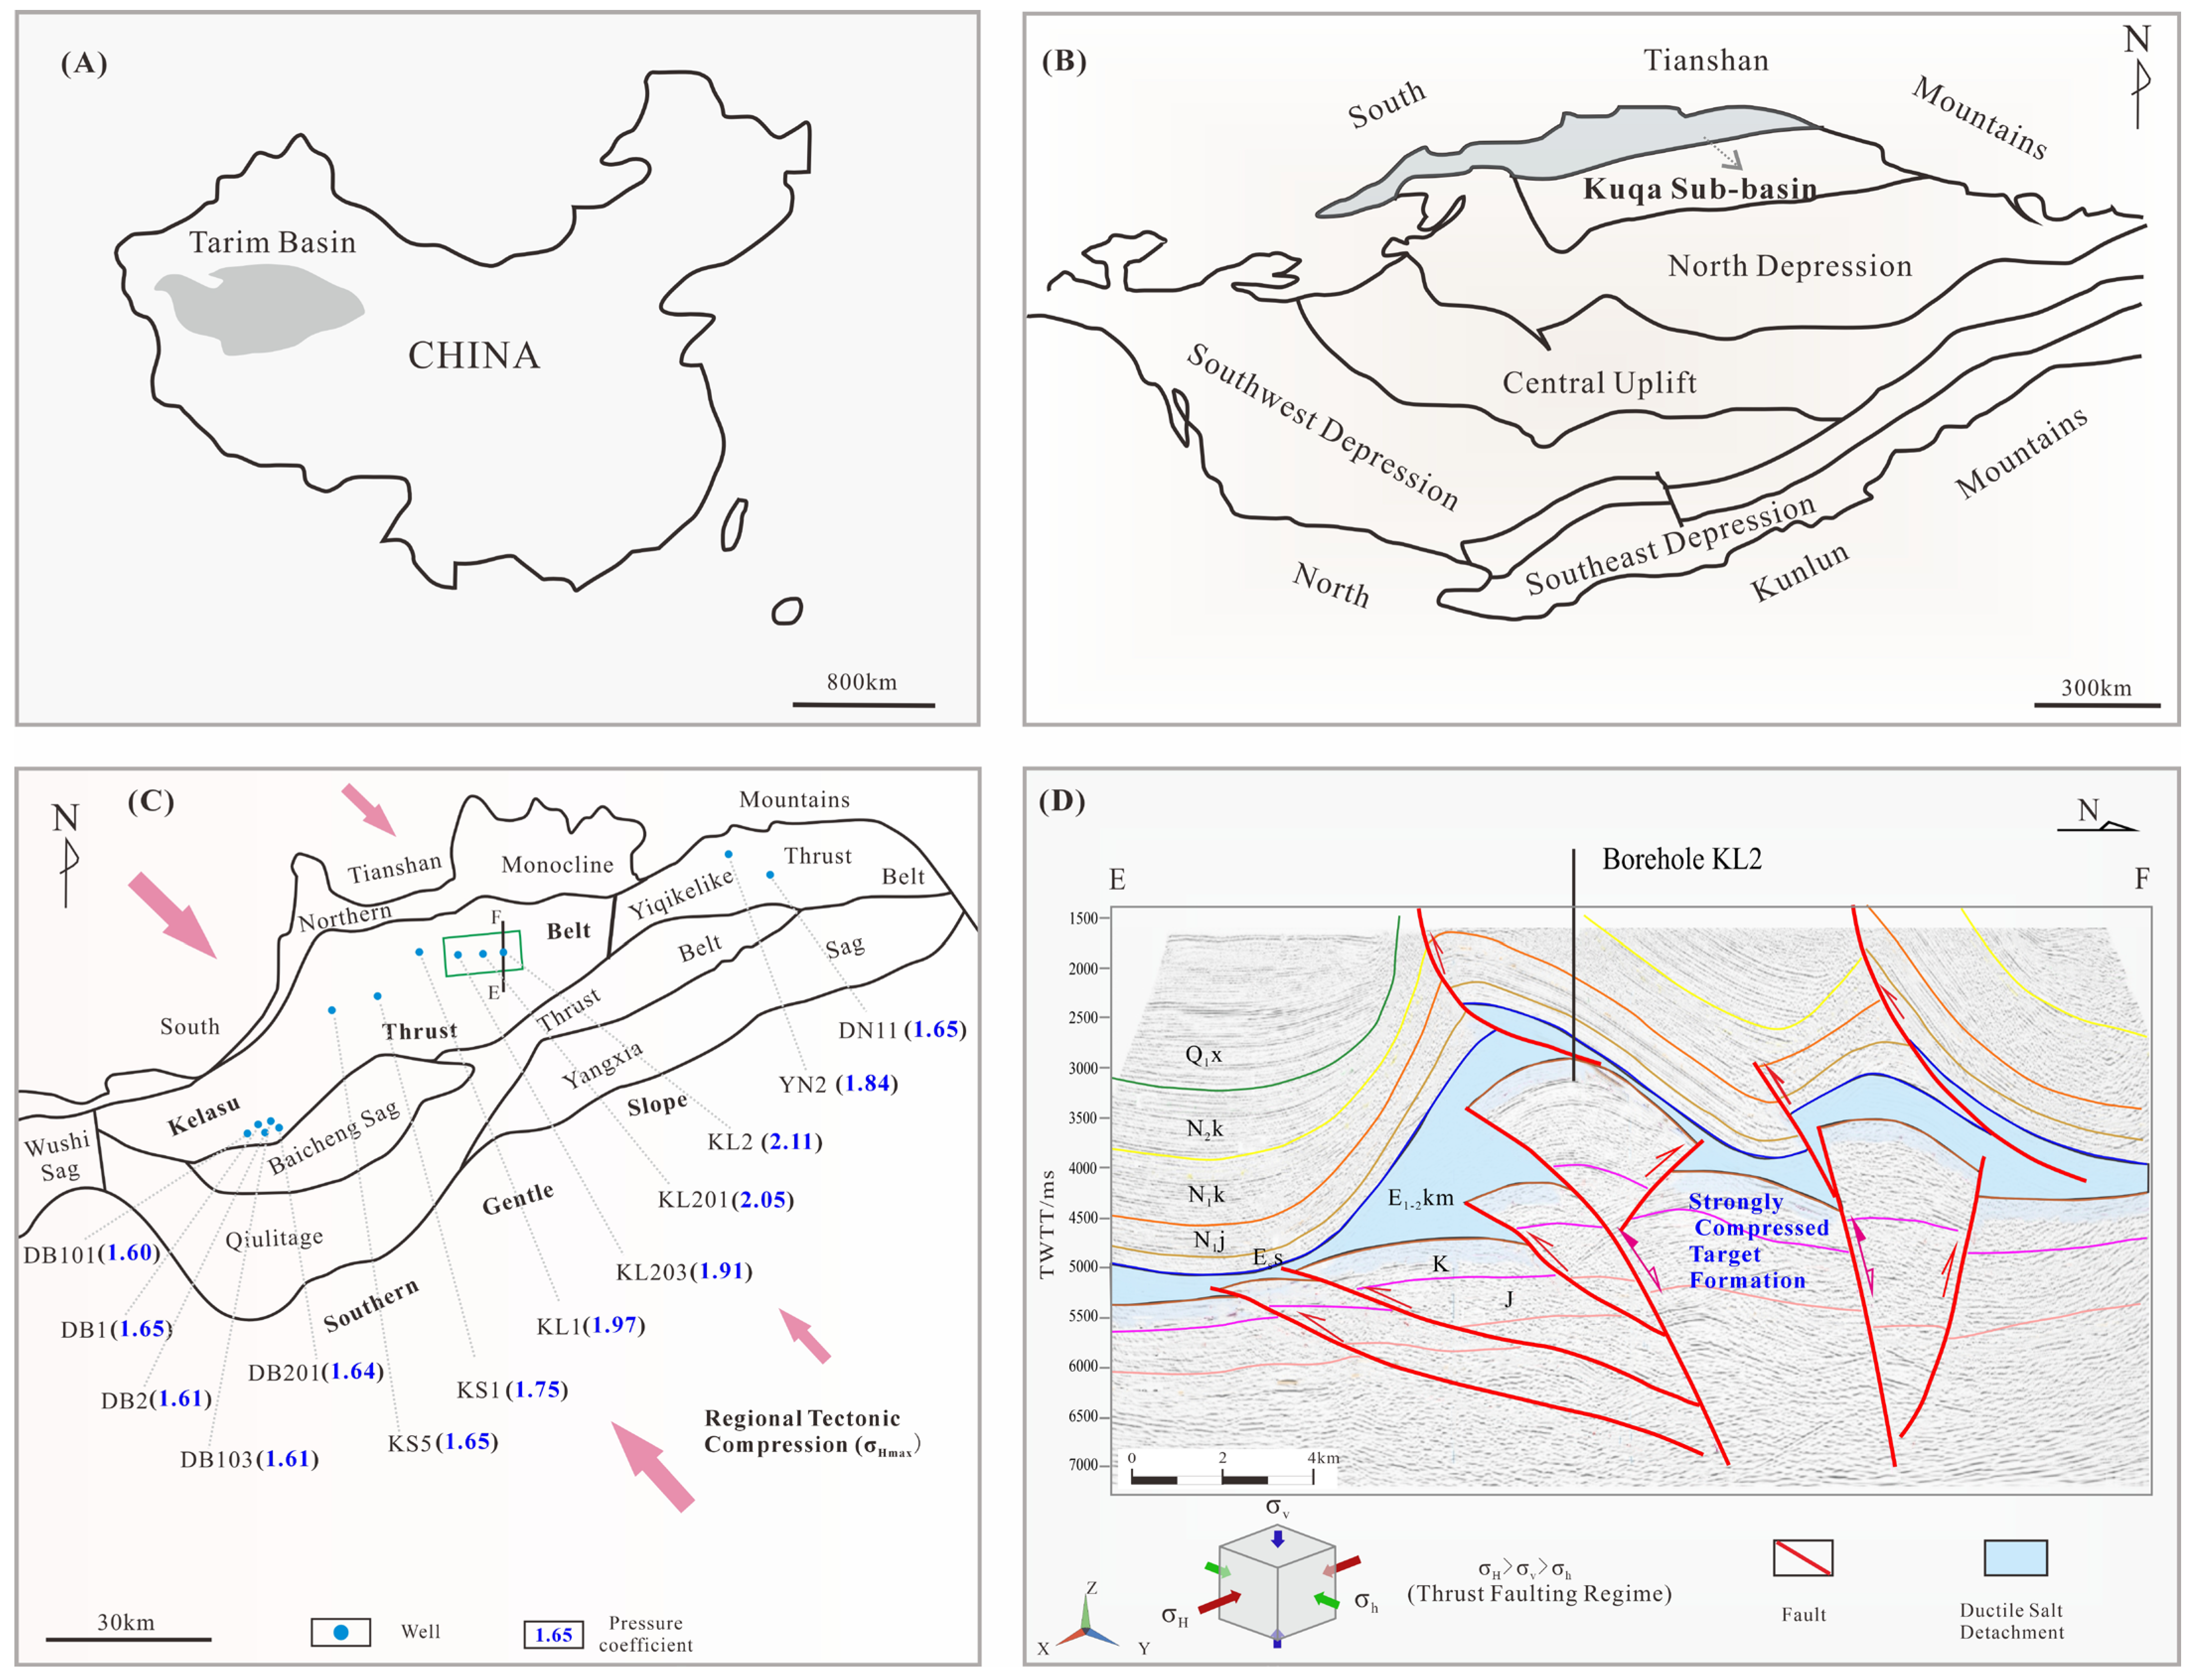
The Kuqa Depression, located in the northern margin of the Tarim Basin between the Southern Tianshan and Northern Kunlun Mountains, represents one of the most structurally complex and overpressured foreland fold-thrust belts in the world [27] (Figure 1A,B). Structurally, the depression transitions from the intensely deformed Kelasu Thrust Belt (KTB) in the north to the relatively stable Southern Gentle Slope in the south [28] (Figure 1C). In this study, we focus on the KTB, which serves as an exceptional natural geomechanical laboratory due to its extreme in situ stress environment and ultra-high pore fluid pressures [29] (Figure 1C).
The current stress and pressure regimes of the Kuqa Depression are the direct products of a complex, multi-stage tectonic loading history [30]. Since the Cenozoic, the region has been subjected to intense northward compression driven by the far-field effects of the India–Eurasia collision [30]. This massive tectonic force profoundly altered the regional stress tensor, shifting the maximum principal stress from vertical (gravity-driven) to horizontal (tectonic-driven) [30]. Consequently, the KTB experienced severe lateral tectonic shortening and layer-parallel compression, followed by significant localized uplift and exhumation ranging from 1200 to 3200 m (Figure 1D). It is precisely during this intense Himalayan compression that the deeply buried rock mass reached macroscopic yield—defined as the Coulomb Failure Period (CFP). The extreme stress and overpressure attained during the CFP are irreversibly locked in the “geomechanical memory” that governs the current subsurface conditions. These active geomechanical processes provide a rare opportunity to quantitatively investigate how varying lateral tectonic stresses drive continuous elastoplastic deformation and pore pressure evolution.
Structurally, the KTB is characterized by a thick layer of Paleogene gypsum–salt sequences, which strongly influence the regional geomechanical behavior [31]. Above the salt layer, deformation is dominated by thrust faults and associated folding; beneath it, deep structures primarily consist of heavily compacted imbricated thrust sheets within Mesozoic strata [31,32] (Figure 1D). Crucially, the highly ductile and practically impermeable nature of the gypsum–salt layer acts as a perfect mechanical seal [28,29]. It effectively prevents fluid dissipation from the underlying deep strata, creating an idealized “undrained” or “semi-undrained” condition that preserves the extreme tectonic overpressure generated during structural compression. This structural complexity and intense compressional regime in the KTB stand in stark contrast to the stable Southern Gentle Slope, where the stress state is predominantly 1D (vertical compaction) and exhumation is minimal [33]. This stark regional contrast is scientifically advantageous, allowing us to isolate and quantify the specific contributions of tectonic deviatoric stress to sediment compaction and fluid pressure generation.
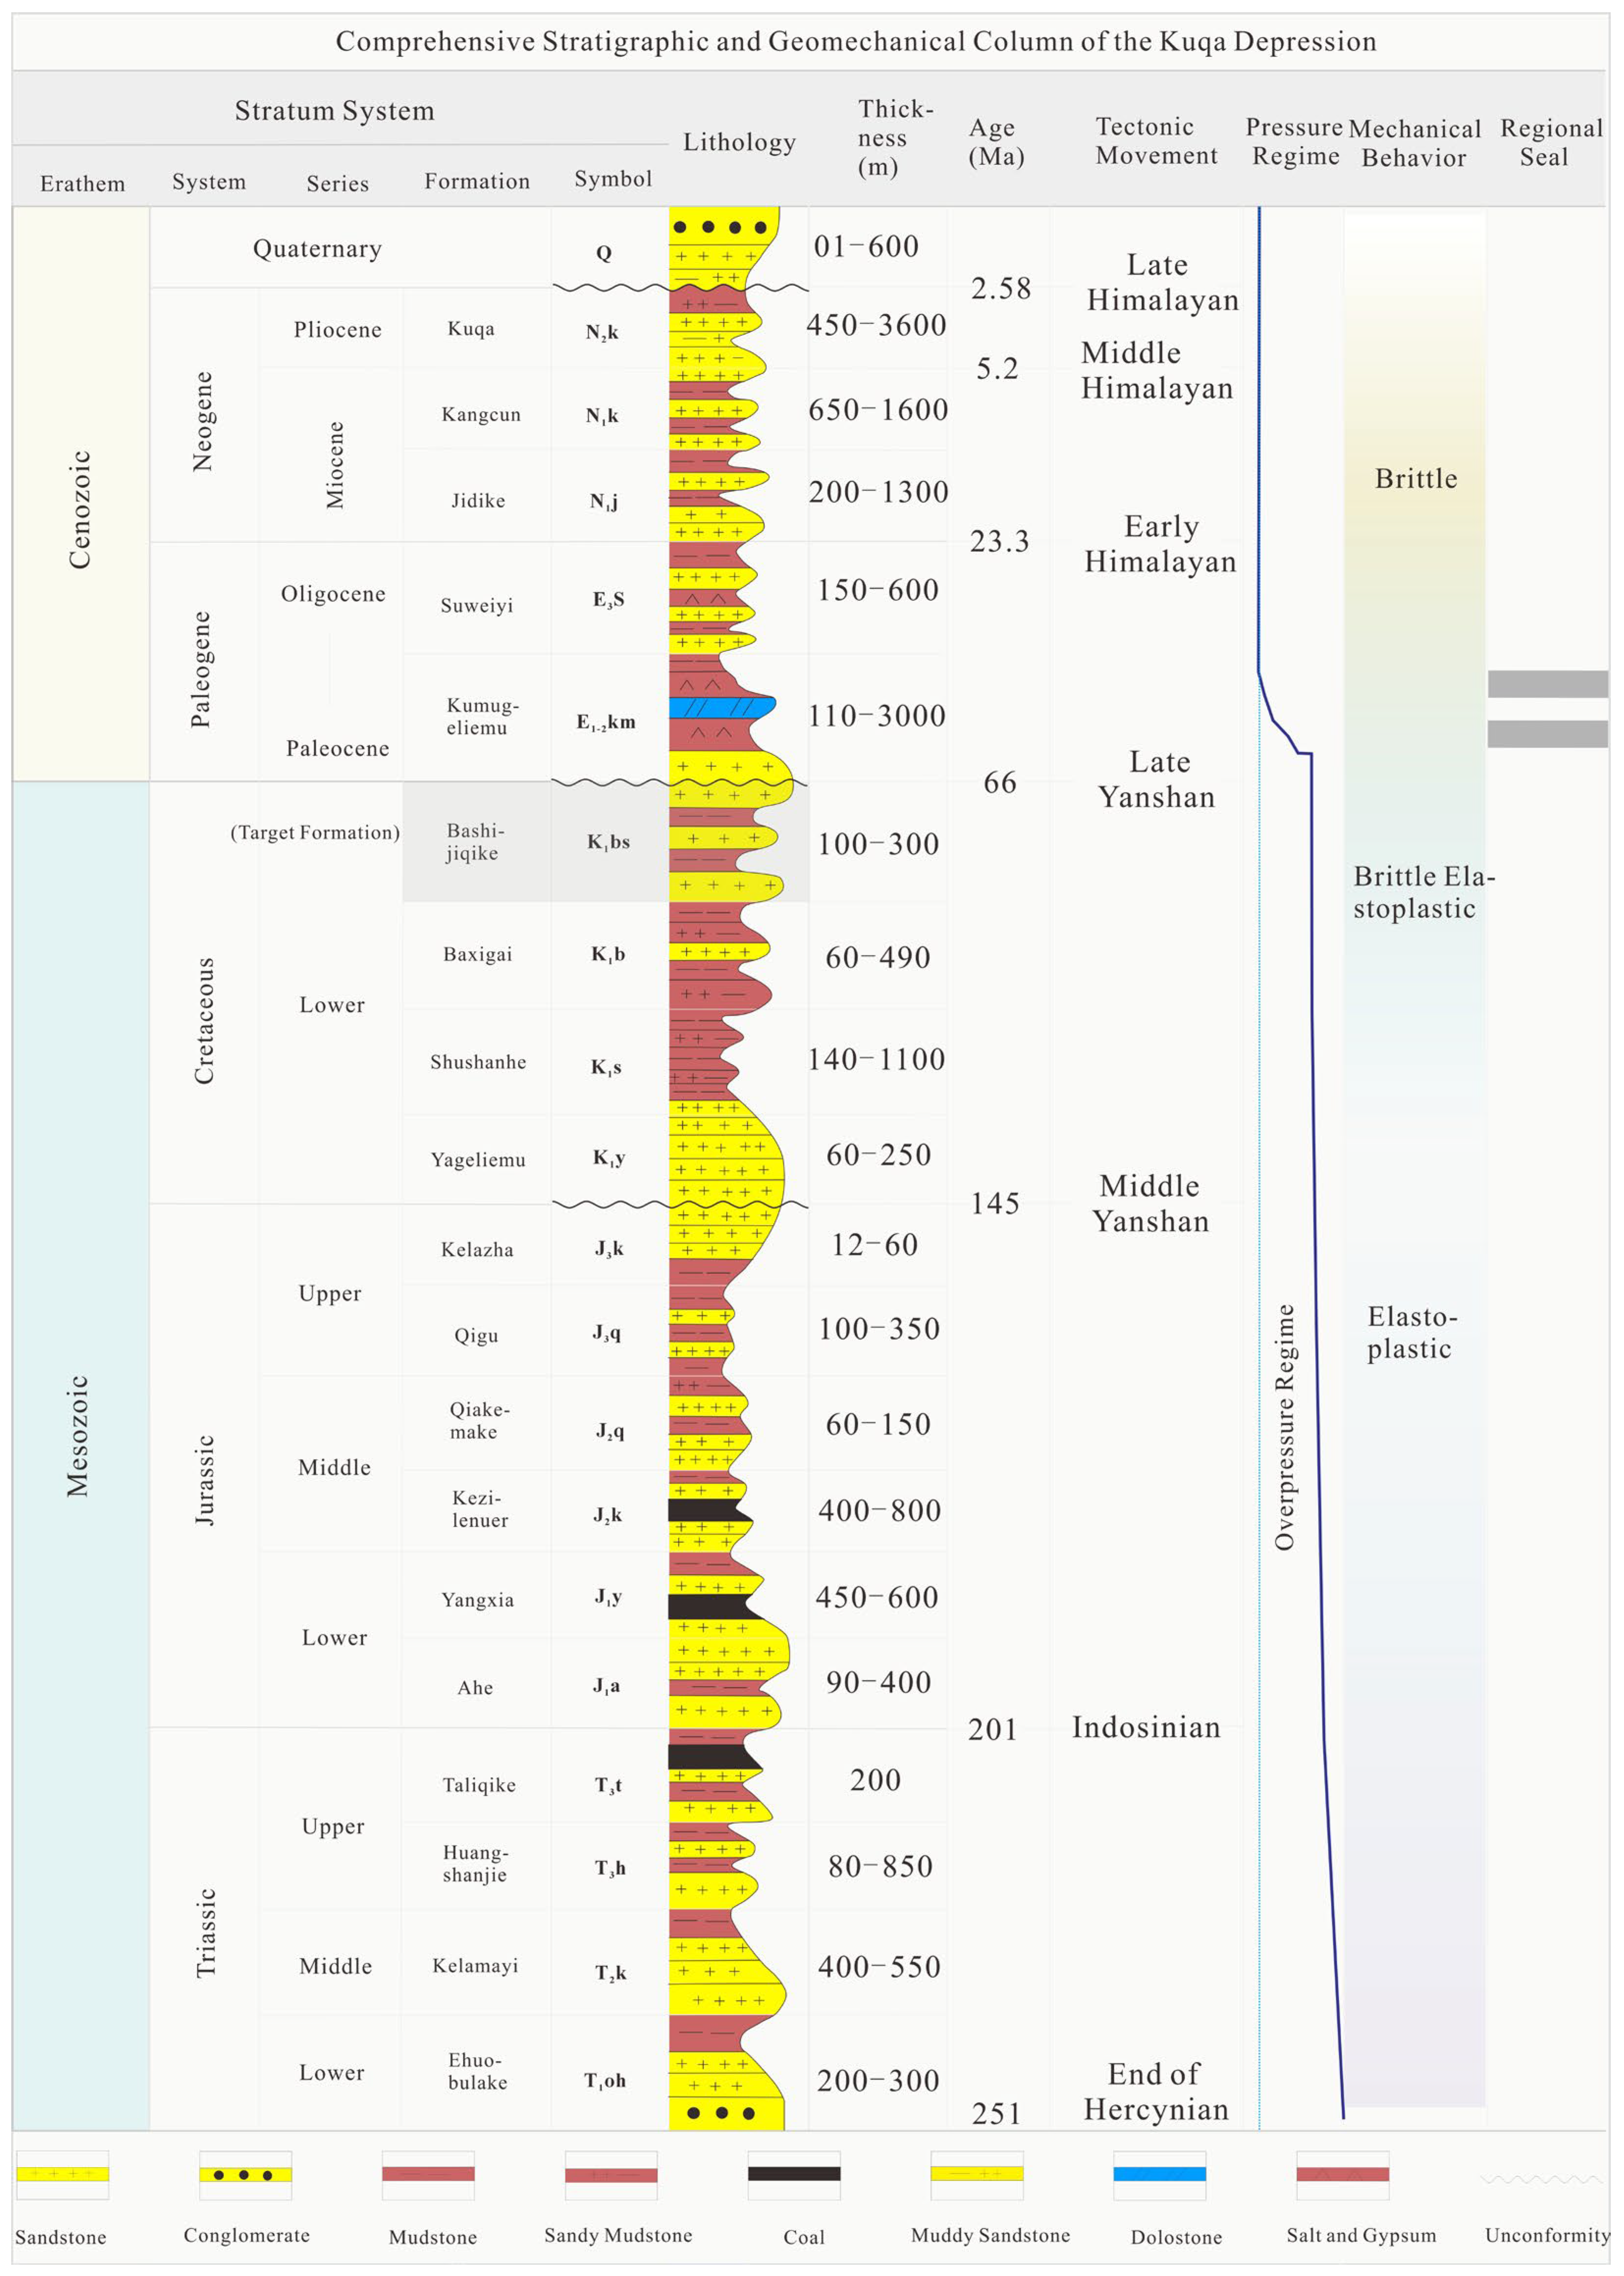
Stratigraphically, the deeply buried Mesozoic sequences encompass the ultra-deep Triassic (T) and Jurassic (J) shales, which serve as high-quality source rocks and emerging targets for unconventional exploration [2,25]. However, due to their extreme depths, direct geomechanical well-logging data for these T/J shales remain exceptionally scarce. Therefore, to validate our analytical framework, this study primarily focuses on the heavily drilled overlying Lower Cretaceous argillaceous sequences (e.g., the massive mudstones intercalated within or overlying the Bashijiqike Formation) (Figure 2). These deeply buried Cretaceous mudstones experienced the exact same intense Himalayan structural loading as the underlying T/J shales and act as the primary hazard zones for severe casing deformation today. Thus, they serve as a well-calibrated geomechanical proxy.
Reconstructions of the burial and tectonic history reveal a significant discrepancy between the current and maximum paleo-burial conditions of these Cretaceous mudstones. Currently, the target formation resides at depths ranging from 3500 to 4100 m. However, during the peak tectonic compression corresponding to the CFP, it experienced extreme paleo-burial depths exceeding 6200 m. These abundant mudstone sequences are treated as continuous poro-elastoplastic media. Subjected to the extreme geostatic stresses and high temperatures characteristic of ultradeep burial conditions, the mudstones are expected to overcome shallow-level brittleness and cementation, exhibiting pronounced ductile yielding and continuous plastic flow [20,21]. This transition ensures that their mechanical behavior essentially converges toward that of normally consolidated soils, fundamentally justifying the application of the Critical State Soil Mechanics (CSSM) framework [26]. By accurately modeling these Cretaceous proxies, we establish a reliable predictive tool that can be subsequently extrapolated to evaluate the deeper, undrilled T/J unconventional systems. Furthermore, the Neogene–Quaternary clastic sediments overlying the depression provide a highly consistent lithological baseline, minimizing the influence of lithological variations and allowing for a more direct mathematical assessment of stress–strain relationships [34].

3. Poro-Elastoplastic Constitutive Framework and Mathematical Formulation

3.1. Stress Paths and Poro-Mechanical Boundary Conditions

To rigorously model the coupled hydro-mechanical behavior of deep argillaceous rocks under intense tectonic compression, the following foundational assumptions are established: (1) Tectonic loading is accommodated under approximate plane-strain conditions. (2) Given the extreme magnitude of tectonic deformation in the Kelasu Thrust Belt, the irreversible plastic strain dictates the total volumetric strain (porosity loss), rendering the elastic rebound strain comparatively negligible. This simplification facilitates a focused formulation of the dominant plastic compaction driven by macroscopic stress tensor variations.
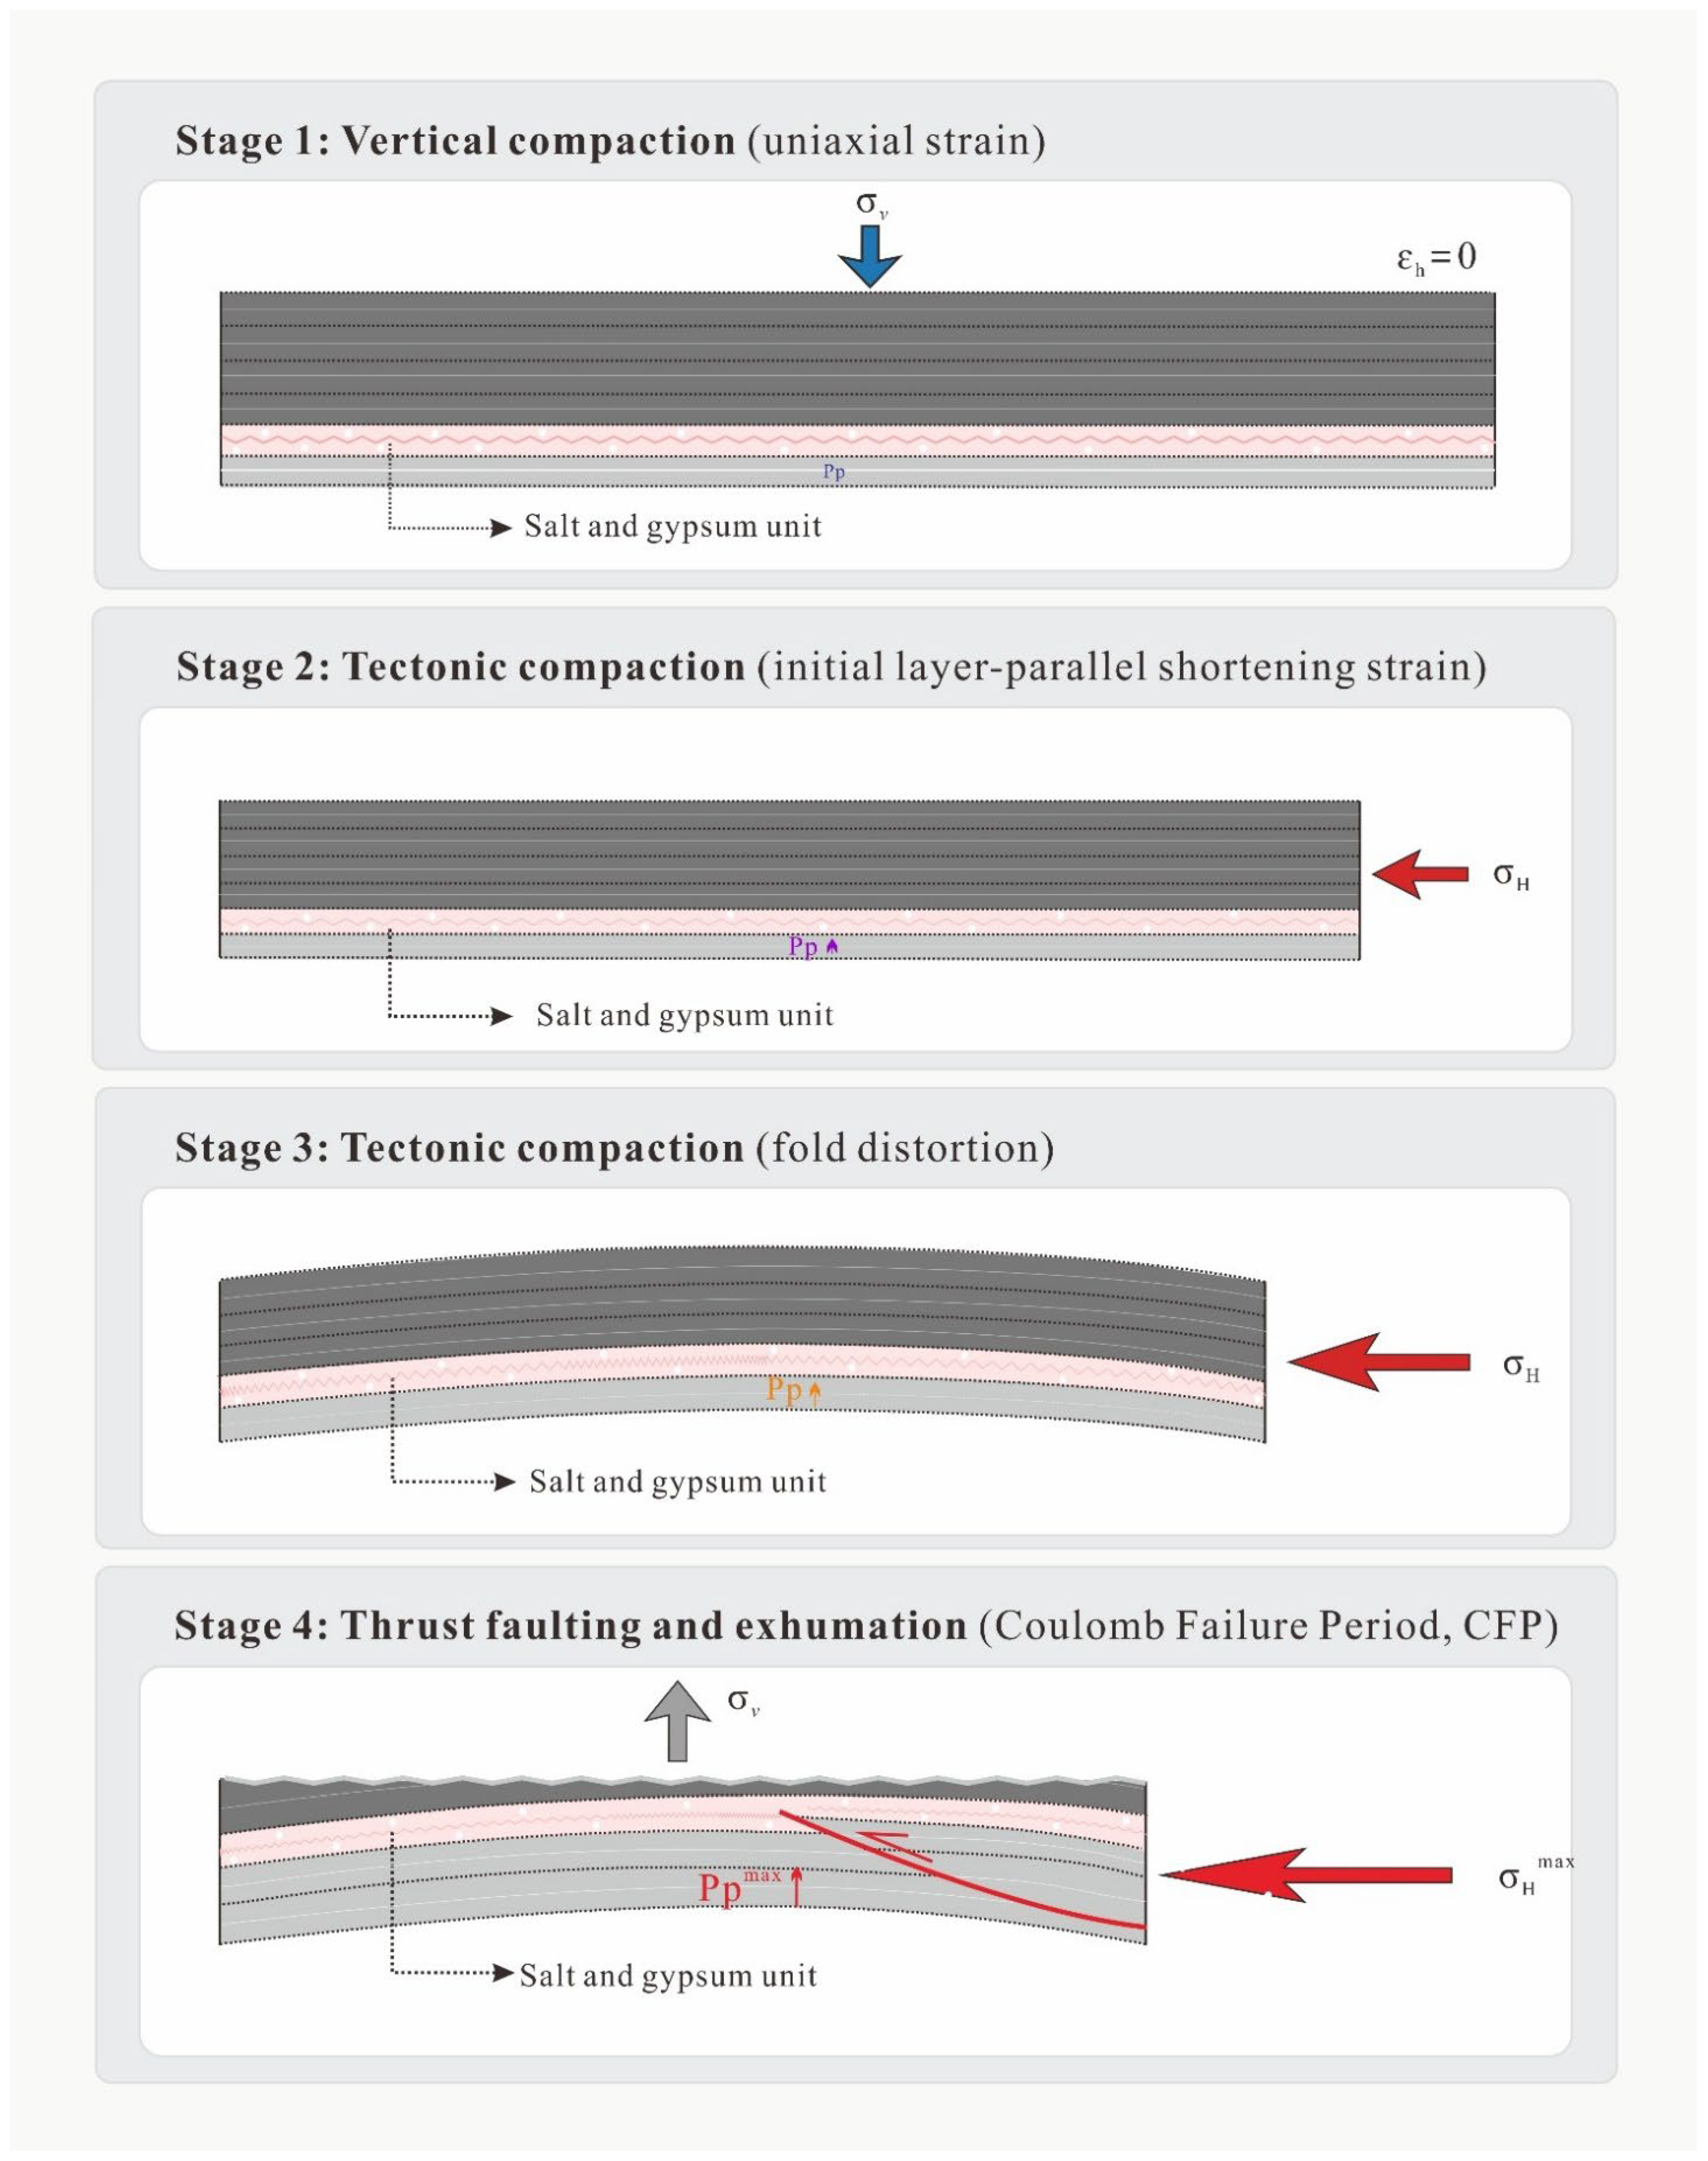
In a strongly compressional tectonic regime, the macroscopic compaction (strain) and pore pressure evolution of rock masses are governed by distinct, continuous poro-mechanical stress paths. Based on fundamental geomechanics and numerical conceptualizations [35], we categorize the loading history into four sequential stages:
Stage 1: Vertical compaction (uniaxial strain). Initially, continuous subsidence drives compaction under strictly vertical loading. The horizontal stresses are coupled to the vertical stress via the lateral earth pressure coefficient at rest (Kv), maintaining a normal faulting stress state (σv > σH ≈ σh), accompanied by a normal hydrostatic pore pressure (Pp) regime (Figure 3 (Stage 1)).
Stage 2: Initial layer-parallel shortening (onset of tectonic loading). As lateral tectonic compression initiates, the principal stress tensor begins to rotate, and the maximum horizontal stress (σH) surpasses the vertical stress (σv). The rock mass experiences plastic layer-parallel shortening, causing further porosity reduction beyond the gravitational baseline, which consequently triggers the initial build-up of overpressure (Pp) due to poroelastic squeezing and fluid retention (Figure 3 (Stage 2)).
Stage 3: Bulk plastic distortion and shear-induced yielding. With intensified tectonic compression, the dominant thrusting stress state (σH > σh > σv) is firmly established. The rock undergoes profound elastoplastic distortion and folding without macroscopic discontinuous fracture. Driven by the intense lateral volumetric strain, the pore pressure surges significantly toward abnormal levels (Figure 3 (Stage 3)).
Stage 4: Macroscopic rupture and the CFP. When the effective stress path eventually intersects the Coulomb failure envelope, the system enters the CFP. Localized brittle–ductile shear bands and thrust faults initiate. Crucially, this macroscopic rupture fundamentally limits the further accumulation of strain energy and fluid pressure, acting as a geomechanical upper bound. Therefore, the CFP characterizes the ultimate bearing capacity of the formation, perfectly recording the maximum paleo-horizontal stress (σHmax) and the maximum paleo-pore pressure (Ppmax) sustained by the target reservoirs (Figure 3 (Stage 4)).
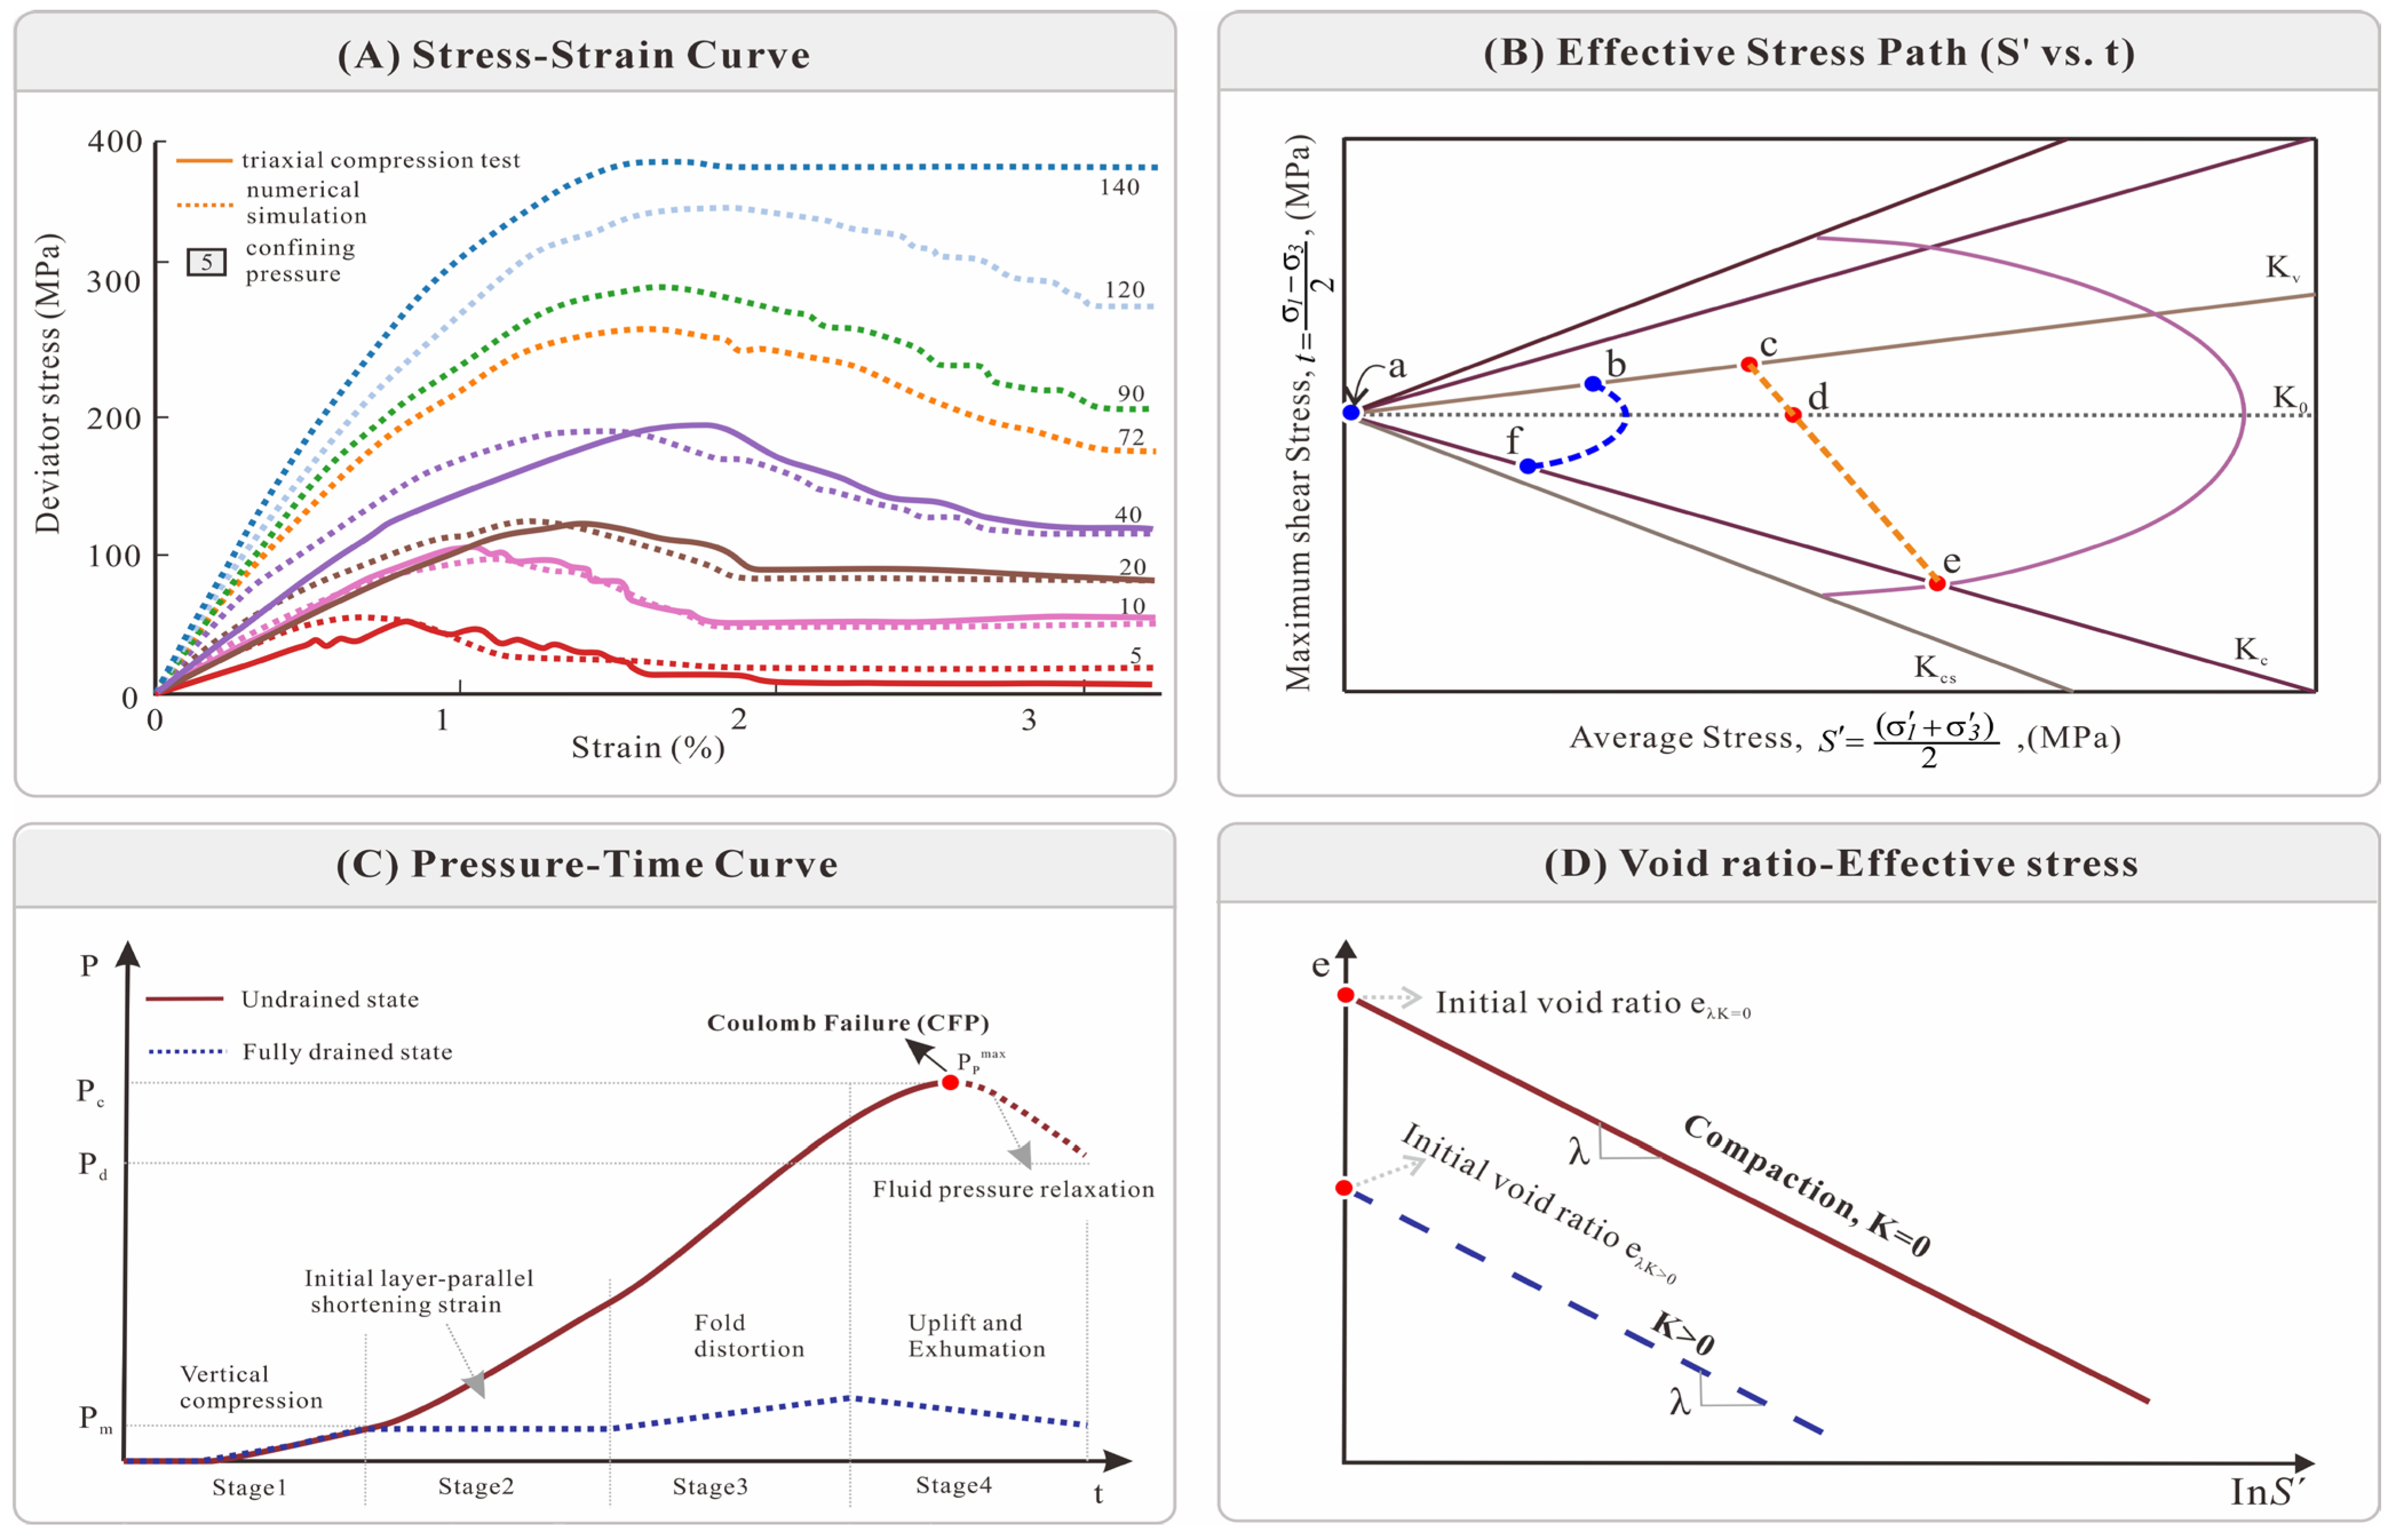
Triaxial compression tests (Figure 4A) reveal a critical confining pressure threshold at approximately 140 MPa—equivalent to a burial depth of ~6000 m [36]. Beyond this threshold, extreme stresses structurally degrade diagenetic cementation, causing the deep mudstones to transition fundamentally from brittle strain-softening to profound ductile strain-hardening (plastic flow) [21]. Given that the maximum paleo-burial depth of the target Bashijiqike formation reached 6200 m during the CFP, it surpassed this brittle–ductile boundary form geomechanical perspective. Therefore, during its primary loading phase at the stress peak, the target formation underwent continuous, matrix-dominated plastic yielding, behaving strictly as a normally consolidated poro-elastoplastic medium. Although subsequent tectonic exhumation to current depths (3500–4100 m) has transformed the rock mass into a heavily overconsolidated state today, it permanently retains the irreversible plastic volumetric strain. This strain serves as a “geomechanical memory” that locked in the extreme paleo-stresses and overpressures accumulated during the CFP. Because this historical stress–strain evolution perfectly mirrors the behavior of critical-state soils undergoing normal consolidation, the application of the Modified Cam-Clay (MCC) elastoplastic model [26] to quantify its paleo-volumetric yielding and pore pressure generation is fully justified.
The evolution of pore pressure is highly sensitive to hydraulic boundary conditions (Figure 4B,C). Fully Drained Scenario: In a fully drained system, pore fluid escapes freely, maintaining a normal hydrostatic pressure regime that only fluctuates with burial depth and subsequent exhumation (Figure 4C). During the initial subsidence, the sediment is vertically compacted under Kv conditions, driving the effective stress state along the Kv consolidation line to point c (Figure 4B). Upon the onset of lateral tectonic compression (Stage 2), the maximum horizontal stress (σH) begins to build up. Because the vertical stress (σv) initially remains the maximum principal stress (σ1), this lateral loading effectively reduces the principal stress difference. Consequently, the stress state evolves from point c to d, characterized by an increase in the mean effective stress (S′) but a temporary decrease in the maximum shear stress (t). As tectonic compression intensifies, σH overtakes σv to become the maximum principal stress. From point d to e, both S′ and t escalate continuously until the effective stress path intersects the failure envelope (Point e), marking the onset of macroscopic frictional sliding.
Undrained Scenario and CFP Decoupling: Conversely, in heavily compacted, low-permeability mudstones, fluid retention enforces a strictly undrained (closed) boundary condition. This constant-porosity (isochoric) constraint prohibits volumetric strain, forcing the effective stress path to follow a specific yield contour (dashed blue line, path b f in Figure 4B). Along this trajectory, as the total tectonic stress increases, the trapped fluid bears the majority of the applied load. Consequently, while the maximum shear stress (t) escalates, the mean effective stress (S′) remarkably decreases (shifting leftward on the S′ − t plane). This drives the continuous and extreme generation of anomalous pore pressure (Pp) (Figure 4C). Ultimately, when the undrained stress path reaches the Coulomb failure state (Point f), the system enters the Coulomb Failure Period (CFP, Stage 4). At this critical juncture, macroscopic rupture accommodates further strain via fault slip, causing the tectonic stress and fluid pressure to fundamentally decouple. The pore pressure reaches its mechanical upper limit (Ppmax) and subsequently drops or relaxes during the structural exhumation and unloading phase (Figure 4C).

3.2. Mathematical Formulation

The theoretical foundation of the Critical State Soil Mechanics (CSSM) framework is the robust semi-logarithmic relationship between the specific volume (quantified by void ratio, e) and the mean effective stress (S′) (Figure 4D). The compaction state is defined by the void ratio:
e = φ 1 φ
where ψ is the porosity of the rock matrix. Along the Normal Consolidation Line (NCL), this relationship is governed by
e = e 0 λ I n S
where e0 is the reference initial void ratio dependent on the applied stress ratio, and λ is the elastoplastic compressibility index (slope of the NCL in the e − lnS′ plane in Figure 4D).
For plane-strain tectonic regimes, the 2D mean effective stress (S′) and maximum shear stress (t) are formulated as
S = σ 1 + σ 3 2
t = σ 1 σ 3 2
where σ1′ and σ3′ are the major and minor principal effective stresses, respectively. The stress trajectory in the S′ − t invariant space is dictated by the stress ratio (K):
K = t S
For idealized isotropic compaction (K = 0), where t = 0 and Siso′ = (σ1′ + σ3′)/2, Equation (2) can be transformed into the volumetric relationship:
e = e λ i s o λ I n S i s o
Under anisotropic loading (K > 0), the compaction locus remains parallel to the isotropic line:
e = e λ K λ I n S K
where eλk is the adjusted intercept for the specific stress ratio. By combining Equations (6) and (7), this intercept relates to the isotropic reference via:
e λ K = e λ i s o + λ I n S K S i s o
In the generalized stress space, the MCC yield surface represents the boundary of the elastic domain. Mapping this yield surface to the required invariants yields the governing ratio:
S K S i s o = M / 3 2 M / 3 2 + K 2
where M is the slope of the critical state line (CSL). It is intrinsically linked to the material’s internal friction angle (ϕ) via the rigorous 3D spatial relationship:
M = 6 sin ϕ 3 sin ϕ
By combining Equations (8) and (9), the generalized intercept (eλK) under any specific stress ratio becomes:
e λ K = e λ i s o + λ I n M / 3 2 M / 3 2 + K 2
During Stage 1 uniaxial vertical compaction, the corresponding stress ratio (Kv) remains a constant value defined by the material properties:
K v = 2 1 + 1 3 M 2 1
When the rock element reaches the Coulomb failure state during lateral tectonic compression (Stages 3 to 4), the ratio of the maximum to minimum principal effective stress satisfies:
σ 1 σ 3 = 1 + sin ϕ 1 sin ϕ
Therefore, by combining Equations (3)–(5) and (13), the critical stress ratio (Kc) at failure is geometrically derived as
K c = sin ϕ
To explicitly determine the mean effective stress at the Coulomb failure state (Sc′), we combine the critical stress ratios with the undrained isochoric condition. By substituting Equations (7), (10), (11) and (14) (For the detailed mathematical derivation process, please refer to Appendix A), Sc′ is rigorously resolved:
I n S C = e λ i s o e λ + I n 12 sin 2 ϕ 6 sin ϕ + 21
At the onset of tectonic Coulomb failure, σ1′ equates to the horizontal maximum effective stress (σH′), and σ3′ corresponds to the vertical effective stress (σv′). Combining Equations (3) and (13), the vertical effective stress is explicitly calculated as
σ v = S C ( 1 sin ϕ )
Consequently, the absolute pore fluid pressure (Pc) of the Coulomb Failure Period is obtained by Terzaghi’s principle:
P = σ v σ v
To explicitly decouple the pressure generation mechanisms, the pore pressure induced strictly by pure vertical loading (mean stress variation, Ps) is isolated as
P s = σ v ( 1 sin ϕ ) e e λ i s o e λ
The residual magnitude (Pc − Ps) quantifies the shear-induced (deviatoric) tectonic overpressure. Furthermore, the intermediate principal effective stress (σ2′ = intermediate principal effective stress, corresponding to σh′) in this 3D stress regime can be rigorously determined by the generalized flow rule:
σ 2 σ 3 σ 1 σ 3 = 9 K 2 + 2 K 3 M 2 + 18 K 4 K ( M 2 + 9 )

4. Results

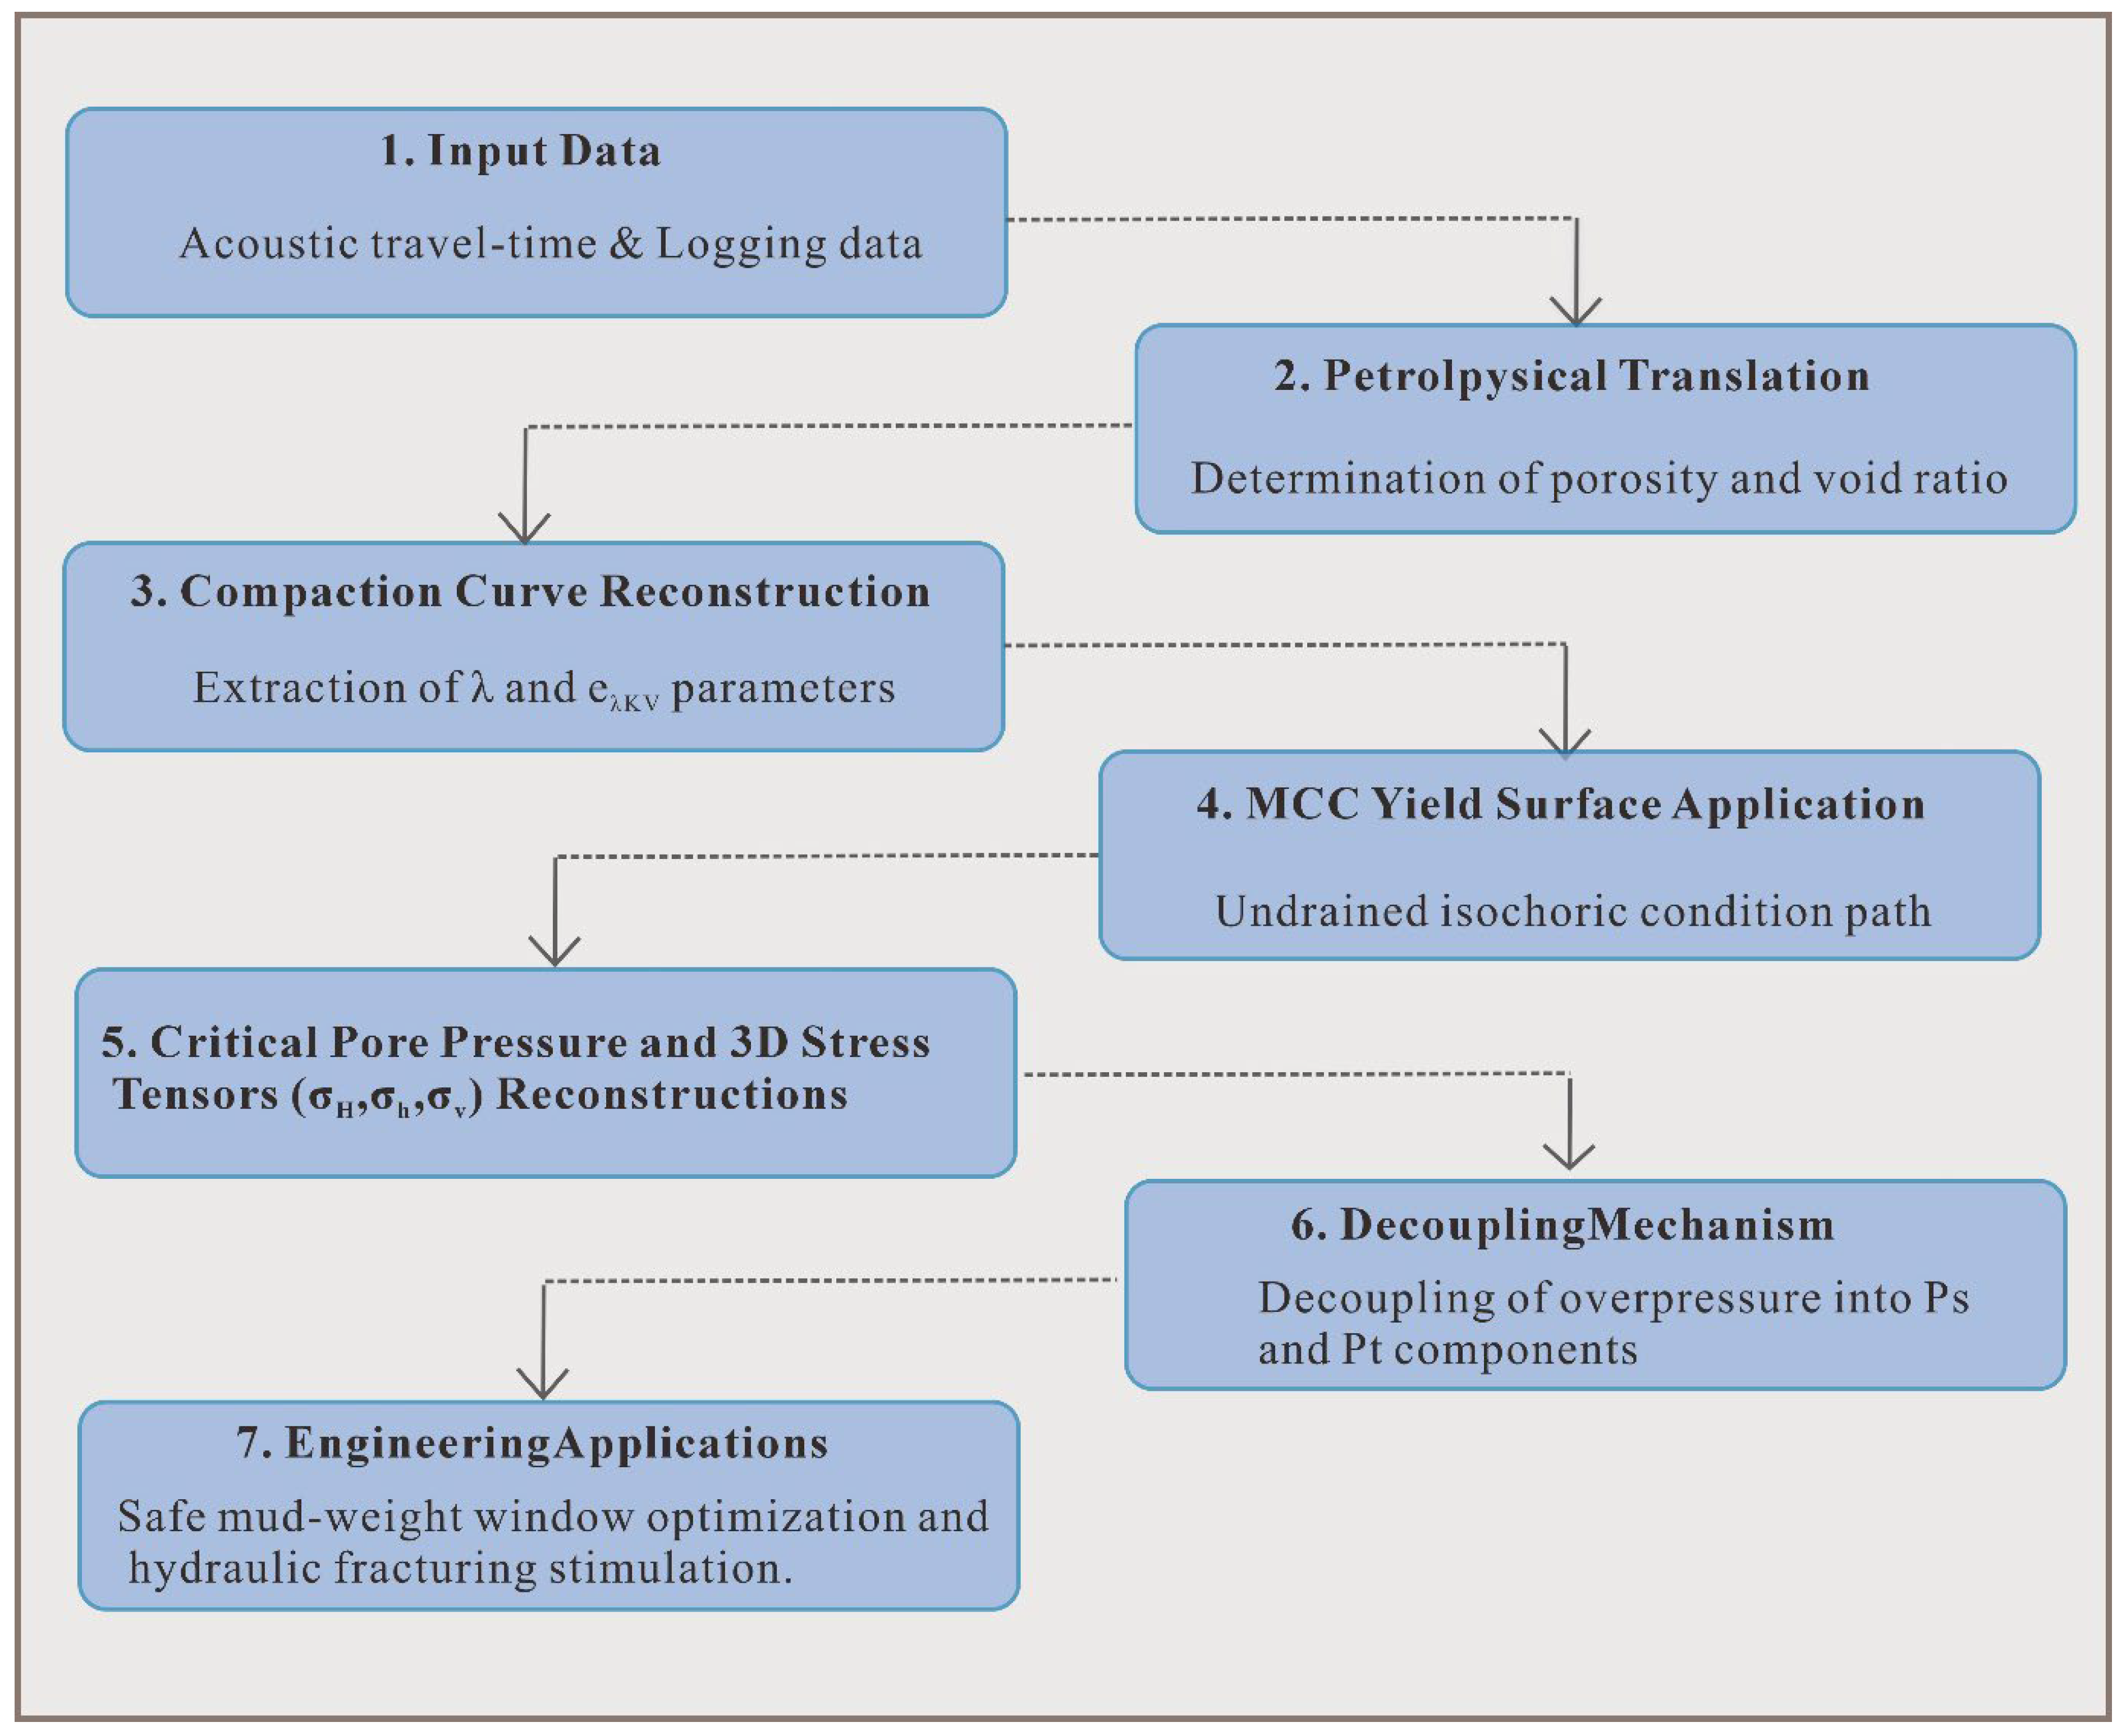
To bridge the theoretical poro-elastoplastic formulations developed in Section 3 with the field-scale quantitative evaluation of the Kelasu Thrust Belt (KTB), a systematic execution workflow is implemented as illustrated in Figure 5. This integrated workflow guides the transition from raw geophysical inputs to the final 3D stress tensors, overpressure partitions, and their subsequent engineering applications.

4.1. Determination of Poro-Elastoplastic Material Parameters

The implementation of the proposed poro-elastoplastic model relies on three fundamental material parameters: the effective internal friction angle (ϕ), the elastoplastic compressibility index (λ), and the reference void ratio intercept (eλKv). The effective friction angle (ϕ) defines the critical state boundary and was experimentally calibrated. Based on triaxial compressive rock mechanics tests on deep mudstone cores from the region (Figure 4A), the mean effective friction angle is determined to be 35.5° [37].
The parameters λ and eλKv characterize the intrinsic compaction behavior of the argillaceous matrix under uniaxial strain (Kv) conditions. However, in strongly compressional and tectonically active settings like the KTB, the present-day in situ compaction state is heavily perturbed by intense tectonic lateral compression, overpressure transfer, and significant post-orogenic uplift and exhumation [33,38]. These subsequent geological events significantly obscure the original virgin compaction trend that prevailed during the basin subsidence phase [30].
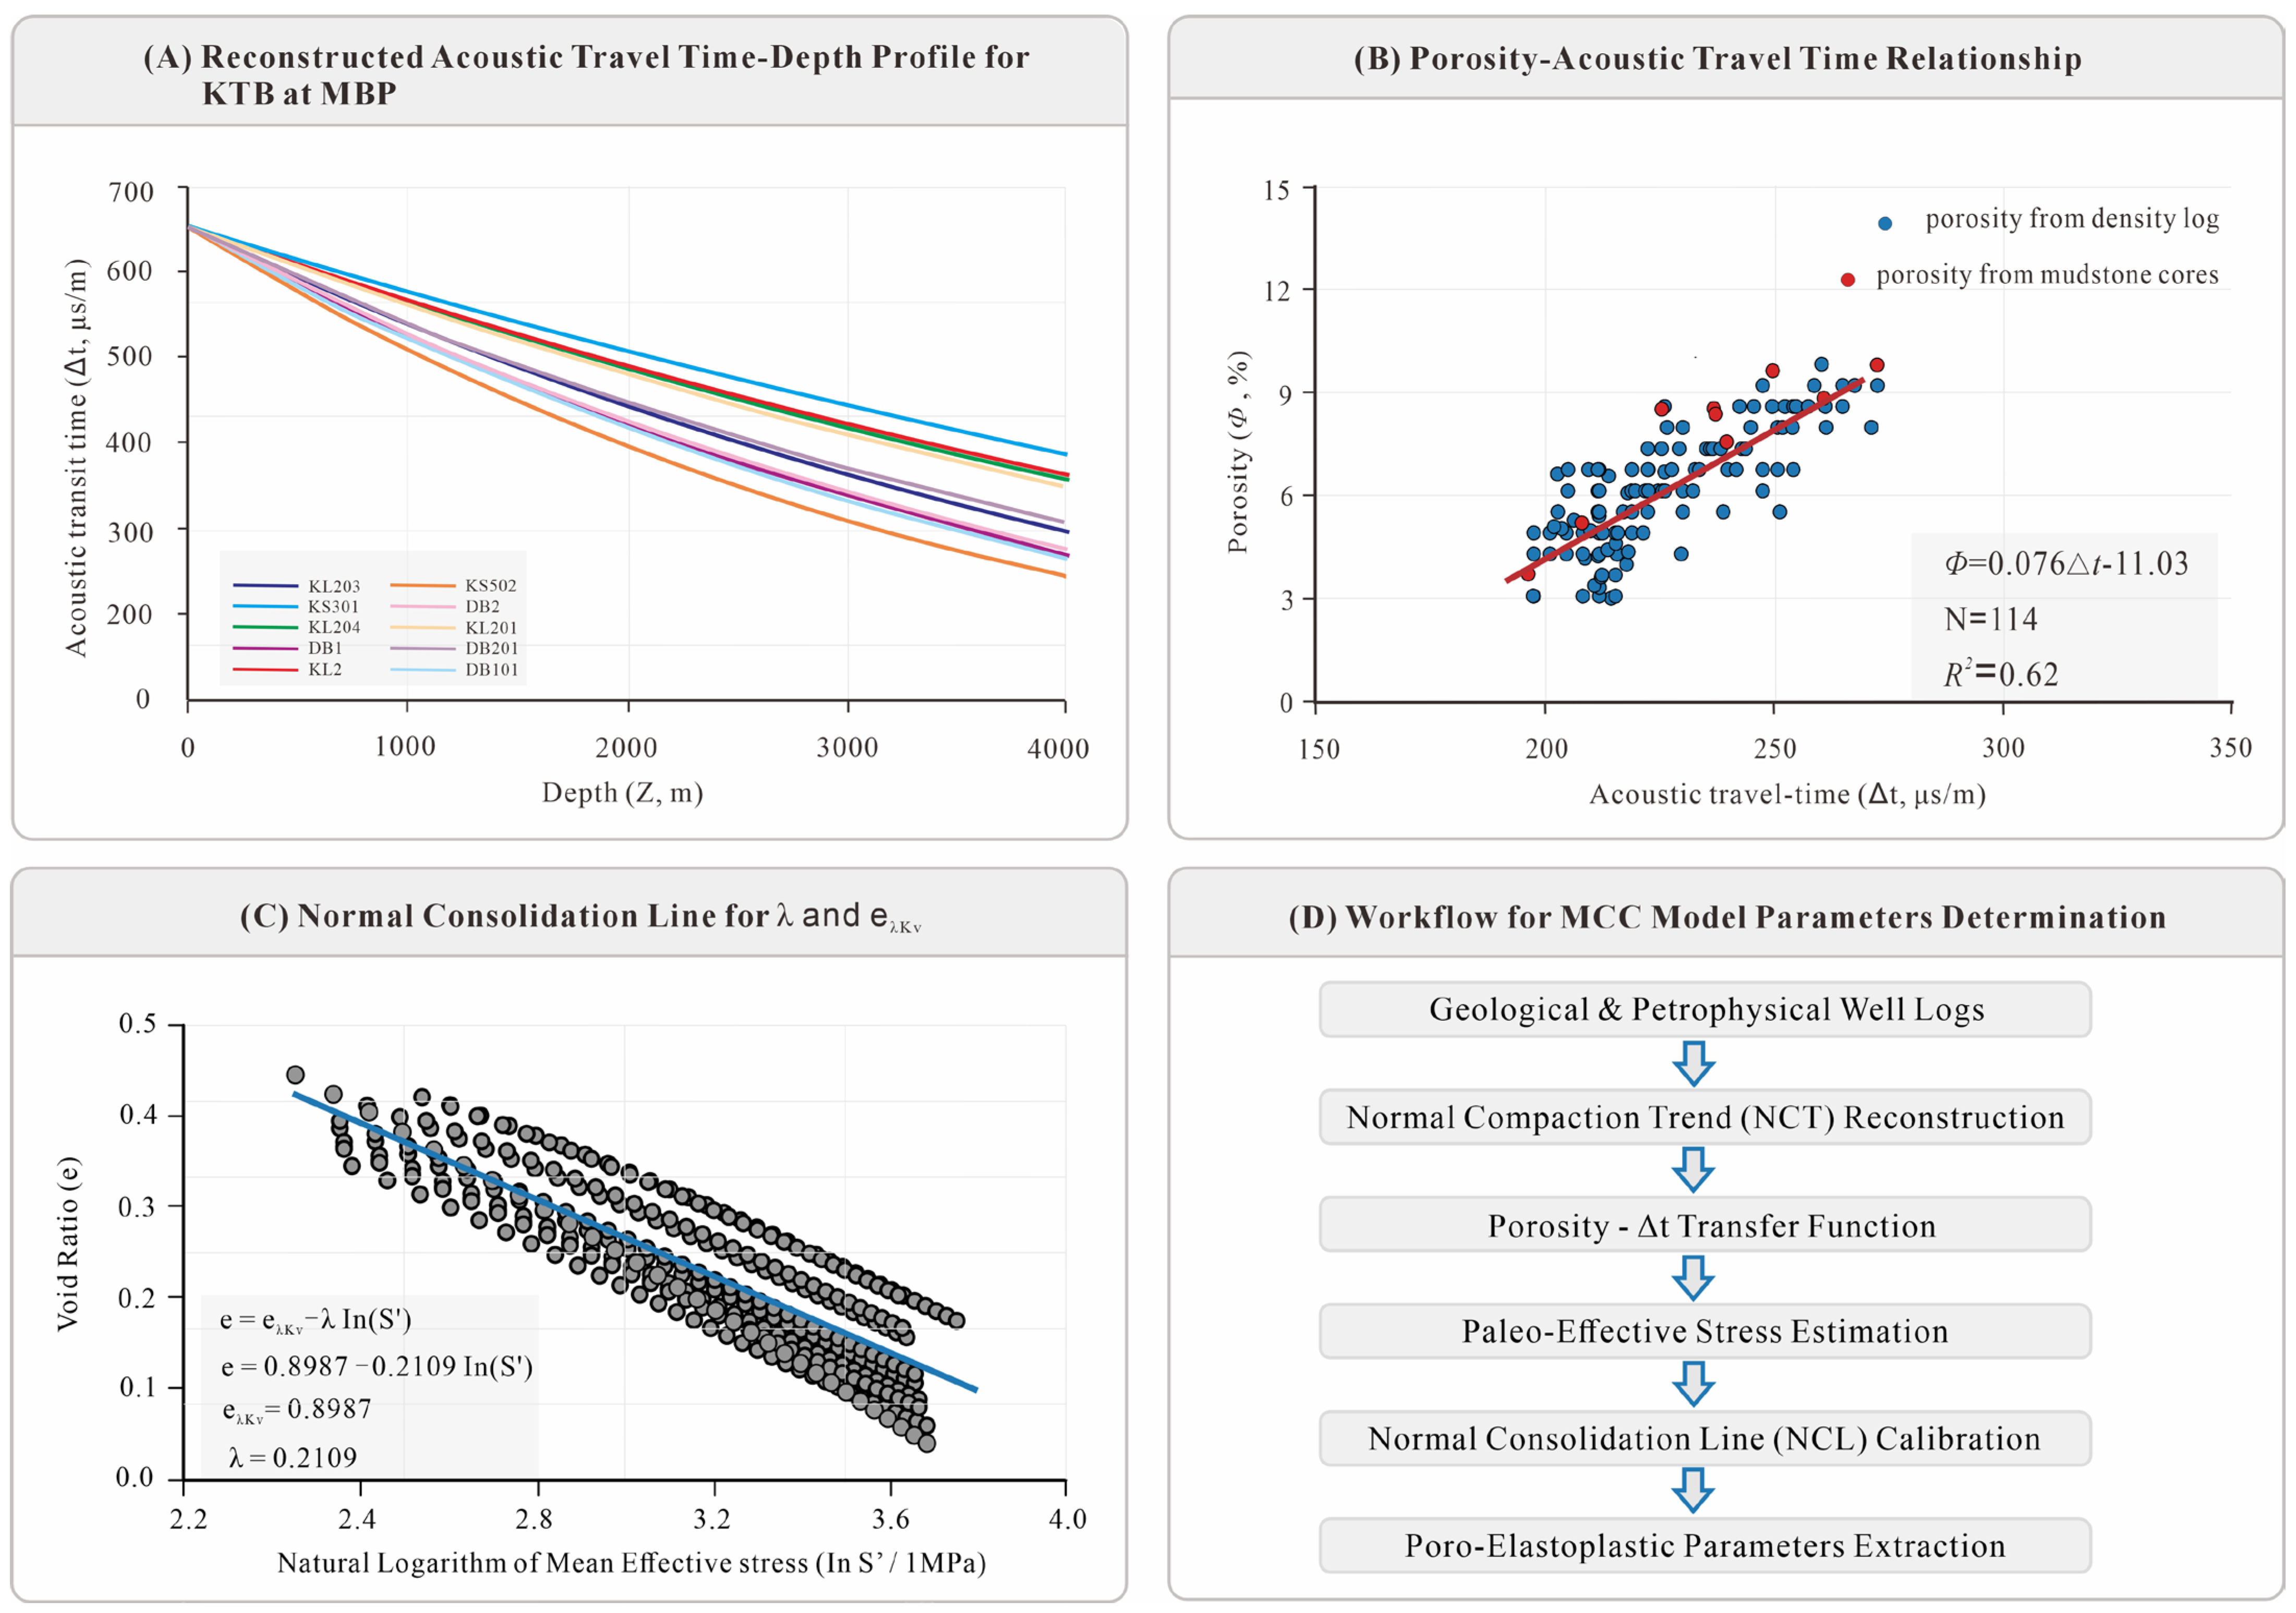
To accurately capture the pure KV consolidation baseline, it is imperative to reconstruct the initial vertical loading trajectory corresponding to the maximum burial period (MBP). Following established geomechanical workflows [33], we reconstructed the MBP compaction curves for the KTB mudstones by correlating acoustic travel time with burial depth (Figure 6A). This baseline model is rigorously calibrated using analogous weakly compressed mudstones from the southern gentle slope of the basin.
Using this reconstructed profile, the matrix porosity at the MBP was derived via the acoustic transit time–porosity relationship (Figure 6B). Subsequently, the material parameters λ and eλKv were extracted by plotting the specific void ratio (e, calculated via Equation (1)) against the natural logarithm of the mean effective stress (lnS) calculated strictly under Kv conditions (Equation (7) (Figure 6C). The systematic workflow for parameter determination is delineated in Figure 6D. For the target formation with ϕ = 35.5, the best-fit constitutive parameters are structurally derived as λ = 0.2109 and eλKv = 0.8987. Furthermore, by combining Equations (10)–(12), the parameter eλiso can be calculated.

4.2. Quantitative Prediction of Pore Pressure and Overpressure Partitions

Applying the generalized mathematical formulations (Equations (15)–(17)) with the calibrated parameters, we quantitatively predicted the critical pore fluid pressure and in situ stress state for KTB at the exact moment of impending structural failure, defined as the CFP.
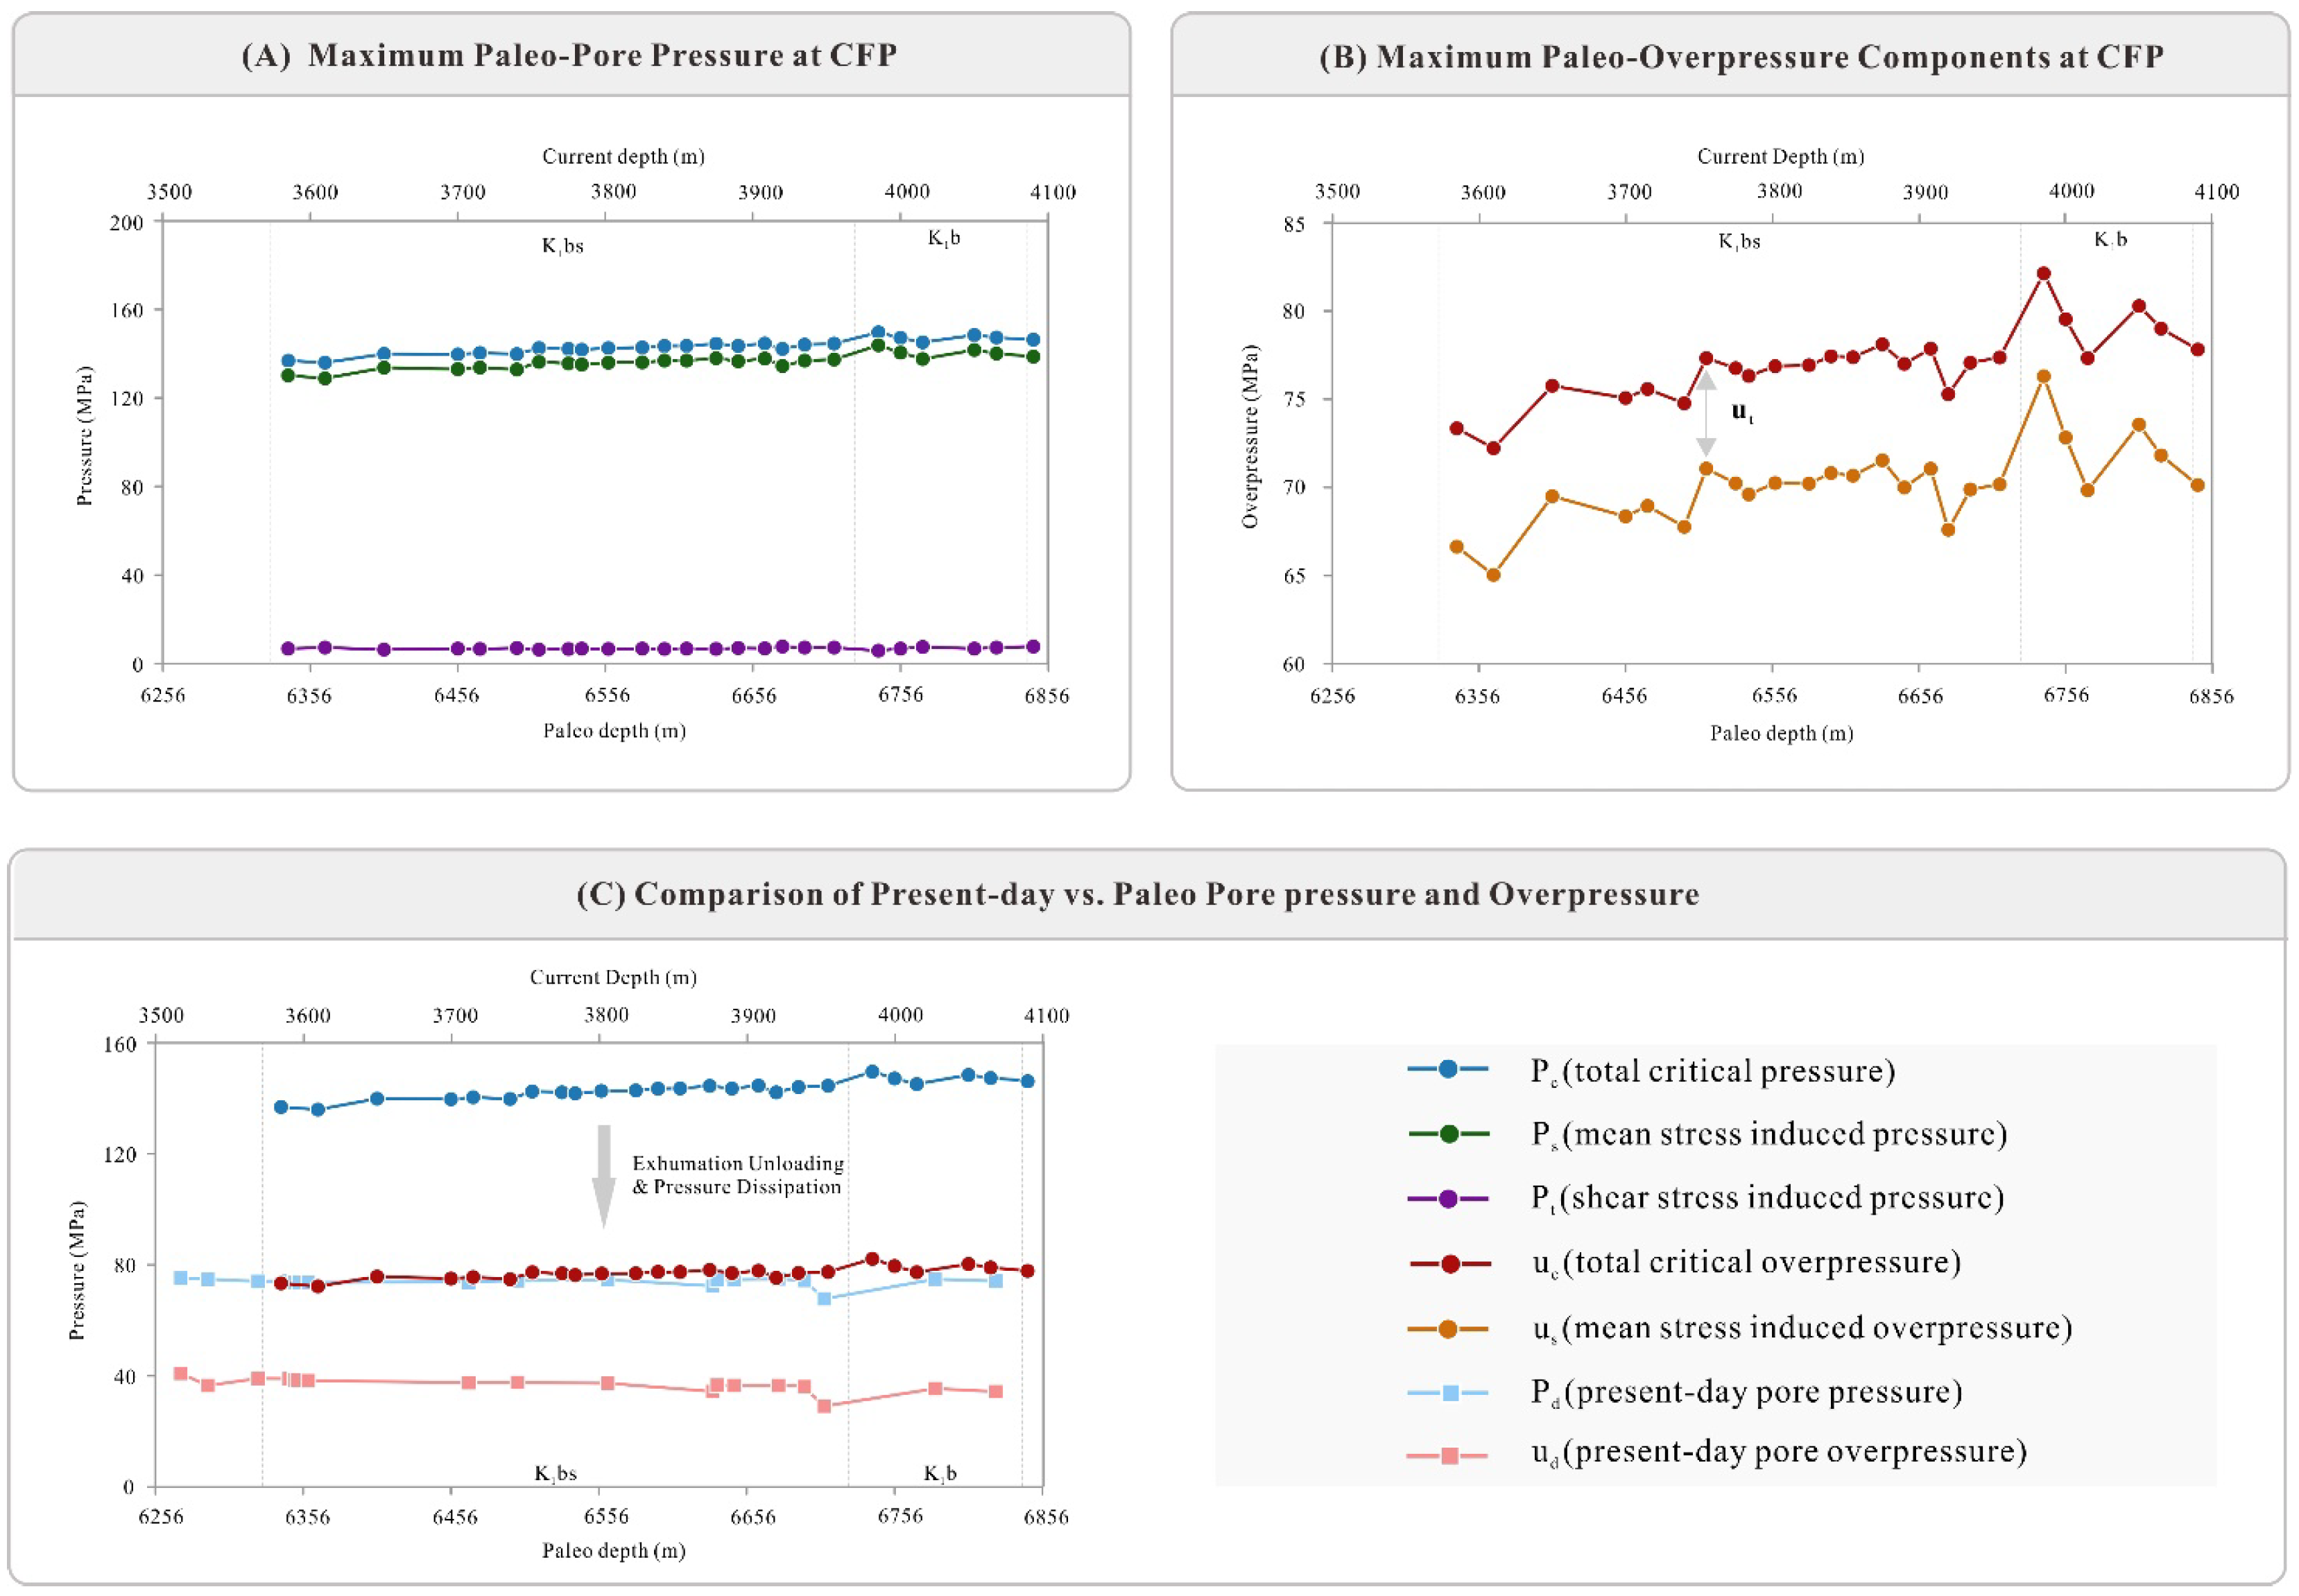
Take Well Kela 2 as an example, where the predicted absolute critical pore pressure (Pc) ranges from 135.9 to 149.6 MPa (Figure 7A). This magnitude scales quasi-linearly with the lithostatic pressure, representing approximately 85.4% to 89.0% of the total overburden stress (yielding a pore pressure ratio, α = 0.85–0.89). This slight increase in the α value is primarily due to the gradual increase in horizontal tectonic stress with burial depth. The deeper formations experience stronger lateral tectonic compression, which continually generates higher tectonic overpressure. This compression-induced pressure increment exceeds the linear lithostatic stress gradient, resulting in the observed upward trend of the pore pressure ratio α at greater depths. This indicates an extreme state of geopressure prior to macroscopic faulting.
The absolute tectonic overpressure (defined as Pc minus the normal hydrostatic gradient) spans from 72.2 to 82.1 MPa, demonstrating a proportional increase with paleo-burial depth (Figure 7B). Crucially, the analytical decoupling of the pore pressure generation mechanisms (Equation (18) reveals that the overpressure induced strictly by volumetric mean stress variations (Ps) is approximately 70.2 MPa, contributing overwhelmingly (~91.1%) to the total overpressure anomaly. In contrast, the purely deviatoric, shear-induced overpressure contributes approximately 6.8 MPa, accounting for the remaining ~8.9% (Figure 7B).
This quantitative partition demonstrates that in the KTB, extreme anomalous overpressure is primarily driven by the dramatic escalation of the mean stress tensor. This surge in mean stress is physically governed by two coupled mechanisms: (1) the intense lateral tectonic compression originating from the Tianshan orogeny, which drastically amplifies horizontal stress; and (2) the concurrent profound continuous sedimentary loading, which maximizes the vertical principal stress.

4.3. Reconstructed 3D Stress Tensor and Effective Stress State at Failure

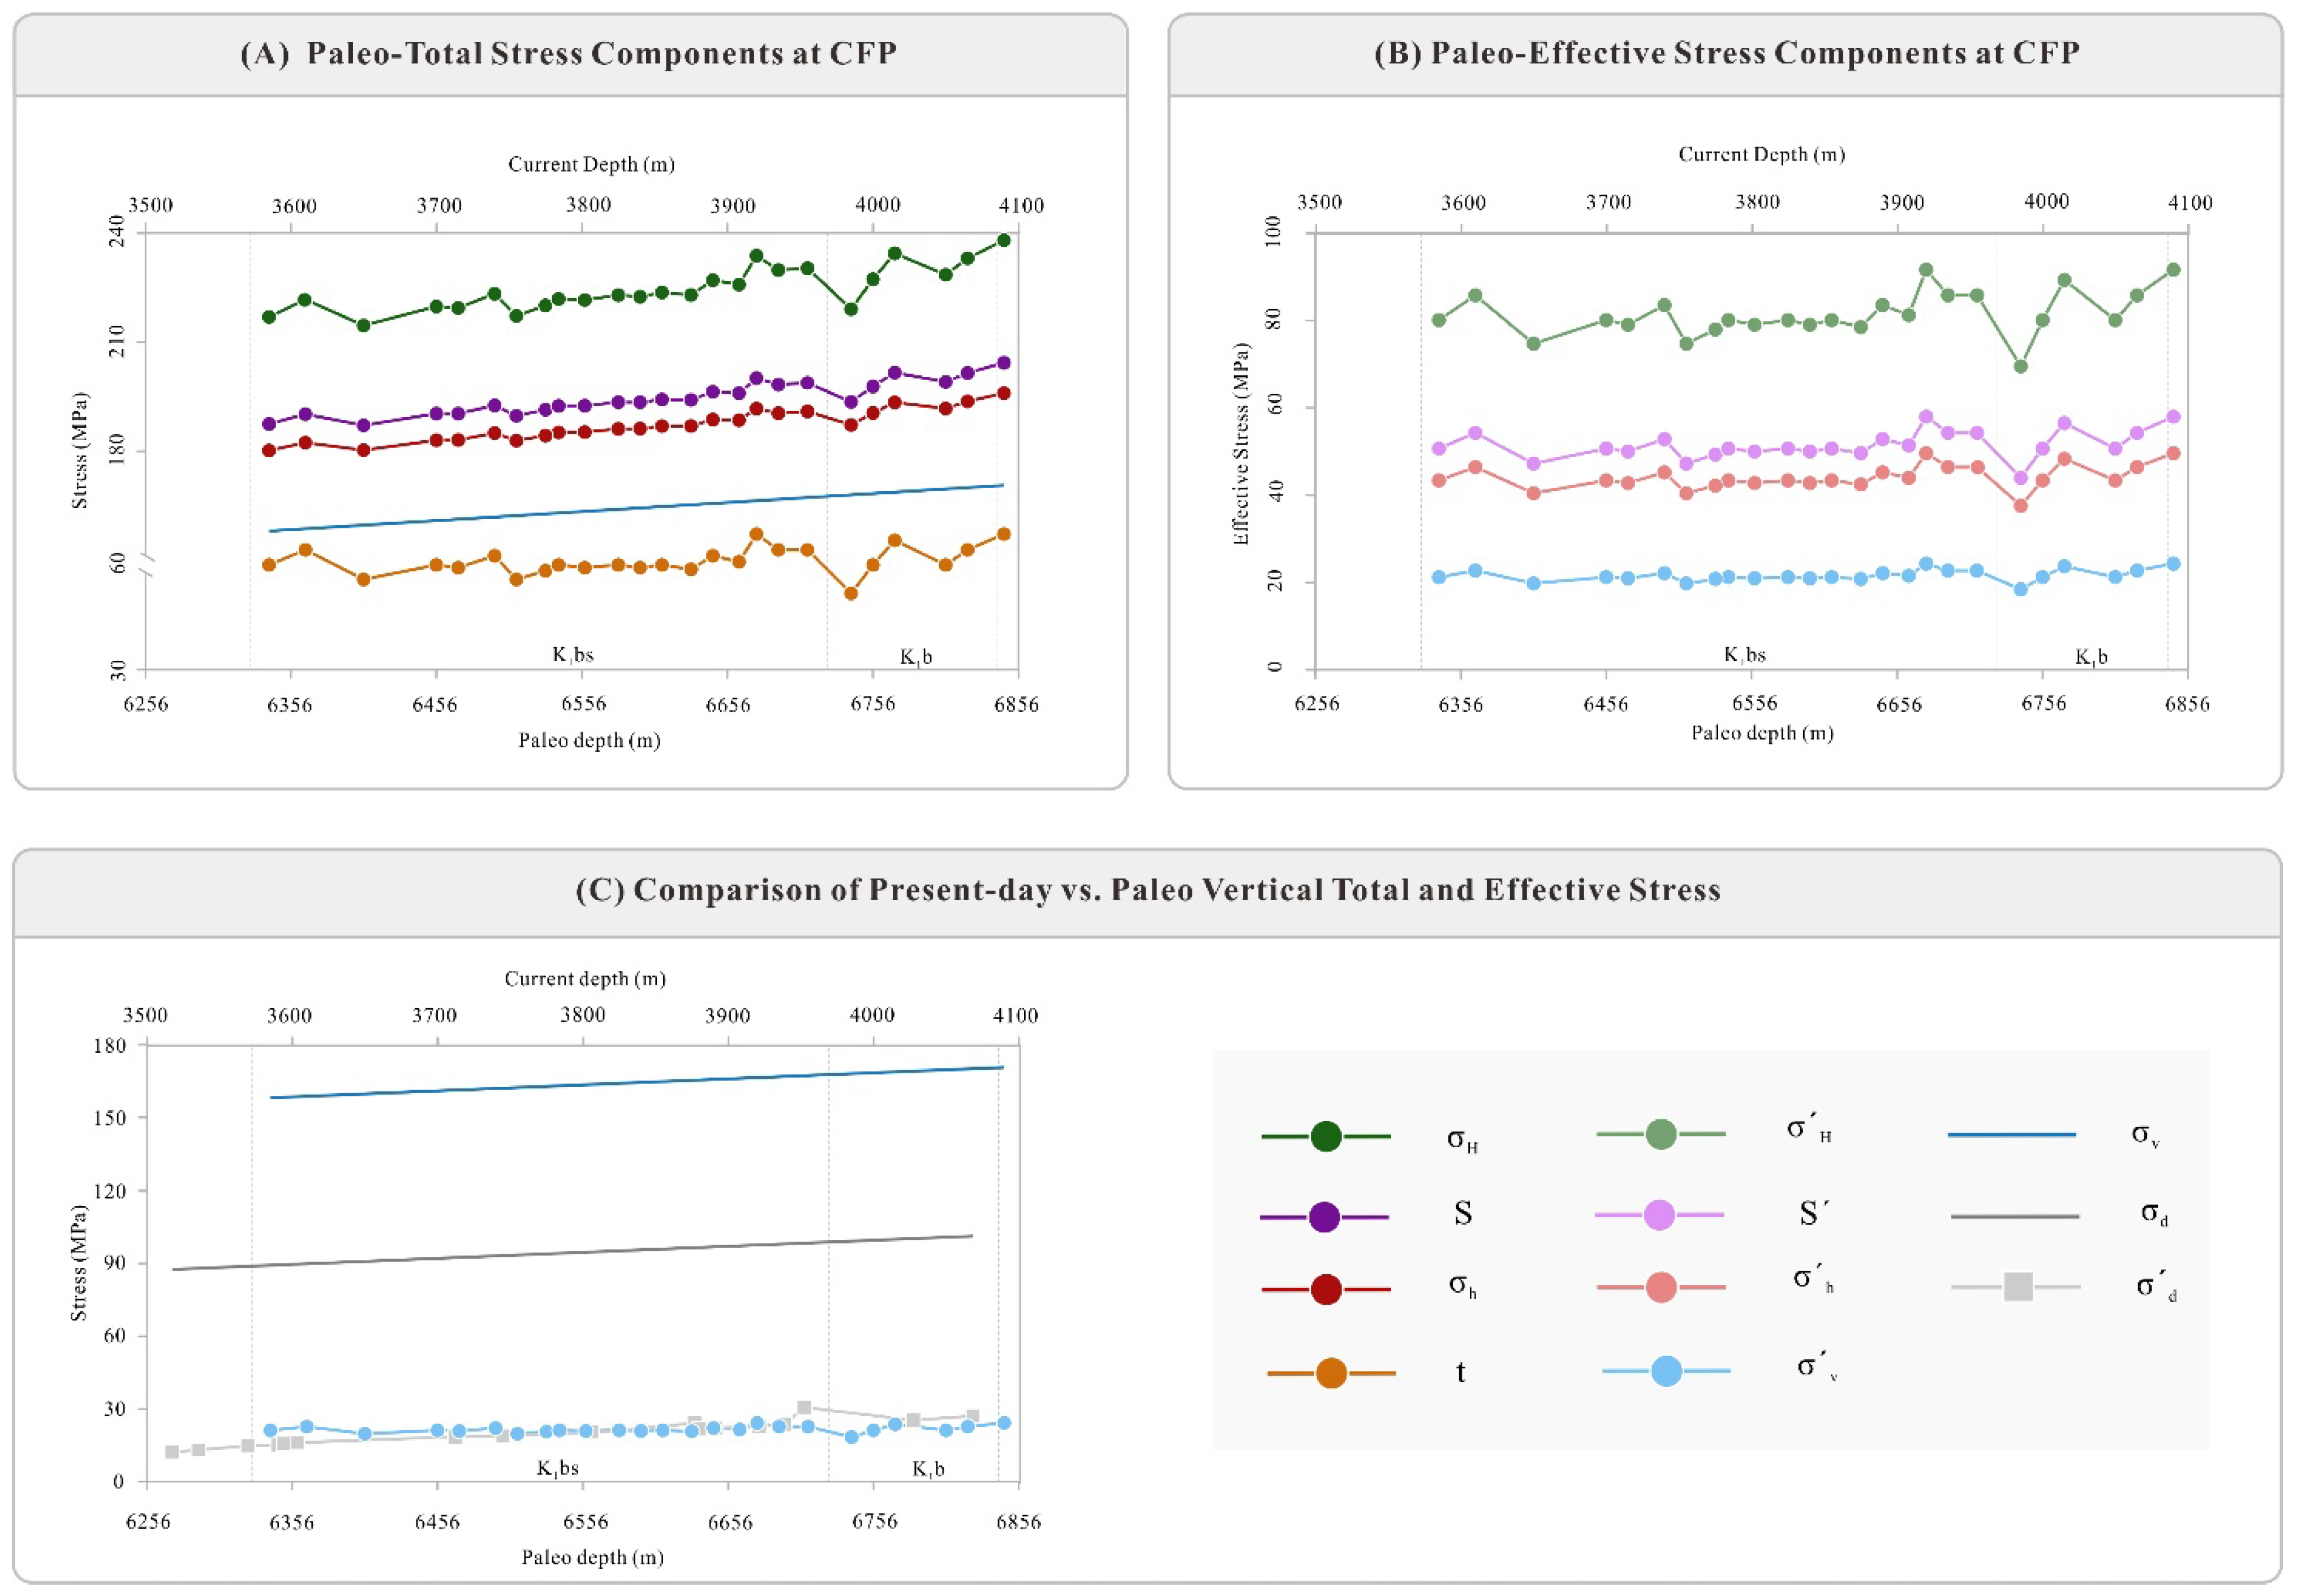
The analytical framework further permits the complete resolution of the 3D stress tensor at the critical failure state. The predicted maximum horizontal principal stress (σH) is exceptionally high, ranging from 214.6 to 237.9 MPa (Figure 8A). Governed by the generalized flow rule constraint (Equation (19), the intermediate principal stress (σh) is bounded between 180.2 and 195.9 MPa. The vertical principal stress (σv), acting as the minimum principal stress, ranges from 158.1 to 170.7 MPa.
This establishes a definitive σH > σh > σv stress hierarchy, perfectly consistent with a classic Andersonian thrust-faulting tectonic regime. The corresponding maximum shear stress (t) ranges from 51.1 to 67.3 MPa, confirming the severe elastoplastic distortion driven by the differential between horizontal tectonic compression and vertical overburden.
In terms of effective stress, the critical maximum horizontal effective stress (σH′) ranges from 69.5 to 91.6 MPa, while the vertical effective stress (σv) is significantly reduced to 18.4–24.3 MPa due to the extreme pore pressure counteraction (Figure 8B). Consequently, the overall mean effective stress (S′), ranging from 43.9 to 57.9 MPa, sits marginally above the vertical effective stress, maintaining the structural integrity of the rock mass precisely until the Coulomb yield criterion is violated.

5. Discussion

5.1. Quantitative Comparison with Alternative Stress and Pressure Evaluation Models

To evaluate the scientific advance and accuracy of the proposed analytical framework, the quantitative results from the Kelasu Thrust Belt (KTB) were systematically compared with alternative modeling methodologies and regional geomechanical observations.
(1)
Comparison with Eaton-type Empirical Formulations
Traditional 1D pore pressure prediction workflows, such as the Eaton-type equivalent depth method, rely solely on vertical compaction disequilibrium assumptions. When applied to the target intervals of Well Kela-2, the conventional Eaton method predicts a critical pore pressure ratio (α) ranging from 0.55 to 0.67. This underpredicts the field-measured Drill Stem Test (DST) pressures and mud weight thresholds (αactual ≈ 0.82–0.88) by up to 35%.
This discrepancy exists because vertical-compaction models assume that anomalous pore pressure is exclusively a function of overburden stress. By incorporating the Modified Cam-Clay (MCC) yield surface, our framework accurately predicts α values of 0.85–0.89, demonstrating that incorporating elastoplastic compaction is essential for safe deep drilling design.
(2)
Alignment with Basin Modeling in Convergent Margins
Our decoupling results indicate that tectonic lateral compression contributes approximately 80–90% to the peak overpressure anomaly. This finding aligns with numerical basin modeling in active margins. For example, in the convergent Hikurangi margin of New Zealand, Burgreen-Chan et al. (2016) [9] demonstrated that incorporation of tectonic strain rate in 3D basin modeling is required to explain overpressure ratios exceeding 0.80, with lateral compression acting as the dominant pressure driver. Similarly, Nifuku et al. (2021) [14] simulated convergent margins and found that rapid horizontal shortening generates massive overpressure compartments due to rapid pore-volume contraction and low-permeability shale seal retention. The excellent alignment of our results with these studies validates the physical consistency of our poro-elastoplastic decoupling mechanism.
(3)
In situ Verification via Drilling-induced Failures and LOT Measurements
Our model predicts an intermediate principal stress (σh) of 180.2–195.9 MPa at failure. To validate our predictions, in situ stress measurements from extended leak-off tests (XLOT) and hydraulic fracturing closure pressures were compiled. The XLOT-derived closure pressure (minimum horizontal stress) at target depths ranges from 175 to 190 MPa, showing a strong correlation with our calculated σh (relative error < 5%). This close agreement confirms that the generalized flow rule utilized in Equation (19) successfully captures the intermediate principal stress state under active thrusting.

5.2. Poro-Mechanical Evolution Path During Uplift and Exhumation

By integrating the CSSM framework, we can retroactively trace the stress and fluid pressure trajectories from the CFP to the present-day state. Comparing the model-predicted paleo-fluid pressure at the rupture stage with present-day in situ measurements (via DST) reveals an average pressure dissipation of 67.8 MPa (Figure 7C).
This substantial pressure reduction can be decoupled into two hydro-mechanical components associated with tectonic exhumation. Approximately 37.2 MPa is directly attributed to the reduction in the hydrostatic fluid column due to continuous stratal uplift. The remaining 36.6 MPa represents the dissipation of the tectonic excess overpressure. Consequently, tectonic uplift and exhumation induced a severe thinning of the overburden, resulting in a lithostatic pressure (σv) drop of approximately 68.8 MPa. However, it is particularly noteworthy that the discrepancy between the paleo and present-day vertical effective stresses (σv′) is exceptionally minimal, averaging only 0.98 MPa (Figure 8C). This strongly implies a synchronous, nearly 1:1 coupled reduction in lithostatic and fluid pressures. The extreme impermeability of the highly compacted argillaceous matrix, bounded by the regionally extensive, high-quality gypsum–salt caprock, severely restricts fluid migration. Under these conditions, the bulk formation approximates an undrained unloading regime during exhumation. In stark contrast to the continuous loading phase (where both σv and P increase), the unloading phase accommodates the removal of overburden weight primarily through fluid depressurization, maintaining a nearly constant effective stress state. This supports the hypothesis that, barring transient fracture reactivation (fault-valve behavior), the deeply buried geopressured system behaves as an undrained poro-elastic medium during macroscopic tectonic uplift.

5.3. Quantitative Decoupling of Overpressure: Vertical Compaction vs. Tectonic Compression

By tracing the undrained stress–fluid evolution paths (Figure 4B), the specific geological drivers of overpressure can be rigorously decoupled. During the initial subsidence phase, the isolated sediment undergoes vertical loading. Using Terzaghi’s effective stress principle, the fluid pressure generated precisely at the MBP (corresponding to Point b in Figure 4B) can be mathematically isolated. This pressure magnitude strictly represents the contribution of purely vertical loading, classically defined as the undercompaction-induced pressure increment.
Subsequently, as severe lateral shortening initiates, the stress state is driven from Point b to the ultimate Coulomb Failure Period (CFP, Point f in Figure 4B). The substantial pore pressure accumulated along this specific trajectory isolates the tectonic compression-induced increment, which is generated exclusively by horizontal boundary stresses.
Quantitative evaluation reveals a striking disparity: classical vertical undercompaction contributes a mere 10–20% to the total excess pore pressure. In stark contrast, horizontal tectonic compression acts as the absolute dominant mechanism, accounting for approximately 80–90% of the anomaly. This overwhelming dominance of tectonically driven pressurization aligns perfectly with the extreme lateral shortening rates documented in the Kuqa foreland basin. Therefore, the present-day anomalous fluid pressure is fundamentally a composite geomechanical product: initialized by vertical undercompaction, overwhelmingly dominated by horizontal tectonic compression, and ultimately modified by exhumation-induced depressurization.
To address the inherent geological uncertainty regarding erosion thickness (ranging from 1200 to 3200 m), a systematic sensitivity analysis was performed. Perturbing the exhumation depth by ±1000 m yields a corresponding pore pressure variation of ±5.4 MPa at the CFP. While absolute pressure values fluctuate, the fundamental conclusion—that lateral tectonic compression is the absolutely dominant overpressure mechanism—remains robust and mathematically insensitive to the precise erosion boundary condition.

5.4. The Rheological Influence of Internal Friction Angle (Φ)

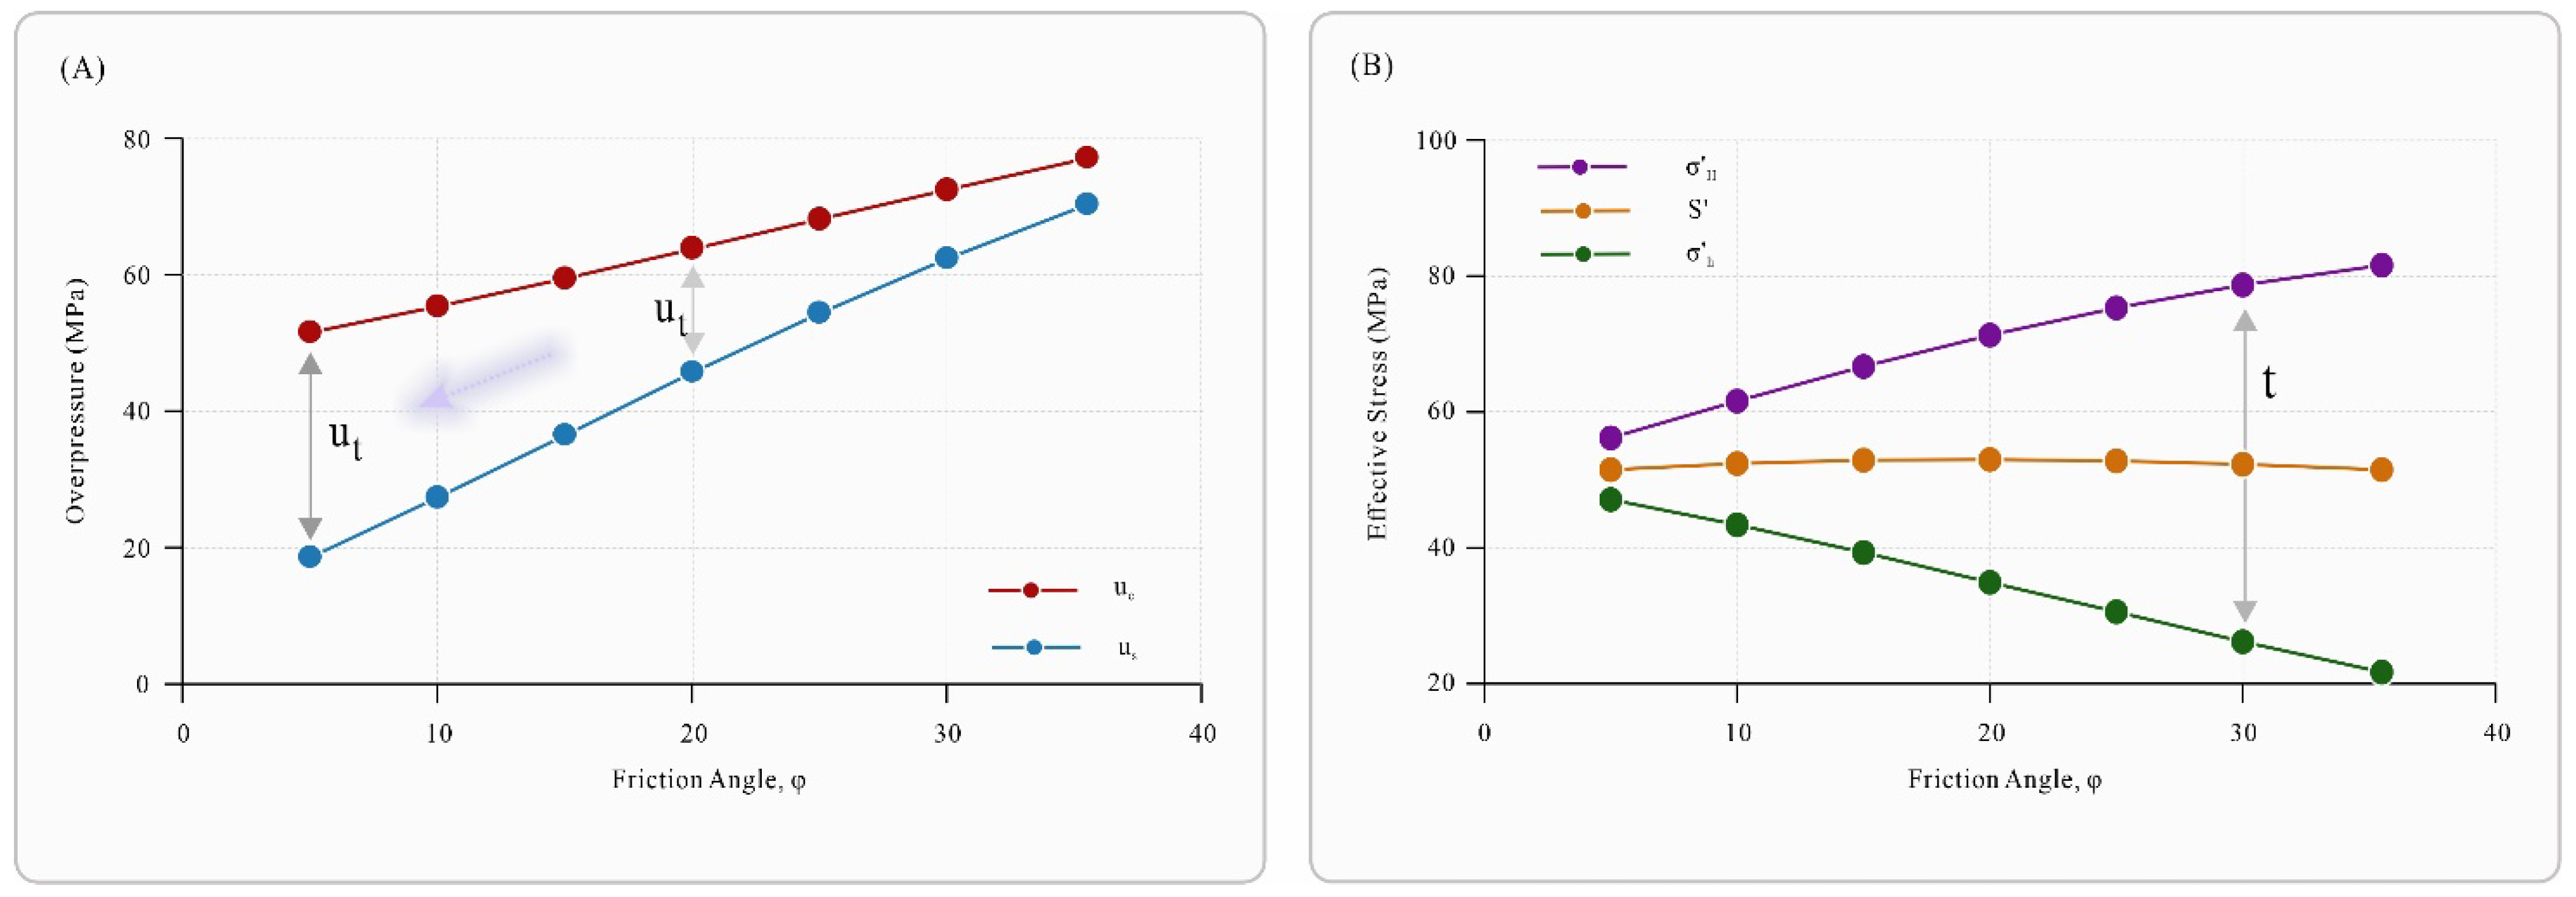
A critical parameter dictating the elastoplastic response is the internal friction angle (ϕ). Parametric analysis demonstrates that, keeping other variables constant, reducing ϕ from 35.5 to 5 significantly depresses the total predicted overpressure (uc, Figure 9A). Mechanistically, according to Equation (16), a lower friction angle necessitates a proportionally higher vertical effective stress to intersect the Coulomb failure envelope, thereby requiring less total pore pressure to balance the constant lithostatic load. Correspondingly, the ultimate maximum shear stress (t) and maximum horizontal effective stress (σH′) at failure decay as the friction angle decreases (Figure 9B).
However, an intriguing poro-mechanical phenomenon emerges when decoupling the components: at extremely low friction angles (e.g., ϕ = 5), the absolute magnitude of the shear-induced overpressure (represented by the gap uc-us in Figure 9A) is substantially greater than that at higher friction angles (ϕ = 35.5). This is intrinsically linked to the geometry of the MCC yield surface in the p′ − q invariant space. Based on Equations (10) and (12), a decrease in ϕ flattens the slope of the critical state line (M) and simultaneously increases the stress ratio (Kv). Consequently, the stress trajectory required to transition from the initial Kv elastic domain to the dilated Coulomb failure state must traverse a considerably longer distance across the yield surface. This extended plastic strain path mobilizes a profoundly greater degree of undrained shear-induced volumetric contraction, directly translating to amplified deviatoric pore fluid pressures.
It is worth noting that while the typical internal friction angle (φ) of lithified mudstones ranges from 25° to 40° under normal geological conditions, this study deliberately extends the sensitivity analysis down to an extreme value of φ = 5°. The rationale for incorporating this extreme scenario is twofold. First, it serves as an end-member boundary test to evaluate the mathematical stability and physical limit of the proposed model under extreme lithological conditions. Second, φ = 5° represents an equivalent mechanical state in specific geological processes, such as the fluidization of mudstones during mud diapirism, or the severe shear strength degradation within localized clay-rich fault slip zones under elevated overpressure. By including this extreme case, we present a more comprehensive parametric spectrum that enhances the theoretical completeness of the sensitivity analysis.

5.5. Limitations, Boundary Conditions, and Future Directions

Compared to traditional 1D vertical poro-elastic compaction models, the proposed elastoplastic framework offers a physically rigorous method for predicting extreme pressure states within complex, 3D non-uniaxial tectonic regimes. It facilitates the precise decoupling of mean-stress and shear-stress-driven pore pressure increments (Equations (18) and (19)), overcoming spatial limitations inherent to sparse borehole calibration or fluid-inclusion paleo-pressure techniques.
However, the application of this critical-state analog relies on fundamental constitutive assumptions, which also point to key future research directions:
(1)
Thermodynamic and Stress Thresholds: The analogy between lithified mudstones and critical-state soils requires specific high-stress boundary conditions. Our triaxial experiments confirm that diagenetic cementation dictates brittle behavior at shallow depths. The continuous plastic flow and volumetric yielding essential for the MCC framework are exclusively activated when the confining pressure exceeds 140 MPa. Thus, the model is strictly applicable to ultra-deep regimes (>6000 m), where extreme lithostatic stresses and elevated temperatures (>140 °C) overcome shallow-level brittleness, forcing the matrix into a ductile, strain-hardening state. Future extensions should couple this framework with thermo-hydro-mechanical (THM) formulations to explicitly model temperature-dependent evolution of MCC parameters under extreme geothermal gradients (>140 °C), as conceptualized by Casey et al. (2016) [20].
(2)
Constant Elastoplastic Parameters: The current formulation assumes a constant compression index (λ) and friction angle (ϕ). Contemporary geomechanics recognizes stress-dependent degradation of these parameters under extreme confinement [39,40]. While adopting constant values represents a first-order mechanical simplification, future improvements will incorporate non-linear degradation laws (e.g., Fjaer et al., 2008 [39]; Casey, 2014 [40]) to capture continuous rock matrix damage. Nevertheless, current sensitivity analyses confirm that the constant-parameter assumption successfully captures fundamental macro-yielding trends without obscuring the dominant tectonic mechanism.
(3)
Negligible Elastic Rebound (κ ≪ λ): Treating the mudstone matrix as undergoing irreversible plastic compaction during exhumation implies neglecting the poro-elastic swelling index (κ). For deeply buried, highly overconsolidated mudstones,κ is typically an order of magnitude smaller than λ. Hence, the porosity expansion driven by elastic relaxation during uplift is mathematically insignificant compared to the primary tectonic plastic contraction. To rigorously validate the calculated stresses (especially σh), integrating core-based Anelastic Strain Recovery (ASR) measurements and image log breakout widths will be an essential validation protocol in future field applications.
(4)
Static Peak Pressure vs. Transient Dynamics: Finally, the model analytically resolves the peak fluid pressure (Pc) immediately preceding macroscopic Coulomb failure. It does not account for transient, post-failure hydro-mechanical behavior, such as rapid pressure bleed-off induced by fault-rupture permeability surges (fault-valve mechanisms) [41]. Future research extending this framework to incorporate fault-valve dynamic models (e.g., Wang et al., 2024 [41]) and time-dependent creep will further refine the temporal prediction of geopressure evolution.
It is worth noting that while the reconstructed minimum horizontal stress (σh = 180.2–195.9 MPa) is highly consistent with the in situ XLOT and hydraulic fracturing closure pressures (175–190 MPa, relative error < 5%), a systematic cross-well validation of the predicted pore pressure (Pc) remains a limitation. Due to the extreme burial depth (>7000 m) and harsh downhole testing environments, high-quality measured pressure data (such as DST) in nearby wells (e.g., Kela-3 and Kela-6) are currently unavailable. Future studies will focus on integrating multi-well calibration grids once deeper exploration data become accessible.

5.6. Engineering Implications and Present-Day Applications

The proposed poro-elastoplastic analytical framework, while deeply rooted in the geological evolution of the Kelasu Thrust Belt, yields profound and immediate engineering implications for deep underground geomechanics. By rigorously decoupling the 3D in situ stress tensor (σH, σh, σv) and the generation mechanisms of extreme overpressure, this methodology offers a robust predictive tool for mitigating severe geomechanical risks in contemporary deep-earth engineering projects.
(1)
Optimization of Ultra-deep Drilling Safety and Wellbore Stability
In strongly compressional tectonic regimes, drilling through overpressured argillaceous caprocks poses catastrophic risks, including severe wellbore breakouts, tight-hole conditions, and violent blowouts [42]. The precise determination of the critical pore pressure (Pc) and the maximum horizontal effective stress (σH)—which our model identifies as the primary driver of failure—is indispensable for defining the narrow Safe Mud Weight Window (SMWW). By utilizing the predicted 3D effective stress hierarchy (σ′H > σ′h > σ′v), drilling engineers can proactively optimize wellbore trajectories, aligning highly deviated or horizontal wells along the σ′H azimuth to minimize shear-induced stress concentrations and prevent costly wellbore collapse.
(2)
Hydraulic Fracturing and Deep Reservoir Stimulation
The quantitative partition of mean-stress-driven versus shear-induced pore pressure fundamentally alters the approach to deep reservoir stimulation. In an Andersonian thrust-faulting stress regime characterized by extreme deviatoric stress, hydraulic fractures inherently tend to propagate horizontally, complicating the creation of complex vertical fracture networks [43,44]. The geomechanical insights derived from our MCC-based framework allow completion engineers to accurately evaluate the breakdown pressure and fracture re-orientation dynamics. Understanding the exact magnitude of the intermediate principal stress (σh) governed by the generalized flow rule (Equation (19)) is critical for optimizing multi-stage fracturing spacing and ensuring the effective volumetric stimulation of tight formations.
(3)
Long-term Integrity of Caprocks for Geo-Energy Storage
Furthermore, the elastoplastic yielding behavior and critical state boundaries identified in these highly compressed mudstones transcend petroleum geomechanics, offering vital reference data for the broader field of underground geo-energy engineering. Projects involving Underground Gas Storage (UGS), Geological Carbon Sequestration (CCS), and Deep Radioactive Waste Repositories rely absolutely on the long-term sealing capacity of argillaceous caprocks. Our findings reveal that under high-confining-pressure environments, the caprock matrix exhibits significant ductile strain-hardening before Coulomb failure. This implies that such geomaterials possess a robust poro-mechanical “buffering” capacity against injection-induced pressure fluctuations, providing theoretical confidence for the dynamic safety assessment and long-term containment integrity of deep geological repositories.

6. Conclusions

A novel methodology was developed to quantitatively predict CFP pore pressures and stresses in thrust belts using the MCC model, which defines porosity as a function of mean and maximum shear stress.
A novel methodology was developed to quantitatively predict CFP pore pressures and stresses in thrust belts using the MCC model, which defines porosity as a function of mean and maximum shear stress. Applied at the Kela-2 well (Kelasu Thrust Belt, KTB), the full 3D paleo-stress tensor of the Cretaceous Bashijiqike Formation at the critical rupture state was quantitatively reconstructed. Specifically, at the critical failure depth interval (5800–6500 m), the maximum horizontal principal stress (σH) reached extreme magnitudes of 214.6 to 237.9 MPa, the intermediate principal stress (σh) ranged from 180.2 to 195.9 MPa, and the vertical overburden stress (σv) was constrained to 158.1–170.7 MPa. Correspondingly, the critical paleo-pore pressure (Pc) reached extreme magnitudes of 135.9 to 149.6 MPa, yielding a highly anomalous pressure gradient of 2.31 to 2.34 MPa/100m.
The predicted pore pressures support 85.4~89.0% of overburden stress (α = 0.85–0.89) for mudstones (φ = 35.5°) in the Cretaceous Bashijiqike Formation. Mean stress increase generates ~91.1% of the total overpressure, constituting the dominant mechanism. Decoupling of the pressurization mechanisms reveals that tectonic compression contributes 80~90% of the overpressure anomaly, while traditional undercompaction accounts for only 10~20%, quantitatively confirming the predominance of tectonic squeezing.
Higher friction angles yield increased maximum shear stress and maximum horizontal effective stress, while reducing vertical effective stress. Pore fluid pressure decreases as the friction angle declines from 35.5° to 5°, whereas the relative contribution of shear-induced pore pressure increases. During the process of uplift exhumation, the decrease in lithostatic pressures was entirely borne by the fluid pressure, with the effective stress remaining largely unchanged.

Author Contributions

G.W.: conceptualization, methodology, formal analysis, and writing—original draft preparation. C.F.: conceptualization, supervision, funding acquisition, and writing—reviewing and editing. Z.W. and H.Y.: resources and supervision. All authors have read and agreed to the published version of the manuscript.

Funding

This work was supported by the National Natural Science Foundation of China (project no. 41972133) (Changyu Fan), the Natural Science and Basic Research Program of Shaanxi Province (project no. 2021JCW-04) (Changyu Fan), and the Major National Science and Technology Project (No. 2017ZX05008-004-004) (Changyu Fan).

Data Availability Statement

The datasets used and/or analyzed during the current study are available from the corresponding author on reasonable request. Declaration of generative AI and AI-assisted technologies in the manuscript preparation process. During the preparation of this work, the author(s) used ChatGPT in order to improve the professional tone and readability of the text, as well as to enhance the visual quality of the figures. After using this tool, the author(s) reviewed and edited the content as needed and take(s) full responsibility for the content of the published article.

Acknowledgments

The authors gratefully acknowledge the Research Institute of Petroleum Exploration and Development, PetroChina Tarim Oilfield Company, for providing the data used in this study.

Conflicts of Interest

Author Haijun Yang was employed by the company Petro China Tarim Oilfield Company. The remaining authors declare that the research was conducted in the absence of any commercial or financial relationships that could be construed as a potential conflict of interest.

Nomenclature

CFPCoulomb failure period
MBPmaximum burial period
MCCModified Cam-Clay model
KTBKelasu Thrust Belt
Pdcurrent pore fluid pressure
Pcpore fluid pressure of Coulomb failure period
Pmpore fluid pressure of maximum burial period
Pspore fluid overpressure induced by average stress of Coulomb failure period
Ptpore fluid overpressure induced by shear stress of Coulomb failure period
udcurrent pore fluid overpressure
ucpore fluid overpressure of Coulomb failure period
uspore fluid overpressure induced by average stress of Coulomb failure period
utpore fluid overpressure induced by shear stress of Coulomb failure period
Saverage stress
S′average effective stress
tmaximum shear stress
σ′vvertical effective stress of Coulomb failure period
σ′Hmaximum horizontal effective stress of Coulomb failure period
σ′hminimum horizontal effective stress of Coulomb failure period
σv-presentcurrent vertical stress
σ′v-presentcurrent vertical effective stress
σ′1the maximum effective stress
σ′3the minimum effective stress
ψsediment porosity
evoid ratio
e0sediment initial void ratio
eλisothe initial void ratio of isotropic compaction path
Mthe slope of the critical shape of yield surface
λthe slope represented by compaction line
φangle of internal friction of mudstone
Kthe slope of an arbitrary line in s’-t space
Kvstress ratio in vertical compaction
KCthe stress ratio when soil element reaches the Coulomb failure

Appendix A

This appendix provides the intermediate steps leading to Equation (15) in the main text, in order to clarify how the parameter associated with the K-condition evolves from a general stress ratio K to the critical state Kc, and how it is further linked to the plane-stress void-ratio relation.
From Equation (11), the intercept parameter eλK can be written as
e λ K = e λ i s o + λ I n M / 3 2 M / 3 2 + K 2
where eλiso is the isotropic reference intercept, λ is the compression index, and M is the critical-state stress ratio parameter.
At the critical state K = Kc, Equation (1) becomes:
e λ K c = e λ i s o + λ I n M / 3 2 M / 3 2 + K c 2
According to Equation (14), the critical-state coefficient Kc is a function of the internal friction angle φ:
K c = sin ϕ
Substituting Equation (3) into Equation (2) yields:
e λ K c = e λ i s o + λ I n M / 3 2 M / 3 2 + sin 2 ϕ
In addition, Equation (10) gives the critical-state parameter M as a function of φ:
M = 6 sin ϕ 3 sin ϕ
Substituting Equation (5) into Equation (4), we obtain:
e λ K c = e λ i s o + λ I n 12 sin 2 ϕ sin 2 ϕ 6 sin ϕ + 21
Meanwhile, Equation (7) in the main text expresses the void ratio e as a function of the plane-stress variable S′ under a given K-condition:
e = e λ K λ I n S K
When K reaches the critical state, K = Kc, Equation (7) reduces to:
e λ K c = e + λ I n S c
Finally, substituting Equation (6) into Equation (8) leads to the explicit relationship used in the main text (i.e., Equation (15)):
I n S C = e λ i s o e λ + I n 12 sin 2 ϕ 6 sin ϕ + 21

References

  1. Guo, X.S.; Hu, Z.Q.; Li, S.J.; Zheng, L.J.; Zhu, D.Y.; Liu, J.L.; Shen, B.J.; Du, W. Progress and prospect of natural gas exploration and research in deep and ultra-deep strata. Pet. Sci. Bull. 2023, 04, 461–474. [Google Scholar] [CrossRef]
  2. He, X.P.; Zhang, P.X.; Gao, Y.Q.; Wang, K.M.; He, G.S.; Ren, J.H.; Gao, Q.F.; Zang, S.H. Challenges and countermeasures for beneficial development of unconventional oil and gas resources in China. China Pet. Explor. 2025, 30, 28–43. [Google Scholar] [CrossRef]
  3. Cao, W.; Zhang, R.; Nie, X.; Ren, L. Laboratory Fracture Slip and Seismicity Subjected to Fluid Injection-Related Stress and Pressure Paths. Rock Mech. Rock Eng. 2024, 57, 1245–1261. [Google Scholar] [CrossRef]
  4. Sun, B.S.; Ding, Y.C.; Shao, Z.G. Application of acoustic emission technique in determination of fossil and present-day stresses in oil fields. J. Geo-Mech. 1996, 2, 11–17. (In Chinese) [Google Scholar]
  5. Ding, Y.C.; Shao, Z.G. An experimental research into determination of the highest paleotectonic stress state experienced by rock through geological ages. Earth Sci. J. China Univ. Geosci. 2001, 26, 99–104. (In Chinese) [Google Scholar]
  6. Vergara Sassarini, N.A.; Gasparrini, M.; Bernasconi, S.M.; Corrado, S. Joint application of fluid inclusion and clumped isotope (Δ47) thermometry unravels the complexity of thermal and fluid-flow history reconstruction in sedimentary basins—Upper Triassic Chaunoy Formation reservoirs (Paris Basin). Basin Res. 2024, 36, e12814. [Google Scholar] [CrossRef]
  7. Gonçalvès, J.; Pagel, M.; Violette, S.; Guillocheau, F.; Robin, C. Fluid inclusions as constraints in a three-dimensional hydro-thermo-mechanical model of the Paris Basin, France. Basin Res. 2010, 22, 699–716. [Google Scholar] [CrossRef]
  8. Marín-Moreno, H.; Minshull, T.A.; Edwards, R.A. Inverse modelling and seismic data constraints on overpressure generation by disequilibrium compaction and aquathermal pressuring: Application to the Eastern Black Sea Basin. Basin Res. 2013, 25, 331–347. [Google Scholar]
  9. Burgreen-Chan, B.; Scheirer, A.H.; Graham, S.A.; Muñoz-Sáez, C. Basin and petroleum system modelling of the East Coast Basin, New Zealand: A test of overpressure scenarios in a convergent margin. Basin Res. 2016, 28, 536–567. [Google Scholar] [CrossRef]
  10. Eaton, B.A. The equation for geopressure prediction from well logs. Soc. Pet. Eng. 1975, 5544, SPE-5544-MS. [Google Scholar] [CrossRef]
  11. Zhang, J.C. Pore pressure prediction from well logs: Methods, modifications, and new approaches. Earth Sci. Rev. 2011, 108, 50–63. [Google Scholar] [CrossRef]
  12. Couzens-Schultz, B.A.; Chan, A.W. Stress determination in active thrust belts: An alternative leak-off pressure interpretation. J. Struct. Geol. 2010, 32, 1061–1069. [Google Scholar] [CrossRef]
  13. Chang, C.; McNeill, L.C.; Moore, J.C.; Lin, W.; Conin, M.; Yamada, Y. In situ stress state in the Nankai accretionary wedge estimated from borehole wall failures. Geochem. Geophys. Geosystems 2010, 11, Q0AD04. [Google Scholar] [CrossRef]
  14. Nifuku, K.; Kobayashi, Y.; Araki, Y.; Ashida, T.; Taniwaki, T. Overpressure evolution controlled by spatial and temporal changes in the sedimentation rate: Insights from a basin modelling study in offshore Suriname. Basin Res. 2021, 33, 1294–1314. [Google Scholar] [CrossRef]
  15. Hubbert, M.K.; Rubey, W.W. Role of fluid pressure in mechanics of overthrust faulting. Geol. Soc. Am. Bull. 1959, 70, 115–166. [Google Scholar] [CrossRef]
  16. Zhang, J. Effective stress, porosity, velocity and abnormal pore pressure prediction accounting for compaction disequilibrium and unloading. Mar. Pet. Geol. 2013, 45, 2–11. [Google Scholar] [CrossRef]
  17. Li, Q.; Li, Q.; Cao, H.; Wu, J.; Wang, F.; Wang, Y. The crack propagation behaviour of CO2 fracturing fluid in unconventional low permeability reservoirs: Factor analysis and mechanism revelation. Processes 2025, 13, 159. [Google Scholar] [CrossRef]
  18. Li, Q.; Li, Q.; Wang, F.; Wu, J.; Wang, Y.; Jin, J. Effects of geological and fluid characteristics on the injection filtration of hydraulic fracturing fluid in the wellbores of shale reservoirs: Numerical analysis and mechanism determination. Processes 2025, 13, 1747. [Google Scholar] [CrossRef]
  19. Li, Q.; Li, Q.; Wang, F.; Xu, N.; Wang, Y.; Bai, B. Settling behavior and mechanism analysis of kaolinite as a fracture proppant of hydrocarbon reservoirs in CO2 fracturing fluid. Colloids Surf. A Physicochem. Eng. Asp. 2025, 724, 137463. [Google Scholar] [CrossRef]
  20. Casey, B.; Germaine, J.T.; Flemings, P.B.; Fahy, B.P. In situ stress state and strength in mudrocks. J. Geophys. Res. Solid Earth 2016, 121, 5611–5623. [Google Scholar] [CrossRef]
  21. Carey, J.W.; Frash, L.P. Brittle-ductile behavior and caprock integrity. Energy Procedia 2017, 114, 3132–3139. [Google Scholar] [CrossRef]
  22. Flemings, P.B.; Saffer, D.M. Pressure and stress prediction in the Nankai accretionary prism: A critical state soil mechanics porosity-based approach. J. Geophys. Res. Solid Earth 2018, 123, 1089–1115. [Google Scholar] [CrossRef]
  23. Ghimire, S.; Panthi, K.K. In-Situ Stress Evaluation in an Unlined Pressure Tunnel of a Hydropower in South-Western Part of Norway. Rock Mech. Rock Eng. 2026, 59, 1–26. [Google Scholar] [CrossRef]
  24. Chen, S.P.; Tang, L.J.; Jin, Z.J.; Jia, C.Z.; Pi, X.J. Thrust and fold tectonics and the role of evaporites in deformation in the Western Kuqa Foreland of Tarim Basin, Northwest China. Mar. Pet. Geol. 2004, 21, 1027–1042. [Google Scholar] [CrossRef]
  25. Wang, Q.H.; Yang, H.J.; Yang, W. New progress and future exploration targets in petroleum geological research of ultra-deep castic rocks in Kuqa Depression, Tarim Basin, NW China. Pet. Explor. Dev. 2025, 52, 70–83. [Google Scholar] [CrossRef]
  26. Roscoe, K.H.; Burland, J.B. On the generalized stress-strain behaviour of “wet” clay. In Engineering Plasticity; Heyman, J., Ed.; Cambridge University: Cambridge, UK, 1968; pp. 535–609. [Google Scholar] [CrossRef]
  27. Jia, C.Z. Characteristics of Mesozoic and Cenozoic Structures and Petroleum Occurrence in the Tarim Basin; Petroleum Industry Press: Beijing, China, 2004. (In Chinese) [Google Scholar]
  28. Song, Y.; Liu, S.B.; Zhao, M.; Hong, J.F.; Fang, S.H. The Oil and Gas Distribution Law and the Main Controlling Factors in Foreland Basins, Central and Western China; Petroleum Industry Press: Beijing, China, 2008; pp. 107–108. [Google Scholar]
  29. Zou, Y.R.; Zhao, C.Y.; Wang, Y.P.; Zhao, W.Z.; Peng, P.A.; Shuai, Y.H. Characteristics and origin of natural gases in the Kuqa Depression of Tarim Basin, NW China. Org. Geochem. 2006, 37, 280–290. [Google Scholar] [CrossRef]
  30. Graham, S.A.; Hendrix, M.S.; Wang, L.B.; Homewood, P. Collision successor basins of western China, impact of tectonic inheritance on sand composition. Geol. Soc. Am. Bull. 1993, 105, 323–344. Available online: https://pubs.geoscienceworld.org/gsa/gsabulletin/article-abstract/105/3/323/182780/Collisional-successor-basins-of-western-China?redirectedFrom=fulltext (accessed on 1 July 2026).
  31. Tang, L.J.; Jia, C.Z.; Jin, Z.J.; Chen, S.P.; Pi, X.J.; Xie, H.W. Salt tectonic evolution and hydrocarbon accumulation of Kuqa foreland fold belt, Tarim Basin, NW China. J. Pet. Sci. Eng. 2004, 41, 97–108. [Google Scholar] [CrossRef]
  32. Mei, Y.X.; Zhang, J.N.; Neng, Y.; Wang, W.J.; Xu, K.; Xiang, H.; Wu, Y.; Liu, P. Tectonic control on ultra-deep sub-salt trap architecture: Insights from multi-detachment modeling and physical simulations in the Kuqa Foreland Thrust Belt. Geosciences 2026, 16, 197. [Google Scholar] [CrossRef]
  33. Fan, C.Y.; Wang, G.; Wang, Z.L.; Han, X.J.; Chen, J.; Zhang, K.L.; Zhang, B.S. Prediction of multiple origin overpressure in deep fold-thrust belt: A case study of Kuqa subbasin, Tarim Basin, northwestern China. AAPG Bull. 2021, 105, 1511–1533. [Google Scholar] [CrossRef]
  34. Xie, H.W.; Li, Y.; Zhong, D.K.; Lei, G.L.; Li, X.; Yang, X.Z.; Rao, H.W.; Yang, Q.X. Sedimentary evolution of the Neogene—Quaternary deposits in the Kuqa depression, Xinjiang. Sediment. Geol. Tethyan Geol. 2013, 33, 10–15. Available online: https://cjyttsdz.com.cn/article/id/20130302 (accessed on 1 July 2026).
  35. Gao, B.; Flemings, P.B.; Nikolinakou, M.A.; Saffer, D.M.; Heidari, M. Mechanics of Fold and Thrust Belts Based on Geomechanical Modeling. J. Geophys. Res. Solid Earth 2018, 123, 4454–4474. [Google Scholar] [CrossRef]
  36. Chen, M.Y.; Chen, S.T.; Ji, Q.S.; Lu, M.X. Numerical simulation of the brittle-ductile fracture characteristics of the mudstone caprock in Kuche Depression. Pet. Geol. Oilfied Dev. Daqing 2020, 39, 28–35. [Google Scholar] [CrossRef]
  37. Jiang, R.T. Fracture Development and Distribution in Interbeded Sandstone and Mudstone of Keshen 2 Gas Reservoir. Master’s Thesis, China University of Petroleum (East China), Qingdao, China, 2021. [Google Scholar]
  38. Marcussen, Ø.; Faleide, J.I.; Jahren, J.; Bjørlykke, K. Mudstone compaction curves in basin modelling: A study of Mesozoic and Cenozoic Sediments in the northern North Sea. Basin Res. 2010, 22, 325–341. [Google Scholar] [CrossRef]
  39. Fjaer, E.; Holt, R.M.; Raaen, A.M.; Risnes, R.; Horsrud, P. Petroleum Related Rock Mechanics, 2nd ed.; Elsevier: Amsterdam, The Netherlands, 2008. [Google Scholar]
  40. Casey, B. The Consolidation and Strength Behavior of Mechanically Compressed Fine-Grained Sediments. Ph.D. Thesis, Department of Civil and Environmental Engineering, Massachusetts Institute of Technology, Cambridge, MA, USA, 2014; 259p. [Google Scholar]
  41. Wang, Q.; Sun, Q.; You, K.; Foschi, M. Overpressure-driven hydrofracture growth in the northern South China Sea. Basin Res. 2024, 36, e12894. [Google Scholar] [CrossRef]
  42. Lu, Y.; Li, W.; Jin, Y.; Chen, M.; Pang, H.; Zhou, W. Short- and Long-term Wellbore Stability Analysis for a Horizontal Well in a Transversely Isotropic Poroelastic Formation. Rock Mech. Rock Eng. 2025, 58, 767–786. [Google Scholar] [CrossRef]
  43. Ibemesi, P.; Benson, P. Effect of Pressure and Stress Cycles on Fluid Flow in Hydraulically Fractured, Low-Porosity, Anisotropic Sandstone. Rock Mech. Rock Eng. 2023, 56, 19–34. [Google Scholar] [CrossRef]
  44. Yang, Y.; Li, X.; Ju, Y.; Gao, Y.; Liu, X.; Liu, J.; Guo, J. Analysis of Wellbore Wall Stress for SC-CO2 Horizontal Well Fracturing in Bedded Rocks and the Influence Mechanism of Bedding Structure: Development of a Fracture Initiation Criterion and a Theoretical Prediction Model for Initiation Pressure in SC-CO2 Fracturing. Rock Mech. Rock Eng. 2026, 59, 1–16. [Google Scholar] [CrossRef]
Figure 1. Geomechanical and tectonic background of the Kelasu Thrust Belt. (A) Location of the Tarim Basin in China. (B) Structural divisions of the Kuqa sub-basin [27]. (C) Plan view showing the intense regional tectonic compression direction (σHmax) and the distribution of present-day pore pressure coefficients. (D) Geological cross-section displaying the deep geoechanical domains, the trajectory of Borehole KL2, and the typical in situ stress state (σH > σh > σv, thrust faulting regime) constrained by the ductile salt detachment.
Geosciences 16 00276 g001
Figure 2. Comprehensive stratigraphic and geomechanical column of the Kuqa Depression. The profile highlights the vertical transitions in rock mechanical behavior and the corresponding pore pressure coefficient, demarcating the deep, overpressured target formation (Bashijiqike Formation) for geomechanical modeling [27].
Geosciences 16 00276 g002
Figure 3. Conceptual geological model illustrating the macroscopic structural evolution and deformation characteristics of the strata. The progressive deformation sequence includes: (Stage 1) vertical compaction dominated by uniaxial strain during burial; (Stage 2) initial tectonic compaction accommodated by layer-parallel shortening; (Stage 3) continuous tectonic compaction resulting in macroscopic fold distortion; and (Stage 4) late-stage structural deformation characterized by thrust faulting and subsequent exhumation.
Geosciences 16 00276 g003
Figure 4. Conceptual geomechanical model coupling tectonic stress and pore pressure. (A) Stress–strain curves of the Jidike Formation mudstone derived from triaxial compression tests and numerical simulations (simulation data from [36]. (B) Effective stress paths in S′ − t space under fully drained (a → c → d → e) and undrained (a → b → f) conditions. Point a: initial compaction; Point b: onset of restricted drainage; Points e and f: Coulomb failure states under drained and undrained conditions, respectively. (C) Pore pressure evolution corresponding to the respective structural stages. Pm: pressure at maximum burial; Pc: pressure at CFP; Pd: present-day pressure. (D) Critical State Soil Mechanics (CSSM) framework illustrating the linear relationship between void ratio (e) and the natural logarithm of mean effective stress (lnS).
Geosciences 16 00276 g004
Figure 5. Methodological flowchart outlining the sequential steps of the poro-elastoplastic analytical framework, from logging data input to engineering applications.
Geosciences 16 00276 g005
Figure 6. Reconstructed paleo-pressure and overpressure profiles at the CFP for Well Kela-2. Note: data points represent only intervals reaching the critical failure state. (A) Paleo-pore pressure components, displaying the total critical pressure (Pc), mean-stress-induced pressure (Ps), and shear-induced pressure (Pt). (B) Reconstructed Paleo-overpressure components, contrasting total overpressure (uc) against mean-stress-induced overpressure (us). where overpressure is explicitly defined as the fluid pressure exceeding the local hydrostatic pressure (u = P − Phydro). (C) Comparison of present-day (subscript d, directly calibrated against operational Drill Stem Tests and mud weight measurements) versus paleo-critical (subscript c) pore pressures and overpressures. (D) MCC model parameters determination workflow.
Geosciences 16 00276 g006
Figure 7. Reconstructed paleo-pressure and overpressure profiles at the CFP for Well Kela-2. Note: data points represent only intervals reaching the critical failure state. (A) Paleo-pore pressure components: total critical pressure (Pc), mean-stress-induced (Ps), and shear-induced (Pt). (B) Paleo-overpressure components: total (uc) vs. mean-stress-induced (us). (C) Comparison of present-day (subscript d, from DST and mud weight) vs. paleo-critical (subscript c) pore pressures and overpressures.
Geosciences 16 00276 g007
Figure 8. Reconstructed paleo-stress and effective stress components at the CFP for Well Kela-2. Note: Paleo-depths are derived from fault restoration. (A) Paleo-total stresses: principal stresses (σH, σh, σv), mean stress (S), and shear stress (t). (B) Paleo-effective stresses (σH′, σh′, σv′, S′). (C) Comparison of present-day vs. paleo vertical total and effective stresses.
Geosciences 16 00276 g008
Figure 9. Pore fluid overpressure (A) and effective stress (B) under different friction angles in Well Kela 2.
Geosciences 16 00276 g009
Disclaimer/Publisher’s Note: The statements, opinions and data contained in all publications are solely those of the individual author(s) and contributor(s) and not of MDPI and/or the editor(s). MDPI and/or the editor(s) disclaim responsibility for any injury to people or property resulting from any ideas, methods, instructions or products referred to in the content.