Article

Seismic Stability Evaluation of Soil–Rock Mixture Slopes Using Upper-Bound Finite Element Limit Analysis Considering Effective Rock Content

1
Institute for Disaster Management and Reconstruction, Sichuan University-The Hong Kong Polytechnic University, Chengdu 610207, China
2
State Key Laboratory of Intelligent Geotechnics and Tunnelling, Southwest Jiaotong University, Chengdu 610031, China
*
Author to whom correspondence should be addressed.
Geosciences 2026, 16(7), 256; https://doi.org/10.3390/geosciences16070256
Submission received: 6 May 2026 / Revised: 14 June 2026 / Accepted: 24 June 2026 / Published: 27 June 2026
(This article belongs to the Section Natural Hazards)

Abstract

Soil–rock mixtures are composed of various constituents, including rock blocks, soil matrix, and pores. The stability of slopes formed by such materials is significantly affected by rock content, block location, and block gradation. However, most existing studies have used the overall rock content as the primary index to characterize the role of rock blocks. This index is essentially a global averaged parameter and therefore cannot accurately reflect the actual contribution of rock blocks to slope stability. To overcome this limitation, stochastic numerical models of soil–rock mixture slopes were established based on real rock-block contours, and the seismic stability of these slopes under pseudo-static horizontal seismic loading was investigated using the upper-bound finite element limit analysis method. On this basis, the concept of effective rock content was proposed to quantify the actual participation of rock blocks within the governing sliding zone. Comparative analyses based on selective rock-block removal further demonstrated the limitation of the overall rock content index. When the rear rock blocks were removed while the effective rock content remained unchanged, the safety factor changed only slightly from 0.882 to 0.881. In contrast, after removing the leading-edge rock blocks, the effective rock content of the slope decreased to 0. The safety factor dropped to 0.774, close to the safety factor of 0.772 for a homogeneous soil slope. Quantitative sensitivity analysis further showed that the effective rock content plays a controlling role in the slope safety factor. Compared with the overall rock content, it can more effectively characterize the actual contribution of rock blocks to the seismic stability of soil–rock mixture slopes and can be regarded as the governing structural parameter controlling slope stability. Furthermore, the effects of gradation and the spatial distribution of oversized rock blocks on the stability of soil–rock mixture slopes can both be interpreted through their regulation of the effective rock content and the rock-skeleton effect. In general, the beneficial influence of the spatial location of oversized rock blocks on slope stability follows the order: slope toe > slope face > slope crest > inside the slope > behind the slope. These findings indicate that effective rock content can serve as a key index for characterizing the seismic stability of soil–rock mixture slopes and provide a new analytical framework for the stability assessment of such slopes in seismic regions.

1. Introduction

Earthquakes are among the major natural triggers of slope instability. Compared with homogeneous soil slopes, soil–rock mixture slopes exhibit stronger structural heterogeneity and more complex mechanical responses because of their complicated material composition, pronounced randomness in rock content and block spatial distribution, and marked differences in the physical and mechanical properties between the soil matrix and rock blocks [1,2,3,4,5,6,7]. Such slopes are commonly characterized by large landslide volumes, diverse failure modes, and pronounced hazard-chain effects when subjected to strong seismic loading. Therefore, the reliable evaluation of the seismic stability of soil–rock mixture slopes is of great significance for disaster prevention and mitigation, as well as for the construction and operation of major geotechnical infrastructure.
Owing to their inherent heterogeneity and discontinuity, deformation and failure within soil–rock mixture slopes generally do not develop along a single well-defined potential sliding path. Instead, multiple competing propagation paths may emerge, eventually resulting in complex multi-slip-band failure patterns [8,9,10,11,12,13]. Considerable efforts have been devoted to this issue by researchers worldwide. Zhao et al. [14] proposed a numerical modeling method for soil–rock mixture slopes based on real rock-block contours, which enables the construction of stochastic slope models with different block shapes, particle-size distributions, and rock contents. Peng et al. [15] further employed a modified two-dimensional discontinuous deformation analysis–smoothed particle hydrodynamics (DDA–SPH) method to analyze the stability and post-failure evolution of soil-rock mixture slopes, revealing their complex failure and movement characteristics. Studies by Napoli et al. [16,17] demonstrated that rock-block morphology, inclination, and spatial distribution can significantly affect sliding patterns and slope safety factors.
With respect to the stability of soil–rock mixture slopes under seismic loading, existing studies have mainly focused on dynamic response characteristics and failure mechanisms. Gayathridevi and Ray [8] numerically investigated the stability of bimslopes under both static and seismic loading conditions, demonstrating that block shape, block size distribution, and volumetric block proportion significantly affect the safety factor and failure mechanism of soil–rock mixture slopes. Using MIDAS Geo-Technical analysis System (GTS), Huang et al. [18] studied the dynamic response characteristics of soil-rock mixture slopes by considering different rock contents and rock-block distribution locations. Xu et al. [19], based on the added-mass method, analyzed an actual engineering slope and found that severe fluctuations in movement velocity and direction under seismic loading are important factors contributing to instability. In addition, numerous experimental studies have shown that rock content, gradation, moisture content, and fine-particle proportion can all significantly affect the shear strength and deformation characteristics of soil-rock mixtures [20,21]. These studies indicate that the influence of rock blocks on slope stability depends not only on their overall proportion but also on their structural role during local deformation and sliding processes.
Although existing studies have gradually shifted from analyses based solely on overall rock content to more comprehensive considerations of block spatial distribution and random heterogeneity [11,22,23,24], most studies still use the conventional overall rock content as the principal index to characterize the role of rock blocks and to interpret variations in slope stability. However, the overall rock content is essentially a global averaged parameter. Although it reflects the general proportion of rock blocks within a slope, it cannot effectively distinguish the actual contribution of rock blocks at different spatial locations to the governing sliding mechanism. In particular, rock blocks located outside the dominant sliding zone may have only limited influence on seismic stability, whereas those located within the key sliding region may play a controlling role in the sliding process through blockage, diversion, inclusion, and skeleton effects.
To address this limitation, the concept of effective rock content, Ce, is proposed to characterize the actual participation of rock blocks within the dominant sliding zone. Stochastic numerical models of soil–rock mixture slopes are constructed using a random placement method based on real rock-block contours. The effects of effective rock content, gradation characteristics, and the spatial distribution of oversized rock blocks on the seismic stability of soil–rock mixture slopes are systematically investigated by the upper-bound finite element limit analysis Compared with the conventional overall rock content, the proposed effective rock content provides a more direct link between rock-block spatial distribution and the governing sliding mechanism, thereby offering a new perspective for interpreting both gradation effects and positional effects. The results of this study are expected to provide a theoretical basis for the stability assessment, engineering design, and construction optimization of soil–rock mixture slopes in seismic regions.

2. Method

This study adopts the upper-bound finite element limit analysis method to investigate slope stability. The basic idea of this method is to construct a kinematically admissible virtual failure mechanism under the conditions of satisfying the velocity boundary conditions and the associated flow rule. According to the kinematic upper-bound theorem, for any kinematically admissible velocity field, the external work rate does not exceed the internal dissipation rate. Therefore, the safety factor of slope (Fs) can be transformed into a minimization problem of the total internal dissipation power [25,26,27,28].
After normalizing the external work rate to unity, the upper-bound problem can be written as
F s = min v V a Ω π Y ε ˙ ( v ) d Ω + Γ d π Γ v d Γ s . t . W e x t ( v ) = 1
where Va denotes the space of kinematically admissible velocity fields, and ε ˙ ( v ) is the strain-rate tensor, expressed as
ε ˙ ( v ) = v + v T 2
Here, πY is the support function of the yield domain Y, which can be interpreted as the plastic dissipation rate per unit volume under the associated flow rule; Γd denotes the velocity-discontinuity boundary, [[v]] is the velocity jump, and πΓ is the dissipation function associated with interfacial plastic sliding. When a continuous velocity field is adopted, the interfacial dissipation term in the above equation may be omitted.
After finite element discretization, the velocity field, strain rate, and external work rate can be expressed as
v = N λ
ε ˙ = B λ
W e x t = f T λ
where N is the shape function matrix, B is the velocity–strain-rate transformation matrix, λ is the nodal velocity parameter vector, and f is the equivalent external load vector. Accordingly, the upper-bound analysis can be further converted into a constrained numerical optimization problem, that is, solving for the nodal velocity parameter λ that minimizes the total dissipation power under the constraints of external work normalization and kinematic admissibility, and taking the corresponding minimum value as the slope Fs. Unlike conventional upper-bound analysis, which requires a predefined failure mechanism, this method can automatically search for potential failure modes through finite element discretization and optimization algorithms and is therefore more suitable for the stability analysis of complex slopes.
The strength reduction technique is introduced to reduce the strength parameters until the geotechnical structure reaches a critical state, at which point the reduction factor is taken as the Fs. The calculation formula of the strength reduction technique is as follows:
F s = tan   φ tan   φ cr = c c cr
In the equation, c and φ denote the cohesion and internal friction angle of the slope, respectively, while ccr and φcr denote the cohesion and internal friction angle at the critical sliding state, respectively.
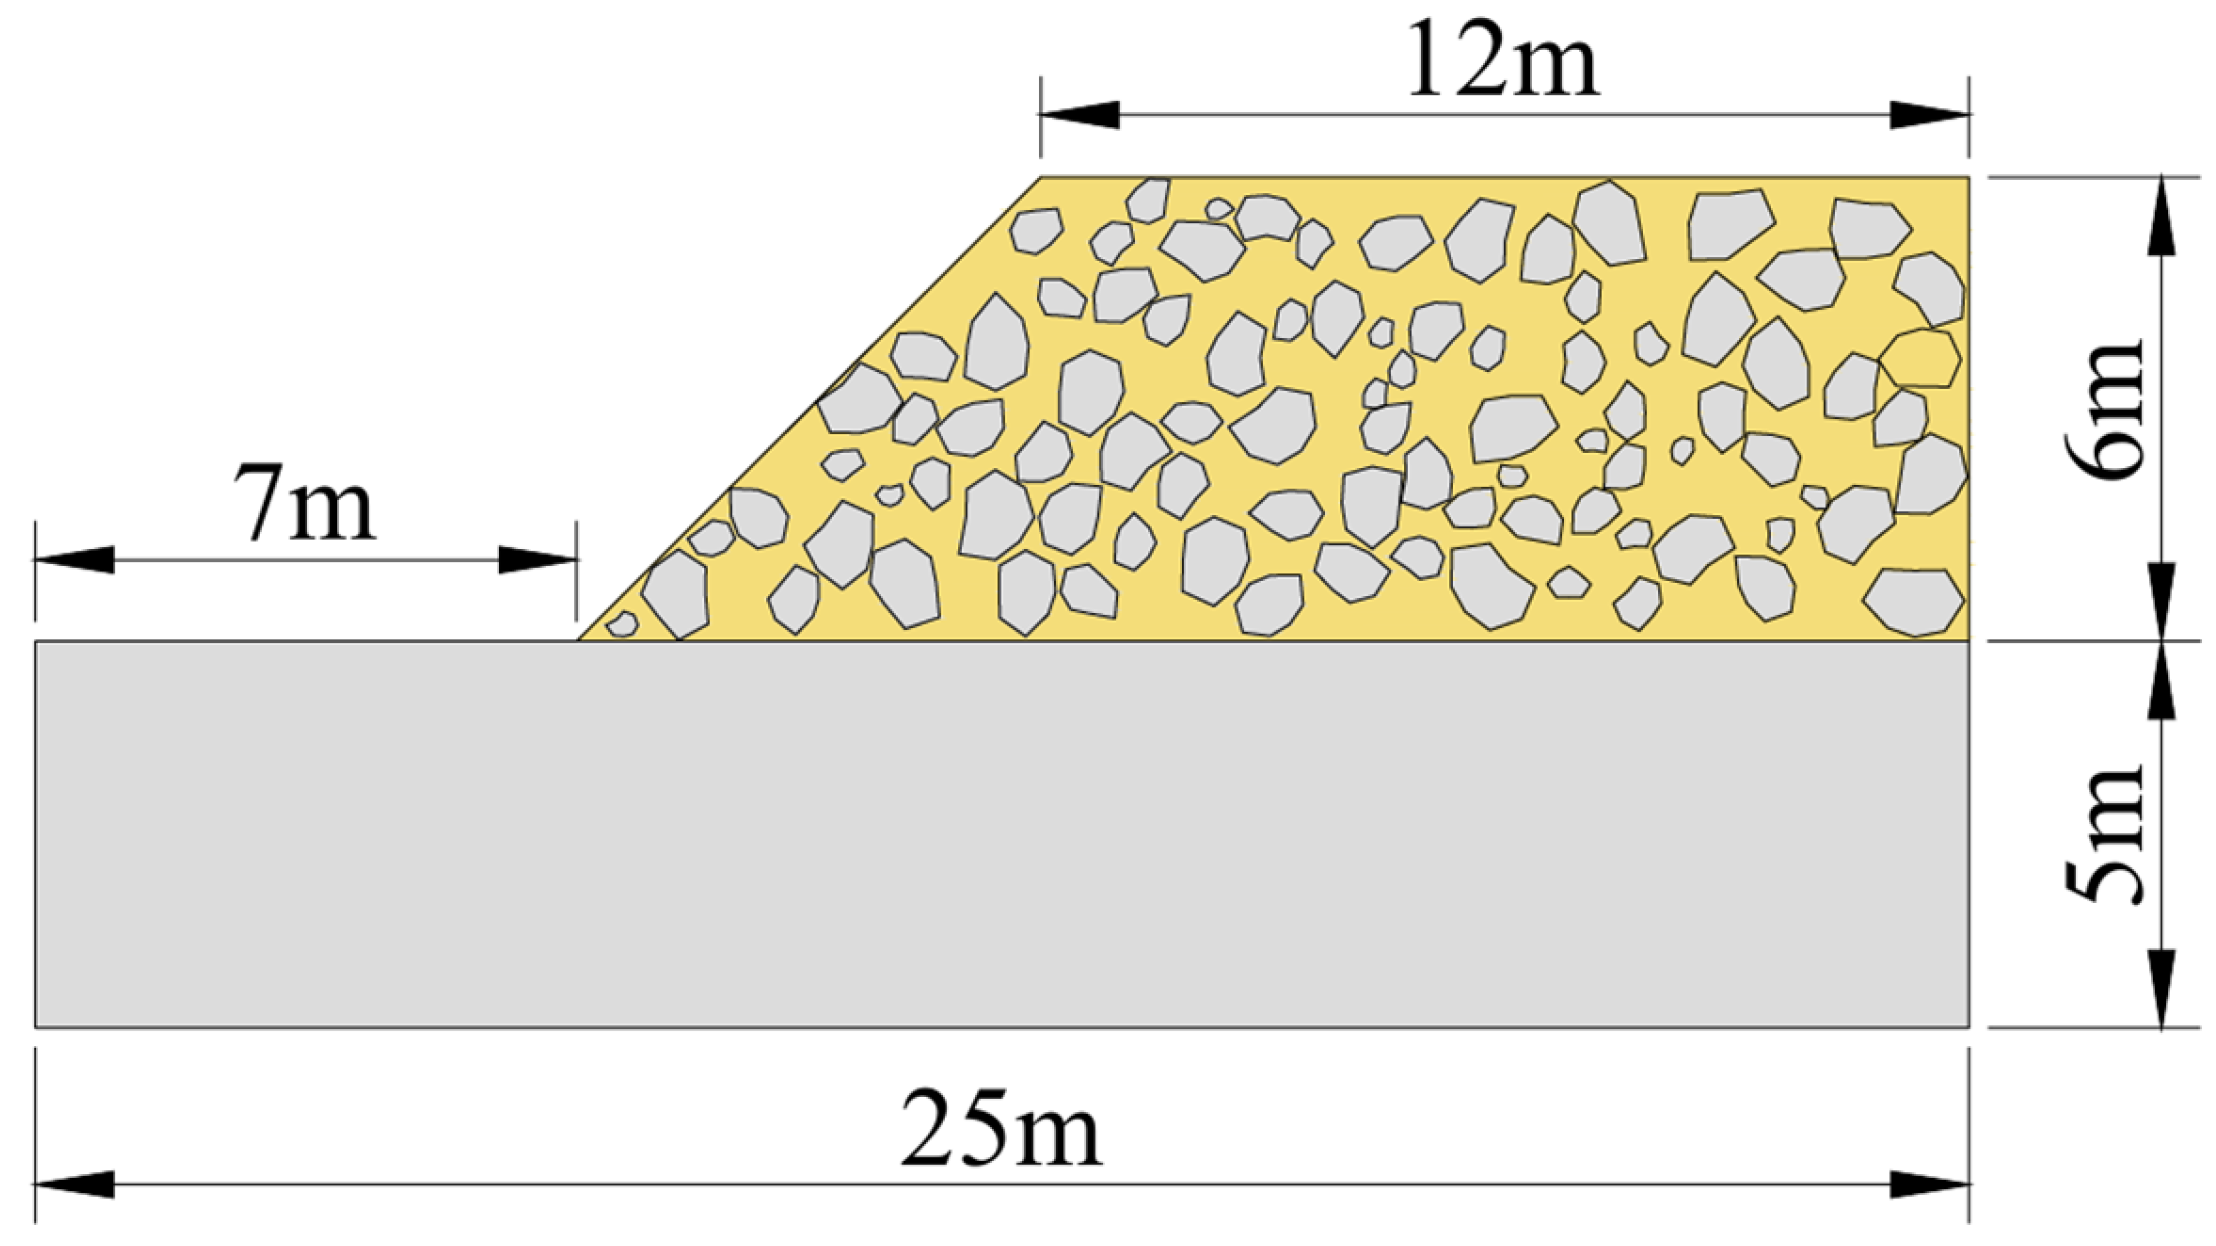
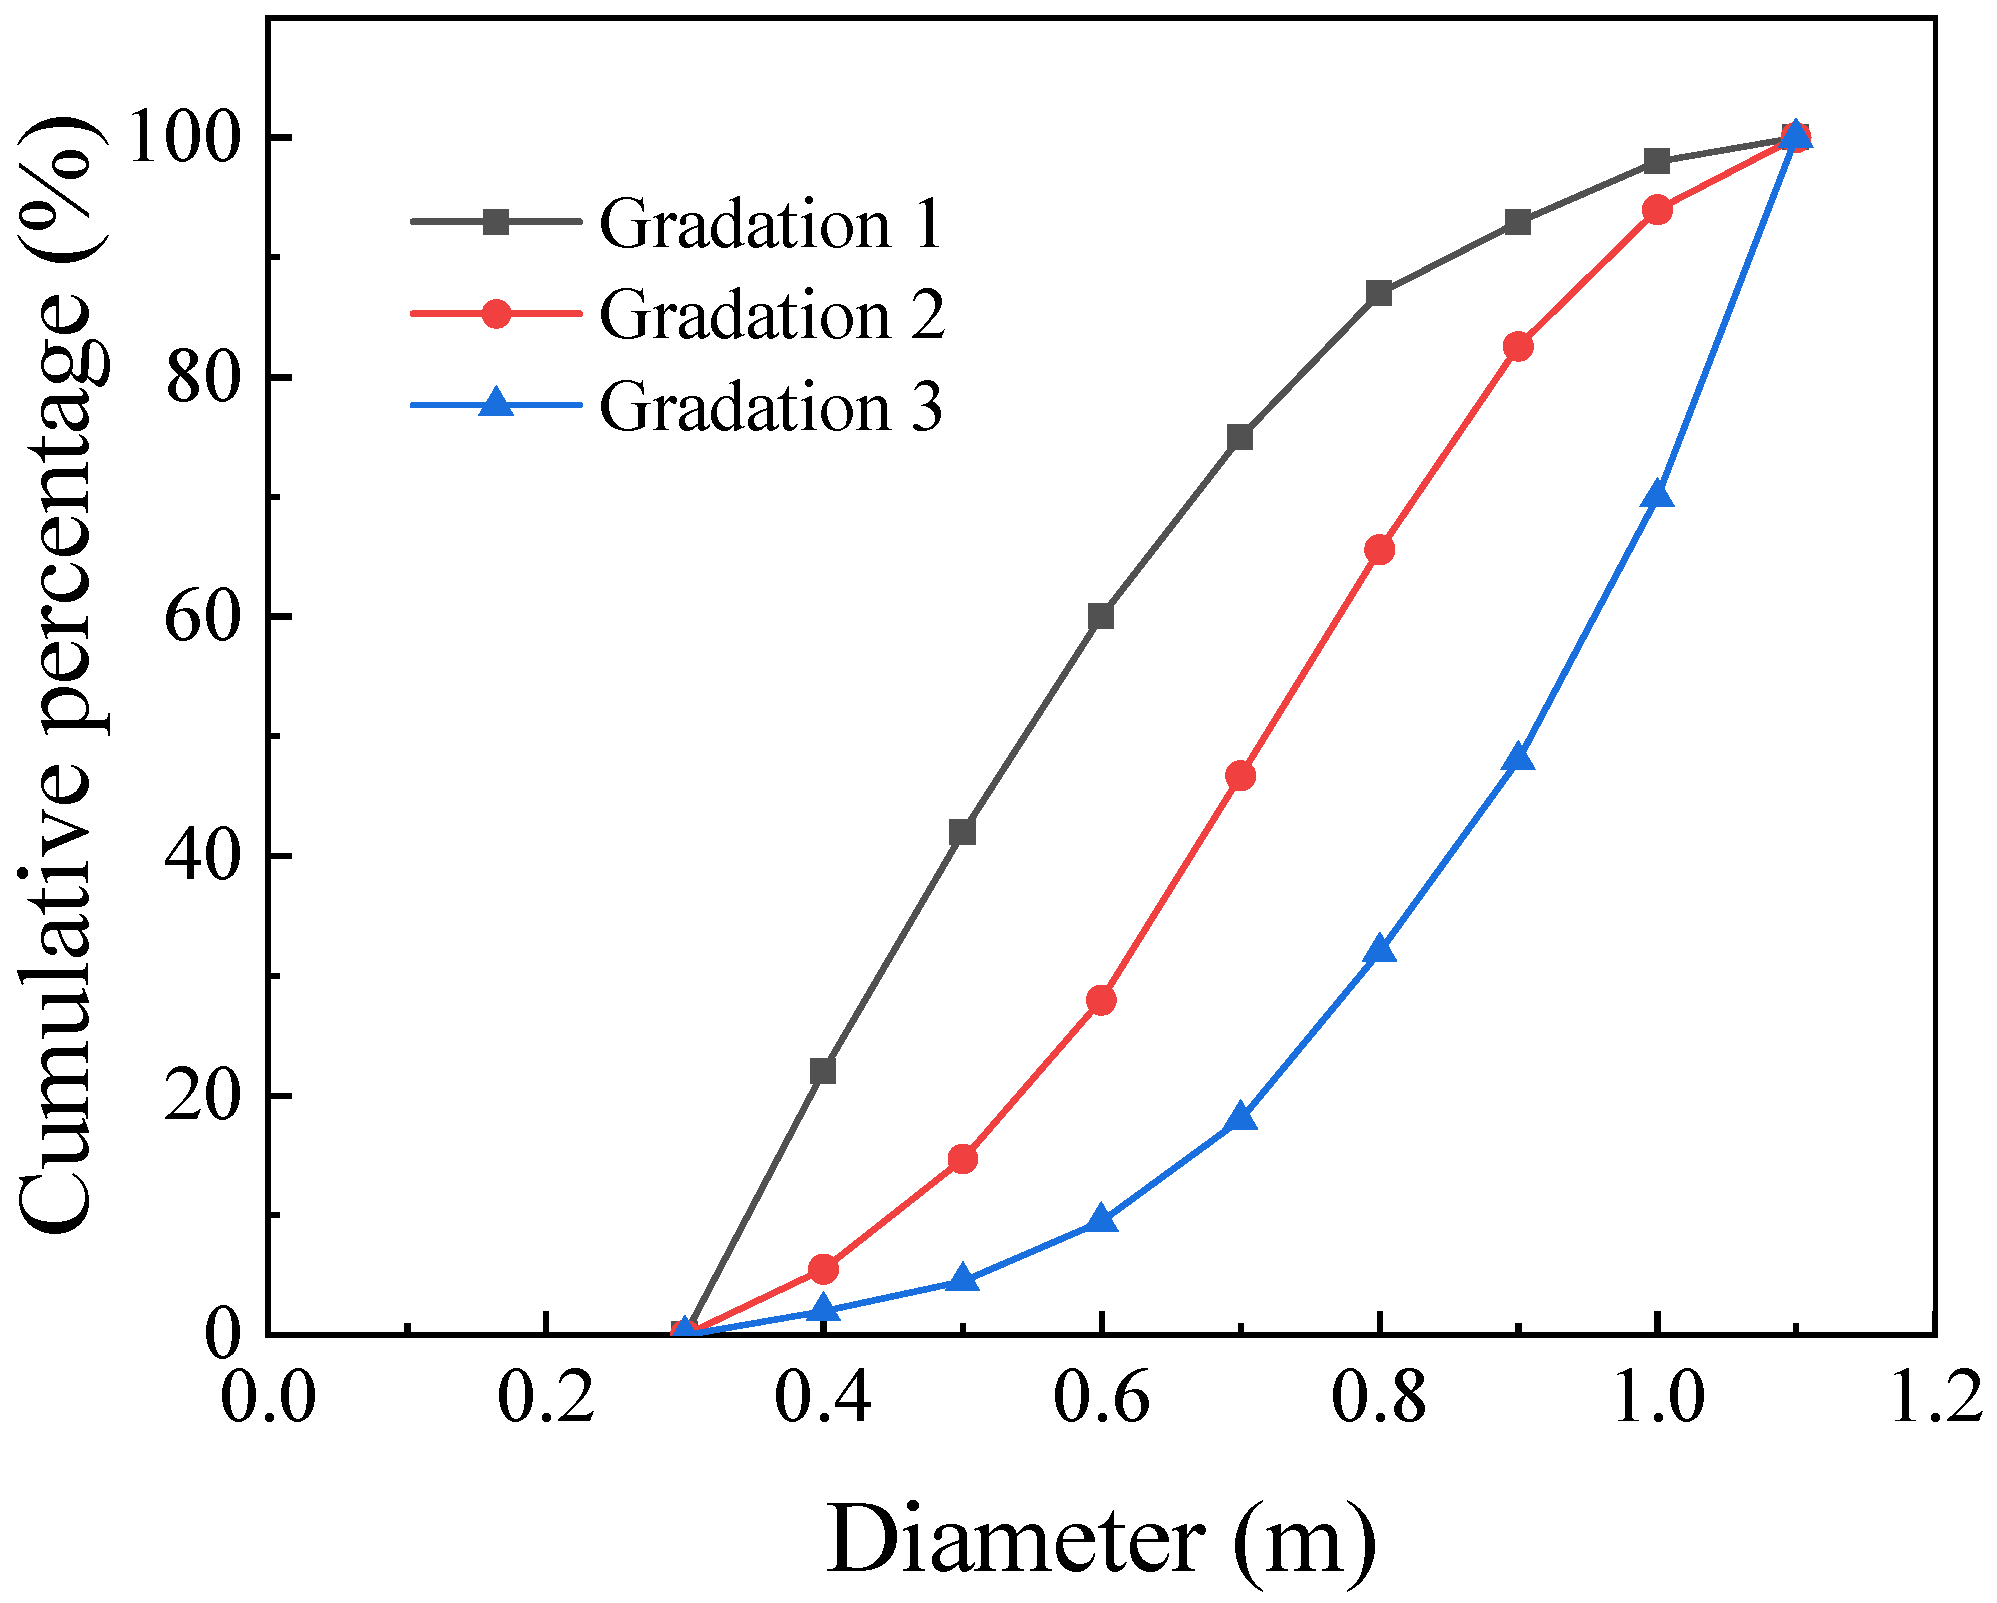
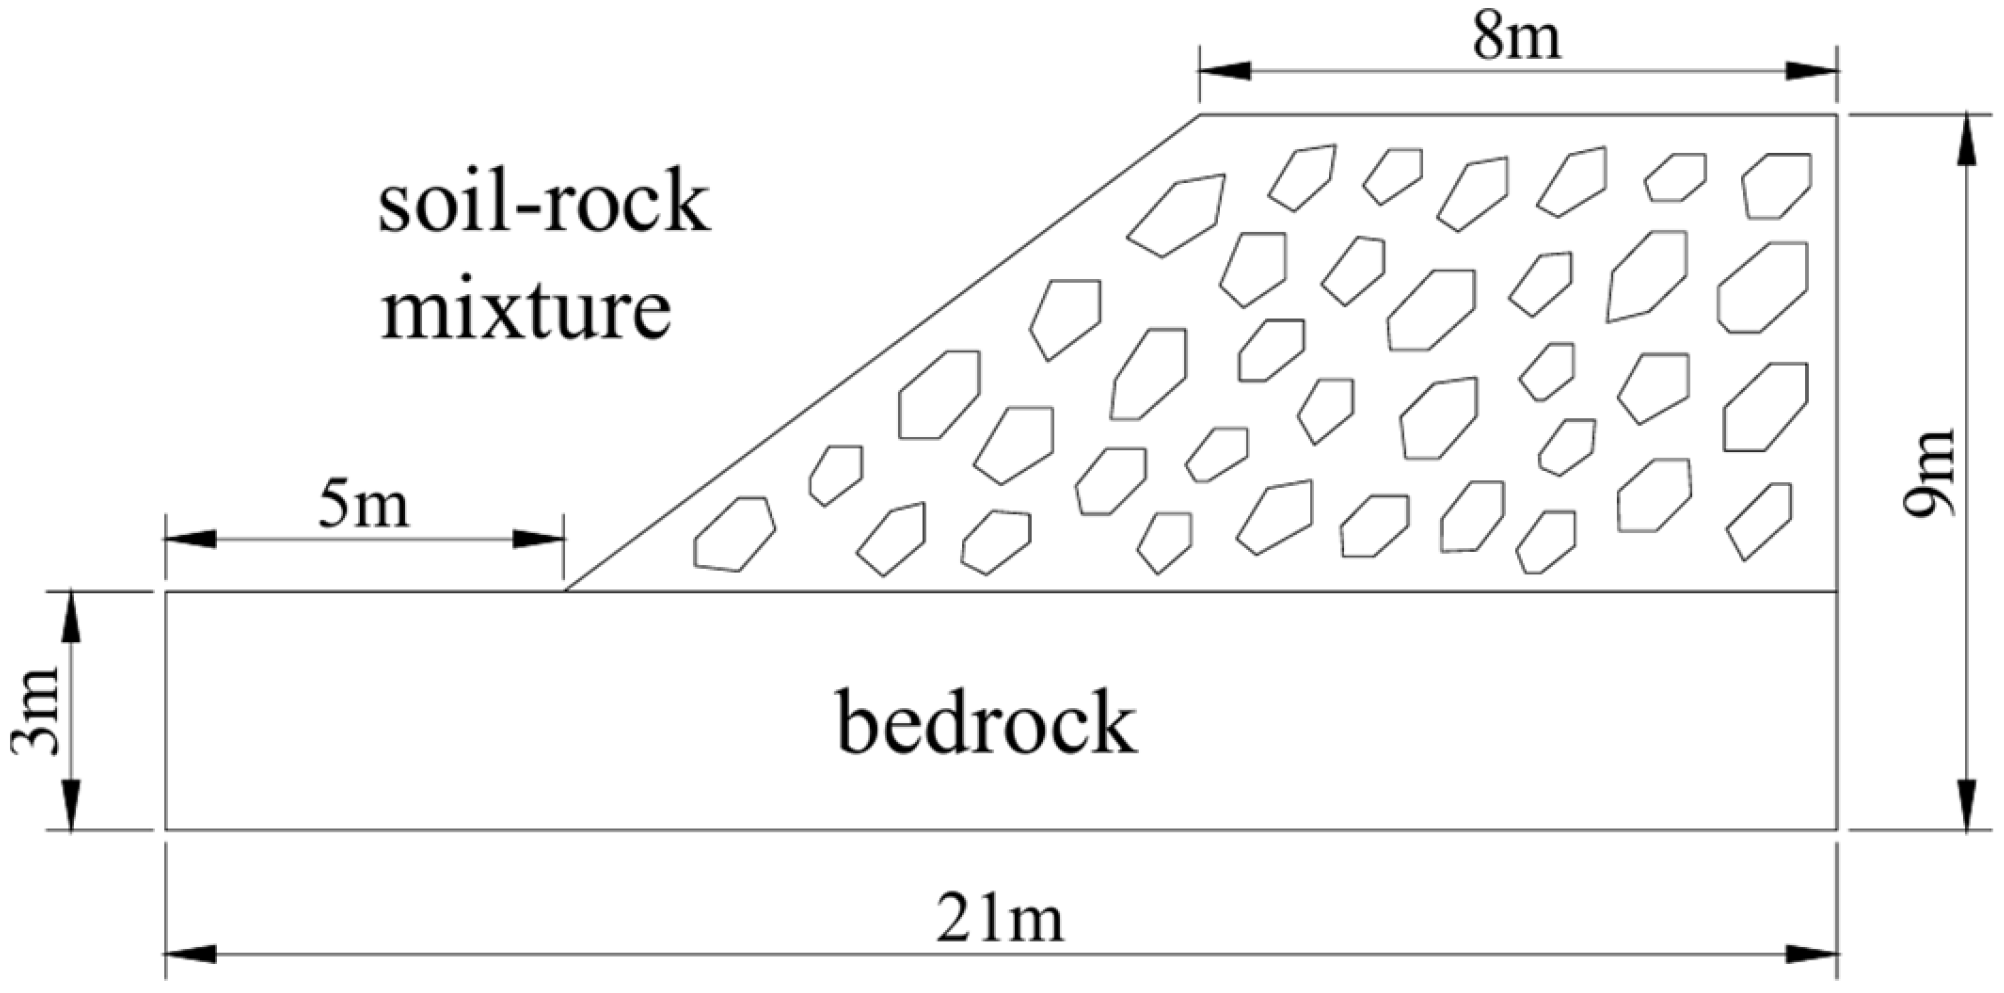
The modeling method for the soil–rock mixture slope adopted in this study follows the generation method proposed by the authors based on digital image processing technology [14]. The blocks were represented by closed polygonal contours extracted from real rock-block images, and their equivalent diameters were calculated from the block areas. According to the prescribed gradation curves, the blocks were randomly selected, scaled, rotated, and placed within the soil–rock mixture domain. Blocks intersecting existing blocks, the bedrock, or the model boundaries were rejected. This procedure was repeated until the target overall rock content VBP was reached. The adopted model represents an idealized shallow soil–rock mixture slope overlying a relatively stiff bedrock layer, which is commonly encountered in mountainous areas. After the model was established, the coordinates of the rock-block contours were imported into AutoCAD 2025 to generate a graphical interchange file. The geometric parameters of the model are shown in Figure 1. The slope angle is 45°, the slope height is 6 m, and the underlying layer is bedrock. All materials were assumed to be elastic-plastic and to obey the Mohr-Coulomb criterion. The material parameters of the rock blocks were taken to be identical to those of the bedrock, and the specific parameter settings are listed in Table 1. Three gradation types of the soil-rock mixture slope model are shown in Figure 2, in which the content of oversized rock blocks increases successively in each group.
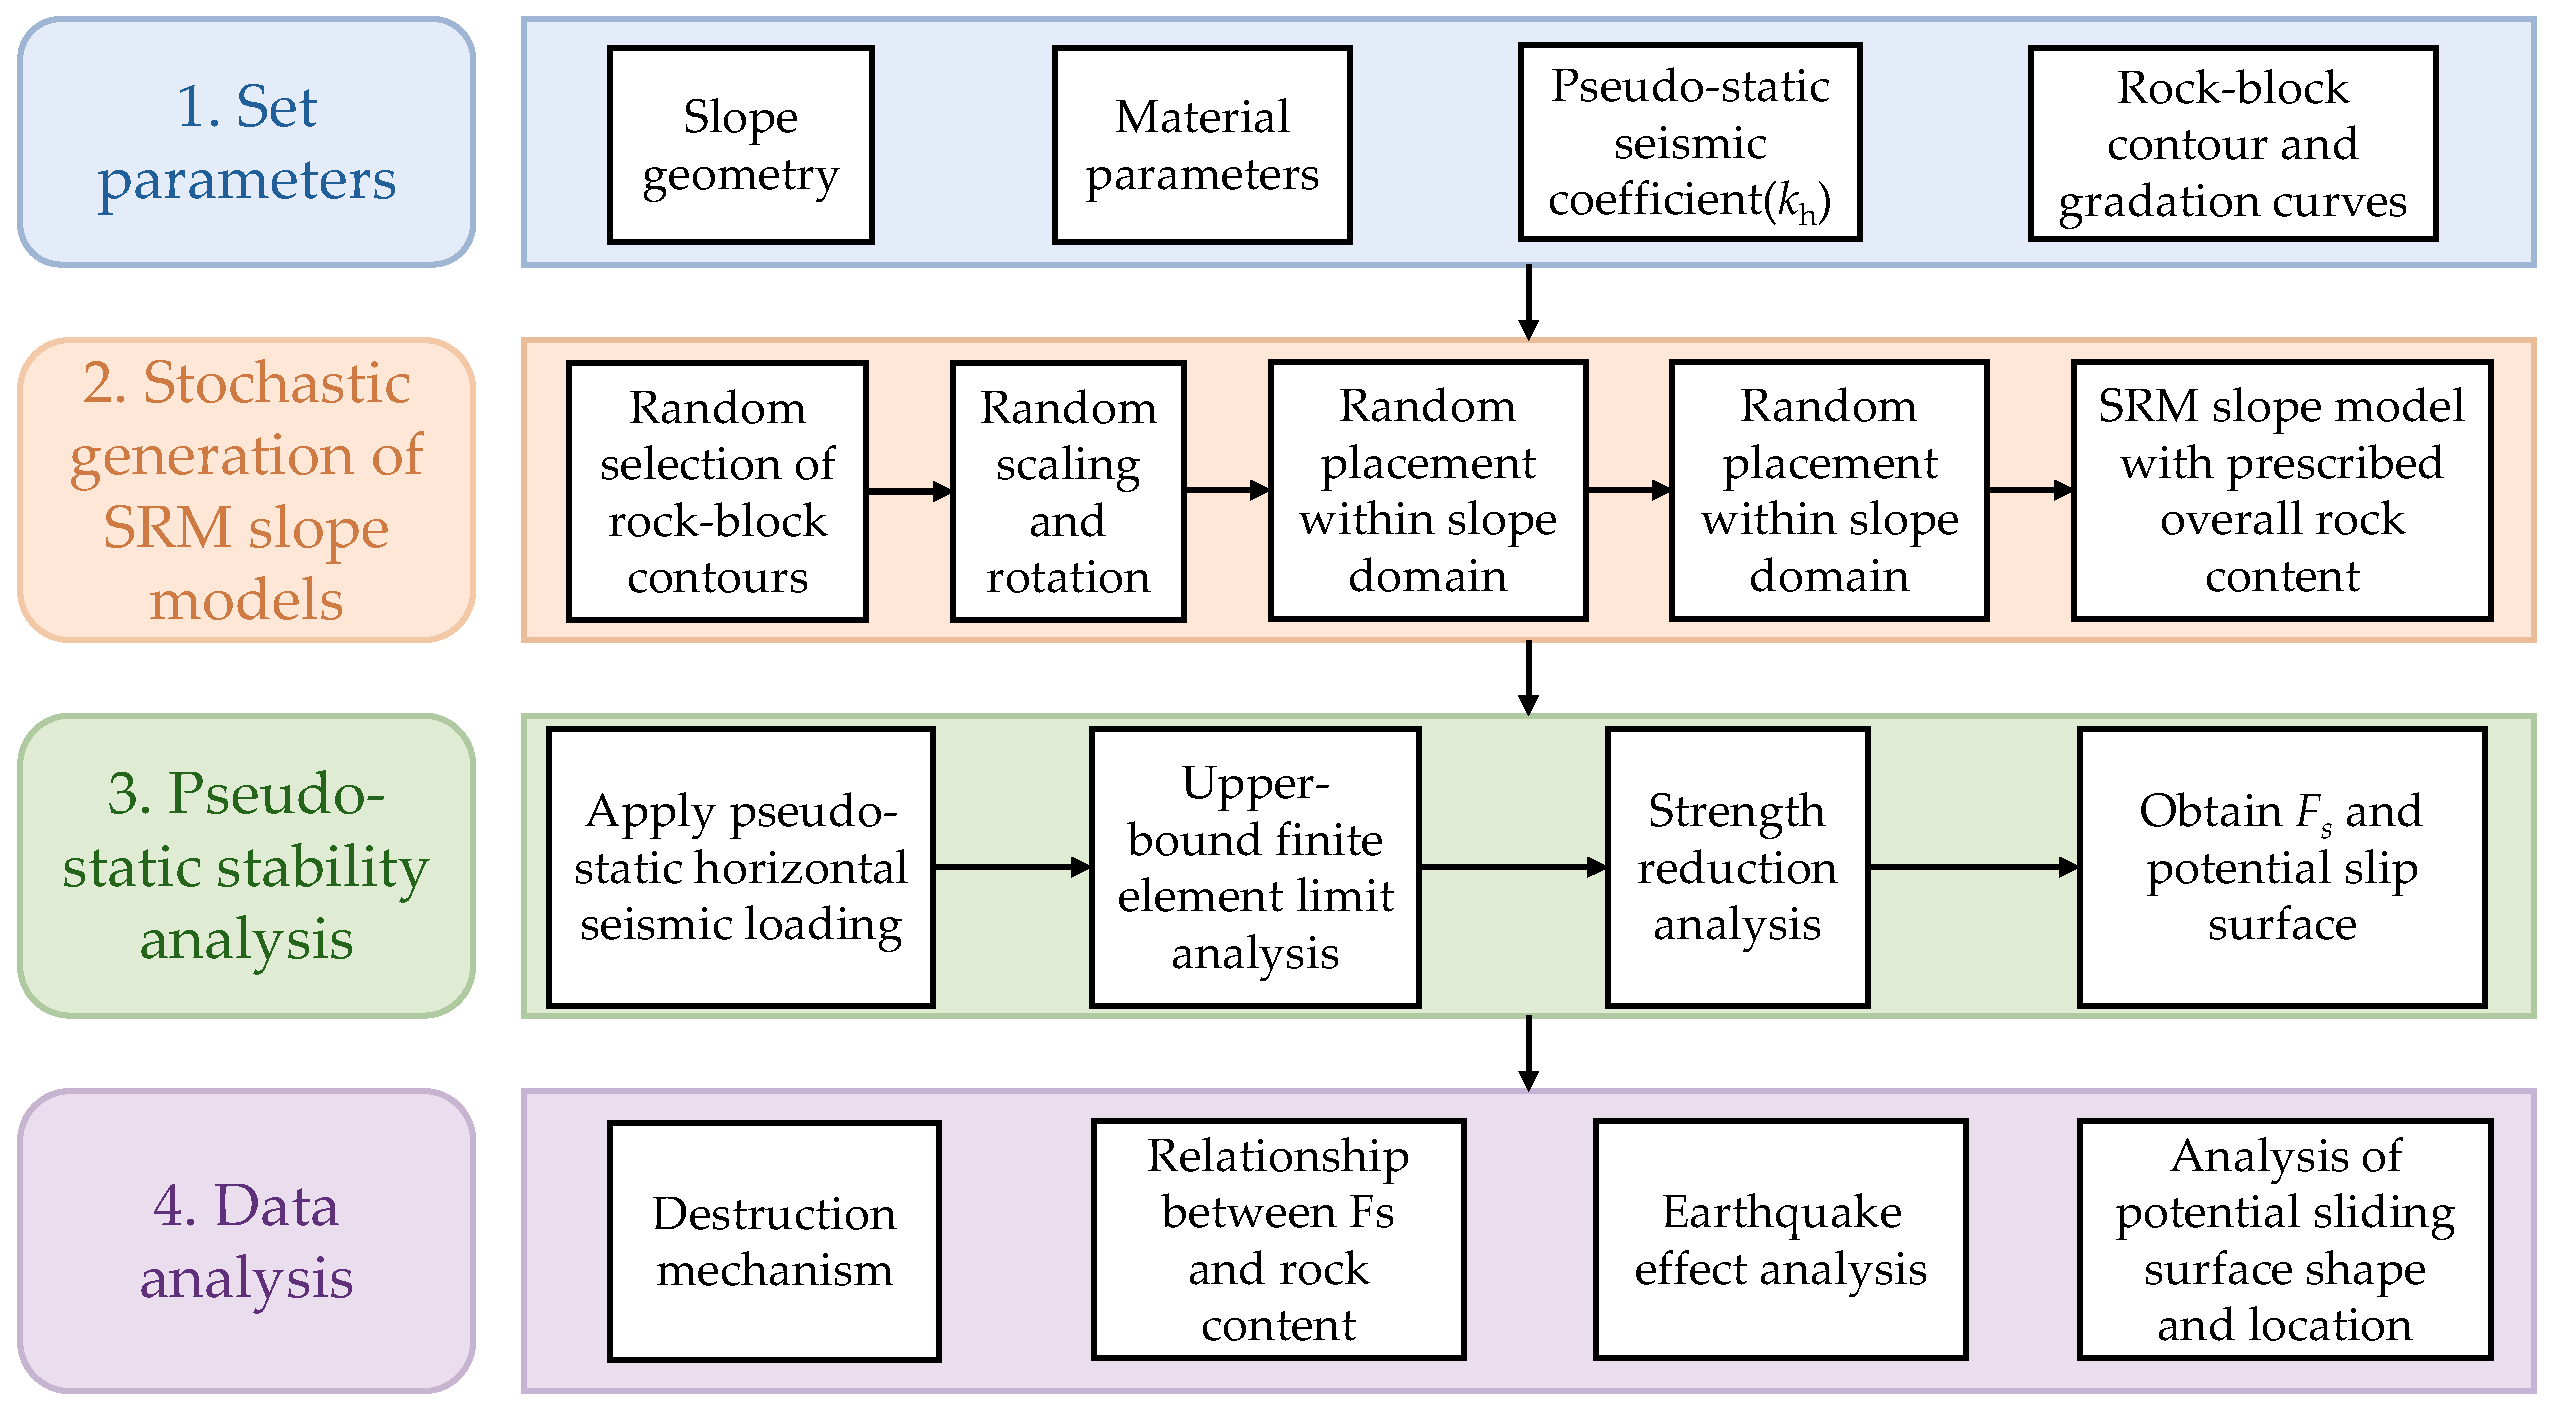
After the material properties were assigned, boundary conditions were imposed on the model in the OptumG2 2021 analysis software: horizontal roller constraints were applied along the lateral boundaries, and the bottom boundary was fully fixed. In this study, the pseudo-static method was adopted, and earthquake loading was represented by an equivalent constant horizontal inertial force. It should be noted that the pseudo-static method is a simplified seismic analysis approach, which is suitable for evaluating the overall stability trend under different horizontal seismic coefficients. However, it cannot explicitly capture the time-varying acceleration, frequency content, duration effect, or dynamic soil–structure interaction associated with real earthquakes. The flowchart of methodology for this study is shown in Figure 3.

3. Result

3.1. Analysis of the Limitations of the Overall Rock Content Index

To investigate the effect of overall rock content (VBP), Gradation 2 (Figure 2) was selected, and rock-block models with overall rock contents of 20%, 40%, and 60% were considered. The rock blocks were randomly distributed, and the horizontal seismic coefficient kh ranged from 0.1 to 0.5. Based on the OptumG2 software, numerical analyses were carried out to obtain the upper-bound values of the Fs, which were then compared with those of a homogeneous soil slope.
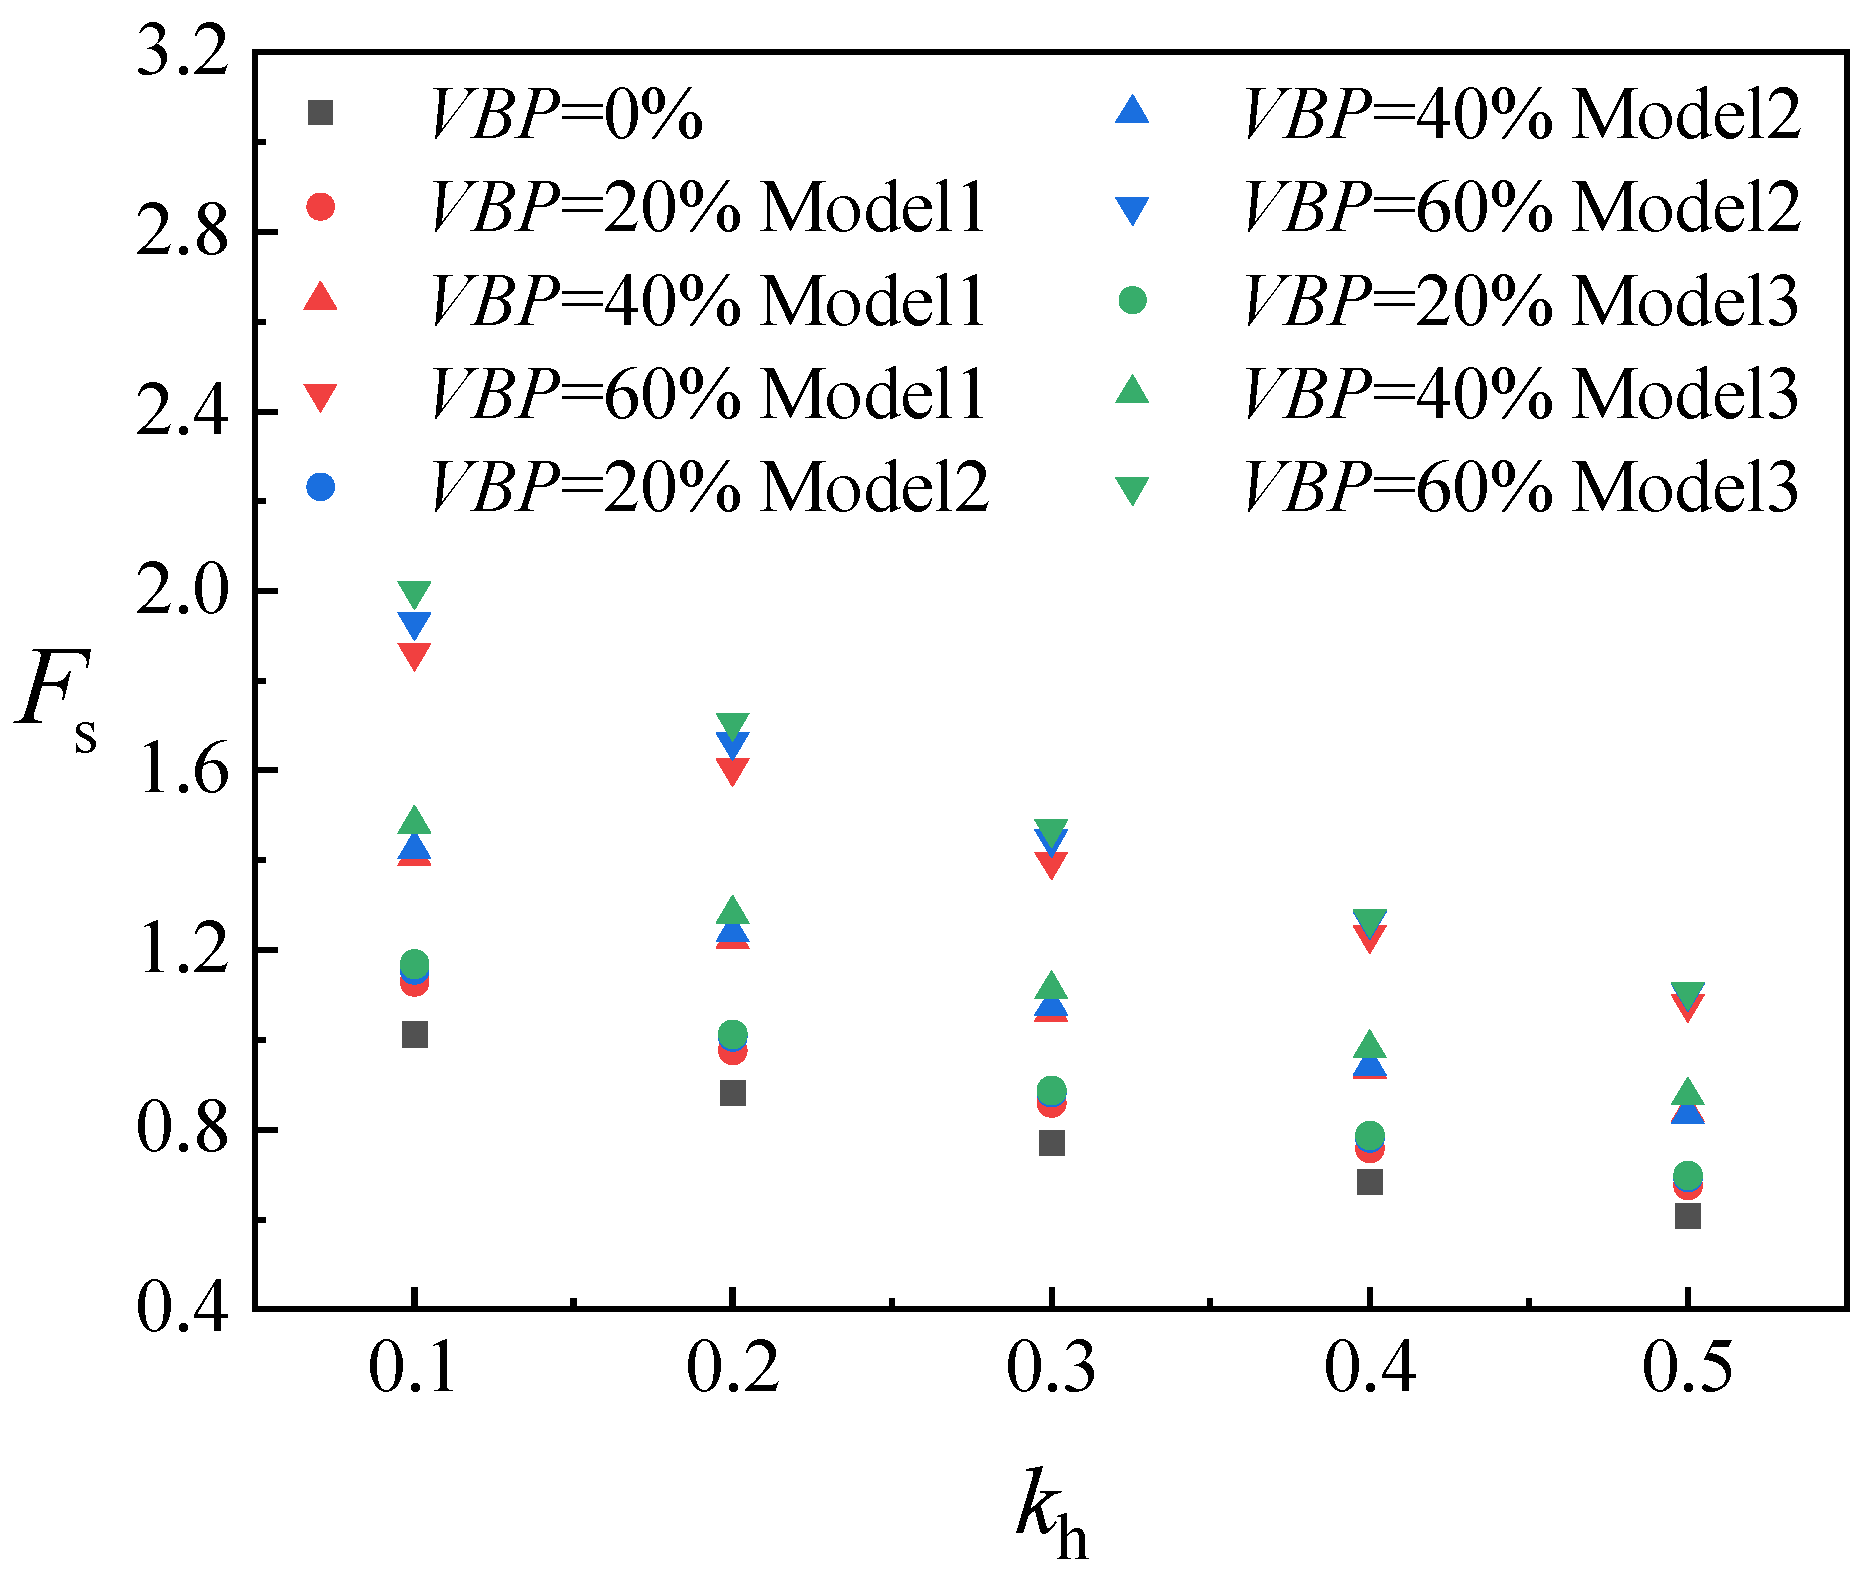
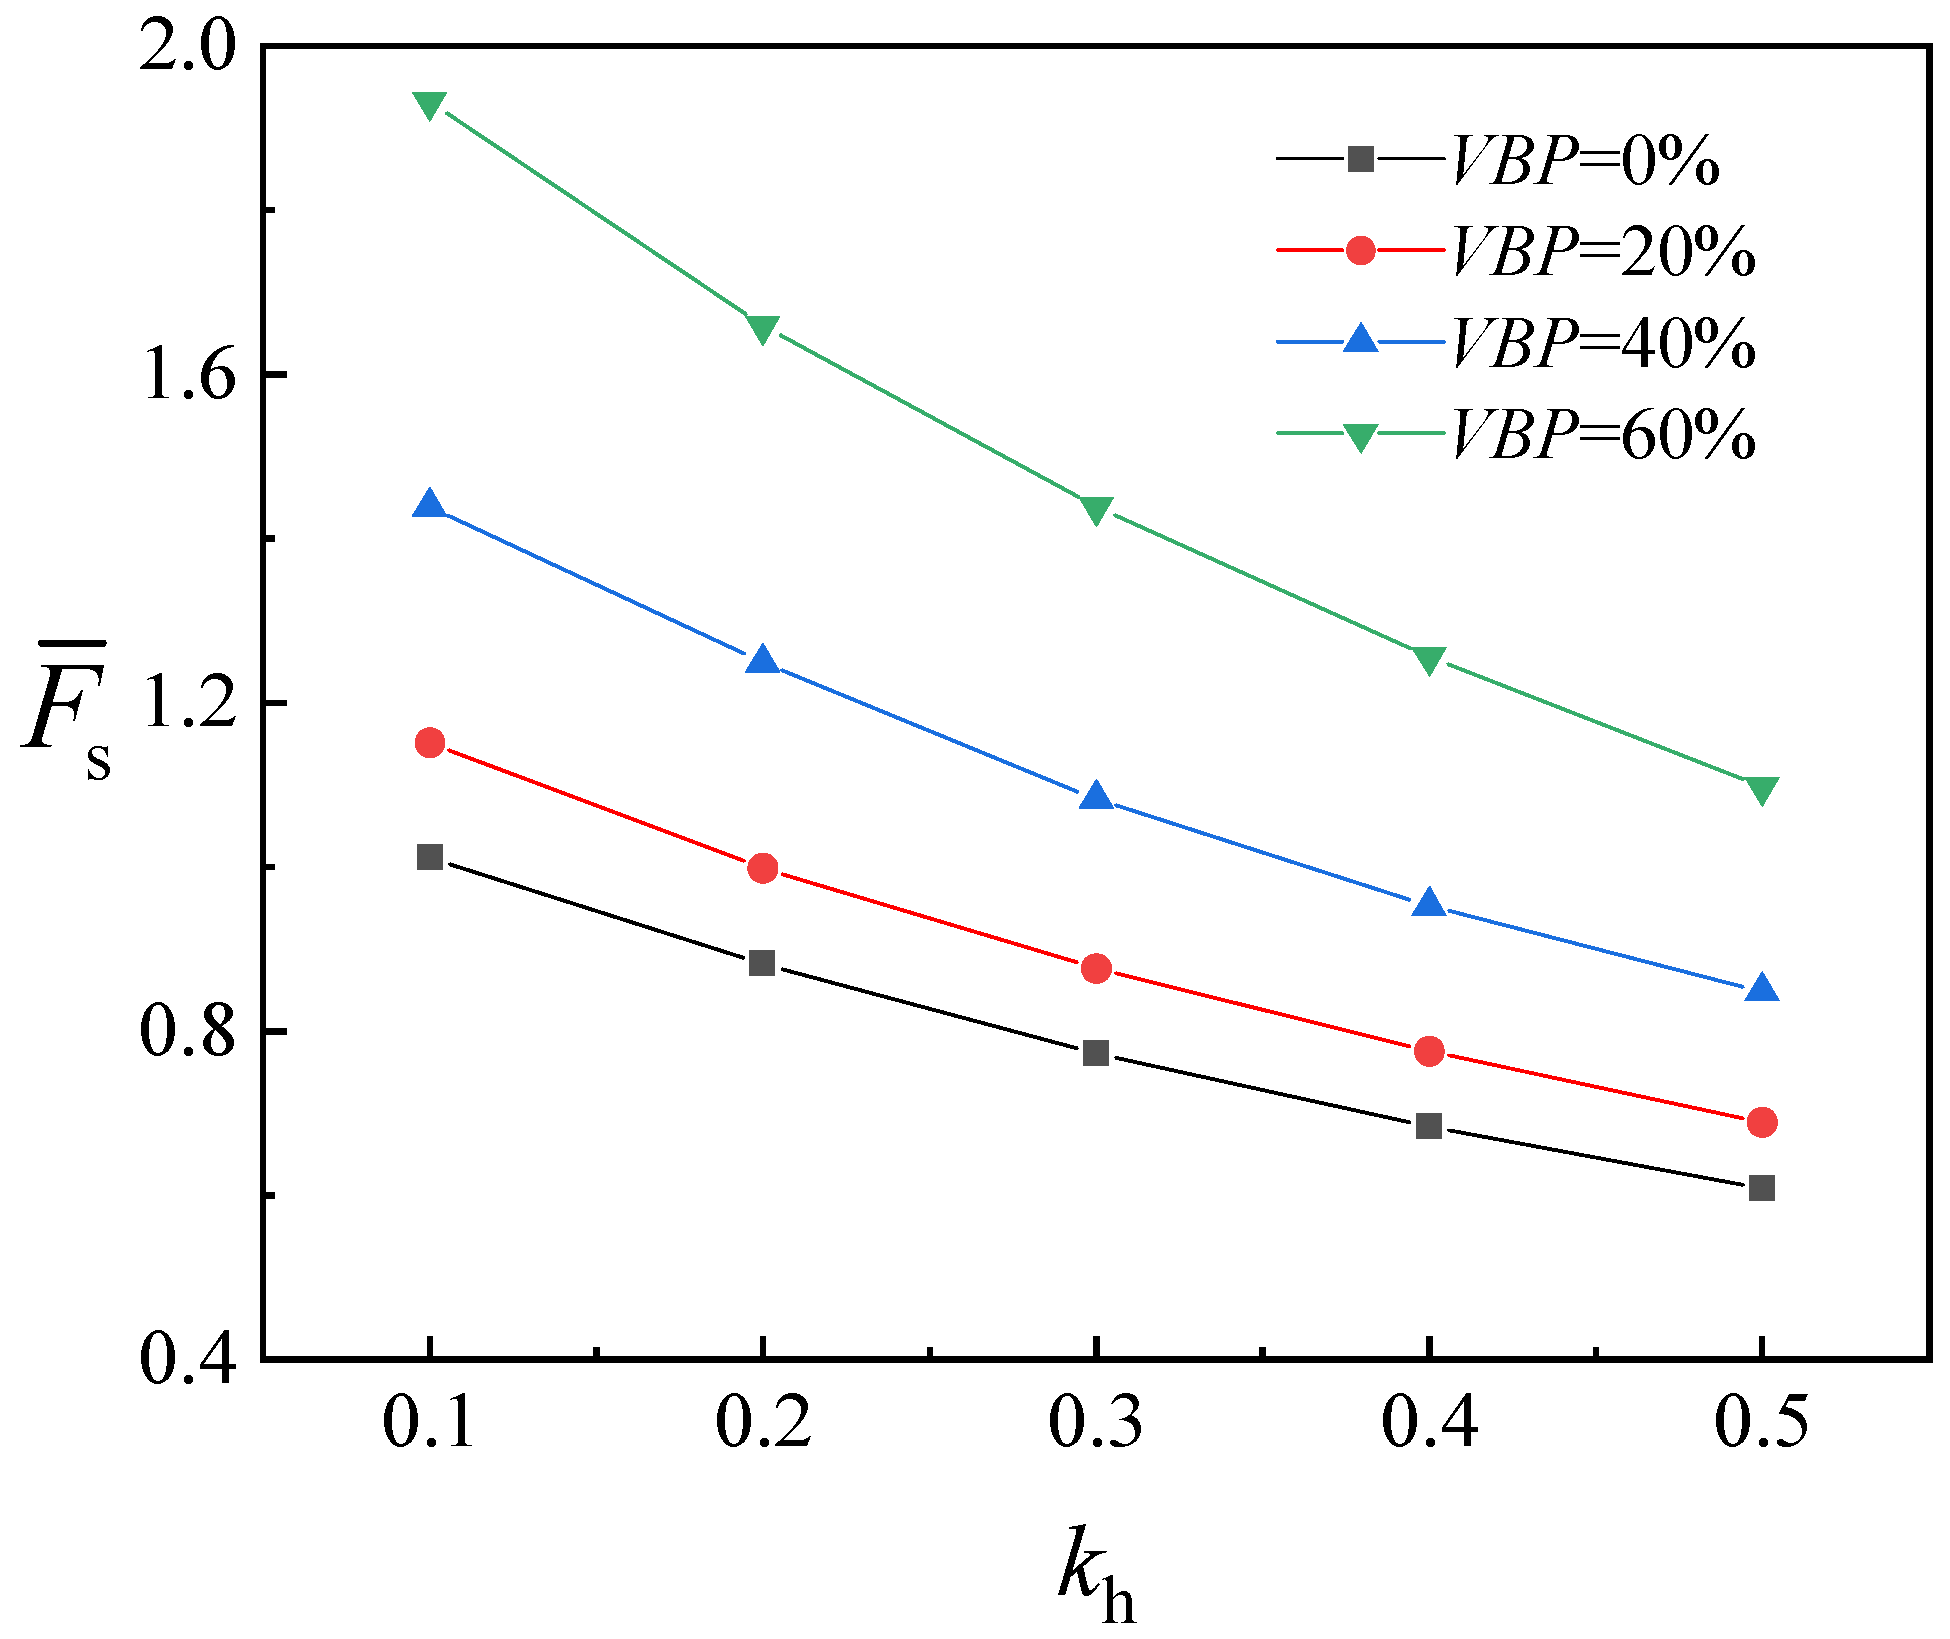
Considering the randomness involved in generating the soil–rock mixture slope models, the spatial distribution of rock blocks has a significant influence on the Fs of the model. Therefore, three random models were generated for each working condition. The corresponding upper-bound Fs are shown in Figure 4, and the F ¯ s are presented in Figure 5.
As can be seen from Figure 4, with the increase in seismic force, the Fs of the soil–rock mixture slope decreases, indicating a gradual reduction in slope stability. Meanwhile, the influence of the overall rock content on slope stability gradually weakens.
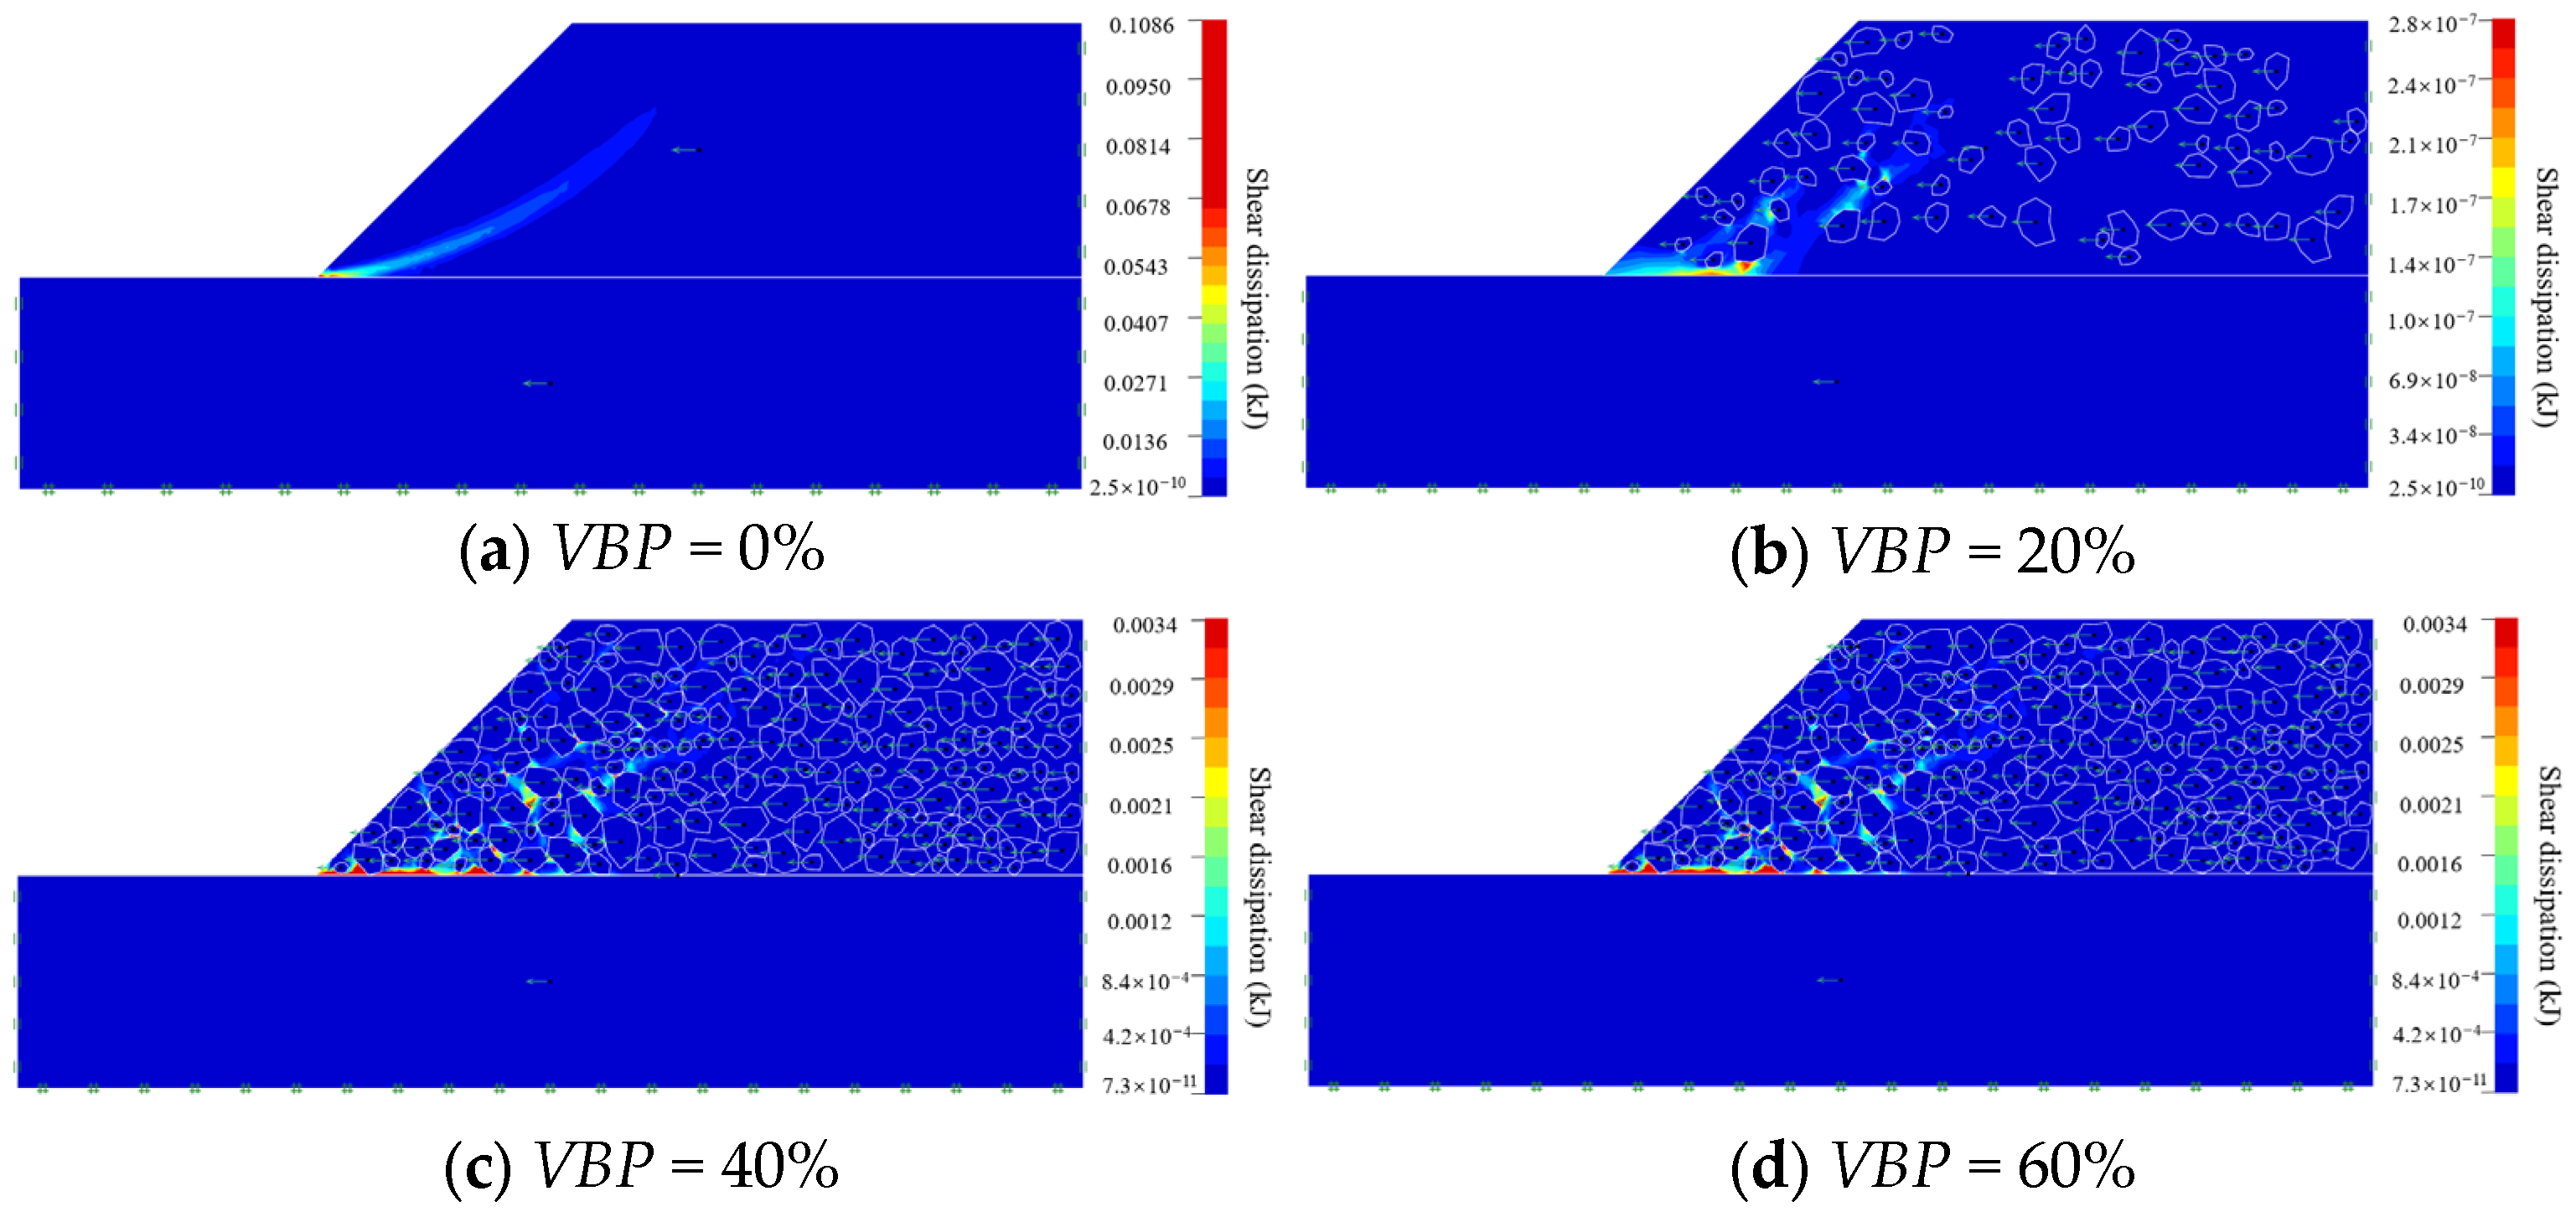
When kh = 0.3, the shear dissipation contours of slopes with overall rock contents of 0%, 20%, 40%, and 60% are shown in Figure 6. The arrows indicate the direction of the applied pseudo-static horizontal seismic force. It can be seen that, compared with the homogeneous soil slope, the potential sliding surface of the soil–rock mixture slope is no longer arc-shaped, but instead exhibits three typical propagation modes, namely, the “rock-bypassing” mode, the “diversion” mode, and the “inclusion” mode. As the rock content increases, the fragmentation degree of the plastic zone in the soil–rock mixture slope also increases, and the “inclusion” mode gradually becomes the dominant mode of plastic zone propagation.
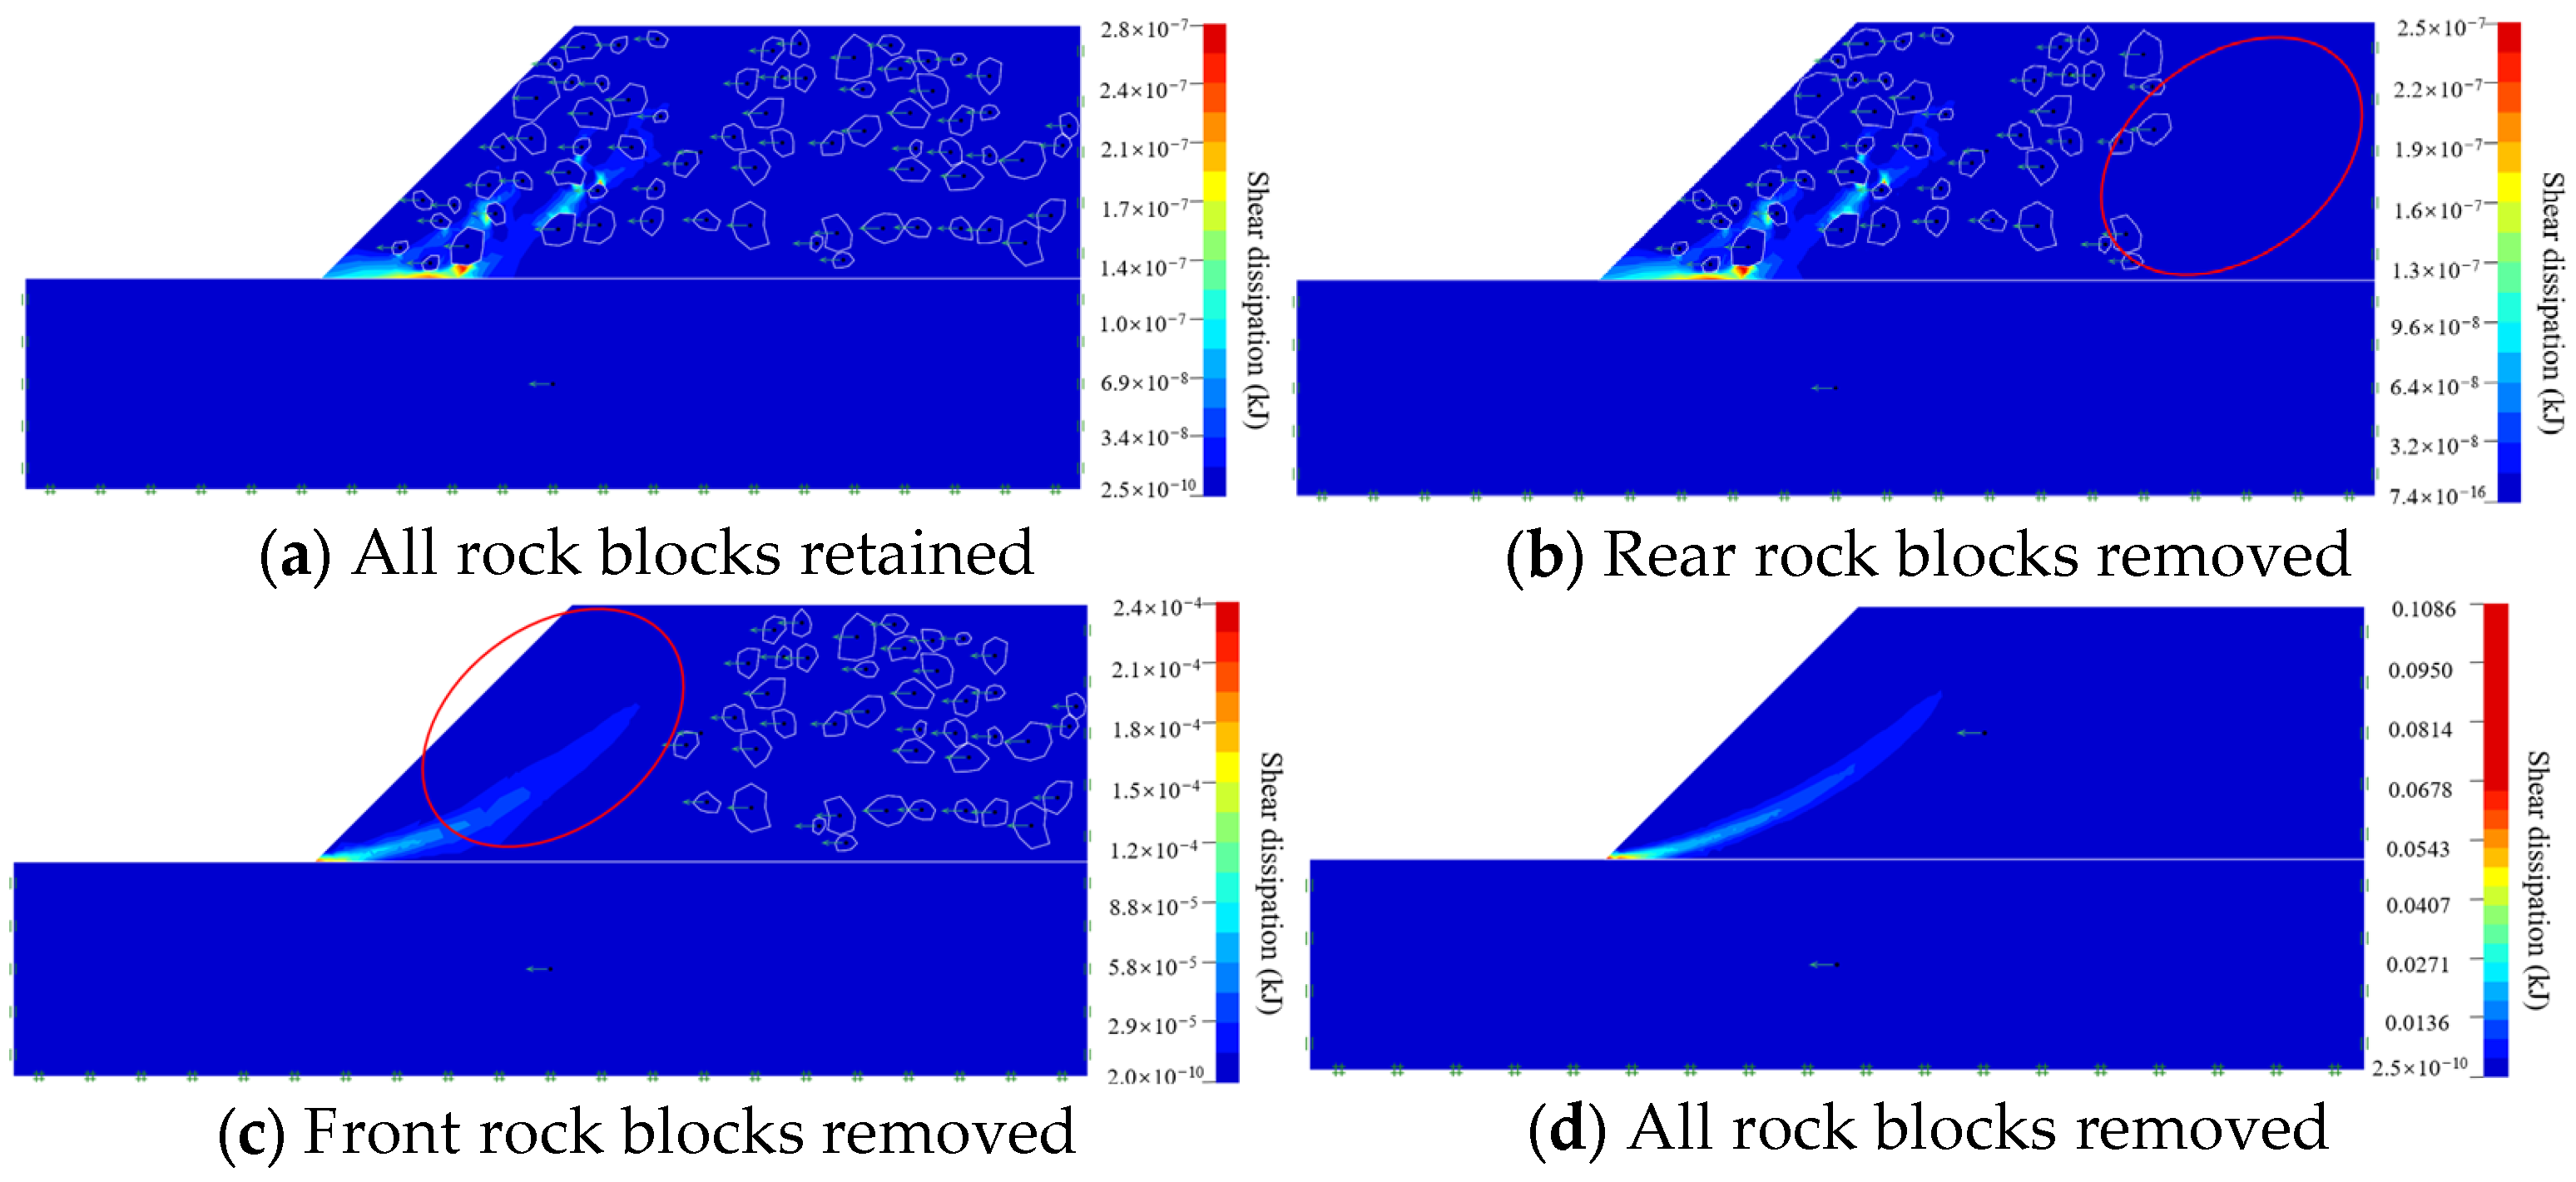
The above results indicate that the overall rock content is one of the key factors affecting the seismic stability of soil–rock mixture slopes. However, under the same or similar overall rock content, significant differences may still exist in the slip-band morphology and Fs due to different spatial configurations of rock blocks. Taking the case of Gradation 2, VBP = 20%, and kh = 0.3 as the reference condition, the overall rock content was adjusted for comparative analysis, and the corresponding shear dissipation contours are shown in Figure 7. The Fs under cases (a) and (b) are 0.882 and 0.881, respectively. Compared with case (a), case (b), in which only the rock blocks in the rear part of the slope are removed, shows that when the effective rock content remains unchanged, the Fs as well as the shape and position of the potential sliding surface remain almost unchanged relative to case (a). In contrast, the Fs under cases (c) and (d) are 0.774 and 0.772, respectively. When the rock blocks in the front part of the slope are removed, the Fs and the shape and position of the potential sliding surface become much closer to those of the homogeneous soil slope in case (d). This indicates that the rock blocks in the front part of the slope play a controlling role in slope stability.

3.2. Definition and Verification of the Effective Rock Content

3.2.1. Definition of the Effective Rock Content

The overall rock content can reflect the general proportion of rock blocks in a soil-rock mixture slope; however, this index cannot further distinguish the differentiated contributions of rock blocks at different spatial locations to the governing sliding mechanism. The above results indicate that the formation and propagation of the potential slip band under seismic loading do not involve the uniform participation of all rock blocks within the slope but are mainly controlled by the modulation of the connectivity and tortuosity of the dissipation path by rock blocks located in local key regions. Therefore, in order to more accurately characterize the actual contribution of rock blocks to slope stability, this study proposes the concept of effective rock content on the basis of the overall rock content. Under given slope geometry, material parameters, and seismic loading conditions, effective rock content refers to the local rock content corresponding to those rock blocks located within the influence range of the potential governing sliding mechanism and capable of significantly controlling the formation, penetration, and evolution of the slip band.
To identify and calculate the effective rock content, a definition method based on the potential sliding surface of a homogeneous slope is adopted in this study. Under the same slope geometry, soil-matrix parameters, boundary conditions, and pseudo-static seismic coefficient, the slip surface of the homogeneous slope represents the baseline failure path that would develop without the interference of rock blocks. Therefore, it provides a consistent reference for distinguishing the contribution of rock blocks from the effects of slope geometry, boundary conditions, and soil strength. Similar studies have also used the method of calculating the sliding surface of soil–rock mixture slopes based on the potential sliding surface of homogeneous slopes [29]. In addition, the numerical results obtained in this study further support the rationality of this treatment. When only the rock blocks located within the effective region defined by the homogeneous reference slip surface were retained, both the calculated safety factor and the potential slip surface remained close to those of the complete soil–rock mixture slope model. This indicates that the homogeneous-reference-based effective region can reasonably capture the key rock blocks participating in the governing sliding mechanism.
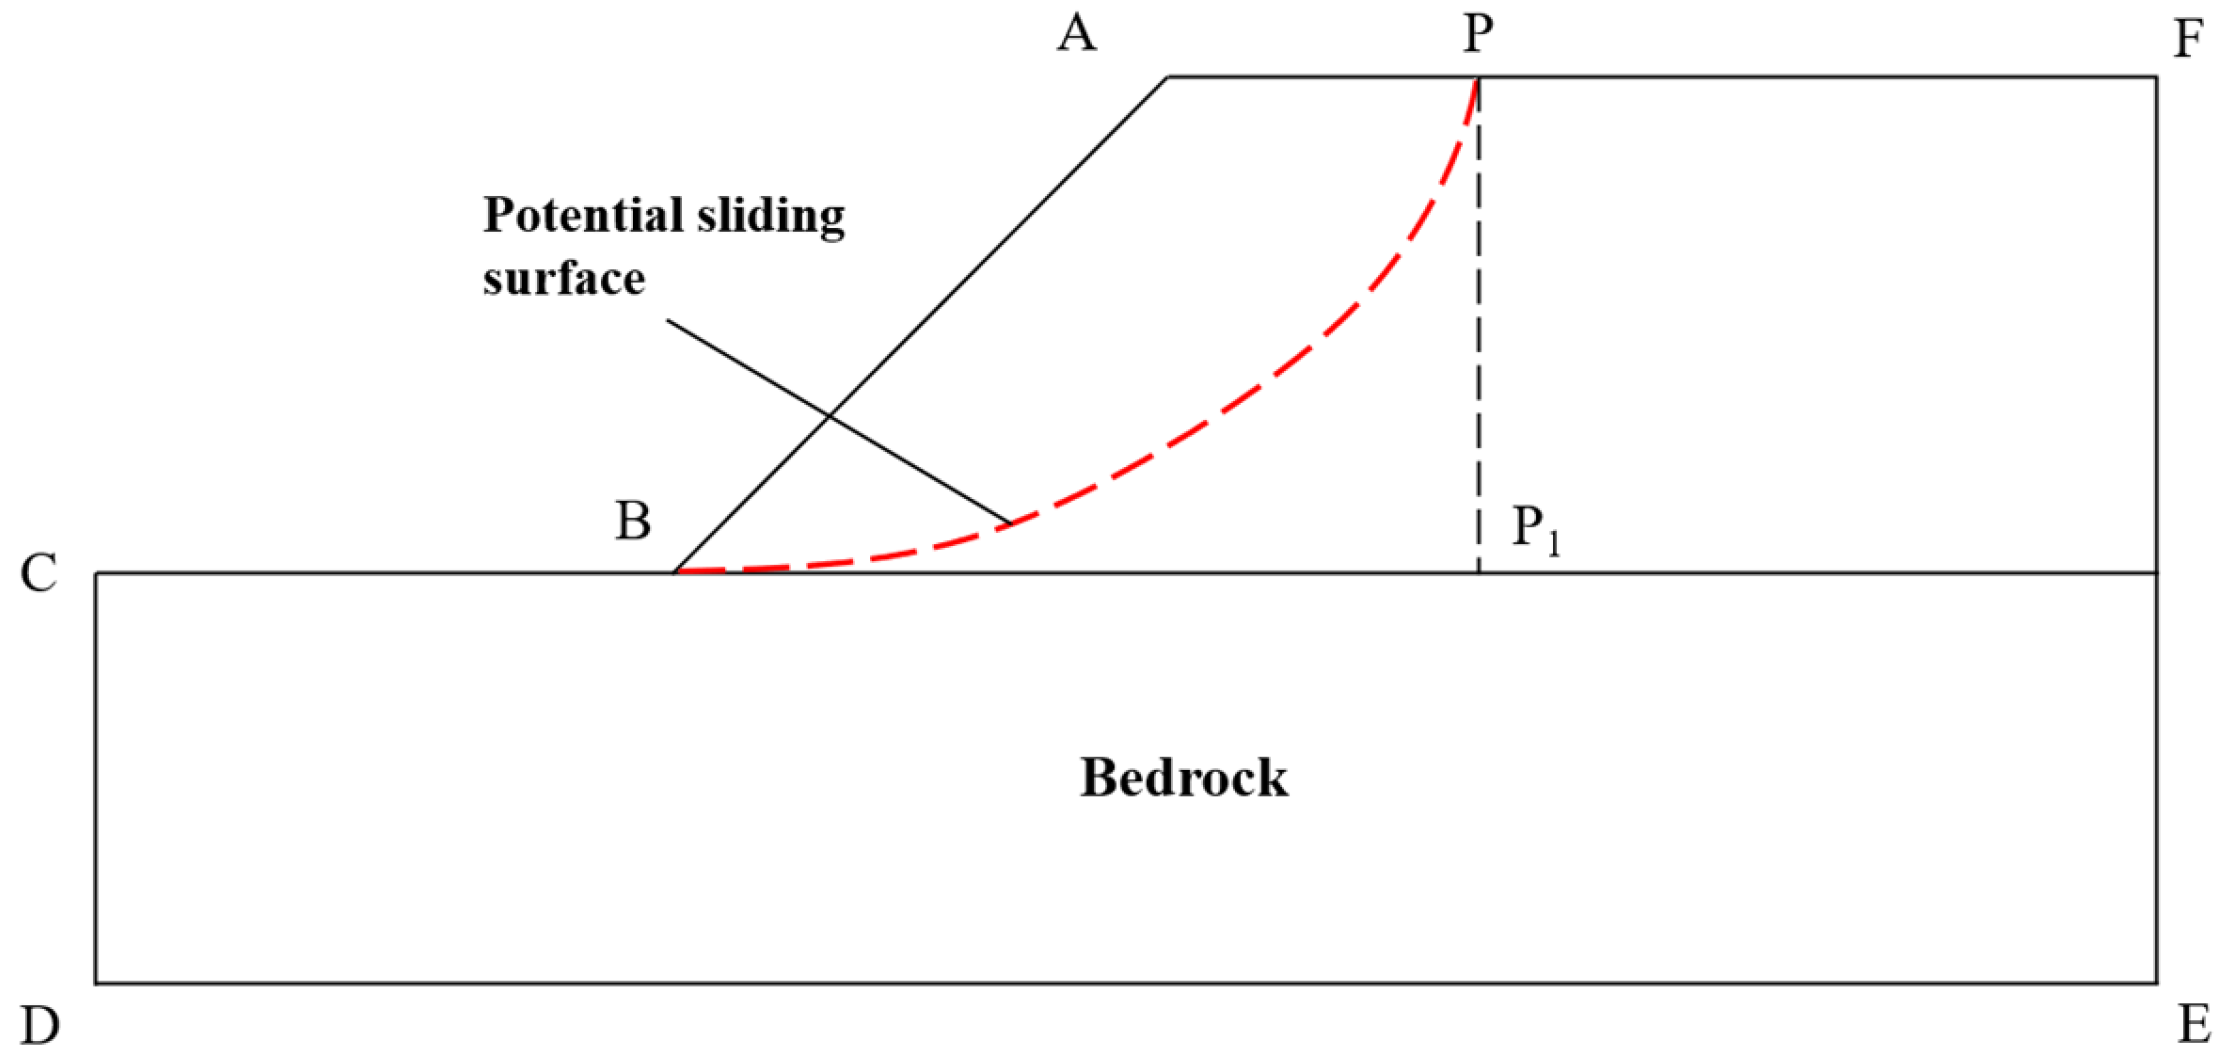
The detailed definition procedure is illustrated in Figure 8. First, a homogeneous soil slope model is established using the same geometry, material parameters, boundary conditions, and pseudo-static seismic coefficient as those of the soil–rock mixture slope. The potential slip surface of this homogeneous slope is then obtained and used as the reference slip surface. Let the intersection point between the reference slip surface and the slope crest platform be denoted as P. A vertical line PP1 is drawn through point P, which serves as the reference boundary for dividing the slope domain Ω into a front region and a rear region. The region APP1B located in front of this dividing line is defined as the effective region, denoted as Ωe. Accordingly, the effective rock content Ce is defined as the proportion of rock blocks located within Ωe. Compared with the overall rock content VBP, Ce more directly characterizes the actual contribution of rock blocks to slope stability.
To further characterize the degree to which rock blocks throughout the slope participate in the governing sliding mechanism, this study also defines the effective rock-block contribution ratio, ηe, which is the ratio of the area of rock blocks within the governing region to the total area of rock blocks in the entire slope
η e = A b ( Ω e ) A b ( Ω )
In the equation, Ab(Ω) is the total area of rock blocks, and Ab(Ωe) is the area of rock blocks within the governing region. This index further quantifies the proportion of rock blocks that may make a significant contribution to the Fs.

3.2.2. Quantitative Verification of the Controlling Role of Ce

To verify the controlling role of effective rock content, the effective rock content Ce of the soil–rock mixture slope is kept constant, while the VBP is regulated by varying ηe, so as to examine its controlling effect on slope stability. The homogeneous soil slope under the condition of kh = 0.3 is selected as the reference case. The calculation shows that the intersection point P between the potential sliding surface and the slope crest platform is located 3.08 m behind the slope crest, that is, AP = 3.08 m. The corresponding Fs are listed in Table 2.
It can be seen from Table 2 that, when Ce is kept constant, the Fs does not vary significantly with ηe. To further quantitatively verify the influence of effective rock content, the normalized range sensitivity coefficient is employed to analyze Ce and ηe:
S x = Δ F s / F ¯ s Δ x / x ¯
where Δ F s is the range of Fs under a given set of control conditions, F ¯ s is the mean value of Fs for that set, Δ x is the range of variable x, and x ¯ is the mean value of variable x. The physical meaning of Sx is that a 1% relative change in variable x will cause a relative change of S% in Fs.
By averaging the calculated values of Sx under different ηe and Ce, the values of S C e ¯ and S C e ¯ were obtained as 0.1758 and 0.0133. Under this set of working conditions, the sensitivity of the Fs of the soil–rock mixture slope to Ce is approximately 13 times that to ηe, indicating that the Fs is mainly governed by the effective rock content Ce. Verification under the other working conditions shows that the same pattern is also observed.

3.2.3. Benchmark Verification Against Published Numerical Cases

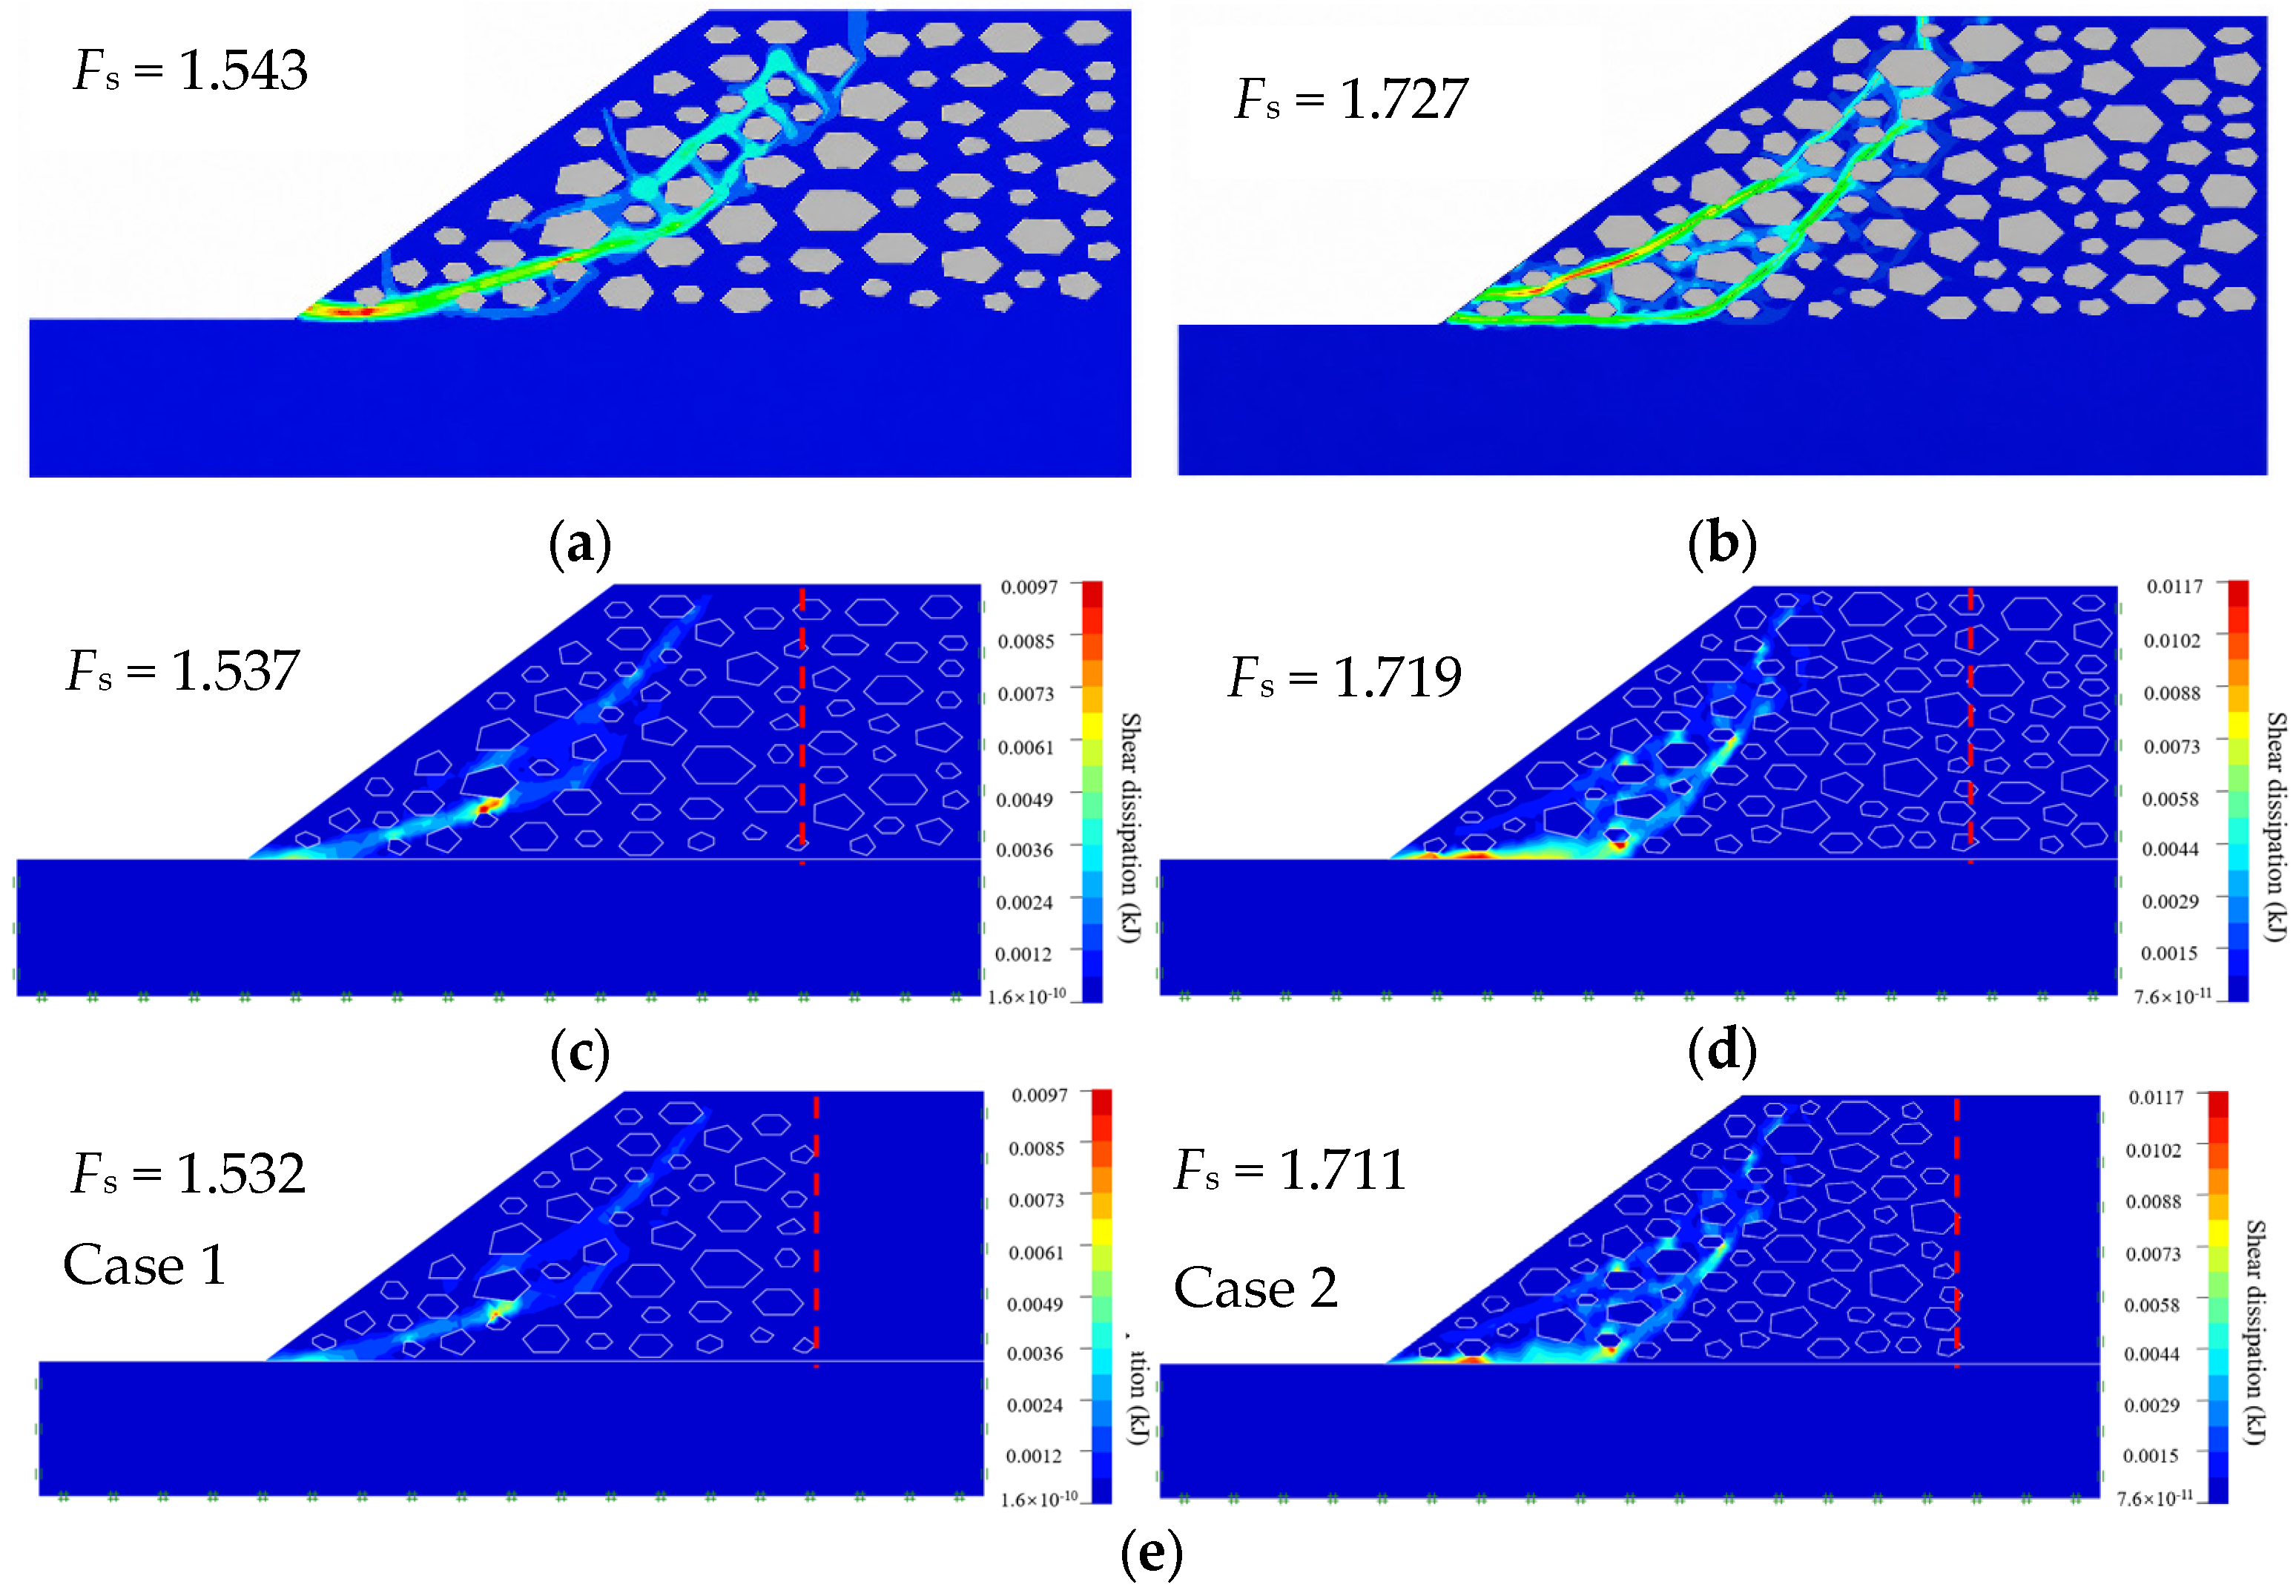
To verify the reliability of the concept proposed in this study, two cases reported by Liu et al. [30] were selected for comparison. The slope geometry and mechanical parameters were taken to be identical, as shown in Figure 9 and Table 3. In Figure 10, panels (a) and (b) present the numerical simulation results obtained by Liu et al. [31] using Fast Lagrangian Analysis of Continua in Three Dimensions (FLAC3D) for overall rock contents of 30% and 40%, respectively, with corresponding Fs of 1.543 and 1.727. Panels (c) and (d) show the results calculated in this study using OptumG2, with corresponding Fs of 1.537 and 1.719. The red dashed line in the figure denotes the boundary of the effective region, which is located 4.5 m away from the right slope boundary [29]. It can be seen that the Fs and potential sliding surfaces obtained in this study are in good agreement with those reported by Liu et al. Furthermore, the calculation results obtained by retaining only the rock blocks within the effective region are shown in panels (e) and (f), with Fs of 1.532 and 1.711, respectively, which are also in close agreement with those of cases (c) and (d) in terms of both Fs and potential sliding surface. These results further demonstrate the controlling role of the rock blocks within the effective region on slope stability. It should be emphasized that this comparison represents a benchmark verification against published numerical results rather than a direct field-case validation. The relative differences in Fs between the present results and those reported by Liu et al. are approximately 0.39% and 0.46% for the two cases, respectively. In addition, the predicted potential slip surfaces are also in good agreement with the published results. These comparisons support the numerical reliability of the present modeling framework and the rationality of the effective-region concept. Nevertheless, further validation using well-documented field cases, monitoring data, or back-analysis of real slope failures is still required in future work.

3.2.4. Influence of Ce on Stability of Soil-Rock Slopes Under Seismic Loading

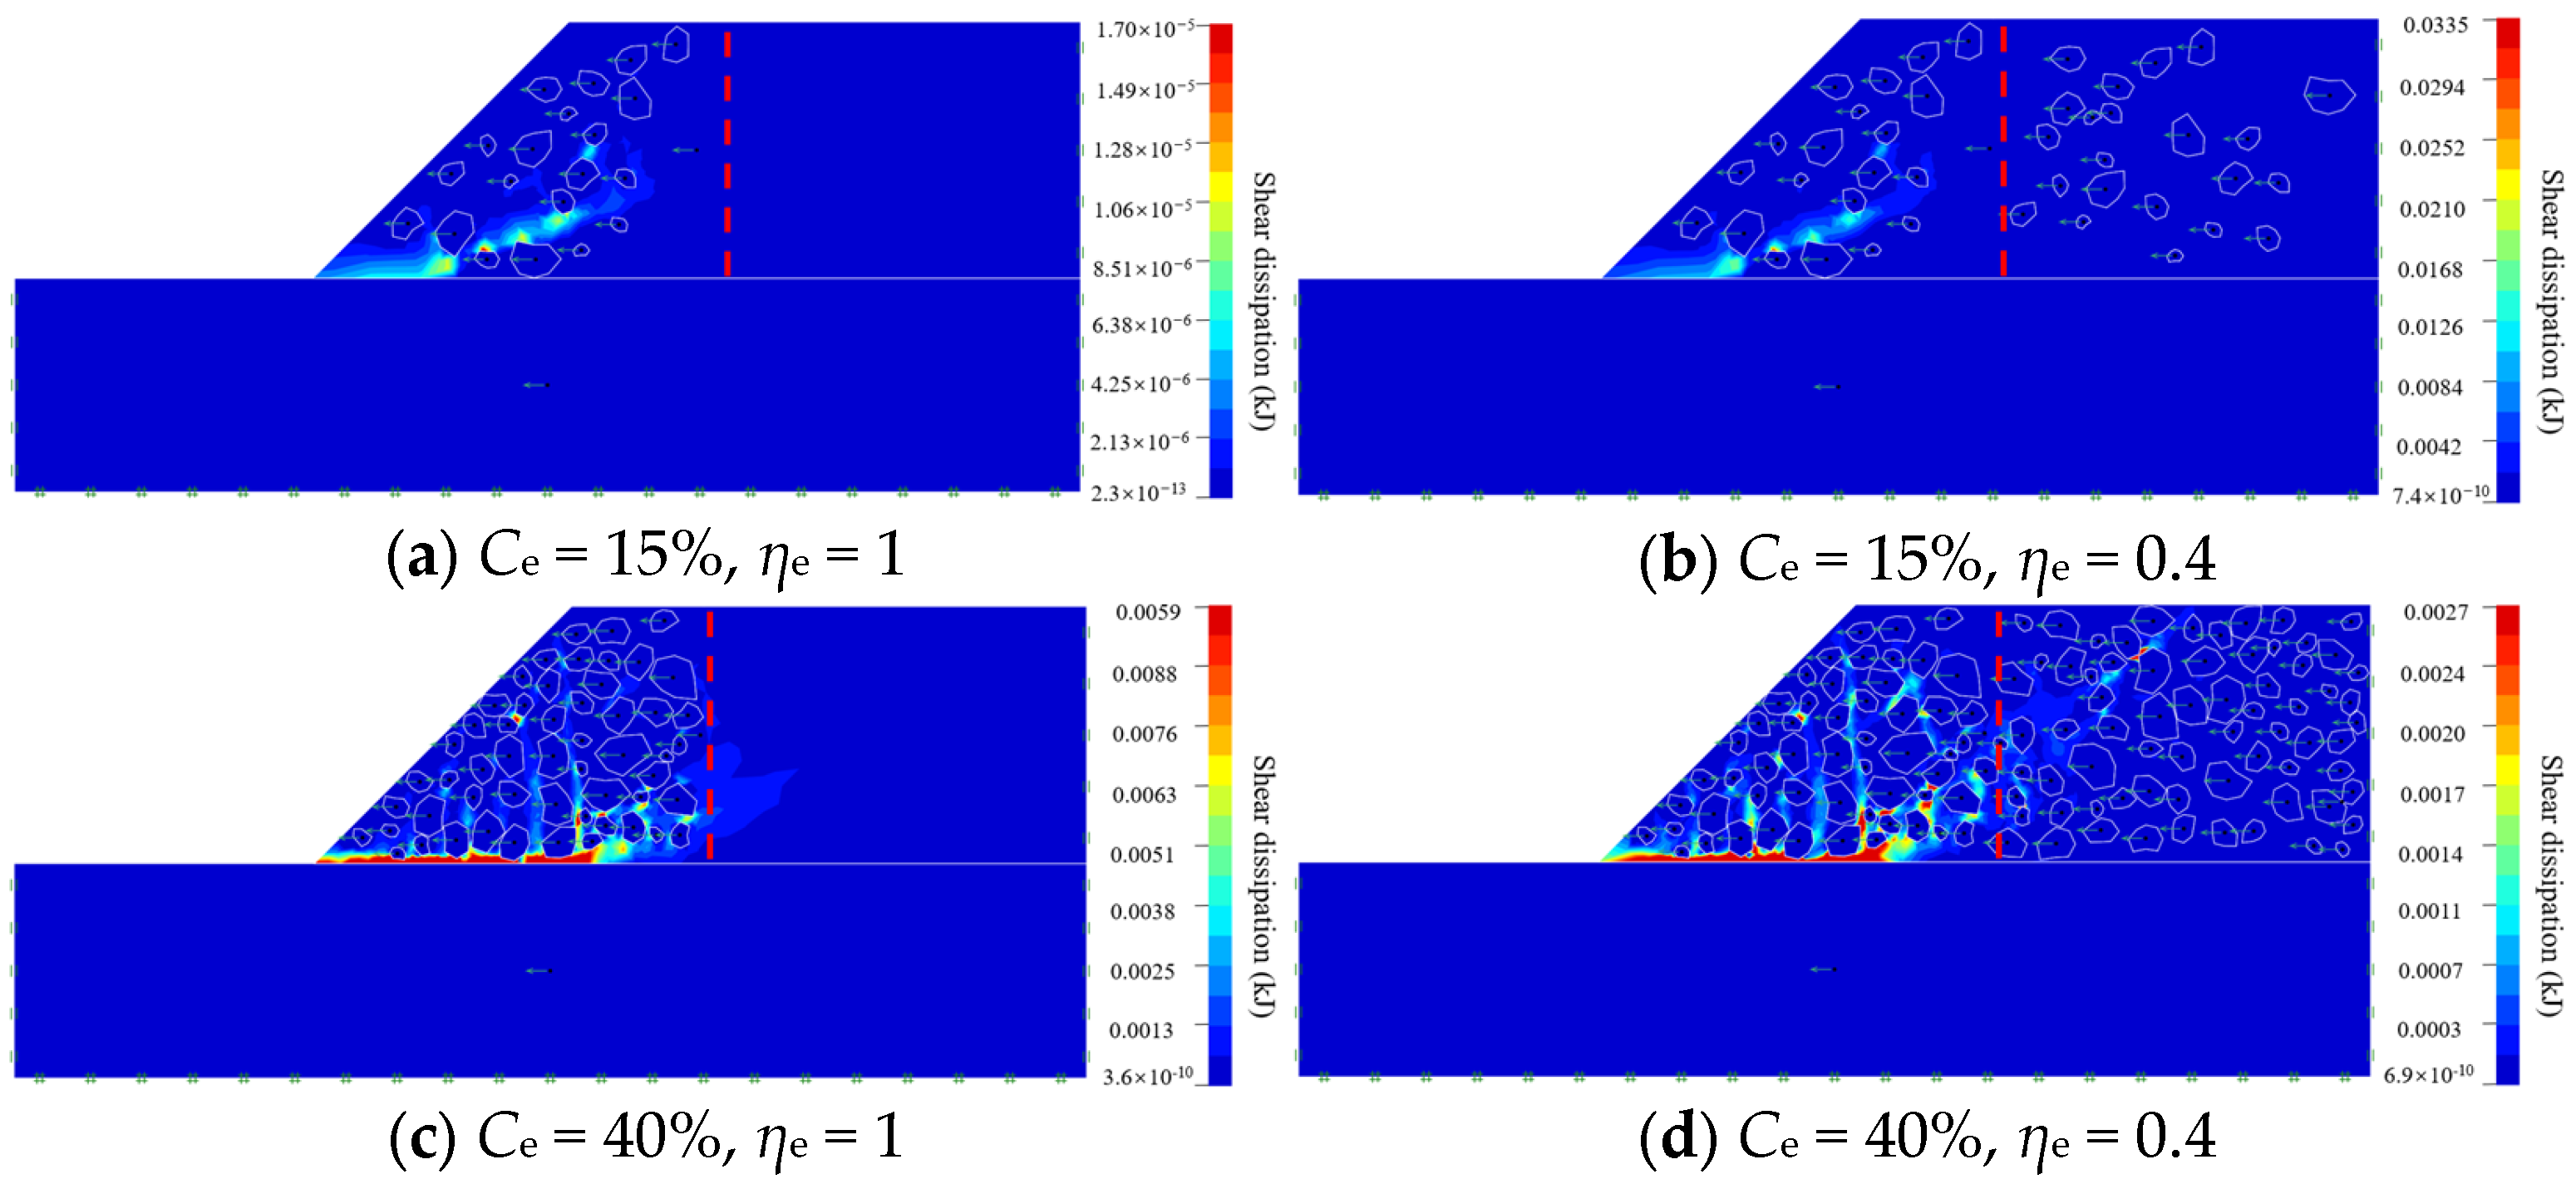
To further investigate the effect of Ce on the stability of soil–rock mixture slopes, four cases were designed by combining two levels of effective rock content, Ce = 15% and Ce = 40%, with two levels of effective rock-block contribution ratio, ηe = 0.4 and ηe = 1, and the corresponding shear dissipation contours are shown in Figure 10. The red dashed line in the figure denotes the boundary of the effective region. It can be seen that when Ce is relatively low, the potential sliding surface of the soil–rock mixture slope varies only slightly with the VBP. However, as Ce increases (Figure 11c,d), the rock skeleton within the effective region significantly restricts the upward and outward propagation of the plastic zone, causing the slip band to extend backward along the weaker soil matrix near the bedrock interface. As a result, the slope tends to develop a composite failure mode, with a curved slip surface in the upper soil–rock mixture and a nearly horizontal segment near the underlying bedrock. This pattern is consistent with the common slope configuration in which a soil–rock mixture layer overlies relatively stiff bedrock Under such circumstances, the role of the rock blocks outside the effective region can no longer be neglected. Therefore, in practical engineering, when rock blocks are uniformly distributed and the VBP is relatively high, the morphology of the potential sliding surface is governed by the rock blocks throughout the entire slope. In such cases, in addition to the Fs, other evaluation criteria should also be introduced.
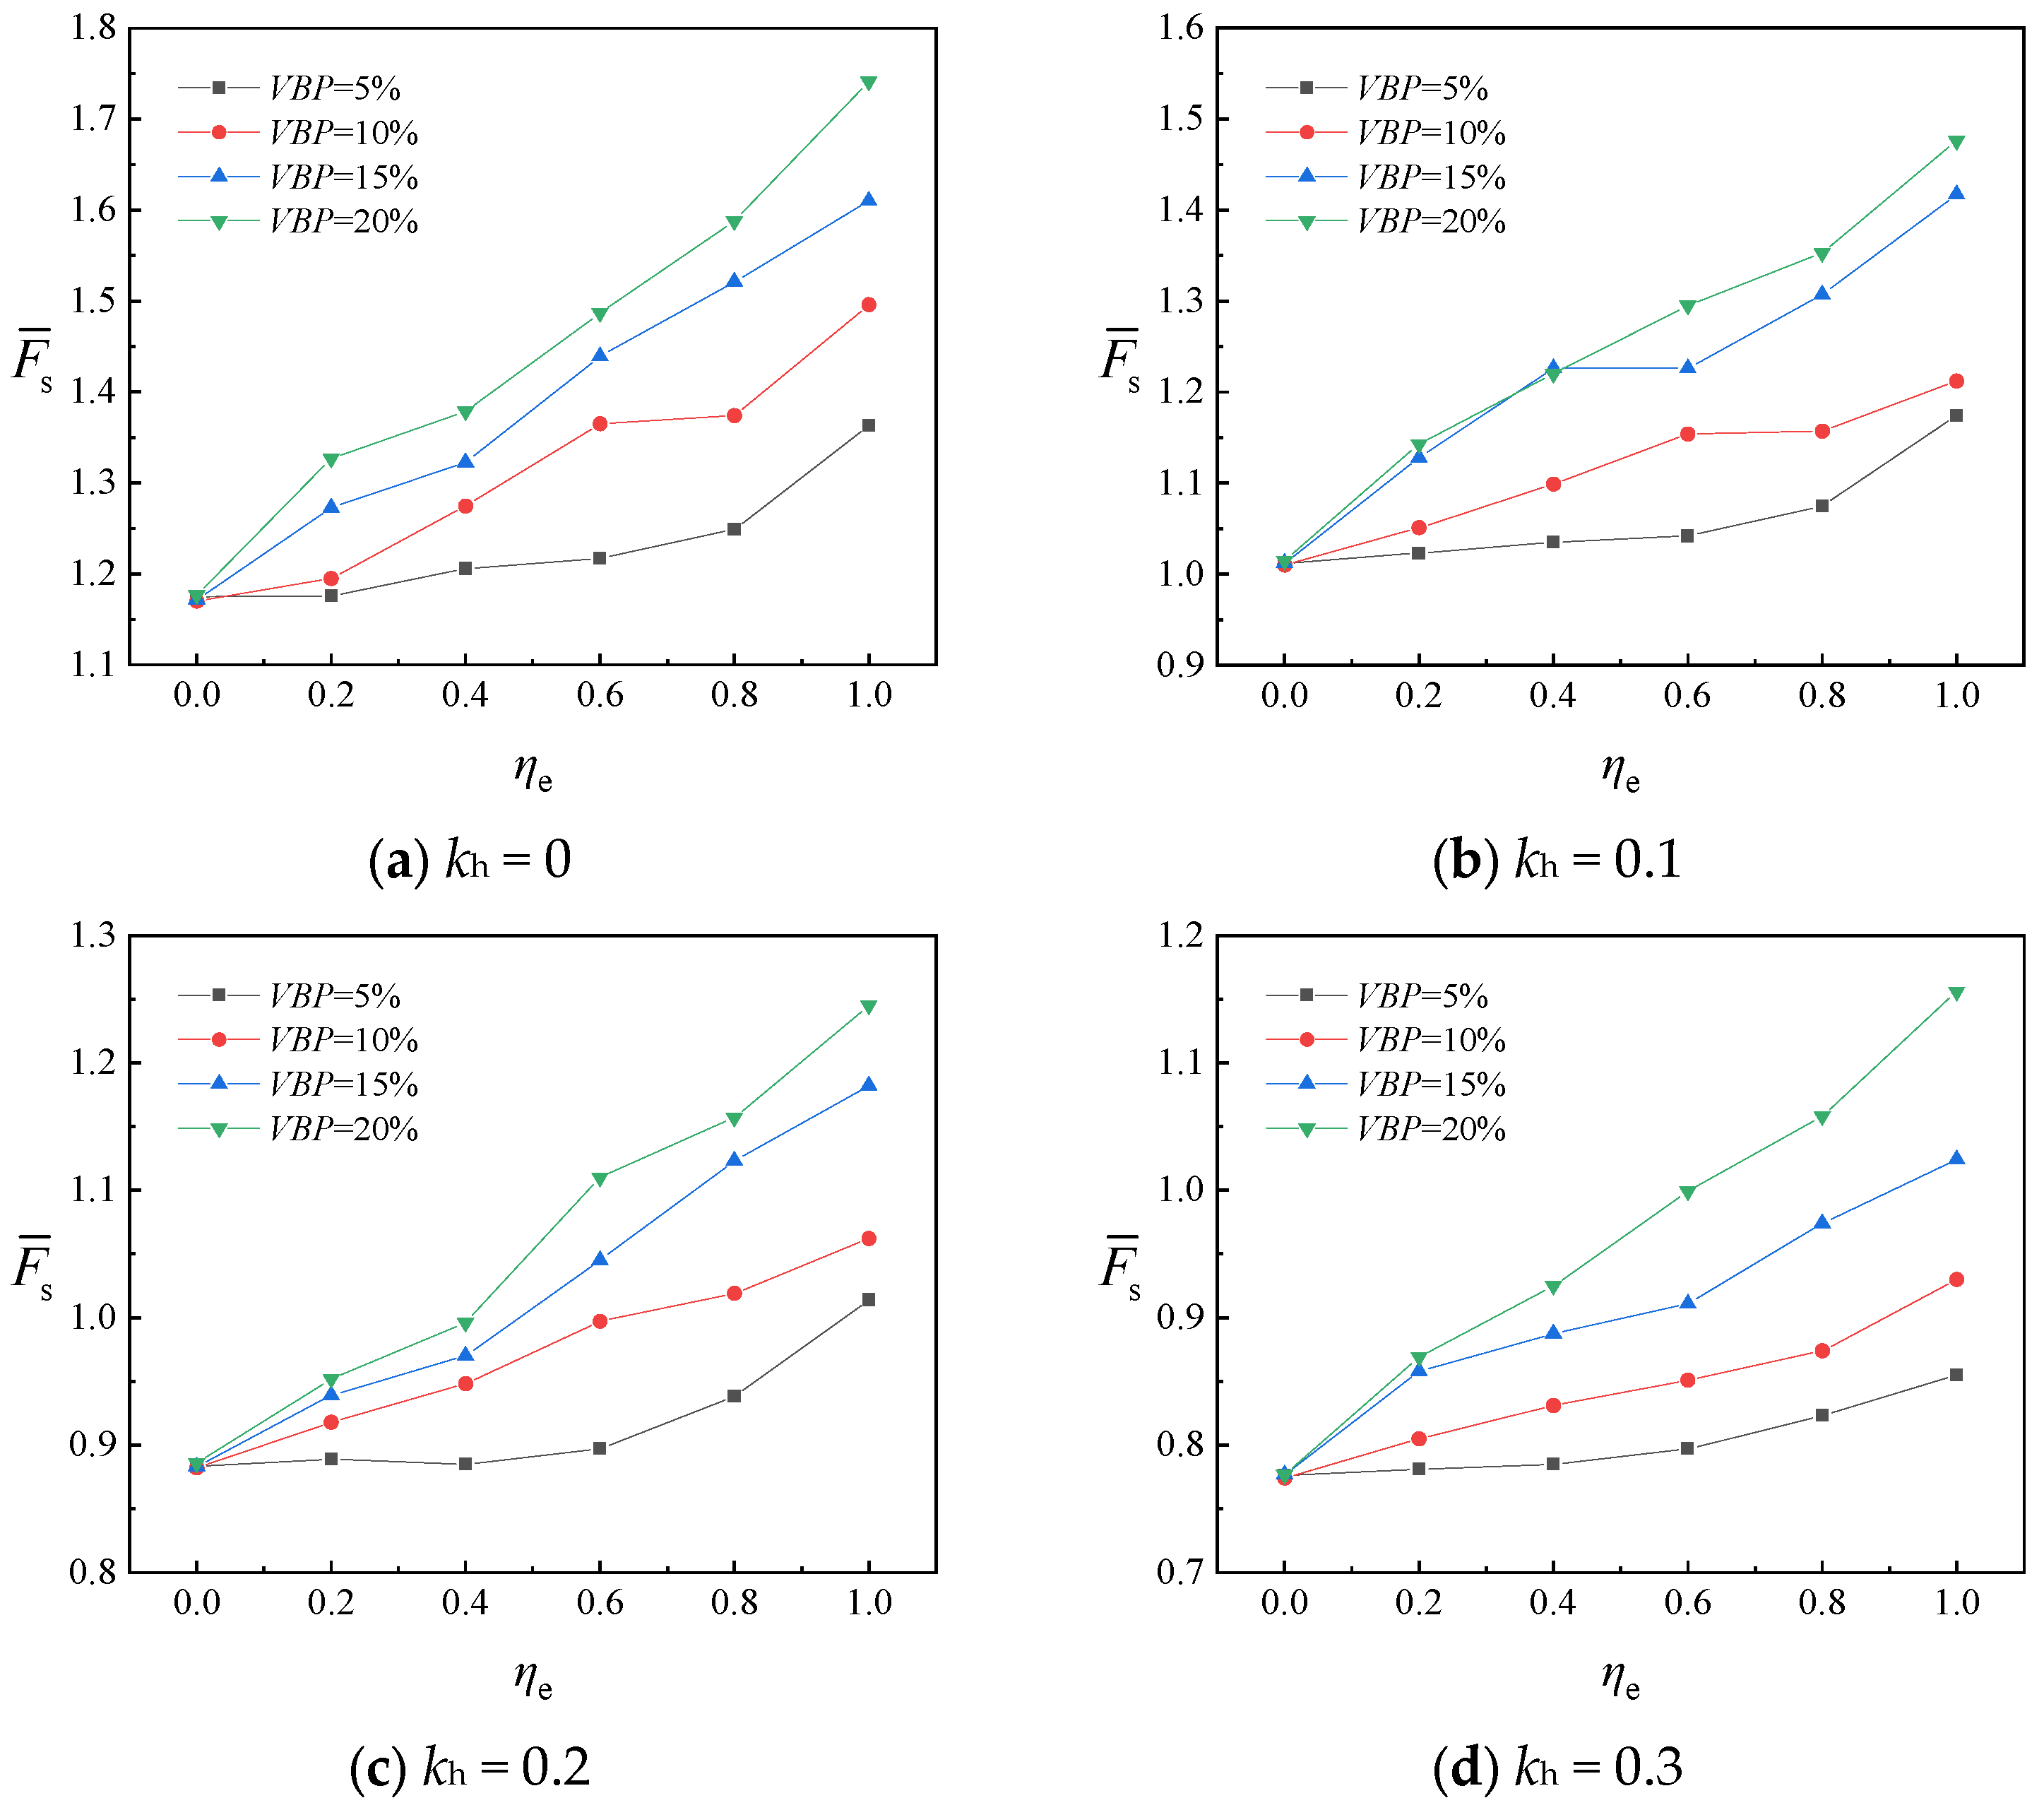
Further cases with VBP of 5%, 10%, 15%, and 20%, and horizontal seismic coefficients kh = 0, 0.1, 0.2, and 0.3, were selected. For each working condition, three models were established. The variation trends of the average safety factor F ¯ s with ηe are shown in Figure 12.
It can be seen from Figure 12 that when ηe = 0, the Fs under different overall rock-content conditions almost coincide, indicating that if the rock blocks are not distributed within the front effective region, merely increasing the overall rock content has a very limited effect on improving slope stability. As ηe increases, the Fs of soil–rock mixture slopes with different overall rock contents all increase, indicating that gradually arranging rock blocks into the effective region can significantly enhance slope stability.
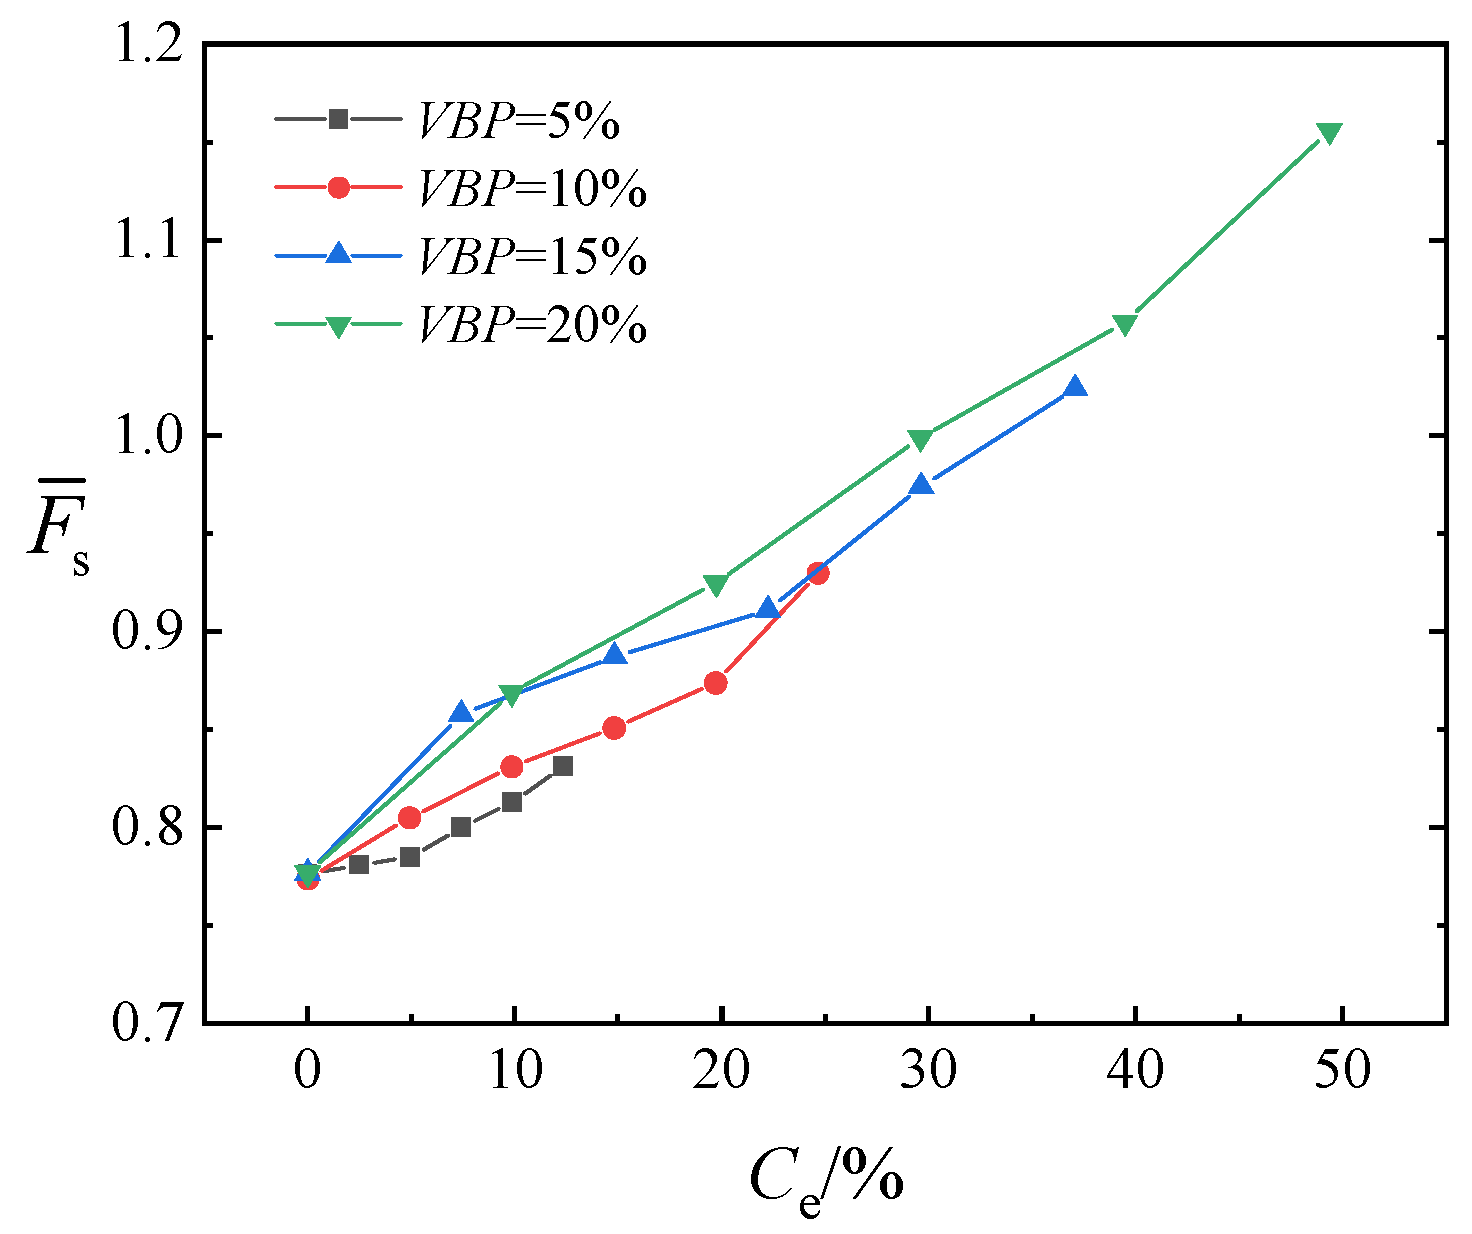
To further analyze the influence of Ce on the slope Fs under seismic loading, the results are shown in Figure 13. When Ce = 10%, the corresponding Fs under the three cases of VBP = 20%, 15%, and 5% are 0.869, 0.831, and 0.813, respectively. It can be seen that changes in Ce have a significant effect on the Fs of soil–rock mixture slopes. However, this effect is still jointly influenced by the VBP and the structural characteristics of the rock skeleton.

3.3. Analysis of Gradation Effect Based on Effective Rock Content

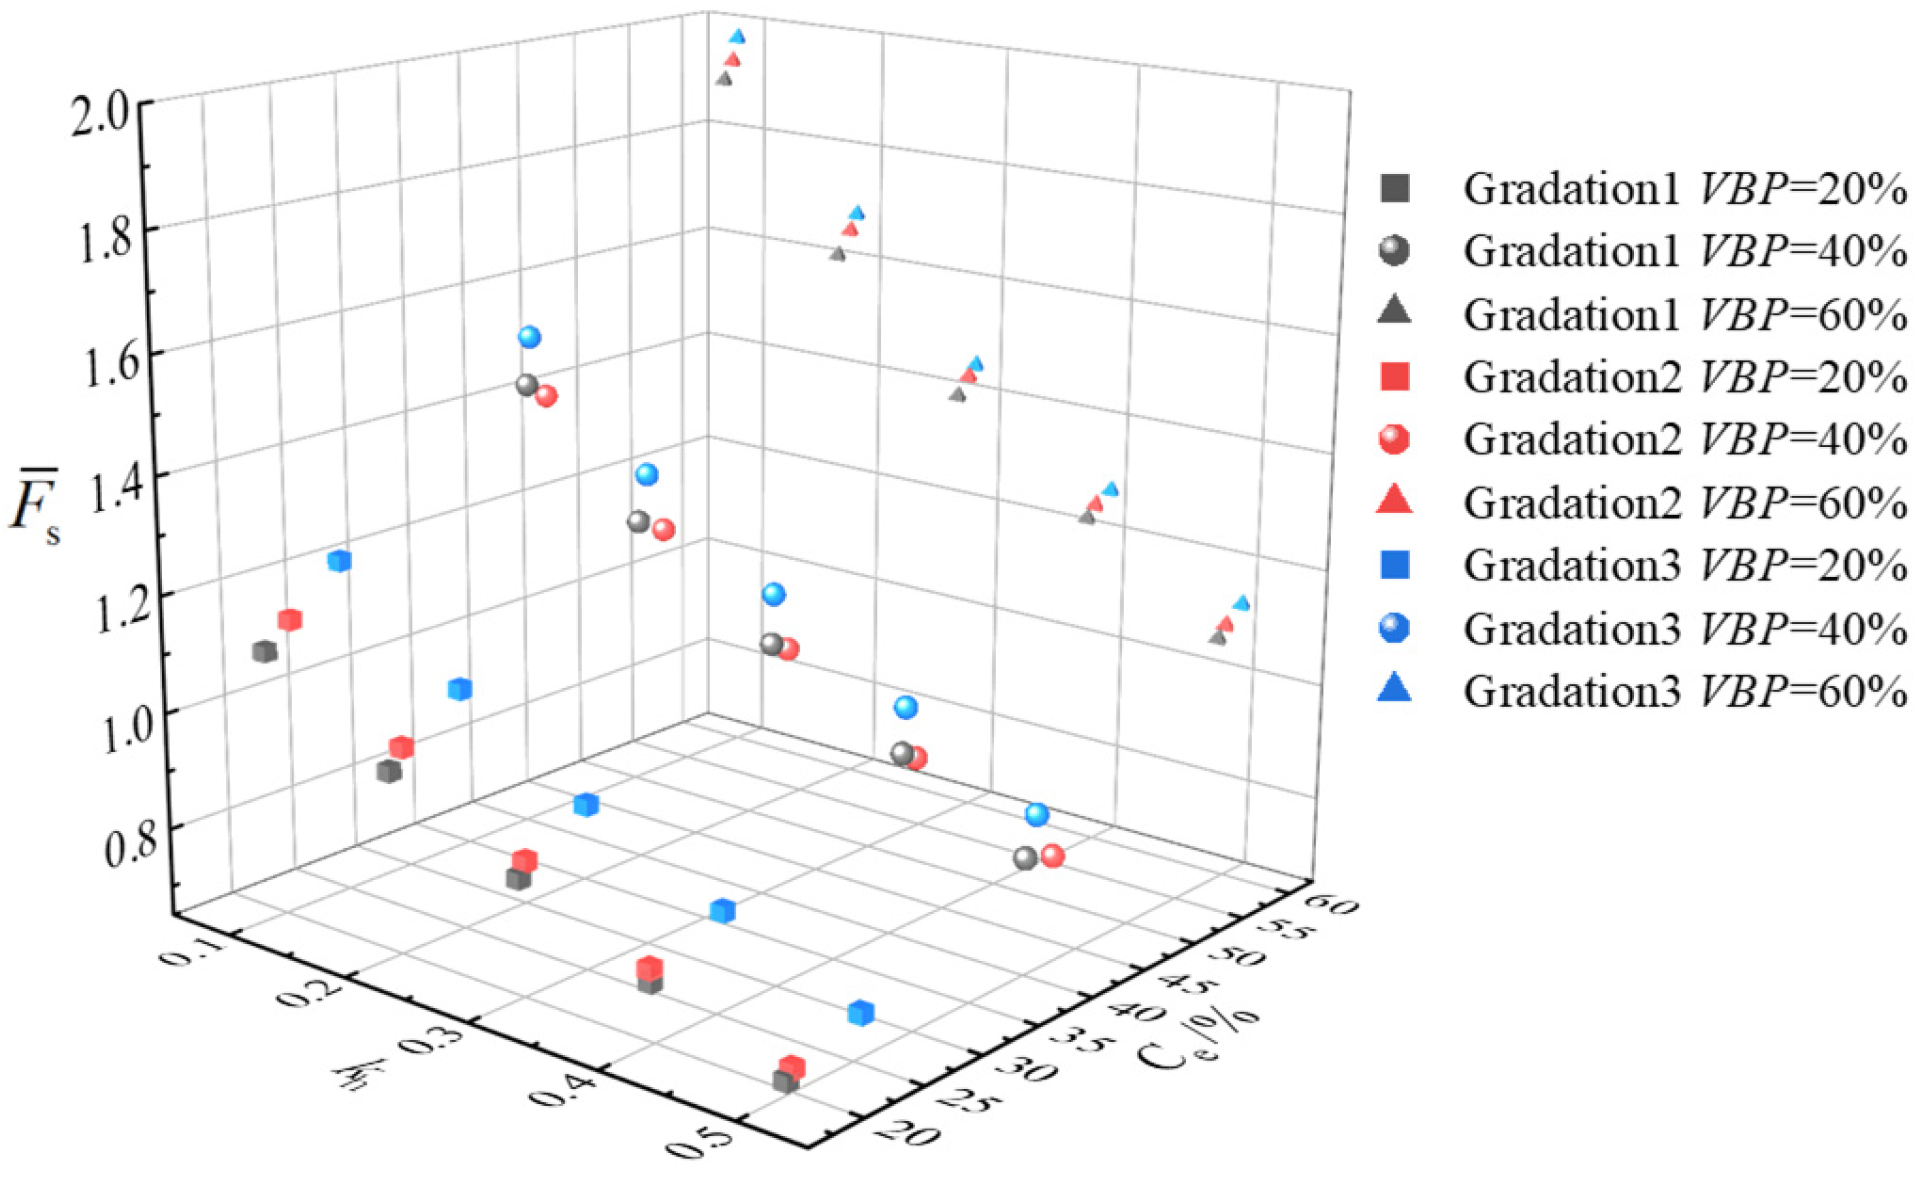
The stability of soil–rock mixture slopes is significantly influenced by gradation. The authors previously found that when the rock content is relatively low (10%, 20%, and 30%), increasing the proportion of oversized rock blocks helps improve slope stability. However, when the rock content is relatively high (40% and 50%), the influence of oversized rock blocks is not significant [14]. To investigate the effects of gradation and overall rock content on the stability of soil–rock mixture slopes under seismic loading, and to further interpret these effects based on Ce, three gradation groups were considered in this study (Figure 2). From Gradation 1 to Gradation 3, the proportion of oversized rock blocks increases successively. Soil–rock mixture slope models with rock contents of 20%, 40%, and 60% were established, and the horizontal seismic coefficient kh was taken from 0.1 to 0.5. Considering the randomness of rock-block spatial distribution, three random models were generated for each working condition. The average values of Ce for each case, identified and extracted by Python 3.9 for the specified region, together with the corresponding average Fs, are shown in Figure 14.
It can be seen from Figure 14 that the Fs of the soil–rock mixture slope is positively correlated with Ce. When the VBP is relatively low, increasing the proportion of oversized rock blocks can increase Ce, thereby improving the Fs of the soil–rock mixture slope. When the VBP is relatively high, there exists an optimal gradation, under which fine rock blocks can effectively fill the voids between oversized rock blocks, increase Ce, and thus further enhance slope stability.
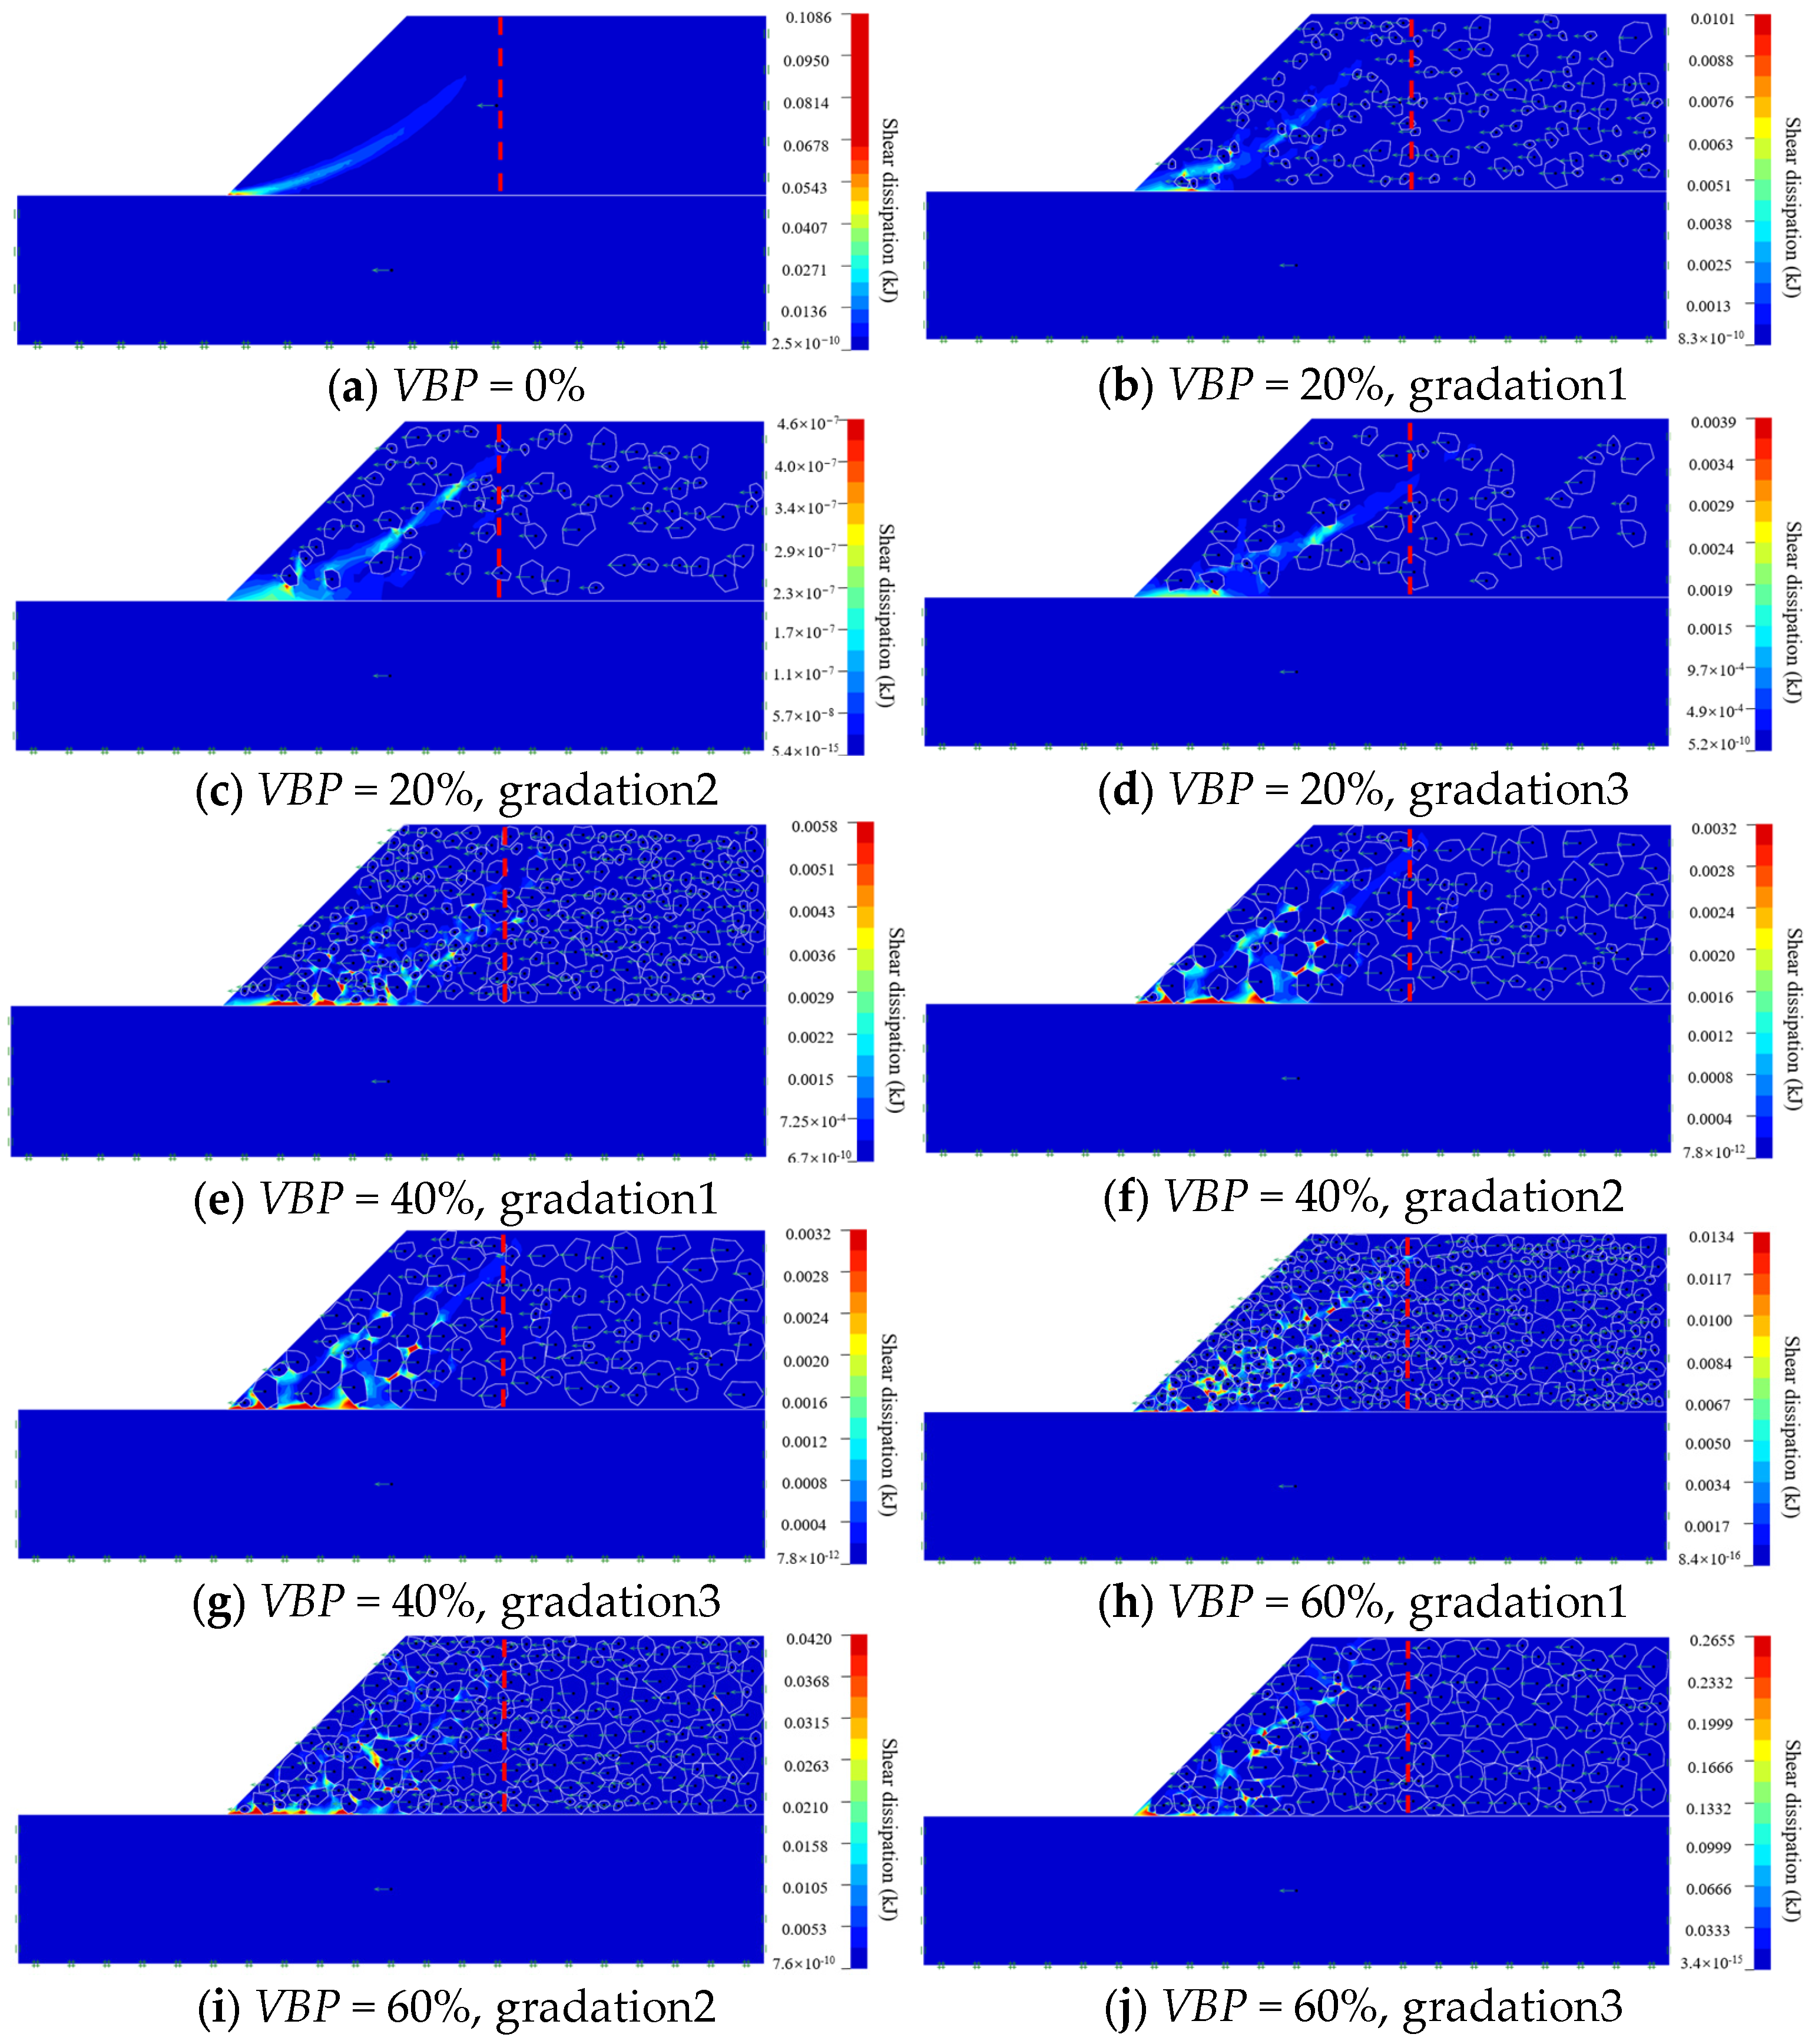
In addition to its influence on Ce, gradation can also affect slope stability through its regulation of the slope skeleton. The shear dissipation contours of soil–rock mixture slopes with kh = 0.3 and VBP values of 0%, 20%, 40%, and 60% are shown in Figure 15, where the red dashed line indicates the boundary of the effective region. As the proportion of oversized rock blocks increases, the dissipation zone gradually becomes more discrete, and its propagation path is obstructed and deflected by the large rock blocks, thereby significantly weakening the continuity of the plastic zone. The dominant propagation modes are “rock-bypassing” and “inclusion,” and the failure zone tends to concentrate near the slope surface, resulting in a further improvement in slope stability.
In summary, the influence of gradation on slope stability is manifested in the coupled effect of the soil–rock mixture skeleton formed by different rock-block distributions and the effective rock content Ce. For slope models with low VBP, appropriately increasing the proportion of oversized rock blocks can increase Ce and help construct a stable rock skeleton, thereby improving slope stability. When the VBP is high, the effect of gradation on Ce is no longer significant, and the obstruction and deflection effects of oversized rock blocks on the propagation of the plastic zone become the dominant factors controlling slope stability.

3.4. Analysis of the Positional Effect of Oversized Rock Blocks Based on Effective Rock Content

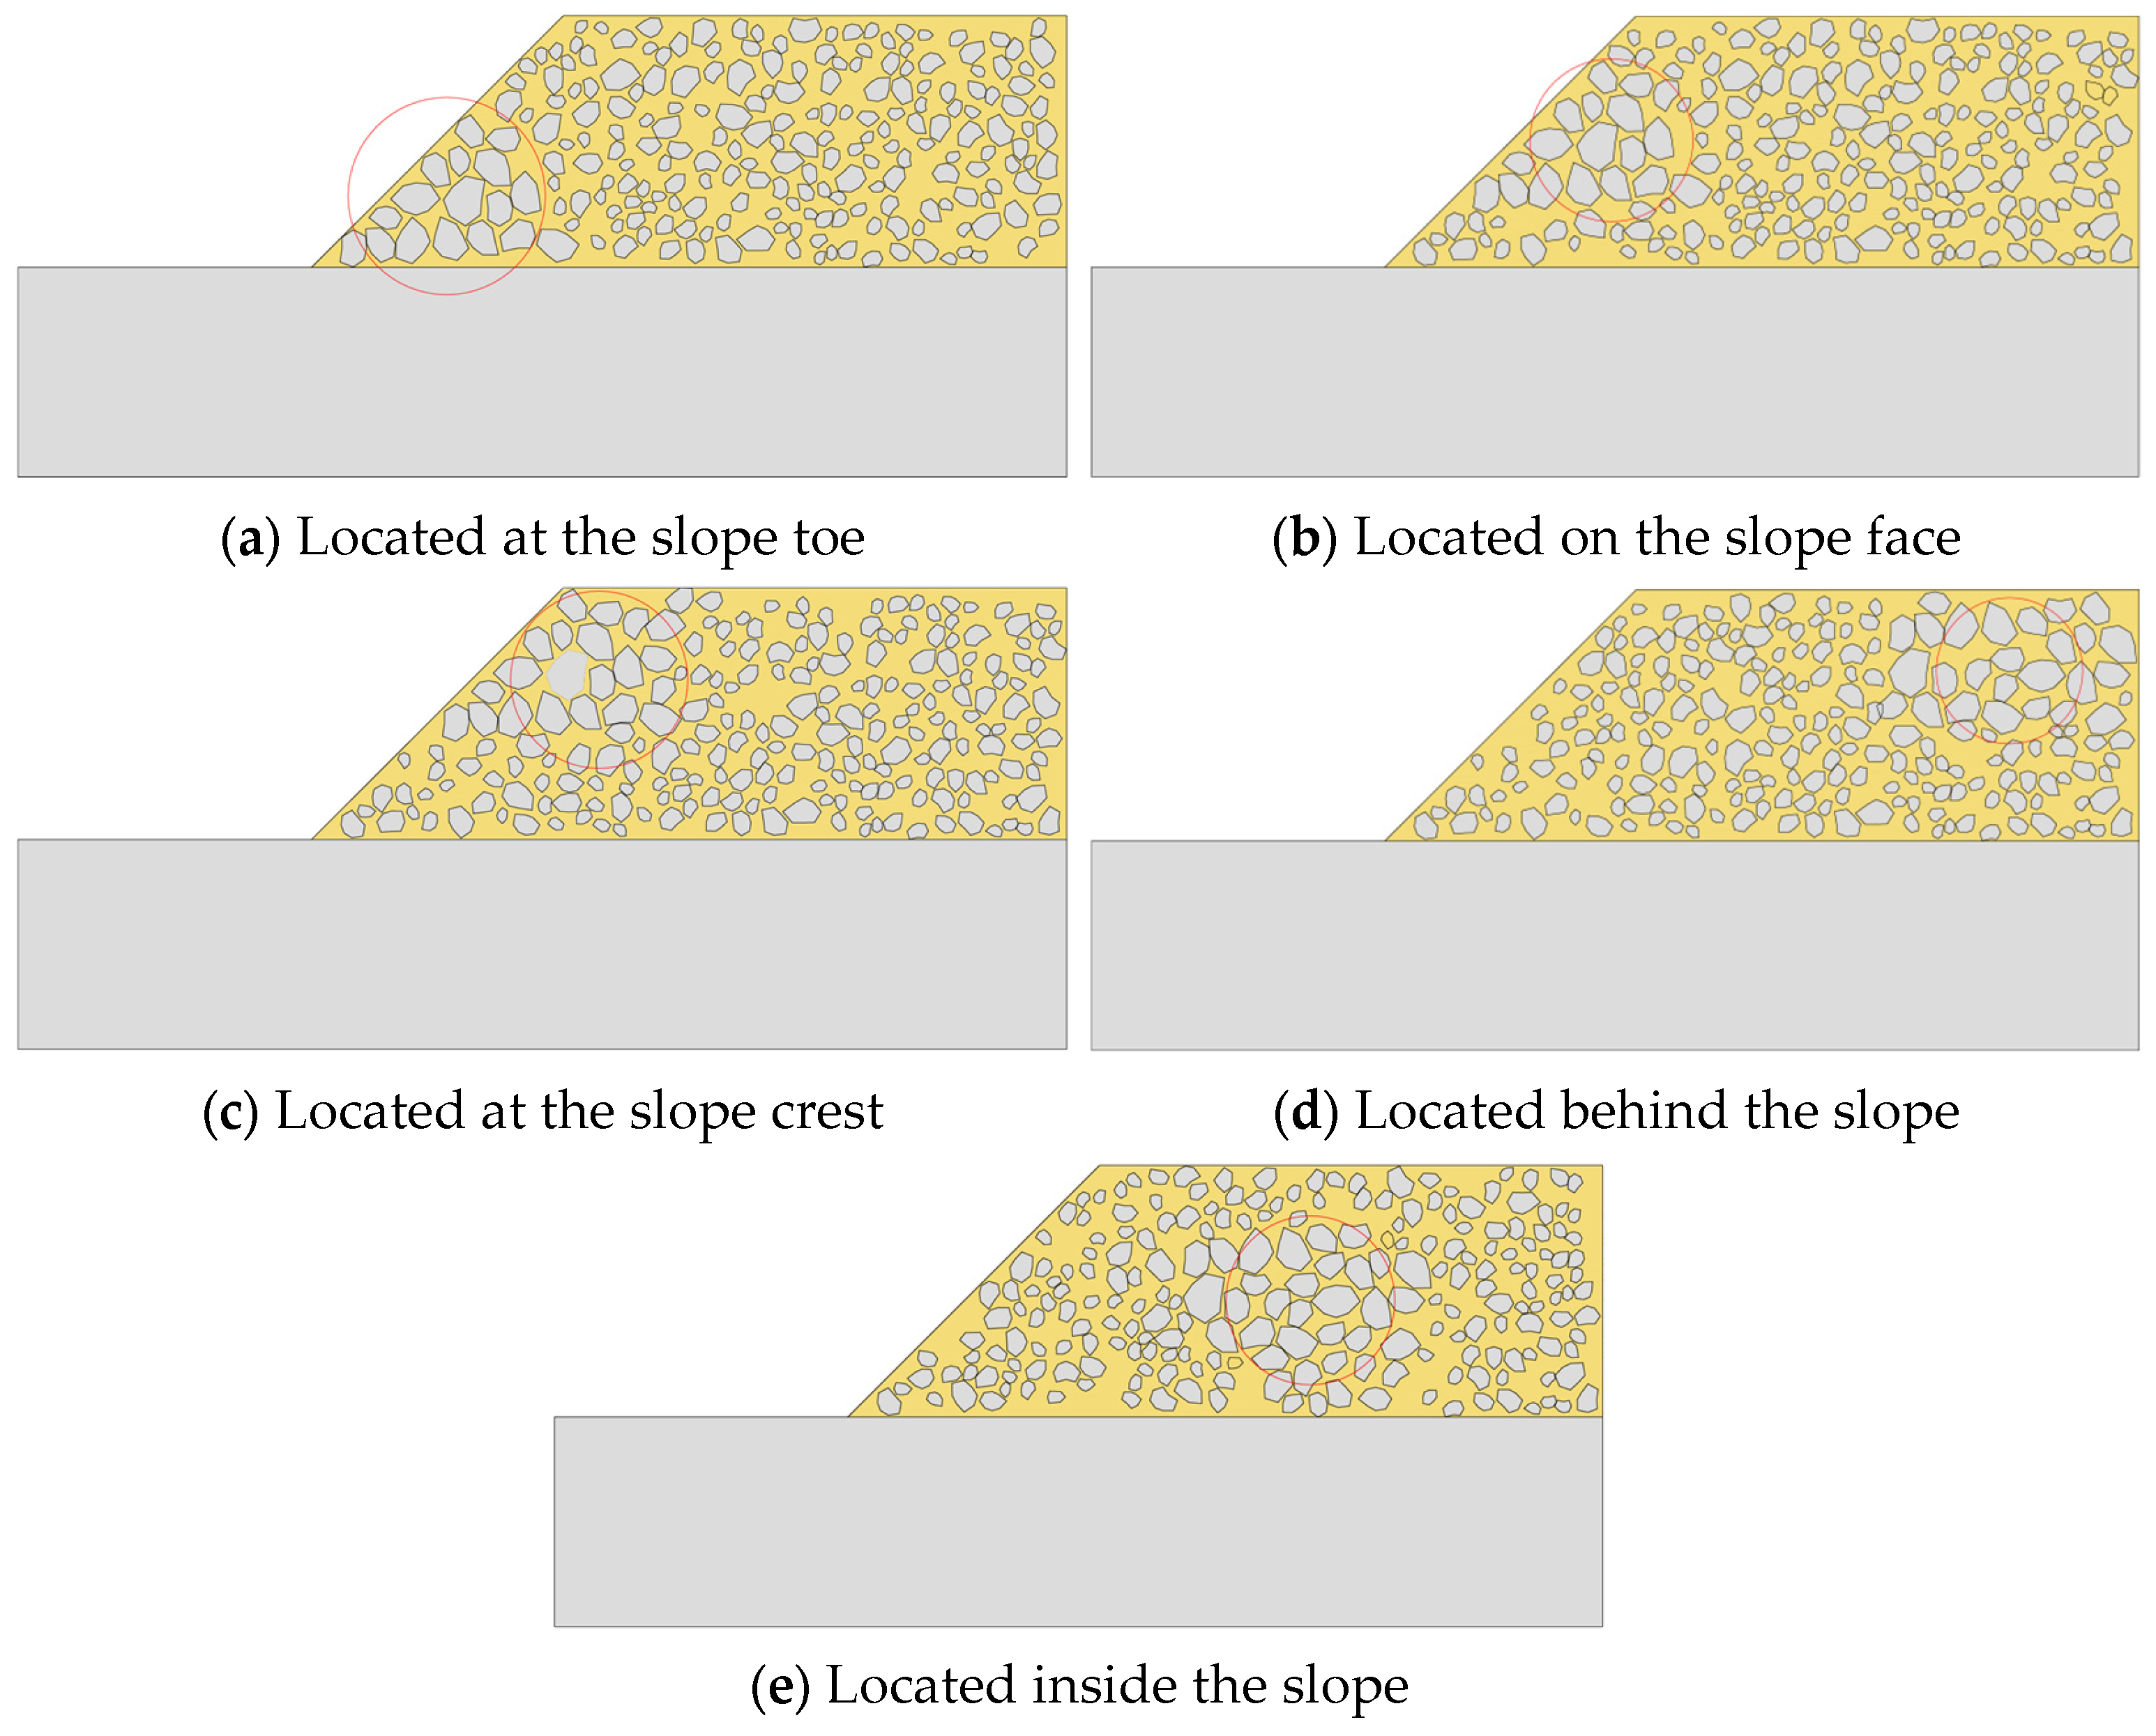
The spatial distribution of rock blocks has an important influence on the stability of soil–rock mixture slopes [31]. Therefore, based on Gradation 1 in Figure 2, and by varying only the placement positions of the rock blocks, five soil–rock mixture slope models with different spatial distributions of oversized rock blocks were established at an overall rock content of 40%, as shown in Figure 16.
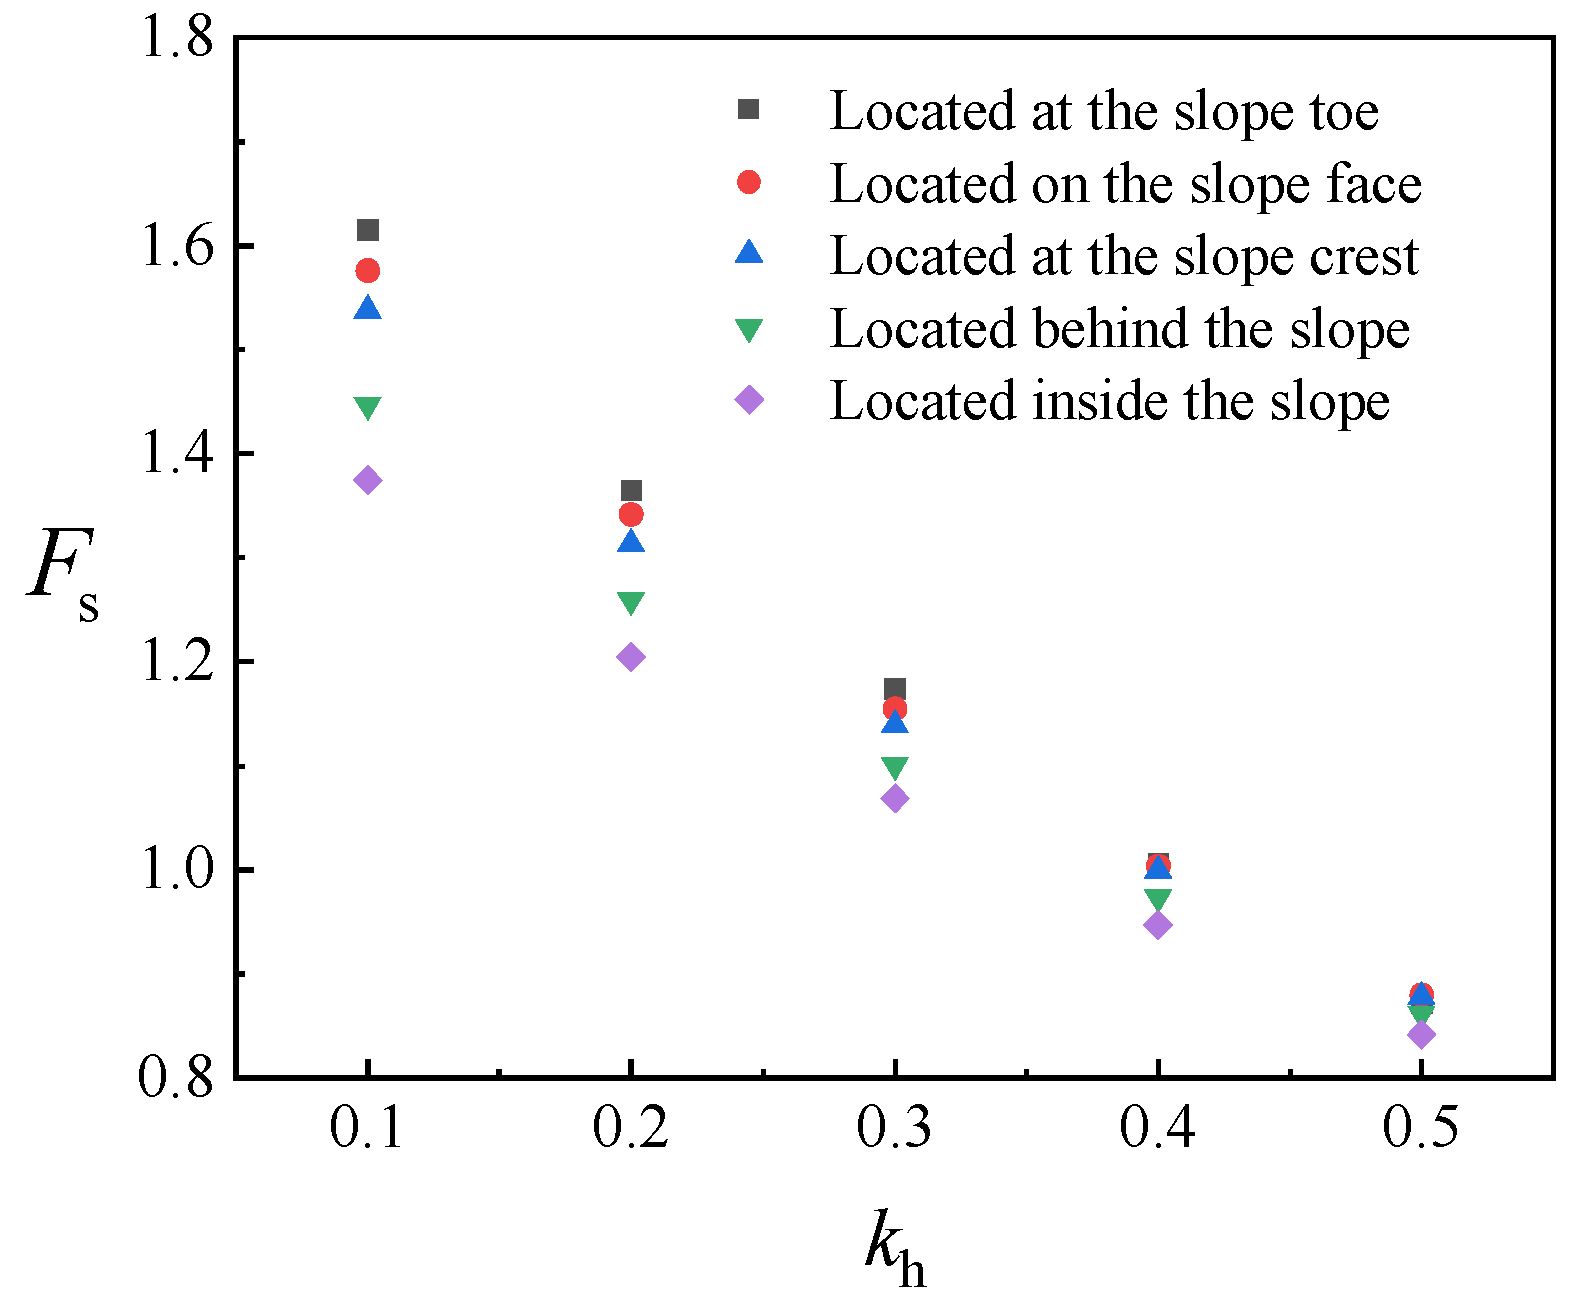
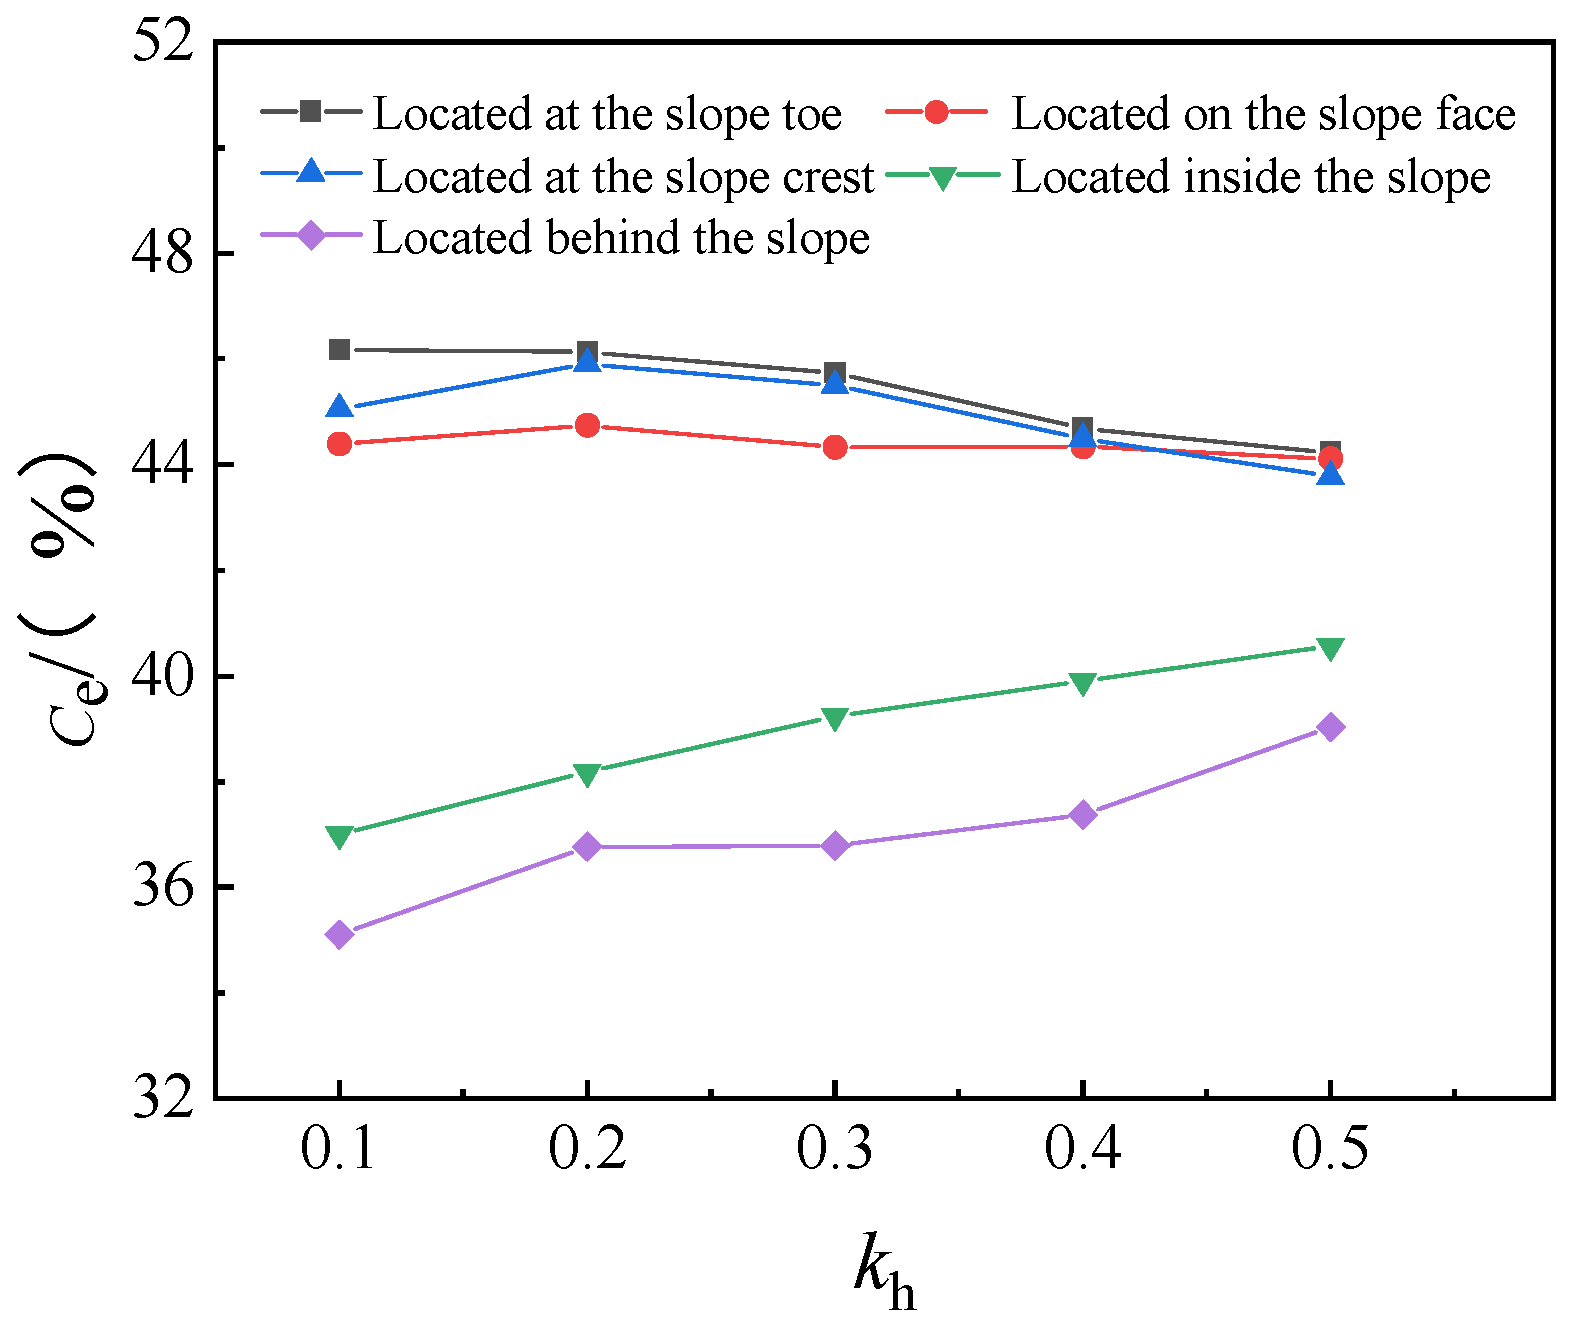
By analyzing these five models with different rock-block distributions, the corresponding Fs values were obtained, as shown in Figure 17. It can be seen that the influence of the spatial distribution of oversized rock blocks on slope stability can be ranked as follows: slope toe > slope face > slope crest > inside the slope > behind the slope. When kh is small (0.1), the effect of the spatial distribution of oversized rock blocks on stability is the most significant. As kh increases (0.2–0.3), the differences still exist but begin to diminish. When kh further increases (0.4–0.5), the differences in Fs among the different spatial distribution cases become even smaller. The Ce values under various working conditions were identified using Python, as shown in Figure 17. Taken together, the variation patterns of Fs and Ce for soil–rock mixture slopes with different distributions of oversized rock blocks show good consistency: the cases of slope toe, slope crest, and slope face, which have relatively high Ce, also exhibit relatively high Fs, whereas the cases of inside the slope and behind the slope, which have relatively low Ce, also show relatively low Fs. This indicates that the distribution of oversized rock blocks can influence slope stability by altering the degree of participation of rock blocks within the governing sliding zone. The slope toe, slope crest, and slope face are more favorable for increasing Ce and enhancing slope stability, whereas the inside-slope and rear-slope cases, being farther from the critical sliding control zone, have a relatively limited effect on stability improvement. As the seismic loading increases, the effective region continuously expands toward the interior of the slope, and the Ce values under different oversized rock-block distribution cases tend to become similar, showing a variation pattern consistent with that of Fs.
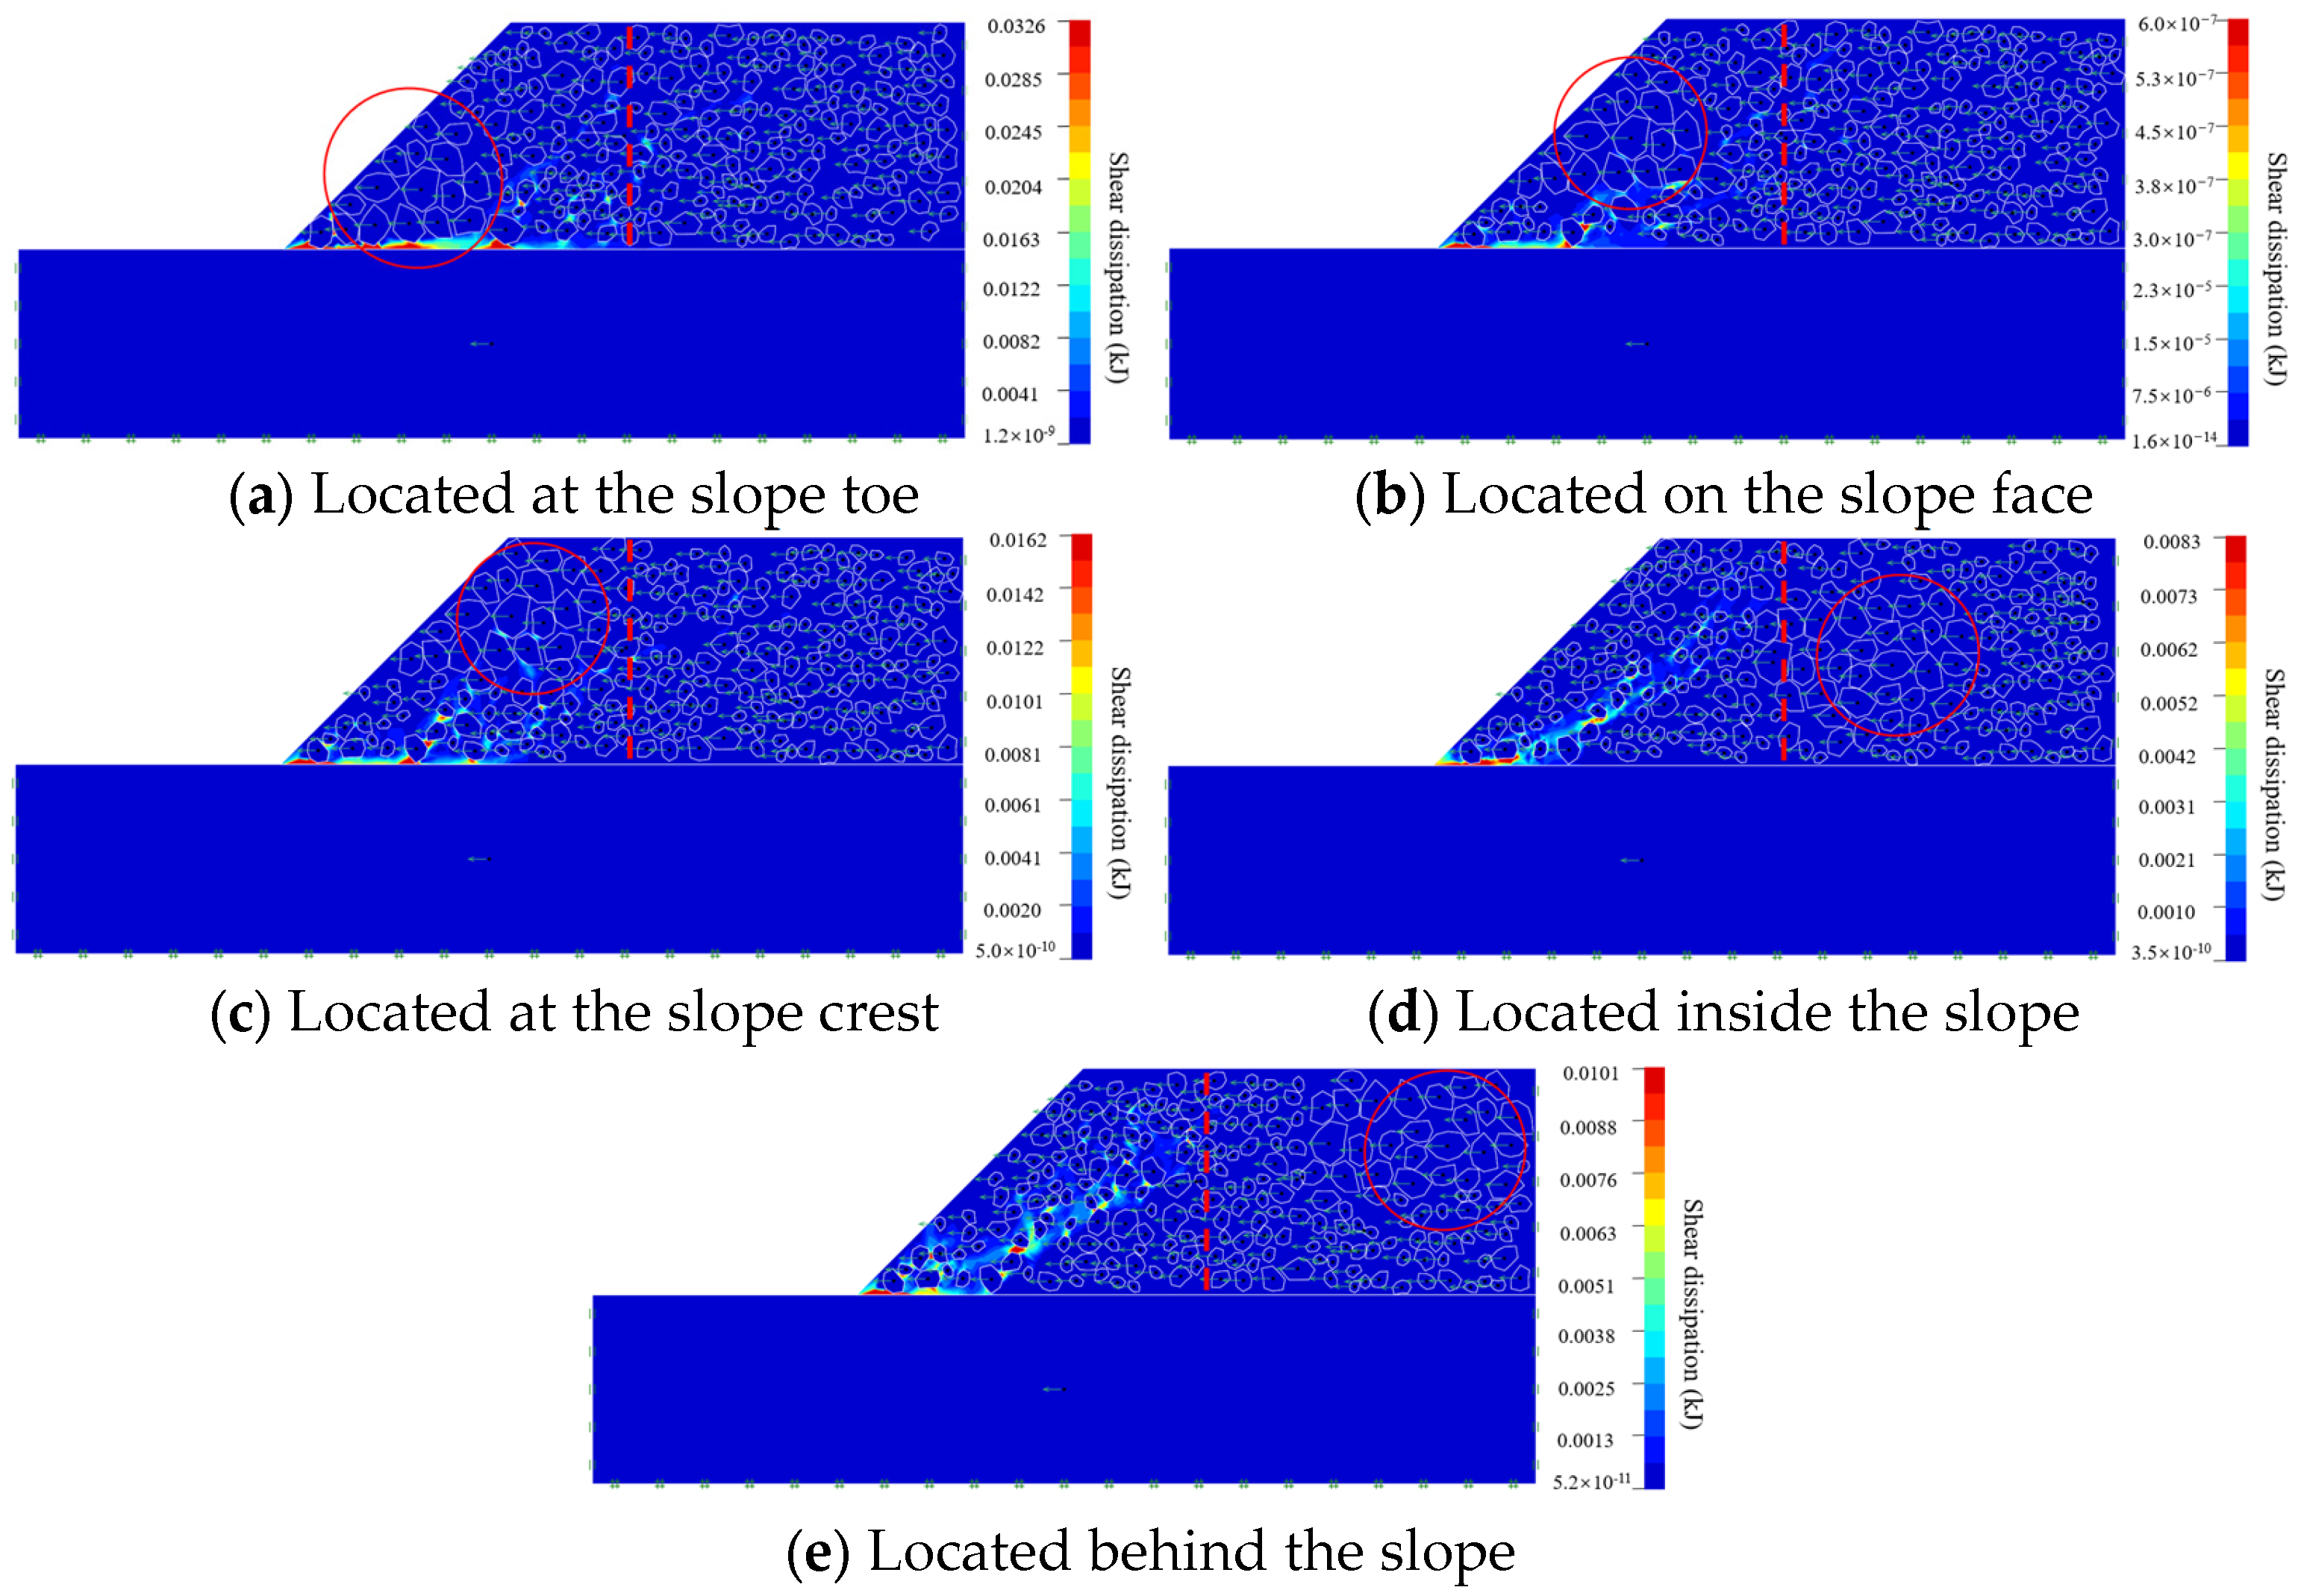
For the soil–rock mixture slope under the condition of kh = 0.3, the upper-bound shear dissipation contours are shown in Figure 18, where the dashed line denotes the boundary of the effective region. Although the effective rock content Ce is similar when the oversized rock blocks are located at the slope toe, slope face, and slope crest, the differences in block arrangement lead to markedly different restraining effects on the propagation of the plastic zone. As shown in Figure 19a, the presence of oversized rock blocks at the slope toe effectively hinders the propagation of the plastic zone, and the potential sliding surface as a whole bypasses the concentrated region of oversized rock blocks, thereby enhancing slope stability. When the oversized rock blocks are located on the slope face (Figure 19b), the restraining effect of the fine rock blocks near the slope toe on the propagation of the plastic zone decreases, resulting in lower stability compared with the case where the oversized rock blocks are located at the slope toe. In this case, the propagation mode of the plastic zone near the concentrated oversized rock blocks on the slope face changes to the “rock-bypassing” mode, causing a deviation of the potential sliding surface. When the oversized rock blocks are located at the slope crest (Figure 19c), the presence of the oversized rock blocks at the crest hinders the further propagation of the plastic zone; however, because the shear band has already partially penetrated, the influence is relatively limited. When the oversized rock blocks are located inside the slope and behind the slope (Figure 19d,e), the Ce of the slope is smaller than that in the previous three cases, and the fine rock blocks have only a limited restraining effect on the propagation of the plastic zone. The “rock-bypassing” mode becomes dominant, the dissipated energy is relatively small, and therefore the slope is the least stable under these two spatial distribution conditions.

4. Discussion

4.1. Limitations of the Pseudo-Static Method

The seismic action in this study is simulated using the pseudo-static method, in which earthquake loading is represented by an equivalent constant horizontal inertial force. This approach is widely used in slope stability analysis because it provides a simple and efficient way to evaluate the overall stability trend under different horizontal seismic coefficients. It is also suitable for comparing the relative influence of rock-block distribution, gradation, and effective rock content under controlled loading conditions.
Nevertheless, the pseudo-static method is a simplified seismic analysis approach. Real earthquake loading is characterized by time-varying acceleration, frequency content, duration effects, and possible cyclic degradation of geomaterials. These dynamic characteristics cannot be explicitly captured by a constant seismic coefficient. In addition, dynamic soil–structure interaction, wave propagation and amplification effects are not considered in the present framework. Therefore, the results of this study should be interpreted within the scope of pseudo-static seismic stability analysis, rather than as a substitute for full dynamic time-history analysis.

4.2. Limitations of the Two-Dimensional Analysis

The present study is conducted within a two-dimensional plane-strain framework, in which rock blocks are represented by planar contours and the effective rock content is calculated based on the area fraction of rock blocks within the effective region. This simplification helps clarify the relationship among rock-block distribution, effective rock content, and the governing sliding mechanism.
However, real soil–rock mixture slopes are inherently three-dimensional. The stabilizing effect of rock blocks depends not only on their projected positions in a two-dimensional section, but also on their volume, out-of-plane continuity, spatial connectivity, and contact relationships. The failure mechanism may develop as a three-dimensional curved failure surface rather than a two-dimensional slip band, and the corresponding safety factor may also be affected by lateral confinement, block-bridging, and three-dimensional rock-skeleton effects.
In future work, the proposed framework can be extended by defining a three-dimensional effective region based on the critical failure surface of a homogeneous three-dimensional reference slope. Accordingly, the effective rock content should be evaluated as a volumetric fraction of rock blocks within this control volume. Such an extension would allow the influence of out-of-plane block continuity, spatial connectivity, and three-dimensional skeleton formation to be considered, but it would require three-dimensional stochastic block generation, volumetric characterization, three-dimensional stability analysis, and more random realizations.

5. Conclusions

In summary, the improvement in slope stability results from the combined effect of Ce and the obstruction and deflection of the plastic zone by oversized rock blocks at key locations. Specifically, Ce determines the quantitative basis for rock-block participation in sliding resistance, whereas the spatial distribution of oversized rock blocks determines whether this quantitative advantage can be translated into greater sliding resistance at the most favorable locations.
In this study, a series of computational models of soil–rock mixture slopes were established, and the concept of effective rock content, Ce, was proposed. On this basis, the effects of seismic loading on the stability and slip-band evolution of soil–rock mixture slopes were investigated, providing a new perspective for interpreting both the gradation effect and the positional effect of oversized rock blocks. The main conclusions are as follows:
(1)
Under seismic loading, the slip bands in soil–rock mixture slopes exhibit pronounced discontinuous and irregular characteristics, showing complex propagation patterns such as rock bypassing, diversion, and local penetration. As the horizontal seismic coefficient increases, the Fs of the slope continuously decreases, and the differences in stability among slopes with different rock contents gradually diminish.
(2)
Compared with the overall rock content, the effective rock content proposed in this study can better characterize the actual contribution of rock blocks to slope stability. When more rock blocks are distributed within the governing sliding zone, the Fs of the slope increases significantly; conversely, even if the overall rock content is relatively high, the improvement in stability remains limited when the rock blocks are not effectively involved in the governing sliding mechanism. This indicates that the seismic stability of the slope is primarily controlled by the effective rock content.
(3)
The influence of gradation on slope stability is essentially the result of the combined effect of effective rock content and the rock-skeleton effect. Under conditions of relatively low effective rock content, increasing the proportion of oversized rock blocks is beneficial for improving the effective rock content and enhancing the skeleton-supporting effect. Under conditions of relatively high effective rock content, the stability gain brought by gradation adjustment becomes relatively limited.
(4)
The spatial distribution of oversized rock blocks has a significant effect on slope stability, and its favorable influence generally follows the order: slope toe > slope face > slope crest > inside the slope > behind the slope. The improvement in slope stability results from the combined effect of the total effective rock content and the obstruction and deflection of plastic-zone propagation by rock blocks located at key positions.
It should be noted that the potential sliding surface and stability of soil–rock mixture slopes are strongly affected by the random positions and sizes of rock blocks. Therefore, more random models and reliability-based analyses should be conducted in future work. In addition, the present study adopts a pseudo-static two-dimensional framework, which cannot fully capture the time-varying characteristics of real earthquake motions or the three-dimensional spatial effects of rock-block distributions. Future studies should further incorporate real seismic records, dynamic time-history analysis, three-dimensional modeling, and field validation to improve the engineering applicability of the proposed effective rock content index.

Author Contributions

Conceptualization, J.L. and X.C.; methodology, J.L. and X.C.; software, J.L.; validation, J.L. and H.G.; formal analysis, J.L.; investigation, J.L.; resources, X.C.; data curation, J.L. and H.G.; visualization, J.L. and H.G.; writing—original draft preparation, J.L. and H.G.; writing—review and editing, J.L., H.G. and X.C.; supervision, X.C.; project administration, X.C.; funding acquisition, X.C. and H.G. All authors have read and agreed to the published version of the manuscript.

Funding

This study was financially supported by the National Natural Science Foundation of China (Nos. 52309138; 52578433), Department of Science and Technology of Sichuan Province (2025ZNSFSC0409). All financial support is greatly appreciated.

Data Availability Statement

The data presented in this study are available upon request from the corresponding author.

Acknowledgments

We extend our thanks to all colleagues who supported us during the research process. Without their assistance, this work would not have been possible.

Conflicts of Interest

The authors declare no conflicts of interest.

Abbreviations

The following abbreviations are used in this manuscript:
DDA–SPHDiscontinuous deformation analysis–smoothed particle hydrodynamics
FLAC3DFast Lagrangian Analysis of Continua in Three Dimensions
MIDAS/GTSMIDAS Geo-Technical analysis System
FsSafety factor
VBPOverall rock content
khSeismic coefficient
CeEffective rock content
ηeEffective rock-block contribution ratio
ΩeEffective region
Ab(Ω)Total area of rock blocks in the whole slope
Ab(Ωe)Area of rock blocks within the effective region

References

  1. Vallejo, L.E.; Mawby, R. Porosity Influence on the Shear Strength of Granular Material–Clay Mixtures. Eng. Geol. 2000, 58, 125–136. [Google Scholar] [CrossRef] [Scilit]
  2. Kalender, A.; Sonmez, H.; Medley, E.; Tunusluoglu, C.; Kasapoglu, K.E. An Approach to Predicting the Overall Strengths of Unwelded Bimrocks and Bimsoils. Eng. Geol. 2014, 183, 65–79. [Google Scholar] [CrossRef] [Scilit]
  3. Iannacchione, A.T.; Vallejo, L.E. Shear Strength Evaluation of Clay-Rock Mixtures. In Slope Stability 2000: Proceedings; American Society of Civil Engineers: Reston, VA, USA, 2012; pp. 209–223. ISBN 978-0-7844-0512-3. [Google Scholar] [CrossRef] [Scilit]
  4. Caselle, C.; Comina, C.; Festa, A.; Bonetto, S. Electrical Resistivity Tomography for the Evaluation of Areal Block Proportion (ABP) in Bimunits: Modelling and Preliminary Field Validation. Eng. Geol. 2024, 333, 107488. [Google Scholar] [CrossRef] [Scilit]
  5. Montoya-Araque, E.A.; Suarez-Burgoa, L.O.; Medley, E.W. Application of the Tortuous Surface Method to Stochastic Analysis of Bimslope Stability. Bull. Eng. Geol. Environ. 2020, 79, 5329–5340. [Google Scholar] [CrossRef] [Scilit]
  6. Sharafisafa, M.; Aliabadian, Z.; Shen, L. Crack Initiation and Failure of Block-in-Matrix Rocks under Brazilian Test Using Digital Image Correlation. Theor. Appl. Fract. Mech. 2020, 109, 102743. [Google Scholar] [CrossRef] [Scilit]
  7. Gayathridevi, K.; Ray, A. A Detail Review of the Geomechanical and Geohydrological Behaviors of Block-in-Matrix Geological Formations at Laboratory and Virtual Scales. Prog. Eng. Sci. 2025, 2, 100127. [Google Scholar] [CrossRef] [Scilit]
  8. Gayathridevi, K.; Ray, A. Influence of Block Shape and Size Distribution on Bimslope Stability: A Numerical Investigation of Static and Seismic Behavior. Int. J. Geo-Eng. 2025, 16, 19. [Google Scholar] [CrossRef] [Scilit]
  9. Lindquist, E.S.; Goodman, R.E. Strength and deformation properties of a physical model melange. In Proceedings of the 1st North American Rock Mechanics Symposium, Austin, TX, USA, 1–3 June 1994; pp. 843–850. [Google Scholar]
  10. Sönmez, H.; Altinsoy, H.; Gökçeoğlu, C.; Medley, E.W. Considerations in developing an empirical strength criterion for bimrocks. In Proceedings of the 4th Asian Rock Mechanics Symposium, Singapore, 6–10 November 2006. [Google Scholar]
  11. Khorasani, E.; Amini, M.; Hossaini, M.F.; Medley, E.W. Statistical analysis of bimslope stability using physical and numerical models. Eng. Geol. 2019, 254, 13–24. [Google Scholar] [CrossRef] [Scilit]
  12. Yang, Y.; Chen, T.; Wu, W.; Zheng, H. Modelling the Stability of a Soil-Rock-Mixture Slope Based on the Digital Image Technology and Strength Reduction Numerical Manifold Method. Eng. Anal. Bound. Elem. 2021, 126, 45–54. [Google Scholar] [CrossRef] [Scilit]
  13. Sharafisafa, M.; Aliabadian, Z.; Sato, A.; Sainoki, A.; Bahaaddini, M.; Kargar, A.; Reza Nejati, H.; Shen, L. Finite-Discrete Element Modelling of Fracture Development in Bimrocks. Eng. Fract. Mech. 2024, 308, 110346. [Google Scholar] [CrossRef] [Scilit]
  14. Zhao, L.; Huang, D.; Zhang, S.; Cheng, X.; Luo, Y.; Deng, M. A New Method for Constructing Finite Difference Model of Soil-Rock Mixture Slope and Its Stability Analysis. Int. J. Rock Mech. Min. Sci. 2021, 138, 104605. [Google Scholar] [CrossRef] [Scilit]
  15. Peng, X.; Liu, J.; Cheng, X.; Yu, P.; Zhang, Y.; Chen, G. Dynamic Modelling of Soil-Rock-Mixture Slopes Using the Coupled DDA-SPH Method. Eng. Geol. 2022, 307, 106772. [Google Scholar] [CrossRef] [Scilit]
  16. Napoli, M.L.; Barbero, M.; Ravera, E.; Scavia, C. A Stochastic Approach to Slope Stability Analysis in Bimrocks. Int. J. Rock Mech. Min. Sci. 2018, 101, 41–49. [Google Scholar] [CrossRef] [Scilit]
  17. Napoli, M.L.; Barbero, M.; Scavia, C. Effects of Block Shape and Inclination on the Stability of Melange Bimrocks. Bull. Eng. Geol. Environ. 2021, 80, 7457–7466. [Google Scholar] [CrossRef] [Scilit]
  18. Huang, X.; Liu, S.; Sui, X.; Hu, Y. Earthquake Response Analysis of Soil-Rock Slope Based on Distribution of Rocks. MATEC Web Conf. 2018, 175, 04010. [Google Scholar] [CrossRef] [Scilit]
  19. Xu, W.; Tan, R.; Yang, C. Research on seismic response of soil-rock mixture slope based on added mass. Chin. J. Rock Mech. Eng. 2009, 28, 3168–3175. (In Chinese) [Google Scholar] [CrossRef]
  20. Zhao, L.; Xie, Z.; Li, L.; Huang, D.; Zhang, Z.; Zhou, J. Investigation of Effect of Rock Content on Dynamic Response and Failure Characteristics of Soil–Rock Mixture Slope Using Large-Scale Shaking Table Test. Eng. Fail. Anal. 2024, 158, 108022. [Google Scholar] [CrossRef] [Scilit]
  21. Zhu, C.; Cheng, H.; Bao, Y.; Chen, Z.; Huang, Y. Shaking table Tests on the Seismic Response of Slopes to Near-Fault Ground Motion. Geomech. Eng. 2022, 29, 133–143. [Google Scholar] [CrossRef]
  22. Cao, V.-H.; Go, G.-H. Stability Analysis of Random Soil–Rock Mixture Slope Using an Energy-Based Failure Criterion and Monte Carlo Simulation. Eng. Fail. Anal. 2025, 171, 109346. [Google Scholar] [CrossRef] [Scilit]
  23. Millán, M.A.; Galindo, R.A.; Molina-Gómez, F. Probabilistic Rock Slope Stability Assessment of Heterogeneous Pyroclastic Slopes Considering Collapse Using Monte Carlo Methodology. CMES—Comput. Model. Eng. Sci. 2025, 144, 2923–2941. [Google Scholar] [CrossRef] [Scilit]
  24. Nguyen, T.; Keawsawasvong, S.; Phan, T.N.; Tanapalungkorn, W.; Likitlersuang, S. Probabilistic Analysis of Rock Slope Stability Considering the Spatial Variability of Rock Strength Parameters. Int. J. Geomech. 2025, 25, 04025002. [Google Scholar] [CrossRef] [Scilit]
  25. Chen, W.; Scawthorn, C.R. Limit Analysis and Limit Equilibrium Solutions in Soil Mechanics. Soils Found. 1970, 10, 13–49. [Google Scholar] [CrossRef] [Scilit] [PubMed]
  26. Sloan, S.W.; Kleeman, P.W. Upper Bound Limit Analysis Using Discontinuous Velocity Fields. Comput. Methods Appl. Mech. Eng. 1995, 127, 293–314. [Google Scholar] [CrossRef] [Scilit]
  27. Lyamin, A.V.; Sloan, S.W. Upper Bound Limit Analysis Using Linear Finite Elements and Non-Linear Programming. Int. J. Numer. Anal. Methods Geomech. 2002, 26, 181–216. [Google Scholar] [CrossRef] [Scilit]
  28. Salencon, J.; Chatzigogos, C.T.; Pecker, A. Seismic Bearing Capacity of Circular Footings: A Yield Design Approach. J. Mech. Mater. Struct. 2009, 4, 427–440. [Google Scholar] [CrossRef] [Scilit]
  29. Liu, S.; Cheng, Z.; Qu, X. A Novel Method Incorporating Digital Image Processing and A-Star Algorithm for Soil-Rock Mixture (SRM) Slope Stability. Environ. Earth Sci. 2023, 82, 163. [Google Scholar] [CrossRef] [Scilit]
  30. Liu, S.; Wang, L.; Xu, W.; Cheng, Z.; Xiang, Z.; Xie, W. Numerical Investigation of the Influence of Rock Characteristics on the Soil-Rock Mixture (SRM) Slopes Stability. KSCE J. Civ. Eng. 2020, 24, 3247–3256. [Google Scholar] [CrossRef] [Scilit]
  31. Gao, W.; Yang, H.; Teng, J.; Sun, Y. Numerical study of the influence of the spatial distribution of oversized rock blocks on the stability of soil–rock mixture slopes. Adv. Civ. Eng. 2023, 2023, 3751915. [Google Scholar] [CrossRef] [Scilit]
Figure 1. Geometrical model of soil–rock mixture slope.
Geosciences 16 00256 g001
Figure 2. Gradation curves of soil–rock mixture slopes [14].
Geosciences 16 00256 g002
Figure 3. Flowchart of research methods in this study.
Geosciences 16 00256 g003
Figure 4. Fs of soil–rock mixture slopes with different VBP under seismic loading.
Geosciences 16 00256 g004
Figure 5. F ¯ s of soil–rock mixture slopes with different VBP under seismic loading.
Geosciences 16 00256 g005
Figure 6. Shear dissipation of soil–rock mixture slopes with different VBP under seismic loading (kh = 0.3).
Geosciences 16 00256 g006
Figure 7. Effect of spatially selective rock-block removal on the stability of soil–rock mixture slopes.
Geosciences 16 00256 g007
Figure 8. Definition of effective rock content.
Geosciences 16 00256 g008
Figure 9. Geometric model of soil–rock mixture slope by Liu et al. [31].
Geosciences 16 00256 g009
Figure 10. Comparison with existing numerical cases. (a) VBP = 30% for case 1 [31]. (b) VBP = 40% for case 2 [31]. (c) VBP = 30% for case 1 (this study). (d) VBP = 40% for case 2 (this study). (e) Retaining only the rock blocks within the effective region (this study).
Geosciences 16 00256 g010
Figure 11. Shear dissipation of soil–rock mixture slopes under different Ce and ηe.
Geosciences 16 00256 g011
Figure 12. Effect of ηe on F ¯ s under different VBP and kh.
Geosciences 16 00256 g012
Figure 13. Effect of Ce on F ¯ s under different VBP.
Geosciences 16 00256 g013
Figure 14. Variation of F ¯ s with Ce under different gradations and VBP.
Geosciences 16 00256 g014
Figure 15. Shear dissipation of soil–rock mixture slopes with different block gradations under seismic loading.
Geosciences 16 00256 g015
Figure 16. Numerical model of soil–rock mixture slopes with different spatial distributions of oversized rock blocks.
Geosciences 16 00256 g016
Figure 17. Fs of soil–rock mixture slopes with different spatial distributions of oversized rock blocks under seismic loading.
Geosciences 16 00256 g017
Figure 18. Ce of soil–rock mixture slopes with different spatial distributions of oversized rock blocks under seismic loading.
Geosciences 16 00256 g018
Figure 19. Shear dissipation of soil–rock mixture slopes with different spatial distributions of oversized rock blocks under seismic loading.
Geosciences 16 00256 g019
Table 1. Material parameters of soil–rock mixture slope.
MaterialUnit Weight/kN·m−3Elastic Modulus/MPaPoisson’s RatioCohesion/kPaInternal Friction Angle/°
Soil201000.31020
Rock24.120,0000.290042
Table 2. Variation of Fs with ηe under different Ce.
ηeCe = 15%Ce = 25%Ce = 35%Ce = 40%
0.40.88460.93000.97351.042
0.60.88040.92210.97081.029
0.80.88030.92250.96901.021
10.88010.92350.96811.015
Table 3. Material parameters of soil–rock mixture slope by Liu et al. [31].
MaterialDensity/
kg·m−3
Elastic Modulus/MPaPoisson’s RatioCohesion/kPaInternal Friction Angle/°
Soil190050.4120
Rock254016,0000.238038
Bedrock270019,0000.28243
Disclaimer/Publisher’s Note: The statements, opinions and data contained in all publications are solely those of the individual author(s) and contributor(s) and not of MDPI and/or the editor(s). MDPI and/or the editor(s) disclaim responsibility for any injury to people or property resulting from any ideas, methods, instructions or products referred to in the content.