Article

Insights from Molybdenum Isotopes into Rhenium Enrichment in Porphyry Mo Deposits: Evidence from the Shapinggou Deposit, Eastern China

1
School of Earth Science and Resources, Chang’an University, Xi’an 710054, China
2
Key Laboratory for the Study of Focused Magmatism and Giant Ore Deposits of Ministry of Natural Resources, Xi’an Center of China Geological Survey (Northwest China Center for Geoscience Innovation), Xi’an 710119, China
*
Authors to whom correspondence should be addressed.
Geosciences 2026, 16(7), 253; https://doi.org/10.3390/geosciences16070253
Submission received: 13 May 2026 / Revised: 18 June 2026 / Accepted: 24 June 2026 / Published: 26 June 2026
(This article belongs to the Special Issue Isotope Geochemistry: New Techniques and Applications)

Abstract

Rhenium (Re) is a critical metal indispensable to high-technology manufacturing, defense, and new energy industries. Molybdenite in porphyry deposits is one of the most important hosts of economically recoverable Re. However, the mechanisms controlling Re enrichment in molybdenite remain debated. Ore-forming fluids in Dabie-type porphyry Mo deposits are CO2-rich and commonly occur as coexisting vapor and brine phases, favoring phase separation and boiling. Recent work on the Jinduicheng Dabie-type porphyry Mo deposit in the East Qinling–Dabie Mo metallogenic belt suggested that fluid boiling plays an important role in Re enrichment, but whether this mechanism also applies to other Dabie-type porphyry Mo deposits remains unclear. In this study, Mo and S isotopes of molybdenite from the Shapinggou porphyry Mo deposit were employed to investigate Re enrichment in Dabie-type porphyry Mo deposits. The results show that molybdenite contains 1.13–23.56 ppm Re, has δ98/95Mo values of −0.28‰ to +1.02‰, and shows a negative correlation between δ98/95Mo and δ34S. From early- to late-stage molybdenite, δ98/95Mo values decrease systematically. The systematic decrease in Mo isotopic compositions during mineralization indicates that fluid boiling was the key factor controlling their variation. The negative correlation between Re contents and Mo isotopic compositions further suggests that Re enrichment was also controlled by fluid boiling. During boiling, lighter Mo isotopes and Re partitioned into the vapor phase, whereas delayed vapor-phase Re precipitation and increased residual-fluid salinity enhanced Re mobility in the liquid phase, producing late-stage molybdenite with high Re contents and light Mo isotopic compositions. This study demonstrates that fluid boiling was an important process during mineralization at Shapinggou and may represent one of the factors controlling Re contents in Dabie-type porphyry Mo deposits.

1. Introduction

Rhenium (Re) is a strategically important metal widely used in aerospace, defense, and energy-related industries [1,2,3]. However, its abundance in the Earth’s crust (0.2 to 2 ppb) and the primitive mantle (0.3 ppb) is extremely low [4,5,6]. Economically recoverable Re is limited to restricted types of mineralized systems, mainly porphyry deposits, where it is predominantly hosted by molybdenite (MoS2) [1,7]. Porphyry Mo deposits, which contain large Mo reserves, also host substantial Re resources, accounting for about 10% of the reported global total [8].
Molybdenite from porphyry deposits exhibits a wide range of Re contents, ranging from ppb levels to wt.% levels, and despite numerous studies investigating the factors controlling this variability, Re enrichment of molybdenite remains debated (e.g., [1,3,9,10] and references therein). From the perspective of metallogenic magmas and metal sources, variations in Re content may arise from the mafic–felsic magma interactions, where the Re content in molybdenite is controlled by the proportion of mantle material involved in the parent magma, without requiring recycled Re input [11,12,13]. An alternative interpretation links the formation of some porphyry Mo deposits to magmas or hydrothermal systems influenced by recycled crustal material, such as black shales, which can be enriched in Mo and Re relative to mafic rocks [14,15]. Under this model, elevated Re contents in molybdenite may partly reflect a crustal contribution to the metal budget. From a mineralogical perspective, molybdenite polytypism has also been considered an important factor in Re enrichment, with 3R molybdenite commonly regarded as more Re-rich than the 2H polytype [16,17,18]. Recent studies of molybdenite polytypes have shown that both 2H and 3R molybdenite can be enriched in Re [3,19]. In addition, the physicochemical properties of ore-forming fluids during the magmatic–hydrothermal stage (e.g., temperature, oxygen fugacity, and salinity) also exert an important control on Re contents in molybdenite [10,20,21,22,23,24]. Thus, multiple factors may control Re enrichment in molybdenite from porphyry deposits.
Porphyry Mo deposits have been classified into subduction, rift, and collision types, also termed Endako, Climax, and Dabie types, respectively [25,26,27,28,29,30]. Dabie- or collision-type porphyry Mo deposits represent a distinct class of porphyry Mo systems formed in continental collision orogens, commonly in syn- to post-collisional settings and associated with crust-derived high-K calc-alkaline to shoshonitic granitic magmatism [28,29,30]. Fluid boiling is widely regarded as an important process in metal transport and precipitation in porphyry systems [31,32,33,34,35]. This process may be especially relevant to Dabie-type porphyry Mo deposits. The ore-forming fluids in these deposits are commonly characterized by high CO2 contents and high salinities and may occur as coexisting vapor and brine phases [30,36,37]. During ascent and decompression, such fluids are prone to phase separation and boiling, which can strongly affect metal migration and deposition [36,37]. Only a few studies have investigated the role of fluid boiling in controlling Re enrichment. Early studies suggested that the higher Re contents observed in porphyry Cu deposits are related to their deeper emplacement depths, resulting in more fluid boiling and facilitating the partitioning of Re into the vapor phase [38]. In contrast, porphyry Mo deposits have relatively shallower emplacement depths, and fluid boiling is less common [38]. However, subsequent studies have shown that porphyry Cu and Mo deposits have similar emplacement depths and both experienced multiple episodes of fluid boiling [39]. Barton et al. [9] compared the Re contents in molybdenite from different deposit types and found that greisen systems, although associated with phase separation, show no significant Re enrichment. Therefore, the role of fluid boiling-induced phase separation in controlling Re enrichment in porphyry systems still remains unclear and requires further investigation. Recent work on the Jinduicheng deposit in the Qinling–Dabie belt suggested that boiling played an important role in Re enrichment and that the covariation between Mo isotopes and Re contents in molybdenite may record this process [24]. Whether this mechanism also operates in other Dabie-type porphyry Mo deposits remains uncertain.
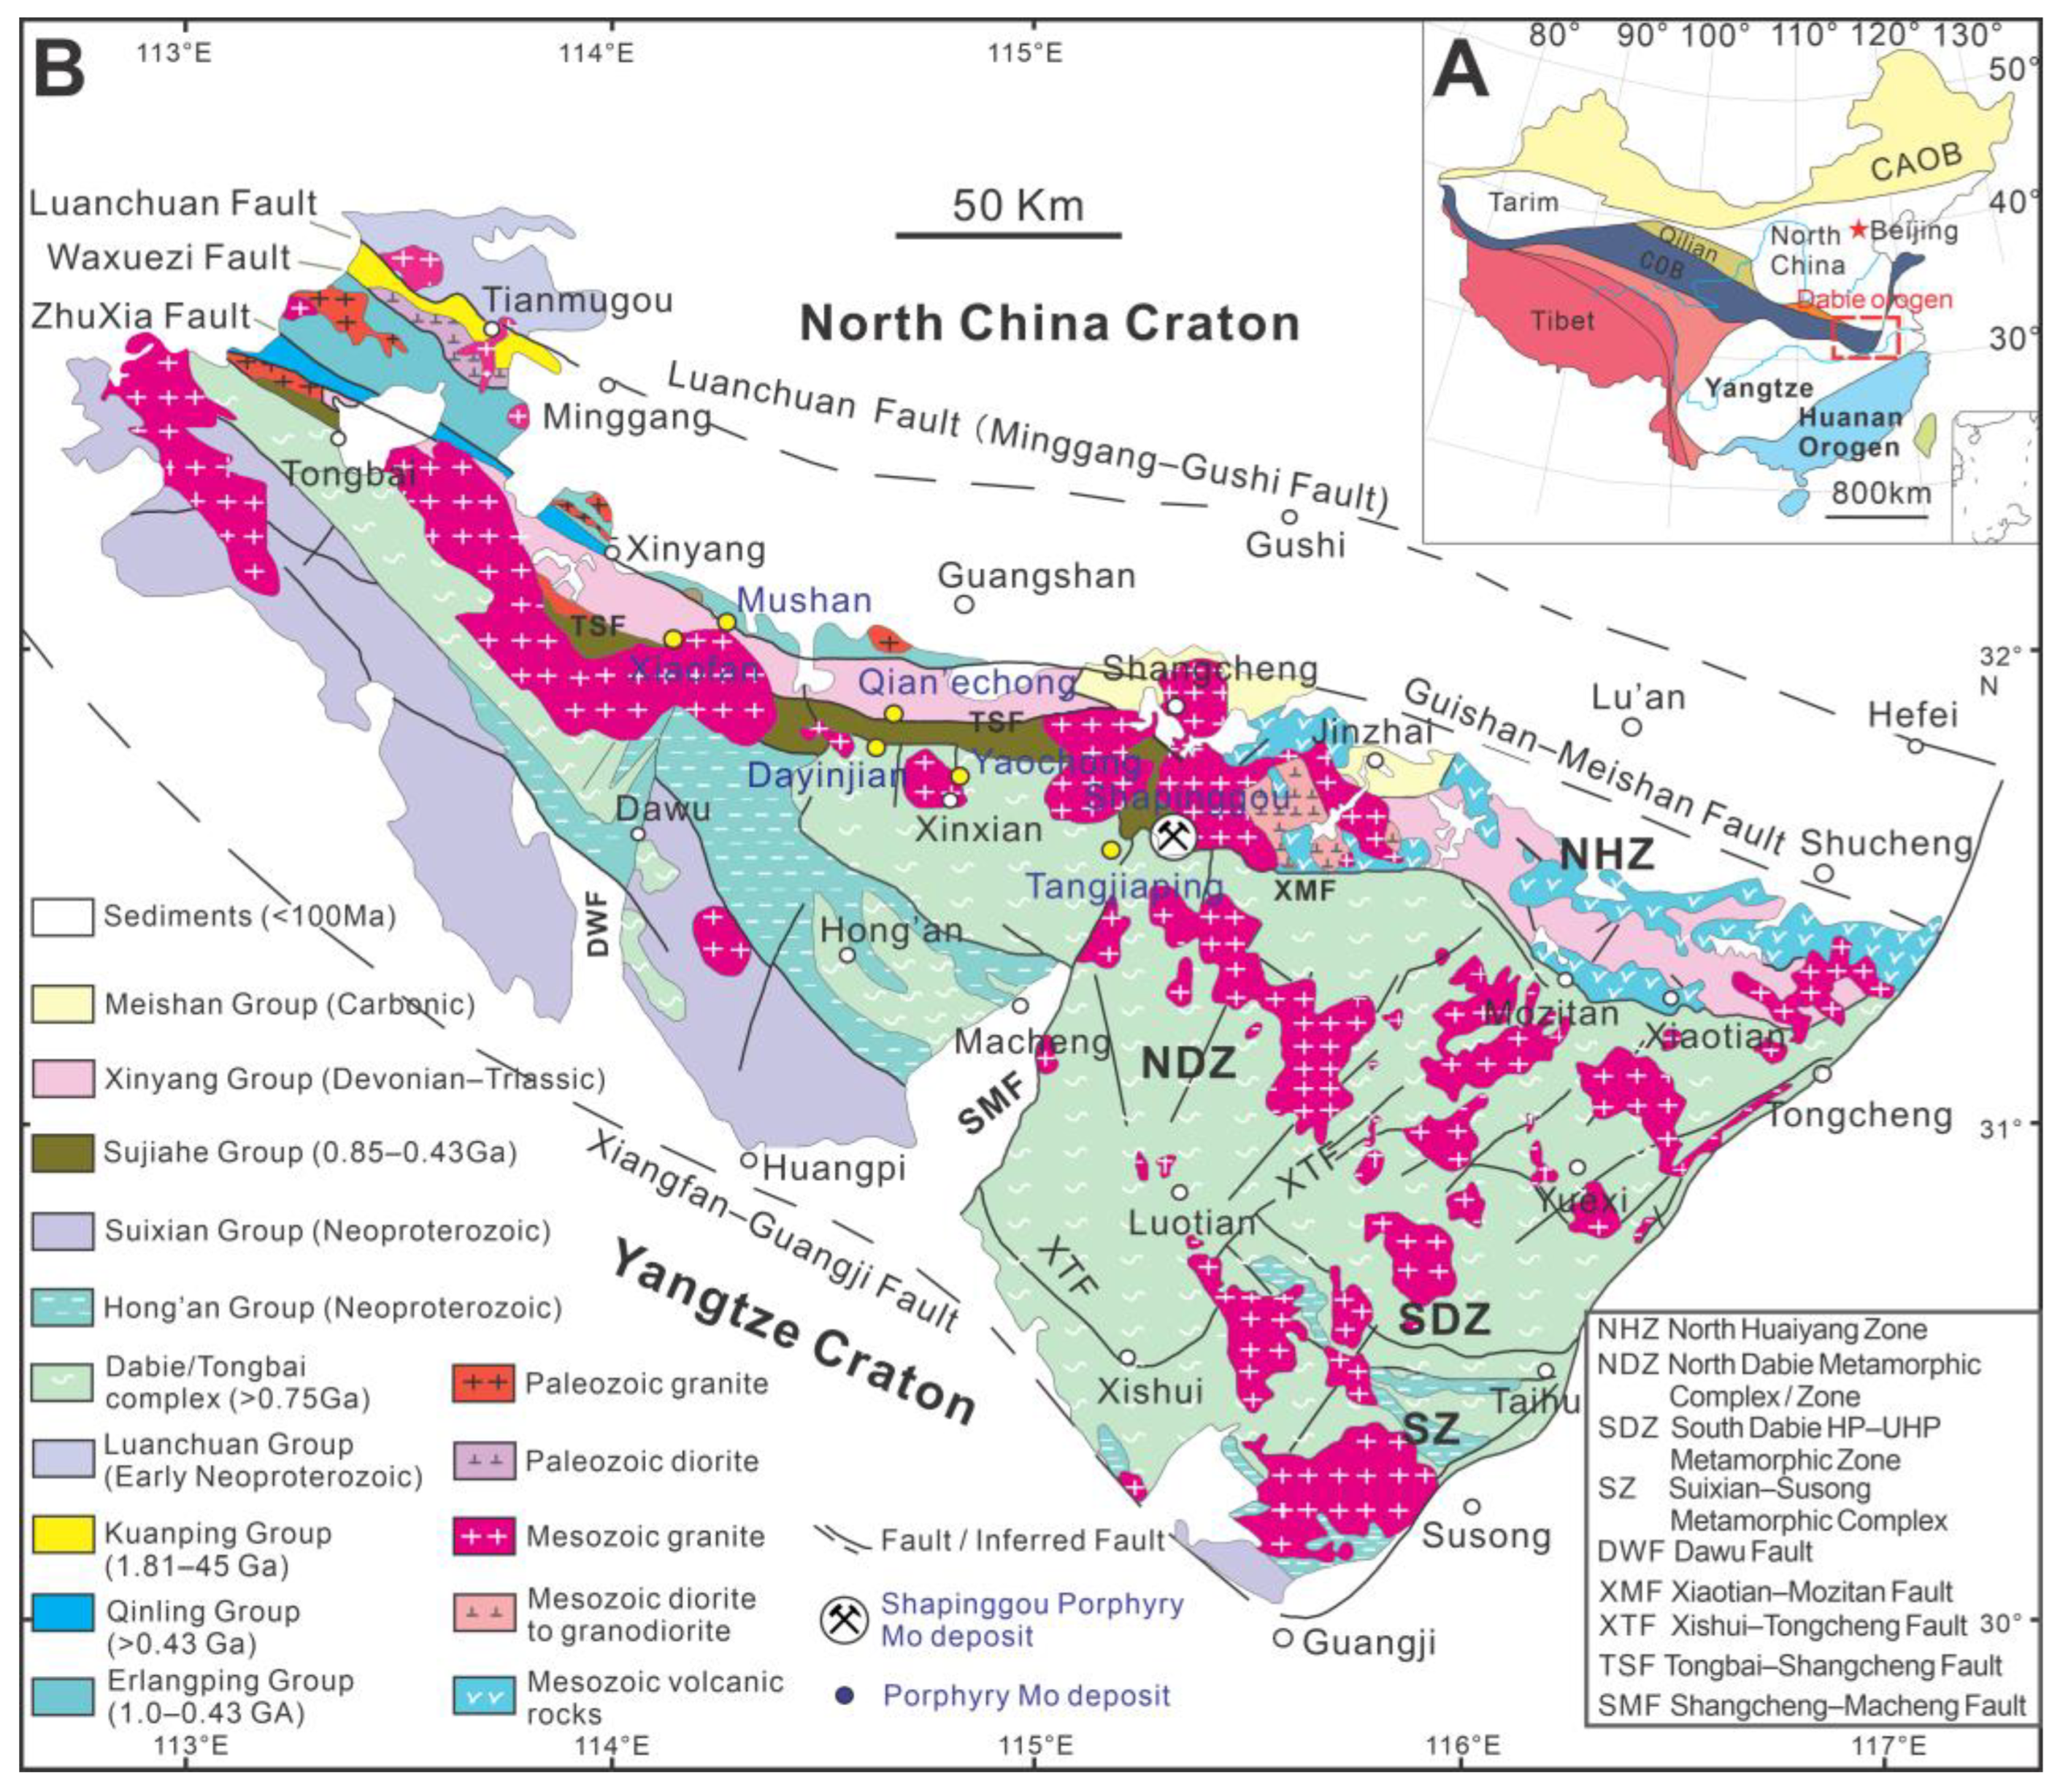
The East Qinling–Dabie orogenic belt in central China is one of the most important global Mo metallogenic belts and contains numerous Mo deposits (Figure 1), with total Mo resources of about 10 Mt [22,30,40,41]. The Shapinggou porphyry Mo deposit, located in the eastern Dabie orogen, is one of the largest porphyry Mo deposits in this region and worldwide [30,41]. It contains 2.37 Mt of Mo and also represents a significant Re resource [8,22,41]. Previous studies have documented its geochronology [37,42], ore-forming fluids [37,41], and Sr–Nd–Pb isotopic characteristics [22,42,43], providing a useful basis for further discussion of Re enrichment.
In this study, major and trace element data, Mo and sulfur isotopic compositions, and X-ray diffraction (XRD) analyses of molybdenite from the Shapinggou deposit are used to examine the mechanism of Re enrichment. The aim is to evaluate whether fluid boiling was an important control on Re enrichment at Shapinggou and whether this process may be more broadly applicable to Dabie-type porphyry Mo systems.

2. Geological Setting and Ore Deposit

The Dabie orogenic belt in eastern China records a protracted Mesozoic geodynamic history, initiated by northward subduction of the Yangtze Craton beneath the North China Craton and culminating in continent–continent collision (Figure 1B). Successive phases of terrane amalgamation and accretion imposed pervasive ductile deformation and high-grade metamorphic reworking across the belt, rendering it one of the most tectonically complex orogens in East Asia [22,30,44]. Together with the Qinling orogenic belt, the Dabie belt defines the largest Mo metallogenic province in China [41]. The regional tectonic architecture is defined by two conjugate fault systems with dominant NE- and NW-trending orientations [30,45,46]. The northern boundary of the belt is marked by the Luanchuan Fault against the North China Craton, while the southern boundary is defined by the Xiangfan–Guangji Fault bordering the Yangtze Craton (Figure 1B).
The regional basement and cover sequences are composed of several tectonostratigraphic units, including the Kuanping, Erlangping, Qinling, Xinyang, Sujiahe, Dabie Complex, Hong’an, and Suixian groups, which are juxtaposed by major regional faults [30,44,45]. Among these, the Dabie Complex is the most important unit for understanding the tectonic evolution of the belt because it contains Neoproterozoic TTG gneisses, Precambrian supracrustal rocks, and classic ultrahigh-pressure metamorphic assemblages that record deep continental subduction [30,45,46].
The Dabie orogen is rich in mineral resources, among which Mo deposits are particularly important, forming a key part of the East Qinling–Dabie world-class molybdenum metallogenic belt [30,40,41]. Mo deposits in this region formed mainly during the Mesozoic and are dominated by the porphyry type, with subordinate porphyry–skarn, skarn, and carbonatite–vein types [30,41]. They are distributed mainly along the northern margin of the Dabie orogen and are broadly controlled by NW-trending regional faults and their intersections with NE-trending structures [28,30]. Representative deposits include Shapinggou and Qian’echong [28,37,47].
Mineralized intrusions in the Dabie orogen are predominantly felsic to intermediate-felsic, including monzogranite, granodiorite, syenite, quartz syenite porphyry, and granite porphyry, and are spatially and genetically associated with molybdenum mineralization [22,30,45]. Post-collisional granitic magmatism occurred in three main stages: Late Triassic syn-exhumation magmatism at 206–200 Ma, Late Jurassic magmatism at 167–146 Ma, and Early Cretaceous magmatism at 143–110 Ma [30,41]. Molybdenum mineralization is closely related to the Late Jurassic–Early Cretaceous magmatic evolution, with compiled geochronological data constraining mineralization to 156–110 Ma. Two main mineralization episodes have been recognized: an early stage at 143–130 Ma (e.g., Mushan, Qian’echong, and Yaochong) and a late stage at 130–110 Ma (e.g., Dayinjian, Tangjiaping, Gaijing, and Shapinggou) [30,41]. These deposits are generally interpreted to have formed in a post-collisional extensional regime, with emplacement controlled by NW- and NNE-trending fault systems (Figure 1B).
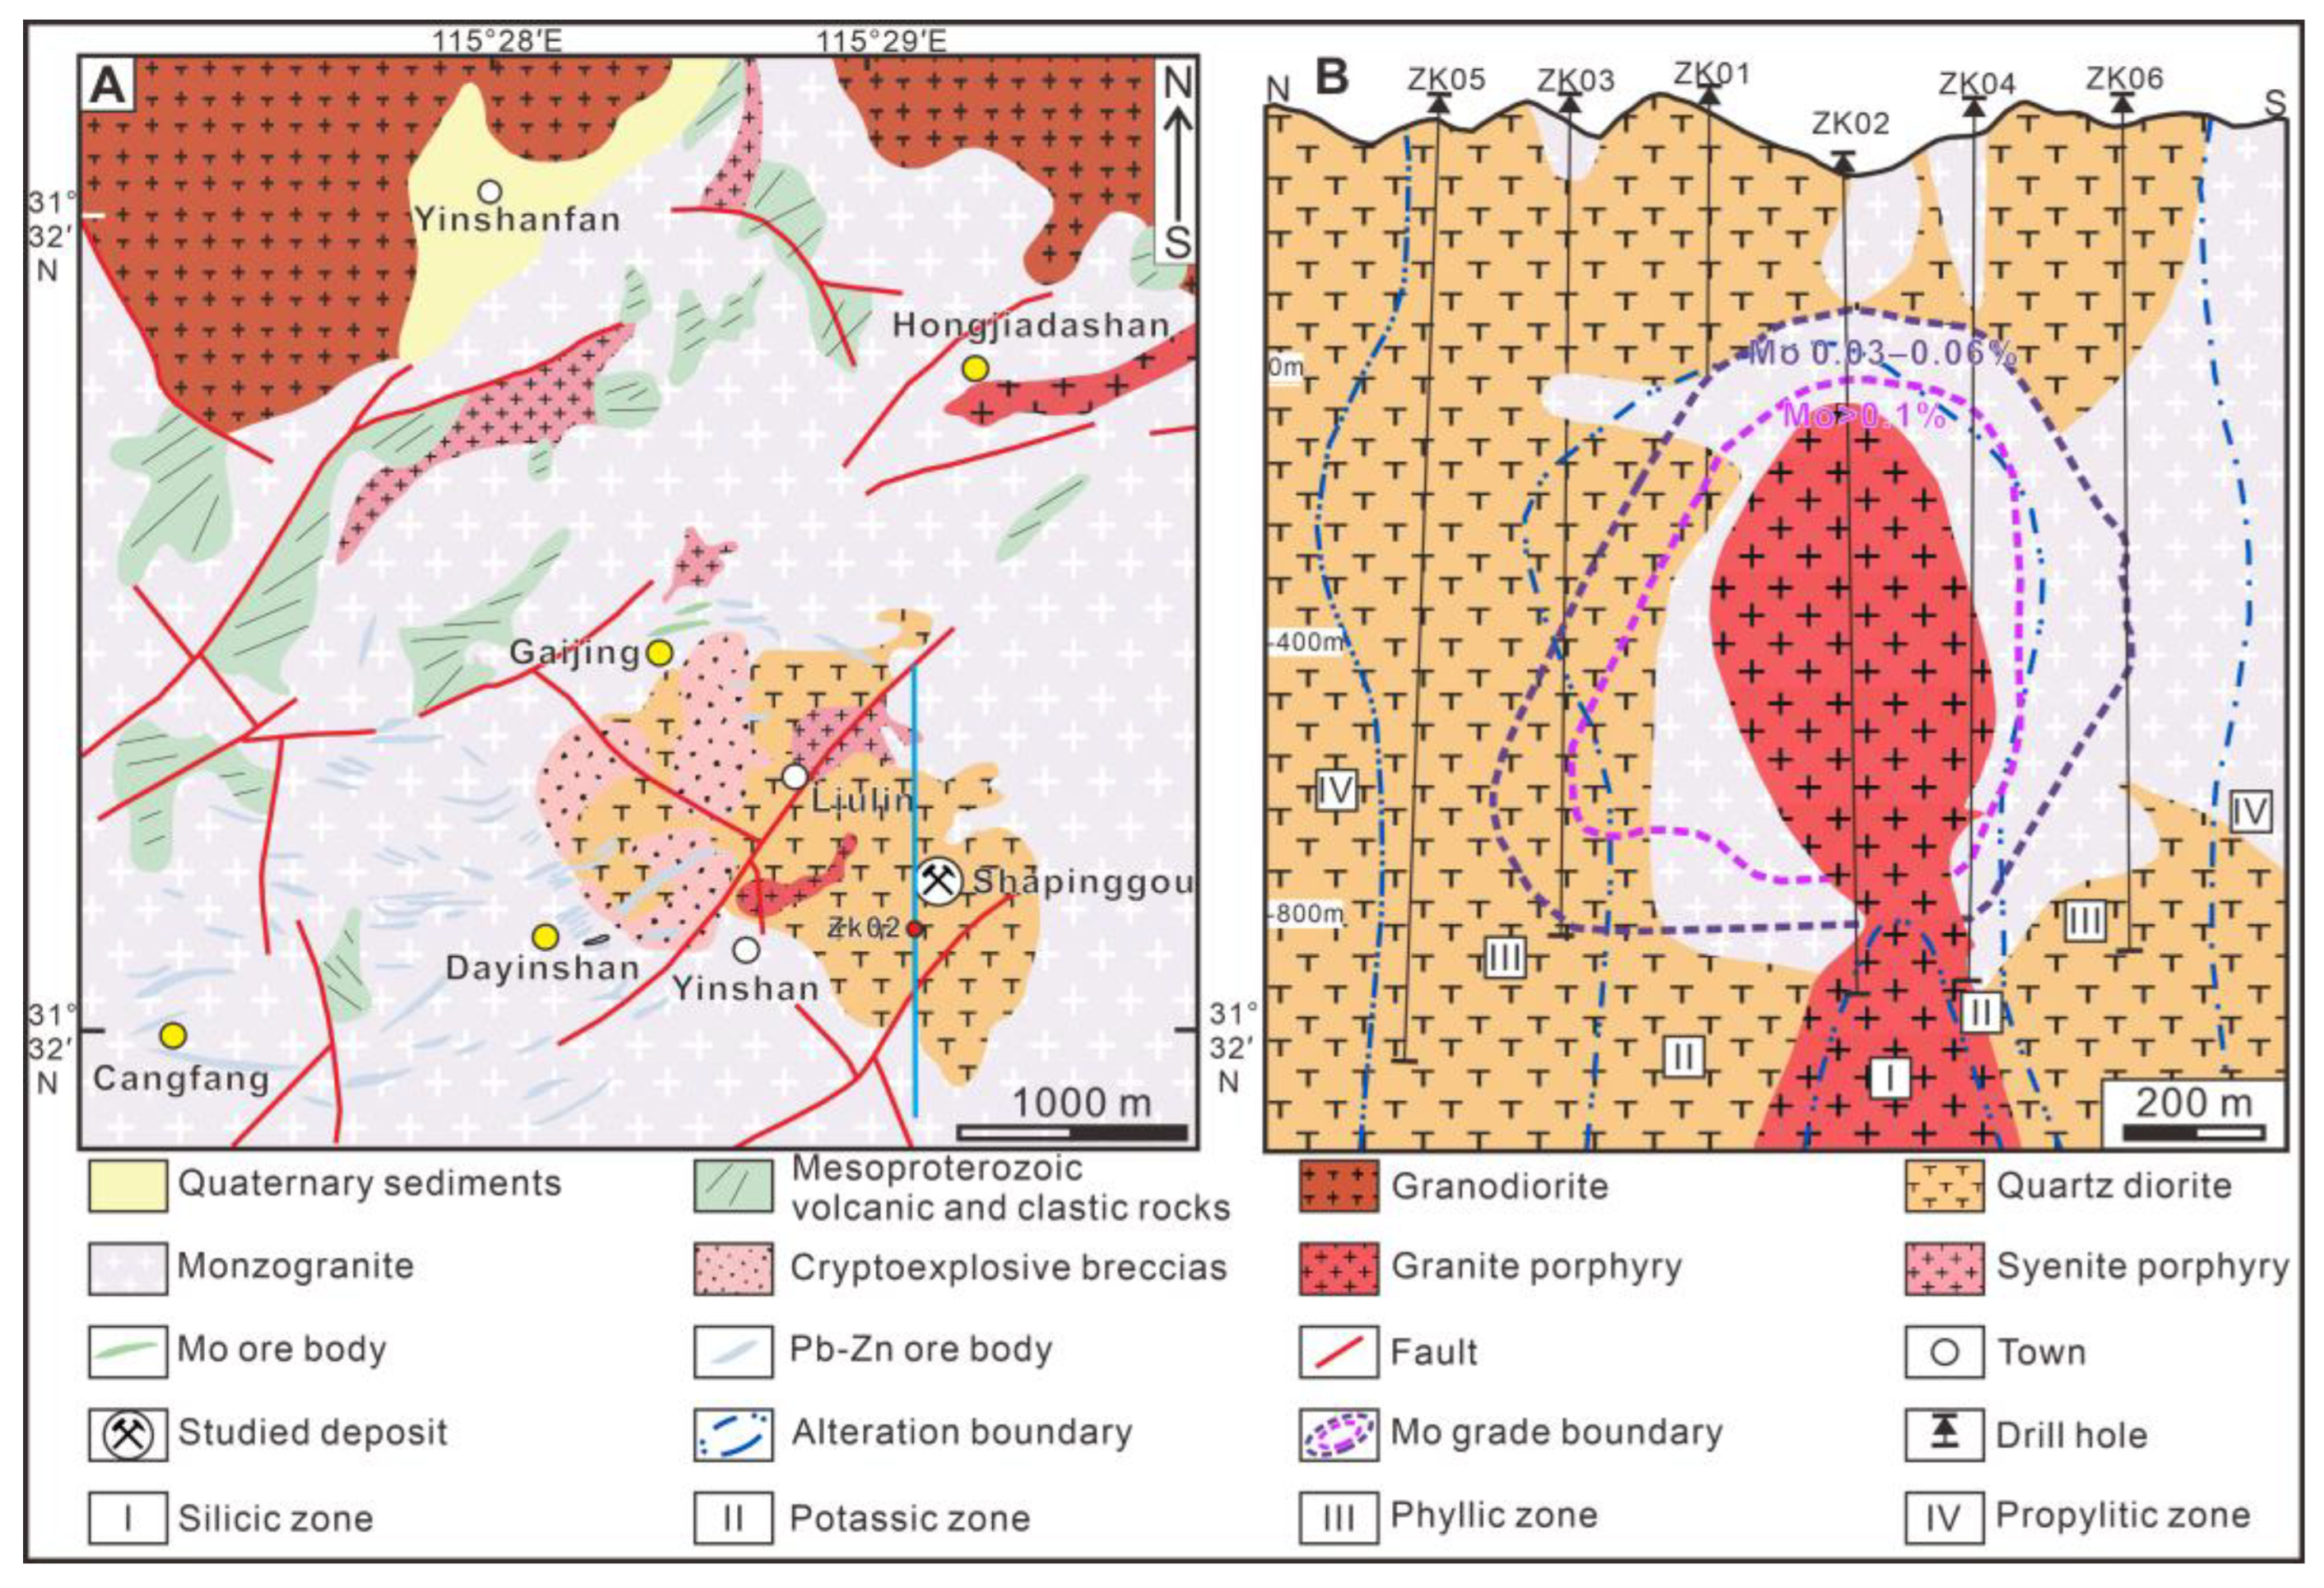
The Shapinggou porphyry Mo deposit is located in the east-central Dabie orogenic belt (Figure 1B). It lies within the western part of the eastern North Huaiyang tectonic belt, proximal to the intersection of the Xiaotian–Mozitan and Shangcheng–Macheng faults. Regional fault structures exerted a first-order control on both magma emplacement and ore localization (Figure 2A) [44]. Mo mineralization in the Shapinggou deposit is largely confined to a single, concealed, laterally continuous main orebody. The mineralization is hosted mainly in intermediate to felsic intrusions, including granitic porphyry and quartz syenite, and in the immediately adjacent wall rocks along intrusive contacts. The orebodies are large-scale and exhibit excellent lateral and vertical continuity [30,37]. Hydrothermal alteration in the Shapinggou deposit shows a typical porphyry-style zonation, with silicic and potassic alteration in the central part, outward grading into phyllic and propylitic alteration zones. Ore deposition can be divided into four hydrothermal stages: (I) a quartz–K-feldspar stage developed mainly in the silicic to potassic alteration zones. (II) a quartz–sulfide stage associated with potassic alteration and the main Mo mineralization. (III) a quartz–sericite stage related to phyllic alteration. (IV) a late quartz–fluorite–gypsum stage corresponding to propylitic alteration (Figure 2B) [22,37]. Molybdenite precipitation was concentrated in stage II, represented by quartz–sulfide mineralization, with minor contributions from the late part of the quartz–K-feldspar stage (stage I) and the early part of the quartz–sericite stage (stage III). The ore mineralogy is relatively simple, dominated by molybdenite and pyrite, with accessory magnetite, galena, sphalerite, and chalcopyrite occurring as minor constituents. The gangue assemblage is dominated by quartz, K-feldspar, and plagioclase. Molybdenite occurs predominantly as fine veinlets, stockworks, and disseminated grains within quartz syenites and granitic porphyries, representing the most characteristic ore style in the Shapinggou deposit [22,37,44,46].
Shapinggou is the largest porphyry Mo deposit in the Dabie belt, with an established resource of 2.37 Mt Mo at a mean grade of 0.14 wt.% [22,41]. Rhenium concentrations in molybdenite range from 0.05 to 154 ppm (mean 16.50 ppm), yielding an estimated Re endowment of ~10 t [8,22]. Molybdenite Re–Os ages (~113 Ma) are concordant with zircon U–Pb ages of the host syenogranite (111.3 ± 1.2 Ma) [37,42], collectively constraining mineralization to the Early Cretaceous.

3. Sample and Methods

3.1. Samples and Sample Preparation

The samples analyzed in this study were mainly collected from the Mo-mineralized inner potassic–silicic core and intermediate sericite–quartz zone of the Shapinggou deposit. Molybdenite is mainly hosted by quartz veins developed in quartz syenite and granite porphyry. Based on field relationships, vein textures and structures observed in hand specimens, mineral assemblages, and crosscutting relationships, together with previous classifications of the hydrothermal stages of the deposit, the molybdenite-bearing samples were divided into three mineralization stages corresponding to stages I–III. Stage IV was not included in this study because it represents a late quartz–fluorite–gypsum stage related to propylitic alteration and contains little to no molybdenite mineralization [22,37].
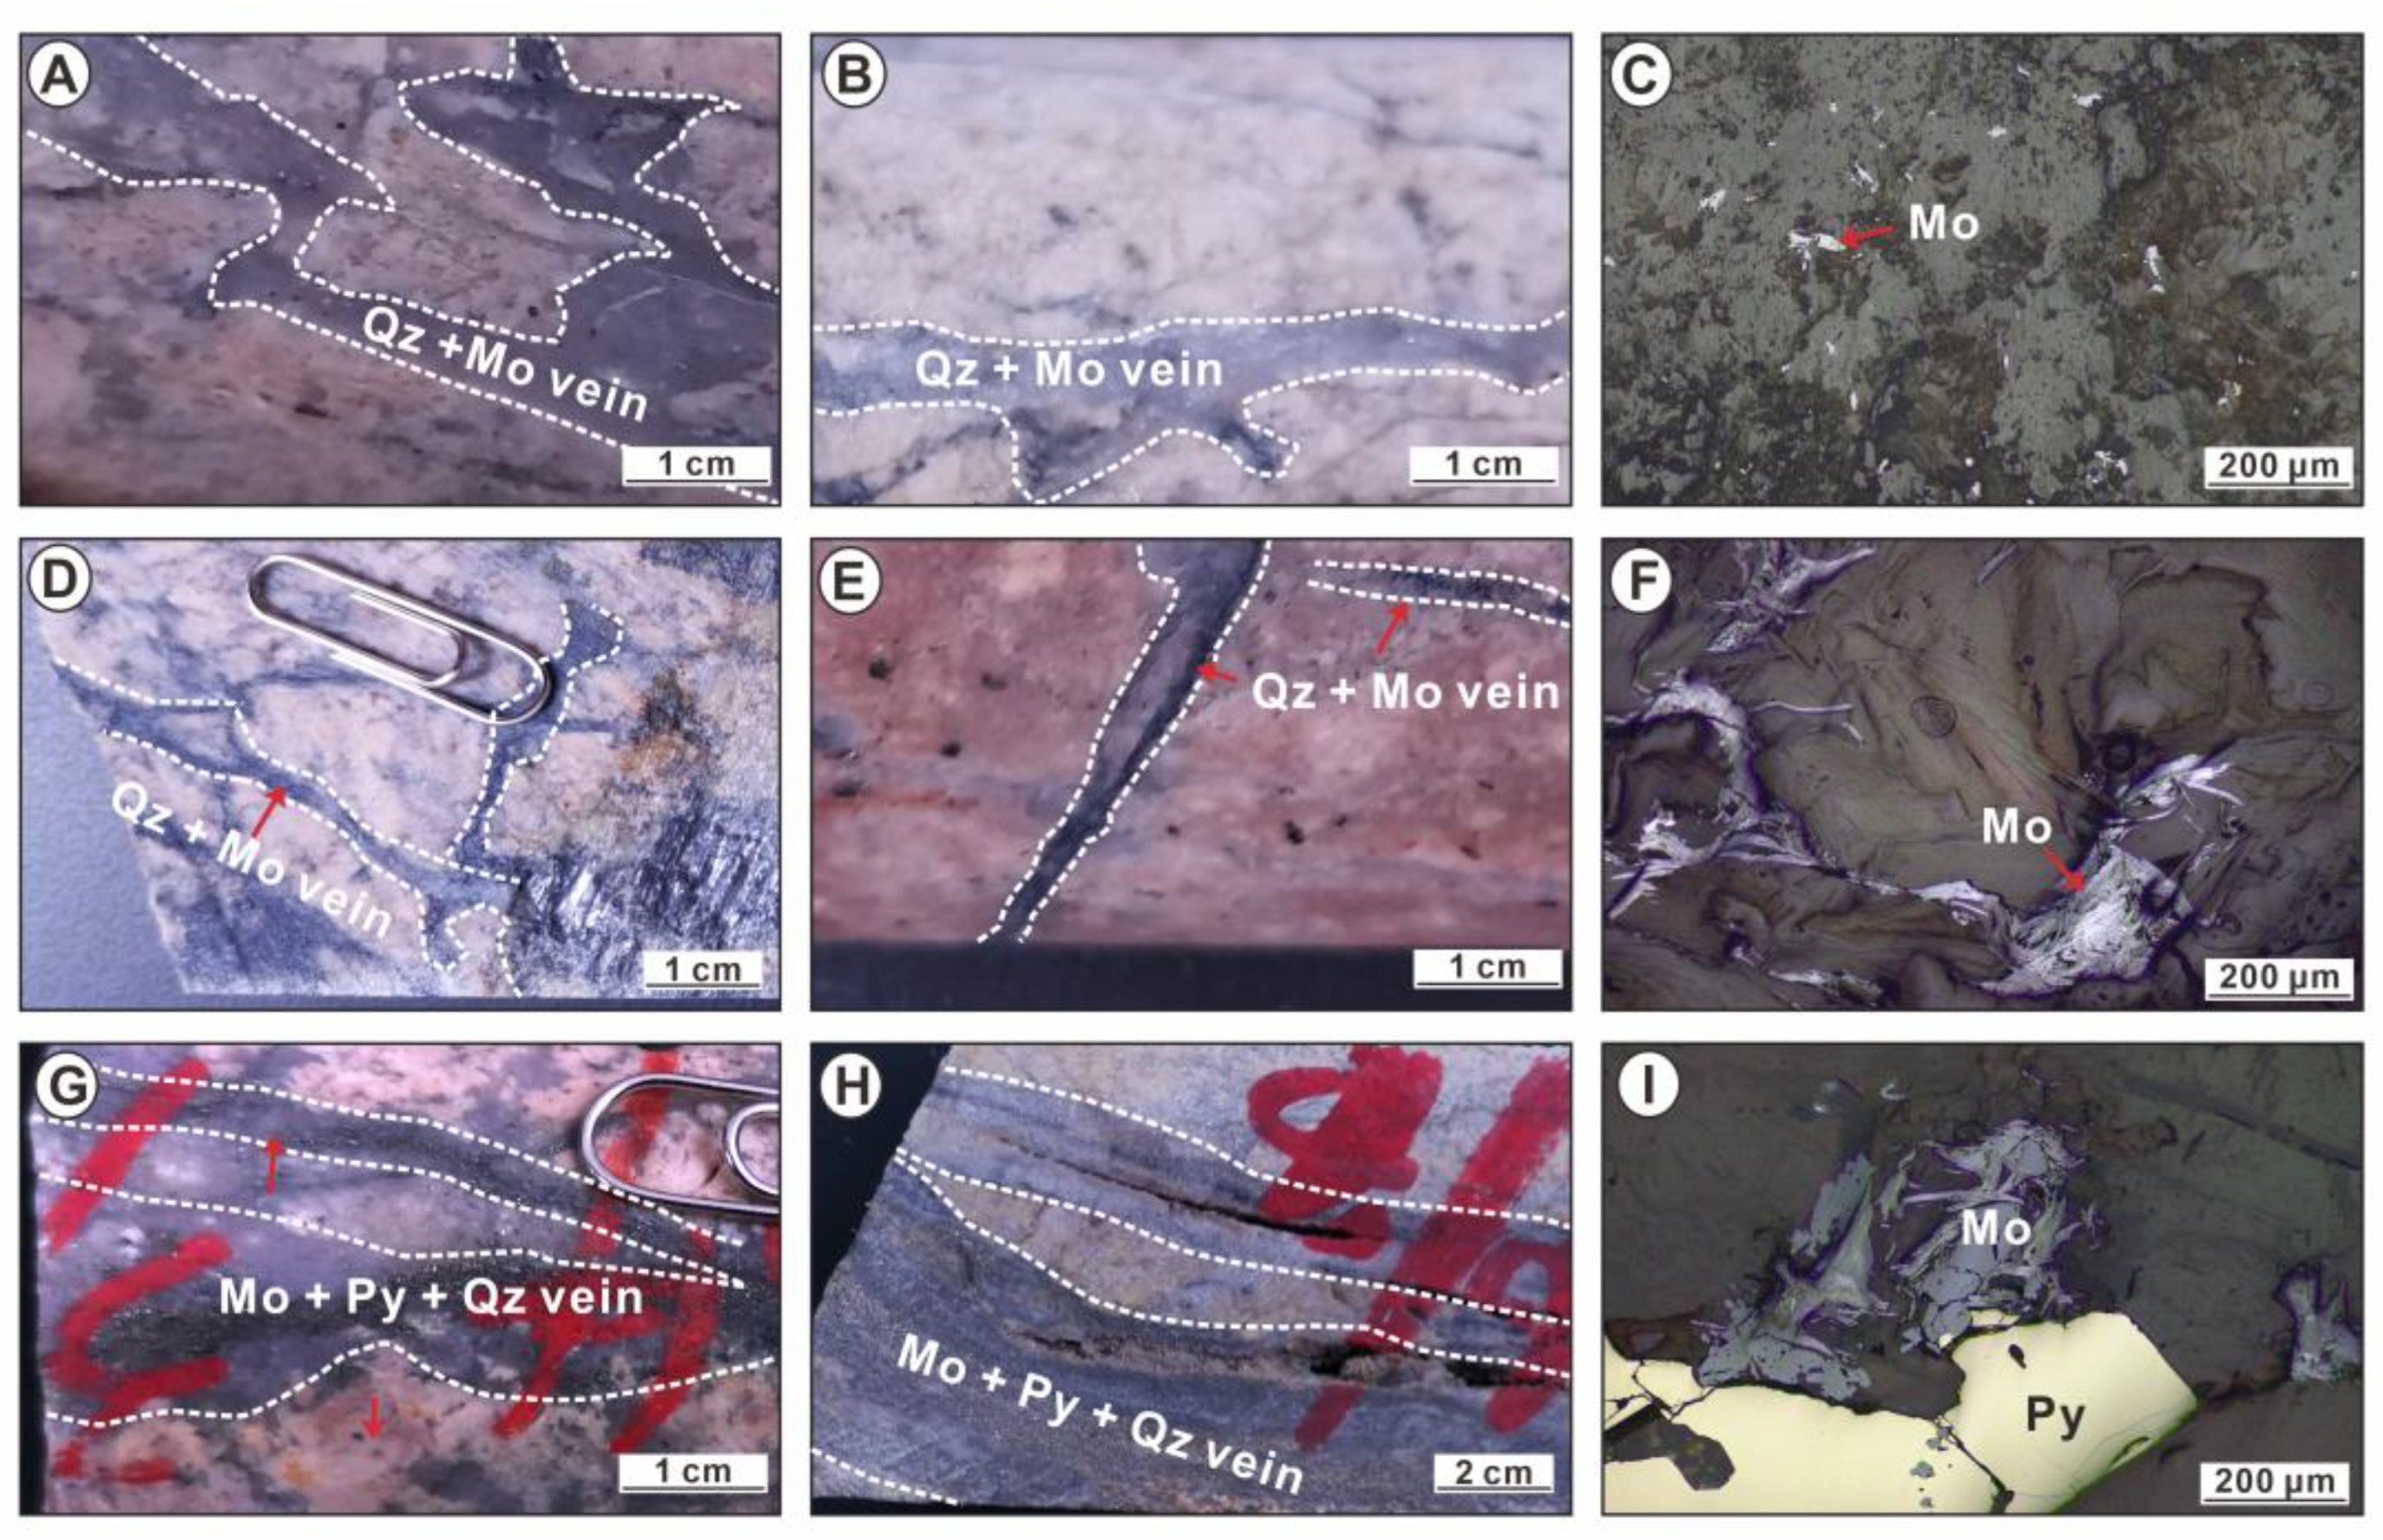
Stage I is represented mainly by quartz veins with minor early Mo mineralization. These veins are relatively coarse and occur chiefly in quartz syenite. Molybdenite from this stage is sparse and represents weak early mineralization (Figure 3A,B). Microscopically, the grains are very fine and occur as speck-like disseminations (Figure 3C).
Stage II is characterized by quartz–molybdenite veins and is closely associated with potassic alteration. Molybdenite occurs mainly as fine disseminations and thin veinlets, along or within quartz veins (Figure 3D,E). At this stage, molybdenite precipitation becomes widespread, and molybdenite commonly forms relatively coarse platy aggregates, locally showing bending and distortion (Figure 3F).
Stage III is characterized by quartz–sulfide veins, in which pyrite and molybdenite are the main sulfides (Figure 3G,H). This stage represents the main sulfide precipitation event. Molybdenite commonly occurs together with pyrite; the pyrite is generally xenomorphic to subhedral, whereas molybdenite is widely developed as platy aggregates (Figure 3I).
A total of 10 molybdenite separates (purity > 99%) were obtained for this study. After ultrasonic cleaning with ultrapure water and air drying, the samples were ground to 200 mesh for Re analysis, X-ray diffraction (XRD), and Mo and S isotope analyses.

3.2. X-Ray Diffraction (XRD) Analysis

XRD analyses were carried out using a Shimadzu XRD-6100 diffractometer (Shimadzu Corporation, Kyoto, Japan) at the Ore-forming Processes and Dynamics Laboratory, Chang’an University. The samples were analyzed over a 2θ range of X–Y° using Cu Kα radiation operated at 40 kV and 35 mA. Continuous scans were performed from 10 to 80° 2θ at a scanning rate of 1°/min. The XRD patterns were processed using JADE 6 software (Materials Data, Inc., Livermore, CA, USA).

3.3. Major Element and Re Content Analyses

Mo, S, and Re content analyses were carried out at ALS Minerals/ALS Chemex Co., Ltd. (Guangzhou, China) using a four-acid digestion method. Approximately 0.25 g of sample was digested with hydrofluoric and nitric acids in a closed Teflon vessel. After evaporation to dryness, the residue was redissolved in dilute hydrochloric acid. Major elements were determined using a Varian VISTA inductively coupled plasma atomic emission spectrometer (ICP-AES; Varian, Palo Alto, CA, USA), whereas trace elements were analyzed using a PerkinElmer ELAN 6000 inductively coupled plasma mass spectrometer (ICP-MS; PerkinElmer, Waltham, MA, USA). The analytical data were corrected for instrumental drift and inter-element spectral interferences, and the detection limit for Re was 0.02 ppm. Detailed analytical procedures are given in Alexander [48].

3.4. Sulfur and Mo Isotope Analyses

Molybdenite sulfur isotope analyses were performed at the Gas Mass Spectrometry Laboratory, State Key Laboratory of Critical Mineral Research and Exploration, Institute of Geochemistry, Chinese Academy of Sciences (IGCAS), using a MAT-253 stable isotope mass spectrometer (Thermo Fisher Scientific, Waltham, MA, USA). International reference materials IAEA-S-1 (δ34SVCDT = 0.3‰), IAEA-S-2 (δ34SVCDT = 22.62 ± 0.17‰), and IAEA-S-3 (δ34SVCDT = −32.49 ± 0.17‰) were used to control data quality. All δ34S data are reported relative to Vienna Canyon Diablo Troilite (VCDT), with an analytical uncertainty of ±0.1‰.
Approximately 200 mg of molybdenite was weighed into perfluoroalkoxy (PFA) microwave digestion vessels and digested with 6 mL HNO3 and 2 mL HF in a microwave system at 200 °C for 90 min to ensure complete dissolution. After digestion, aliquots containing approximately 2 μg of Mo were accurately transferred to polytetrafluoroethylene (PTFE) beakers, followed by the addition of an equal amount of a 97Mo–100Mo double spike, and the solutions were evaporated to dryness. Residual HF was removed by repeatedly adding 1 mL of HNO3 and evaporating to dryness. Then, 1 mL 6 mol/L HCl was added and evaporated to dryness. Finally, the samples were diluted to 8 mL with 6 mol/L HCl and left overnight.
Mo isotope separation and purification were carried out using a two-column procedure following Liu et al. [49]. First, preliminary separation was performed using an ion-exchange column loaded with 5 mL of AG® 1-X8 resin (100–200 mesh; Bio-Rad, Hercules, CA, USA). Mo was then further purified using a second column loaded with 5 mL of AG® 50W-X8 resin (200–400 mesh; Bio-Rad, Hercules, CA, USA)). After purification and evaporation to dryness, the samples were dissolved in 3 mL of 2% HNO3 and diluted to 200 ppb for subsequent Mo isotope analysis.
At the IGCAS, molybdenum isotope compositions were measured using a Neptune Plus multi-collector inductively coupled plasma mass spectrometer (MC-ICP-MS; Thermo Fisher Scientific, Waltham, MA, USA). The instrumental operating conditions, calibration strategy, and analytical procedures used in this study were the same as those described in [50]. Mo isotope compositions in this study are reported as δ98/95Mo values in parts per thousand (‰) relative to NIST SRM 3134, produced by the National Institute of Standards and Technology (NIST).
Following Nägler et al. [51] and Zhang et al. [50], +0.25‰ was added to all δ98/95Mo values reported in this study. To verify the reliability of the Mo isotope analyses, two international reference materials, BCR-2 basalt and Nod-P-1 ferromanganese nodule, both issued by the U.S. Geological Survey (USGS), were processed and analyzed as samples. The measured values were δ98/95Mo (BCR-2) = −0.24 ± 0.02‰ (n = 6) and δ98/95Mo (Nod-P-1) = −0.69 ± 0.02‰ (n = 6), and they are consistent with previously published data within analytical uncertainty [49,50,52].

4. Results

4.1. XRD Results

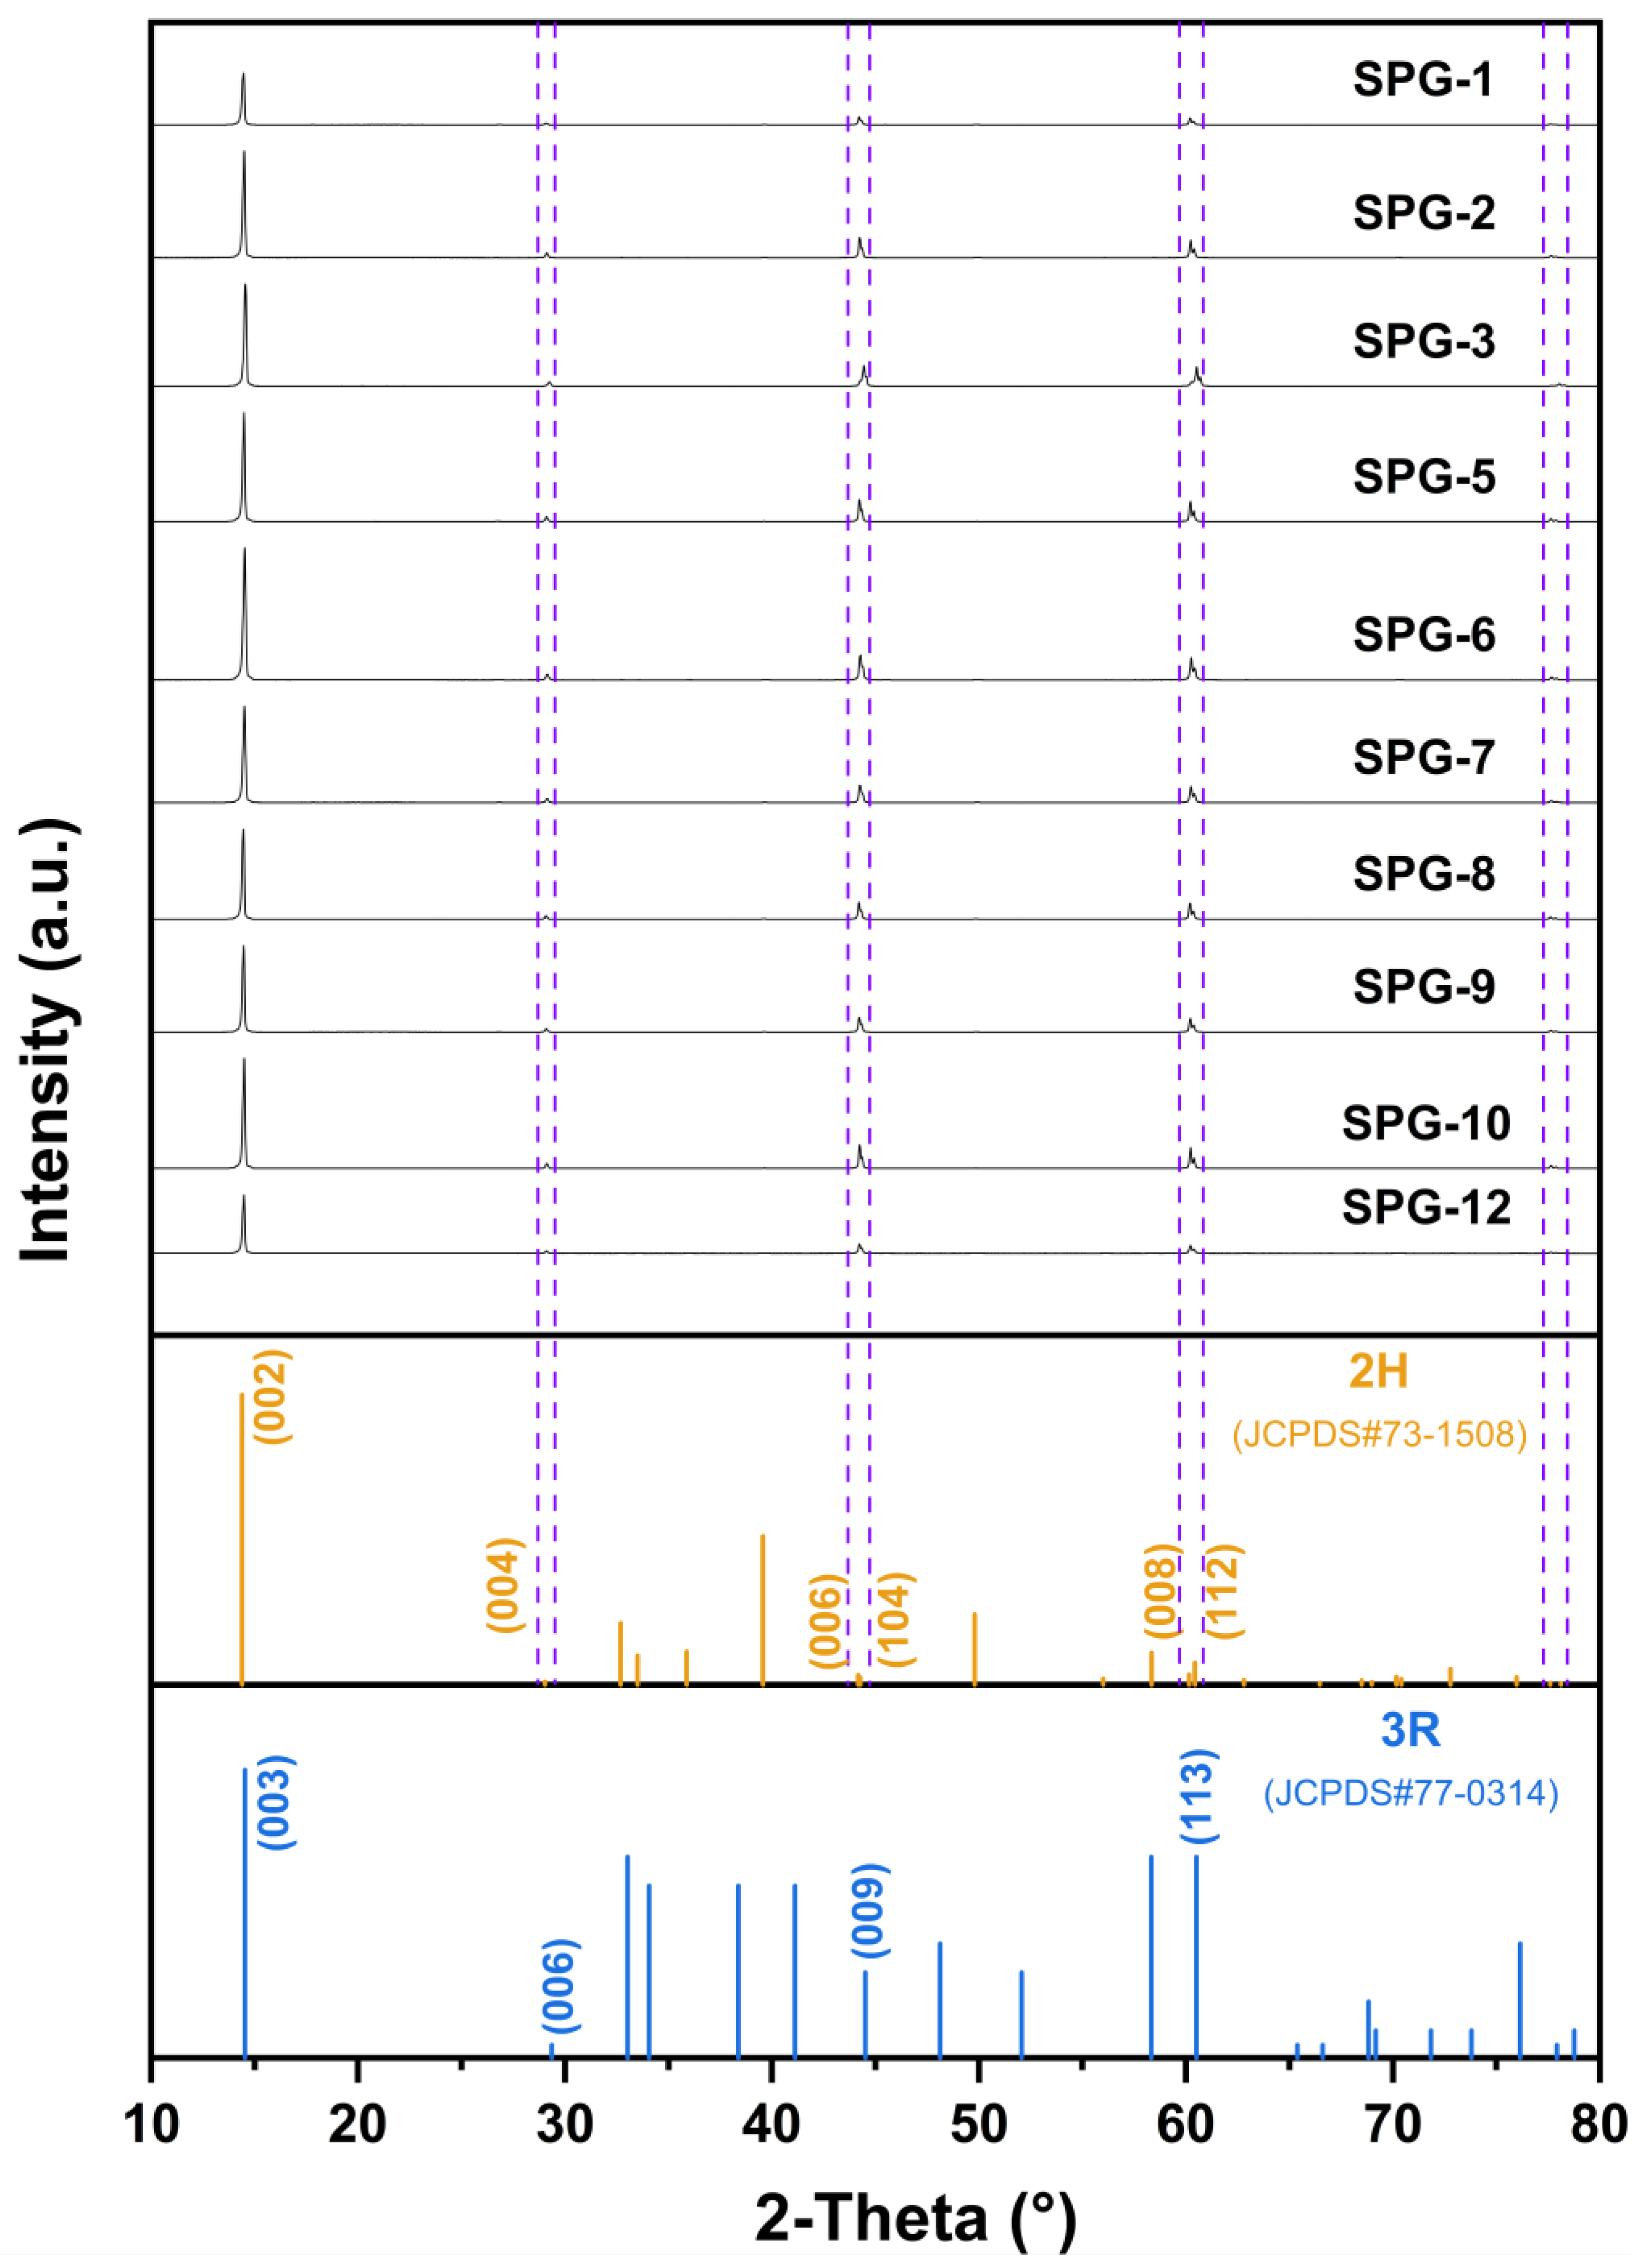
X-ray diffraction analyses were conducted on 10 molybdenite samples, and the diffraction patterns were compared with the standard card for molybdenite. The results indicate that the studied molybdenite has a uniform crystal structure. Molybdenite from both early and late stages is exclusively of the 2H polytype, and no 3R polytype was identified (Figure 4).

4.2. Major Element and Re Contents of Molybdenite

The Mo, S, and Re contents of molybdenite from the Shapinggou deposit are listed in Table 1. The theoretical composition of molybdenite is 59.9 w.t.% Mo and 40.1 w.t.% S [53]. In this study, molybdenite contains 58.52 ± 0.73 w.t.% Mo and 38.82 ± 0.72 w.t.% S on average (n = 10). Molybdenite from the Shapinggou deposit is characterized by relatively low Re contents, ranging from 1.13 to 23.59 ppm, with an average of 8.56 ± 7.46 ppm (n = 10). Notably, the Re content shows a progressive increase from the early to late mineralization stages. The average Re content increases from 3.67 ppm in Stage I (n = 3) to 6.25 ppm in Stage II (n = 3), and further to 13.96 ppm in Stage III (n = 4).

4.3. Sulfur Isotopes

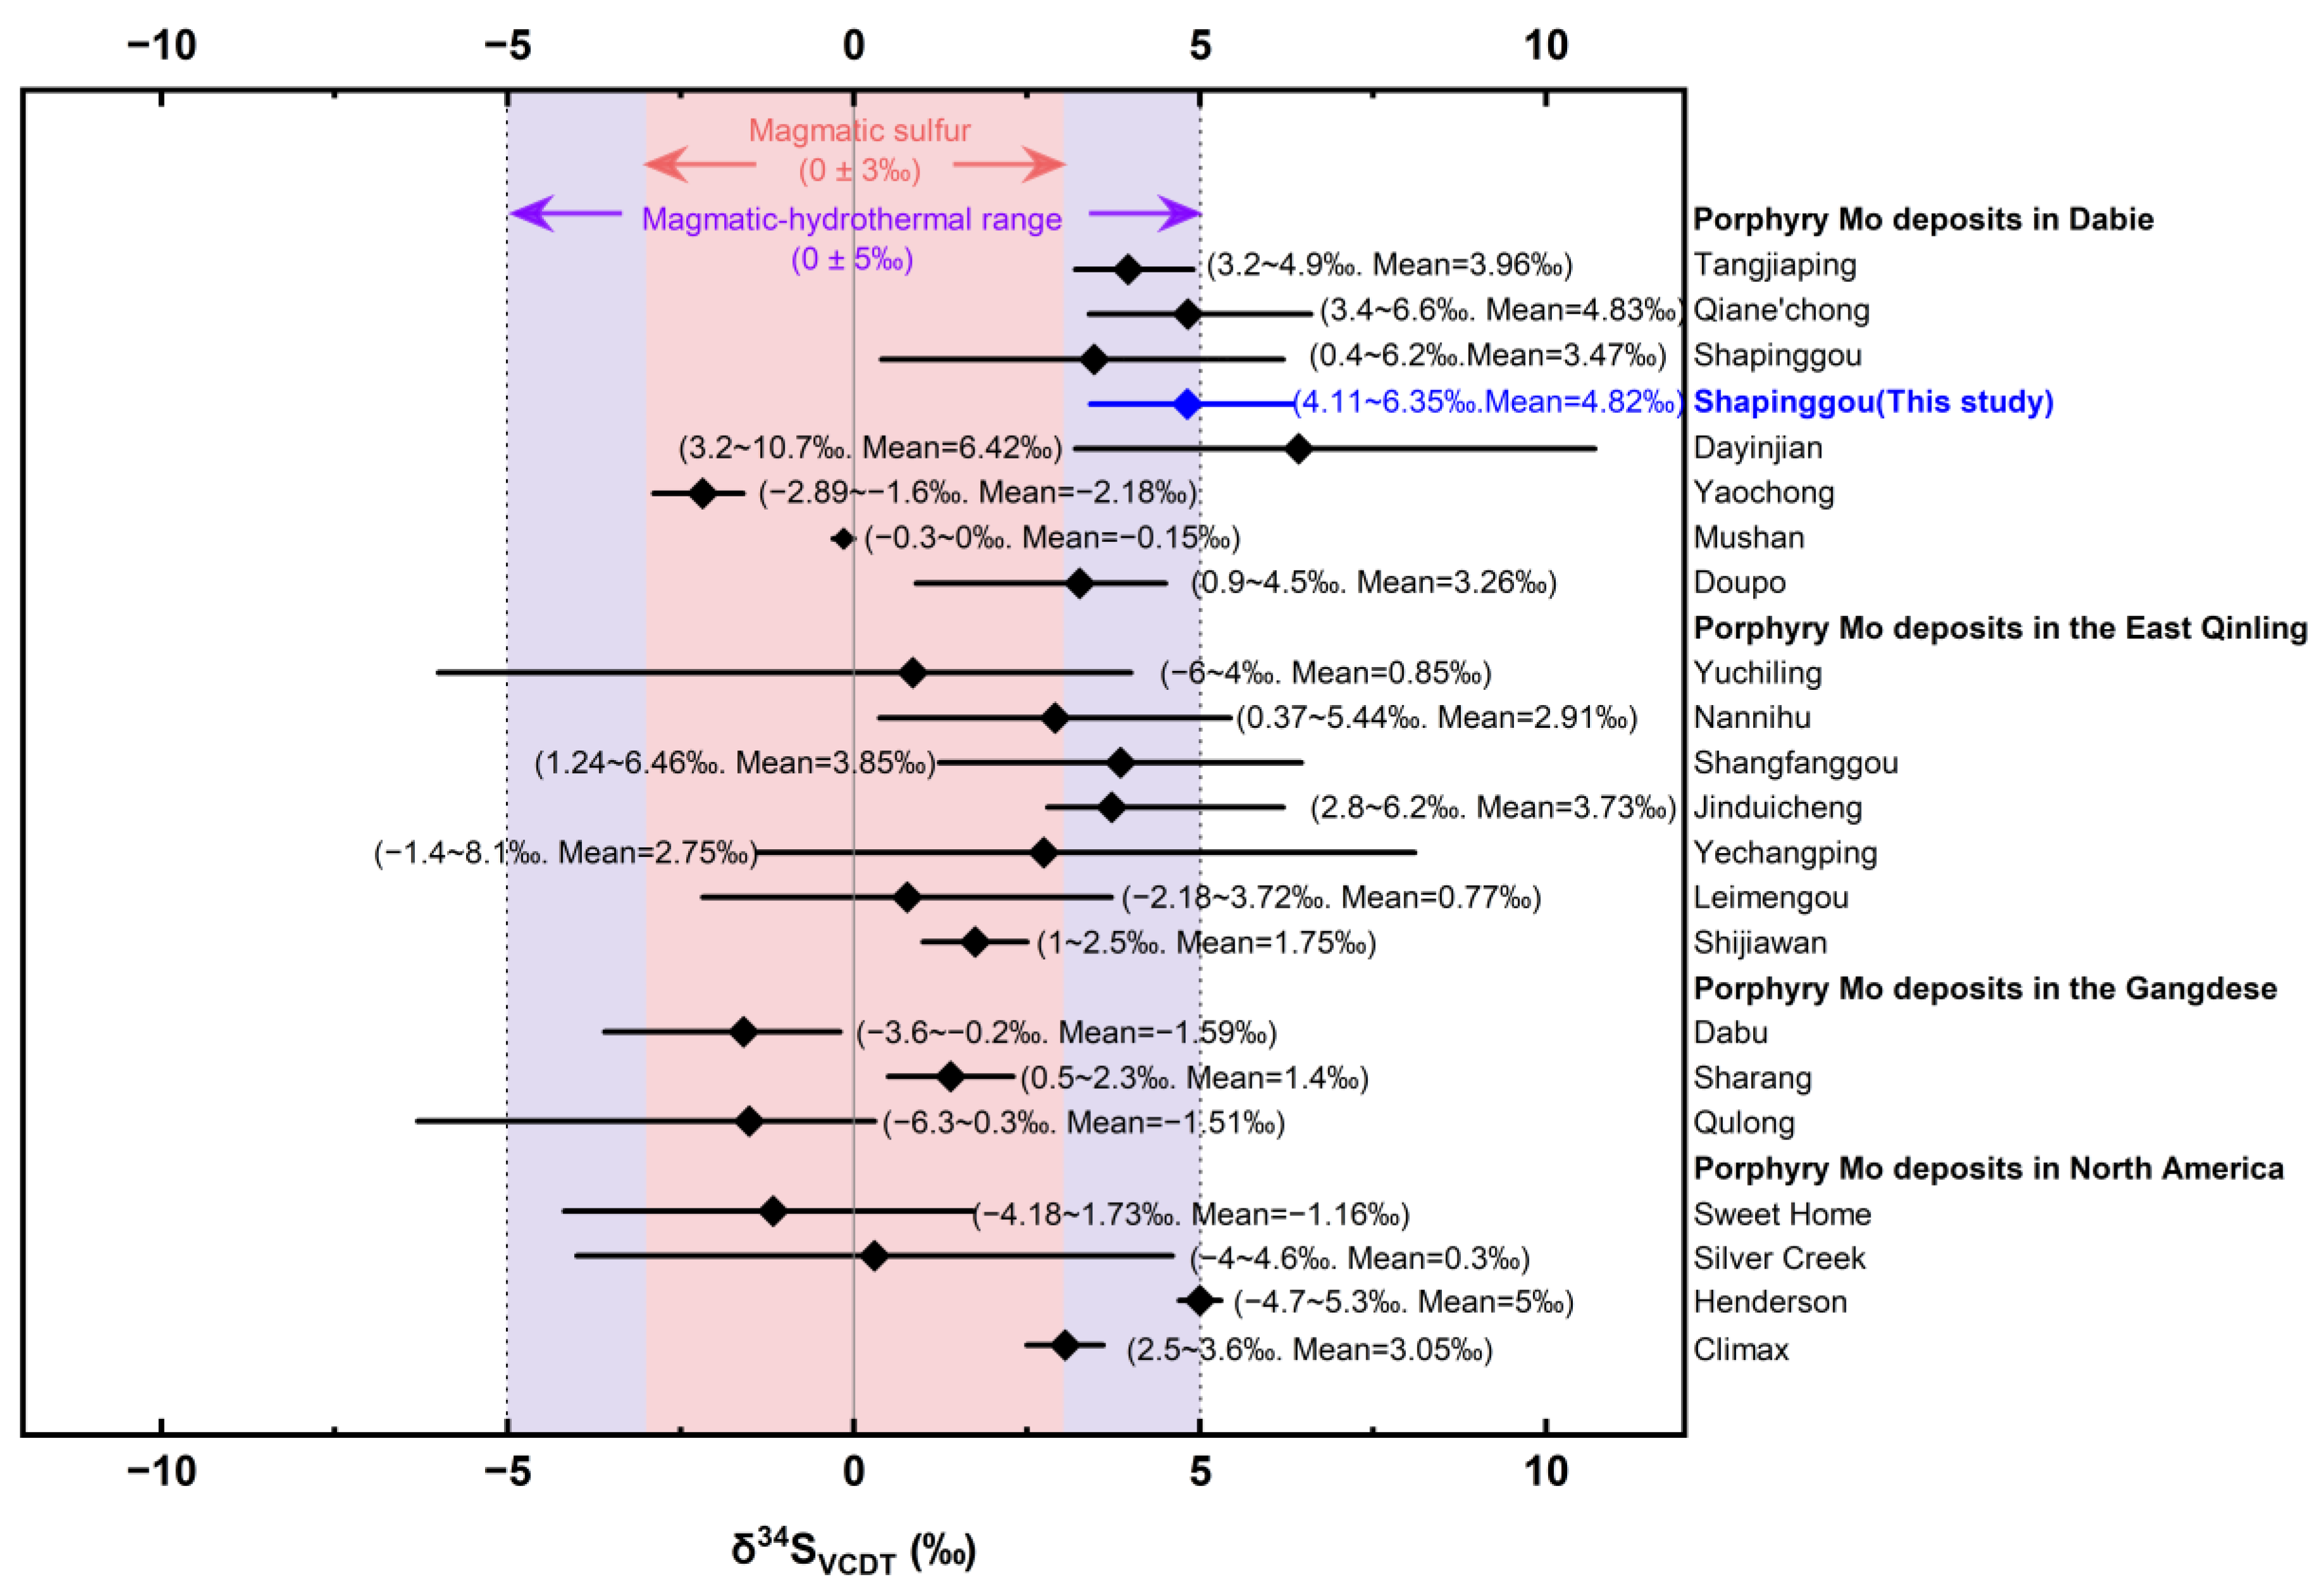
Sulfur isotope data for molybdenite are presented in Table 1. The δ34S values range from 3.42‰ to 6.35‰, with an average of 4.82 ± 0.88‰ (n = 10), and are characterized by relatively heavy sulfur isotopic compositions. Notably, δ34S values of molybdenite become progressively heavier from the early to the late mineralization stages (Table 1). Previous studies reported δ34S values of 0.4‰ to 6.2‰ for sulfides from the Shapinggou deposit, similar to the values obtained in this study (Figure 5) [30,37,54,55].

4.4. Mo Isotopes

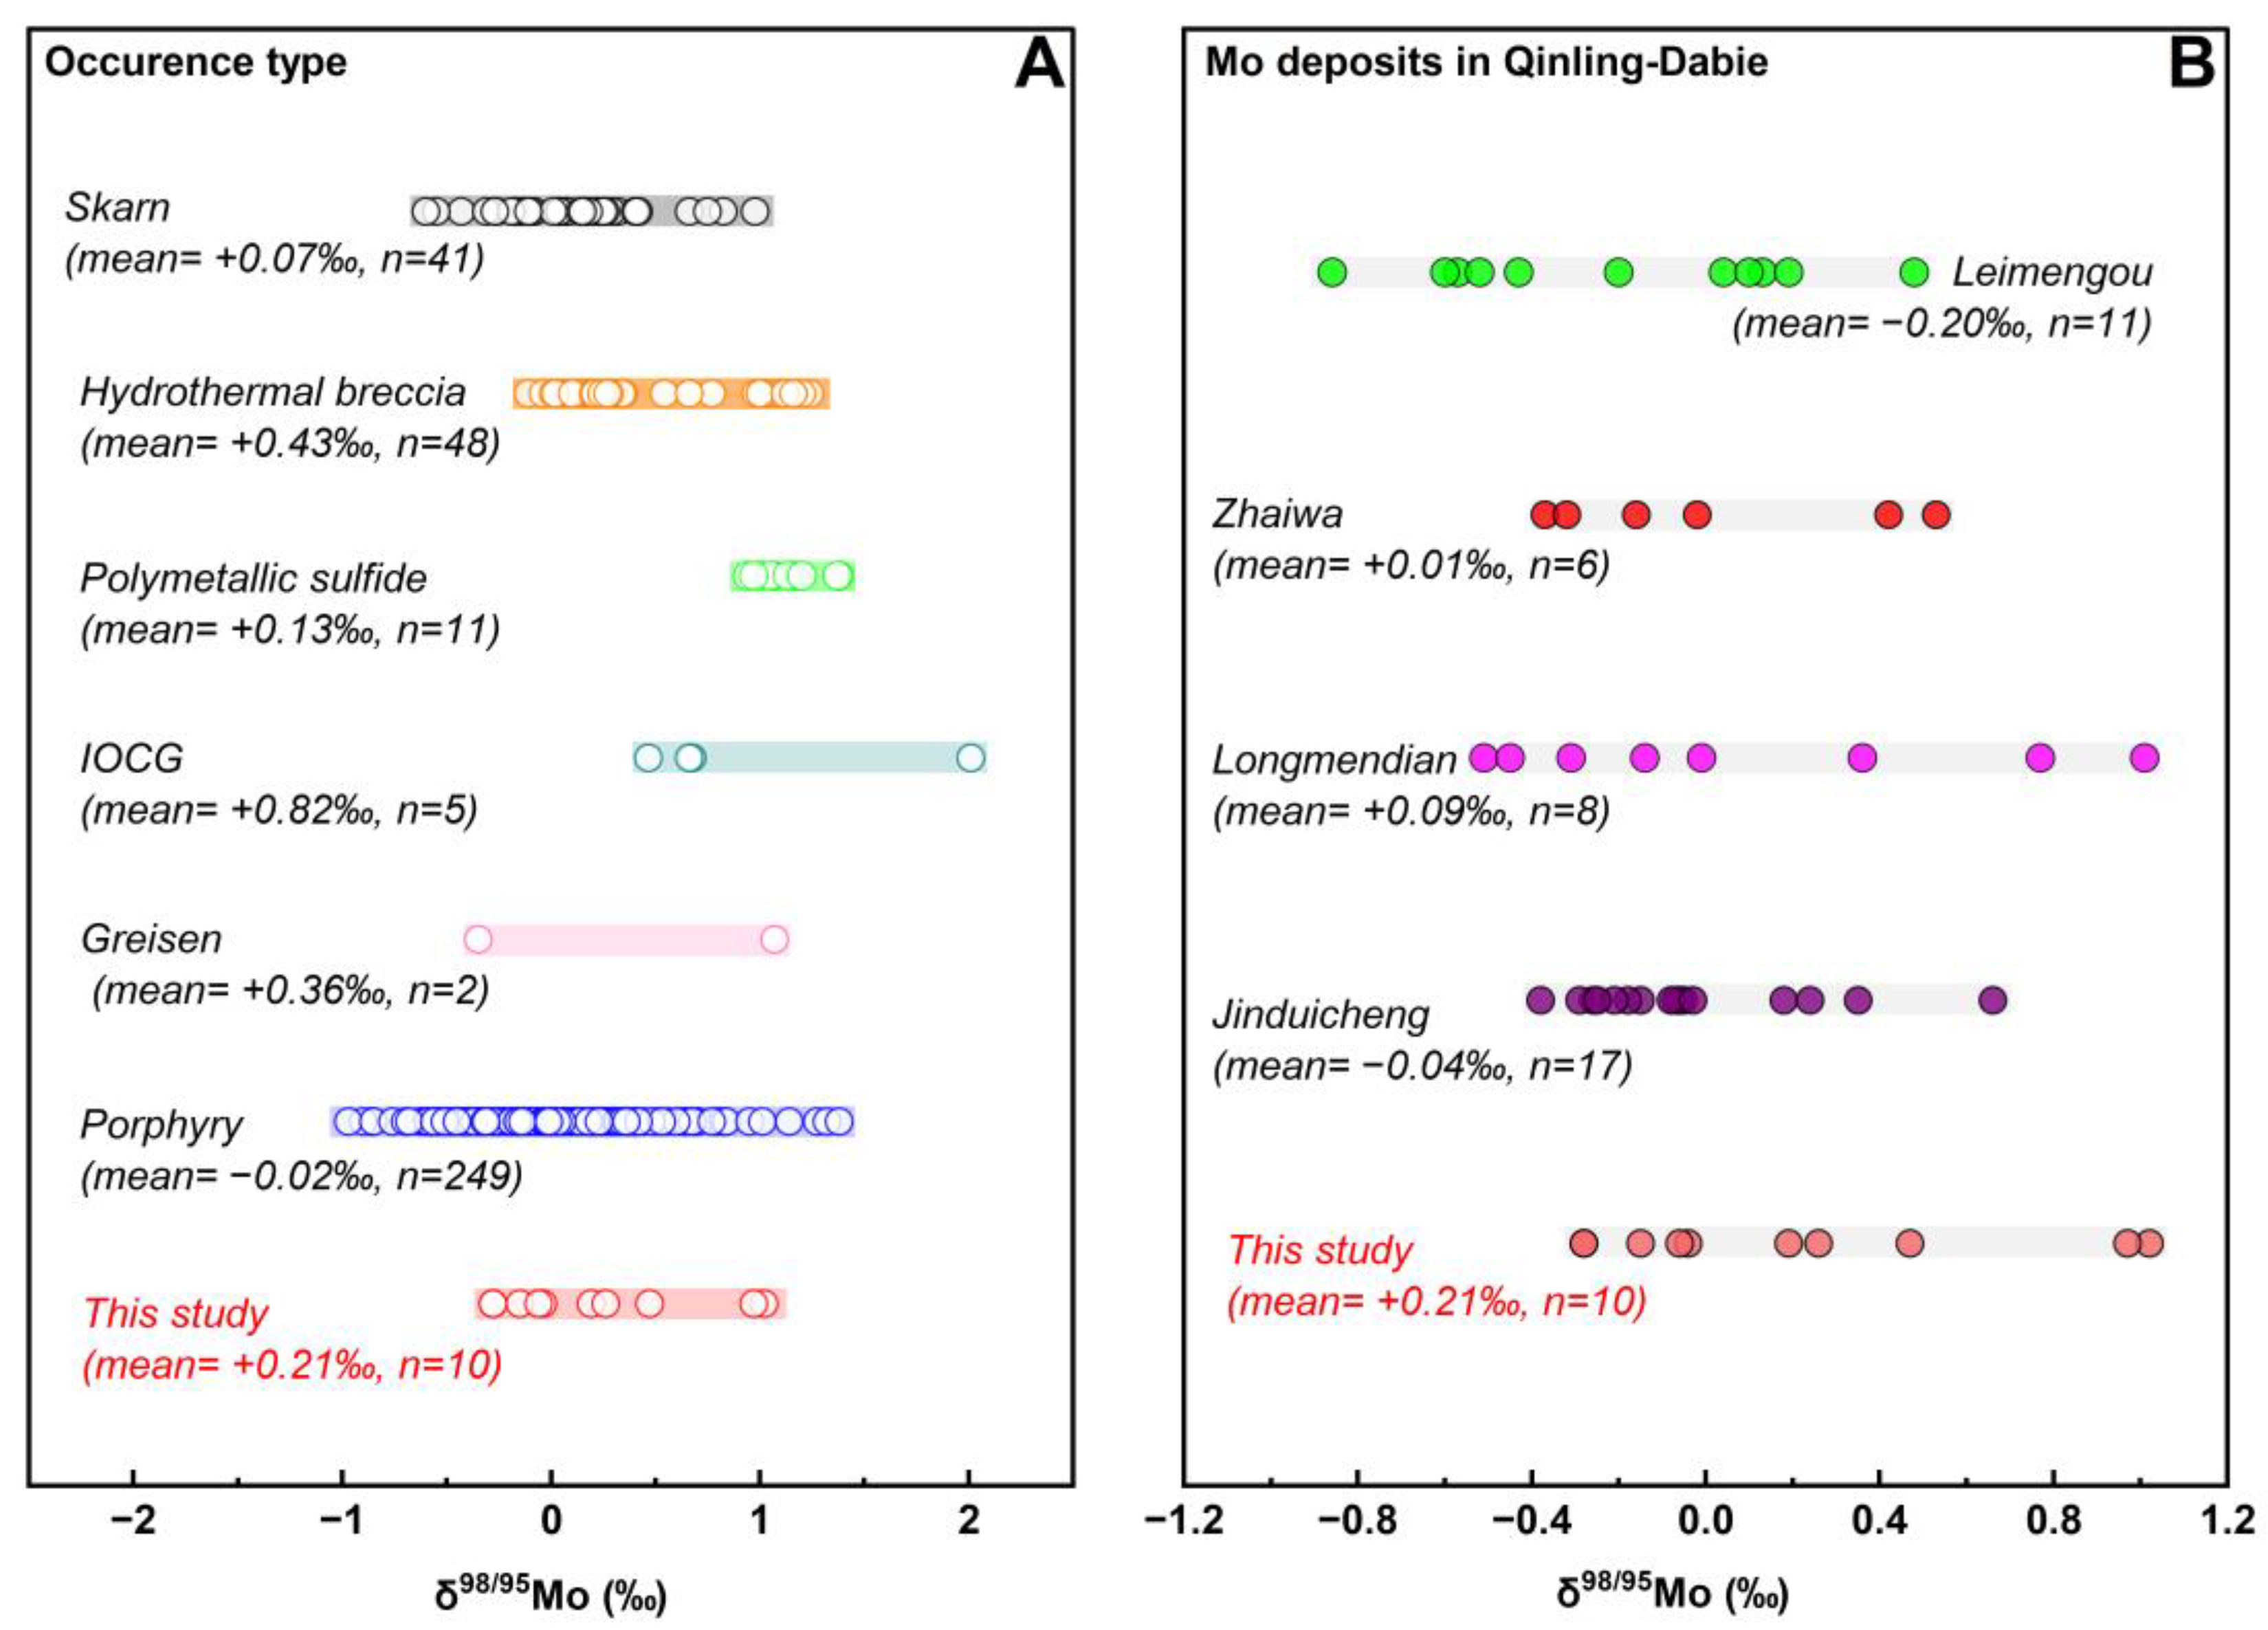
Molybdenite δ98/95Mo values range from −0.28‰ to +1.02‰, with an average of +0.21 ± 0.45‰ (Table 1). Compared with molybdenite from other types of hydrothermal deposits, the Mo isotopic compositions of Shapinggou molybdenite fall mainly within the range of porphyry deposits and partly overlap with those of hydrothermal breccia, polymetallic sulfide, and skarn deposits (Figure 6A). Compared with molybdenite from other porphyry Mo deposits in the Qinling–Dabie metallogenic belt, Shapinggou molybdenite shows partly overlapping δ98/95Mo values, but is characterized by a higher mean value and overall heavier Mo isotopic compositions (Figure 6B).

5. Discussion

5.1. Correlation Between Re Concentrations and Molybdenite Polytypes

Natural molybdenite mainly occurs as the 2H, 3R, and 2H + 3R polytypes, of which the 3R polytype is relatively rare [17,18]. The relationship between molybdenite polytype and Re content has been discussed extensively but remains controversial. From a crystal-chemical perspective, ideal molybdenite consists only of Mo (59.9%) and S (40.1%), and elements such as Re are regarded as impurities [3,53]. Some studies have suggested that 3R molybdenite tends to contain higher Re contents than 2H molybdenite [17,18,71]. However, other studies have shown that high Re contents can also occur in 2H molybdenite or in mixed 2H + 3R molybdenite [19,72,73,74].
XRD patterns of ten molybdenite samples from the Shapinggou porphyry Mo deposit all correspond to the 2H polytype (Figure 4). Re contents range from 1.13 ppm to 23.59 × ppm, with an average of 8.56 ppm, and show no systematic relationship with molybdenite polytype (Figure 4; Table 1). Recent microanalytical work on molybdenite from the Longmendian deposit in the same metallogenic belt likewise showed that Re-rich and Re-poor domains are unrelated to polytype and that Re-enriched domains are mainly associated with deformation in molybdenite [19]. In contrast, studies of the Dexing ore field showed that 3R polytypes and disordered stacking domains are more developed in molybdenite samples with higher Re contents [3]. This relationship, however, cannot be simply taken to indicate that polytype controls Re enrichment, because it is also affected by nonequilibrium crystallization, impurity contents of the ore-forming fluid, and cooling and crystallization rates [3]. Molybdenite polytypes are therefore best interpreted as indicators of crystallization conditions and subsequent evolution, rather than as direct controls on Re enrichment. Instead, Re enrichment is more likely governed by the physicochemical conditions of the ore-forming fluid, with polytype variations representing an associated response to the same process. Furthermore, molybdenite from the Shapinggou deposit is uniformly characterized by the 2H polytype, indicating that polytypism was not a key factor controlling Re enrichment in this deposit.

5.2. Mo Isotope Fractionation in the Shapinggou Porphyry Mo Deposit

Previous studies have systematically investigated the mechanisms of Mo isotope fractionation in molybdenite and have summarized the major controlling factors [58,59,64,65,66,67,68,69,70,75]. Due to phase separation during sulfide precipitation, the Rayleigh fractionation model was proposed to explain Mo isotopic variation in molybdenite [58]. Hannah et al. [58] analyzed the Mo isotopic compositions of 20 molybdenite samples and suggested that the observed variations could be explained by vapor transport and Rayleigh distillation. They further proposed that the average Mo isotopic composition of molybdenite from a single deposit may approximate that of the bulk continental crust [58]. Rayleigh fractionation has since been widely invoked to account for the Mo isotopic variations observed in molybdenite from porphyry deposits. For example, Rayleigh fractionation has been identified as an important control on Mo isotope variations in molybdenite from several porphyry systems, including the Kerman porphyry Cu system in Iran, the Dahutang W–Cu–Mo ore field in China, and the Qulong and Yulong porphyry Cu–Mo deposits [66,67,68,75]. In these systems, Rayleigh fractionation operated during the evolution of the whole deposit or within individual mineralization stages [66,67,68,75]. However, some studies have suggested that molybdenite precipitation does not cause significant Mo isotope fractionation due to homogeneous Mo isotope compositions in molybdenites. Wang et al. [65] reported near-identical Mo isotopic compositions for quartz veins and coexisting molybdenite from the Jigongcun deposit in the Gangdese metallogenic belt and proposed that the Mo isotopic composition of molybdenite preserves the isotopic signature of the magmatic source. In addition, the redox state of Mo in magmatic–hydrothermal systems, changes in its coordination environment, and fluid boiling (phase separation) are also factors controlling Mo isotope fractionation in molybdenite [24,63,66,67,75,76]. During fluid boiling, heavier Mo isotopes preferentially partition into the vapor phase, whereas lighter Mo isotopes become enriched in the residual fluid. As a result, molybdenite precipitated from the residual fluid tends to show progressively lighter Mo isotopic compositions during magmatic–hydrothermal evolution [24,66,67,75]. Therefore, the Mo isotopic composition of molybdenite in different deposits should be evaluated together with the mineralization stage and fluid evolution.
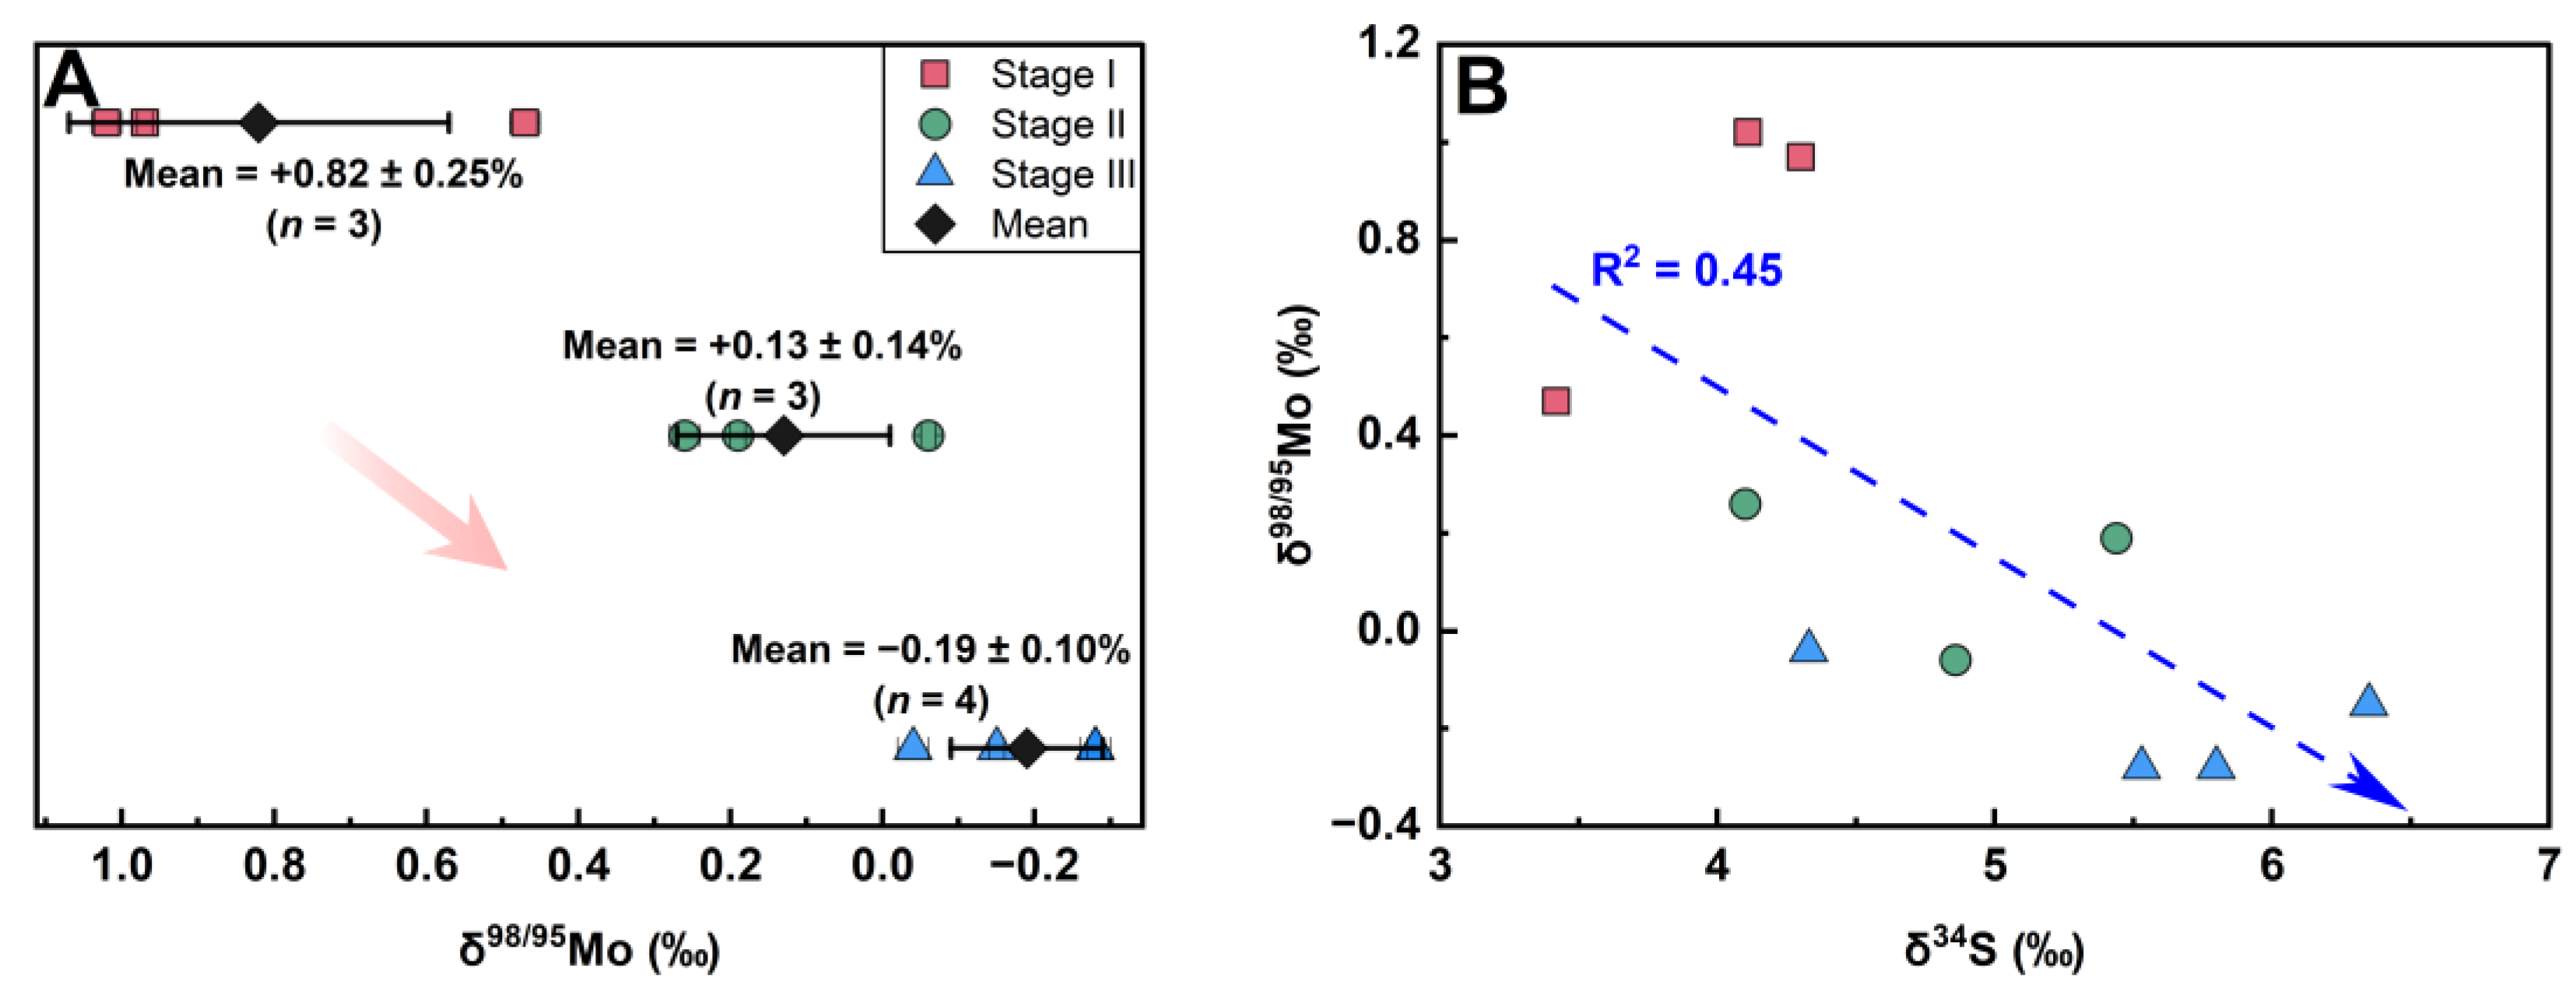
In the Shapinggou deposit, molybdenite δ98/95Mo values become progressively lighter from stage I to stage III (Figure 7A). Shafiei et al. [66] proposed that late 3R molybdenite preferentially incorporates lighter Mo isotopes than early 2H molybdenite, resulting in progressively lighter Mo isotopic compositions from early to late stages. This polytype-controlled fractionation was attributed to molecular vibration theory [66,77]. According to this interpretation, heavier Mo isotopes (e.g., 98Mo) are preferentially partitioned into the denser crystal structure because the vibrational frequencies of Mo–S bonds in a more compact lattice lead to a higher zero-point energy difference, favoring the incorporation of heavier isotopes into the solid phase with stronger bonding environments [66,77]. The 2H (hexagonal) polytype of molybdenite has a denser crystal structure than the 3R (rhombohedral) polytype; therefore, early-formed 2H molybdenite tends to incorporate relatively heavier Mo isotopes, yielding higher δ98/95Mo values, whereas later-formed 3R molybdenite preferentially takes up lighter Mo isotopes, resulting in lower δ98/95Mo values [66,77]. However, XRD analyses in this study demonstrate that all molybdenite samples from the Shapinggou porphyry Mo deposit belong exclusively to the 2H polytype, with no detectable 3R component. Therefore, polytype differences cannot explain the progressively lighter Mo isotopic compositions from the early to the late stages. This trend is more consistent with Mo isotope fractionation during fluid boiling (Figure 7A) [67].
The δ34S values of molybdenite from the Shapinggou deposit fall within the range of typical porphyry Mo deposits in the Qinling–Dabie orogenic belt. Although S isotopic compositions of porphyry Mo deposits vary among different metallogenic belts, the δ34S values of nearly all porphyry Mo deposits fall within the typical magmatic-hydrothermal range of ±5‰ (Figure 5) [56,57]. Previous studies have shown that during Rayleigh fractionation, S and Mo isotopes in molybdenite generally exhibit a positive correlation [58,78]. In contrast, molybdenite δ98/95Mo and δ34S values show a negative correlation (Figure 7B). This pattern is consistent with Mo isotope fractionation during fluid boiling, with heavier Mo isotopes preferentially entering the vapor phase, and the residual fluid becomes progressively lighter [67]. In magmatic–hydrothermal fluids, sulfur isotope evolution is mainly controlled by the SO42−/H2S ratio [79]. Boiling can drive the continuous loss of H2S and CO2 from the hydrothermal fluid and markedly modify fluid chemistry [80]. Due to gaseous H2S being relatively enriched in light sulfur isotopes, continued loss of light sulfur may result in progressively higher δ34S values in the residual fluid and in subsequently precipitated sulfides [81]. Fluid inclusion studies of the Shapinggou deposit provide further support for this interpretation. Previous work identified widespread CO2-bearing three-phase inclusions and daughter mineral-bearing inclusions, indicating that multiple episodes of fluid boiling occurred in the hydrothermal system [37]. Therefore, Mo isotope fractionation in molybdenite from the Shapinggou deposit is attributed to fluid boiling. This is consistent with the fractionation mechanism recognized in the Jinduicheng deposit from the same metallogenic belt [24].

5.3. Re Enrichment Driven by Fluid Boiling

Fluid boiling is an important mechanism for metal precipitation in porphyry deposits [31,32,33,34,35] and has also been regarded as a key process controlling Re enrichment in molybdenite [24]. In the Jinduicheng deposit, Ma et al. [24] interpreted the negative correlation between Re contents and Mo isotopic compositions in molybdenite as evidence that fluid boiling controlled Re enrichment. During boiling-induced vapor–liquid separation, lighter Mo isotopes were preferentially partitioned into the vapor phase, driving the residual fluid toward lighter Mo isotopic compositions. At the same time, Re was redistributed into both the vapor and residual liquid. Thermodynamic calculations further suggested that, in the vapor phase, Re precipitated later than Mo during cooling, whereas in the residual liquid, continued boiling increased salinity, enhanced Re mobility, and promoted continued Re transport in the liquid phase. Consequently, Re enrichment in molybdenite was considered to reflect the combined contribution of both vapor and residual liquid during fluid boiling [24].
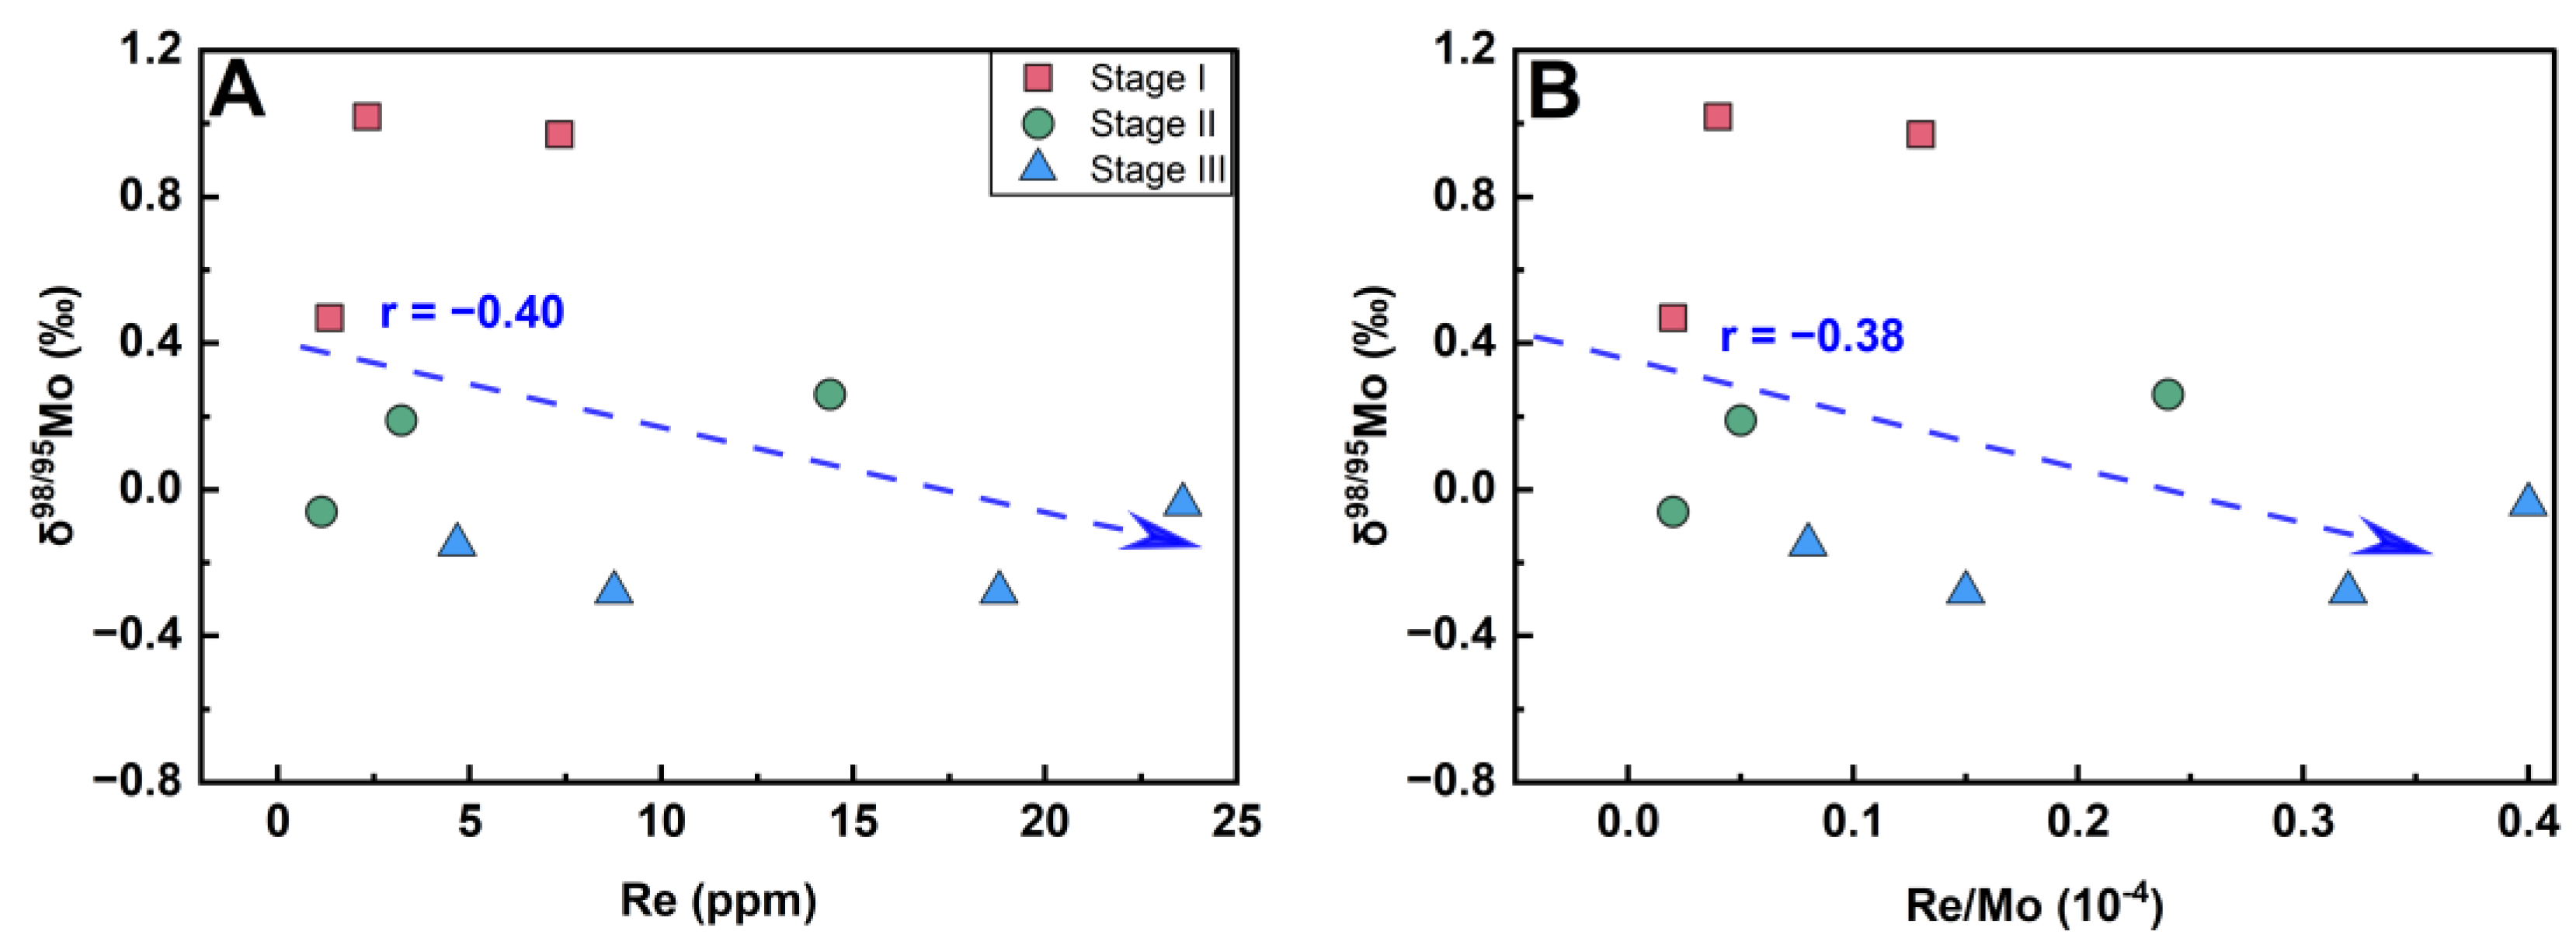
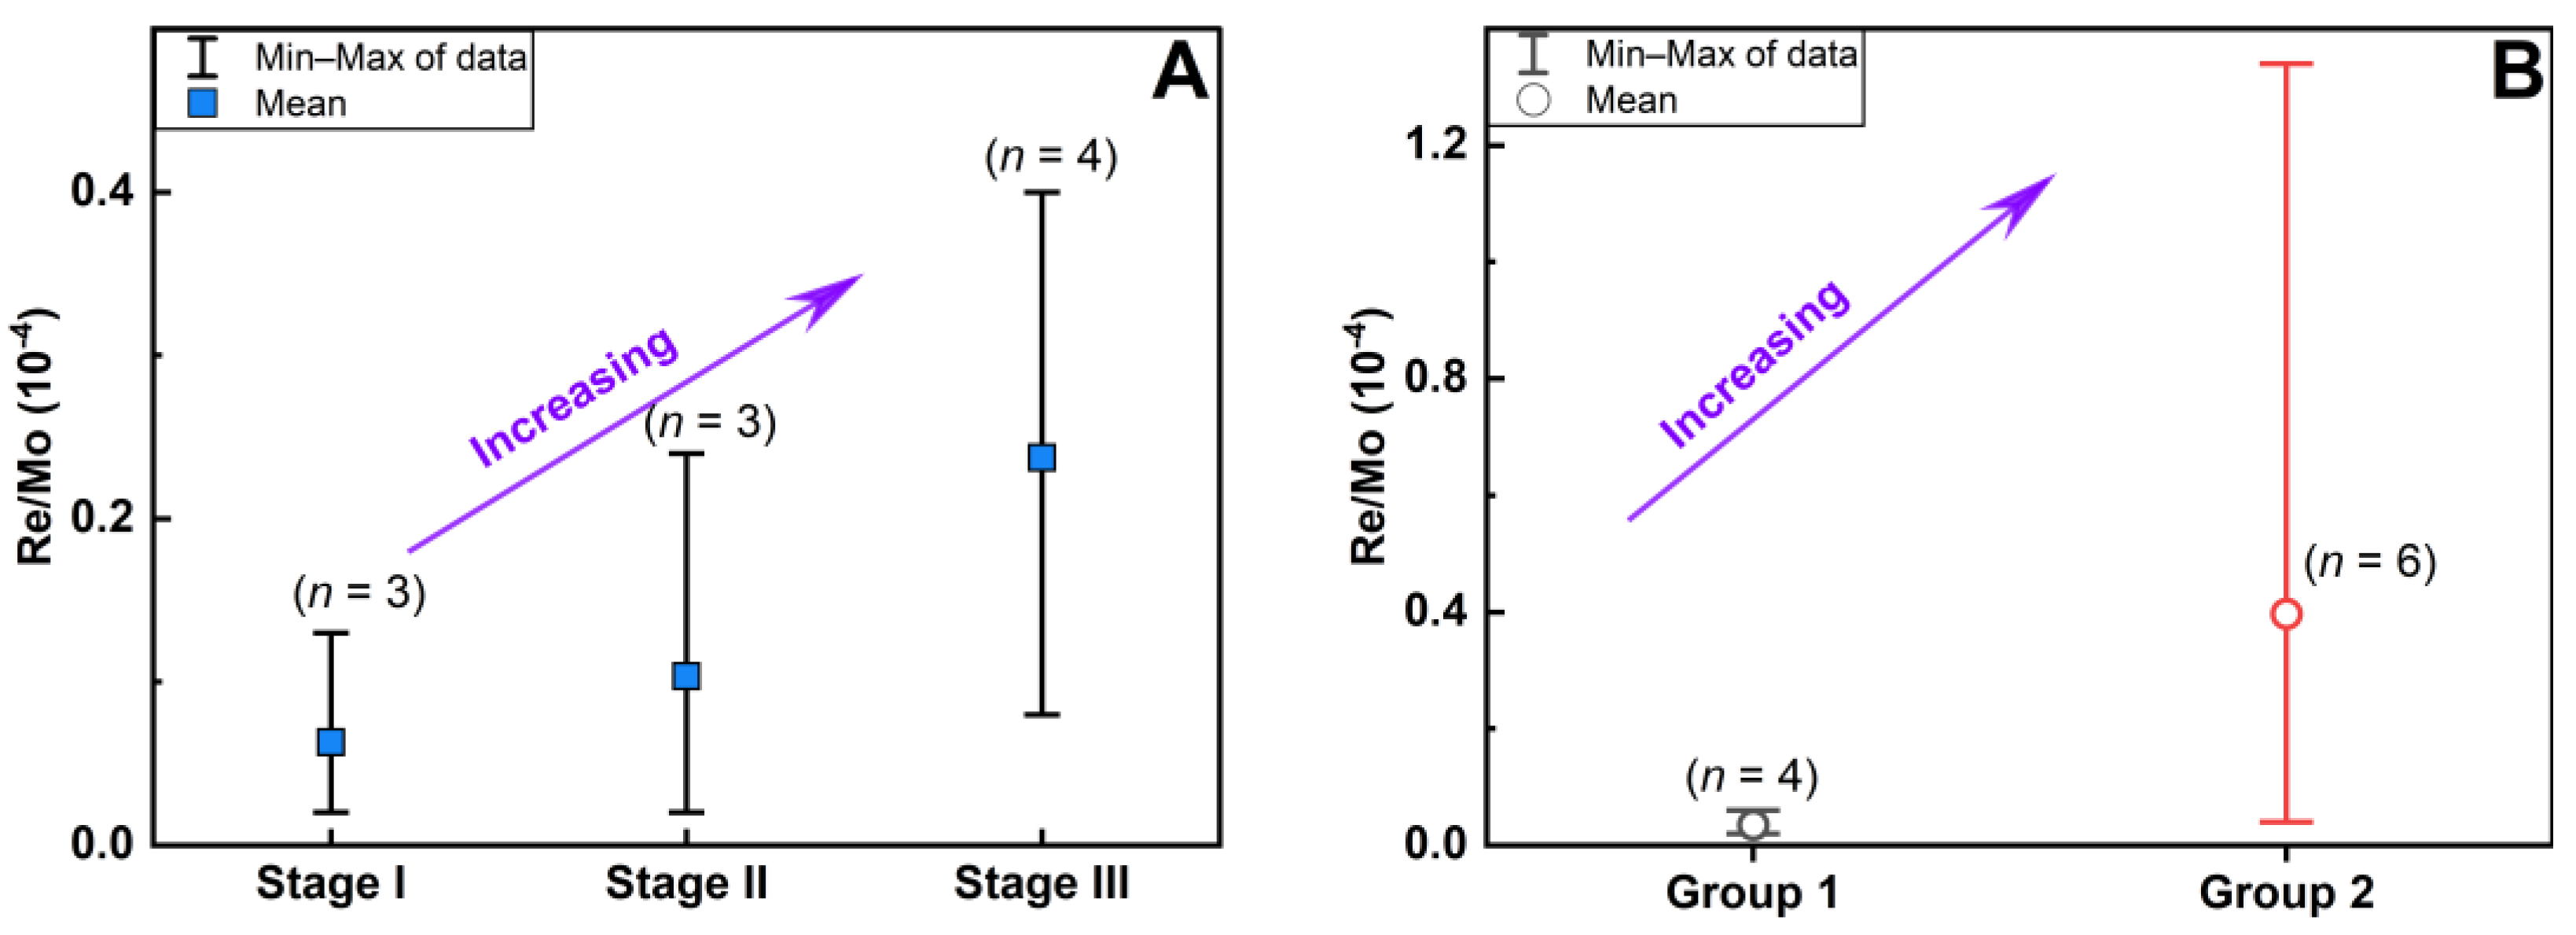
Early studies of volcanic gases demonstrated that both Re and Mo can be transported in the vapor phase and that Re preferentially enters the vapor phase relative to Mo [82,83]. Recently, Mo isotope data and thermodynamic simulations for the Jinduicheng porphyry Mo deposit showed that fluid boiling can drive the vapor-phase transport of both Re and Mo and that during subsequent cooling, Re precipitates later than Mo from the vapor phase, thereby producing Re-rich molybdenite in the late stage [24]. A similar negative correlation between Mo isotopic compositions and Re contents is observed in molybdenite from the Shapinggou deposit, indicating that Re enrichment in this deposit followed a pattern similar to that of the Jinduicheng deposit and was controlled by fluid boiling (Figure 8). In addition, Mo mineralization in porphyry Mo deposits is mainly derived from the liquid phase [67]. Higher Cl concentrations in ore-forming fluids enhance the mobility of Re and thus promote its enrichment in late-stage molybdenite [21,84]. As discussed above, the Shapinggou deposit experienced multiple episodes of fluid boiling during mineralization, resulting in pronounced changes in fluid salinity. The early ore-forming fluid had relatively low salinities of 7.9–16.9 wt.% NaCl eq., whereas continued boiling and phase separation increased salinity to 34.1–50.9 wt.% NaCl eq. [37]. In addition, abundant two-phase liquid-rich inclusions and two- or three-phase gas-rich inclusions developed during the Mo mineralization stage [37]. Elevated salinity enhances the mobility of Re in hydrothermal fluids, thereby promoting higher Re contents in late-stage molybdenite [21,84]. In this study, molybdenite Re/Mo ratios increase from the early to late stages (Figure 9A). A similar increasing trend was also reported in previous studies of the Shapinggou deposit (Figure 9B) [22]. Consistent with our observations, Mo mineralization in those studies was likewise restricted to the first three mineralization stages, and the analyzed molybdenite samples were subdivided into early and late groups [22]. The early group is associated with early potassic–silicic alteration (Group 1), whereas the late group is associated with silicic–sericitic alteration (Group 2) [22]. Because Re/Mo ratios in molybdenite can reflect changes in the relative enrichment of Re and Mo in the ore-forming fluid, the observed increase suggests that the fluid salinity may have increased during hydrothermal evolution. Higher salinity, and thus higher Cl concentrations, could suppress the role of hydroxyl complexes in Mo transport and reduce Mo mobility as hydroxyl complexes, thereby increasing the Re/Mo ratio of the fluid and favoring the formation of relatively Re-rich molybdenite [53,85].
Therefore, Re enrichment in molybdenite from the Shapinggou deposit was controlled by fluid boiling. This is consistent with the Re enrichment mechanism recognized in the Jinduicheng deposit, where fluid boiling promoted preferential partitioning of Re into the vapor phase and increased the salinity of the residual fluid, thereby enhancing Re transport and leading to higher Re contents in late-stage molybdenite (Stage III).

6. Conclusions

In this study, we integrate newly acquired molybdenite polytype, Mo–S isotope, and Re concentration data with published fluid inclusion constraints to assess how fluid boiling contributed to Re enrichment in the Shapinggou porphyry Mo deposit. The main conclusions are as follows.
(1)
Molybdenite from the Shapinggou deposit is uniformly of the 2H polytype, and the molybdenite polytype shows no relationship with Re content.
(2)
Molybdenite from the Shapinggou deposit has δ98/95Mo values of −0.28‰ to +1.02‰ and shows progressively lighter Mo isotopic compositions from the early to the late stages, consistent with fractionation controlled by fluid boiling, which may also be one of the factors controlling Re contents in Dabie-type porphyry Mo deposits.
(3)
The negative correlation between molybdenite δ98/95Mo values and Re contents indicates that Re enrichment in the Shapinggou porphyry Mo deposit was controlled by fluid boiling through coupled enrichment of Re in both the vapor phase and the residual fluid phase.

Author Contributions

Conceptualization, W.M. and Y.C.; methodology, W.M.; software, W.M. and X.C.; validation, W.M. and X.C.; formal analysis, W.M.; investigation, W.M.; data curation, W.M. and X.C.; writing—original draft preparation, W.M.; writing—review and editing, W.M., X.C. and Y.C.; visualization, W.M.; supervision, X.C., Y.C. and D.J.; project administration, Y.C. and D.J.; funding acquisition, Y.C. and D.J. All authors have read and agreed to the published version of the manuscript.

Funding

This research was funded by the Deep Earth Probe and Mineral Resources Exploration—National Science and Technology Major Project (Grant No. 2025ZD1007707), the Major Special Science and Technology Project of Gansu Province (Grant No. 26ZDFF001) and The Northwest China Science and Technology Innovation Fundation (Grant No. XBKC2025-PY37).

Data Availability Statement

Data is contained within the article.

Conflicts of Interest

The authors declare no conflicts of interest.

References

  1. John, D.A.; Seal, R.R., II; Polyak, D.E. Rhenium. In Critical Mineral Resources of the United States—Economic and Environmental Geology and Prospects for Future Supply; Schulz, K.J., DeYoung, J.H., Jr., Seal, R.R., II, Bradley, D.C., Eds.; U.S. Geological Survey: Reston, VA, USA, 2017; Chapter P. [Google Scholar]
  2. Tabelin, C.B.; Park, I.; Phengsaart, T.; Jeon, S.; Villacorte-Tabelin, M.; Alonzo, D.; Yoo, K.; Ito, M.; Hiroyoshi, N. Copper and critical metals production from porphyry ores and e-wastes: A review of resource availability, processing/recycling challenges, socio-environmental aspects, and sustainability issues. Resour. Conserv. Recycl. 2021, 170, 105610. [Google Scholar]
  3. Ren, Z.; Leng, C.-B.; Yang, Y.; Chen, J.; Wang, A.; Wang, S. Microstructure and trace element occurrence in molybdenite (MoS2) from the Dexing ore field: Implications for the differential enrichment of rhenium. Ore Geol. Rev. 2025, 177, 106473. [Google Scholar] [CrossRef] [Scilit]
  4. Sun, W.; Bennett, V.C.; Eggins, S.M.; Kamenetsky, V.S.; Arculus, R.J. Enhanced mantle-to-crust rhenium transfer in undegassed arc magmas. Nature 2003, 422, 294–297. [Google Scholar] [PubMed]
  5. Palme, H.; O’Neill, H.S.C. Cosmochemical estimates of mantle composition. In Treatise on Geochemistry; Elsevier: Amsterdam, The Netherlands, 2003; Volume 2, p. 568. [Google Scholar]
  6. Rudnick, R.L.; Gao, S. Composition of the continental crust. In Treatise on Geochemistry, 2nd ed.; Holland, H.D., Turekian, K.K., Eds.; Elsevier: Oxford, UK, 2014; pp. 1–51. [Google Scholar]
  7. Yan, L.; Fan, Y.; Huang, J.; Li, Y.; Zhou, T.; Zuo, T.; Zhang, Y.; Xu, G. Occurrence state and enrichment mechanism of rhenium in molybdenite from the Merlin deposit, Australia. Ore Geol. Rev. 2023, 162, 105693. [Google Scholar] [CrossRef] [Scilit]
  8. Werner, T.T.; Mudd, G.M.; Jowitt, S.M.; Huston, D. Rhenium mineral resources: A global assessment. Resour. Policy 2023, 82, 103441. [Google Scholar] [CrossRef] [Scilit]
  9. Barton, I.F.; Rathkopf, C.A.; Barton, M.D. Rhenium in molybdenite: A database approach to identifying geochemical controls on the distribution of a critical element. Min. Metall. Explor. 2020, 37, 21–37. [Google Scholar]
  10. Falkenberg, J.J.; Keith, M.; Melfos, V.; Hohl, M.; Haase, K.M.; Voudouris, P.; Höss, A.; Wenske, J.; Klemd, R.; Beier, C.; et al. Insights into fluid evolution and Re enrichment by mineral micro-analysis and fluid inclusion constraints: Evidence from the Maronia Cu–Mo ± Re ± Au porphyry system in NE Greece. Miner. Depos. 2024, 59, 1407–1431. [Google Scholar]
  11. Mao, J.; Zhang, Z.; Zhang, Z.; Du, A. Re–Os isotopic dating of molybdenites in the Xiaoliugou W (Mo) deposit in the northern Qilian Mountains and its geological significance. Geochim. Cosmochim. Acta 1999, 63, 1815–1818. [Google Scholar]
  12. Stein, H.J.; Markey, R.J.; Morgan, J.W.; Hannah, J.L.; Scherstén, A. The remarkable Re–Os chronometer in molybdenite: How and why it works. Terra Nova 2001, 13, 479–486. [Google Scholar] [CrossRef] [Scilit]
  13. Zhang, J.; Shu, Q. Rhenium in molybdenite from Mo (–Cu) deposits in northeastern China. J. Geochem. Explor. 2025, 275, 107769. [Google Scholar] [CrossRef] [Scilit]
  14. Sun, W.; Li, C.; Hao, X.; Ling, M.; Ireland, T.; Ding, X.; Fan, W. Oceanic anoxic events, subduction style and molybdenum mineralization. Solid Earth Sci. 2016, 1, 64–73. [Google Scholar] [CrossRef] [Scilit]
  15. Xue, Q.; Zhang, L.; Chen, S.; Guo, K.; Li, T.; Han, Z.; Sun, W. Tracing black shales in the source of a porphyry Mo deposit using molybdenum isotopes. Geology 2023, 51, 688–692. [Google Scholar] [CrossRef] [Scilit]
  16. McCandless, T.E.; Ruiz, J.; Campbell, A.R. Rhenium behavior in molybdenite in hypogene and near-surface environments: Implications for Re–Os geochronometry. Geochim. Cosmochim. Acta 1993, 57, 889–905. [Google Scholar]
  17. Newberry, R.J. Polytypism in molybdenite (I): A non-equilibrium impurity-induced phenomenon. Am. Mineral. 1979, 64, 758–767. [Google Scholar]
  18. Newberry, R.J. Polytypism in molybdenite (II): Relationships between polytypism, ore deposition/alteration stages and rhenium contents. Am. Mineral. 1979, 64, 768–775. [Google Scholar]
  19. Tan, M.; Yang, Y.; Huang, X.-W.; Xi, J.; Li, N.; Meng, Y.-M.; Qi, L. Rhenium residency in molybdenite, compressional textures and relationship to polytypism. Geochim. Cosmochim. Acta 2025, 389, 59–73. [Google Scholar]
  20. Xiong, Y.; Wood, S.A. Experimental determination of the hydrothermal solubility of ReS2 and the Re–ReO2 buffer assemblage and transport of rhenium under supercritical conditions. Geochem. Trans. 2002, 3, 1–10. [Google Scholar] [PubMed]
  21. Xiong, Y.; Wood, S.; Kruszewski, J. Hydrothermal transport and deposition of rhenium under subcritical conditions revisited. Econ. Geol. 2006, 101, 471–478. [Google Scholar] [CrossRef] [Scilit]
  22. Ren, Z.; Zhou, T.; Hollings, P.; White, N.C.; Wang, F.; Yuan, F. Trace element geochemistry of molybdenite from the Shapinggou super-large porphyry Mo deposit, China. Ore Geol. Rev. 2018, 95, 1049–1065. [Google Scholar] [CrossRef] [Scilit]
  23. McFall, K.; Roberts, S.; McDonald, I.; Boyce, A.J.; Naden, J.; Teagle, D. Rhenium enrichment in the Muratdere Cu–Mo (Au–Re) porphyry deposit, Turkey: Evidence from stable isotope analyses (δ34S, δ18O, δD) and laser ablation-inductively coupled plasma-mass spectrometry analysis of sulfides. Econ. Geol. 2019, 114, 1443–1466. [Google Scholar]
  24. Ma, W.; Wen, H.; Zhou, Z.; Xu, F.; Zhu, C.; Xu, L. Vapor phase facilitated rhenium enrichment in porphyry Mo deposit: Insights from thermodynamic simulations and molybdenum isotopes at Jinduicheng deposit, central China. J. Geochem. Explor. 2026, 286, 108057. [Google Scholar] [CrossRef] [Scilit]
  25. Lawley, C.J.M.; Richards, J.P.; Anderson, R.G.; Creaser, R.A.; Heaman, L.M. Geochronology and Geochemistry of the MAX Porphyry Mo Deposit and Its Relationship to Pb-Zn-Ag Mineralization, Kootenay Arc, Southeastern British Columbia, Canada. Econ. Geol. 2010, 105, 1113–1142. [Google Scholar]
  26. Selby, D.; Nesbitt, B.E.; Muehlenbachs, K.; Prochaska, W. Hydrothermal Alteration and Fluid Chemistry of the Endako Porphyry Molybdenum Deposit, British Columbia. Econ. Geol. 2000, 95, 183–202. [Google Scholar] [CrossRef] [Scilit]
  27. Seedorff, E.; Einaudi, M.T. Henderson Porphyry Molybdenum System, Colorado: I. Sequence and Abundance of Hydrothermal Mineral Assemblages, Flow Paths of Evolving Fluids, and Evolutionary Style. Econ. Geol. 2004, 99, 3–37. [Google Scholar] [CrossRef] [Scilit]
  28. Mi, M.; Chen, Y.-J.; Yang, Y.-F.; Wang, P.; Li, F.-L.; Wan, S.-Q.; Xu, Y.-L. Geochronology and Geochemistry of the Giant Qian’echong Mo Deposit, Dabie Shan, Eastern China: Implications for Ore Genesis and Tectonic Setting. Gondwana Res. 2015, 27, 1217–1235. [Google Scholar]
  29. Mi, M.; Li, C.; Sun, W.; Li, D.; Zhu, C. Yaochong Mo Deposit, a Low-F Porphyry Mo Deposit from the Qinling-Dabie Orogenic Belt. Ore Geol. Rev. 2017, 88, 188–200. [Google Scholar]
  30. Chen, Y.-J.; Wang, P.; Li, N.; Yang, Y.-F.; Pirajno, F. The Collision-Type Porphyry Mo Deposits in Dabie Shan, China. Ore Geol. Rev. 2017, 81, 405–430. [Google Scholar] [CrossRef] [Scilit]
  31. Sillitoe, R.H. Porphyry copper systems. Econ. Geol. 2010, 105, 3–41. [Google Scholar] [CrossRef] [Scilit]
  32. Richards, J.P. Magmatic to hydrothermal metal fluxes in convergent and collided margins. Ore Geol. Rev. 2011, 40, 1–26. [Google Scholar] [CrossRef] [Scilit]
  33. Wilkinson, J.J. Triggers for the formation of porphyry ore deposits in magmatic arcs. Nat. Geosci. 2013, 6, 917–925. [Google Scholar] [CrossRef] [Scilit]
  34. Cooke, D.R.; Baker, M.; Hollings, P.; Sweet, G.; Chang, Z.; Danyushevsky, L.; Gilbert, S.; Zhou, T.; White, N.C.; Gemmell, J.B.; et al. New advances in detecting the distal geochemical footprints of porphyry systems—Epidote mineral chemistry as a tool for vectoring and fertility assessments. In Building Exploration Capability for the 21st Century; Kelley, K.D., Golden, H.C., Eds.; Society of Economic Geologists: Littleton, CO, USA, 2014; Volume 18. [Google Scholar]
  35. Chiaradia, M.; Caricchi, L. Stochastic modelling of deep magmatic controls on porphyry copper deposit endowment. Sci. Rep. 2017, 7, 44523. [Google Scholar] [CrossRef] [Scilit] [PubMed]
  36. Jiang, Z.-Q.; Shang, L.-B.; Williams-Jones, A.E.; Wang, X.-S.; Zhang, L.; Ni, H.-W.; Hu, R.-Z.; Bi, X.-W. The role of CO2 in the genesis of Dabie-type porphyry molybdenum deposits. Nat. Commun. 2024, 15, 4849. [Google Scholar] [CrossRef] [Scilit] [PubMed]
  37. Ni, P.; Wang, G.-G.; Yu, W.; Chen, H.; Jiang, L.-L.; Wang, B.-H.; Zhang, H.-D.; Xu, Y.-F. Evidence of fluid inclusions for two stages of fluid boiling in the formation of the giant Shapinggou porphyry Mo deposit, Dabie orogen, central China. Ore Geol. Rev. 2015, 65, 1078–1094. [Google Scholar] [CrossRef] [Scilit]
  38. Candela, P.A.; Holland, H.D. A Mass Transfer Model for Copper and Molybdenum in Magmatic Hydrothermal Systems; the Origin of Porphyry-Type Ore Deposits. Econ. Geol. 1986, 81, 1–19. [Google Scholar] [CrossRef] [Scilit]
  39. Seedorff, E.; Dilles, J.H.; Proffett, J.M., Jr.; Einaudi, M.T.; Zurcher, L.; Stavast, W.J.A.; Johnson, D.A.; Barton, M.D. Porphyry Deposits: Characteristics and Origin of Hypogene Features. In One Hundredth Anniversary Volume; Society of Economic Geologists: Littleton, CO, USA, 2005. [Google Scholar]
  40. Mao, J.W.; Xie, G.Q.; Bierlein, F.; Qü, W.J.; Du, A.D.; Ye, H.S.; Pirajno, F.; Li, H.M.; Guo, B.J.; Li, Y.F.; et al. Tectonic implications from Re–Os dating of Mesozoic molybdenum deposits in the East Qinling–Dabie orogenic belt. Geochim. Cosmochim. Acta 2008, 72, 4607–4626. [Google Scholar]
  41. Mao, J.W.; Pirajno, F.; Xiang, J.F.; Gao, J.J.; Ye, H.S.; Li, Y.F.; Guo, B.J. Mesozoic molybdenum deposits in the East Qinling–Dabie orogenic belt: Characteristics and tectonic settings. Ore Geol. Rev. 2011, 43, 264–293. [Google Scholar] [CrossRef] [Scilit]
  42. He, T.; Yang, X.; Deng, J.; Zhang, H.; Zha, S.; Li, C.; Zhang, H. Geochronology, geochemistry and Hf–Sr–Nd isotopes of the ore-bearing syenite from the Shapinggou porphyry Mo deposit, East Qinling-Dabie orogenic belt. Solid Earth Sci. 2016, 1, 101–117. [Google Scholar]
  43. Liu, X.; Yan, J.; Wang, A.; Li, Q.; Xie, J. Origin of the Cretaceous ore-bearing granitoids in the Beihuaiyang zone, northern margin of the Dabie orogen, eastern China. Int. Geol. Rev. 2018, 60, 1453–1478. [Google Scholar]
  44. Ren, Z.; Zhou, T.; Hollings, P.; White, N.C. Magmatism in the Shapinggou district of the Dabie orogen, China: Implications for the formation of porphyry Mo deposits in a collisional orogenic belt. Lithos 2018, 308–309, 346–363. [Google Scholar] [CrossRef] [Scilit]
  45. Zhang, D.; Wei, J.; Nadeau, O.; Shi, W.; Dan, K. Magmatic and hydrothermal evolution at Qian’echong, central-eastern China: Insights into Dabie-type porphyry Mo mineralization. J. Petrol. 2022, 63, egac013. [Google Scholar]
  46. Ren, Z.; Zhou, T.; Yuan, F.; Zhang, H. Characteristics of the metallogenic system of the Shapinggou super-large porphyry molybdenum deposit in the Dabie orogenic belt, Anhui Province. Earth Sci. Front. 2020, 27, 353–372, (In Chinese with English abstract). [Google Scholar]
  47. Zhang, H.; Li, C.-Y.; Yang, X.-Y.; Sun, Y.-L.; Deng, J.-H.; Liang, H.-Y.; Wang, R.-L.; Wang, B.-H.; Wang, Y.-X.; Sun, W.-D. Shapinggou: The largest Climax-type porphyry Mo deposit in China. Int. Geol. Rev. 2014, 56, 313–331. [Google Scholar]
  48. Alexander, J. Major, Trace and Rare Earth Element Concentrations in NIST Standard Reference Material® 1646a Analyzed by ALS Global Using Method ME-MS61r; CUNY College of Staten Island: New York, NY, USA, 2025. [Google Scholar]
  49. Liu, J.; Wen, H.; Zhang, Y.; Fan, H.; Zhu, C. Precise Mo isotope ratio measurements of low-Mo (ng g−1) geological samples using MC-ICP-MS. J. Anal. At. Spectrom. 2016, 31, 1287–1297. [Google Scholar] [CrossRef] [Scilit]
  50. Zhang, Y.; Wen, H.; Zhu, C.; Fan, H.; Xiao, J.; Wen, J. Molybdenum isotopic evidence for anoxic marine conditions during the end-Permian mass extinction. Chem. Geol. 2021, 575, 120259. [Google Scholar] [CrossRef] [Scilit]
  51. Nägler, T.F.; Anbar, A.D.; Archer, C.; Goldberg, T.; Gordon, G.W.; Greber, N.D.; Siebert, C.; Sohrin, Y.; Vance, D. Proposal for an international molybdenum isotope measurement standard and data representation. Geostand. Geoanal. Res. 2014, 38, 149–151. [Google Scholar] [CrossRef] [Scilit]
  52. Li, J.; Zhu, X.; Tang, S.; Zhang, K. High-precision measurement of molybdenum isotopic compositions of selected geochemical reference materials. Geostand. Geoanal. Res. 2016, 40, 405–415. [Google Scholar]
  53. Leng, C.B.; Chen, T.L.; Ren, Z.; Zhao, Y.; Wang, A.D.; Wang, F.Y. Distribution characteristics and differential enrichment mechanism of rhenium in molybdenite in the Dexing copper ore field. Acta Petrol. Sin. 2023, 39, 3107–3120, (In Chinese with English abstract). [Google Scholar] [CrossRef] [Scilit]
  54. Lu, S.M.; Li, J.S.; Ruan, L.S.; Zhao, L.L.; Huang, F.; Wang, B.H.; Zhang, H.D. The characteristics of stable isotope geochemistry of the Shapinggou molybdenum deposit, Anhui Province. Geoscience 2019, 33, 262–270, (In Chinese with English abstract). [Google Scholar]
  55. Wu, S.; Zheng, Y.; Geng, R.; Jin, L.; Bao, B.; Tan, M.; Guo, F. Geology, fluid inclusion and isotope constraints on ore genesis of the post-collisional Dabu porphyry Cu–Mo deposit, southern Tibet. Ore Geol. Rev. 2017, 89, 421–440. [Google Scholar]
  56. Ohmoto, H. Isotopes of sulfur and carbon. In Geochemistry of Hydrothermal Ore Deposits; Barnes, H.L., Ed.; Wiley: New York, NY, USA, 1979. [Google Scholar]
  57. Hoefs, J. Stable Isotope Geochemistry; Springer International Publishing: Cham, Switzerland, 2021. [Google Scholar]
  58. Hannah, J.L.; Stein, H.J.; Wieser, M.E.; de Laeter, J.R.; Varner, M.D. Molybdenum isotope variations in molybdenite: Vapor transport and Rayleigh fractionation of Mo. Geology 2007, 35, 703–706. [Google Scholar] [CrossRef] [Scilit]
  59. Mathur, R.; Brantley, S.; Anbar, A.; Munizaga, F.; Maksaev, V.; Newberry, R.; Vervoort, J.; Hart, G. Variation of Mo isotopes from molybdenite in high-temperature hydrothermal ore deposits. Miner. Depos. 2010, 45, 43–50. [Google Scholar]
  60. Breillat, N.; Guerrot, C.; Marcoux, E.; Négrel, P. A new global database of δ98Mo in molybdenites: A literature review and new data. J. Geochem. Explor. 2016, 161, 1–15. [Google Scholar] [CrossRef] [Scilit]
  61. Greber, N.D.; Hofmann, B.A.; Voegelin, A.R.; Villa, I.M.; Nägler, T.F. Mo isotope composition in Mo-rich high- and low-T hydrothermal systems from the Swiss Alps. Geochim. Cosmochim. Acta 2011, 75, 6600–6609. [Google Scholar]
  62. Xu, L.; Lehmann, B.; Mao, J. Seawater contribution to polymetallic Ni–Mo–PGE–Au mineralization in early Cambrian black shales of South China: Evidence from Mo isotope, PGE, trace element, and REE geochemistry. Ore Geol. Rev. 2013, 52, 66–84. [Google Scholar] [CrossRef] [Scilit]
  63. Greber, N.D.; Pettke, T.; Nägler, T.F. Magmatic–hydrothermal molybdenum isotope fractionation and its relevance to the igneous crustal signature. Lithos 2014, 190–191, 104–110. [Google Scholar] [CrossRef] [Scilit]
  64. Zhai, D.; Liu, J.; Tombros, S.; Williams-Jones, A.E. The genesis of the Hashitu porphyry molybdenum deposit, Inner Mongolia, NE China: Constraints from mineralogical, fluid inclusion, and multiple isotope (H, O, S, Mo, Pb) studies. Miner. Depos. 2018, 53, 377–397. [Google Scholar]
  65. Wang, Y.; Zhou, L.; Gao, S.; Li, J.-W.; Hu, Z.-F.; Yang, L.; Hu, Z.-C. Variation of molybdenum isotopes in molybdenite from porphyry and vein Mo deposits in the Gangdese metallogenic belt, Tibetan Plateau and its implications. Miner. Depos. 2016, 51, 201–210. [Google Scholar]
  66. Shafiei, B.; Shamanian, G.; Mathur, R.; Mirnejad, H. Mo isotope fractionation during hydrothermal evolution of porphyry Cu systems. Miner. Depos. 2015, 50, 281–291. [Google Scholar]
  67. Li, Y.; McCoy-West, A.J.; Zhang, S.; Selby, D.; Burton, K.W.; Horan, K. Controlling mechanisms for molybdenum isotope fractionation in porphyry deposits: The Qulong example. Econ. Geol. 2019, 114, 981–992. [Google Scholar] [CrossRef] [Scilit]
  68. Chang, J.; Li, J.-W.; Zhou, L. Molybdenum isotopic fractionation in the Tibetan Yulong Cu–Mo deposit and its implications for mechanisms of molybdenite precipitation in porphyry ore systems. Ore Geol. Rev. 2020, 123, 103571. [Google Scholar]
  69. Qi, N.; Williams-Jones, A.E.; Dong, Y.; Mathur, R.; Chen, X.; Chen, Y. Molybdenum isotope fractionation in collision-type magmatic-hydrothermal systems: Evidence from the Leimengou porphyry Mo deposit. Miner. Depos. 2026, 1–13. [Google Scholar] [CrossRef] [Scilit]
  70. Li, F.-L.; Mathur, R.; Li, J.; Li, N.; Deng, X.-H.; Yao, Y.-F.; Zhao, T.-P.; Yao, J.-M. Link Mo isotopes to the sources of the Paleoproterozoic Mo mineralization in the Qinling orogen. Ore Geol. Rev. 2023, 160, 105618. [Google Scholar] [CrossRef] [Scilit]
  71. Strachan, J.; Masters, A.F.; Maschmeyer, T. 3R-MoS2 in review: History, status, and outlook. ACS Appl. Energy Mater. 2021, 4, 7405–7418. [Google Scholar] [CrossRef] [Scilit]
  72. Ciobanu, C.L.; Cook, N.J.; Kelson, C.R.; Guerin, R.; Kalleske, N.; Danyushevsky, L. Trace element heterogeneity in molybdenite fingerprints stages of mineralization. Chem. Geol. 2013, 347, 175–189. [Google Scholar] [CrossRef] [Scilit]
  73. Plotinskaya, O.Y.; Zu, B.; Seltmann, R.; Najorka, J.; Bondar, D.; Abramova, V.D.; Li, C.; Spratt, J.; Bergal-Kuvikas, O.; Belogub, E. Tectonic history of the Urals as stored in molybdenites of porphyry and greisen deposits. Earth-Sci. Rev. 2023, 247, 104609. [Google Scholar] [CrossRef] [Scilit]
  74. Voudouris, P.C.; Melfos, V.; Spry, P.G.; Bindi, L.; Kartal, T.; Arikas, K.; Moritz, R.; Ortelli, M. Rhenium-rich molybdenite and rheniite in the Pagoni Rachi Mo–Cu–Te–Ag–Au prospect, northern Greece: Implications for the Re geochemistry of porphyry-style Cu–Mo and Mo mineralization. Can. Mineral. 2009, 47, 1013–1036. [Google Scholar] [CrossRef] [Scilit]
  75. Yao, J.; Mathur, R.; Sun, W.; Song, W.; Chen, H.; Mutti, L.; Xiang, X.; Luo, X. Fractionation of Cu and Mo isotopes caused by vapor–liquid partitioning: Evidence from the Dahutang W–Cu–Mo ore field. Geochem. Geophys. Geosyst. 2016, 17, 1725–1739. [Google Scholar]
  76. Tossell, J.A. Calculating the partitioning of the isotopes of Mo between oxidic and sulfidic species in aqueous solution. Geochim. Cosmochim. Acta 2005, 69, 2981–2993. [Google Scholar] [CrossRef] [Scilit]
  77. Kendall, B.; Dahl, T.W.; Anbar, A.D. The stable isotope geochemistry of molybdenum. Rev. Mineral. Geochem. 2017, 82, 683–732. [Google Scholar] [CrossRef] [Scilit]
  78. Segato, A. Mo Isotope Variations in Molybdenites at Single-Crystal, Ore Deposit, and Global Scales: Implications for Mo Source Fluid, Transport, Fractionation Mechanisms, and Molybdenite Mineralization. Master’s Thesis, University of Waterloo, Waterloo, ON, Canada, 2018. [Google Scholar]
  79. Hutchison, W.; Finch, A.A.; Boyce, A.J. The sulfur isotope evolution of magmatic-hydrothermal fluids: Insights into ore-forming processes. Geochim. Cosmochim. Acta 2020, 288, 176–198. [Google Scholar]
  80. Drummond, S.E.; Ohmoto, H. Chemical evolution and mineral deposition in boiling hydrothermal systems. Econ. Geol. 1985, 80, 126–147. [Google Scholar] [CrossRef] [Scilit]
  81. Sim, M.S.; Sessions, A.L.; Orphan, V.J.; Adkins, J.F. Precise determination of equilibrium sulfur isotope effects during volatilization and deprotonation of dissolved H2S. Geochim. Cosmochim. Acta 2019, 248, 242–251. [Google Scholar] [CrossRef] [Scilit]
  82. Bernard, A.; Symonds, R.B.; Rose, W.I. Volatile transport and deposition of Mo, W and Re in high temperature magmatic fluids. Appl. Geochem. 1990, 5, 317–326. [Google Scholar] [CrossRef] [Scilit]
  83. Zelenski, M.; Malik, N.; Taran, Y. Emissions of trace elements during the 2012–2013 effusive eruption of Tolbachik Volcano, Kamchatka: Enrichment factors, partition coefficients and aerosol contribution. J. Volcanol. Geotherm. Res. 2014, 285, 136–149. [Google Scholar] [CrossRef] [Scilit]
  84. Berzina, A.N.; Sotnikov, V.I.; Economou-Eliopoulos, M.; Eliopoulos, D.G. Distribution of rhenium in molybdenite from porphyry Cu–Mo and Mo–Cu deposits of Russia (Siberia) and Mongolia. Ore Geol. Rev. 2005, 26, 91–113. [Google Scholar] [CrossRef] [Scilit]
  85. Selby, D.; Creaser, R.A. Re–Os geochronology and systematics in molybdenite from the Endako porphyry molybdenum deposit, British Columbia, Canada. Econ. Geol. 2001, 96, 197–204. [Google Scholar]
Figure 1. (A) Geological units of China (modified from [22]). (B) Simplified geological map of the Dabie Orogenic Belt (modified from [22]).
Geosciences 16 00253 g001
Figure 2. (A) Simplified geological map of the Shapinggou Mo deposit; (B) Geological cross-setion of the Shapinggou Mo deposit along the No. 0 exploration line (modified from [30,37]).
Geosciences 16 00253 g002
Figure 3. Photographs of hand specimens and photomicrographs from the Shapinggou porphyry Mo deposit: (A,B) early-stage quartz (Qz) and molybdenite (Mo) veins, with (C) molybdenite occurring as very fine speck-like disseminations; (D,E) transitional-stage quartz (Qz) and molybdenite (Mo) veins, with (F) relatively coarse platy molybdenite aggregates, locally showing bending and distortion; (G,H) late-stage pyrite–molybdenite–quartz veins, with (I) platy molybdenite aggregates closely associated with pyrite. Abbreviations: Qz = quartz; Py = pyrite; Mo = molybdenite.
Geosciences 16 00253 g003
Figure 4. X-ray diffraction (XRD) patterns of molybdenite from the Shapinggou deposit and the standard patterns of 2H and 3R molybdenite (2H: JCPDS#73-1508; 3R: JCPDS#77-0341).
Geosciences 16 00253 g004
Figure 5. Sulfur isotope compositions of porphyry Mo deposits from different metallogenic belts (data from [30,37,54,55]). The δ34S range of Magmatic sulfur from [56]; and magmatic–hdrthermal range is from [56,57].
Geosciences 16 00253 g005
Figure 6. (A) Ranges and mean δ98/95Mo values of molybdenite from different magmatic–hydrothermal deposit types. (B) Ranges and mean δ98/95Mo values of molybdenite from different Mo deposits in the Qinling–Dabie Mo metallogenic belt. IOCG = iron oxide copper-gold deposits. Mo isotope data were compiled from skarn deposits [58,59,60]; hydrothermal breccia deposits [61]; polymetallic sulfide deposits [62]; IOCG deposits [59,60]; greisen deposits [58,60]; porphyry deposits [24,58,59,60,63,64,65,66,67,68]; Lei menggou deposit [69]; Zhaiwa and Longmengdian deposits [70]; and Jinduicheng deposit [24]. “n” represents the number of samples.
Geosciences 16 00253 g006
Figure 7. (A) Mo isotope variations in molybdenite across successive Mo mineralization stages during the hydrothermal evolution of the Shapinggou porphyry Mo deposit. The pink arrow indicates the progressive shift toward lighter Mo isotopic compositions during hydrothermal evolution. (B) δ34S versus δ98/95Mo. “n” represents the number of samples; each sample was analyzed in triplicate.
Geosciences 16 00253 g007
Figure 8. (A) Re versus δ98/95Mo. (B) Re/Mo ratio versus δ98/95Mo.
Geosciences 16 00253 g008
Figure 9. Variation trend of Re/Mo ratios in different stages: (A) this study, (B) literature data [22]. “n” represents the number of samples; each sample was analyzed in duplicate.
Geosciences 16 00253 g009
Table 1. Major element and Re contents and Mo-S isotopic compositions of molybdenite from the Shapinggou porphyry Mo deposit.
Sample No.Rock TypeVein TypeCrystal Typeδ34Sδ98/95MoSMoReRe/Mo
%ppm10−4
Spg-1Quartz syeniteI2H4.111.020.0339.4157.052.320.04
Spg-2Quartz syeniteI2H4.300.970.0238.2758.117.350.13
Spg-3Granite porphyryI2H3.420.470.0339.1159.141.350.02
Mean 3.94 ± 0.380.82 ± 0.25 38.9358.103.670.06
Spg-5Granite porphyryII2H5.440.190.0138.4458.963.220.05
Spg-6Granite porphyryII2H4.100.260.0339.0259.2414.390.24
Spg-7Granite porphyryII2H4.86−0.060.0139.2558.411.130.02
Mean 4.80 ± 0.550.13 ± 0.14 38.9058.876.250.11
Spg-8Granite porphyryIII2H5.80−0.280.0338.4258.7918.800.32
Spg-9Granite porphyryIII2H4.33−0.040.0438.6758.7123.590.40
Spg-10Granite porphyryIII2H6.35−0.150.0140.2157.484.670.08
Spg-12Granite porphyryIII2H5.53−0.280.0137.4159.348.760.15
Mean 5.50 ± 0.74−0.19 ± 0.10 38.6858.5813.960.24
Total mean 4.82 ± 0.88+0.21 ± 0.45 38.82 ± 0.7258.52 ± 0.738.56 ± 7.460.15 ± 0.13
All δ34S and δ98/95Mo values represent the mean of three replicate analyses (n = 3). S, Mo, and Re contents were determined by duplicate analyses (n = 2).
Disclaimer/Publisher’s Note: The statements, opinions and data contained in all publications are solely those of the individual author(s) and contributor(s) and not of MDPI and/or the editor(s). MDPI and/or the editor(s) disclaim responsibility for any injury to people or property resulting from any ideas, methods, instructions or products referred to in the content.