Article

Lamprophyre Zircon Geochronology and Pyrite–Arsenopyrite S-Fe Isotopes: Implications for Magmatic Mineralization at the Jinshan Gold Deposit, Western Qinling Metallogenic Belt

1
Xi’an Mineral Resources Survey, China Geological Survey, Xi’an 710100, China
2
Technology Innovation Center for Gold Ore Exploration, China Geological Survey, Xi’an 710100, China
3
Longnan Zijin Mining Limited Company, Longnan 746005, China
*
Author to whom correspondence should be addressed.
Geosciences 2026, 16(6), 208; https://doi.org/10.3390/geosciences16060208
Submission received: 30 March 2026 / Revised: 12 May 2026 / Accepted: 13 May 2026 / Published: 22 May 2026

Abstract

The lamprophyre dikes and multi-generational pyrite and arsenopyrite developed in the Jinshan gold deposit in the West Qinling metallogenic belt provide critical evidence for understanding the role of mantle-derived magmatism in gold mineralization processes. In this study, we conducted zircon U-Pb dating of lamprophyre to constrain the timing of magmatic activity and the mineralization age, and performed EMPA and LA-ICP-MS analyses on sulfides from the main metallogenic stage (Py II–III, Apy II–III) and lamprophyre-hosted pyrite (Py L) to constrain the formation conditions and metal sources of the Jinshan deposit. The results show that the mantle-derived magmatism represented by lamprophyre yields an age of 206 ± 2 Ma, which provides a lower-limit constraint on the timing of gold mineralization, corresponding to the subduction-to-extension transition period in the region. Stage II mineralization occurred at 270–320 °C with logƒS2 of −9 to −5, dominantly as Au-HS complexes, indicating medium-temperature hydrothermal conditions with low sulfur fugacity, consistent with microscopic mineral assemblages and thermodynamic simulations. Systematic δ34S variations reveal: stage II values (9.24–5‰) indicate granitic/Devonian sedimentary sources; Py L values (2.19–3.6‰) reflect mantle contributions; stage III signatures (−2.3–1.93‰) record late meteoric water mixing. Complementary δ56Fe data show that Py II (0.2–0.3‰) and Py L (0.58–0.68‰) preserve magmatic fingerprints, while negative values of Py III (−2.29 to −0.71‰) document increasing sedimentary Fe incorporation. Combined with geochronology, S-Fe isotopes, and physicochemical constraints, we propose that the Jinshan gold deposit formed in a tectonic setting transitioning from compression to extension during the Late Indosinian (ca. 237–201 Ma). Mineralization was initiated by the partial melting of the metasomatized mantle, where hydrous magmas efficiently extracted Au and volatiles. These components ascended through transcrustal faults, with Au partitioning into exsolved fluids that precipitated gold through immiscibility and boiling in secondary structures.

1. Introduction

The geochronology of dikes closely related to mineralization provides important constraints on the timing of mineralization. Lamprophyre, as a deep-sourced mafic dike, typically exhibits a spatiotemporal coupling relationship with regional extensional tectonic settings and gold mineralization events [1,2]. In addition, the specific physicochemical conditions of mineralization are crucial for defining the metallogenic environment and conditions of gold deposits [3,4,5]. Metal sulfides, particularly arsenopyrite and pyrite, serve as critical hosts for gold mineralization in various deposit types [3,6]. Through their occurrence modes, structural characteristics, chemical compositions, and geochemical signatures, they provide crucial insights into the physicochemical conditions of gold mineralization [7,8,9], making them ideal subjects for investigating the genetic mechanisms of gold deposits.
The West Qinling metallogenic belt (WQMB) is characterized by significant tectonic–magmatic activity, and represents one of China’s most significant gold provinces. Currently, 15 large to super-large gold deposits and 31 medium-sized deposits have been identified within the region, collectively holding proven gold reserves exceeding 2000 tonnes. This makes the WQMB the second-largest gold mining area in China, surpassed only by the Jiaodong gold field [10,11]. However, the genetic mechanisms of numerous large to super-large gold deposits in the WQMB remain poorly constrained, particularly regarding the critical role of mantle-derived magmatism in gold mineralization processes.
The Jinshan gold deposit is located in the Xiahe-Xihe-Fengxian-Huangbaiyuan sub-belt of the WQMB, approximately 3.5 km south of the Zhongchuan pluton. The deposit is characterized by the development of multi-stage pyrite and arsenopyrite. A recent exploration by Longnan Zijin Mining Limited Company (LZM Mining) in 2015 delineated gold resources of 24.56 tons, classifying it as a large-scale gold deposit with considerable exploration potential. Previous studies have established that mineralization at Jinshan is predominantly associated with magmatic processes and tectonic activities [12,13,14,15]. Our preliminary investigations by author of chlorite mineralogy and physicochemical characteristics from ore samples suggested that gold mineralization primarily resulted from hydrothermal boiling processes, with significant amounts of invisible gold being incorporated into pyrite and arsenopyrite under conditions of low sulfur fugacity and neutral pH [14]. However, critical aspects regarding the source of ore-forming materials, formation mechanisms, the precise role of boiling in mineralization, and the timing of mineralization remain poorly constrained.
In this study, we conducted zircon U-Pb dating of lamprophyre to constrain the timing of magmatic activity and the mineralization age, and focused on arsenopyrite (Apy II–III) and pyrite (Py II–III) from the main metallogenic period, along with lamprophyre-hosted pyrite (Py L) in the Jinshan gold deposit. We analyzed trace elements in these minerals using EMPA and LA-ICP-MS, along with their S-Fe isotopic compositions. This integrated approach—combining lamprophyre zircon U-Pb dating, in situ S-Fe isotopes of pyrite and arsenopyrite, and thermodynamic simulations—allows us to address three outstanding questions regarding the Jinshan deposit: (1) the timing of mantle-derived magmatism relative to gold mineralization, (2) the physicochemical conditions (temperature, sulfur fugacity, and pH) under which gold precipitated, and (3) the relative contributions of mantle, sedimentary, and meteoric sources to the ore-forming fluids. Compared to previous studies in the West Qinling orogenic belt [15,16,17,18], which focused primarily on geological descriptions and bulk geochemistry, this study provides the first coupled S-Fe isotopic dataset for the Jinshan deposit and the first quantitative thermodynamic simulation of gold speciation under its specific mineralization conditions. These new constraints allow us to evaluate, rather than assume, the role of mantle-derived magmatism in gold mineralization and to propose a revised genetic model for the Jinshan deposit that can be tested against other gold systems in the region.

2. Regional Geological Setting

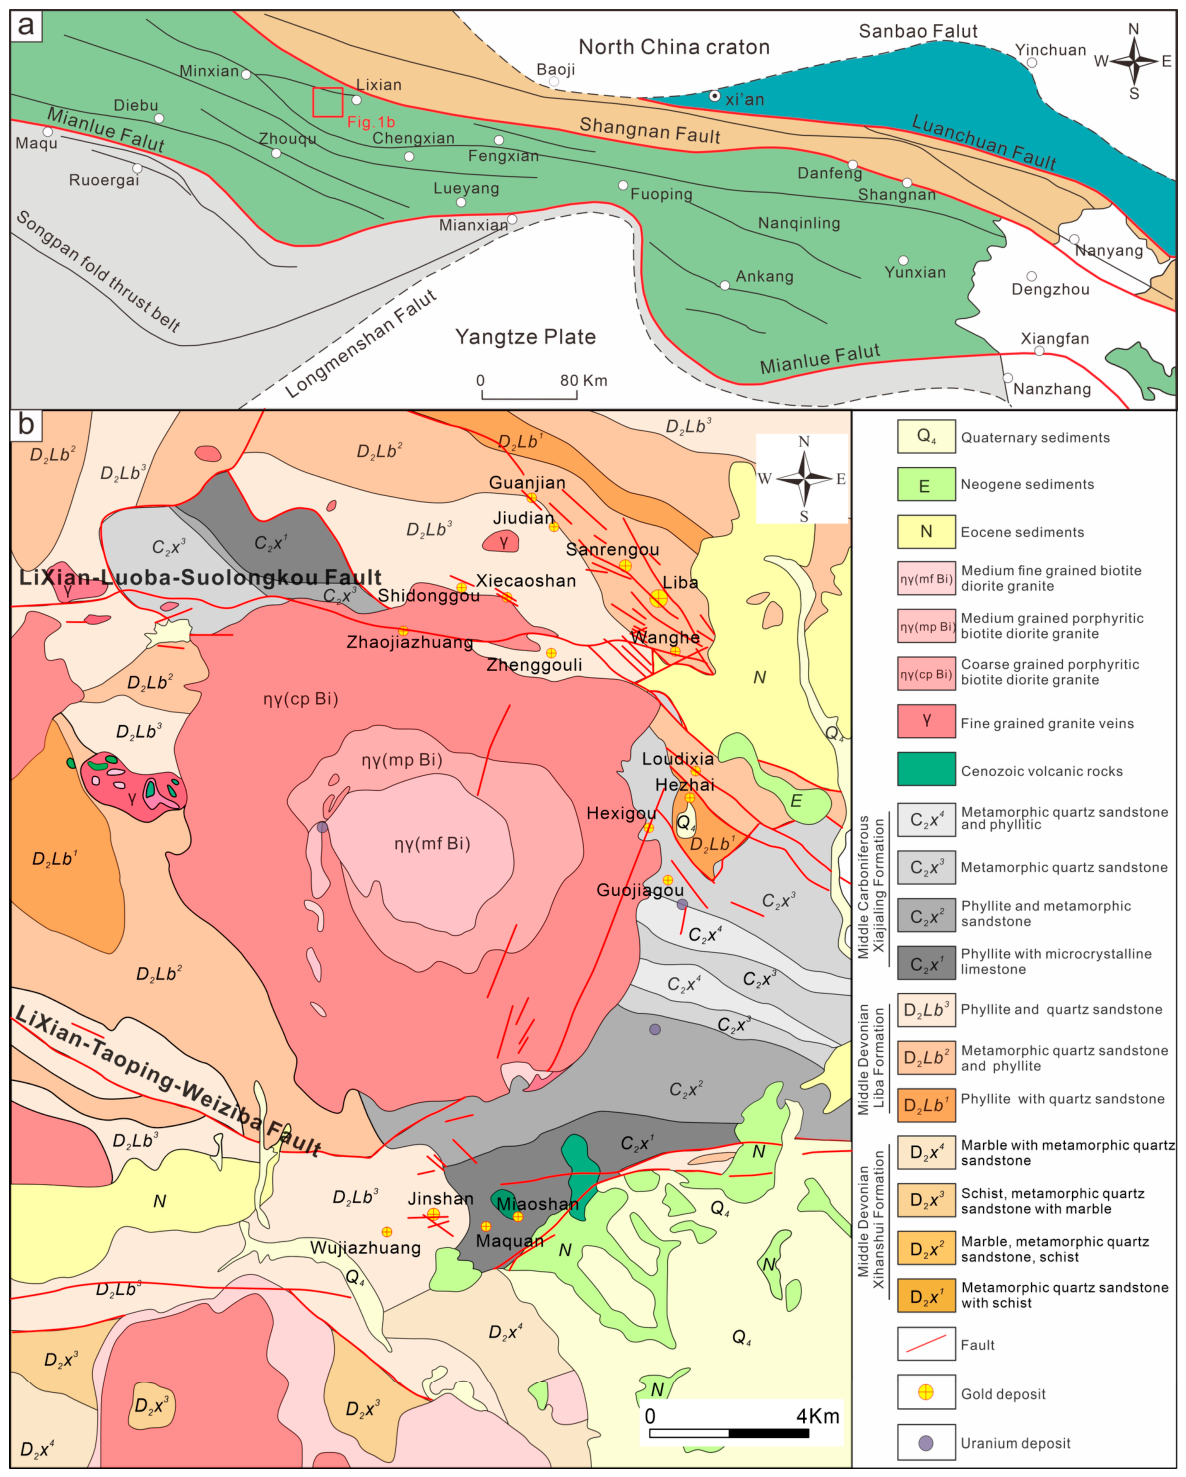
The Jinshan gold deposit is located in the Zhongchuan region of the WQMB, at the intersection of the North China Block and the Yangtze Plate (Figure 1a). This region has undergone a complex tectonic evolution, encompassing multiple phases of continental rifting, ocean basin development, collisional orogenesis, intraplate extension, and intracontinental orogenic superimposition [14,15,16].
The structural framework of the Zhongchuan region is dominated by well-developed fold and fault systems. The principal fold structure is represented by the NW-trending Shijiaheba compound syncline in the central region [15,18,19,20]. Fault systems are categorized into four major groups based on their orientations, NW, NWW, SWW, and SW directions, accompanied by numerous secondary NW-trending folds and NW-NWW/NE-oriented faults. These structural elements exert fundamental control over sedimentation patterns, magmatic activities, and the spatial distribution of mineral resources, including gold, antimony, lead, and zinc deposits. Notably, significant gold mineralization is preferentially localized at the intersections of fold anticlines and fault fracture zones (Figure 1b).
The stratigraphic sequence in the region predominantly comprises the Middle Devonian Liba Formation (D2Lb, synonymous with the Shujiaba Formation), Middle Devonian Xihanshui Formation (D2x), and Middle Carboniferous Xiajialing Formation (C2x) [12,13]. The D2Lb is characterized by conglomerate structures mainly composed of fine clastic rocks deposited by deep-water turbidity currents. It can be divided into three lithological sections from bottom to top: slate; speckled slate interbedded with metamorphic sandstone; and slate interbedded with metamorphic sandstone and speckled slate, as well as metamorphic quartz sandstone, siltstone, and slate. The D2x consists of carbonate rocks that represent shallow sea platform and shelf facies, interbedded with clastic rocks, which can be divided into four lithological sections, arranged from bottom to top as follows: metamorphic quartz sandstone interbedded with schist; marble, metamorphic quartz sandstone and schist; metamorphic quartz sandstone interbedded with marble; and marble interbedded with metamorphic quartz sandstone. The C2x features typical sedimentary formations found in coastal shallow marine facies, including mudstone, siliceous rock, mudstone, siltstone, and sandstone formations in the coastal shallow marine facies, which is composed primarily of quartzite interbedded with microcrystalline limestone; thousand layered slate and metamorphic sandstone; metamorphic quartz sandstone; as well as metamorphic quartz sandstone and phyletic slate (Figure 1b).
Magmatic activity in the region is exemplified by the Zhongchuan pluton, located approximately 3.5 km north of the Jinshan deposit. This concentrically zoned intrusion comprises three distinct phases: outer medium-coarse grained speckled biotite diorite, intermediate medium-grained speckled biotite diorite, and inner medium-fine grained equigranular biotite diorite. Extensive zircon U-Pb geochronological data constrain the magmatic emplacement age of the Zhongchuan pluton to 236–217 Ma [17,18,19,20,21].
Meanwhile, the Zhongchuan region hosts significant mineral resources, predominantly gold and uranium deposits. Over 20 gold occurrences are spatially associated with fault systems related to the Zhongchuan pluton, primarily distributed in the northeastern, eastern, and southern sectors [20,21]. Notable gold deposits include the Liba gold deposit in the northeast and the Jinshan and Maquan gold deposits in the south. In addition, uranium deposits are principally concentrated in the central and eastern parts of the Zhongchuan pluton (Figure 1b).
Figure 1. (a) Structural framework of Qinling orogenic belt (modified after Ke et al. [20]); (b) geological and mineral map of Zhongchuan area in the West Qinling orogenic belt (modified after LZM Mining).
Geosciences 16 00208 g001

3. Geological Setting of the Jinshan Gold Deposit

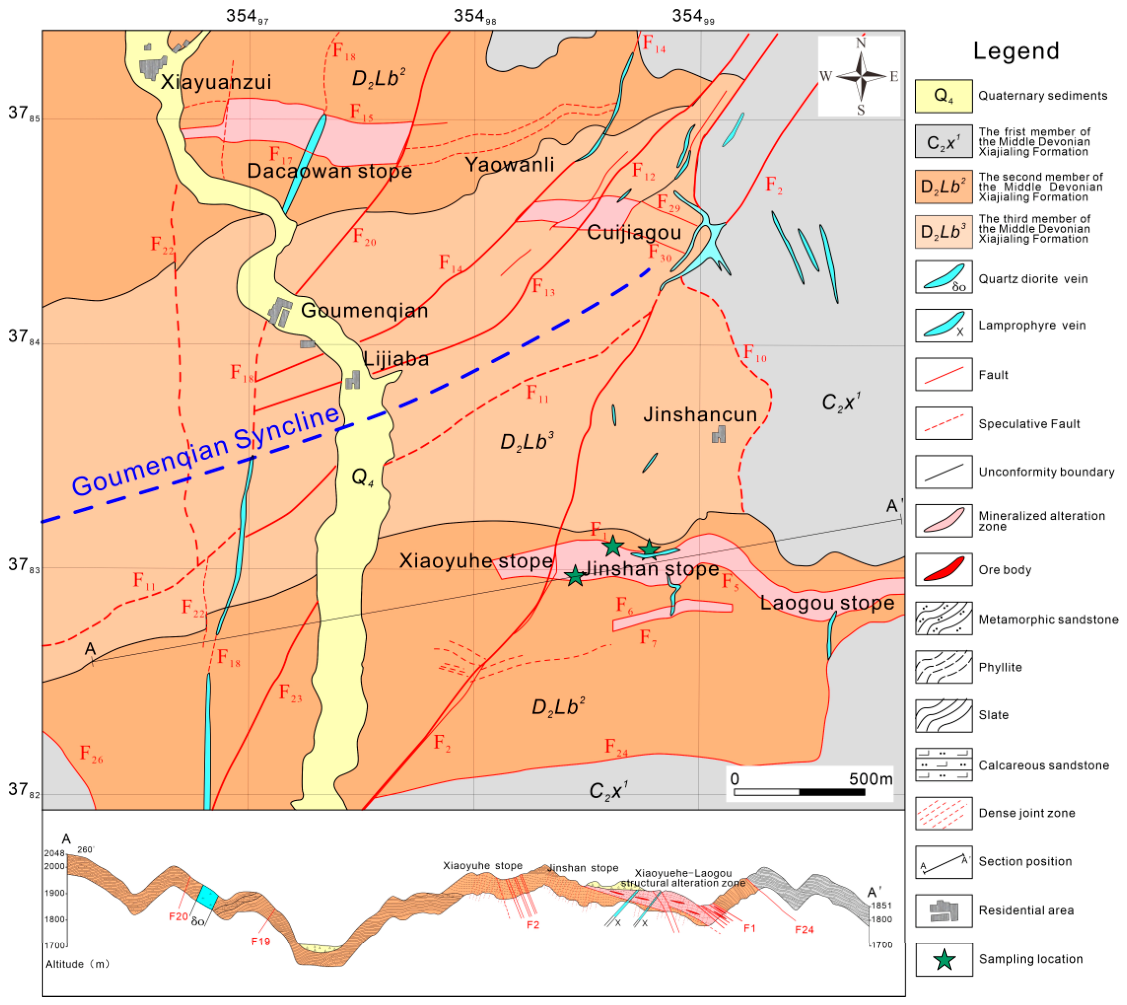
The Jinshan gold deposit is located on the southern flank of the Zhangfengpo secondary anticline structure within the Shijiaheba compound syncline. The geological strata predominantly strike in the NEE-NE direction, with well-developed fault and fold systems [13,14]. The central part of the mining area is characterized by the Menqiangou syncline. The area lacks large-scale pluton outcrops, with only quartz diorite and lamprophyre veins exposed. These veins, oriented in northeast and near north–south directions, exhibit variable dimensions and are strongly influenced by the structural framework of the mining area. They typically intrude along fault zones or fractures, demonstrating a close spatial and genetic relationship with mineralization processes (Figure 2).
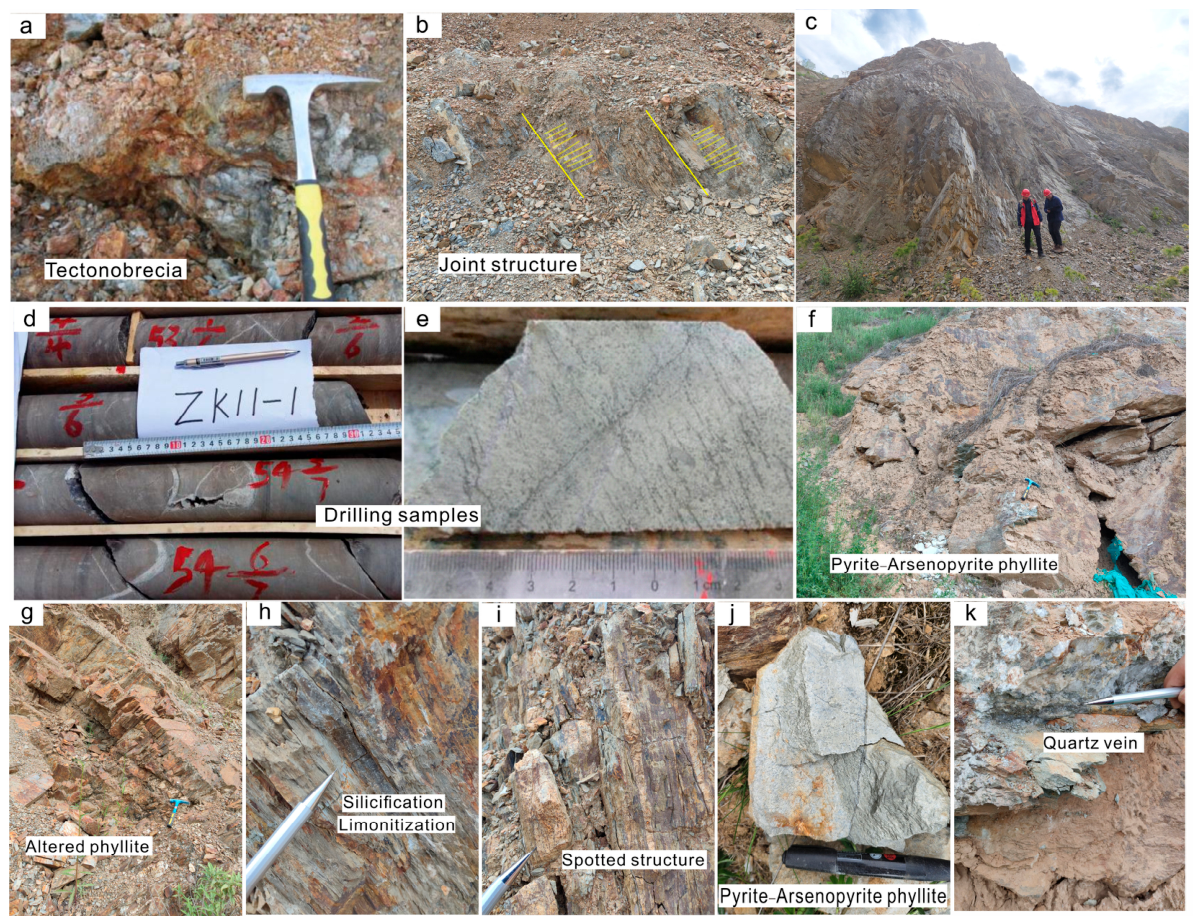
The exposed strata in the mining area primarily comprises the second and third lithological segments of the Middle Devonian Liba Group (D2Lb2, D2Lb3), and the first lithological segment of the Lower Jialing Formation of the Middle Carboniferous (C2x1; Figure 2). The D2Lb2 segment is predominantly distributed in the northwest and southern regions of the mining area, where it is in contact with the D2Lb3. The lithology in this segment includes gray-green, medium-thin to medium-thick metamorphic sandstone, phyllitic metamorphic sandstone interbedded with silty slate, and phyllite [15]. The ore bodies discovered in the mining area are primarily located within this lithological section. The D2Lb3 is predominantly present in the central and western parts of the mining area and is in fault contact with the overlying C2x1. It is composed primarily of metamorphic siliceous calcareous nodule phyllite and sericite arsenopyrite phyllite (Figure 2). Lithological controls on mineralization are evident, with phyllite being the predominant host rock (Figure 3d–k), followed by slate. Gold mineralization exhibits a strong spatial association with arsenopyritization, silicification, and limonitization.
Wall-rock alteration is dominated by silicification, pyritization, sericitization, chloritization, and carbonatization (Figure 3g,h). During the orogenic period following diagenesis, widespread low-grade greenschist facies metamorphism and localized contact metamorphism occurred. This resulted in the recrystallization of most clay minerals in the protoliths, such as mudstone and calcareous siltstone (Figure 3i). Under tectonic stress, these minerals developed preferred orientations, leading to shallow metamorphism and the formation of metamorphic rocks, including sericite phyllite, silty sericite phyllite, and sericite chlorite phyllite. These rocks typically exhibit phyllitic textures and micro-crumpled structures (Figure 3b,c).
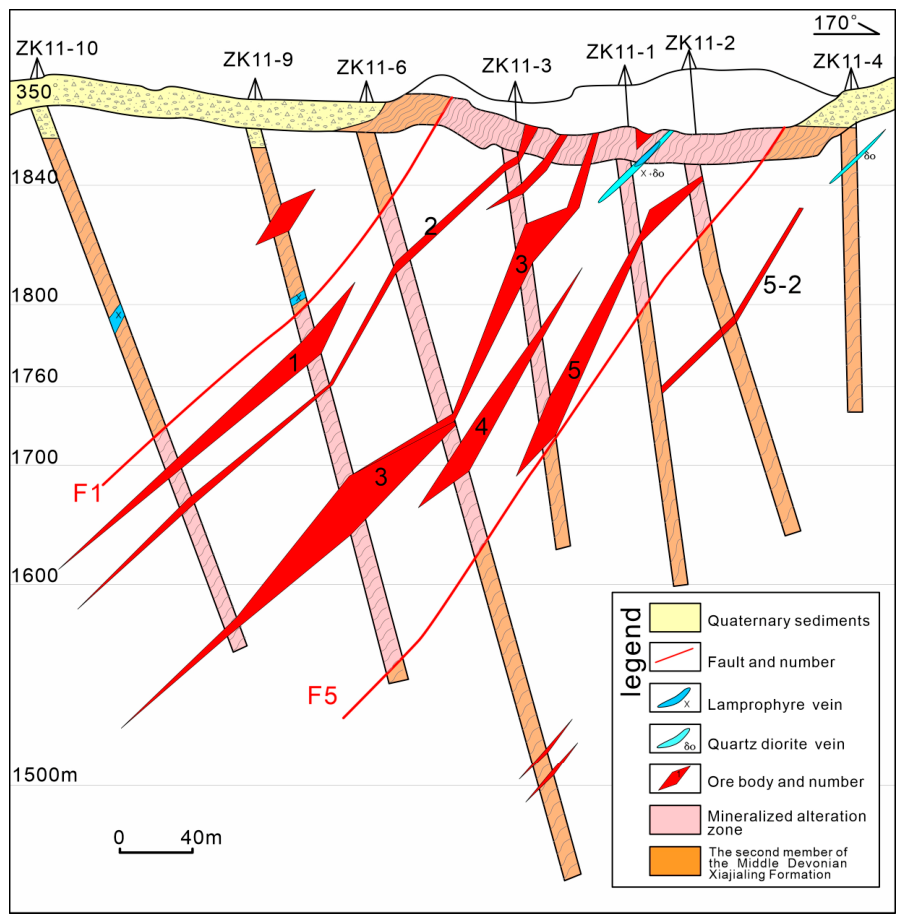
Within the Jinshan mining area, 137 gold ore bodies of varying sizes have been identified, primarily concentrated in the Xiaoyuhe-Jinshan-Laogou gold mineralization zone [13] (Figure 2). The principal ore bodies, numbered 1, 1-1, 2, 2-1, and 5, are hosted within the mineralized zone (also referred to as the tectonic alteration zone) and trend nearly east–west. The orientations of ore bodies F1, F5, F6, and F7 indicate a general north–south parallelism, particularly for ore bodies 1 through 5 (Figure 4).
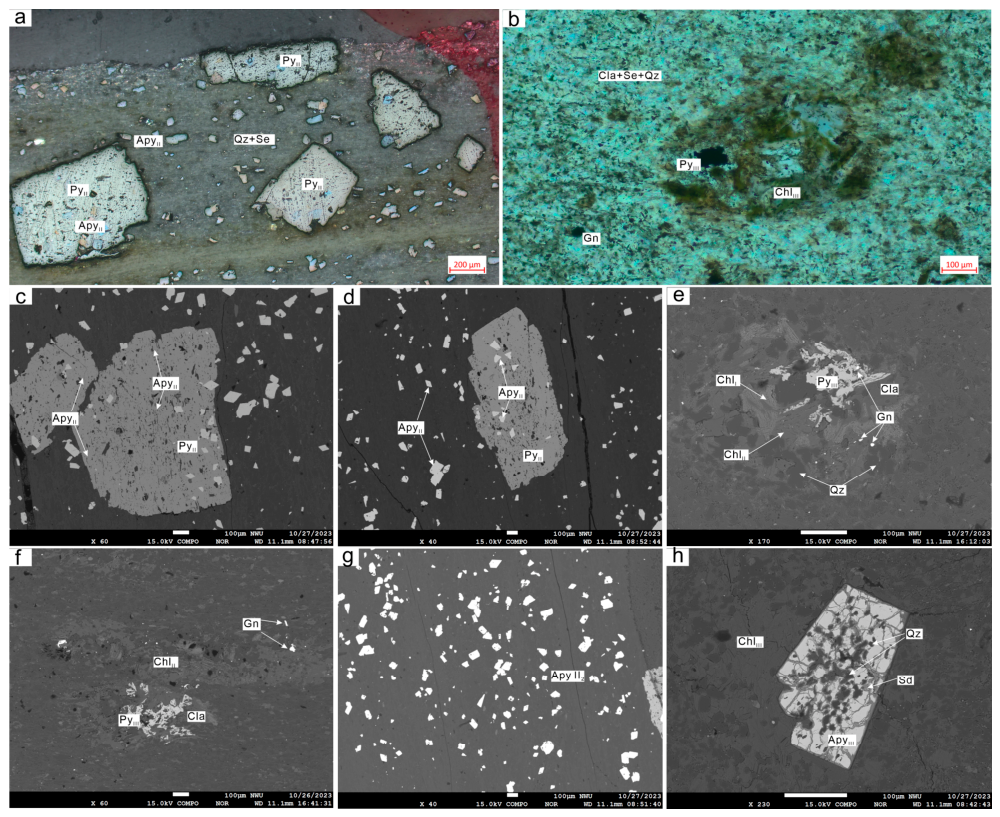
Pyrite is the primary metal mineral found in the Jinshan gold deposit. It mainly occurs in a disseminated form, followed by vein occurrences, with the crystal structures mostly being subhedral, euhedral, and anhedral. The formation of pyrite corresponds to two stages of hydrothermal mineralization: stage II (gold–quartz–sulfide stage; Py II) and stage III (gold–sulfide–carbonate stage; Py III). In backscattered electron (BSE) images, Py II displays well-defined shapes with particle sizes ranging from 200 to 600 μm, and is commonly associated with arsenopyrite. In contrast, Py III (Figure 5a–d) is mostly anhedral and shows a strong paragenetic relationship with calcite and quartz (Figure 5e,f).
Arsenopyrite is a significant gold-bearing mineral in the Jinshan gold deposit. It mainly occurs as disseminated, slender prismatic crystals of varying sizes. The formation of arsenopyrite corresponds to two stages of the hydrothermal mineralization period: stage II (gold–quartz–sulfide stage; Apy II) and stage III (gold–sulfide–carbonate stage; Apy III). Apy II typically appears as hypidiomorphic short columns and prisms that are often enveloped in pyrite. In backscattered electron (BSE) images, it exhibits a homogeneous bright white color. However, it shows notable heterogeneity under cross-polarized light, displaying brown, gray, and blue hues, with euhedral- to subhedral-textured structures (Figure 5a,c,d). The particle size of Apy II is approximately 100–120 μm. Apy III is characterized by a spotted structure and mostly takes the form of long columns. It has a larger grain size, typically 150–200 μm, with siderite dissolved within and filled with quartz, indicating its role as a characteristic mineral of the later stages of mineralization (Figure 5h).
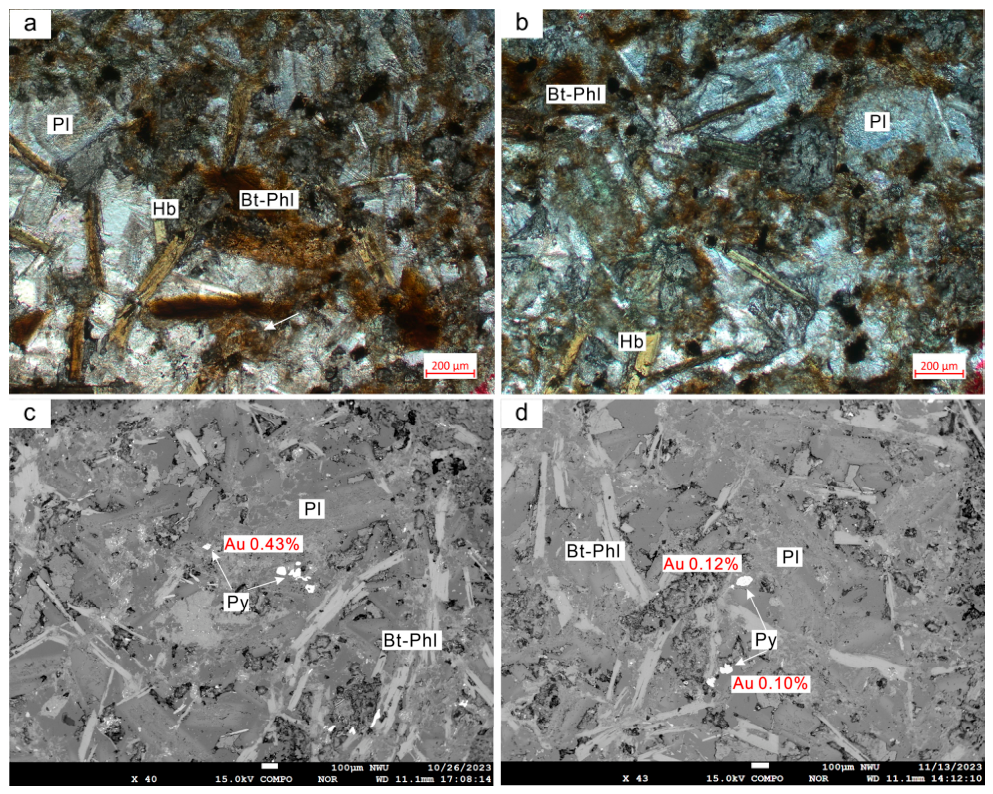
The lamprophyre predominantly occurs as fine-grained veins within the ore bodies or mineralized zones (Figure 4). It is characterized by hornblende phenocrysts, with a groundmass composed primarily of biotite, phlogopite, and plagioclase (Figure 6a,b). The grain size of hornblende is mostly between 0.4 and 0.5 mm, accounting for approximately 40% of the sample, and is primarily in long columnar form, with minor chlorite alteration. The matrix has a grain size of less than 0.2 mm, with biotite–phlogopite content of ~25% and plagioclase content at ~36%. Biotite occurs in lamellar or scaly forms, while most plagioclase is tabular. Additionally, a significant amount of pyrite, measuring approximately 80 μm, is dispersed throughout the lamprophyre, which is commonly associated with biotite and phlogopite (Figure 6c,d). Electron probe microanalysis reveals that all pyrite grains contain gold, with concentrations ranging from 0.10% to 0.43%.
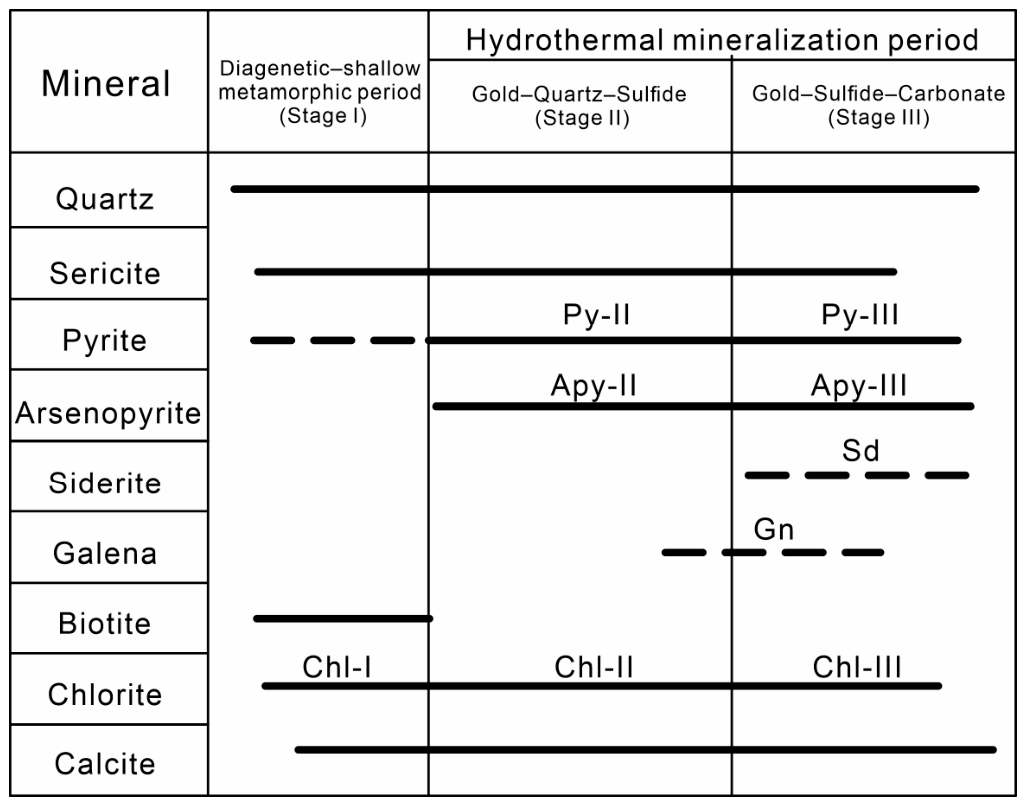
Based on field observations, microscopic textural relationships (Figure 5 and Figure 6), and previous studies by LZM Mining, the gold mineralization at Jinshan can be divided into two periods and three stages (Figure 7): diagenesis and shallow metamorphism (stage I), and hydrothermal mineralization (stages II and III). The hydrothermal period is further subdivided into the gold–quartz–sulfide stage (stage II) and the gold–sulfide–carbonate stage (stage III).

4. Sampling and Analytical Methods

4.1. Sampling

This study focuses on detailed investigations of the Jinshan gold deposit. A total of nine samples, including outcrop and borehole samples, were collected from the No. 1 ore body. The sampling locations are illustrated in Figure 2. Specifically, three representative samples of spotted phyllite and three samples of sericite chlorite phyllite were collected from field exposures (Figure 3d,e). Additionally, two phyllite ore samples were obtained from boreholes (Figure 3f,g), along with one lamprophyre sample (Figure 6).

4.2. Analytical Methods

4.2.1. Zircon U-Pb Geochronology

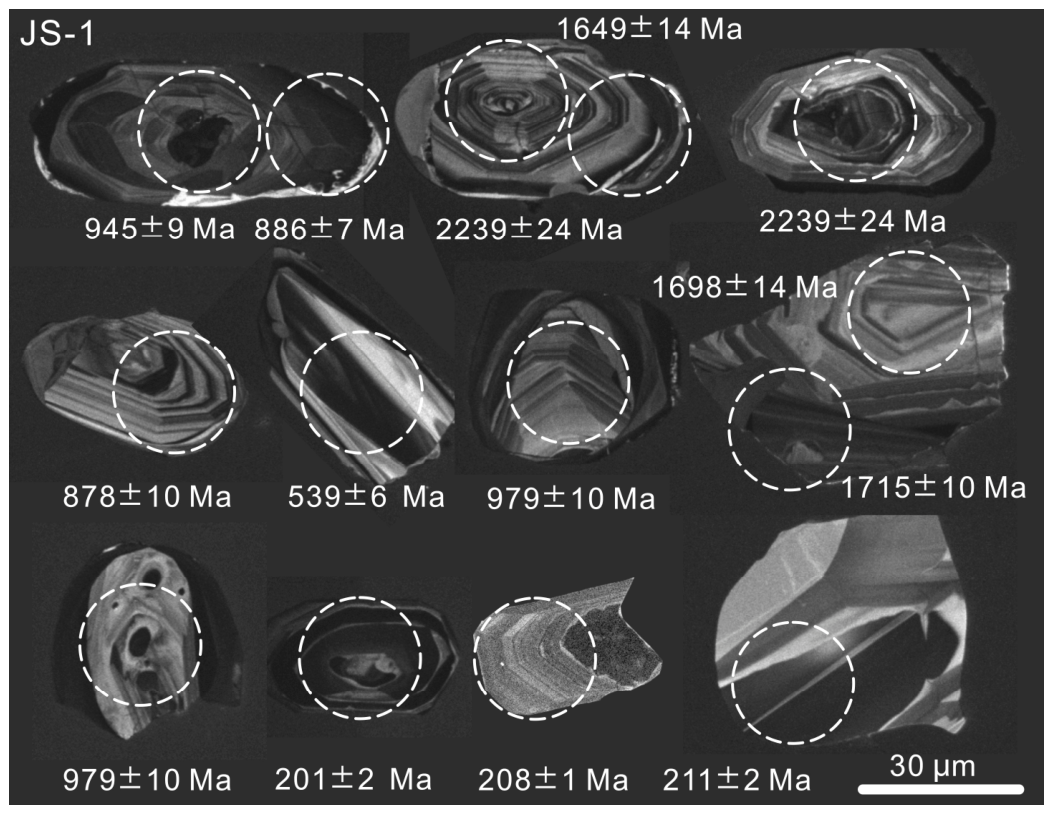
For U-Pb geochronology, zircon grains were separated through conventional magnetic and heavy liquid separation techniques, mounted in epoxy resin, and polished to expose their internal surfaces. Cathodoluminescence (CL) imaging and subsequent U–Pb dating were performed at the State Key Laboratory of Continental Dynamics, Northwest University, China. The internal structures of zircon grains were examined using a Mono CL3+ microprobe (Gatan, Pleasanton, CA, USA) prior to analysis. In situ U-Pb isotopic analyses were conducted by laser ablation inductively coupled plasma mass spectrometry (LA-ICP-MS) using an Agilent 7900 ICP-MS (Agilent Technologies, Santa Clara, CA, USA) coupled to a 193 nm laser (Coherent, Santa Clara, CA, USA), with a spot size of 32 μm. Operational conditions were optimized by ablating the NIST SRM 610 reference glass to achieve high signal sensitivity for high-mass isotopes, minimal oxide production, and stable background levels. The quantifications of U, Th, and Pb concentrations were quantified using 29Si as an internal standard and NIST SRM 610 as the reference material. Isotopic ratios (207Pb/206Pb and 206Pb/238U) were processed through GLITTER 4.0 software and corrected against zircon reference materials 91500 and PLV. Concordia diagrams were generated using the IsoplotR 4.2 [22]. Representative CL images of zircon grains are presented in Figure 8. The zircon U-Pb isotopic data are presented in Table S1.

4.2.2. In Situ Sulfide Microanalysis for S-Fe Isotopes

In situ sulfur and iron isotope analyses of pyrite and arsenopyrite were performed using LA-MC-ICP-MS at the State Key Laboratory of Continental Dynamics, Northwest University. A 193 nm excimer laser ablation system (RESOlution M-50, ASI, Canberra, Australia) coupled to a Nu Plasma 1700 MC-ICP-MS (Nu Instruments, Wrexham, UK) was used. For sulfur isotope analysis, the laser energy density was set to 3.7 J/cm2, with a repetition rate of 2–3 Hz and a spot size of 20–37 μm. High-purity helium (0.28 L/min) and argon (0.96 L/min) were used as carrier and make-up gases, respectively.
The data were calibrated using the sample-standard bracketing (SSB) method. Sulfur isotope ratios are reported as δ34S relative to V-CDT, calculated as δ34S = [(34S/32S_sample)/(34S/32S_standard) − 1] × 1000. The international standard IAEA-S-1 (Ag2S, δ34S_V-CDT = −0.3‰) was used for calibration. Analytical precision (2SE) was ≤0.2‰. Iron isotope ratios are reported as δ56Fe and δ57Fe relative to IRMM-014, defined as δxFe = [(xFe/54Fe_sample)/(xFe/54Fe_standard) − 1] × 1000, where x = 56 or 57. Detailed analytical procedures are described in Chen et al. [23] and Bao et al. [24].

4.2.3. Electron Probe Microanalysis (EPMA)

The major element compositions of pyrite and arsenopyrite were determined using a JEOL JXA-8230 electron probe microanalyzer at the State Key Laboratory of Continental Dynamics, Northwest University. Operating conditions were: acceleration voltage 15 kV, beam current 20 nA, and beam diameter 2 μm. Peak and background counting times were 20 s and 10 s, respectively. Natural and synthetic standards were used for calibration, and analytical accuracy was monitored using the GB/T 15074-2008 standard, General guide of quantitative analysis by EPMA. Standardization Administration of China: Beijing, China, 2008. Detection limits for most elements were below 0.01 wt%.

4.2.4. LA-ICP-MS Trace Elements

In situ trace element analysis of pyrite was performed using laser ablation inductively coupled plasma mass spectrometry (LA-ICP-MS) at Xi’an Zhaonian Mineral Testing Technology Co., Ltd, Xi’an, China. The system consisted of a New Wave NWR 213 laser ablation unit (manufactured by Elemental Scientific Lasers (ESI), Bozeman, MT, USA) coupled to a Thermo Fisher iCAP RQ ICP-MS (manufactured by Thermo Fisher Scientific, Bremen, Germany). Operating parameters were: spot size 40 μm, repetition rate 8 Hz, and energy density ~6 J/cm2. High-purity helium was used as the carrier gas. NIST SRM 610 was used as the primary reference material for calibration, and the data were reduced offline using Iolite 4 software [25]. Reference values for NIST SRM 610 were taken from the GeoReM database. Each analysis consisted of 20 s of background acquisition followed by 45 s of sample ablation.

5. Results

5.1. Lamprophyre Zircon U-Pb Age Data

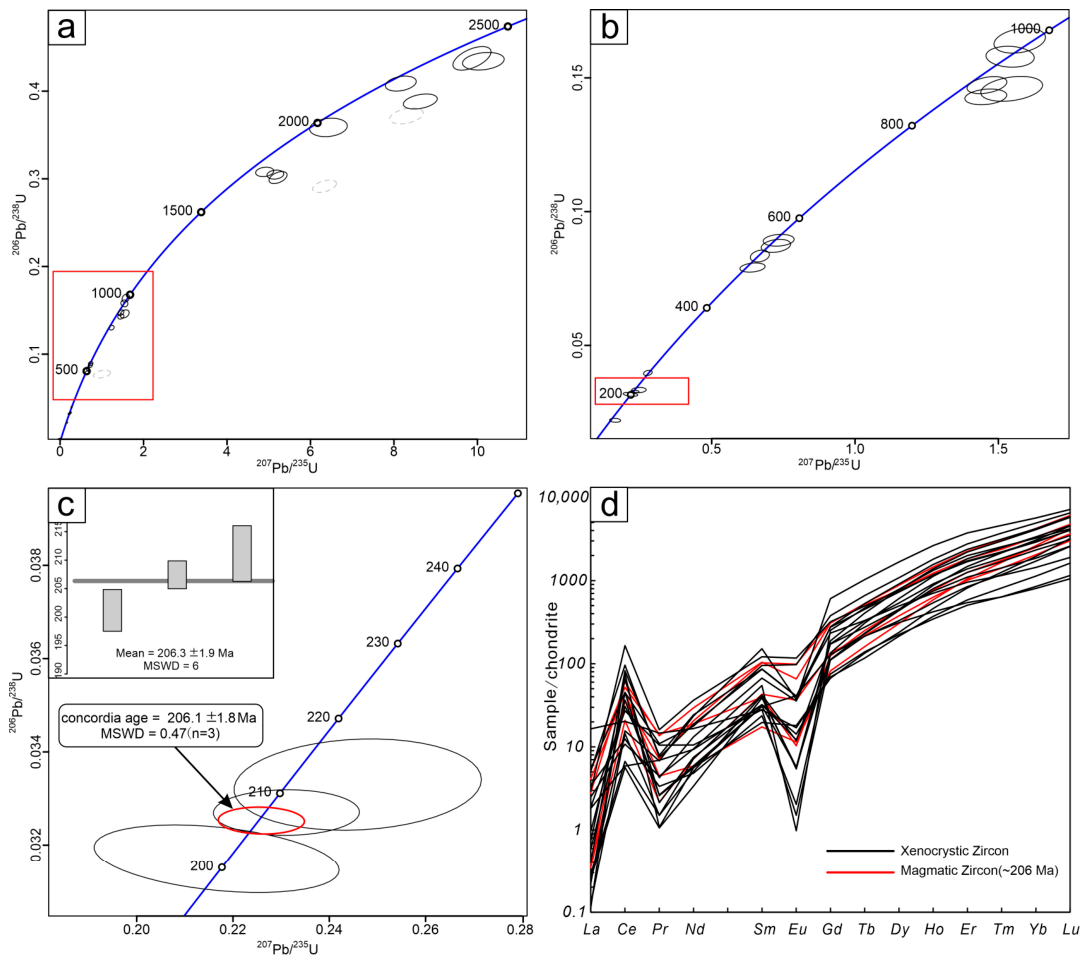
Zircon grains from the lamprophyre sample are euhedral to subhedral in shape, with grain lengths of 30–50 μm, and display broad magmatic oscillatory zoning, indicative of a mafic magma origin (Figure 8). Th/U ratios are high (>0.1), from 0.2 to 1.5, consistent with a magmatic origin. Among the 28 analyzed spots, 25 yielded valid data (Table S1). The zircon ages show a wide distribution ranging from 201 Ma to 2339 Ma. In terms of age populations, six spots yield Paleoproterozoic ages (>1800 Ma), five spots yield Mesoproterozoic ages (1000–1800 Ma), eleven spots yield Neoproterozoic ages (480–1000 Ma). Only three spots yielded Mesozoic ages, all of which are highly consistent, giving a concordia age of 206 ± 2 Ma and a weighted mean age of 206 ± 2 Ma (Figure 9c). Although the number of Mesozoic analyses is limited, their internal consistency and magmatic oscillatory zoning support their interpretation as the crystallization age of the lamprophyre. The remaining older ages are interpreted as xenocrystic zircons captured from country rocks during magma ascent, a common feature in mafic dikes [26,27].

5.2. Geochemistry of Pyrite

The Jinshan gold deposit is characterized by three metallogenic stages, with stages II and III being the most significant. Consequently, EPMA trace element analysis was conducted on pyrite grains from these two stages. Pyrite from stage III is typically smaller, more susceptible to erosion and breakdown, and contains numerous inclusions, such as galena (Figure 5e,f). Therefore, only pyrite from stage II was analyzed for trace elements. The major and trace element compositions of pyrite from the gold ore samples are presented in Table 1 and Table 2. The results indicate that pyrite in the Jinshan gold deposit generally exhibits low concentrations of trace elements. Specifically, pyrite from stages II and III contains Au in the range of 0.03–0.2%. Notably, stage III pyrite is devoid of As, whereas stage II pyrite contains minor amounts of As (0.3–0.82%), consistent with the mineral assemblage characteristics observed under microscopy. Siderophile elements (e.g., Co and Ni), chalcophile elements (e.g., As, Se, and Te), and ore-forming elements (e.g., Cu, Pb, Zn, Ag, and Sb) are all present above detection limits. Additionally, micron-scale galena inclusions were identified in the ablation signals, supporting an interpretation of medium-low temperature mineralization based on the paragenetic relationship between pyrite and galena in stage II.

5.3. Geochemistry of Arsenopyrite

A total of twelve analytical spots were measured on Apy II from the Jinshan gold deposit. The As content ranges from 41.50% to 44.98%, with an atomic percentage between 30.45% and 31.38%, averaging 30.73%. The Fe content varies from 34.85% to 35.66%, whereas the S content ranges from 20.90% to 21.98%, with an atomic percentage ranging from 35.27% to 35.84%. For Apy III, eleven points were tested, revealing an As content of 43.83–45.43%, with an atomic percentage between 32.29% and 32.81%, averaging 32.61%. The Fe content ranges from 33.94% to 35.40%, and the S content ranged from 19.01% to 20.52%, with an atomic percentage between 33.12% and 33.59% (Table 3). Overall, a clear upward trend in the atomic percentage of As is observed from Apy II to Apy III, while the atomic percentage of S shows a distinct downward trend.

5.4. In Situ S-Fe Isotopic Composition of Pyrite and Arsenopyrite

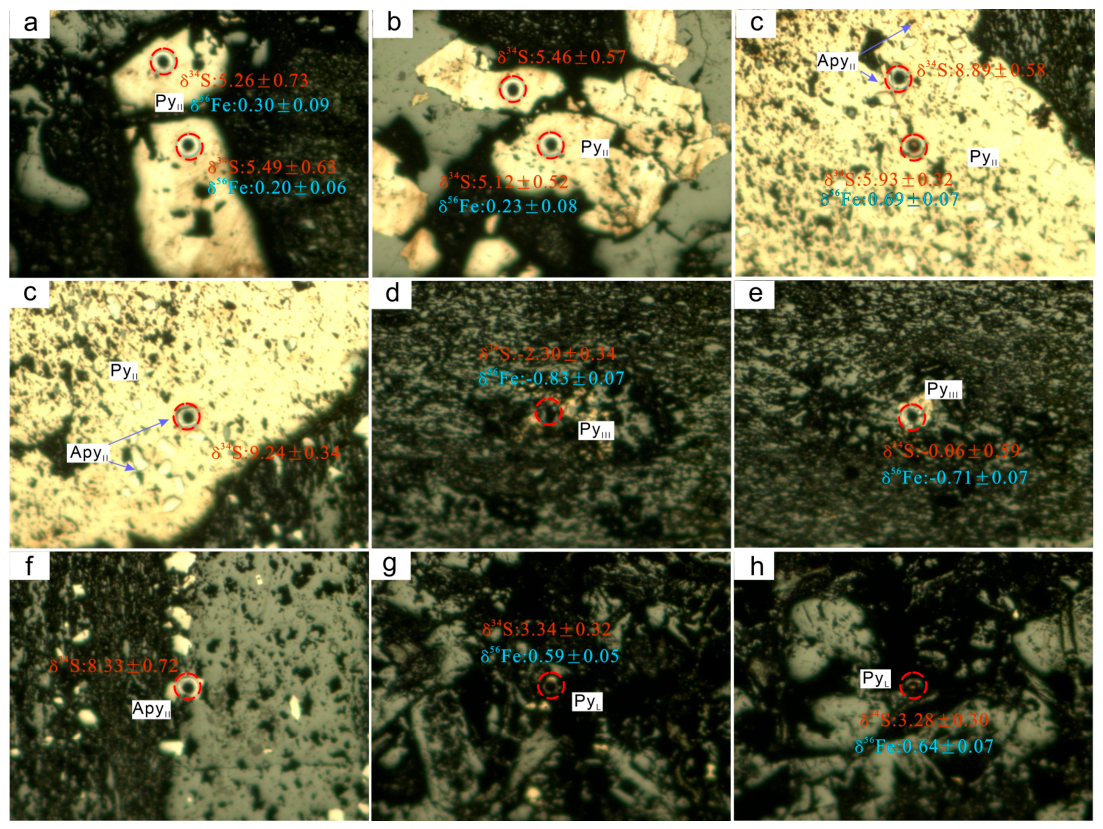
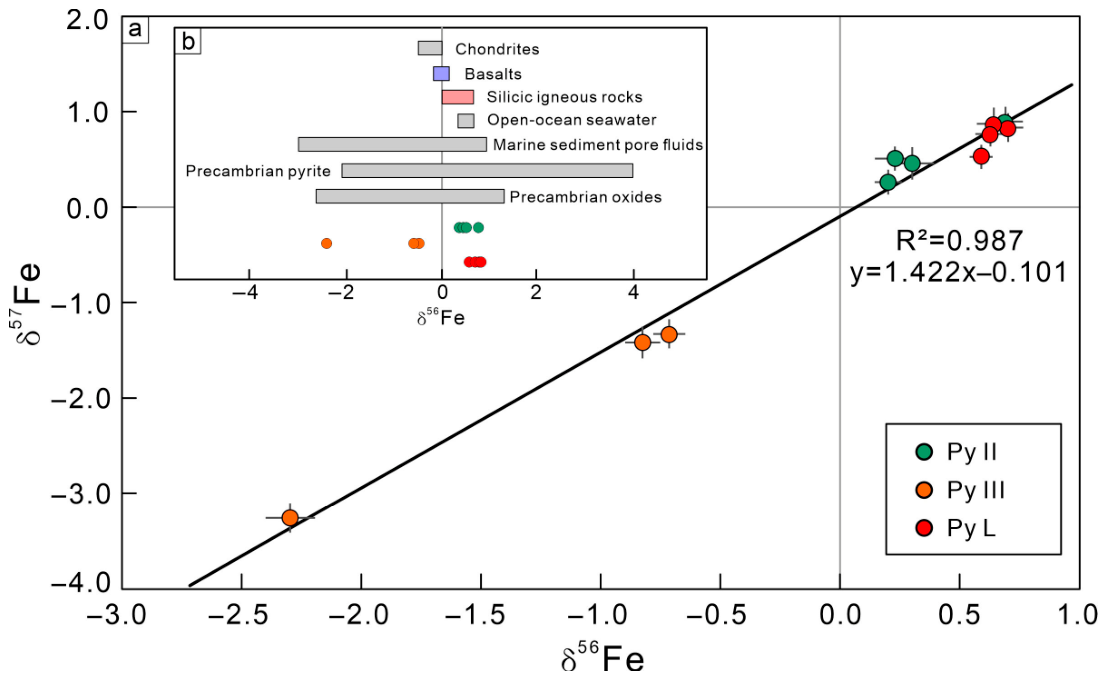
As shown in the results of S-Fe isotopes (Table 4 and Table S2), the δ34S and δ57Fe values of pyrite and arsenopyrite from metallogenic stages I, II, and III show significant variation (Figure 10, Figure 14 and Figure 15). LA-MC-ICP-MS in situ S isotope results reveal the following δ34S compositions: for Apy II, the δ34S ranges from 8.29 to 9.24‰ with an average of 8.29‰ and range of 0.95‰; for Py II, the δ34S ranges from 5 to 6.84‰, with an average of 5.78‰ and extreme differences of 1.84‰; for Py III, the δ34S ranges from −2.30‰ to 1.93‰, with an average of −0.09‰ and extreme differences of 4.23‰; and for Py L, the δ34S ranges from 2.19 to 3.6‰, with an average of 3.2‰ and extreme differences of 1.41‰. These isotopic variations highlight the differences in sulfur sources and geological processes across different metallogenic stages. The δ56Fe and δ57Fe values exhibit a linear correlation (Figure 15a), described by the equation: δ56Fe = 1.422 × δ57Fe − 0.101 (R2 = 0.987). This relationship aligns with the theoretical equilibrium mass fractionation curve, confirming the reliability of the iron isotope data.
Figure 10. Analysis of S-Fe isotope locations and content characteristics of various sulfides in various stages of Jinshan gold deposit.
Geosciences 16 00208 g010

6. Discussion

6.1. Constraints on Mineralization Age

Previous studies have demonstrated that the interpretation of zircon ages in lamprophyres requires consideration of the age spectrum characteristics: the youngest age population typically represents the crystallization age of the lamprophyre, whereas the widely dispersed older age populations represent zircon grains captured from country rocks during magma ascent [26,27]. Zircon grains from the lamprophyre in the Jinshan gold deposit exhibit a wide range of ages (201–2339 Ma), with abundant older ages (>480 Ma) forming multiple age peaks that represent captured ancient crustal zircons, whereas the three youngest spots yield highly consistent ages with a concordia age of 206 ± 2 Ma, representing the crystallization age of the lamprophyre (Figure 9c).
Regionally, the Zhongchuan pluton, adjacent to the Jinshan gold deposit, was mainly emplaced at 236–217 Ma [17,18,19], representing Early–Middle Indosinian crustal melting under a compressional setting. The emplacement age of the lamprophyre (206 Ma) is younger than that of the Zhongchuan pluton, belonging to the Late Indosinian, and records the tectonic transition from syn-collisional compression to post-collisional extension.
Lamprophyre, as a deep-sourced mafic dike, is typically derived from metasomatized lithospheric mantle. Its enrichment in volatiles facilitates the extraction of ore-forming metals from the source, the generation of ore-forming fluids, and the transport, enrichment, and precipitation of gold in hydrothermal systems, exhibiting a close spatiotemporal relationship with gold mineralization [28,29]. It is important to note that the lamprophyre age of 206 ± 2 Ma provides a lower limit, not the exact timing of gold mineralization. The crosscutting relationship indicates that mineralization occurred after lamprophyre emplacement, but the absolute mineralization age remains unconstrained by direct dating of ore-stage minerals. Therefore, throughout this paper, the 206 Ma age is used as a minimum age constraint for gold mineralization at the Jinshan gold deposit.
We acknowledge that the 206 ± 2 Ma age is based on only three zircon spots from a single lamprophyre sample. Zircon grains in lamprophyres are commonly scarce and dominated by xenocrystic populations, making the acquisition of magmatic zircon grains analytically challenging. While the internal consistency of these three analyses and their concordant ages support their interpretation as the crystallization age of the lamprophyre, the limited dataset warrants caution. Nevertheless, given the analytical difficulties, these three concordant spots provide a representative estimate of the emplacement age. Additional lamprophyre samples with higher Mesozoic zircon yields would help strengthen this conclusion.

6.2. Environmental Conditions and Genetic Mechanisms of Pyrite and Arsenopyrite Formation

Pyrite is the most common gold-bearing sulfide in gold deposits and is an important mineral that contains various trace elements, such as Co, Ni, As, Se, Ag, Sb, and Au [30,31]. Variations in the enrichment levels of these trace elements in pyrite are often used to infer the physicochemical conditions of mineralization and the properties of ore-forming fluids [32,33].
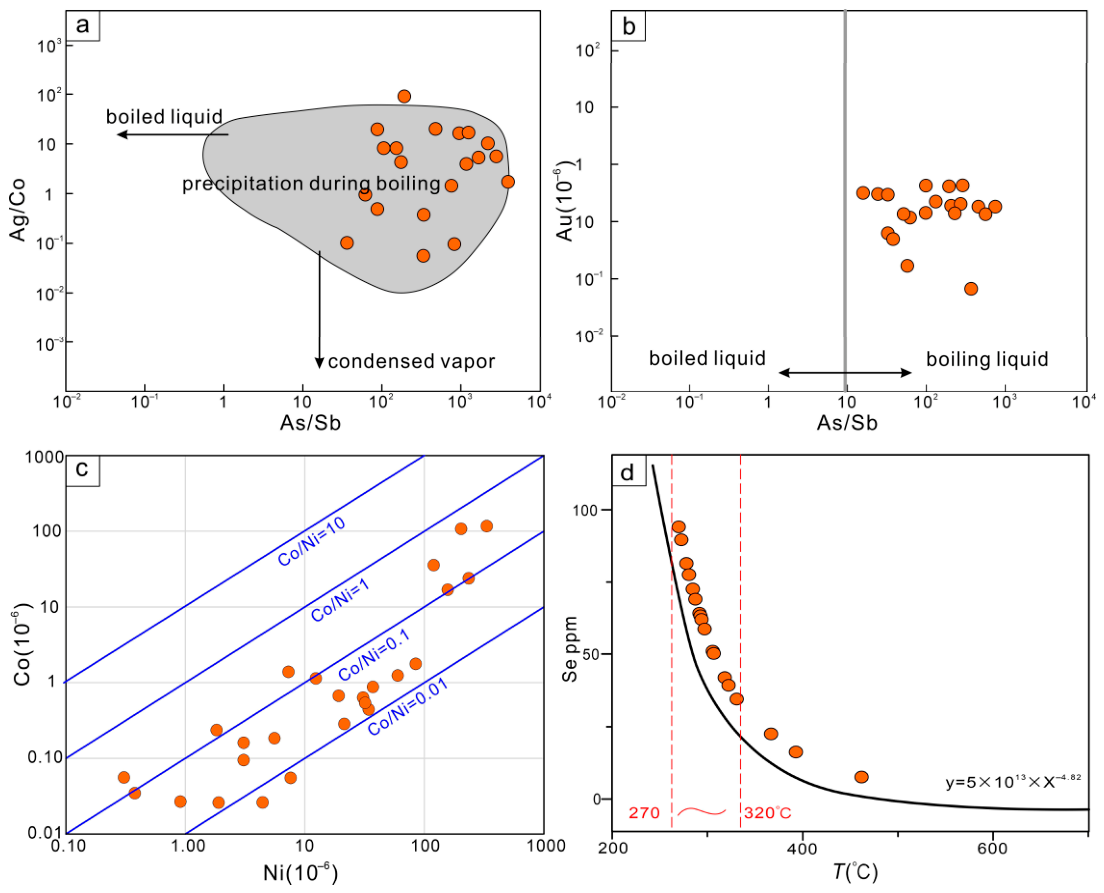
Mantle-derived fluid models generally suggest that hydrothermal fluid rich in CO2 and capable of efficient gold transport are formed through degassing. During gas–liquid separation, elements such as Te, As, Sb, and Tl preferentially partition into the gas phase, whereas elements like Co, Pb, and Ag, which tend to form chloride complexes, remain in the liquid phase [34,35]. In the Jinshan gold deposit, Py II is enriched in gas-phase elements and exhibits low Ag/Co (average 2), Se/Te (average 1.2), and Se/Ge (average value 8). Furthermore, Román et al. [36] proposed that Ag/Co ratios and associated textures in pyrite can distinguish boiling from non-boiling zones in geothermal systems, as boiling triggers Ag precipitation. The Ag/Co ratios (>0.1) in Jinshan pyrite are comparable to those in geothermal pyrite (Figure 11a), supporting the interpretation that boiling played a significant role in Py II precipitation.
Bralia et al. [37] introduced a classification scheme for pyrite origins based on Co/Ni ratios: sedimentary pyrite typically has a Co/Ni ratio <1, whereas volcanic pyrite exhibits ratios between 5 and 50. The chemical similarity between Co and Fe, compared to Co and Ni, suggests that increased Co and Ni concentrations in pyrite reflect significant water–rock interactions between hydrothermal fluids and surrounding rocks, leading to Co enrichment in the fluids. Consequently, the introduction of fluids, such as metamorphic hydrothermal solutions or supergene solutions, can impart sedimentary characteristics to pyrite trace elements [38,39]. In the Jinshan gold deposit, Py II exhibits Co/Ni ratios ranging from 0.005 to 0.533 (average 0.09), consistent with water–rock exchange processes (Figure 11c).
The concentration of various trace elements in pyrite can be influenced by temperature [38]. Among these elements, Se is significantly affected by temperature, exhibiting a clear negative correlation [39]. This relationship can be expressed by the following formula:
Sepyrite = 5 × 10¹³ × T−4.82
Based on this formula, the temperature of the ore-forming fluid during the main metallogenic stage of the Jinshan gold deposit was estimated. The metallogenic temperature mainly ranges from 270 °C to 320 °C, with the peak around 300 °C (Figure 11d).
Figure 11. (a,b) Trace elements in pyrite indicate fluid boiling (after Schaarschmidt et al. [40]); (c) Co-Ni diagram of pyrite; (d) inverting ore-forming temperature by element Se in pyrite from the Jinshan gold deposit (modified after Keith et al. [39]).
Geosciences 16 00208 g011
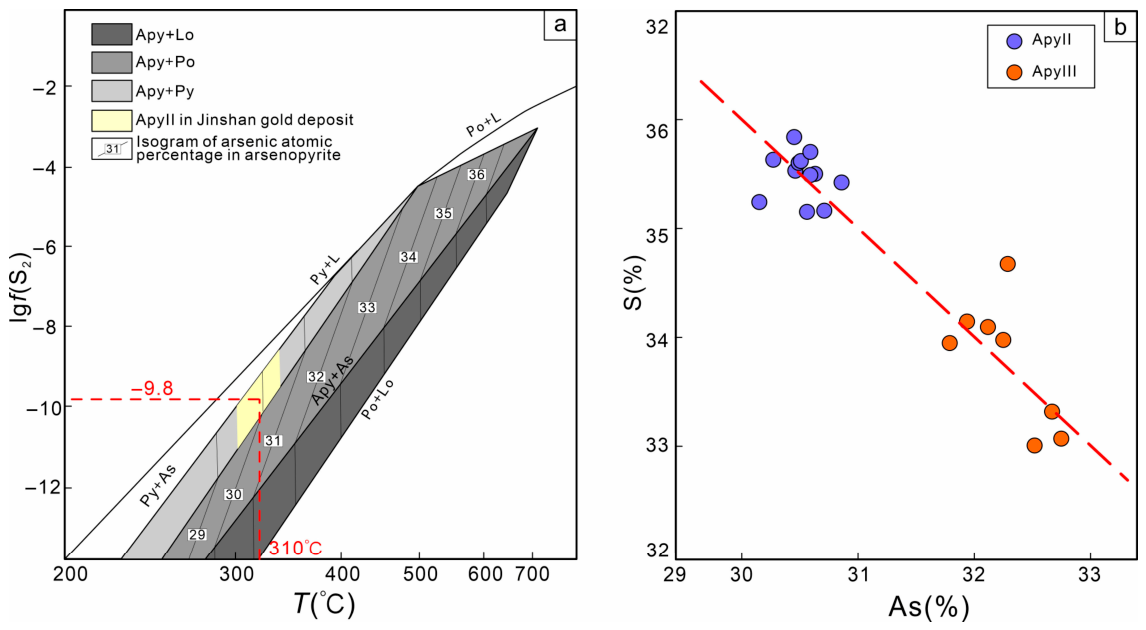
The relationship between the symbiotic temperature (t) and sulfur fugacity (logfS2) of arsenopyrite minerals, established by Kretschmar and Scott [41] and Sharp et al. [42], has been widely applied to hydrothermal gold deposits in various geological settings (such as [3,7]). In the Jinshan gold deposit, Apy II exhibits a notable paragenetic relationship with pyrite (Figure 5e). Based on observed associations of minerals in ore sections and the stages of mineralization, the atomic percentage of arsenopyrite was plotted on the T-logfS2 diagram to infer the environmental information of arsenopyrite formation. The results indicate that the formation temperature of Apy II in the Jinshan gold deposit generally exceeds 280 °C, ranging from 280 °C to 350 °C, with a median temperature of 310 °C (Figure 12a).
Apy III predominantly coexists with siderite (Figure 5h). Research suggests that under low oxygen fugacity and neutral pH conditions, siderite can adsorb arsenate (As3+) and arsenite (As5+) to varying extents [43]. Consequently, the high atomic percentage of arsenic (32.29–32.81%) in Apy III may be attributed to arsenic adsorption by siderite during the late gold–sulfide–carbonate stage. However, the use of the logfS2-T diagram may lead to an overestimation of temperature and sulfur fugacity. In addition, the As atomic percentage in arsenopyrite across all stages of the Jinshan gold deposit exhibits a clear negative correlation with the S atomic percentage, indicating that arsenic substitutes for sulfur in arsenopyrite (Figure 12b).
The somewhat higher temperatures from the arsenopyrite geothermometer (280–350 °C) may reflect the conditions of early-stage Apy II formation, whereas the Se-in-pyrite temperatures (270–320 °C) and thermodynamic simulations (250–300 °C) better represent the gold precipitation stage.

6.3. Thermodynamic Simulation of Mineralization

Numerous studies suggest that gold is primarily present in hydrothermal solutions as Au-Cl and Au-HS complexes [44,45,46,47]. The solubility of gold in hydrothermal solutions containing H2S and NaCl is not influenced by the activity of Cl; instead, it increases with higher activity levels of H2S [48,49]. Additionally, factors such as temperature, pressure, pH, oxygen fugacity, and the concentration of reduced sulfur directly impact the solubility of gold–sulfur complexes in hydrothermal solutions [50,51,52].
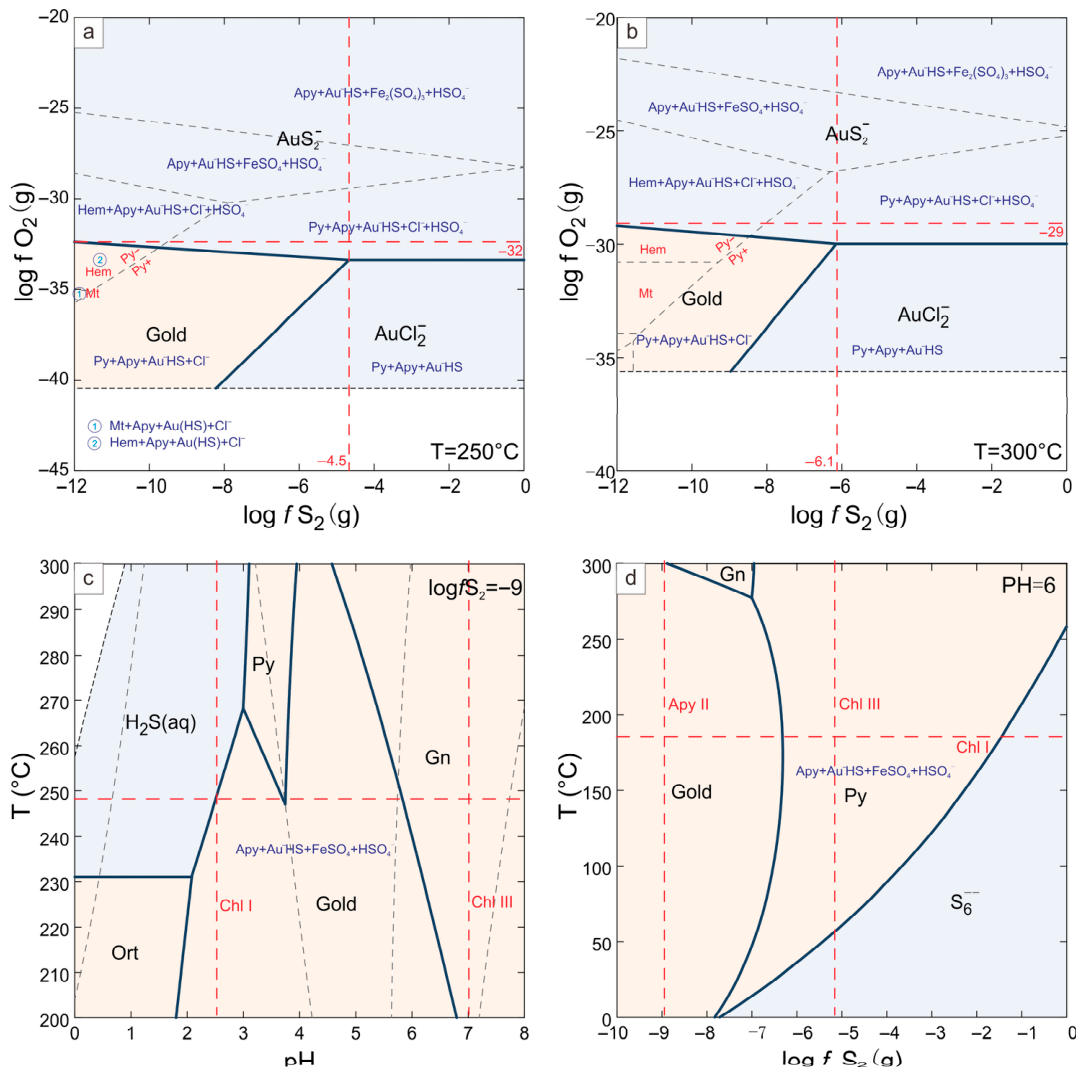
In this study, we used the geochemical simulation software GWB (Geochemist’s Workbench 11.0) to simulate and analyze how variations in temperature, ion concentration, oxygen fugacity, sulfur fugacity, and pH influence the forms of Au present in hydrothermal solutions. The simulation results indicate that in the Jinshan gold deposit, Au predominantly occurs as Au-HS complexes and native gold, with a minor presence of AuCl2 (Figure 13a,b). Natural gold precipitation occurs at temperatures between 250 °C and 300 °C under conditions where logfS2 < −6 and logfO2 < −30. When logfS2 = −9, gold primarily exists in arsenopyrite and pyrite as Au-HS, with these conditions influenced by the pH values of Chl I and Chl II [14] (Figure 13c). The order of mineral crystallization with increasing pH is arsenopyrite, pyrite, and then galena. Under neutral conditions with a pH = 6, when logfS2 ranges between −9 (Apy II) and −5 (Chl II), gold mainly exists in fluid as Au-HS, while galena forms at higher temperatures (greater than 270 °C; Figure 13d). These simulation results (250–300 °C for gold precipitation) are slightly lower than the temperature estimates from the arsenopyrite geothermometer, but overlap with the Se-in-pyrite estimates. These differences reflect the specific minerals and equilibrium assemblages used in each method, and together they constrain the main stage of gold mineralization to approximately 270–320 °C. Therefore, gold in the Jinshan gold deposit is mainly produced in the environment of low logfS2 (−5 to −9), neutral pH (5~7) and medium temperature (270–320 °C), consistent with the trace element data from pyrite and arsenopyrite.

6.4. Constraints on Ore Source from Sulfur and Iron Isotopes

The primary gold-bearing minerals in the Jinshan gold deposit are pyrite and arsenopyrite, both of which are closely related to gold mineralization. A very small quantity of galena was also identified in the deposit (Figure 5b,e,f). Based on the analysis of the physical and chemical conditions of mineralization, the δ34S value of pyrite and arsenopyrite can effectively represent the sulfur isotope composition of the ore-forming hydrothermal fluid.
Sulfur in the Earth’s crust originates from three main sources: mantle (or magmatic) sulfur, sedimentary (reduced) sulfur, and seawater sulfur [53,54]. The δ34S values of mantle-derived, granitic, and basaltic sulfur typically range from (0 ± 3) ‰, 0‰ to 5‰, and 5‰ to 15‰, respectively, exhibiting near-mantle or moderately positive signatures. In contrast, sedimentary sulfur commonly displays more negative δ34S values. Marine sulfate reservoirs are characterized by significantly positive δ34S values that have varied substantially throughout Earth’s history. Ore-forming sulfur may originate from either a homogeneous source or represent mixed contributions from multiple reservoirs [55].
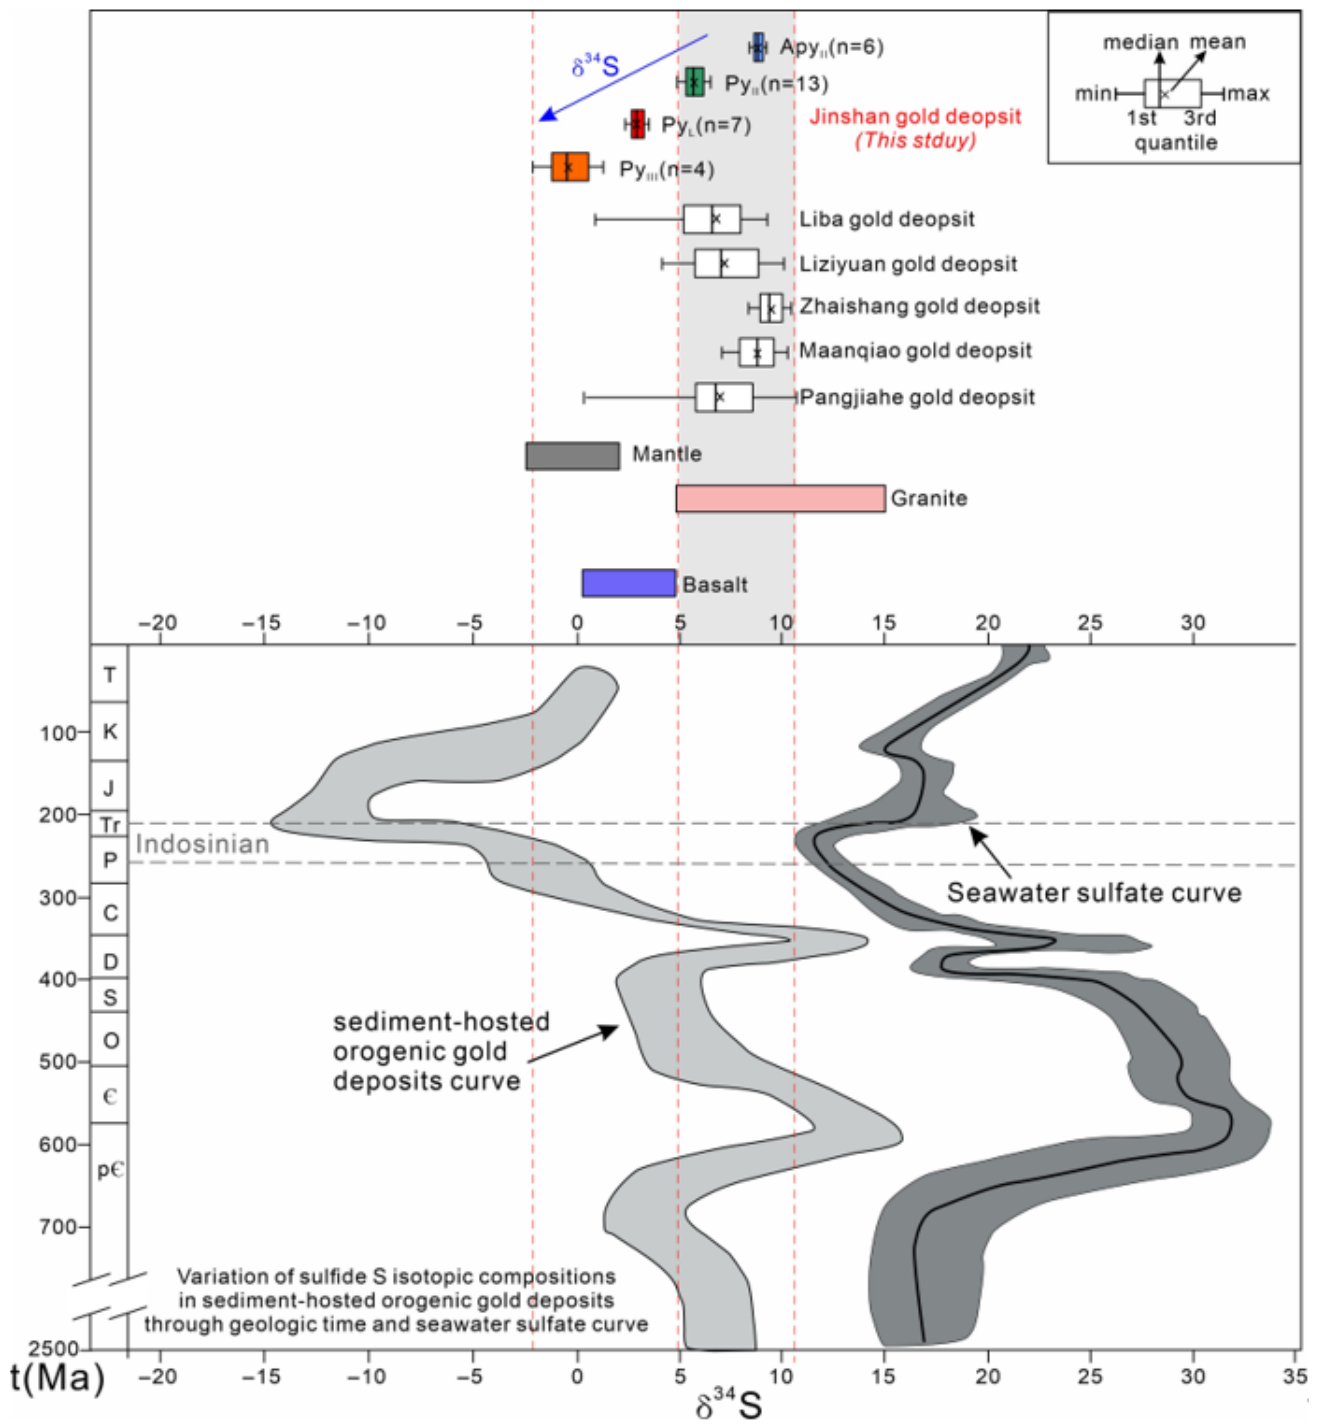
In the Jinshan gold deposit, δ34S values decrease from stage II to stage III (Figure 14). Stage II δ34S values for Apy II and Py II are consistent with those of gold deposits in the WQMB, such as the Liba [21], Liziyuant [56], Zhaishang [57], Maanqiao [58], and Pangjiahe gold deposit [59], suggesting a granitic or Devonian sulfur source. In contrast, the δ34S values of Py L resemble those of mantle and basaltic materials, indicating a mantle-derived contribution. The lower δ34S values in Py III may reflect the mixing of hydrothermal fluids with meteoric or surface water during late-stage mineralization (Figure 14). Therefore, the ore-forming materials in the Jinshan deposit are interpreted to have primarily originated from deep mantle sources, with later contributions from meteoric or surface water mixed into the hydrothermal system during the gold–sulfide–carbonate stage.
Figure 14. The δ34S values between various sulfides in the Jinshan gold deposit and typical gold deposits in the Zhongchuan area and surrounding areas. Data source: Liba gold deposit, Li et al. [21]; Liziyuan gold deposit, Ding et al. [56]; Zhaishang gold deposit, Liu et al. [57]; Maanqiao gold deposit, Zhu et al. [58]; Pangjiahe gold deposit, Ma et al. [59]; temporal curves for δ34S values of pyrite in sedimentary rock-hosted orogenic gold deposits and sulfate seawater, Chang et al. [60].
Geosciences 16 00208 g014
Iron isotope fractionation occurs during processes such as fluid exsolution from magma chambers and subsequent fluid evolution [61,62]. Initial fluids exsolved from magma are enriched in light iron isotopes, whereas highly differentiated igneous rocks are enriched in heavy iron isotopes [63,64,65]. The complex evolution of these fluids leads to iron isotope fractionation, making Fe isotopes valuable tracers for mineralization processes and hydrothermal evolution [66,67,68].
In the Jinshan gold deposit, the δ56Fe values of Py III range from −2.30‰to −0.71‰, significantly different from those of Py II and Py L (0.20‰ to 0.69‰). This divergence highlights the distinct geochemical conditions and processes governing the formation of pyrite in these stages. The δ56Fe values of Py II and Py L reflect the characteristics of silicic igneous rocks and basalts, respectively, whereas the δ56Fe values of Py III resemble those of marine sediment pore fluids and Precambrian oxides (Figure 15b). The progressive decrease in δ56Fe in pyrite during fluid evolution suggests the mixing of magmatic fluids with iron derived from surrounding rocks.
Figure 15. (a) Plot of measured δ57Fe versus δ56Fe values of Fe-bearing minerals from different stages in the Jinshan gold deposit. (b) Range in δ56Fe isotope compositions for various fluids, rocks, and minerals; data from Johnson [69].
Geosciences 16 00208 g015
The interpretation of fluid mixing is qualitative at this stage. Quantitative two-component or three-component mixing modeling is not attempted because the isotopic compositions of the end-members (mantle, Devonian sedimentary, and meteoric water) are not sufficiently constrained from independent data at the Jinshan deposit.

6.5. Genetic Model of the Jinshan Gold Deposit

Before presenting the genetic model, we evaluate alternative fluid sources. A purely metamorphic or sedimentary basinal fluid origin is considered unlikely for the following reasons: (1) the mantle-like δ34S (2.19–3.6‰) and δ56Fe (0.58–0.68‰) signatures of Py L are inconsistent with typical metamorphic fluids derived from the devolatilization of pyrite-bearing metasediments (δ34S typically −5 to +5‰; [53]); (2) the lamprophyre provides a direct magmatic link absent in purely metamorphic or sedimentary systems; (3) the 206 Ma lamprophyre age postdates Devonian sedimentation by ~150 Ma, making a syndepositional sedimentary source unlikely; and (4) the systematic decrease in δ34S and δ56Fe from stage II to stage III is best explained by mixing between a mantle-derived magmatic fluid and meteoric water, rather than by a single fluid source. Therefore, a mantle-derived magmatic fluid is the most consistent interpretation.
The Jinshan and Liba gold deposits are located in the same ore concentration area around the Zhongchuan pluton, sharing similar host rocks, magmatic associations, and structural controls [1,12,13,14]. Previous studies have linked the Liba deposit to mantle-derived magmatism [20,27]. The newly obtained lamprophyre zircon U-Pb age of 206 ± 2 Ma from Jinshan, together with the in situ S-Fe isotopic and thermodynamic data presented in this study, provides the first direct evidence that the Jinshan deposit shares the same magmatic–hydrothermal origin. These findings are consistent with a coherent magmatic–hydrothermal gold system in the Zhongchuan district, related to Late Indosinian mantle-derived magmatism during the transition from compression to extension.
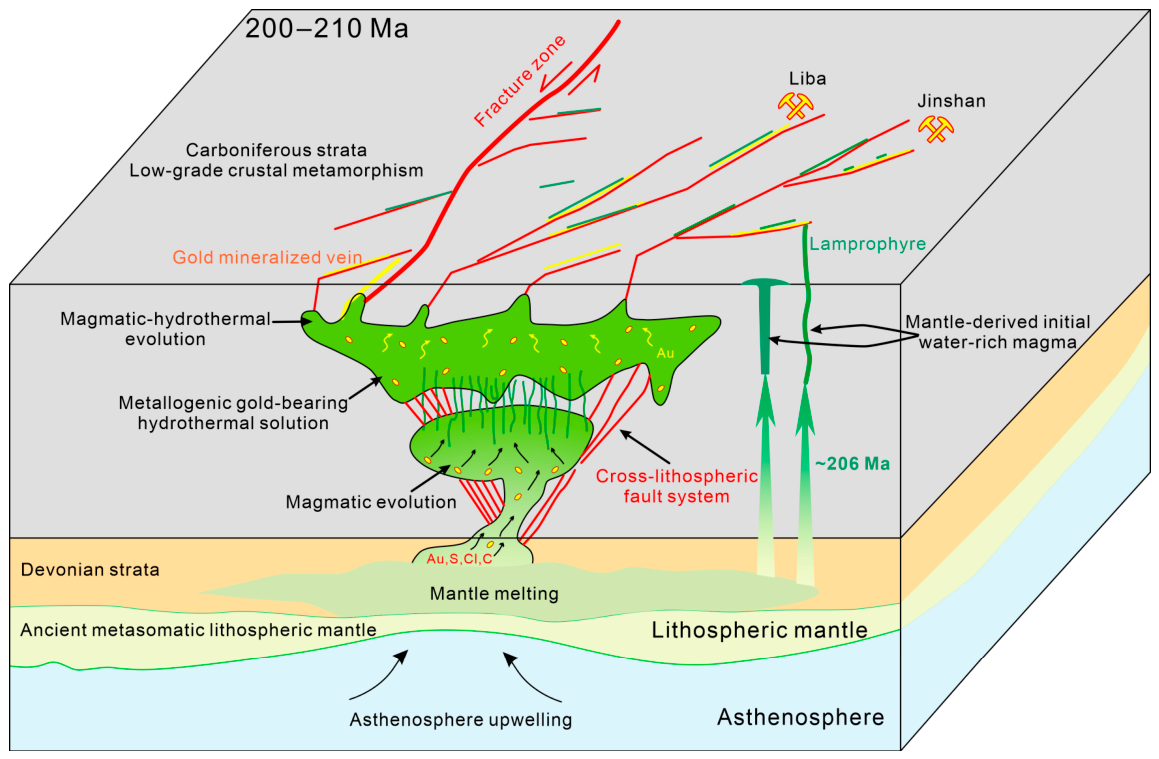
Combined with geological characteristics, physicochemical conditions, and S-Fe isotopic signatures, we interpret that gold mineralization at Jinshan was most likely derived from the partial melting of the metasomatized mantle, based on the integrated age, geochemical, and isotopic evidence presented above (Figure 13, Figure 14 and Figure 15). Mantle-derived hydrous magma mobilized Au and volatiles (H2O, S, Cl, and C), leading to their initial enrichment in the melt [70,71]. The volatile-rich magma ascended along trans-lithospheric faults, during which Au partitioned into exsolved magmatic–hydrothermal fluids [72,73,74,75]. The ore-forming fluids migrated along secondary fractures and triggered efficient gold precipitation through boiling (Figure 16).
Regionally, the West Qinling orogenic belt experienced a transition from subduction to slab break-off during the Indosinian period [10,76]. The Zhongchuan pluton was emplaced at 236–217 Ma, representing crustal melting under a compressional setting, whereas the lamprophyre (~206 Ma) records the tectonic transition from compression to extension. The Jinshan gold deposit is located approximately 3.5 km south of the Zhongchuan pluton and is controlled by a trans-lithospheric fault system. This provides a lower limit constraint on the gold mineralization age of ca. 206 Ma, which is consistent with the timing of the regional tectonic transition.
In summary, the Jinshan gold deposit formed in a tectonic setting transitioning from compression to extension during the Late Indosinian (ca. 237–201 Ma). Asthenospheric upwelling induced partial melting of the metasomatized lithospheric mantle, generating volatile-rich mantle-derived magmas that ascended along trans-lithospheric faults. The ore-forming fluids exsolved during magmatic–hydrothermal evolution precipitated gold through boiling at favorable sites (Figure 16).

7. Conclusions

(1)
Zircon U-Pb dating of lamprophyre yields an age of 206 ± 2 Ma, and provides a lower-limit constraint on the timing of gold mineralization, corresponding to the collisional–extensional transition period in the region.
(2)
The Jinshan gold deposit formed under medium-temperature (270–320 °C), low sulfur fugacity (logƒS2: −9 to −5), and neutral pH (5–7) conditions. Hydrothermal boiling during stage II (gold–quartz–sulfide stage) was pivotal in driving gold precipitation.
(3)
Pyrite from stage II is enriched in volatile elements (e.g., As, Sb, and Te), reflecting boiling-induced mineralization, whereas arsenopyrite exhibits As-S substitution. Sulfur isotopes (δ34S) reveal a mixed mantle–sedimentary source with late-stage meteoric water input, and iron isotopes (δ56Fe) indicate the progressive mixing of magmatic fluids with iron derived from wall rocks.
(4)
Gold primarily existed as Au-HS complexes in hydrothermal fluids, precipitating at 270–320 °C under low sulfur and oxygen fugacity. Ore-forming materials are interpreted to have been derived from deep mantle sources, with late-stage contributions from meteoric or surface water.
In summary, the Jinshan gold deposit is a typical Indosinian (206 ± 2 Ma) medium-temperature, boiling-driven, mantle-derived gold system formed during the collisional–extensional transition, with late-stage meteoric water overprinting.

Supplementary Materials

The following supporting information can be downloaded at https://www.mdpi.com/article/10.3390/geosciences16060208/s1, Table S1: Zircon U-Pb geochronological data for lamprophyre from the Jinshan gold deposit; Table S2: The δ56Fe values of various sulfides in various stages of Jinshan gold deposit.

Author Contributions

Conceptualization, H.L.; methodology, H.L. and Z.X.; software, H.L. and H.G.; validation, K.Y., C.M., H.L. and X.Y.; formal analysis, J.L. and L.C.; investigation, H.L. and X.Y.; resources, J.L.; data curation, L.C. and H.W.; writing—original draft preparation, H.L.; writing—review and editing, H.L., Z.X. and K.Y.; visualization, H.G. and H.W.; supervision, C.M.; project administration, H.L.; funding acquisition, H.L. and Z.X. All authors have read and agreed to the published version of the manuscript.

Funding

This research received external funding from the Shaanxi Provincial Natural Science Basic Research Young Scientists Program (2025JC-YBQN-402) and the Project of China Geological Survey (No. DD202602110001).

Data Availability Statement

The raw data supporting the conclusions of this article will be made available by the authors on request.

Acknowledgments

Thanks to Longnan Zijin Mining Co., Ltd. for their support and assistance. We also sincerely acknowledge Eline Le Breton for the fruitful discussion, two anonymous reviewers for the insightful suggestions that improved the work and Muhammad Usman for his support.

Conflicts of Interest

Author J.L. is employed by the company Longnan Zijin Mining Limited Company. The remaining authors declare that the research was conducted in the absence of any commercial or financial relationships that could be construed as a potential conflict of interest.

References

  1. Wyman, D. Lamprophyres, gold and orogenies: A mineral systems perspective. Geol. Soc. Lond. Spec. Publ. 2025, 551, 369–384. [Google Scholar] [CrossRef]
  2. Wang, X.; Wang, Z.; Zhang, W.; Ma, L.; Chen, W.; Cai, Y.-C.; Foley, S.; Wang, C.Y.; Li, J.; Deng, J.; et al. Sulfur isotopes of lamprophyres and implications for the control of metasomatized lithospheric mantle on the giant Jiaodong gold deposits, Eastern China. GSA Bull. 2024, 136, 3405–3418. [Google Scholar] [CrossRef]
  3. Deng, J.; Liu, X.F.; Wang, Q.F.; Pan, R. Origin of the Jiaodong type Xinli gold deposit, Jiaodong peninsula, China: Constraints from fluid inclusion and C-D-O-S-Sr isotope compositions. Ore Geol. Rev. 2015, 65, 674–686. [Google Scholar] [CrossRef]
  4. Yang, L.Q.; Guo, L.N.; Wang, Z.L.; Zhao, R.-X.; Song, M.-C.; Zheng, X.-L. Timing and mechanism of gold mineralization at the Wang’ ershan gold deposit, Jiaodong Peninsula, eastern China. Ore Geol. Rev. 2017, 88, 491–510. [Google Scholar] [CrossRef]
  5. Shu, Q.H.; Chang, Z.S.; Hammerli, J.; Lai, Y.; Huizenga, J.-M. Composition and evolution of fluids forming the Baiyinnuo’er Zn-Pb skarn deposit, northeastern China: Insights from laser ablation ICPMS study of fluid inclusions. Econ. Geol. 2017, 112, 1441–1460. [Google Scholar] [CrossRef]
  6. Zhang, L.; Yang, L.Q.; Wang, Y.; Weinberg, R.F.; An, P.; Chen, B.-Y. Thermochronologic constrains on the processes of formation and exhumation of the Xinli orogenic gold deposit, Jiaodong Peninsula, eastern China. Ore Geol. Rev. 2017, 81, 140–153. [Google Scholar] [CrossRef]
  7. Kerr, L.C.; Craw, D.; Youngson, J.H. Arsenopyrite compositional variation over variable temperatures of mineralization, Otago Schist, New Zealand. Econ. Geol. 1999, 94, 123–128. [Google Scholar] [CrossRef]
  8. Corkhill, C.L.; Vaughan, D.J. Arsenopyrite oxidation: A review. Appl. Geochem. 2009, 24, 2342–2361. [Google Scholar] [CrossRef]
  9. Yang, L.-Q.; Deng, J.; Li, N.; Zhang, C.; Ji, X.-Z.; Yu, J.-Y. Isotopic characteristics of gold deposits in the Yangshan Gold Belt, West Qinling, central China: Implications for fluid and metal sources and ore genesis. J. Geochem. Explor. 2016, 168, 103–118. [Google Scholar] [CrossRef]
  10. Dong, Y.P.; Santosh, M. Tectonic architecture and multiple orogeny of the Qinling orogenic belt, central China. Gondwana Res. 2016, 29, 1–40. [Google Scholar] [CrossRef]
  11. Yang, L.-Q.; Deng, J.; Dilek, Y.; Qiu, K.-F.; Ji, X.-Z.; Li, N.; Taylor, R.D.; Yu, J.-Y. Structure, geochronology, and petrogenesis of the Late Triassic Puziba granitoid dikes in the Mianlue suture zone, Qinling orogen, China. Geol. Soc. Am. Bull. 2015, 11, 1831–1854. [Google Scholar] [CrossRef]
  12. Tan, H.B. Formation Types and Comparative Analysis of Jinshan and Maquan Gold Deposits in Gansu. Northwest. Geol. 2009, 42, 1–10, (In Chinese with English Abstract). [Google Scholar]
  13. Yuan, X.W. Ore-controlling Factors and Genesis of Jinshan Gold Deposit in Gansu. Gansu Metall. 2016, 38, 48–51, (In Chinese with English Abstract). [Google Scholar]
  14. Li, H.; Fan, B.C.; Xue, Z.K.; Yang, X.Q.; Luo, J.X.; Lu, X.M. Metallogenic Mechanism of the Jinshan Gold Deposit in the West Qinling Orogenic Belt: Evidence from Geochemical Characteristics of Arsenopyrite and Chlorite. Northwest. Geol. 2026, 59, 79–96, (In Chinese with English Abstract). [Google Scholar]
  15. Lai, X.D. The comprehensive study of prospecting prediction and primary haol geochemical characteristics of Jinshan gold deposit in Lixian County of Gansu. Miner. Resour. Geol. 2021, 4, 18, (In Chinese with English Abstract). [Google Scholar]
  16. Zhu, L.M.; Zhang, G.W.; Yang, T.; Wang, F.; Gong, H. Geochronology, petrogenesis and tectonic implications of the Zhongchuan granitic pluton in the Western Qinling metallogenic belt, China. Geol. J. 2013, 48, 310–334. [Google Scholar] [CrossRef]
  17. Zeng, Q.T.; McCuaig, T.C.; Hart, C.J.; Jourdan, F.; Muhling, J.; Bagas, L. Structural and geochronological studies on the Liba goldfield of the West Qinling Orogen, Central China. Miner. Depos. 2012, 47, 799–819. [Google Scholar] [CrossRef]
  18. Zeng, Q.T.; Mccuaig, T.C.; Tohver, E.; Bagas, L.; Lu, Y. Episodic Triassic magmatism in the western South Qinling Orogen, central China, and its implications. Geol. J. 2014, 49, 402–423. [Google Scholar] [CrossRef]
  19. Wang, X.X.; Wang, T.; Zhang, C.L. Neoproterozoic, Paleozoic, and Mesozoic granitoid magmatism in the Qinling Orogen, China: Constraints on orogenic process. J. Asian Earth Sci. 2013, 72, 129–151. [Google Scholar] [CrossRef]
  20. Ke, C.H.; Wang, X.X.; Yang, Y.; Tian, Y.F.; Li, J.B.; Nie, Z.R. Petrogenesis of dykes and its relationship to gold mineralization in the western Qinling belt: Constraints from zircon U-Pb age, geochemistry and Nd-Hf-S isotopes of Liba gold deposit. Miner. Depos. 2020, 1, 3, (In Chinese with English Abstract). [Google Scholar]
  21. Li, B.; Zhu, L.M.; Ding, L.L.; Ma, Y.B.; Xiong, X.; Yang, T.; Wang, F. Geology, isotope geochemistry, and ore genesis of the Liba gold deposit in the western Qinling orogen, China. Acta Geol. Sin. 2021, 95, 427–448, (In Chinese with English Abstract). [Google Scholar]
  22. Vermeesch, P. IsoplotR: A free and open toolbox for geochronology. Geosci. Front. 2018, 9, 1479–1493. [Google Scholar] [CrossRef]
  23. Chen, L.; Yuan, H.L.; Chen, K.Y.; Bao, Z.; Zhu, L.; Liang, P. In situ sulfur isotope analysis by laser ablation MC-ICPMS and a case study of the Erlihe Zn-Pb ore deposit, Qinling orogenic belt, Central China. J. Asian Earth Sci. 2019, 176, 325–336. [Google Scholar] [CrossRef]
  24. Bao, Z.A.; Chen, L.; Zong, C.L.; Yuan, H.; Chen, K.; Dai, M. Development of pressed sulfide powder tablets for in situ sulfur and lead isotope measurement using LA-MC-ICP-MS. Int. J. Mass Spectrom. 2017, 421, 255–262. [Google Scholar] [CrossRef]
  25. Paton, C.; Hellstrom, J.; Paul, B.; Woodhead, J.; Hergt, J. Iolite: Freeware for the visualisation and processing of mass spectrometric data. J. Anal. At. Spectrom. 2011, 26, 2508–2518. [Google Scholar] [CrossRef]
  26. Guo, Z.C.; Shi, Y.; Wang, X.Y.; Fu, W.; Liu, X.; Qin, K.; Liu, L. LA-ICP-MS Zircon U-Pb Dating of Leidong Lamprophyre in Luocheng, Northern Guangxi and Its Geological Significance. J. Guilin Univ. Technol. 2018, 38, 208–216, (In Chinese with English Abstract). [Google Scholar]
  27. Liu, S. Mesozoic Magmatism and Crustal Extension in Shandong Province-With a Discussion on the Relationship between Lamprophyres and Gold Mineralization. Ph.D. Thesis, Graduate School of Chinese Academy of Sciences (Institute of Geochemistry), Guiyang, China, 2004. (In Chinese with English Abstract). [Google Scholar]
  28. Xiong, L. Mesozoic Magmatic Evolution and Its Relationship with Gold Mineralization in the Eastern Hebei-Western Liaoning Region. Ph.D. Thesis, China University of Geosciences, Wuhan, China, 2017. (In Chinese with English Abstract). [Google Scholar]
  29. Wang, Y.; Wang, Q.; Groves, D.I.; Xue, S.; Wang, T.; Yang, L.; Deng, J. Volatile budgets and gold mobilization in metasomatized sub-continental lithospheric mantle. Geochim. Cosmochim. Acta 2024, 376, 1–13. [Google Scholar] [CrossRef]
  30. Reich, M.; Kesler, S.E.; Utsunomiya, S.; Palenik, C.S.; Chryssoulis, S.L.; Ewing, R.C. Solubility of gold in arsenian pyrite. Geochim. Cosmochim. Acta 2005, 69, 2781–2796. [Google Scholar] [CrossRef]
  31. Large, R.R.; Danyushevsky, L.; Hollit, C.; Maslennikov, V.; Meffre, S.; Gilbert, S.; Bull, S.; Scott, R.; Emsbo, P.; Thomas, H.; et al. Gold and trace element zonation in pyrite using a laser imaging technique: Implications for the timing of gold in orogenic and Carlin-style sediment-hosted deposits. Econ. Geol. 2009, 104, 635–668. [Google Scholar] [CrossRef]
  32. Belousov, I.; Large, R.R.; Meffre, S.; Danyushevsky, L.V.; Steadman, J.; Beardsmore, T. Pyrite compositions from VHMS and orogenic Au deposits in the Yilgarn Craton, Western Australia: Implications for gold and copper exploration. Ore Geol. Rev. 2016, 79, 474–499. [Google Scholar] [CrossRef]
  33. Liu, Z.K.; Mao, X.C.; Deng, H.; Li, B.; Zhang, S.; Lai, J.; Bayless, R.C.; Pan, M.; Li, L.; Shang, Q. Hydrothermal processes at the Axi epithermal Au deposit, Western Tianshan: Insights from geochemical effects of alteration, mineralization and trace elements in pyrite. Ore Geol. Rev. 2018, 102, 368–385. [Google Scholar] [CrossRef]
  34. Li, C.; Li, L.; Li, S.-R.; Santosh, M.; Shen, J.-F. Geochemistry of hydrothermal zircon as a proxy to fingerprint ore fluids in late Mesozoic decratonic gold deposits. Ore Geol. Rev. 2022, 143, 104703. [Google Scholar] [CrossRef]
  35. Simmons, S.F.; Brown, K.L.; Tutolo, B.M. Hydrothermal transport of Ag, Au, Cu, Pb, Te, Zn and other metals and metalloids in New Zealand geothermal systems: Spatial patterns, fluid-mineral equilibria and implications for epithermal mineralization. Econ. Geol. 2016, 111, 589–618. [Google Scholar] [CrossRef]
  36. Román, N.; Reich, M.; Leisen, M.; Morata, D.; Barra, F.; Deditius, A.P. Geochemical and micro-textural fingerprints of boiling in pyrite. Geochim. Cosmochim. Acta 2019, 246, 60–85. [Google Scholar] [CrossRef]
  37. Bralia, A.; Sabatini, G.; Troja, F. A revaluation of the Co/Ni ratio in pyrite as geochemical tool in ore genesis prob-lems-evidences from southern tuscany pyritic deposits. Miner. Depos. 1979, 14, 353–374. [Google Scholar] [CrossRef]
  38. Deditius, A.P.; Reich, M.; Kesler, S.E.; Utsunomiya, S.; Chryssoulis, S.L.; Walshe, J.; Ewing, R.C. The coupled geochemistry of Au and As in pyrite from hydrothermal ore deposits. Geochim. Cosmochim. Acta 2014, 140, 644–670. [Google Scholar] [CrossRef]
  39. Keith, M.; Smith, D.J.; Jenkin, G.R.T.; Holwell, D.A.; Dye, M.D. A review of Te and Se systematics in hydrothermal pyrite from precious metal deposits: Insights into ore-forming processes. Ore Geol. Rev. 2018, 96, 269–282. [Google Scholar] [CrossRef]
  40. Schaarschmidt, A.; Haase, K.M.; Klemd, R.; Keith, M.; Voudouris, P.C.; Alfieris, D.; Strauss, H.; Wiedenbeck, M. Boiling effects on trace element and sulfur isotope compositions of sulfides in shallow-marine hydrothermal systems: Evidence from Milos Island, Greece. Chem. Geol. 2021, 583, 120457. [Google Scholar] [CrossRef]
  41. Kretschmar, U.; Scott, S.D. Phase relations involving arsenopyrite in the system Fe-As-S and their application. Can. Miner. 1976, 14, 364–386. [Google Scholar]
  42. Sharp, Z.D.; Essene, E.J.; Kelly, W.C. A re-examination of the arsenopyrite geothermometer: Pressure considerations and applications to natural assemblages. Can. Miner. 1985, 23, 517–534. [Google Scholar]
  43. Lee, S.Y.; Chang, B.; Kim, Y.J.; Jang, H.; Lee, Y.J. Characterization of arsenite (As(III)) and arsenate (As(V)) sorption on synthetic siderite spherules under anoxic conditions: Different sorption behaviors with crystal size and arsenic species. J. Colloid Interface Sci. 2022, 613, 499–514. [Google Scholar] [CrossRef]
  44. Benning, L.G.; Seward, T.M. Hydrosulphide complexing of Au (I) in hydrothermal solutions from 150–400 °C and 500–1500 bar. Geochim. Cosmochim. Acta 1996, 60, 1849–1871. [Google Scholar] [CrossRef]
  45. Widler, A.M.; Seward, T.M. The adsorption of gold (I) hydrosulphide complexes by iron sulphide surfaces. Geochim. Cosmochim. Acta 2002, 66, 383–402. [Google Scholar] [CrossRef]
  46. Wang, Z.C.; Becker, H. Fractionation of Highly Siderophile and Chalcogen Elements during Magma Transport in the Mantle: Constraints from Pyroxenites of the Balmuccia Peridotite Massif. Geochim. Cosmochim. Acta 2015, 159, 244–263. [Google Scholar] [CrossRef]
  47. Chiaradia, M. Gold Endowments of Porphyry Deposits Controlled by Precipitation Efficiency. Nat. Commun. 2020, 11, 248. [Google Scholar] [CrossRef] [PubMed]
  48. Berndt, M.E.; Buttram, T.; Earley, D.; Seyfried, W.E. The stability of gold polysulfide complexes in aqueous sulfide solutions: 100 to 150 °C and 100 bars. Geochim. Cosmochim. Acta 1994, 58, 587–594. [Google Scholar] [CrossRef]
  49. Xu, B.; Hou, Z.Q.; Griffin, W.L.; Lu, Y.; Belousova, E.; Xu, J.-F.; O’Reilly, S.Y. Recycled Volatiles Determine Fertility of Porphyry Deposits in Collisional Settings. Am. Mineral. 2021, 106, 656–661. [Google Scholar] [CrossRef]
  50. Wood, S.A.; Samson, I.M. Solubility of ore minerals and complexations of ore metals in hydrothermal solutions. In Techniques in Hydrothermal Ore Deposits Geology; Richards, J., Larson, P., Eds.; Society of Economic Geologists: Littleton, CO, USA, 1998; pp. 33–80. [Google Scholar]
  51. Sun, W.D.; Arculus, R.J.; Kamenetsky, V.S.; Binns, R.A. Release of gold-bearing fluids in convergent margin magmas promopted by magnetite crystallization. Nature 2004, 431, 975–978. [Google Scholar] [CrossRef]
  52. Holwell, D.A.; Fiorentini, M.; McDonald, I.; Lu, Y.; Giuliani, A.; Smith, D.J.; Keith, M.; Locmelis, M. A Metasomatized Lithospheric Mantle Control on the Metallogenic Signature of Post-Subduction Magmatism. Nat. Commun. 2019, 10, 3511. [Google Scholar] [CrossRef] [PubMed]
  53. Ohmoto, H. Systematics of sulfur and carbon isotopes in hydrothermal ore deposits. Econ. Geol. 1972, 67, 551–578. [Google Scholar] [CrossRef]
  54. Chaussidon, M.; Lorand, J.-P. Sulphur isotope composition of orogenic spinel lherzolite massifs from Ariege (North-Eastern Pyreness, France): An ion microprobe study. Geochim. Cosmochim. Acta 1990, 54, 2835–2846. [Google Scholar] [CrossRef]
  55. Yin, G.; Ni, S.J. Geochemistry of Stable Isotopes; Geological Publishing House: Beijing, China, 2009; In Chinese with English Abstract. [Google Scholar]
  56. Ding, L.L.; Zhu, L.M.; Yuan, H.L.; Lu, R.; Xiong, X.; Yang, T. Geology, Pb Isotope Geochemistry and Ore Genesis of the Liziyuan Gold Deposit, West Qinling Orogen, Central China. Acta Geol. Sin.—Engl. Ed. 2018, 92, 1082–1099. [Google Scholar] [CrossRef]
  57. Liu, J.J.; Dai, H.Z.; Zhai, D.G.; Wang, J.P.; Wang, Y.H.; Yang, L.B.; Mao, G.J.; Liu, X.H.; Liao, Y.F.; Yu, C.; et al. Geological and geochemical characteristics and formation mechanisms of the Zhaishang Carlin-like type gold deposit, western Qinling Mountains, China. Ore Geol. Rev. 2015, 64, 273–298. [Google Scholar] [CrossRef]
  58. Zhu, L.M.; Zhang, G.W.; Lee, B.; Guo, B.; Gong, H.; Kang, L.; Lü, S. Zircon U-Pb dating and geochemical study of the Xianggou granite in the Ma’anqiao gold deposit and its relationship with gold mineralization. Sci. China Earth Sci. 2010, 53, 220–240. [Google Scholar] [CrossRef]
  59. Ma, J.; Lü, X.B.; Escolme, A.; Li, S.; Zhao, N.; Cao, X.; Zhang, L.; Lu, F. In-situ sulfur isotope analysis of pyrite from the Pangjiahe gold deposit: Implications for variable sulfur sources in the north and south gold belt of the South Qinling orogen. Ore Geol. Rev. 2018, 98, 38–61. [Google Scholar] [CrossRef]
  60. Chang, Z.S.; Large, R.R.; Maslennikov, V. Sulfur isotopes in sediment-hosted orogenic gold deposits: Evidence for an early timing and a seawater sulfur source. Geology 2008, 36, 971–974. [Google Scholar] [CrossRef]
  61. Bilenker, L.D.; Vantongeren, J.A.; Lundstrom, C.C.; Simon, A.C. Iron isotopic evolution during fractional crystallization of the uppermost Bushveld Complex layered mafic intrusion. Geochem. Geophys. Geosyst. 2017, 18, 956–972. [Google Scholar] [CrossRef]
  62. Zhang, L.; Qiu, K.F.; Hou, Z.L.; Franco, P.; Espine, S.; Cai, Y.W. Fluid-rock reactions of the Triassic Taiyangshan porphyry Cu-Mo deposit (West Qinling, China) constrained by QEMSCAN and iron isotope. Ore Geol. Rev. 2021, 132, 104068. [Google Scholar] [CrossRef]
  63. Heimann, A.; Beard, B.L.; Johnson, C.M. The role of volatile exsolution and sub-solidus fluid/rock interactions in pro-ducing high Fe-56/Fe-54 ratios in siliceous igneous rocks. Geochim. Cosmochim. Acta 2008, 72, 4379–4396. [Google Scholar] [CrossRef]
  64. Zambardi, T.; Lundstrom, C.C.; Li, X.; McCurry, M. Fe and Si isotope variations at Cedar Butte volcano; insight into magmatic differentiation. Earth Planet. Sci. Lett. 2014, 405, 169–179. [Google Scholar] [CrossRef]
  65. He, Y.; Wu, H.; Ke, S.; Liu, S.-A.; Wang, Q. Iron isotopic compositions of adakitic and non-adakitic granitic magmas: Magma compositional control and subtle residual garnet effect. Geochim. Cosmochim. Acta 2017, 203, 89–102. [Google Scholar] [CrossRef]
  66. Markl, G.; von Blanckenburg, F.; Wagner, T. Iron isotope fractionation during hydrothermal ore deposition and alteration. Geochim. Cosmochim. Acta 2006, 70, 3011–3030. [Google Scholar] [CrossRef]
  67. Troll, V.R.; Weis, F.A.; Jonsson, E.; Andersson, U.B.; Majidi, S.A.; Högdahl, K.; Harris, C.; Millet, M.-A.; Chinnasamy, S.S.; Kooijman, E.; et al. Global Fe-O isotope correlation reveals magmatic origin of Kiruna-type apatite-iron-oxide ores. Nat. Commun. 2019, 10, 1712. [Google Scholar] [CrossRef]
  68. He, Z.W.; Zhang, X.C.; Deng, X.D.; Hu, H.; Li, Y.; Yu, H.; Archer, C.; Li, J.; Huang, F. The behavior of Fe and S isotopes in porphyry copper systems: Constraints from the Tongshankou Cu-Mo deposit, eastern China. Geochim. Cosmochim. Acta 2020, 270, 61–83. [Google Scholar] [CrossRef]
  69. Johnson, C.; Beard, B.; Weyer, S. Iron Geochemistry: An Isotopic Perspective; Springer: Berlin/Heidelberg, Germany, 2020. [Google Scholar] [CrossRef]
  70. Grondahl, C.; Zajacz, Z. Magmatic Controls on the Genesis of Porphyry Cu-Mo-Au Deposits: The Bingham Canyon Example. Earth Planet. Sci. Lett. 2017, 480, 53–65. [Google Scholar] [CrossRef]
  71. Audétat, A.; Edmonds, M. Magmatic-Hydrothermal Fluids. Elements 2020, 16, 401–406. [Google Scholar] [CrossRef]
  72. Richards, J.P. Giant Ore Deposits Formed by Optimal Alignments and Combinations of Geological Processes. Nat. Geosci. 2013, 6, 911–916. [Google Scholar] [CrossRef]
  73. Piquer, J.; Sanchez-Alfaro, P.; Pérez-Flores, P. A New Model for the Optimal Structural Context for Giant Porphyry Copper Deposit Formation. Geology 2021, 49, 597–601. [Google Scholar] [CrossRef]
  74. Wang, Z.C.; Wang, X.; Zong, K.Q.; Cheng, H.; Wang, C. The secular crust-mantle evolution of the North China Craton and the formation of giant Jiaodong gold deposits. Bull. Mineral. Petrol. Geochem. 2023, 42, 1231–1247, (In Chinese with English Abstract). [Google Scholar]
  75. Zhao, H.; Wang, Q.; Li, C.; Pan, R.; Groves, D.I.; Yang, L.; Xu, J.; Deng, J. Two episodes of postpeak metamorphic high- to moderate-temperature orogenic gold mineralization at Danba, Southwest China: Timing and fluid source constraints from thermodynamic modeling and U-Pb, Re-Os, and S isotopes. Econ. Geol. 2024, 119, 1791–1807. [Google Scholar] [CrossRef]
  76. Luo, B.; Zhang, H.; Lü, X. U–Pb zircon dating, geochemical and Sr–Nd–Hf isotopic compositions of Early Indosinian intrusive rocks in West Qinling, central China: Petrogenesis and tectonic implications. Contrib. Mineral. Petrol. 2012, 164, 551–569. [Google Scholar] [CrossRef]
Figure 2. Geological map of Jinshan gold deposit (modified after LZM Mining).
Geosciences 16 00208 g002
Figure 3. The characteristics of rock assemblages in the field of the Jinshan gold deposit. (a) Fault mud and structural breccia developed in the Jinshan gold deposit; (b) joint structure development; (c) macroscopic phenomena in geological field; (d,e) primary ore in the borehole; (f,j,k) outcrop primary minerals in the wild, with sulfides such as pyrite and arsenopyrite and quartz veins developed; (g,h,i) silicification, limonitization, and black spot structure development in altered ores.
Geosciences 16 00208 g003
Figure 4. A geological cross section of line 11 in the Jinshan gold deposit (modified after LZM Mining).
Geosciences 16 00208 g004
Figure 5. Photomicrograph characteristics of ore samples from the Jinshan gold deposit. (a,b) reflected light photos; (ch) BSE photos. Py—pyrite; Apy—arsenopyrite; Gn—galena; Sd—siderite; Chl—chlorite; Qz—quartz; Se—sericite; Cla—calcite.
Geosciences 16 00208 g005
Figure 6. Photomicrograph characteristics of lamprophyre from the Jinshan gold deposit. (a,b) transmitted light photograph; (c,d) BSE photos. Hb—hornblende; Pl—plagioclase; Bt—biotite; Phl—phlogopite; Py—pyrite.
Geosciences 16 00208 g006
Figure 7. Paragenetic assemblage and sequence of mineral and metallogenic period division of Jinshan gold deposit.
Geosciences 16 00208 g007
Figure 8. Cathodoluminescence (CL) images of representative zircon crystals with locations of LA-ICP-MS analyses from this study.
Geosciences 16 00208 g008
Figure 9. Zircon U-Pb concordia diagrams for lamprophyre in the Jinshan gold deposit. Gray dashed circles represent zircon ages with <90% concordance, whereas the remaining spots indicate >90% concordance. (ac) concordia diagrams, (d) the chondrite-normalized REE patterns of zircons.
Geosciences 16 00208 g009
Figure 12. (a) Activity of logf(S2)-temperature (t) projection of the stability field of arsenopyrite from the Jinshan gold deposit (after Kretschmar and Scott, [41]; Sharp et al. [42]); (b) relationship between As and S atomic percentage of arsenopyrite in different stages of the Jinshan gold deposit.
Geosciences 16 00208 g012
Figure 13. Metallogenic thermodynamic simulation diagrams of Jinshan gold deposit based on GWB software. (a) The influence of logƒO2-logƒS2 on gold speciation at 250 °C; (b) the influence of logƒO2-logƒS2 on gold speciation at 300 °C; (c) the influence of T-pH on gold speciation under logƒS2 = −9; (d) the influence of T-logƒS2 on gold speciation under pH = 6; red dashed boundaries delineate stability fields of arsenopyrite, pyrite, and chlorite calculated using thermodynamic parameters from this study and Li et al. [14].
Geosciences 16 00208 g013
Figure 16. A genetic model of the Jinshan gold deposit, Zhongchuan district, West Qinling metallogenic belt (modified after Wang et al. [74]).
Geosciences 16 00208 g016
Table 1. Electron probe major element composition (wt%) of pyrite in the Jinshan gold deposit.
SampleAuSPbAgCdSbAsCuCoFeMnTotal
Py II0.1552.280.000.120.020.000.710.000.0545.660.0098.98
0.2053.350.140.000.000.000.820.010.0645.630.00100.32
0.0053.350.000.000.070.000.810.010.1246.570.00100.99
0.0052.800.040.000.000.020.490.000.0545.550.0399.04
0.1752.560.000.000.000.070.750.000.0745.840.0199.49
0.0053.570.000.000.020.000.170.050.1346.690.00100.64
0.0753.000.000.030.040.000.170.000.0446.010.0099.49
0.0753.700.030.030.000.000.130.000.1546.330.00100.50
0.0052.720.000.010.000.060.310.000.1346.520.0499.81
0.1753.170.000.000.020.000.500.030.0746.420.02100.59
0.0051.490.010.100.010.000.820.000.0546.200.0398.73
0.0953.490.000.010.010.010.740.060.0145.990.04100.81
Py III0.0652.940.000.020.040.000.000.040.0446.110.0099.30
0.0053.700.150.000.110.010.000.000.0646.730.02100.78
0.0053.160.050.020.030.000.000.090.0346.290.0099.87
0.0053.230.000.020.000.000.000.020.0846.210.0399.89
0.1453.020.000.000.000.090.000.030.1046.270.0099.84
0.0652.670.010.010.000.000.000.100.0946.220.0599.33
0.0452.750.000.000.000.070.000.000.1544.760.0097.86
Table 2. The trace element concentrations (in ppm) of PyII from the Jinshan gold deposit analyzed by LA-ICP-MS.
SampleAuAsCoNiCuZnSeAgSbWTeTlBiPbTeGe
Py II2.92126,854.9224.08235.081.981.08134.691.121448.740.6912.900.011.559.4212.908.80
Py II3.0070,477.7816.93156.683.131.28126.581.321142.141.186.800.021.6012.326.808.66
Py II1.34942.800.163.073.771.5482.920.276.171.160.990.020.357.900.999.16
Py II1.95675.811.2459.852.370.6078.860.030.820.070.330.000.030.950.338.94
Py II0.62541.410.067.603.741.7470.630.186.1961.170.330.010.235.090.338.58
Py II3.1437,823.26117.37332.122.250.5860.250.921042.242.023.190.011.449.163.198.49
Py II0.491300.260.8837.034.871.6340.690.6212.3417.940.010.000.5111.410.0110.77
Py II1.162631.080.034.435.114.6260.200.5813.663.060.170.010.7111.750.178.30
Py II0.172187.441.7884.574.072.4335.950.6012.5311.010.000.000.649.210.008.39
Py II4.094247.790.241.826.560.9991.150.325.536.893.210.000.307.053.218.14
Py II2.084726.640.4534.233.922.0073.800.164.030.640.840.000.184.640.848.72
Py II4.274998.390.060.317.170.7395.660.254.010.441.980.000.164.901.988.27
Py II4.22190,629.7235.73119.441.820.5765.740.84564.740.213.440.000.6812.923.448.04
Py II1.433254.770.030.383.460.6974.070.163.411.980.280.000.142.600.287.93
Py II2.213056.890.093.074.253.4052.560.286.4011.880.310.010.436.680.318.15
Py II1.41149,390.49108.32202.923.811.4779.071.17446.461.504.430.011.5713.404.437.95
Py II1.334418.790.031.892.791.0464.820.051.580.140.220.000.062.110.228.15
Py II1.804984.560.030.916.380.4282.910.112.260.340.310.000.081.580.317.81
Py II1.8138,101.811.1412.347.081.3322.620.409.611.820.020.050.7812.700.029.26
Py II0.0710,311.920.6430.642.572.887.870.426.140.030.000.000.144.520.008.51
Py II0.5122,167.960.6819.182.15640.8216.650.092.133.930.000.000.071.150.007.59
Py II2.6850,583.750.5431.875.561.0851.700.174.520.220.350.020.256.990.357.60
Py II4.3258,528.511.397.274.860.6063.580.000.170.050.530.000.010.260.537.64
Py II5.2660,951.260.185.565.951.1082.940.061.090.211.500.000.061.231.507.41
Py II2.0453,915.780.2921.314.181.1743.290.123.002.310.150.000.153.240.157.53
Table 3. Electron probe major element composition (wt%) and molecular formula calculation of arsenopyrite in the Jinshan gold deposit.
SampleAuSPbAgSbAsFeMnTotalStructural Formula
Apy II0.1920.900.030.000.0041.5034.850.0297.69As30.27Fe34.10S35.63
0.1321.670.000.000.1343.0335.500.00100.59As30.45Fe33.70S35.84
0.1921.210.170.040.1042.4635.190.0199.51As30.49Fe33.90S35.60
0.1721.450.000.000.0543.0935.610.00100.73As30.56Fe33.88S35.55
0.1721.290.050.130.1442.6435.000.0399.66As30.59Fe33.69S35.70
0.0221.240.040.070.0143.3535.890.02100.79As30.71Fe34.11S35.16
0.1321.360.000.070.1043.4935.410.00100.63As30.86Fe33.71S35.42
0.1420.700.000.000.0841.3835.400.0097.84As30.15Fe34.60S35.24
0.0821.210.050.050.3342.5035.350.0099.78As30.46Fe33.99S35.53
0.0021.220.000.110.0043.1336.050.02100.64As30.56Fe34.27S35.15
0.0021.430.000.030.1243.1735.660.00100.58As30.59Fe33.90S35.49
0.0021.450.000.050.0043.2535.630.03100.69As30.63Fe33.85S35.50
Apy III0.0020.030.000.060.0246.2535.110.00101.72As33Fe33.6S33.4
0.0019.530.000.060.1345.2235.180.00100.43As32.75Fe34.18S33.06
0.2119.820.110.050.0345.4335.270.04101.16As32.67Fe34.02S33.31
0.0220.130.070.060.0444.0635.400.0099.84As31.79Fe34.27S33.94
0.0420.310.000.000.0045.0635.190.00100.73As32.25Fe33.78S33.97
0.1521.120.000.000.0045.9735.060.00102.47As32.29Fe33.04S34.67
0.0019.030.000.000.0048.6534.500.00102.28As34.9Fe33.2S31.89
0.0219.750.000.020.0245.5134.570.00100.03As32.97Fe33.6S33.43
0.0219.450.100.000.0044.8135.400.0099.89As32.53Fe34.48S32.99
0.0820.350.000.050.0044.8235.150.04100.76As32.12Fe33.79S34.09
Table 4. The δ34S values of various sulfides in various stages of the Jinshan gold deposit.
Sample33/32SSE34/32SSEδ33Srefδ33Sv-CDTδ34Srefδ34Sv-CDT2SE
Apy II0.0083410.0000070.0494650.0000142.883.767.188.890.58
0.0083550.0000080.0494820.0000164.475.357.539.240.63
0.0083480.0000090.0494520.0000153.654.536.928.630.61
0.0083380.0000080.0494610.0000162.393.276.958.670.64
0.0083510.0000100.0494440.0000183.914.796.628.330.72
0.0083530.0000060.0494450.0000134.205.086.588.290.53
Py III0.0083420.0000090.0490320.0000152.923.80−1.76−0.060.59
0.0083090.0000020.0490440.000007−1.11−0.24−1.600.100.30
0.0083180.0000020.0491330.000008−0.070.810.231.930.31
0.0082990.0000020.0489230.000008−2.31−1.44−4.00−2.300.34
Py II0.0083370.0000050.0493710.0000112.233.104.996.700.46
0.0083360.0000020.0493270.0000082.133.004.235.930.32
0.0083360.0000010.0493090.0000072.203.073.875.580.30
0.0083350.0000020.0493030.0000082.052.933.765.470.31
0.0083450.0000090.0493040.0000163.344.223.785.490.63
0.0083440.0000100.0492930.0000183.174.053.555.260.73
0.0083620.0000130.0493220.0000205.326.204.155.860.80
0.0083200.0000070.0493130.0000140.181.053.755.460.57
0.0083240.0000070.0492960.0000130.611.483.415.120.52
0.0083320.0000010.0492910.0000081.702.573.295.000.32
0.0083320.0000050.0493620.0000091.682.554.746.450.38
0.0083260.0000040.0493780.0000120.881.765.146.840.47
0.0083370.0000020.0493350.0000082.193.074.275.980.32
Py L0.0083240.0000020.0492050.0000080.691.561.563.260.31
0.0083240.0000020.0492070.0000080.651.531.543.240.31
0.0083240.0000020.0492120.0000080.701.571.633.340.32
0.0083250.0000020.0492090.0000070.751.631.583.280.30
0.0083190.0000020.0491550.0000080.191.060.492.190.34
0.0083240.0000010.0492180.0000080.841.721.773.470.31
0.0083260.0000020.0492180.0000080.961.831.903.600.34
Disclaimer/Publisher’s Note: The statements, opinions and data contained in all publications are solely those of the individual author(s) and contributor(s) and not of MDPI and/or the editor(s). MDPI and/or the editor(s) disclaim responsibility for any injury to people or property resulting from any ideas, methods, instructions or products referred to in the content.