Article

The Mineral Chemistry Networks of Tin and Tungsten Reflect Metallogenic Events of the Mesozoic

1
U.S. Geological Survey, Geology, Energy & Minerals Science Center, Reston, VA 20192, USA
2
Department of Earth and Planetary Sciences, Rutgers University, New Brunswick, NJ 08854, USA
3
Department of Environmental Science, School of Earth and the Environment, Rowan University, Glassboro, MJ 08028, USA
*
Author to whom correspondence should be addressed.
Geosciences 2026, 16(4), 158; https://doi.org/10.3390/geosciences16040158

Submission received: 4 February 2026 / Revised: 7 April 2026 / Accepted: 9 April 2026 / Published: 14 April 2026

Abstract

Continental remobilization is a crucial driver of metallogenesis and the formation of ore deposits. Some of the world’s largest mineral deposits of the economically valuable elements tin (Sn), tungsten (W), gold (Au), copper (Cu), lead (Pb), and zinc (Zn) formed during the Mesozoic Era. Additionally, the chemistry and distribution of the elements Sn and W have been investigated in previous studies to understand planetary formation and differentiation processes. These two elements are largely co-located during certain South China Mesozoic metallogenic events but are not co-located during other time periods in the same regions. Here, we investigated the mineral chemistry network similarities and dissimilarities of Sn and W to understand their mineral formation and distribution during the Mesozoic Era and throughout Earth history. Mineral chemistry network community detection analysis and electronegativity associations among mineral constituent elements of Sn minerals and W minerals indicate that the elements have similar chemistry among their oxide minerals. However, Sn forms a much wider range of minerals that also contain S compared to W, which occurs in a limited number of S-containing minerals. The divergent constituent element interactions among S-containing Sn minerals and W minerals reflect the redox sensitivity and importance of oxygen (O) fugacity in Sn mineral formation. Conversely, extensive W mineral deposits are known to form at both high and low O fugacities. The similarities and differences between the mineral chemistry networks of Sn and W reflect the mineral distribution of the two elements in the Sn-W mineralization event from 160 to 139 Ma vs. the Sn–uranium (U) mineralization event from 125 to 98 million years ago (Ma). The mineral chemistry and distribution of Mesozoic Sn and W deposits illustrate the contrasting importance of redox and O fugacity on the mineral formation of different elements, and the dynamic crustal evolution that took place during this period of Earth history.

1. Introduction

Tin (Sn) and tungsten (W) are both economically valuable elements that are included on the U.S. Geological Survey Critical Minerals List [1] and have also been investigated to understand planetary formation and differentiation processes. It has been observed that Sn is distributed relatively evenly as a trace element throughout Earth’s outer crust, including in basalts [2], such that pelagic sediments are not markedly enriched in Sn relative to igneous rocks [3]. However, under certain metallogenic conditions, particularly magmatic–hydrothermal systems, enriched Sn deposits can occur as observed in southern China [4,5,6], southwest England [7,8] and southeast Australia [9,10]. Elevated Sn enrichment can also occur in phosphorus (P)- and fluorine (F)-rich peraluminous granitic liquid without any influence from hydrothermal fluids [11].
Among the different Sn deposit types, the cassiterite–sulfide, skarn, and quartz vein deposit types comprise a substantial proportion of Sn resources and reserves [12,13]. Archean rock sources with ages up to 3.4 billion years ago (Ga) have similar tin/samarium (Sn/Sm) ratios to oceanic basalts, indicating that core growth during the last 3.4 Ga was negligibly small [2]. Tin has also been used as a magmatic redox tracer due to the strong fO2 dependence of Sn solubility in a variety of magmatic systems [14].
The redox geochemistry of W has been used to investigate broad-scale planetary processes in different studies. For example, the oxidation state of W in silicate melts has been linked to the comparative chemistry of W and molybdenum (Mo) in planetary differentiation processes due to different Mo/W ratios in chondrites, Bulk Silicate Earth (BSE), and the Moon [15,16,17]. The isotopic depletion of W provides further constraints on core formation timing based on W/Th ratios and the decay of 182Hf to 182W in the early Solar System [18,19]. Additionally, the hafnium–tungsten isotope system is useful as a chronometer of planetary accretion and differentiation, indicating that traces of Earth’s formation have been preserved throughout the history of the planet [20].
Tectonic activity is a major driver of mineral formation and preservation [21,22]. Indeed, periods of increased mineralization and preservation have occurred during known supercontinent assembly events [23,24,25]. Different active and stable tectonic regions exhibit characteristic mineral distributions related to specific local magmatism, metamorphism, sedimentation, tectonic configuration, and potential prior stage mineral inheritance, resulting in progressive mineralization [26]. The Yanshanian orogenic episode [27,28] of the Late Jurassic to Cretaceous involved intercontinental tectonics, magmatism, structural deformation, and sedimentation, resulting in a large number of mineral deposits, with the tectonic change beginning at 165 ± 5 Ma and the largest deposit episode taking place from 145 to 135 Ma, followed by an intermediate episode from 135 to 100 Ma, and a final episode from 100 to 83 Ma [29,30]. In particular, magmatic–hydrothermal processes associated with the Yanshanian orogeny greatly contributed to extensive mineralization and metallogenesis during this time period [31,32,33]. Mineralization and metallogenesis have been extensively studied and documented in South China, allowing for further investigation of continental remobilization using synthesized data resources.
The predominant Yanshanian event, contributing to the “Mesozoic metallogenic explosion” in South China from approximately 160 to 139 Ma, included extensive Sn and W mineralization [5,34,35]. The following Mesozoic metallogenic event in this region from 125 to 98 Ma included widespread Sn–uranium (U) mineralization that was not associated with W to the same extent as the Sn-W mineralization from 160 to 139 Ma [36,37,38]. Granitoids containing Sn and/or W can form due to different processes and possess different petrological and geochemical features [39,40,41,42]. However, given the different physical/chemical properties of the two elements, it is not fully understood why such a dramatic shift took place from extensive Sn-W mineralization from 160 to 139 Ma to Sn mineralization from 125 to 98 Ma. Tin is a moderately siderophilic, chalcophilic metal with an atomic number of 50, a wide variety of uses (e.g., electronics, building materials, energy production/storage) and crustal concentration of 1.7 ppm [43,44,45]. Tungsten is a siderophilic transition metal with an atomic number of 74, crustal concentration of 1.0 ppm, and numerous applications (e.g., alloys, electronics, aerospace) due to the element’s unique properties including high resistivity and density [43,45,46,47]. Tungsten is also a highly incompatible lithophilic element during silicate Earth differentiation, resulting in W enrichment in the core and crust, and depletion in the mantle [48,49].
Given the economic value of Sn and W, their utility in understanding planetary formation and differentiation, and the well-documented mineralization of these two elements in South China, this region is uniquely suited for investigating continental remobilization and metallogenesis using new data science approaches. In this study, we used mineral chemistry network analysis to investigate the similarities and dissimilarities of Sn and W deposits and gain a greater understanding of their mineral formation and distribution in the Mesozoic metallogenic explosion of South China within the greater context of evolving Sn and W geochemistry throughout Earth history.

2. Materials and Methods

Mineral chemistry bipartite networks of Sn and W were constructed using the R package dragon (Deep-time Redox Analysis of the Geobiology Ontology Network, [50]). Dragon is an exploratory network analysis platform that constructs interactive bipartite networks of minerals and their constituent elements based on a user-indicated focal element or set of focal elements over a specified range in geologic time using information from the Mineral Evolution Database (MED, [51]; https://rruff.info/ima/; accessed 15 March 2023). Louvain community detection analysis [52] of the Sn and W combined mineral chemistry network was performed using dragon to identify chemical associations between Sn minerals and W minerals, and their constituent elements in the Sn and W combined mineral chemistry network. Mineral data for Sn and W, including locality and age, were compiled from the MED for analysis.
Weighted mineral element electronegativity coefficient of variation (wMEECV) values were calculated for each Sn mineral and W mineral to understand the chemical interactions of each mineral based on the ability of each constituent element to attract electrons towards itself within the chemical bonds of the mineral lattice as described by Moore et al. [53]. For example, the mineral oregonite (FeNi2As2) constituent element Pauling scale electronegativity [54] values are: Fe = 1.83; Ni = 1.91; and As = 2.18. Oregonite contains one Fe atom, two Ni atoms, and two As atoms, totaling five atoms. Therefore, the wMEECV metric is calculated from the five electronegativity values, 1.83, 1.91, 1.91, 2.18, and 2.18, which represent each atom in the nominal mineral formula. The coefficient of variation of these five values is the standard deviation (0.166) divided by the mean (2.002), giving a value of 0.083. The different wMEECV values of Sn and W can thus be used to compare the changing geochemistry of the two elements through time. A post hoc Tukey’s test following network community detection was performed to investigate differences in wMEECV values between Louvain network communities. Co-located Sn minerals and W minerals were identified by comparing Mindat locality ID numbers of Sn minerals and W minerals cataloged in the MED (mineral localities are defined as co-located when they have the same Mindat locality ID number).
In this study, we considered Sn minerals and W minerals to be mineral species in which the chemical formula of a mineral includes Sn and W, as defined by the International Mineralogical Association (IMA; lists of IMA-defined Sn and W minerals can be identified at https://rruff.info/ima/). Mineral preservation, age, and economic significance biases exist in the MED due to the tectonic recycling of continental plates; the enhanced weathering of softer, more soluble minerals; mineral alterations after the formation of the host lithology; and enhanced sampling and observation of economically significant minerals [55,56,57,58]. These biases must be considered when observing long-term mineral chemistry changes in MED data.

3. Results

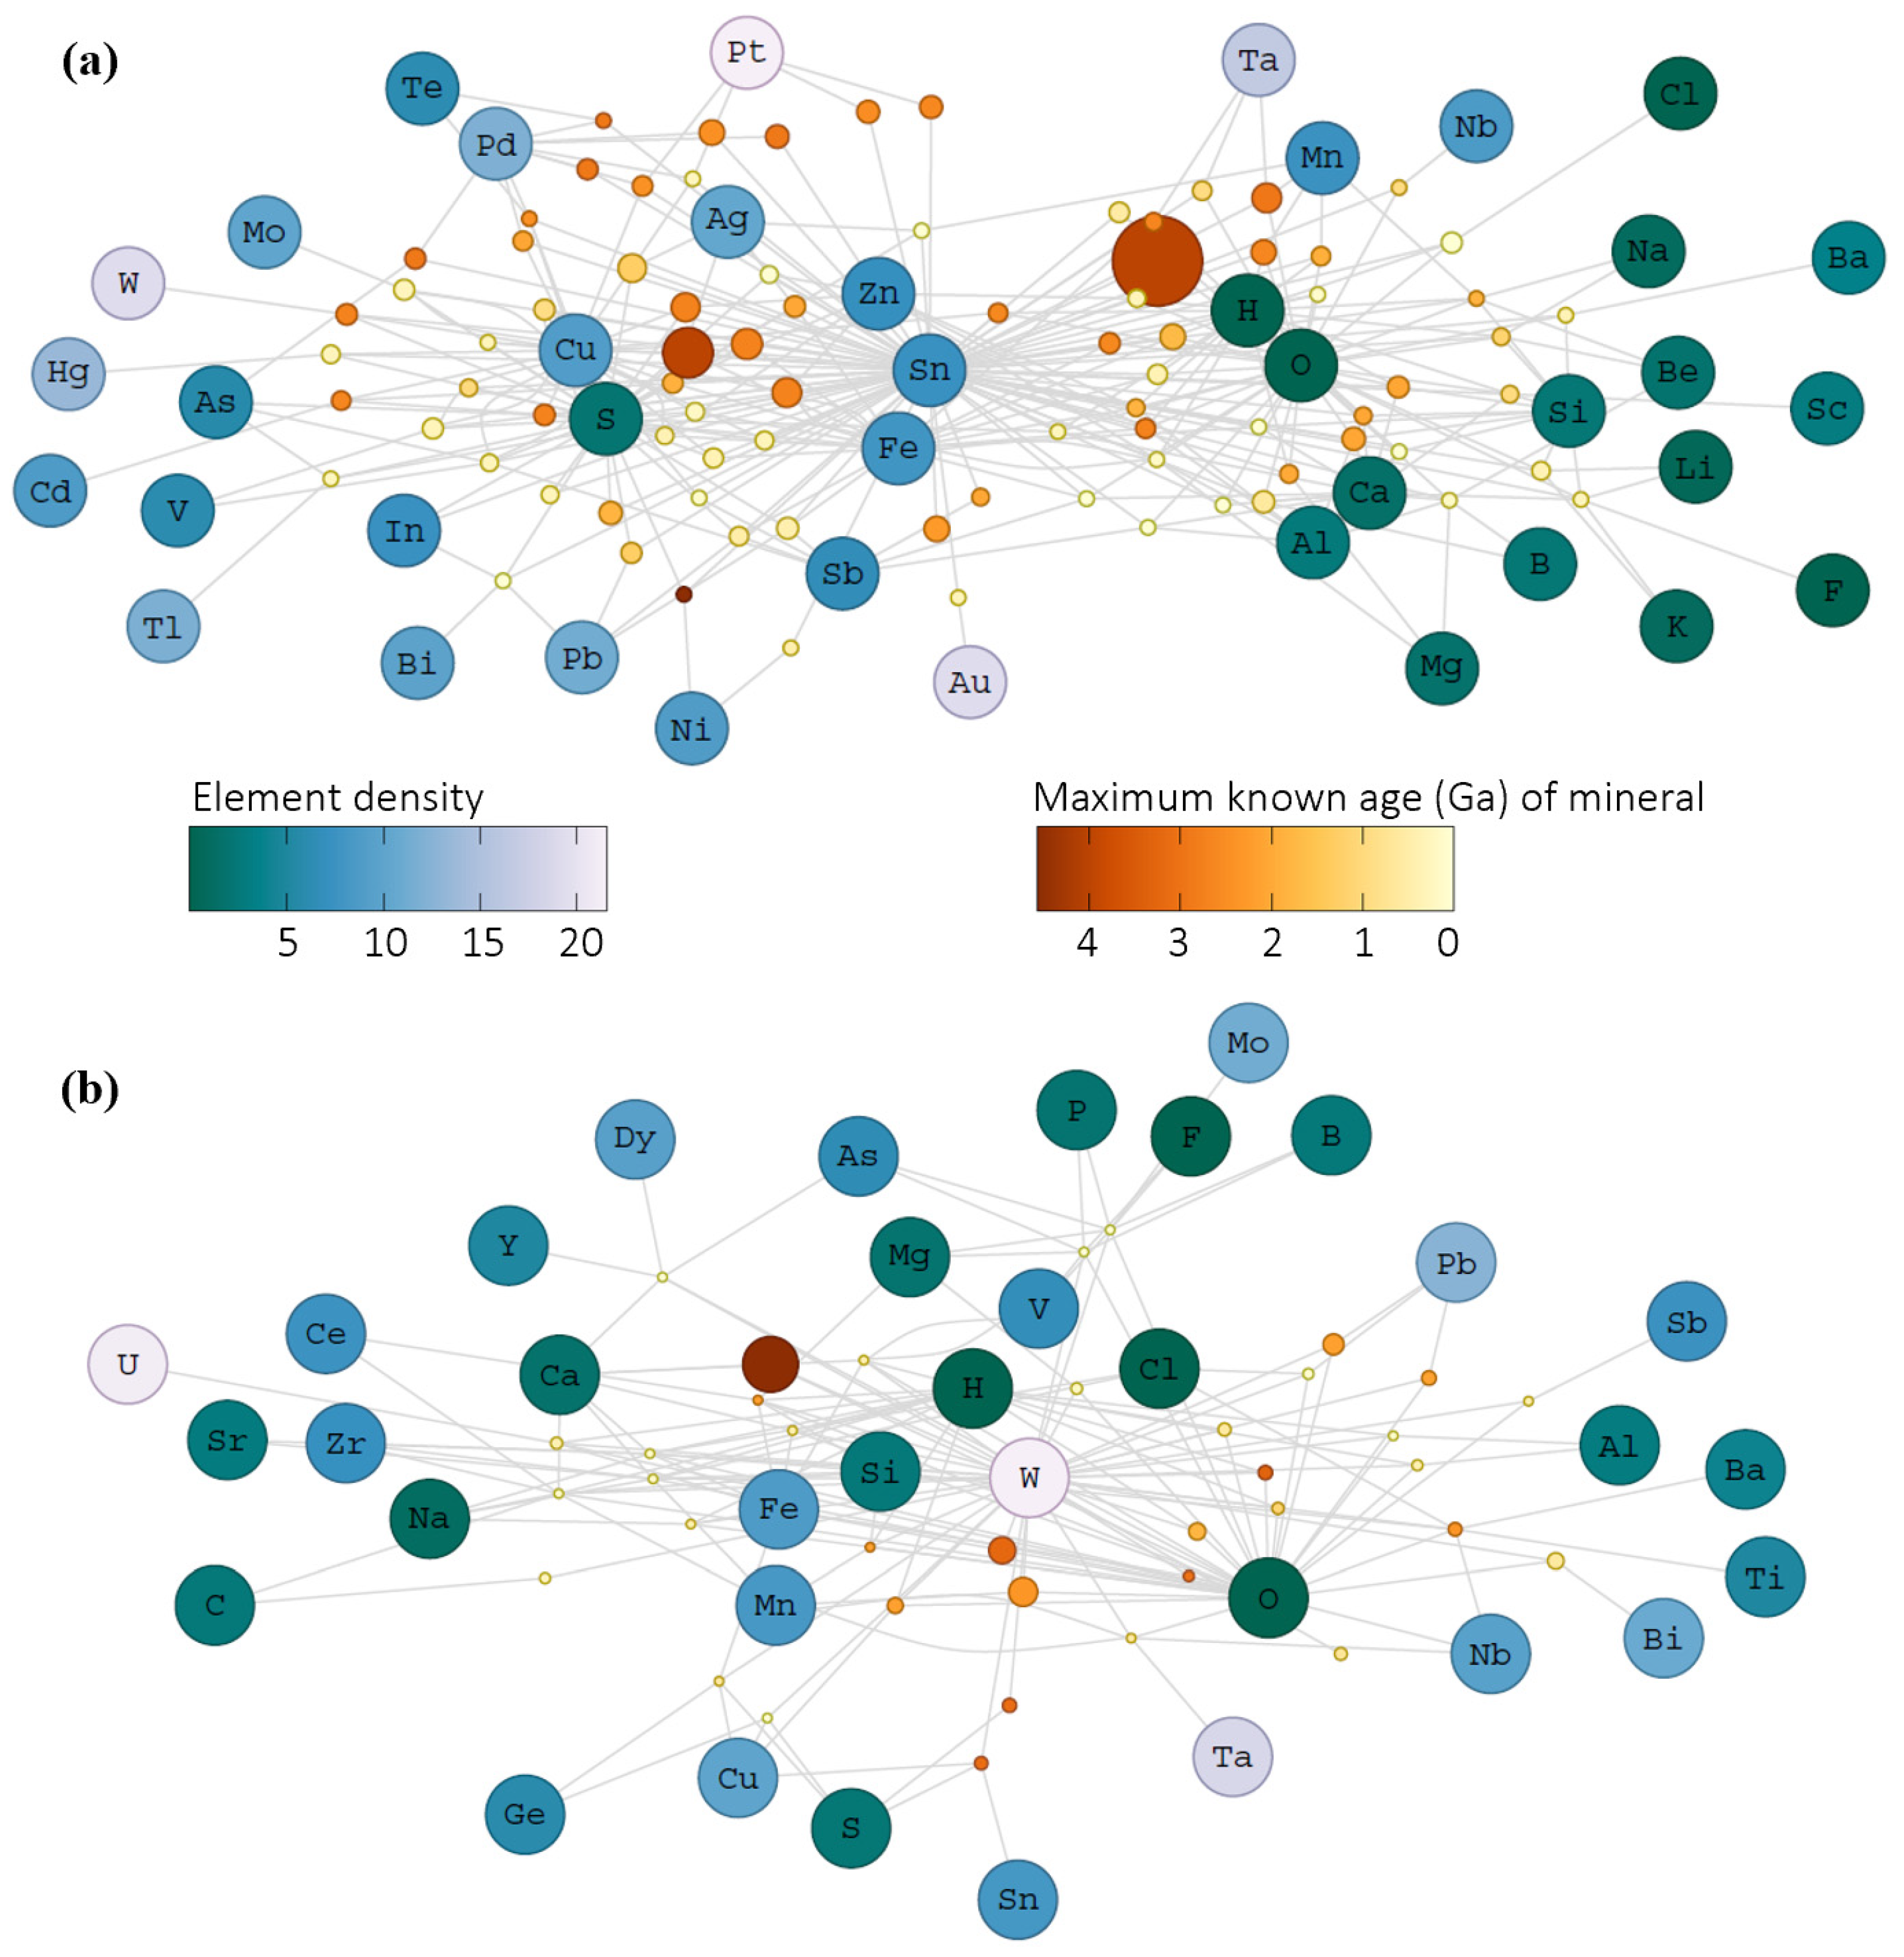
The separate Sn and W mineral chemistry networks have different network structures that are characteristic of their distinct constituent element associations. Tin forms dozens of different mineral species with sulfur (S) and dozens of other mineral species with oxygen (O; Figure 1a). However, only one Sn-containing mineral species contains both S and O [genplesite, Ca3Sn(SO4)2(OH)6·3H2O]. The vast majority of W-containing mineral species also contain O, while only four W minerals contain S (ex: tungstenite—WS2; Figure 1b). There are no International Mineralogical Association (IMA)-recognized W-containing mineral species that contain both S and O (i.e., no IMA-recognized W sulfate mineral species). The Sn mineral chemistry network has a clear separation between S-containing Sn minerals and O-containing Sn minerals (Figure 1). Conversely, the W mineral chemistry network is mainly composed of O-containing W minerals. Aligning with the separation of S and O minerals in the Sn mineral chemistry network, the S-containing Sn minerals are mainly composed of high-density/high-molecular-weight elements, while the O-containing Sn minerals are mainly composed of low-density/low-molecular-weight elements (Figure 1).
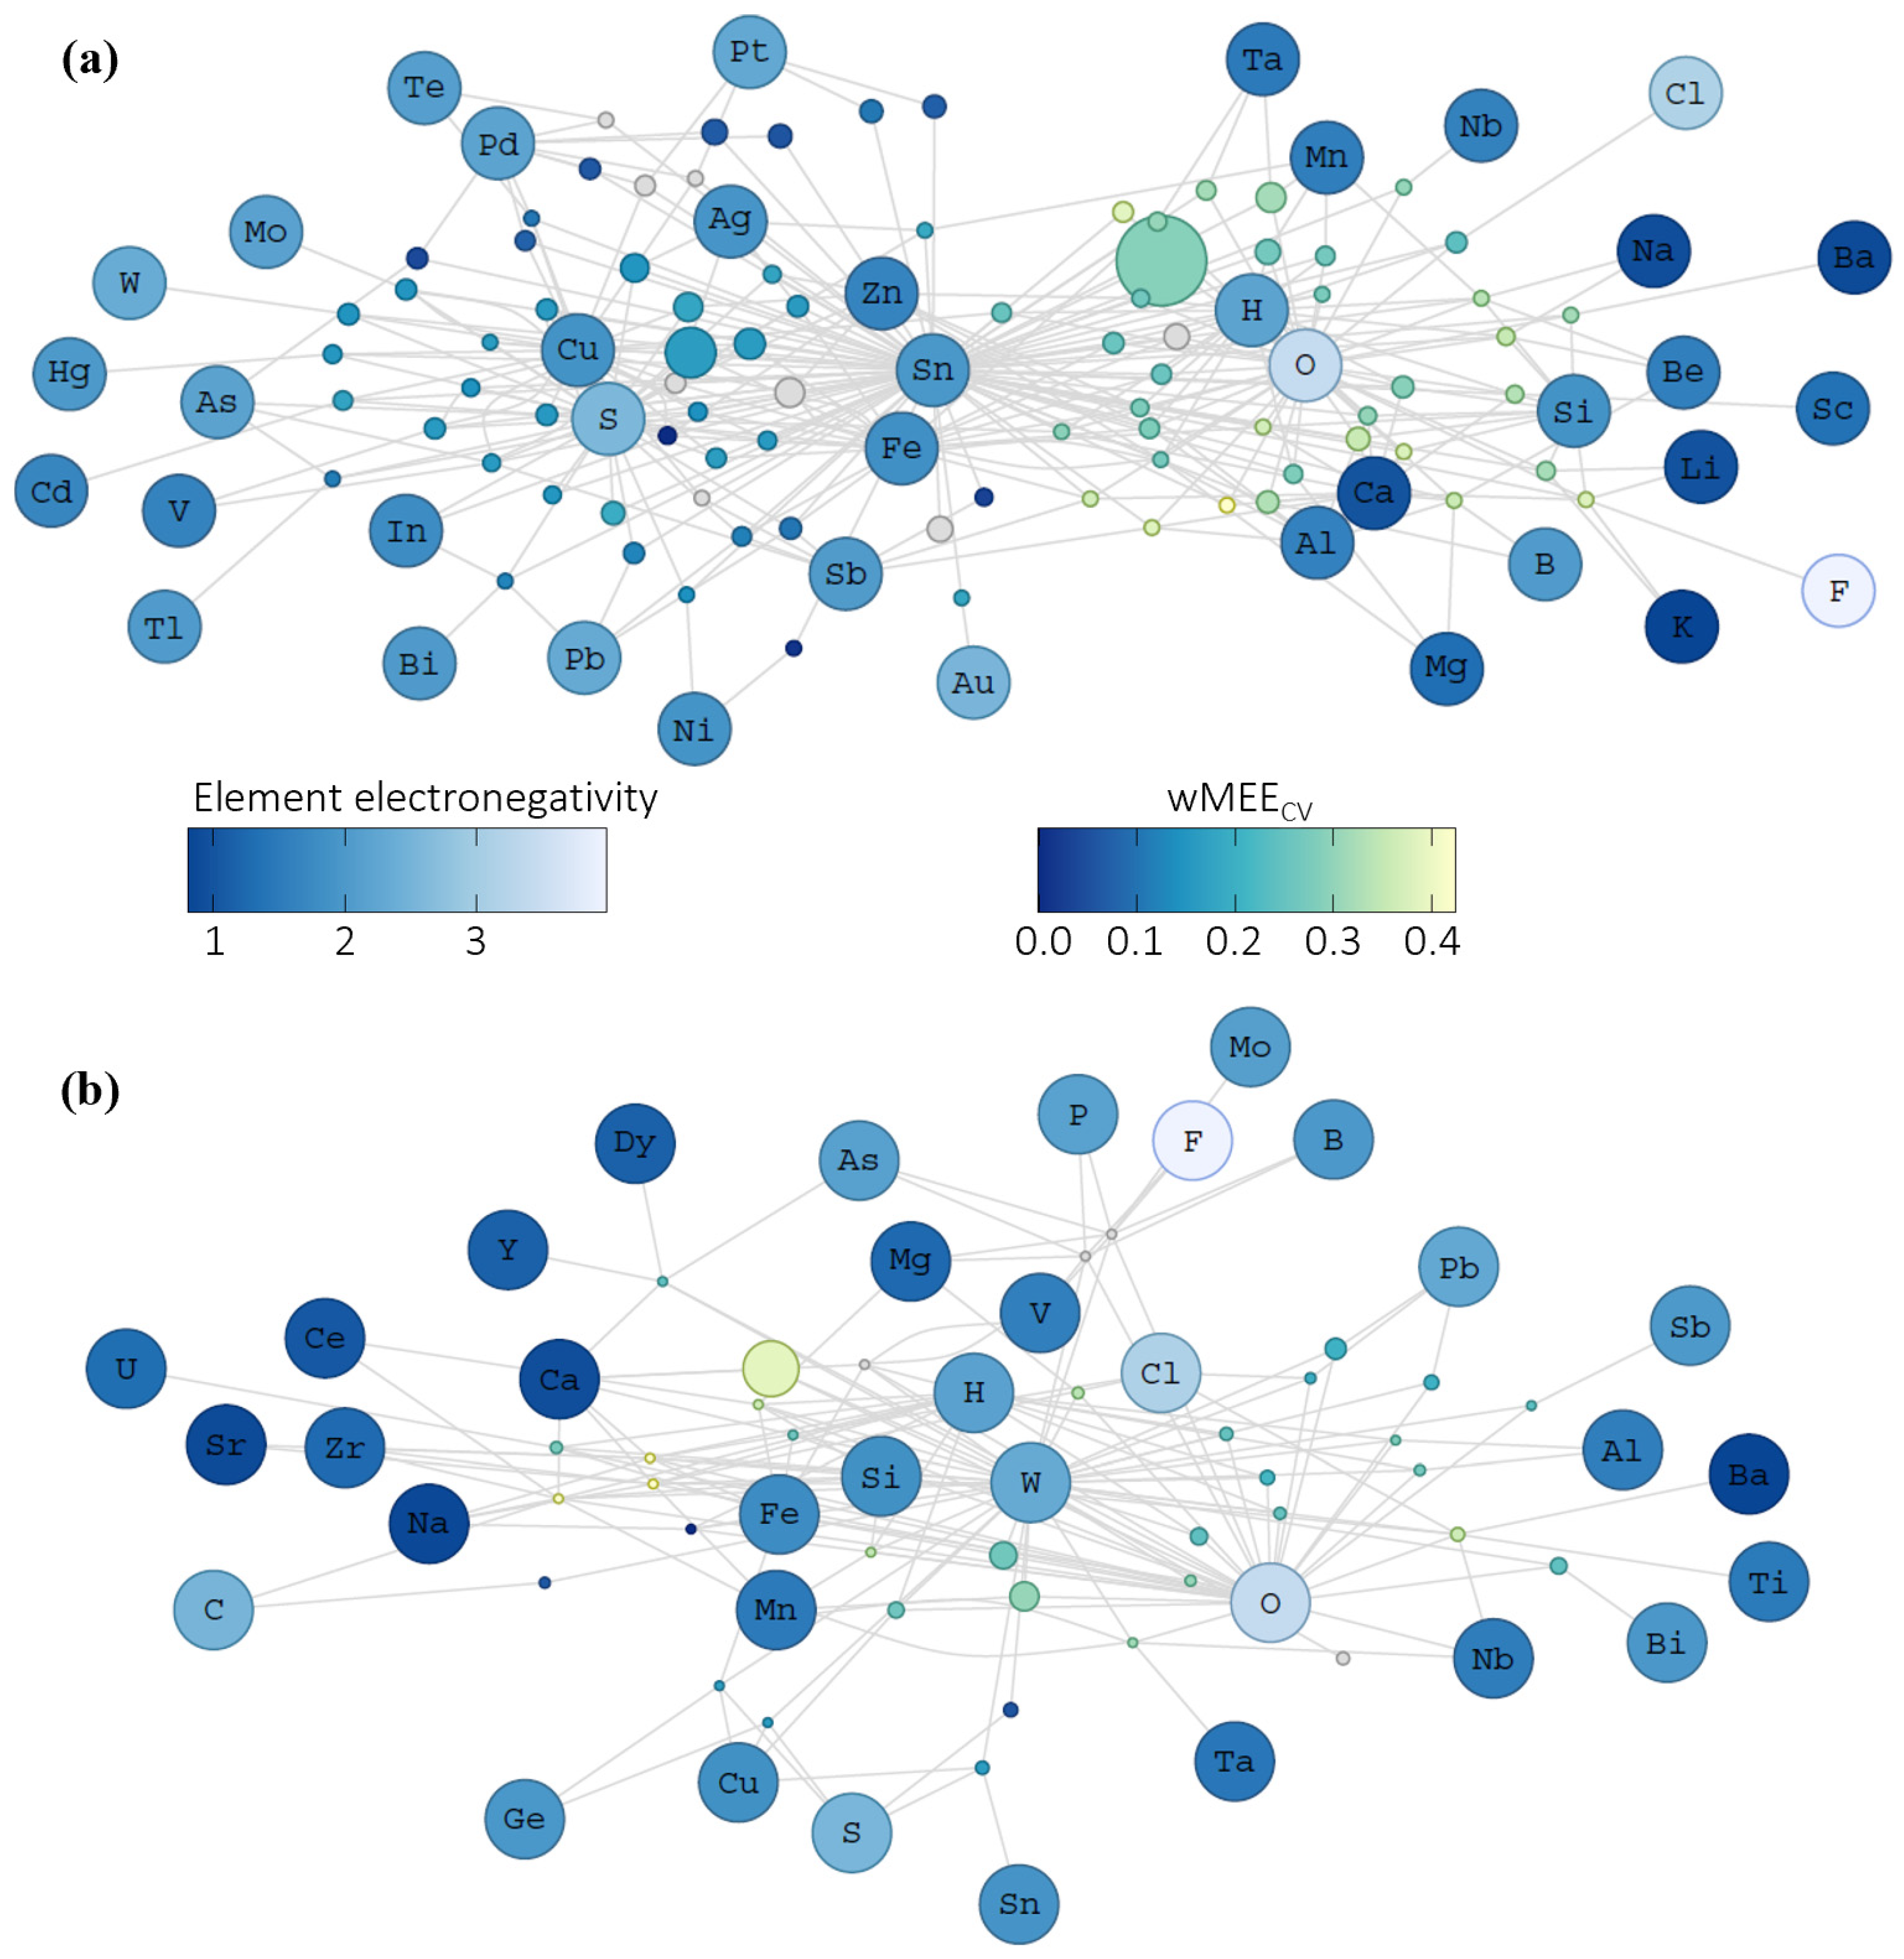
The separation of S and O minerals represented in the Sn mineral chemistry network results in other divergences between the two network groups. The elements that form minerals with Sn and S are predominately soft acids and bases with intermediate electronegativity values (Figure 2a), and the elements that form minerals with Sn and O are mostly hard acids and bases with high or low electronegativities (Figure 2b). The S-containing Sn minerals composed of intermediate electronegativity elements have low wMEECV values (Figure 2a). Conversely, the O-containing Sn minerals composed of high- and low-electronegativity elements in the Sn mineral chemistry network have high wMEECV values. There is very little overlap between the S-containing Sn minerals with low wMEECV values and the O-containing Sn minerals with high wMEECV values. Minerals in the W mineral chemistry network are primarily composed of O and other high- and low-electronegativity elements, resulting in high wMEECV values (Figure 2b).
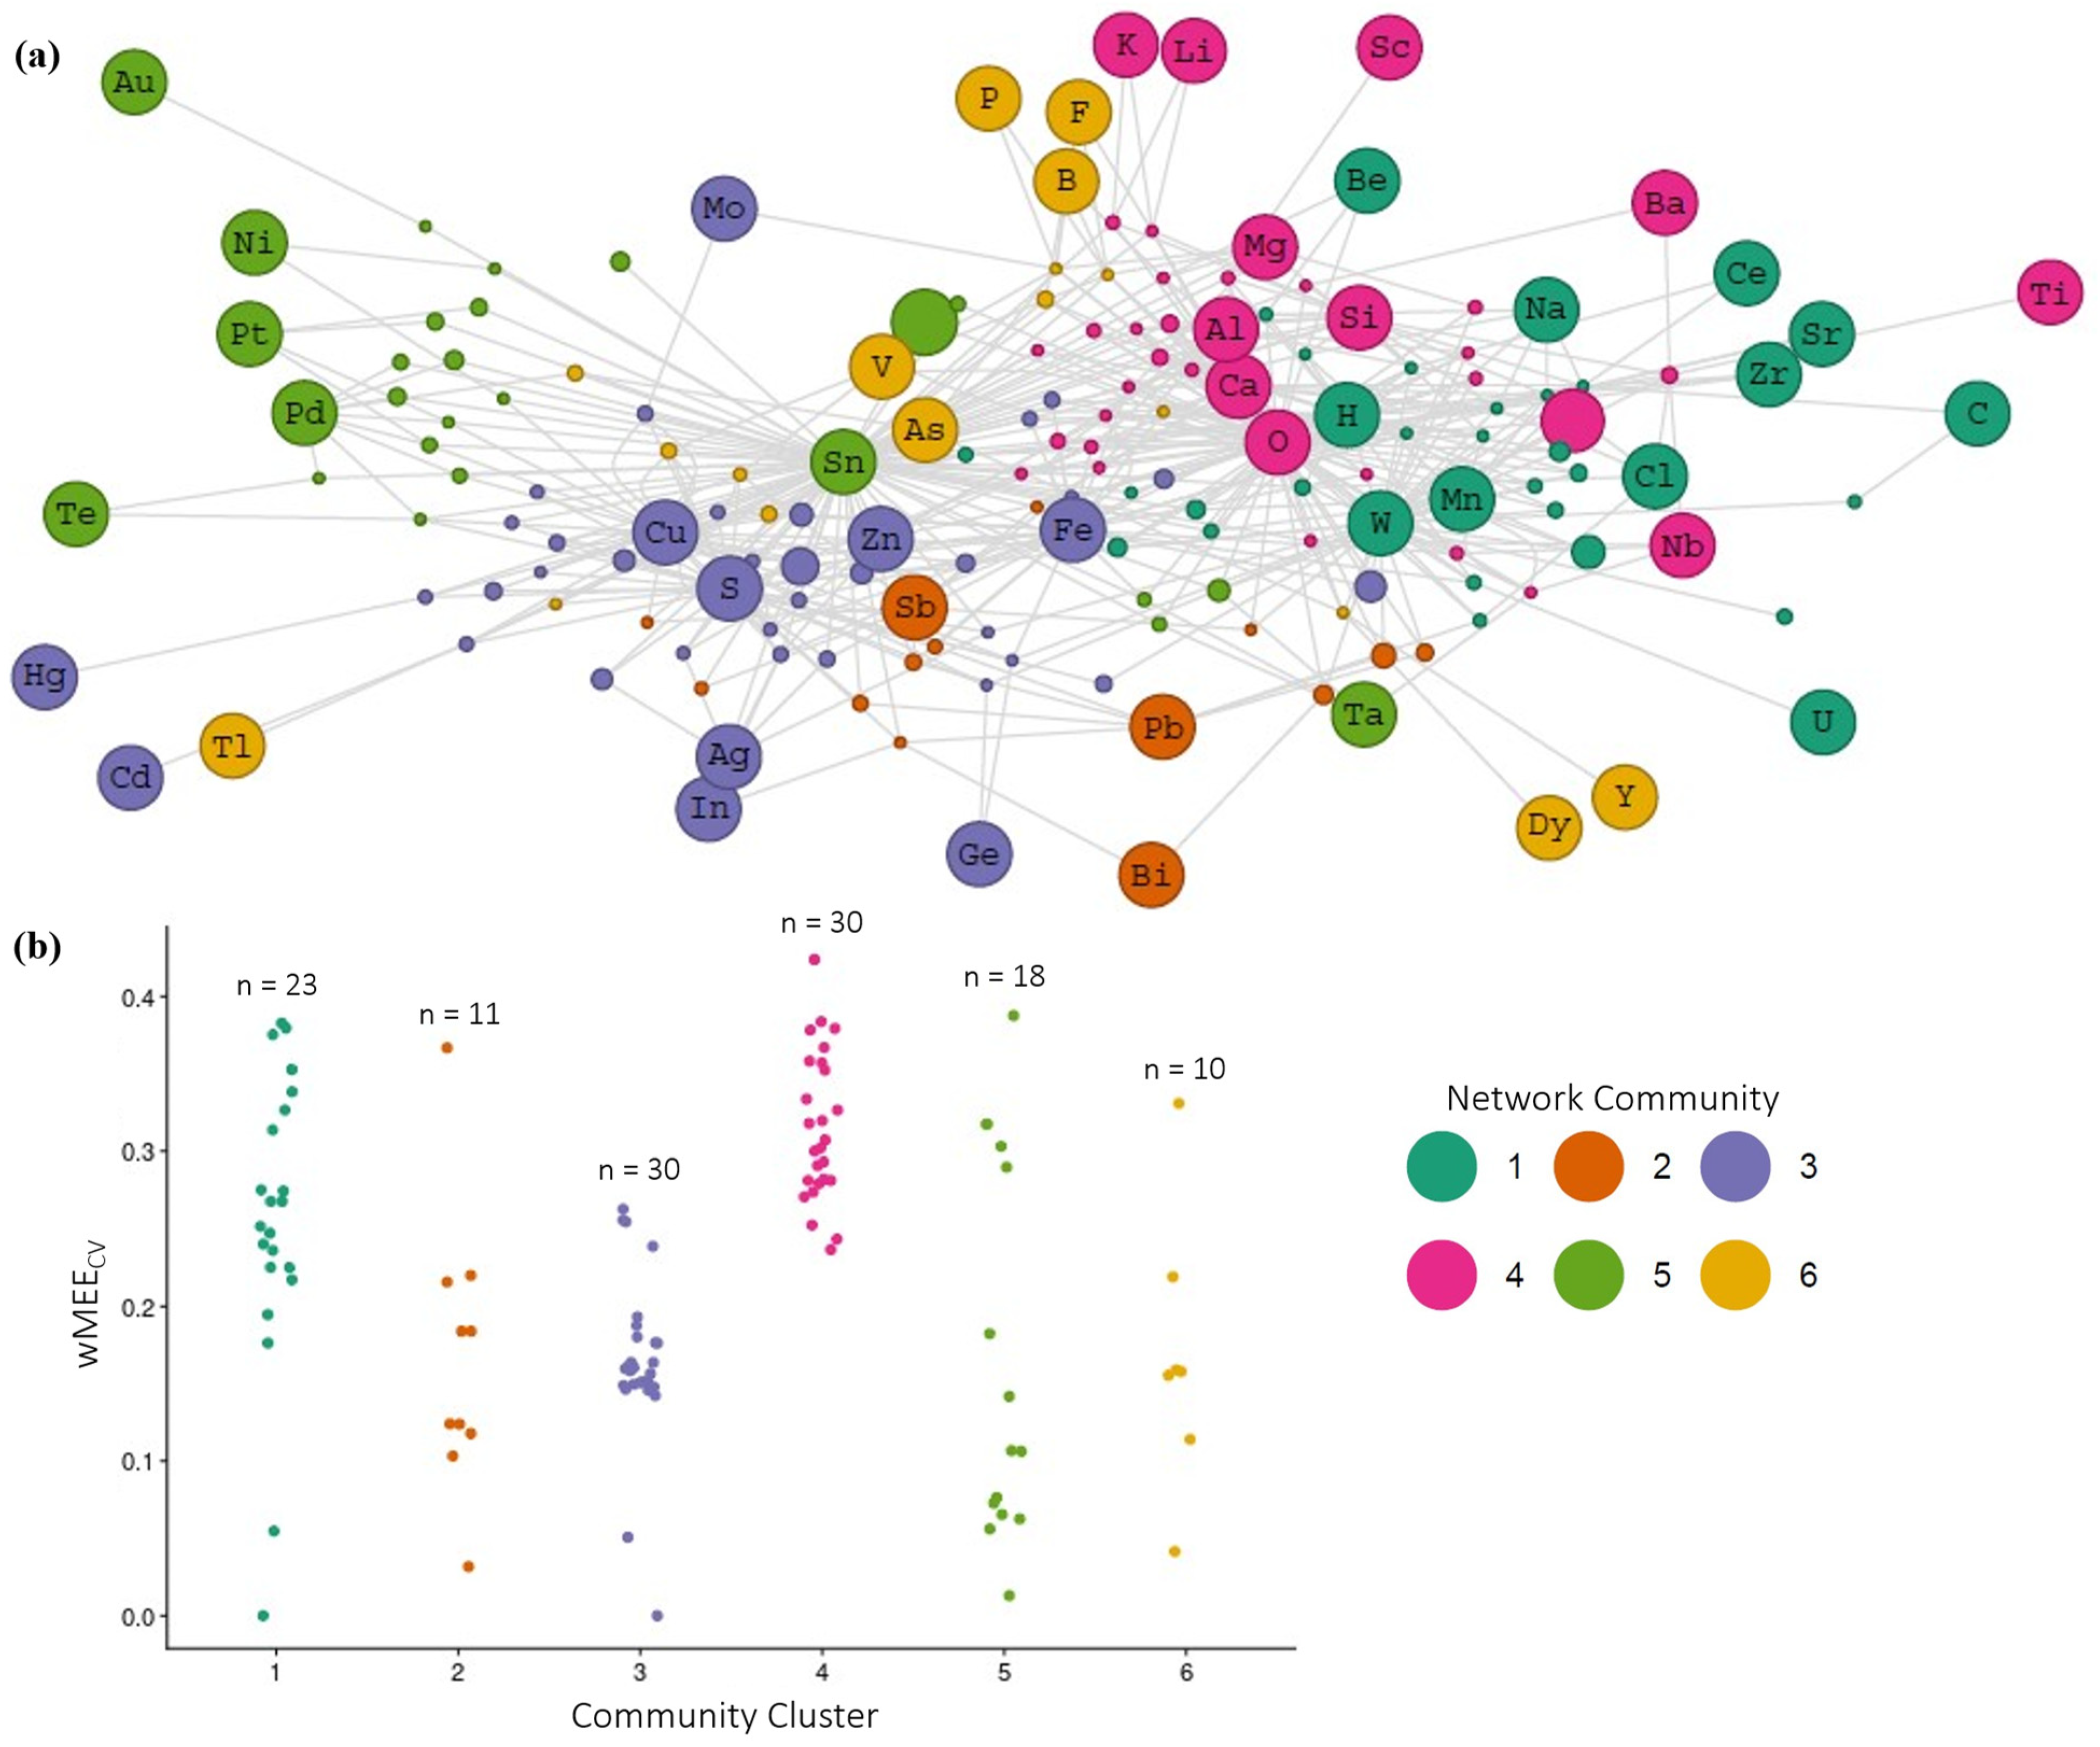
In the combined Sn and W mineral chemistry network, W-containing minerals group with O-containing Sn minerals due to the similarities in mineral constituent elements (Figure 3a). Louvain community detection reveals that there are three network communities in the combined Sn and W chemistry network that mostly include S-containing Sn minerals (communities 2, 3, and 5), and there are two network communities that mostly include O-containing Sn minerals and W minerals (communities 1 and 4; Figure 3a). Network community 6 contains approximately an equal amount of S-containing and O-containing Sn minerals. A post hoc Tukey’s test shows that there is a statistically significant difference between the wMEECV values of communities 1 vs. 3, 1 vs. 5, 2 vs. 4, 3 vs. 4, 4 vs. 5, and 4 vs. 6 (Figure 3b).
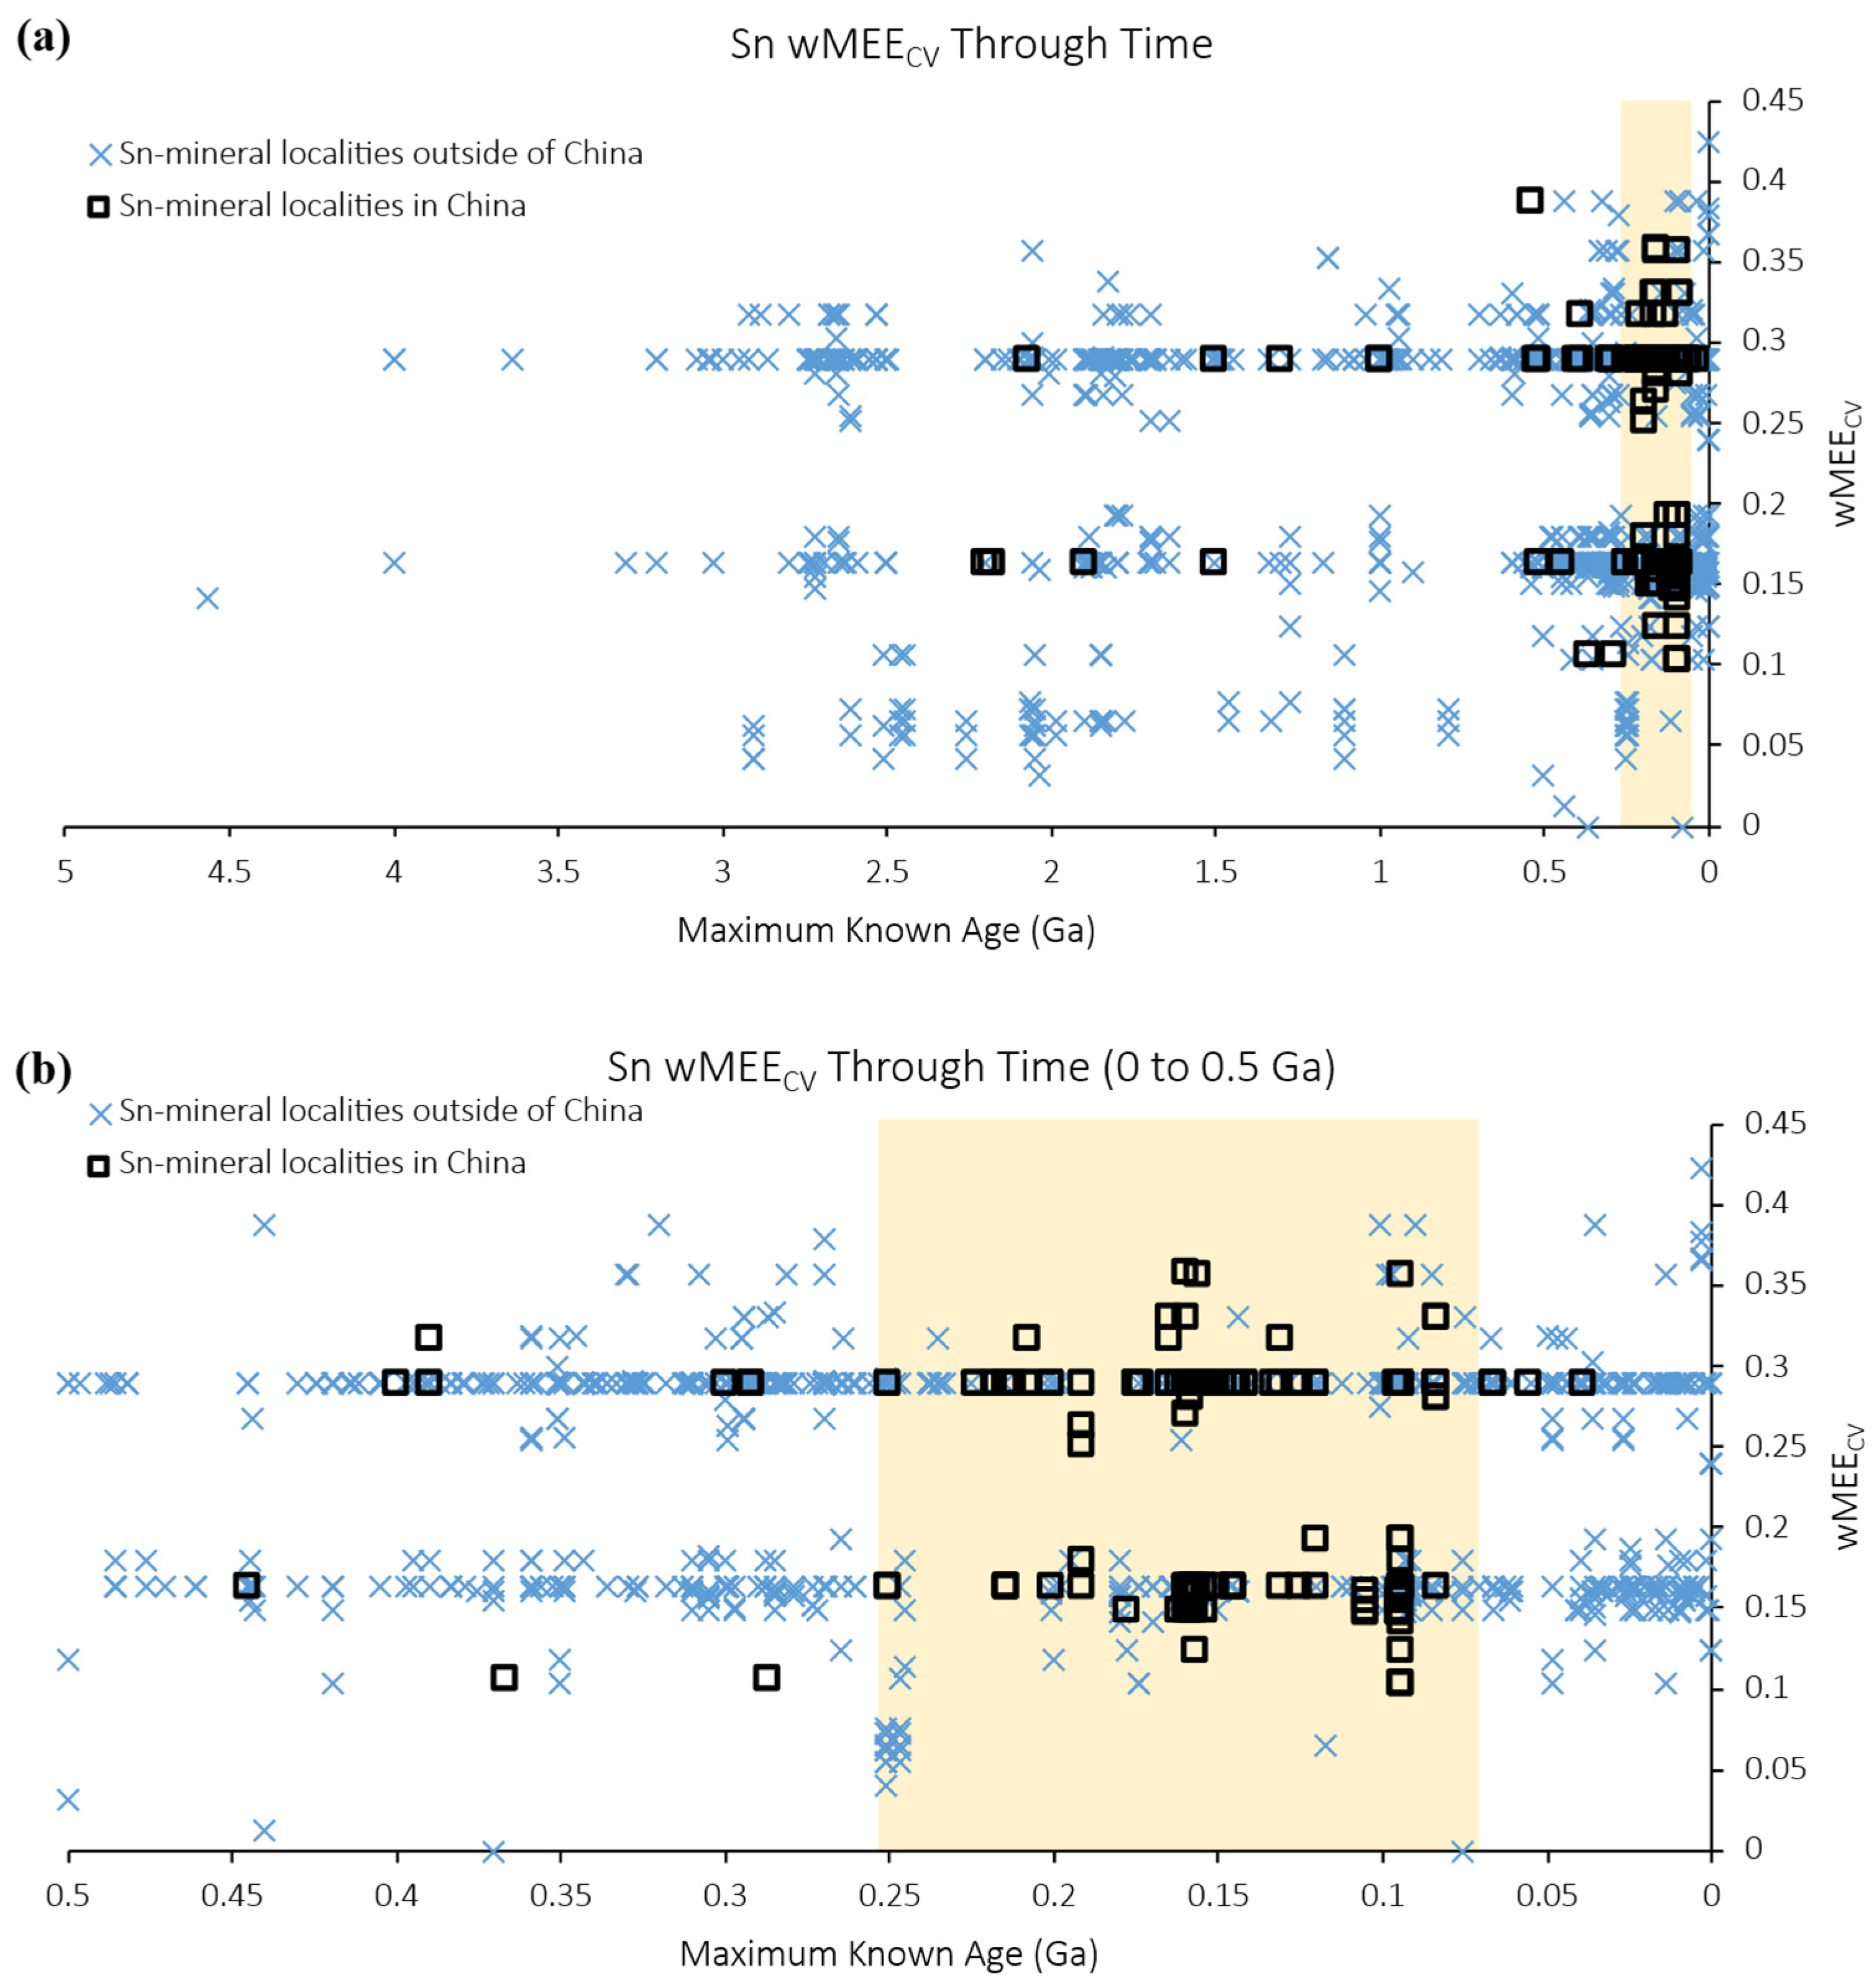
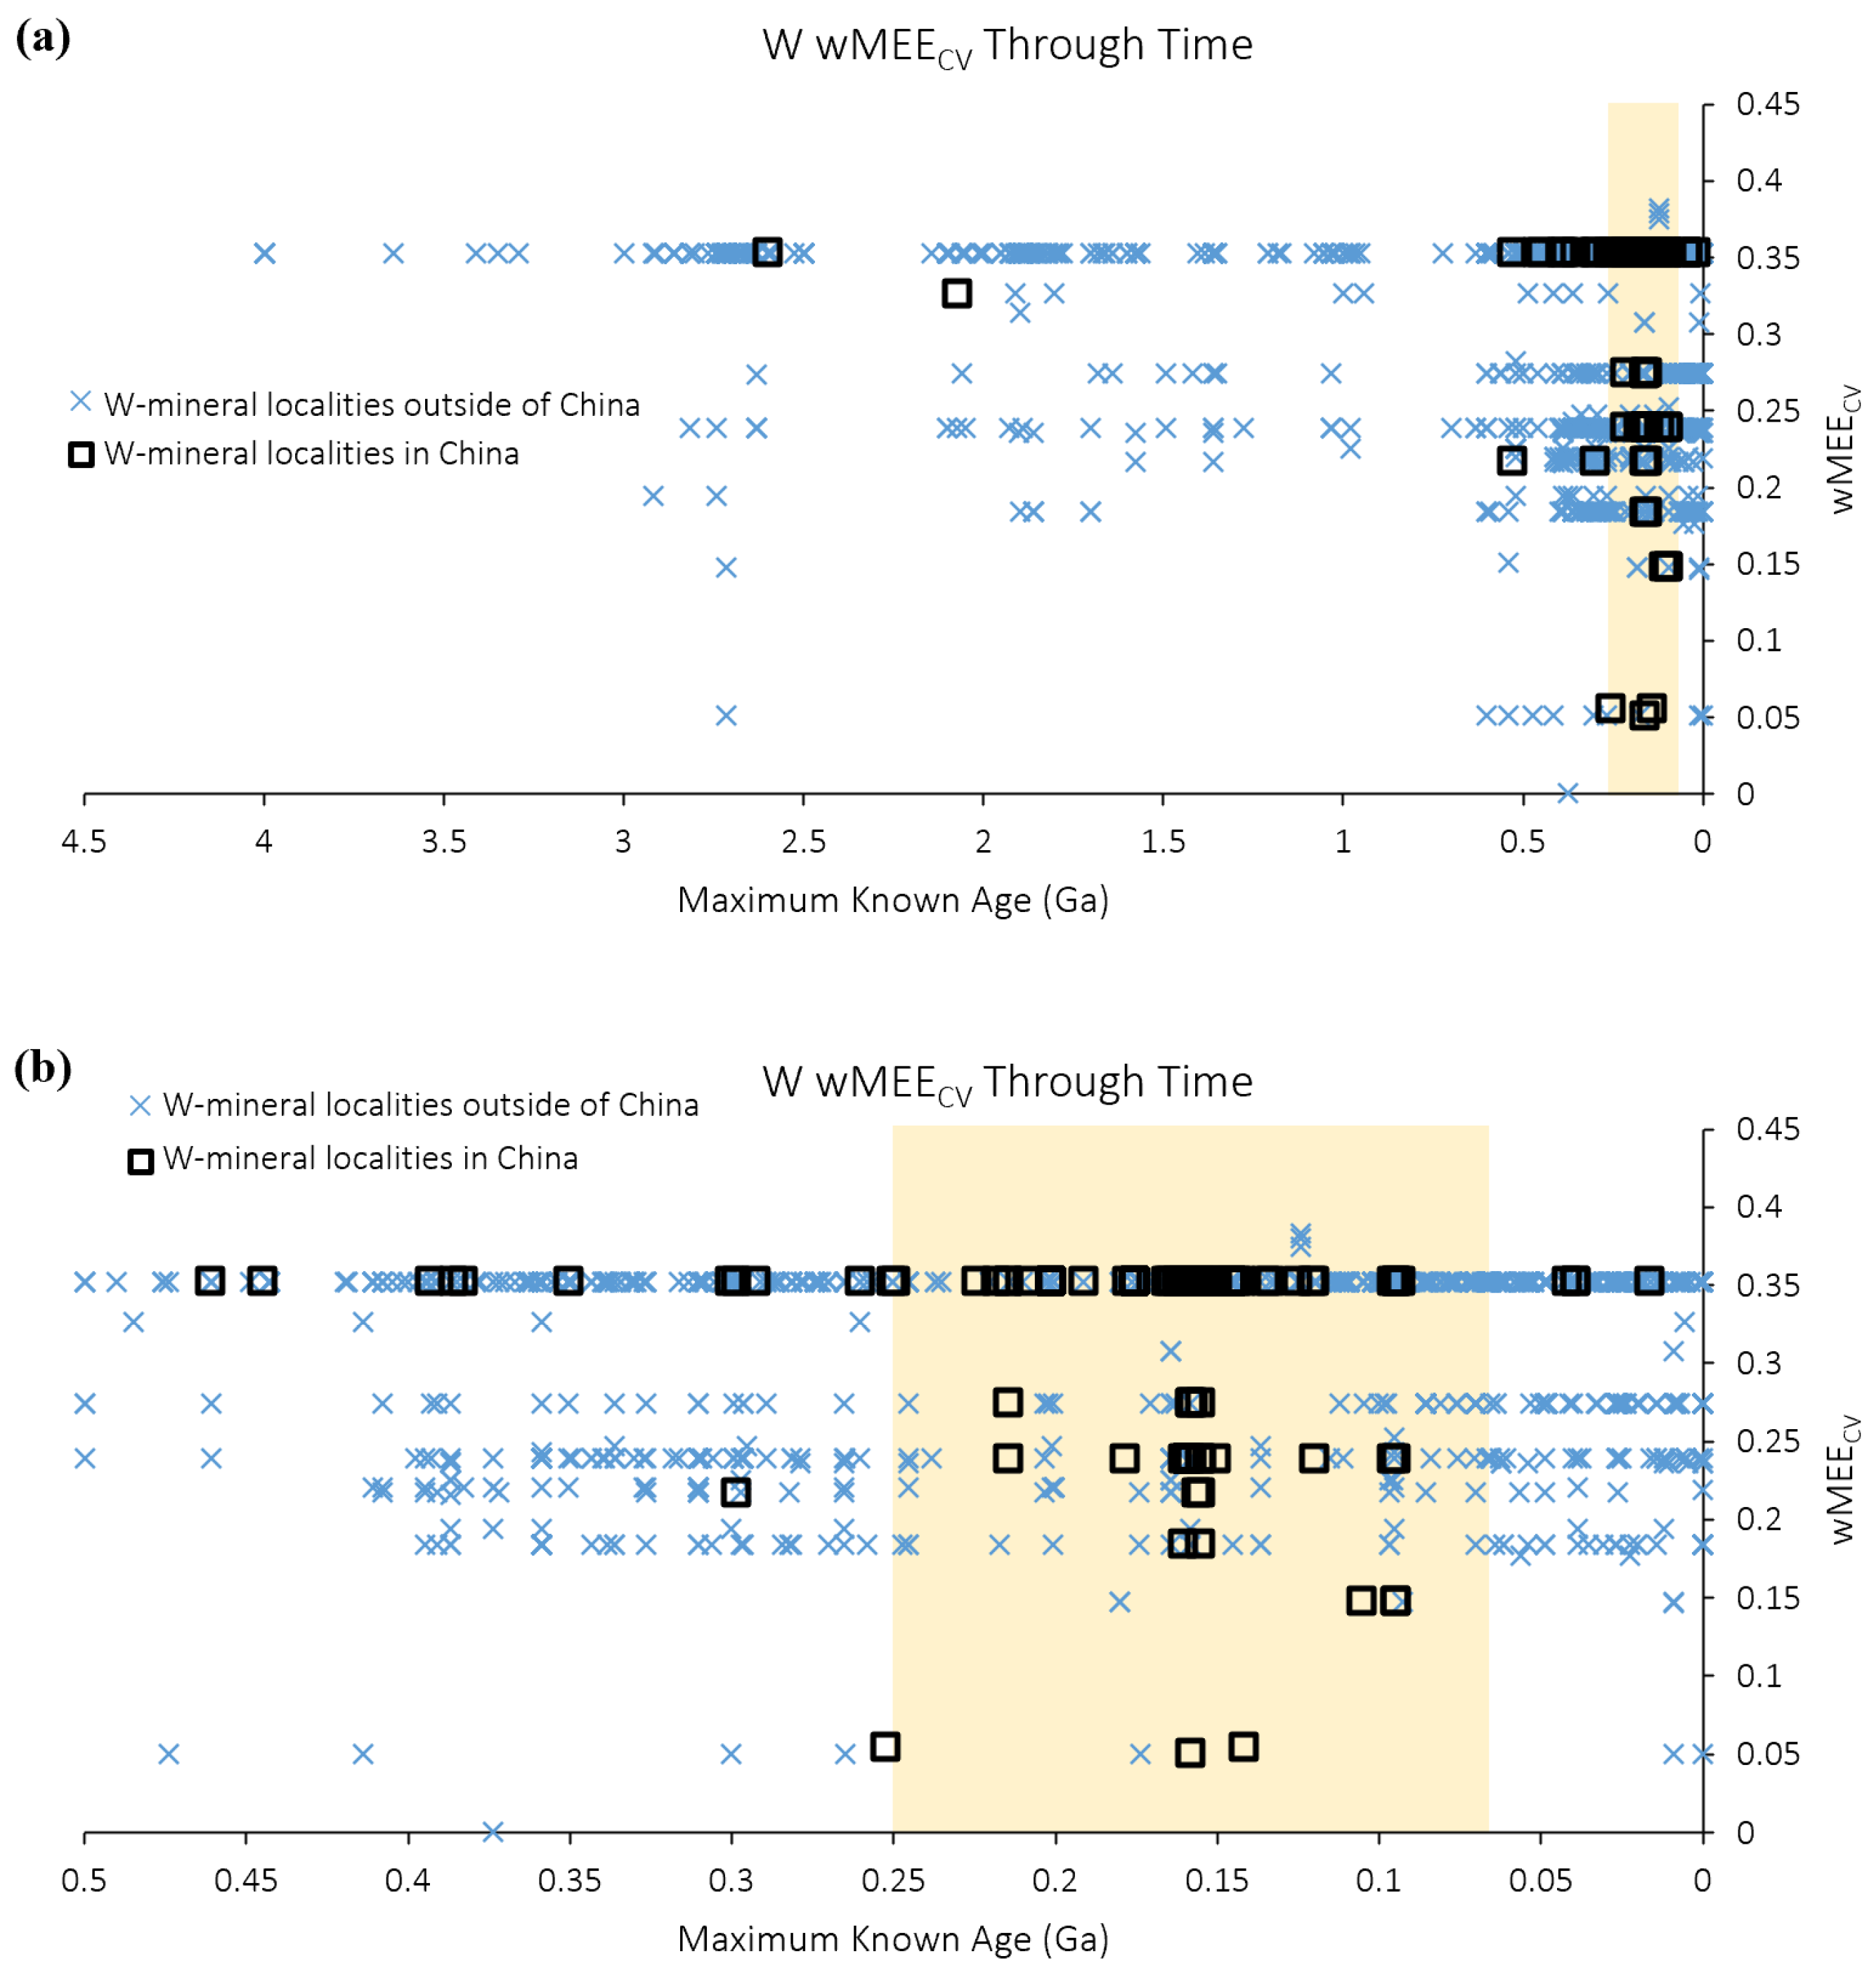
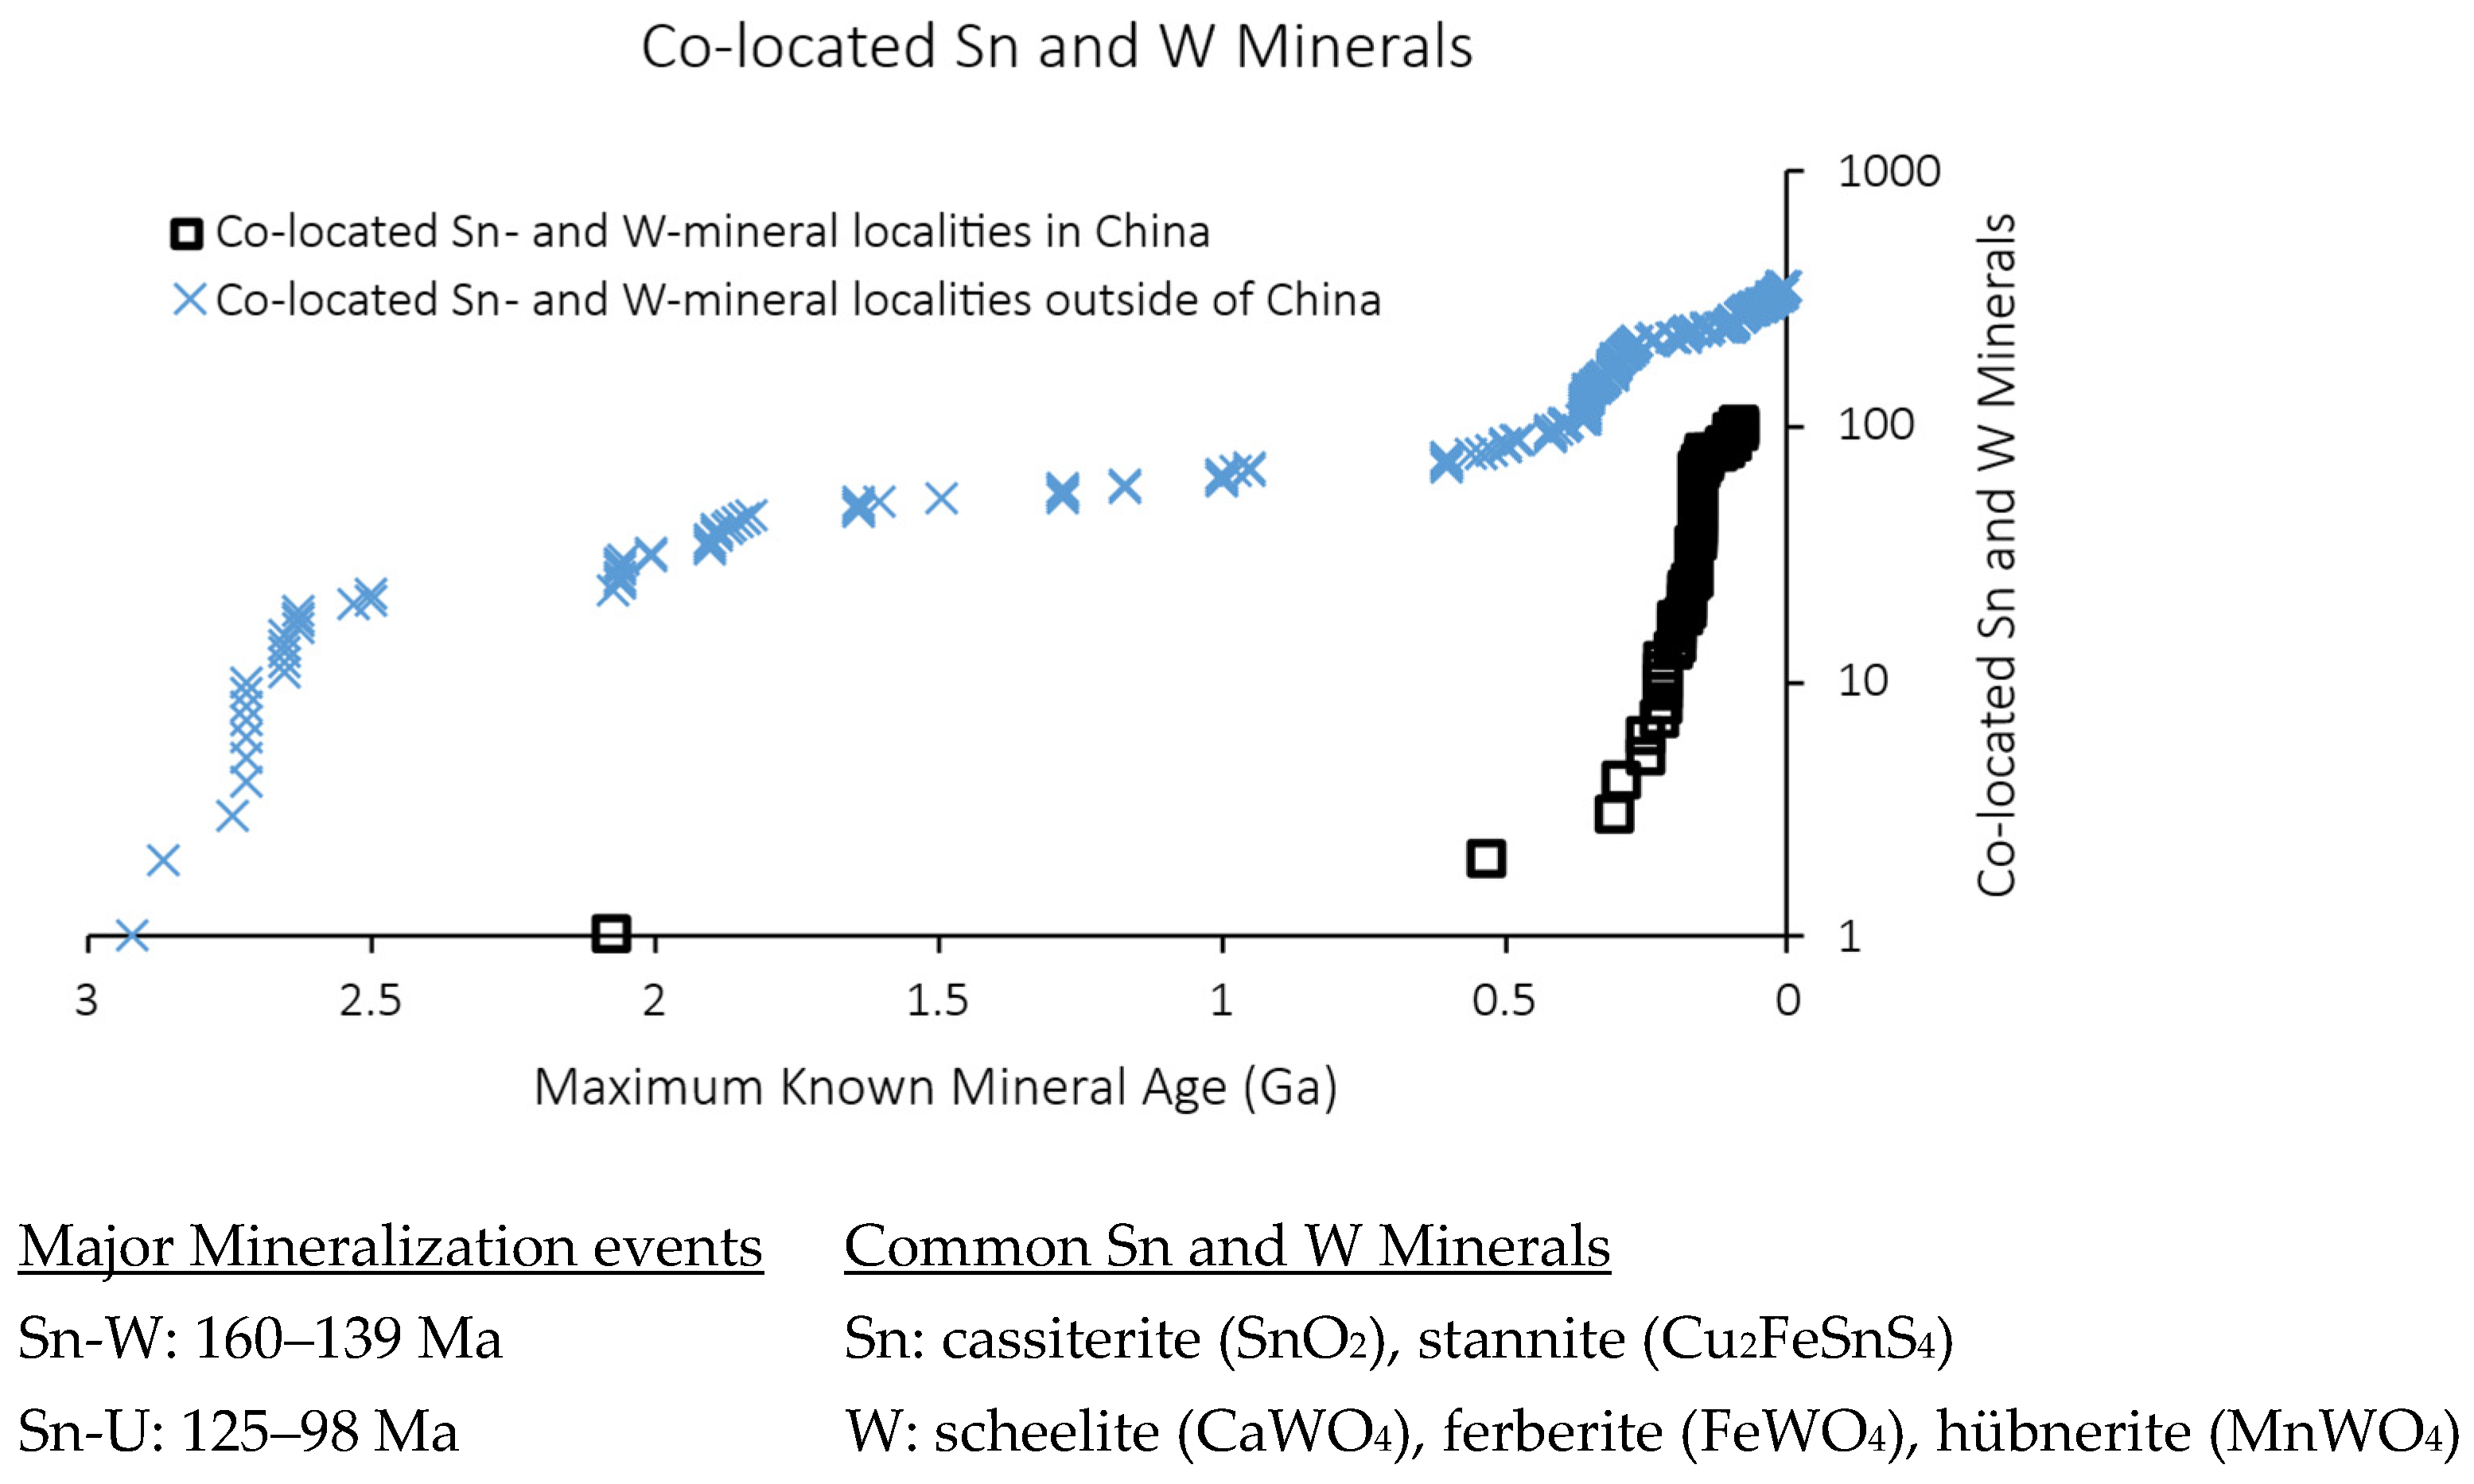
The wMEECV values of Sn minerals plotted through time show the separation of O-containing Sn minerals with higher wMEECV values from S-containing Sn minerals with lower wMEECV values (Figure 4a). While there are more O-containing Sn mineral occurrences than S-containing Sn mineral occurrences, both O-containing and S-containing Sn mineral localities are commonly observed throughout Earth history. The most common O-containing Sn mineral is cassiterite (SnO2, wMEECV = 0.29), which makes up the majority of Sn mineral localities in the MED. There are pulses in Sn and W mineralization, mostly consisting of O-containing Sn minerals and O-containing W minerals both outside and within China with higher wMEECV values, during multiple time periods before the Mesozoic—2.8–2.5 Ga; 2.0–1.8 Ga; 1.3–0.9 Ga; 0.54–0.5 Ga; and 0.4–0.3 Ga—that occur during periods of continental assembly (Figure 4, Figure 5 and Figure 6). The most common Sn minerals and W minerals also have the oldest or close to the oldest known ages, which could be an indicator or sampling bias. However, the vast majority of Sn mineral localities in China have maximum known ages in the Mesozoic Era from 252 to 66 million years ago (Ma), with many cassiterite localities from 175 to 120 Ma (Figure 4b). There is less separation between the wMEECV values of abundant W minerals from the Archean Eon to present day compared to Sn mineral wMEECV values, given that there are fewer S-containing W minerals with low wMEECV values (Figure 5a). In particular, there are fewer S-containing W mineral localities than S-containing Sn mineral localities in the Archean and Proterozoic Eons compared to the Phanerozoic. Scheelite [Ca(WO4), wMEECV = 0.352] makes up the majority of W mineral localities in the MED. Similar to Sn minerals, the vast majority of W mineral localities in China also have maximum known ages in the Mesozoic Era (Figure 5b). Nearly 44% of all Sn mineral localities in China are co-located with W minerals, while only 21% of Sn mineral localities outside of China are co-located with W minerals (Figure 6). Additionally, over 96% of co-located Sn minerals and W minerals in China have maximum known ages in the Mesozoic Era.

4. Discussion

Mineral network analysis has been used in recent years to investigate evolving mineral chemistry [59,60,61,62], predict mineral oxidation state and environmental redox conditions [63,64], and understand the locality distribution of a range of different minerals and their constituent elements [25,58,65,66]. Each element’s mineral chemistry has a unique network structure based on the chemical associations or locality distribution within the network [53]. Oxygen fugacity is an important factor in magmatic–hydrothermal mineralization and the speciation of multivalent elements [67,68,69,70]. The O fugacities related to SnO and SnO2 activity can closely describe the redox conditions of host magma fluids [71,72,73]. Conversely, W operates as an incompatible element irrespective of redox state [74,75]. Along these lines, Sn and W have various mineral chemistry network differences that reflect the O fugacity and redox properties of the two elements (Figure 1 and Figure 2).
The distinct network separation of S-containing Sn minerals from O-containing Sn minerals represents a dramatic divergence in mineral chemistry between reduced and oxidized Sn. Such Sn redox sensitivity has been previously observed in the average O fugacities (LogfO2) of Sn-related Yanshanian granites in South China, which are lower than all other evaluated Yanshanian granites (e.g., Cu-Au-Mo-, +4.22; Cu-Pb-Zn-, +3.51; W-, +3.78; W-Sn-, +1.71; and Sn-related granites, −0.83, [76]). Oxygen fugacity is an important control on Sn-granite formation in other systems as well [77,78]. Additionally, S-containing Sn minerals contain almost exclusively high-density, high-molecular-weight, soft acid–base elements vs. O-containing Sn minerals, which contain mostly low-density, low-molecular-weight hard acid–base elements. The Cretaceous Sn mineralization event in Southwest China was controlled by roll-back of the subduction plate of the New Tethys Ocean that formed granite with low O fugacity that was rich in F and Cl (hard and intermediate bases, [79]). This Sn mineral chemistry network structure very closely aligns with hard–soft acid–base chemistry to an even greater extent than previous network studies that included all mineral-forming elements in a full mineral chemistry network [53]. In both the Sn mineral chemistry network and the full mineral chemistry network, S-containing minerals largely group separately from O-containing minerals.
Due to the incompatibility of W at all redox conditions, W minerals can form at low fO2 as observed with W-Sn-related granites or at relatively high fO2 with W-related granites [76]. Indeed, the W mineral chemistry network does not contain groups of elements and minerals that are separated by density, molecular weight, electronegativity, or hard–soft acid–base properties as in the Sn mineral chemistry network (Figure 1 and Figure 2). Tungsten occurs in the same periodic table group as Mo, but unlike W, Mo is commonly associated with S (e.g., molybdenite, [80]). In the combined Sn and W mineral chemistry network (Figure 3), Louvain network communities that include most W minerals and O-containing Sn minerals (communities 1 and 4) have similar wMEECV values and may reflect the presence of SiO2, Al2O3, Na2O, niobium (Nb), tantalum (Ta), and other commonly enriched elements in W-Sn-related granites [40,81,82]. The combined Sn and W network also highlights the respective geochemical properties of Sn and W. Communities 1 and 4 align more with W and other siderophile (ex: Mn) and lithophile elements (ex: Al, Ca, Mg, Si, etc.), while communities 2, 3, and 5 align more with Sn and other chalcophile elements (ex: Cu, Zn, Ag, Sb, Te, etc.).
The separation between O-containing Sn minerals and S-containing Sn minerals and the O fugacity/redox dependence of Sn speciation [83,84] is further represented by the difference in wMEECV values of O-containing Sn minerals (higher wMEECV values) and S-containing Sn minerals (lower wMEECV values) through time from the Archean Eon to present day (Figure 4). As observed in previous studies with a wide range of mineral-forming elements [23,24,25,53], the pulses of Sn and W mineralization, including O-containing Sn minerals and O-containing W minerals, during multiple time periods before the Mesozoic occur during continental assembly events (Figure 4 and Figure 5): Kenorland 2.8–2.5 Ga; Columbia 2.0–1.8 Ga; Rodinia 1.3–0.9 Ga; Pannotia 0.54–0.5 Ga; and Pangea 0.4–0.3 Ga [23,25,85,86]. Chemical weathering can result in protolith Sn and W enrichment along the margins of former supercontinents [87]. Specific multi-cycle porphyry formation or hydrothermal alteration processes can result in elevated W mineralization [88,89], while more widespread processes can drive recurrent Sn mineralization, including delamination [90] and diverse episodic remelting events [91]. The greater number of known Sn mineral localities than W mineral localities during periods of known continental assembly illustrates that Sn is more compatible than W in mineral formation with both O and S.
The abundance of higher wMEECV Sn mineral and W mineral values located in China with maximum known ages from 160 to 139 Ma (Figure 4 and Figure 5) represents the W-Sn-Nb-Ta mineralization mainly in the Nanling Range [5,31,34,35,92]. There are also abundant Sn mineral and W mineral occurrences with higher wMEECV values from 175 to 120 Ma, which mainly consist of cassiterite and scheelite. The presence of numerous lower wMEECV Sn mineral localities in China, primarily S-containing Sn minerals, from 125 to 98 Ma represents the Sn-U mineralization in the Nanling Range [36,37,38]. Differences in mineralization between these two periods occurred due to similar constituent element associations in oxide minerals in granitic melts from 175 to 120 Ma with comparable oxidation states that transport Sn and W together vs. more reducing sulfur-influenced tectonically evolved crustal conditions that mobilized Sn and U [31,34,35,36,37,38]. The redox influence on Sn and W deposition is represented in the mineral chemistry networks (Figure 1, Figure 2 and Figure 3) and wMEECV values through time (Figure 4, Figure 5 and Figure 6). These mineralization events are further exemplified by the sharp rise in co-located Sn minerals and W minerals during these Mesozoic metallogenic events (Figure 6, [13]). For comparison, the majority of locality ages of Sn minerals and W minerals located in abundant deposits in southwest United Kingdom and southeast Australia are older and occur in the Devonian and Carboniferous Periods (MED, [52] https://rruff.info/ima/).

5. Conclusions

The elements Sn and W occur in extensive and economically important deposits in China that formed during the Mesozoic Era and account for a large proportion of all co-located Sn minerals and W minerals documented in the Mineral Evolution Database. The two elements have a similar chemistry among their oxides as shown using mineral chemistry network community detection analysis and mineral element electronegativity associations (wMEECV). However, Sn forms a wide range of minerals that also contain S, compared to W, which occurs in a limited number of S-containing minerals. The mineral chemistry network wMEECV distributions of Sn minerals and W minerals, and the wMEECV values of Sn mineral and W mineral localities through time, reflect the importance of redox and O fugacity on Sn mineral formation and the lesser importance of O fugacity on W mineral formation. These similarities between O-containing minerals and differences between S-containing minerals may have contributed to the Sn-W mineralization that occurred in the Nanling Range from 160 to 139 Ma vs. the Sn-U mineralization of the Nanling Range from 125 to 98 Ma. The abundance of Sn and W minerals and their diverse chemistry in Mesozoic metallogenic deposits of China exemplify what a unique and important region and time period this is for tracking the distribution of economically important elements and understanding the impact of changing crustal conditions on mineralization.

Author Contributions

Conceptualization, E.K.M.; methodology, E.K.M.; software, E.K.M.; validation, E.K.M.; formal analysis, E.K.M. and A.H.; investigation, E.K.M. and A.H.; resources, E.K.M.; data curation, S.M.M.; writing—original draft preparation, E.K.M.; writing—review and editing, E.K.M., A.H. and S.M.M.; visualization, E.K.M. and A.H.; supervision, E.K.M.; project administration, E.K.M.; funding acquisition, E.K.M. All authors have read and agreed to the published version of the manuscript.

Funding

This project was funded in part by NSF EAR2020520, NASA Astrobiology Institute (Cycle 8) ENIGMA: Evolution of Nanomachines in Geospheres and Microbial Ancestors (80NSSC18M0093), and the 4D Deep-Time Data-Driven Initiative at the Carnegie Institution for Science. This work was also supported by the Energy Resources Program and the Mineral Resources Program of the U.S. Geological Survey. Any use of trade, firm, or product names is for descriptive purposes only and does not imply endorsement by the U.S. Government.

Data Availability Statement

Data presented in this manuscript can be accessed from the Mineral Evolution Database (http://rruff.info/ima/; accessed on 15 March 2023). Dragon is freely available as an open-source R package and is accessible from CRAN (https://cran.r-project.org/; accessed on 15 March 2023) to analyze data from the Mineral Evolution Database. Dragon source code and instructions for usage are available from the repository https://github.com/spielmanlab/dragon (accessed on 15 March 2023). An interactive dragon session can either be launched locally on a personal computer or accessed on a free web server, linked from the dragon repository.

Acknowledgments

We thank Sarah Hayes (U.S. Geological Survey), Carlin Green (U.S. Geological Survey), and Clint Scott (U.S. Geological Survey) for their helpful comments and input. We thank Joshua J. Golden for his assistance in working with the Mineral Evolution Database and for his input in the development of dragon. We thank Robert Hazen for his comments and input as well.

Conflicts of Interest

The authors declare that they have no commercial or financial relationships that could be interpreted as a potential conflict of interest.

References

  1. Nassar, N.T.; Pineault, D.; Allen, S.M.; McCaffrey, D.M.; Padilla, A.J.; Brainard, J.L.; Bayani, M.; Shojaeddini, E.; Ryter, J.W.; Lincoln, S.; et al. Methodology and Technical Input for the 2025 U.S. List of Critical Minerals—Assessing the Potential Effects of Mineral Commodity Supply Chain Disruptions on the U.S. Economy; U.S. Geological Survey: Reston, VA, USA, 2025. [Google Scholar]
  2. Jochum, K.P.; Hofmann, A.W.; Seufert, H.M. Tin in Mantle-Derived Rocks: Constraints on Earth Evolution. Geochim. Cosmochim. Acta 1993, 57, 3585–3595. [Google Scholar] [CrossRef]
  3. Hamaguchi, H.; Kuroda, R.; Okuma, N.; Kawabuchi, K.; Mitsubayashi, T.; Hosohara, K. The Geochemistry of Tin. Geochim. Cosmochim. Acta 1964, 28, 1039–1053. [Google Scholar] [CrossRef]
  4. Chen, J.; Halls, C.; Stanley, C.J. Mineral Association and Mineralogical Criteria for the Formation Conditions of A B-F-Sn-Bi Skarn in Damoshan, Gejiu Tin Field, Southwest China. Chin. J. Geochem. 1992, 11, 140–155. [Google Scholar] [CrossRef]
  5. Zhang, W.L.; Hua, R.; Wang, R.; Chen, P.; Li, H. New Dating of the Dajishan Granite and Related Tungsten Mineralization in Southern Jiangxi. Acta Geol. Sin. 2006, 80, 956–962. [Google Scholar]
  6. Cai, M.H.; Che, K.X.; Qu, W.J.; Liu, G.Q.; Fu, J.M.; Yin, J.P. Geological Characteristics and Re-Os Dating of Molybdenite in Hehuaping Tin-Polymetallic Deposit, Southern Hunan Province. Miner. Depos. 2006, 25, 263–267. [Google Scholar]
  7. Dines, H.G. The Metalliferous Mining Region of South-West England; H.M. Stationery Office: London, UK, 1956. [Google Scholar]
  8. Alderton, D.H.M.; Moore, F. New Determinations of Tin and Tungsten in Granites from South-West England. Mineral. Mag. 1981, 44, 354–356. [Google Scholar] [CrossRef]
  9. de Roo, J.A. Structural Controls on the Emplacement of the Vein-Type Tungsten-Tin Ore at Mount Carbine, Queensland, Australia. Econ. Geol. 1988, 83, 1170–1180. [Google Scholar] [CrossRef]
  10. Zhao, P.; Chu, X.; Williams-Jones, A.E.; Mao, J.; Yuan, S. The Role of Phyllosilicate Partial Melting in Segregating Tungsten and Tin Deposits in W-Sn Metallogenic Provinces. Geology 2022, 50, 121–125. [Google Scholar] [CrossRef]
  11. Webster, J.D.; Thomas, R.; Rhede, D.; Förster, H.-J.; Seltmann, R. Melt Inclusions in Quartz from an Evolved Peraluminous Pegmatite: Geochemical Evidence for Strong Tin Enrichment in Fluorine-Rich and Phosphorus-Rich Residual Liquids. Geochim. Cosmochim. Acta 1997, 61, 2589–2604. [Google Scholar] [CrossRef]
  12. Zhu, Z.; Xu, J. A Tentative Analysis of the Tin Mineralization Geological Characteristics and Metallogenic Prospect Areas in China. Yunnan Geol. 1984, 3, 1–10. [Google Scholar]
  13. Chen, Z.; Sheng, J.; Liu, L.; Wang, D.; Liang, T.; Wang, C. A Preliminary Review of Metallogenic Regularity of Tin Deposits in China. Acta Geol. Sin. Engl. Ed. 2015, 89, 1021–1035. [Google Scholar] [CrossRef]
  14. Linnen, R.L.; Pichavant, M.; Holtz, F.; Burgess, S. The Effect of fo2 on the Solubility, Diffusion, and Speciation of Tin in Haplogranitic Melt at 850 °C and 2 Kbar. Geochim. Cosmochim. Acta 1995, 59, 1579–1588. [Google Scholar] [CrossRef]
  15. O’Neill, H.S.C. The Origin of the Moon and the Early History of the Earth—A Chemical Model. Part 1: The Moon. Geochim. Cosmochim. Acta 1991, 55, 1135–1157. [Google Scholar] [CrossRef]
  16. Palme, H.; O’Neill, H. Cosmochemical Estimates of Mantle Composition. In The Mantle and Core, Treatise on Geochemistry; Elsevier: Amsterdam, The Netherlands, 2003; Volume 2, pp. 1–38. [Google Scholar]
  17. O’Neill, H.S.C.; Berry, A.J.; Eggins, S.M. The Solubility and Oxidation State of Tungsten in Silicate Melts: Implications for the Comparative Chemistry of W and Mo in Planetary Differentiation Processes. Chem. Geol. 2008, 255, 346–359. [Google Scholar] [CrossRef]
  18. Harper, C.L.; Jacobsen, S.B. Investigations of the 182Hf-182W Systematics. Lunar Planet. Sci. 1994, 25, 509–510. [Google Scholar]
  19. Newsom, H.E.; Sims, K.W.W.; Noll, P.D.; Jaeger, W.L.; Maehr, S.A.; Beserra, T.B. The Depletion of Tungsten in the Bulk Silicate Earth: Constraints on Core Formation. Geochim. Cosmochim. Acta 1996, 60, 1155–1169. [Google Scholar] [CrossRef]
  20. Kleine, T.; Walker, R.J. Tungsten Isotopes in Planets. Annu. Rev. Earth Planet. Sci. 2017, 45, 389–417. [Google Scholar] [CrossRef]
  21. Chen, G. Crustobody, a New Concept of Comprehensive Geotectonics. Geotecton. Metallog. 1994, 18, 283–310. [Google Scholar]
  22. Chen, G. A Preliminary Proposal on Crustobody Geotectonics. Geotecton. Metallog. 1998, 22, 97–104. [Google Scholar]
  23. Voice, P.J.; Kowalewski, M.; Eriksson, K.A. Quantifying the Timing and Rate of Crustal Evolution: Global Compilation of Radiometrically Dated Detrital Zircon Grains. J. Geol. 2011, 119, 109–126. [Google Scholar] [CrossRef]
  24. Liu, C.; Knoll, A.H.; Hazen, R.M. Geochemical and Mineralogical Evidence That Rodinian Assembly Was Unique. Nat. Commun. 2017, 8, 1950. [Google Scholar] [CrossRef] [PubMed]
  25. Hazen, R.M.; Downs, R.T.; Eleish, A.; Fox, P.; Gagné, O.C.; Golden, J.J.; Grew, E.S.; Hummer, D.R.; Hystad, G.; Krivovichev, S.V.; et al. Data-Driven Discovery in Mineralogy: Recent Advances in Data Resources, Analysis, and Visualization. Engineering 2019, 5, 397–405. [Google Scholar] [CrossRef]
  26. Chen, G.; Peng, S.; Dai, T. Evolution-Motion of Crustobodies and Geotectonic Metallogeny. Acta Geol. Sin. Engl. Ed. 2000, 74, 433–438. [Google Scholar] [CrossRef]
  27. Wong, W.H. Crustal Movements and Igneous Activities in Eastern China since Mesozoic Time. Acta Geol. Sin. 1927, 6, 9–37. [Google Scholar] [CrossRef]
  28. Wong, W.H. The Mesozoic Orogenic Movement in Eastern China. Bull. Geol. Soc. China 1929, 8, 33–44. [Google Scholar] [CrossRef]
  29. Dong, S.W.; Zhang, Y.Q.; Long, C.X.; Yang, Z.Y.; Ji, Q.; Wang, T.; Hu, J.M.; Chen, X.H. Jurassic Tectonic Revolution in China and New Interpretation of the Yanshan Movement. Acta Geol. Sin. 2007, 81, 1449–1461. [Google Scholar]
  30. Xu, D.; Chi, G.; Zhang, Y.; Zhang, Z.; Sun, W. Yanshanian (Late Mesozoic) Ore Deposits in China—An Introduction to the Special Issue. Ore Geol. Rev. 2017, 88, 481–490. [Google Scholar] [CrossRef]
  31. Hua, R.M.; Chen, P.; Zhang, W.; Lu, J. Three Major Metallogenic Events in Mesozoic in South China. Miner. Depos. 2005, 24, 99–107. [Google Scholar]
  32. Hu, R.-Z.; Zhou, M.-F. Multiple Mesozoic Mineralization Events in South China—An Introduction to the Thematic Issue. Miner. Depos. 2012, 47, 579–588. [Google Scholar] [CrossRef]
  33. Mao, J.W.; Chen, Y.B.; Chen, M.H.; Pirajno, F. Major Types and Time–Space Distribution of Mesozoic Ore Deposits in South China and Their Geodynamic Settings. Miner. Depos. 2013, 48, 267–294. [Google Scholar] [CrossRef]
  34. Shu, X.-J.; Wang, X.-L.; Sun, T.; Xu, X.; Dai, M.-N. Trace Elements, U–Pb Ages and Hf Isotopes of Zircons from Mesozoic Granites in the Western Nanling Range, South China: Implications for Petrogenesis and W–Sn Mineralization. Lithos 2011, 127, 468–482. [Google Scholar] [CrossRef]
  35. Huang, L.-C.; Jiang, S.-Y. Highly Fractionated S-Type Granites from the Giant Dahutang Tungsten Deposit in Jiangnan Orogen, Southeast China: Geochronology, Petrogenesis and Their Relationship with W-Mineralization. Lithos 2014, 202–203, 207–226. [Google Scholar] [CrossRef]
  36. Mao, J.; Zhang, J.; Pirajno, F.; Ishiyama, D.; Su, H.; Guo, C.; Chen, Y. Porphyry Cu–Au–Mo–Epithermal Ag–Pb–Zn–Distal Hydrothermal Au Deposits in the Dexing Area, Jiangxi Province, East China—A Linked Ore System. Ore Geol. Rev. 2011, 43, 203–216. [Google Scholar] [CrossRef]
  37. Liang, J.; Zhou, Y.Z.; Li, H.Z.; Ying, Z.Z.; Zhou, L.Y.; Zeng, C.Y.; Yu, P.P. Geological Characteristics and Genesis of Porphyry Copper Deposits in Qinzhou-Hangzhou Suture Zone, South China. Acta Petrol. Sin. 2012, 28, 3361–3372. [Google Scholar]
  38. Jiang, S.-H.; Liang, Q.-L.; Bagas, L.; Wang, S.-H.; Nie, F.-J.; Liu, Y.-F. Geodynamic Setting of the Zijinshan Porphyry–Epithermal Cu–Au–Mo–Ag Ore System, SW Fujian Province, China: Constrains from the Geochronology and Geochemistry of the Igneous Rocks. Ore Geol. Rev. 2013, 53, 287–305. [Google Scholar] [CrossRef]
  39. Štemprok, M. Solubility of Tin, Tungsten and Molybdenum Oxides in Felsic Magmas. Miner. Depos. 1990, 25, 205–212. [Google Scholar] [CrossRef]
  40. Chen, J.; Lu, J.-J.; Chen, W.-F.; Wang, R.-C.; Ma, D.-S.; Zhu, J.; Zhang, W.-I.; Ji, J.-F. W-Sn-Nb-Ta-Bearing Granites in the Nanling Range and Their Relationship to Metallogengesis. Geol. J. China Univ. 2008, 14, 459. [Google Scholar]
  41. Che, X.D.; Linnen, R.L.; Wang, R.C.; Aseri, A.; Thibault, Y. Tungsten Solubility in Evolved Granitic Melts: An Evaluation of Magmatic Wolframite. Geochim. Cosmochim. Acta 2013, 106, 84–98. [Google Scholar] [CrossRef]
  42. Chen, J.; Wang, R.; Zhu, J.; Lu, J.; Ma, D. Multiple-Aged Granitoids and Related Tungsten-Tin Mineralization in the Nanling Range, South China. Sci. China Earth Sci. 2013, 56, 2045–2055. [Google Scholar] [CrossRef]
  43. McDonough, W.F.; Sun, S.-S. The Composition of the Earth. Chem. Geol. 1995, 120, 223–253. [Google Scholar] [CrossRef]
  44. Emsley, J.T. Nature’s Building Blocks: An A–Z Guide to the Elements; Oxford University Press: Oxford, UK, 2001; pp. 445–450. [Google Scholar]
  45. Rudnick, R.L.; Gao, S. 3.01—Composition of the Continental Crust. In Treatise on Geochemistry; Holland, H.D., Turekian, K.K., Eds.; Pergamon: Oxford, UK, 2003; Volume 3: The Crust, pp. 1–64. [Google Scholar]
  46. Rieth, M.; Dudarev, S.L.; Gonzalez de Vicente, S.M.; Aktaa, J.; Ahlgren, T.; Antusch, S.; Armstrong, D.E.J.; Balden, M.; Baluc, N.; Barthe, M.-F.; et al. Recent Progress in Research on Tungsten Materials for Nuclear Fusion Applications in Europe. J. Nucl. Mater. 2013, 432, 482–500. [Google Scholar] [CrossRef]
  47. Wu, C.-M.; Naseem, S.; Chou, M.-H.; Wang, J.-H.; Jian, Y.-Q. Recent Advances in Tungsten-Oxide-Based Materials and Their Applications. Front. Mater. 2019, 6, 49. [Google Scholar] [CrossRef]
  48. Sun, S.-S. Chemical Composition and Origin of the Earth’s Primitive Mantle. Geochim. Cosmochim. Acta 1982, 46, 179–192. [Google Scholar] [CrossRef]
  49. Arevalo, R.; McDonough, W.F. Tungsten Geochemistry and Implications for Understanding the Earth’s Interior. Earth Planet. Sci. Lett. 2008, 272, 656–665. [Google Scholar] [CrossRef]
  50. Spielman, S.J.; Moore, E.K. Dragon: A New Tool for Exploring Redox Evolution Preserved in the Mineral Record. Front. Earth Sci. 2020, 8, 585087. [Google Scholar] [CrossRef]
  51. Golden, J.J. Mineral Evolution Database: Data Model for Mineral Age Associations. Master’s Thesis, Department of Geosciences, University of Arizona, Tucson, AZ, USA, 2019. [Google Scholar]
  52. Blondel, V.D.; Guillaume, J.-L.; Lambiotte, R.; Lefebvre, E. Fast Unfolding of Communities in Large Networks. J. Stat. Mech. 2008, 2008, P10008. [Google Scholar] [CrossRef]
  53. Moore, E.K.; Golden, J.J.; Morrison, S.M.; Hao, J.; Spielman, S.J. The Expanding Network of Mineral Chemistry throughout Earth History Reveals Global Shifts in Crustal Chemistry during the Proterozoic. Sci. Rep. 2022, 12, 4956. [Google Scholar] [CrossRef]
  54. Pauling, L. The Nature of the Chemical Bond. IV. The Energy of Single Bonds and the Relative Electronegativity of Atoms. J. Am. Chem. Soc. 1932, 54, 3570–3582. [Google Scholar] [CrossRef]
  55. Rapp, R.P.; Watson, E.B. Dehydration Melting of Metabasalt at 8–32 Kbar: Implications for Continental Growth and Crust-Mantle Recycling. J. Petrol. 1995, 36, 891–931. [Google Scholar] [CrossRef]
  56. Taylor, S.R.; McLennan, S.M. The Geochemical Evolution of the Continental Crust. Rev. Geophys. 1995, 33, 241–265. [Google Scholar] [CrossRef]
  57. Xu, T.; Pruess, K. On Fluid Flow and Mineral Alteration in Fractured Caprock of Magmatic Hydrothermal Systems. J. Geophys. Res. Solid Earth 2001, 106, 2121–2138. [Google Scholar] [CrossRef]
  58. Morrison, S.M.; Buongiorno, J.; Downs, R.T.; Eleish, A.; Fox, P.; Giovannelli, D.; Golden, J.J.; Hummer, D.R.; Hystad, G.; Kellogg, L.H.; et al. Exploring Carbon Mineral Systems: Recent Advances in C Mineral Evolution, Mineral Ecology, and Network Analysis. Front. Earth Sci. 2020, 8, 208. [Google Scholar] [CrossRef]
  59. Moore, E.K.; Hao, J.; Prabhu, A.; Zhong, H.; Jelen, B.I.; Meyer, M.; Hazen, R.M.; Falkowski, P.G. Geological and Chemical Factors That Impacted the Biological Utilization of Cobalt in the Archean Eon. J. Geophys. Res. Biogeosciences 2018, 123, 743–759. [Google Scholar] [CrossRef]
  60. Moore, E.K.; Hao, J.; Spielman, S.J.; Yee, N. The Evolving Redox Chemistry and Bioavailability of Vanadium in Deep Time. Geobiology 2020, 18, 127–138. [Google Scholar] [CrossRef]
  61. Srivastava, N.; Spielman, S.J.; Morrison, S.M.; Moore, E.K. Geological Factors Impacted Cadmium Availability and Use as an Alternative Cofactor for Zinc in the Carbon Fixation Pathways of Marine Diatoms. J. Geophys. Res. Biogeosciences 2021, 126, e2020JG005966. [Google Scholar] [CrossRef]
  62. Moore, E.K.; Martinez, D.L.; Srivastava, N.; Morrison, S.M.; Spielman, S.J. Mineral Element Insiders and Outliers Play Crucial Roles in Biological Evolution. Life 2022, 12, 951. [Google Scholar] [CrossRef] [PubMed]
  63. Moore, E.K.; Li, J.; Zhang, A.; Hao, J.; Morrison, S.M.; Hummer, D.R.; Yee, N. Uranium Redox and Deposition Transitions Embedded in Deep-Time Geochemical Models and Mineral Chemistry Networks. Geochem. Geophys. Geosystems 2024, 25, e2023GC011267. [Google Scholar] [CrossRef]
  64. Moore, E.K.; Diedolf, J.E.; Morrison, S.M.; Hummer, D.R. Characterizing Sulfur Redox State and Geochemical Implications in Deep-Time Using Mineral Chemistry Network Analysis. Geochim. Cosmochim. Acta 2024, 376, 25–36. [Google Scholar] [CrossRef]
  65. Morrison, S.M.; Liu, C.; Eleish, A.; Prabhu, A.; Li, C.; Ralph, J.; Downs, R.T.; Golden, J.J.; Fox, P.; Hummer, D.R.; et al. Network Analysis of Mineralogical Systems. Am. Mineral. 2017, 102, 1588–1596. [Google Scholar] [CrossRef]
  66. Liu, C.; Eleish, A.; Hystad, G.; Golden, J.J.; Downs, R.T.; Morrison, S.M.; Hummer, D.R.; Ralph, J.P.; Fox, P.; Hazen, R.M. Analysis and Visualization of Vanadium Mineral Diversity and Distribution. Am. Mineral. 2018, 103, 1080–1086. [Google Scholar] [CrossRef]
  67. Lee, C.T.A.; Leeman, W.P.; Canil, D.; Li, Z.X.A. Similar V/Sc Systematics in MORB and Arc Basalts: Implications for the Oxygen Fugacities of Their Mantle Source Regions. J. Petrol. 2005, 46, 2313–2336. [Google Scholar] [CrossRef]
  68. Qiu, J.-T.; Yu, X.-Q.; Santosh, M.; Zhang, D.-H.; Chen, S.-Q.; Li, P.-J. Geochronology and Magmatic Oxygen Fugacity of the Tongcun Molybdenum Deposit, Northwest Zhejiang, SE China. Miner. Depos. 2013, 48, 545–556. [Google Scholar] [CrossRef]
  69. Zhang, H.; Ling, M.-X.; Liu, Y.-L.; Tu, X.-L.; Wang, F.-Y.; Li, C.-Y.; Liang, H.-Y.; Yang, X.-Y.; Arndt, N.T.; Sun, W.-D. High Oxygen Fugacity and Slab Melting Linked to Cu Mineralization: Evidence from Dexing Porphyry Copper Deposits, Southeastern China. J. Geol. 2013, 121, 289–305. [Google Scholar] [CrossRef]
  70. Brounce, M.; Kelley, K.A.; Cottrell, E.; Reagan, M.K. Temporal Evolution of Mantle Wedge Oxygen Fugacity during Subduction Initiation. Geology 2015, 43, 775–778. [Google Scholar] [CrossRef]
  71. Coughlin, J.P. Contributions to the Data on Theoretical Metallurgy. XII. Heats and Free Energies of Formation of Inorganic Oxides. U.S. Bur. Mines Bull. 1954, 542, 1–84. [Google Scholar]
  72. Kozuka, Z.; Siahaan, O.P.; Moriyama, J. Thermodynamic Studies of Fused SnO-SnO2 System. Nippon. Kinzoku Gakkaishi 1967, 31, 1272–1278. [Google Scholar]
  73. Ryabchikov, I.D. Termodinamika Flyuidnoy Fazy Granitoidykh Magm (Thermodynamics of the Fluid Phase in Granitoid Magmas); Nauka Press: Moscow, Russia, 1975. [Google Scholar]
  74. Mengason, M.J.; Candela, P.A.; Piccoli, P.M. Molybdenum, Tungsten and Manganese Partitioning in the System Pyrrhotite–Fe–S–O Melt–Rhyolite Melt: Impact of Sulfide Segregation on Arc Magma Evolution. Geochim. Cosmochim. Acta 2011, 75, 7018–7030. [Google Scholar] [CrossRef]
  75. Li, P.; Yu, X.; Li, H.; Qiu, J.; Zhou, X. Jurassic–Cretaceous Tectonic Evolution of Southeast China: Geochronological and Geochemical Constraints of Yanshanian Granitoids. Int. Geol. Rev. 2013, 55, 1202–1219. [Google Scholar] [CrossRef]
  76. Li, X.; Chi, G.; Zhou, Y.; Deng, T.; Zhang, J. Oxygen Fugacity of Yanshanian Granites in South China and Implications for Metallogeny. Ore Geol. Rev. 2017, 88, 690–701. [Google Scholar] [CrossRef]
  77. Lehmann, B. Metallogeny of Tin; Magmatic Differentiation versus Geochemical Heritage. Econ. Geol. 1982, 77, 50–59. [Google Scholar] [CrossRef]
  78. Taylor, J.R.; Wall, V.J. The Behavior of Tin in Granitoid Magmas. Econ. Geol. 1992, 87, 403–420. [Google Scholar] [CrossRef]
  79. Sui, Q.L.; Zhu, H.L.; Sun, S.J.; Chen, D.H.; Zhao, X.J.; Wang, Z.F. The geochemical behavior of tin and Late Cretaceous tin mineralization in South China. Acta Petrol. Sin. 2020, 36, 23–34. [Google Scholar] [CrossRef]
  80. Hazen, R.; Liu, X.-M.; Downs, R.; Golden, J.; Pires, A.; Grew, E.; Hystad, G.; Estrada, C.; Sverjensky, D. Mineral Evolution: Episodic Metallogenesis, the Supercontinent Cycle, and the Coevolving Geosphere and Biosphere. In Building Exploration Capability for the 21st Century; Society of Economic Geologists: Littleton, CO, USA, 2014. [Google Scholar]
  81. Cao, J.; Yang, X.; Du, J.; Wu, Q.; Kong, H.; Li, H.; Wan, Q.; Xi, X.; Gong, Y.; Zhao, H. Formation and Geodynamic Implication of the Early Yanshanian Granites Associated with W–Sn Mineralization in the Nanling Range, South China: An Overview. Int. Geol. Rev. 2018, 60, 1744–1771. [Google Scholar] [CrossRef]
  82. Wang, R.; Zhu, J.; Zhang, W.; Xie, L.; Yu, A.; Che, X. Ore-Forming Mineralogy of W-Sn Granites in the Nanling Range: Concept and Case Study. Geol. J. China Univ. 2008, 14, 485. [Google Scholar]
  83. Farges, F.; Linnen, R.L.; Brown, G.E., Jr. Redox and Speciation of Tin in Hydrous Silicate Glasses: A Comparison with Nb, Ta, Mo and W. Can. Mineral. 2006, 44, 795–810. [Google Scholar] [CrossRef]
  84. Wang, D.; Mathur, R.; Powell, W.; Godfrey, L.; Zheng, Y. Experimental Evidence for Fractionation of Tin Chlorides by Redox and Vapor Mechanisms. Geochim. Cosmochim. Acta 2019, 250, 209–218. [Google Scholar] [CrossRef]
  85. Liu, C.; Runyon, S.E.; Knoll, A.H.; Hazen, R.M. The Same and Not the Same: Ore Geology, Mineralogy and Geochemistry of Rodinia Assembly versus Other Supercontinents. Earth-Sci. Rev. 2019, 196, 102860. [Google Scholar] [CrossRef]
  86. Hummer, D.R.; Golden, J.J.; Hystad, G.; Downs, R.T.; Eleish, A.; Liu, C.; Ralph, J.; Morrison, S.M.; Meyer, M.B.; Hazen, R.M. Evidence for the Oxidation of Earth’s Crust from the Evolution of Manganese Minerals. Nat. Commun. 2022, 13, 960. [Google Scholar] [CrossRef]
  87. Romer, R.L.; Kroner, U. Phanerozoic tin and tungsten mineralization—Tectonic controls on the distribution of enriched protoliths and heat sources for crustal melting. Gondwana Res. 2016, 31, 60–95. [Google Scholar] [CrossRef]
  88. Wu, S.; Sun, W.; Wang, X. A new model for porphyry W mineralization in a world-class tungsten metallogenic belt. Ore Geol. Rev. 2019, 107, 501–512. [Google Scholar] [CrossRef]
  89. Zhang, Y.; Gao, J.F.; Ma, D.; Pan, J. The role of hydrothermal alteration in tungsten mineralization at the Dahutang tungsten deposit, South China. Ore Geol. Rev. 2018, 95, 1008–1027. [Google Scholar] [CrossRef]
  90. Huang, W.Q.; Pan, J.Y.; Ni, P.; Zhou, J.G.; Shui, T.; Chen, H.; Fan, M.S.; Cui, J.M. Recognition of Neogene tin mineralization in the Southeast Asian tin belt. GSA Bull. 2024, 136, 11–12. [Google Scholar] [CrossRef]
  91. Sun, X.; Zheng, M.; Pei, T.; Hollings, P.; Si, X.; Zheng, R.; Deng, J. Reassessing the spatial and temporal evolution of the Southeast Asian Tin Belt: Insights into recurrent tin mineralization. Earth-Sci. Rev. 2025, 270, 105233. [Google Scholar] [CrossRef]
  92. Feng, Z.; Wang, C.; Zhang, M.; Liang, J. Unusually Dumbbell-Shaped Guposhan–Huashan Twin Granite Plutons in Nanling Range of South China: Discussion on Their Incremental Emplacement and Growth Mechanism. J. Asian Earth Sci. 2012, 48, 9–23. [Google Scholar] [CrossRef]
Figure 1. Bipartite mineral chemistry network of (a) all Sn-containing minerals, and (b) all W-containing minerals. Each network contains element and mineral nodes. Element nodes are represented by green to blue to lavender scale-colored circles with chemical element symbols, and mineral nodes are represented by smaller unlabeled brown scale-colored circles. Each mineral node has a network connection (network connections are referred to as “edges”) with each constituent element in the mineral (ex: the cassiterite, SnO2, mineral node has edge connections to the Sn and O element nodes). Element nodes are colored by element density and mineral nodes are colored by the maximum known age of each mineral (i.e., the oldest locality where each mineral has been identified). The mineral nodes are sized by the number of known localities in the Mineral Evolution Database (MED). Key: Ga = Billions of years ago.
Geosciences 16 00158 g001
Figure 2. Bipartite mineral chemistry network of (a) all Sn-containing minerals, and (b) all W-containing minerals. Each network contains element nodes (labeled with chemical element symbols) and mineral nodes (unlabeled). Element nodes are colored according to Pauling scale electronegativity [54], and the mineral nodes are colored by weighted Mineral Element Electronegativity Coefficient of Variation (wMEECV). The mineral nodes are sized by the number of known localities in the Mineral Evolution Database (MED).
Geosciences 16 00158 g002
Figure 3. (a) Combined bipartite mineral chemistry network of all Sn-containing minerals and all W-containing minerals. Each network contains element nodes (labeled with chemical element symbols) and mineral nodes (unlabeled). Element and mineral nodes are colored according to Louvain network community as shown in the legend, which groups network nodes into communities based on shared network connections [51]. The mineral nodes are sized by the number of known localities in the Mineral Evolution Database (MED). (b) Plot of weighted Mineral Element Electronegativity Coefficient of Variation (wMEECV), separated by Louvain network community.
Geosciences 16 00158 g003
Figure 4. (a) Weighted Mineral Element Electronegativity Coefficient of Variation (wMEECV) values of all known Sn minerals plotted by maximum known age in billions of years (Ga) of all known Sn mineral localities in the Mineral Evolution Database (MED). Black square symbols represent Sn mineral localities in China, and blue “X” symbols represent Sn mineral localities outside of China. (b) Same plot as Figure 4a from 0.5 to 0 Ga. Shaded areas represent the Mesozoic Era.
Geosciences 16 00158 g004
Figure 5. (a) Weighted Mineral Element Electronegativity Coefficient of Variation (wMEECV) values of all known W minerals plotted by maximum known age in billions of years (Ga) of all known W mineral localities in the Mineral Evolution Database (MED). Black square symbols represent W mineral localities in China, and blue “X” symbols represent W mineral localities outside of China. (b) Same plot as Figure 5a from 0.5 to 0 Ga. Highlighted areas represent the Mesozoic Era.
Geosciences 16 00158 g005
Figure 6. Total number of localities where Sn minerals and W minerals co-occur through geologic time by age of locality in billions of years (Ga). Black square symbols represent co-located Sn mineral and W mineral localities in China, and blue “X” symbols represent co-located Sn mineral and W mineral localities outside of China.
Geosciences 16 00158 g006
Disclaimer/Publisher’s Note: The statements, opinions and data contained in all publications are solely those of the individual author(s) and contributor(s) and not of MDPI and/or the editor(s). MDPI and/or the editor(s) disclaim responsibility for any injury to people or property resulting from any ideas, methods, instructions or products referred to in the content.