Article

Ongoing Deformation at the Southern Apennine Front: Insights from the Gulf of Taranto (Italy)

Dipartimento di Scienze e Tecnologie, Università degli Studi del Sannio, 82100 Benevento, Italy
*
Author to whom correspondence should be addressed.
Geosciences 2026, 16(4), 141; https://doi.org/10.3390/geosciences16040141
Submission received: 28 January 2026 / Revised: 23 February 2026 / Accepted: 27 March 2026 / Published: 30 March 2026

Abstract

The Gulf of Taranto (Ionian Sea) is a key transitional sector between the Southern Apennines collisional belt and the Calabrian Arc system, where the expression of Pleistocene–Holocene deformation in the shallow stratigraphic record remains debated. This study focuses on the Taranto Canyon area, the main morphologic feature of the northeastern Gulf of Taranto slope. We integrate high-resolution multibeam bathymetry (10 m grid) with Sparker seismic profiles to (i) define the shallow seismo-stratigraphic framework and (ii) document spatial relationships between shallow discontinuities, morphostructural lineaments, and submarine channel network organization. A simplified tie to the Livia 001 well constrains the subdivision of the shallow succession into four seismic units: the late Pleistocene–Holocene unit (PtH), the Santerno Formation (SNT), the Calcarenite di Gravina (GRA), and the Cupello Limestones (CPL). The PtH interval shows the strongest lateral variability and includes widespread acoustically disturbed bodies and recurrent sub-vertical fluid escape acoustic anomalies. Steep discontinuities producing reflector terminations, minor vertical separation, and localized bending affect PtH and, locally, SNT, with normal fault geometries prevailing where resolvable. Bathymetric mapping reveals multiple lineament families and preferred channel orientations that persist across higher Strahler orders, supporting a structurally conditioned template that guides seafloor morphology, sediment routing, and canyon–slope evolution in the northeastern Gulf of Taranto.

1. Introduction

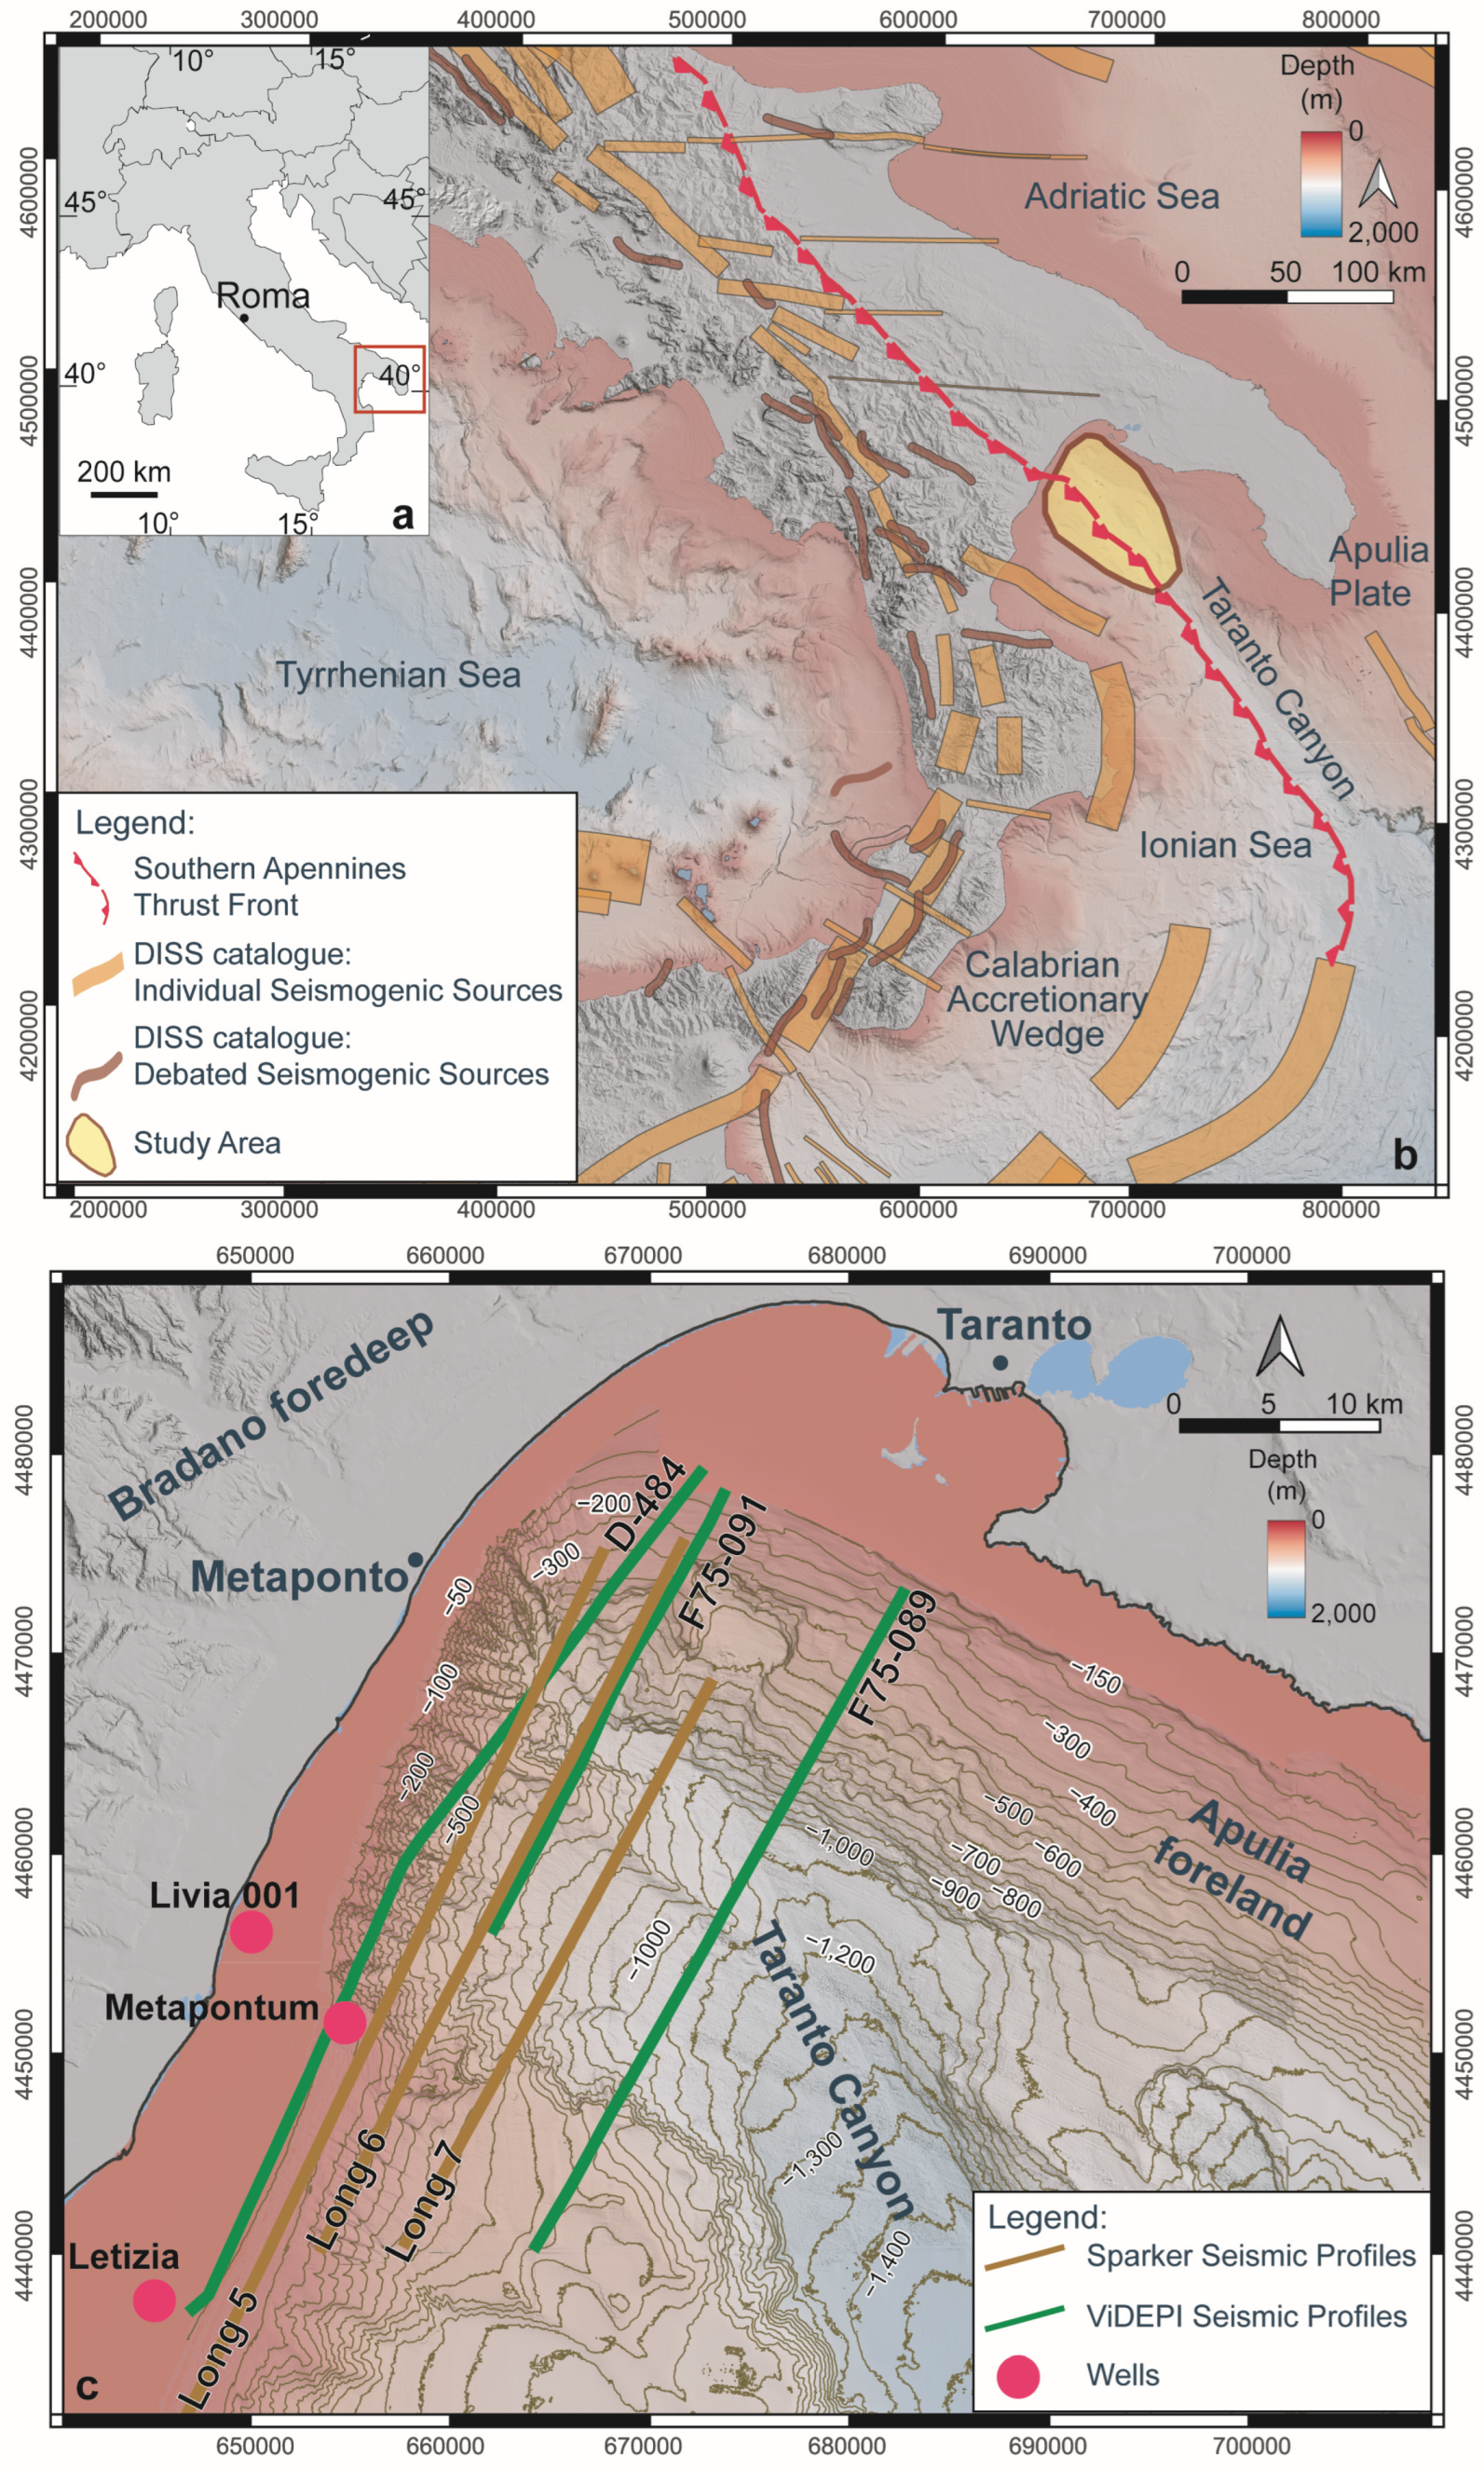
The Gulf of Taranto (GoT) occupies the northernmost sector of the Ionian Sea and is bounded by Calabria, Basilicata, and Apulia regions within the broader Nubia–Eurasia convergence zone [1,2] (Figure 1a,b). Since the Neogene, the GoT has acted as a transitional region between the Apulian foreland and the Southern Apennine fold-and-thrust belt [3,4,5,6,7,8,9]. It corresponds to the northwestern termination of a foredeep basin in an advanced evolutionary stage, where the frontal thrusts of the Apennine accretionary wedge approach the Apulian Platform [10]. Despite regional tectono-stratigraphic reconstructions [11], it remains debated whether and how Pleistocene–Holocene deformation is recorded in the shallow stratigraphic succession and in the present-day seafloor morphology within this transition zone [5,12,13].
Along continental margins, submarine canyons, slope failures, and mass-transport deposits (MTDs) are widespread and commonly reflect the interplay between tectonic activity, gravitational instability, and sea-level-driven changes in sediment supply [14,15,16,17,18,19]. In the northeastern GoT, the Taranto Canyon represents the dominant slope incision and a major sediment-routing element. Its geomorphic configuration provides a suitable target for investigating the interaction between structural inheritance, seafloor deformation, sediment dispersal, and slope processes [20,21].
Within this framework, this study investigates the offshore northeastern GoT between the Sinni River mouth (Basilicata) and Taranto City (Apulia), focusing on the Taranto Canyon sector. We integrate high-resolution multibeam bathymetry (10 m gridded) with Sparker seismic profiles to link seafloor morphology with the late Pleistocene–Holocene stratigraphic architecture and shallow deformation patterns. Specifically, the objectives are to (1) reconstruct and calibrate the shallow seismo-stratigraphic framework of the outer shelf–upper slope domain using well constraints (Livia 001; Figure 1c and Figure 2); (2) identify and map deformation features affecting late Pleistocene–Holocene deposits and evaluate their spatial relationship with morphostructural lineaments and submarine channel network organization; and (3) document the distribution of subsurface slope instability bodies together with fluid escape-related acoustic anomalies imaged in the high-resolution profiles.
By providing new constraints on the coupling between shallow sedimentary unit deformation, stratigraphy, and canyon-related slope processes in a key Central Mediterranean transition zone, this study refines the shallow structural expression of regional tectono-stratigraphic models and establishes a robust framework to discuss structural controls on margin instability in the northeastern GoT.
Figure 1. Location and regional setting of the study area (Gulf of Taranto, Ionian Sea) and dataset overview. (a) Geographic framework of southern Italy with the study sector highlighted (red box). (b) Regional physiographic and tectonic framework of the Ionian domain showing the Southern Apennines thrust front and the distribution of the seismogenic sources from the DISS catalogue (individual and debated sources) [22]. (c) Detailed map of the northeastern Gulf of Taranto showing the high-resolution bathymetry and geophysical dataset used in this work. Sparker seismic profiles (brown), ViDEPI seismic profiles (green), and exploration/stratigraphic wells (pink) [23]. Bathymetric contours are shown at 50 m intervals.
Geosciences 16 00141 g001
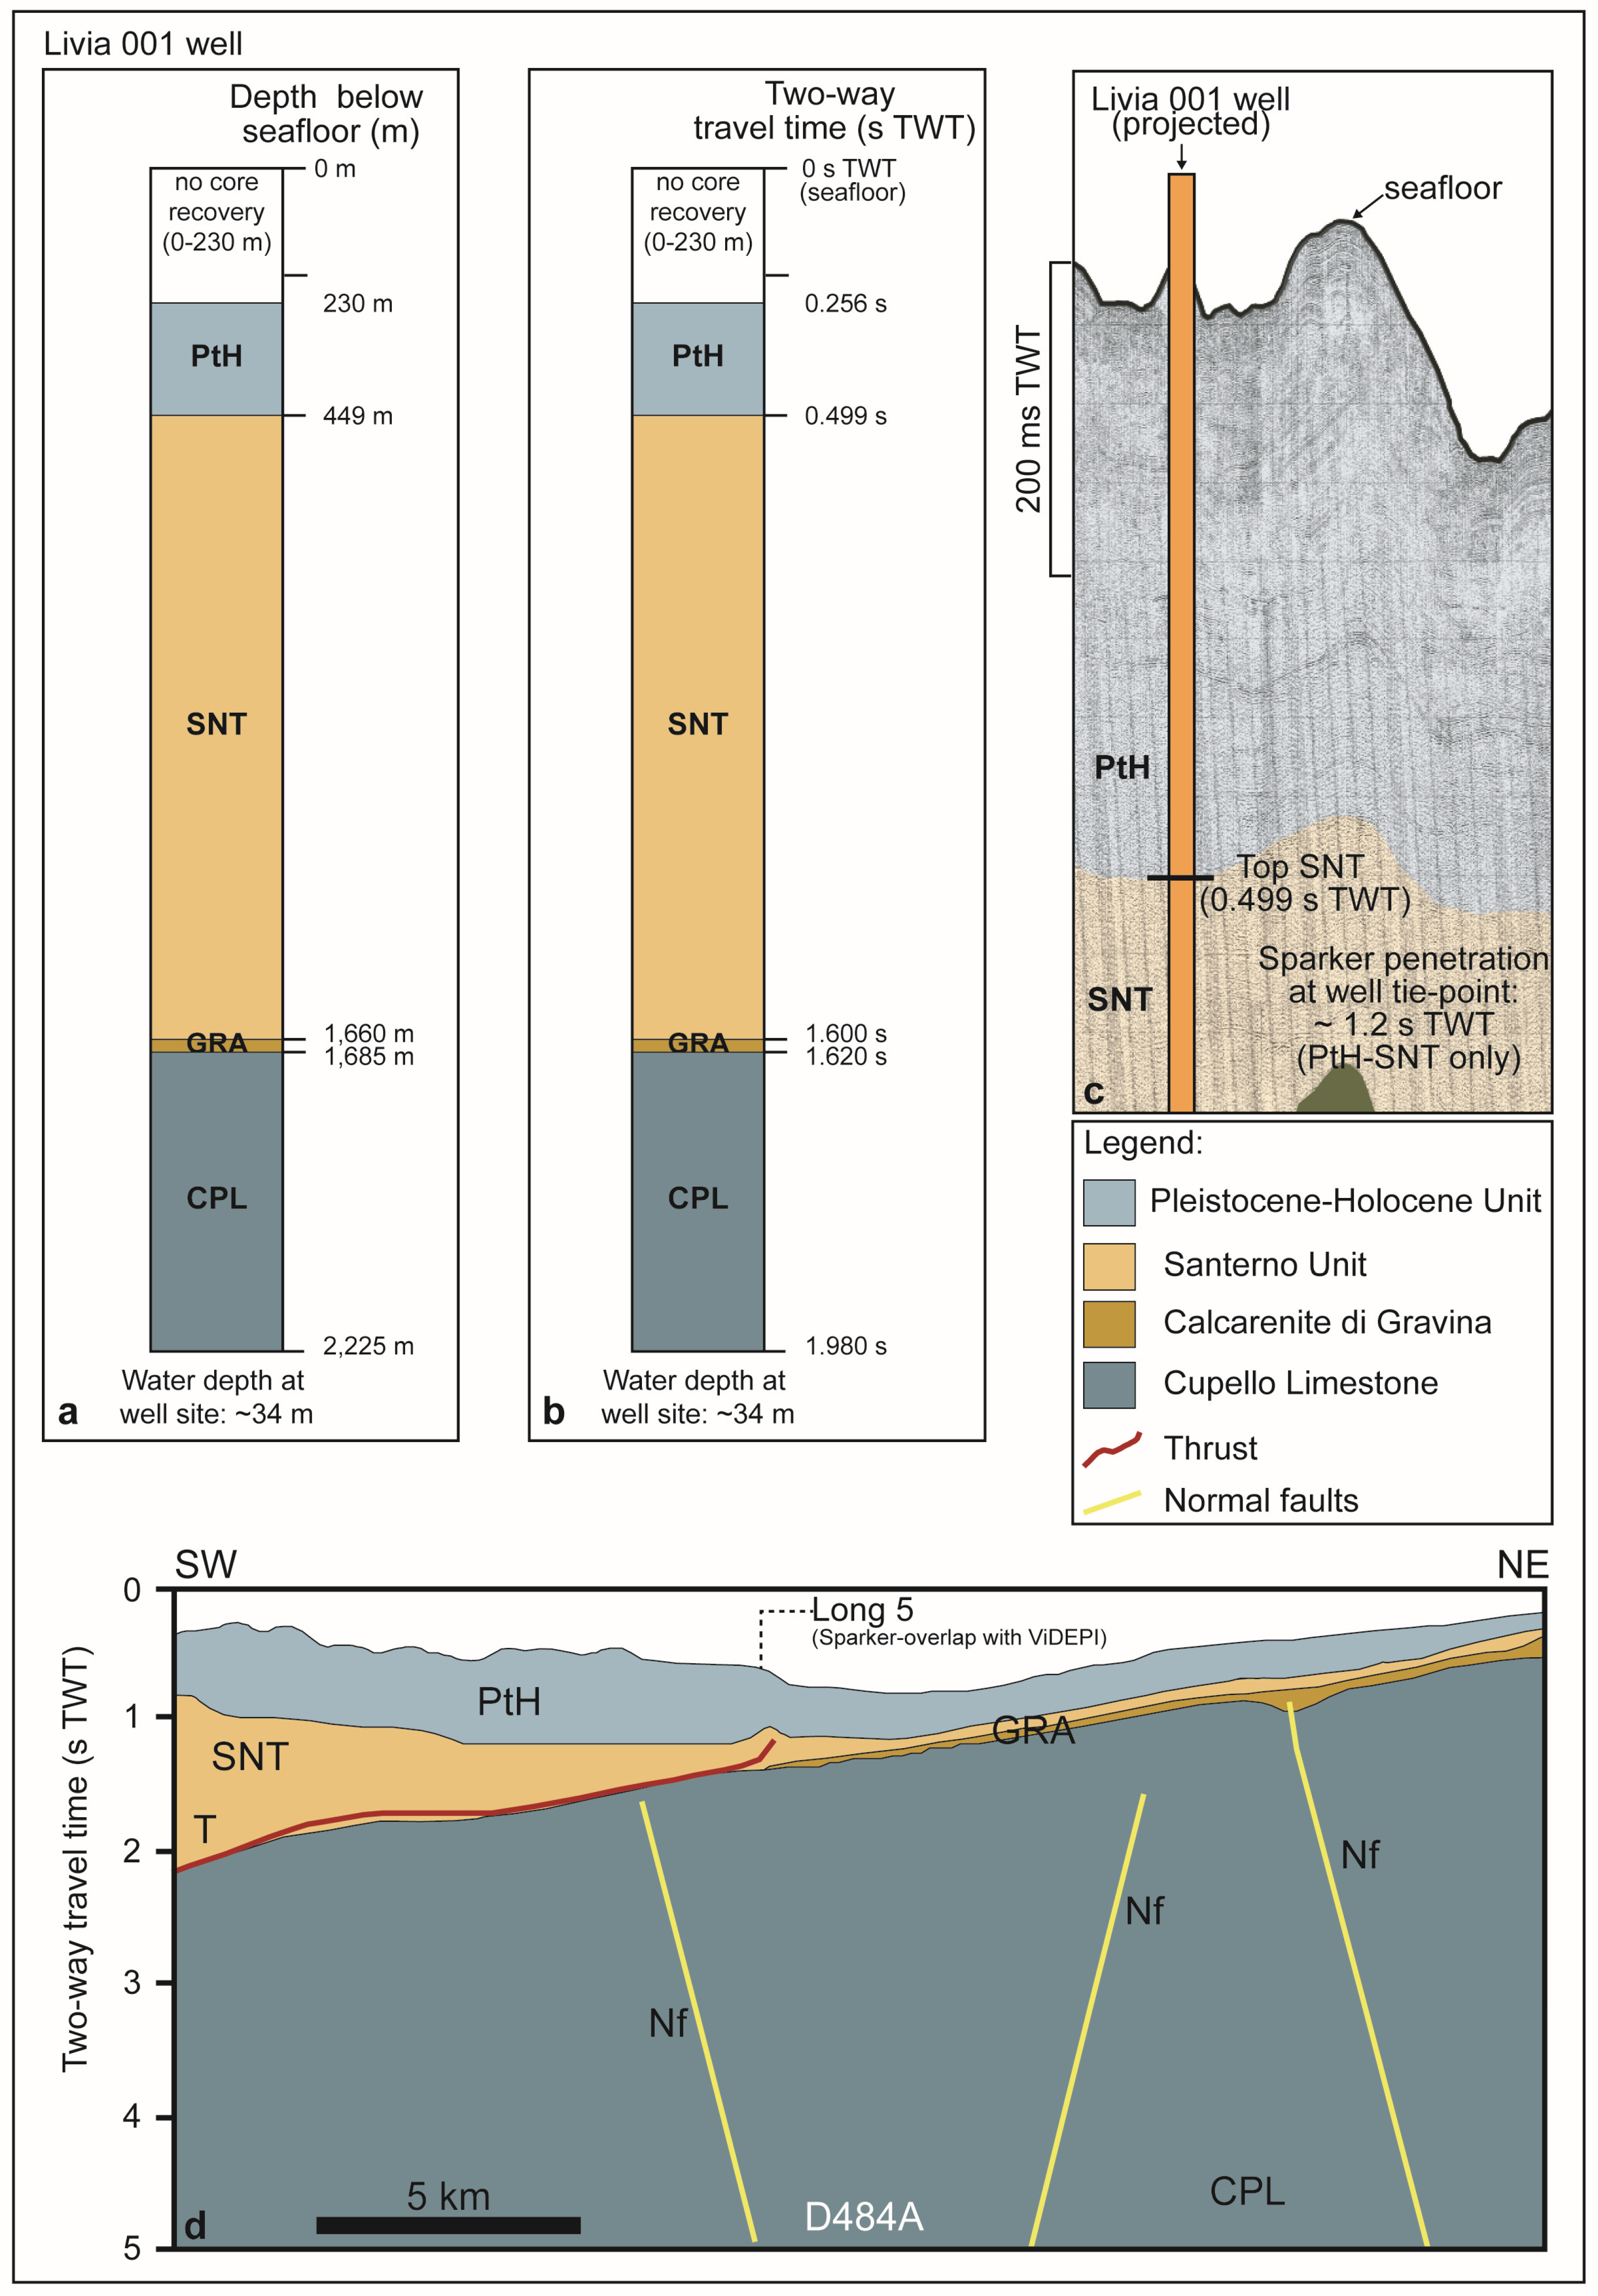
Figure 2. Schematic calibration of the main seismo-stratigraphic units used in this study against the Livia 001 well. (a) Stratigraphic column expressed as depth below the seafloor (m), including the upper interval with no core recovery (0–230 m below the seafloor) and the calibrated tops used for seismic correlation. (b) Equivalent column expressed as two-way travel time (s TWT), obtained by tying the well markers to the nearest Sparker reflector package (Long 5 tie-point). (c) Local well projection onto the closest Sparker profile segment, illustrating the depth of investigation at the tie-point and the penetration limit of the Sparker dataset (PtH–SNT interval). (d) Reference interpreted deep-penetration seismic profile (ViDEPI D484A; mod, after [11]) showing the regional structural–stratigraphic framework (CPL, GRA, SNT, PtH) and the position of the Sparker–ViDEPI overlap along Long 5.
Geosciences 16 00141 g002

2. Geological and Structural Setting

Rheological contrasts and variations in deformation style exert a strong control on the geodynamics of the Ionian region. Recent geophysical investigations [24,25] have highlighted crustal heterogeneities and the lateral transition between two distinct geodynamic domains, the Southern Apennines fold-and-thrust system and the Calabrian subduction prism, occurring beneath the GoT; however, no clear tectonic evidence has been identified to mark a sharp boundary between these regimes [26,27,28]. Furthermore, it remains unresolved whether this collision–subduction boundary has remained spatially fixed throughout the Quaternary or has migrated laterally through time [5,12,13]. This uncertainty is consistent with the diachronous along-strike evolution of deformation from the northern Bradano foredeep, where contraction has waned and transcurrent regimes dominate, to the still-active Calabrian Arc subduction front [29,30,31,32].
The long-term structural model of the central Mediterranean includes a Mesozoic phase dominated by widespread extension, responsible for the development of neritic carbonate platforms and intervening deep basins [33,34,35,36,37,38]. Since the Early Miocene, a progressive northeastward migration of the southern Apennines accretionary prism occurred, driven by the rollback of the subducting Ionian–Apulian slab and flexural retreat of the foreland basin [39,40,41,42,43,44]. This process produced a foredeep system with eastward-young depocenters, growth strata, and piggyback basins [8,45].
A key contribution to understanding the offshore setting and the evolution of this area was provided by [11], who integrated ~1100 km of seismic lines and 17 exploration wells to build a 3D tectono-stratigraphic model of the Apennine accretionary wedge. This model described an NE-verging imbricate thrust system shaped by alternating episodes of frontal propagation and tectonic strain accumulation, with syn-tectonic sedimentation, growth strata, and structural segmentation linked to the reactivation of inherited Mesozoic discontinuities. The internal structural style includes transpressional and transtensional structures (e.g., the Amendolara transpressional system), highlighting strain partitioning between thrust and strike-slip components [46,47].
In the broader Ionian setting, the Calabrian Arc prism continues offshore as a thick (>4000 m) wedge of deformed sediments [48], subdivided into NE and SW lobes separated by an NW–SE high-deformation crustal zone [49,50,51,52]. The Apennine accretionary prism is bounded laterally by the Malta Escarpment to the south and the Apulian Platform to the north and includes thrust, strike–slip, and dip–slip normal fault systems (e.g., Catanzaro, Spartivento, and Bovalino) [46]. Seismic and geodetic data across the GoT suggest active contraction, with slip rates along the basal detachment ranging from 4 to 7 mm/yr [53,54,55].
From a stratigraphic perspective, the Ionian basin hosts a thick Neogene to Quaternary succession, including Messinian evaporites (Gessoso-Solfifera Fm.), Pliocene marine clays (Santerno Fm.), and Holocene marine deposits (PtH unit), calibrated by boreholes such as Flora, Francesca, Letizia, and Metapontum 001 (Figure 1c) [11,23]. The Messinian evaporites act as a regional detachment level, facilitating gravitational spreading, mud volcanism, and fluid migration [49,56]. In the northeastern GoT, the Livia 001 well provides key stratigraphic constraints for the shallow units discussed in this study and is used to calibrate the high-resolution seismo-stratigraphic framework through a simplified well-to-seismic tie (Figure 2).

3. Materials and Methods

3.1. Geophysical Dataset and Seismic Stratigraphy

An integrated dataset of multibeam bathymetry and high-resolution seismic profiles was acquired across the outer continental shelf and slope in the northeastern sector of the GoT (Figure 1c). These data were used to reconstruct seafloor morphology and constrain the shallow subsurface stratigraphy of the study area.
Two multibeam surveys were conducted in the study area: (i) in 2005, within the Italian CARG Project [57,58], aboard the R/V Coopernaut Franca (University of Sannio and Sapienza University of Rome) and (ii) in 2010, during the oceanographic cruise “MAGIC Conisma11/2010” within the MaGIC Project (Marine Geohazards along the Italian Coasts) [59,60], aboard the R/V Minerva Uno. Overall, approximately 1600 km2 of bathymetric data were collected, and the final bathymetric surface was gridded at 10 × 10 m resolution and referenced to mean sea level (MSL).
Bathymetric data were collected using a RESON SeaBat 8160 MBES system (50 kHz), capable of acquiring 126 across-track beams over a 130° swath (with a maximum swath width of approximately 4× the water depth) with 1.2° beam spacing. The system is characterized by an across-track beam width of 1.5° at the nadir and selectable along-track beam widths (1.5–6.0°), with beam stabilization up to ±15° (pitch) and ±20° (roll). At the nadir, a 1.5° beam width corresponds to an approximate seafloor footprint of ~0.026× water depth (e.g., ~0.9 m at 34 m, ~13 m at 500 m, ~26 m at 1000 m), increasing toward the outer beams due to oblique incidence.
Data were processed using CARIS HIPS & SIPS (Teledyne CARIS), including sound–velocity correction, tide correction (with MSL referencing), beam refraction, and 3D visualization. The workflow included spike removal, surface cleaning, and generation of a digital terrain model (DTM) to ensure an accurate representation of the surveyed seabed. Post-processing and quality control were performed at the Department of Earth Sciences, Sapienza University of Rome, within the framework of the inter-institutional collaboration established for the CARG/MaGIC projects.
Seismic profiles were processed and interpreted in the IHS Kingdom® Suite (version 2018; IHS Markit, now S&P Global), following a seismic sequence-stratigraphic framework [61,62,63,64,65]. Reflector geometries, bounding discontinuities, and acoustic facies were used to define the main seismic units and key stratigraphic surfaces and support the correlation between profiles.
Positioning and navigation for both MBES and seismic acquisition were ensured by a Trimble GeoExplorer® GNSS (Westminster, CO, USA) receiver with real-time differential correction via the European Geostationary Navigation Overlay System [66]. Horizontal positioning accuracy was typically on the order of ~1–3 m in real-time mode. Navigation data were used to georeference bathymetric grids and seismic profiles.

3.2. Seismic Stratigraphy Well Tie (Livia 001)

To strengthen the chronostratigraphic and lithostratigraphic attribution of the interpreted seismic units, the seismic stratigraphy was cross-checked against available borehole information. In particular, the Livia 001 well was used as a reference for a simplified tie to the nearest Sparker profile (Long 5), where Sparker penetration allows imaging of the PtH–SNT interval. The well-based depth column, the corresponding two-way travel time (TWT) representation, and the schematic tie-point projection onto the seismic profile are summarized in Figure 2. This tie was used to ensure consistency between interpreted seismic horizons and well-derived stratigraphic tops within the limits imposed by Sparker bandwidth and penetration at the tie location.

3.3. Morphostructural Features

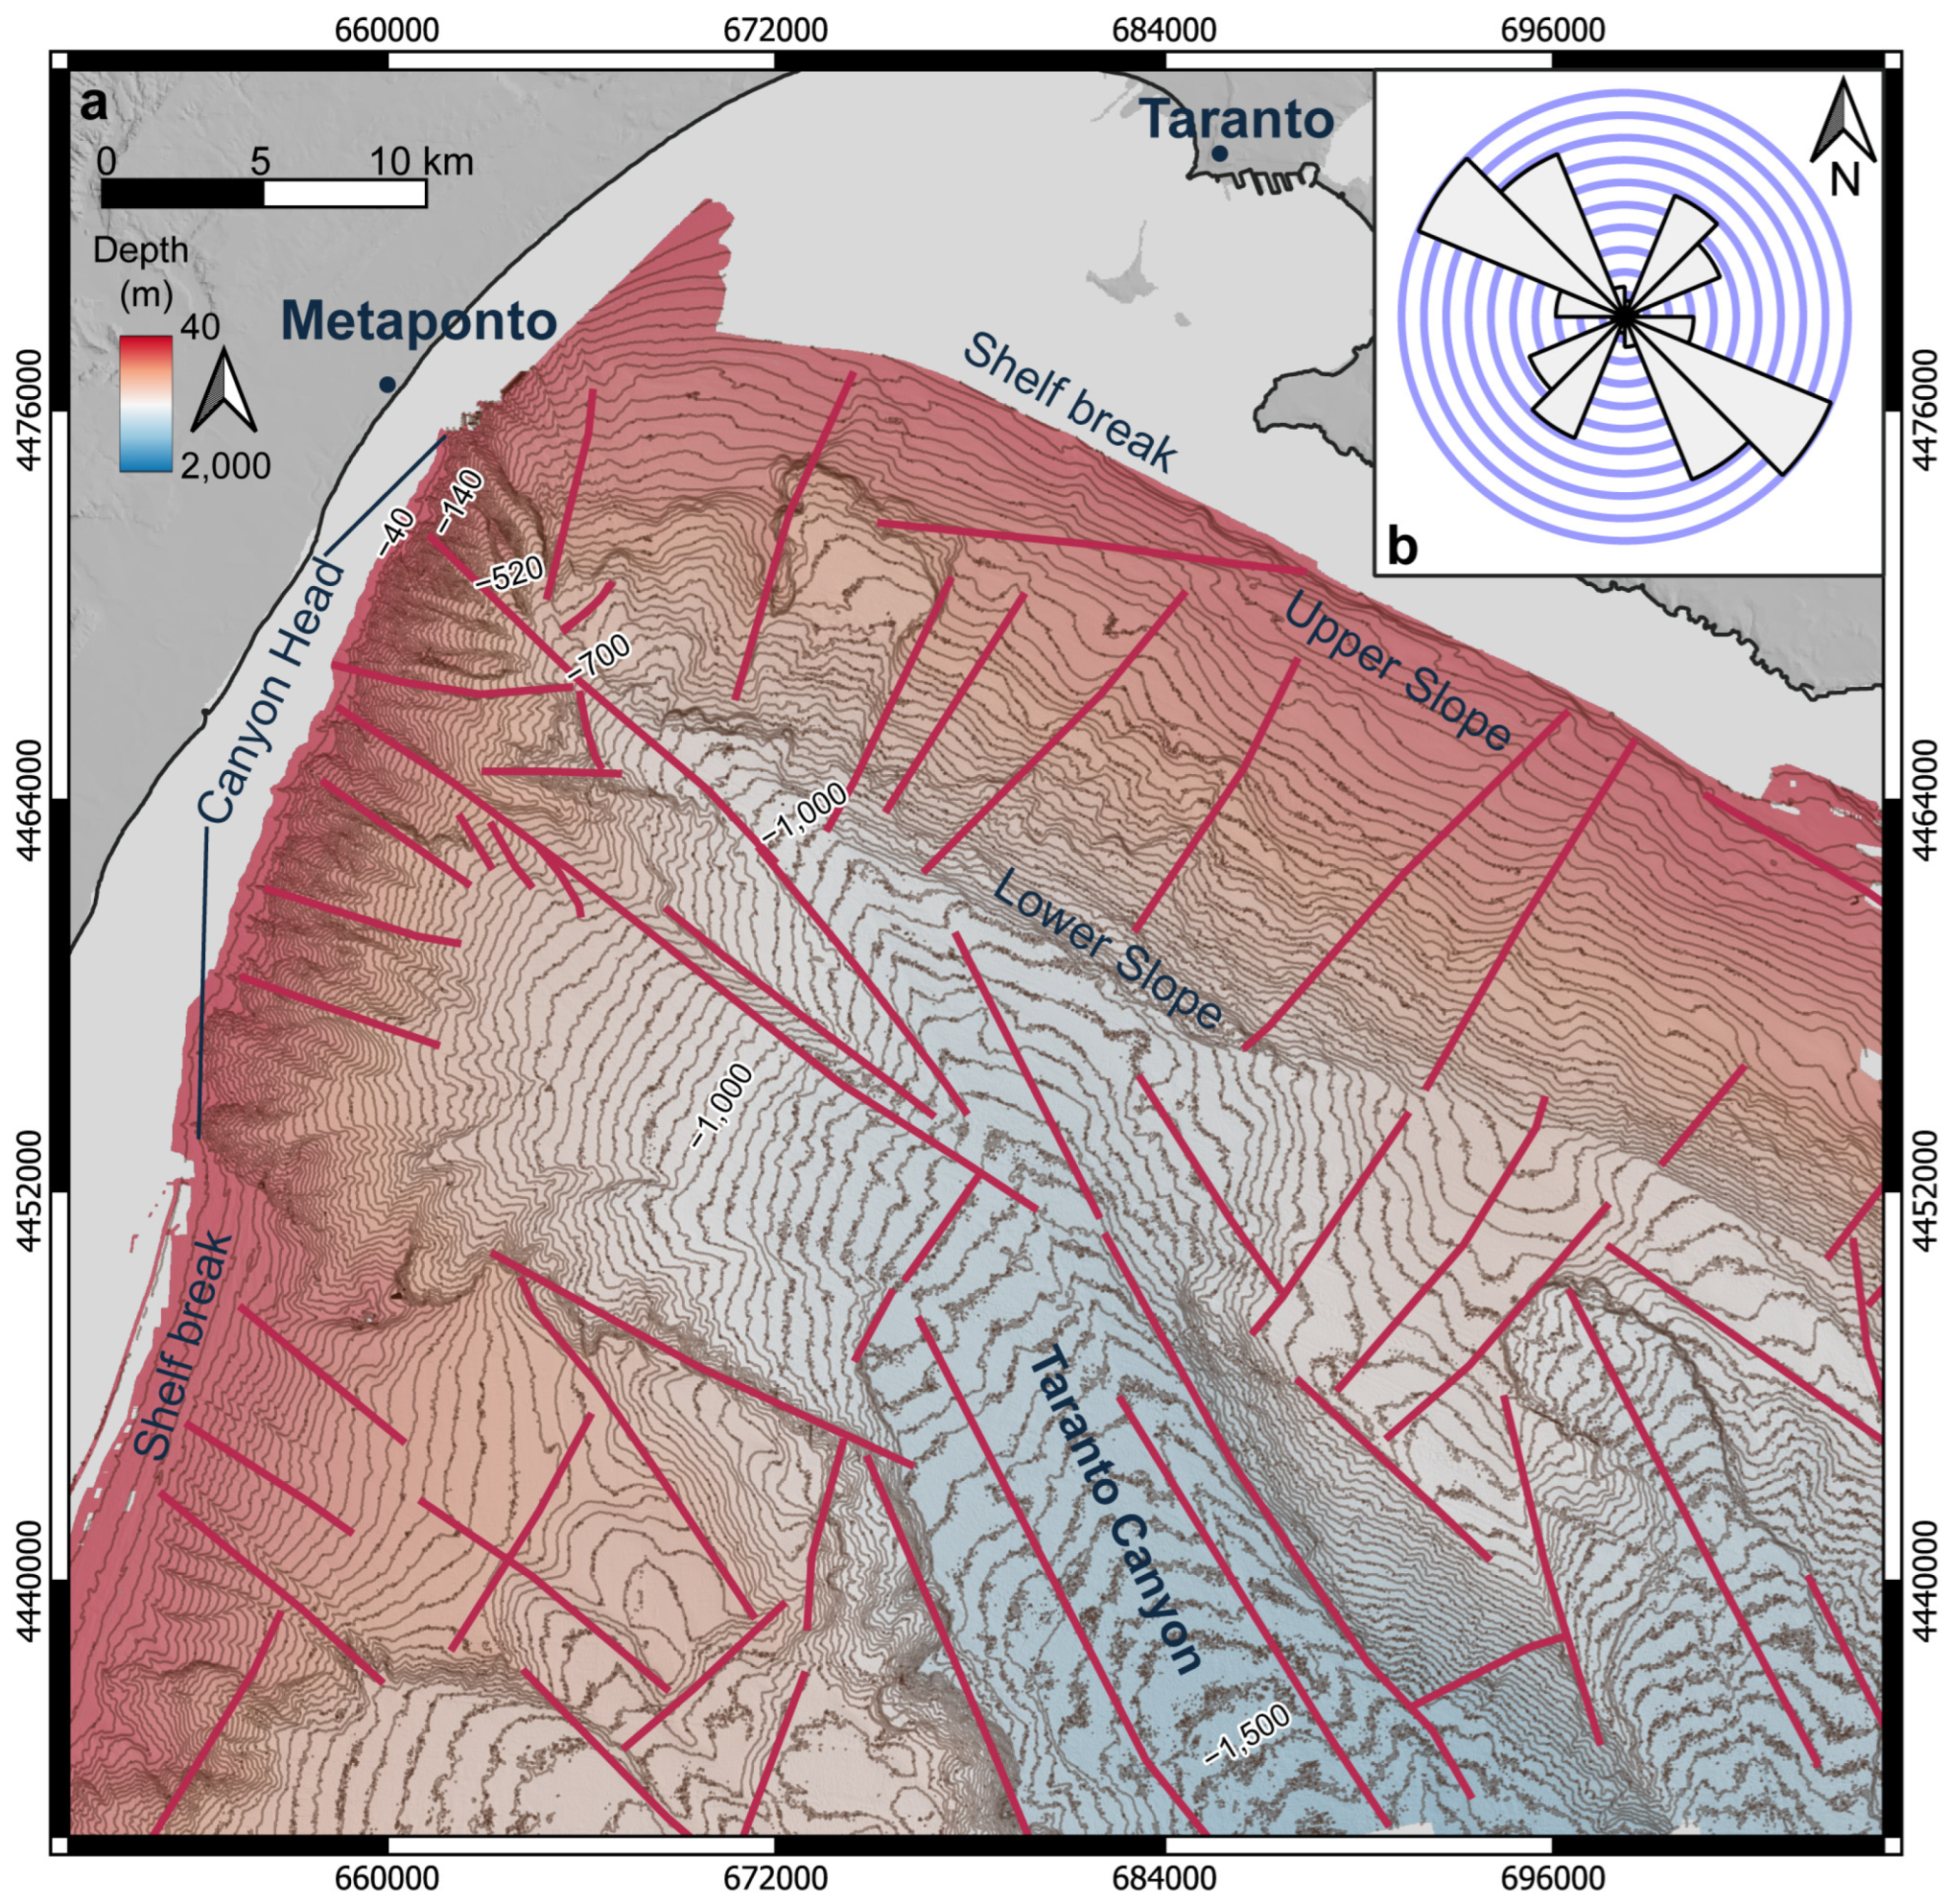
Morphostructural mapping was performed on DTM derived from the MBES data, subsampled at a resolution of 10 m. Analyses and cartographic outputs were produced in the QGIS environment (v. 3.44 “Solothurn”). Bathymetric contours were extracted at 20 m intervals and combined with hillshade visualization to support the identification of morphostructural features. Morphological lineaments were mapped based on their seafloor evidence (slope breaks, aligned escarpments, linear depressions, or ridges). These lineaments are considered fault-generated but cannot be confirmed as fault scarps, making the inclusion of kinematic information inappropriate. The resulting lineament map and the associated directional statistics (rose diagram) are presented in Figure 3.

3.4. Submarine Channel Network Extraction and Strahler Analysis

A channel network analysis was conducted to quantitatively assess the orientation of submarine channels and their order-dependent patterns. The channel network was extracted from the DTM using GRASS GIS hydrological tools (within QGIS), following a standard flow-routing workflow (sink filling where needed, flow direction, and flow accumulation). Extracted channel segments were then classified by Strahler order to evaluate how and if channel orientations vary with network hierarchy. Directional analysis of the extracted channel network was performed in QGIS using the Line Direction Histogram plugin (v3.2; https://plugins.qgis.org/plugins/LineDirectionHistogram, accessed on 27 January 2026), computing azimuth distributions weighted by segment length (bin size = 10°). Orientation statistics were computed for each channel order and summarized using rose diagrams.

4. Results

4.1. Seismostratigraphic Framework and Seismic Facies

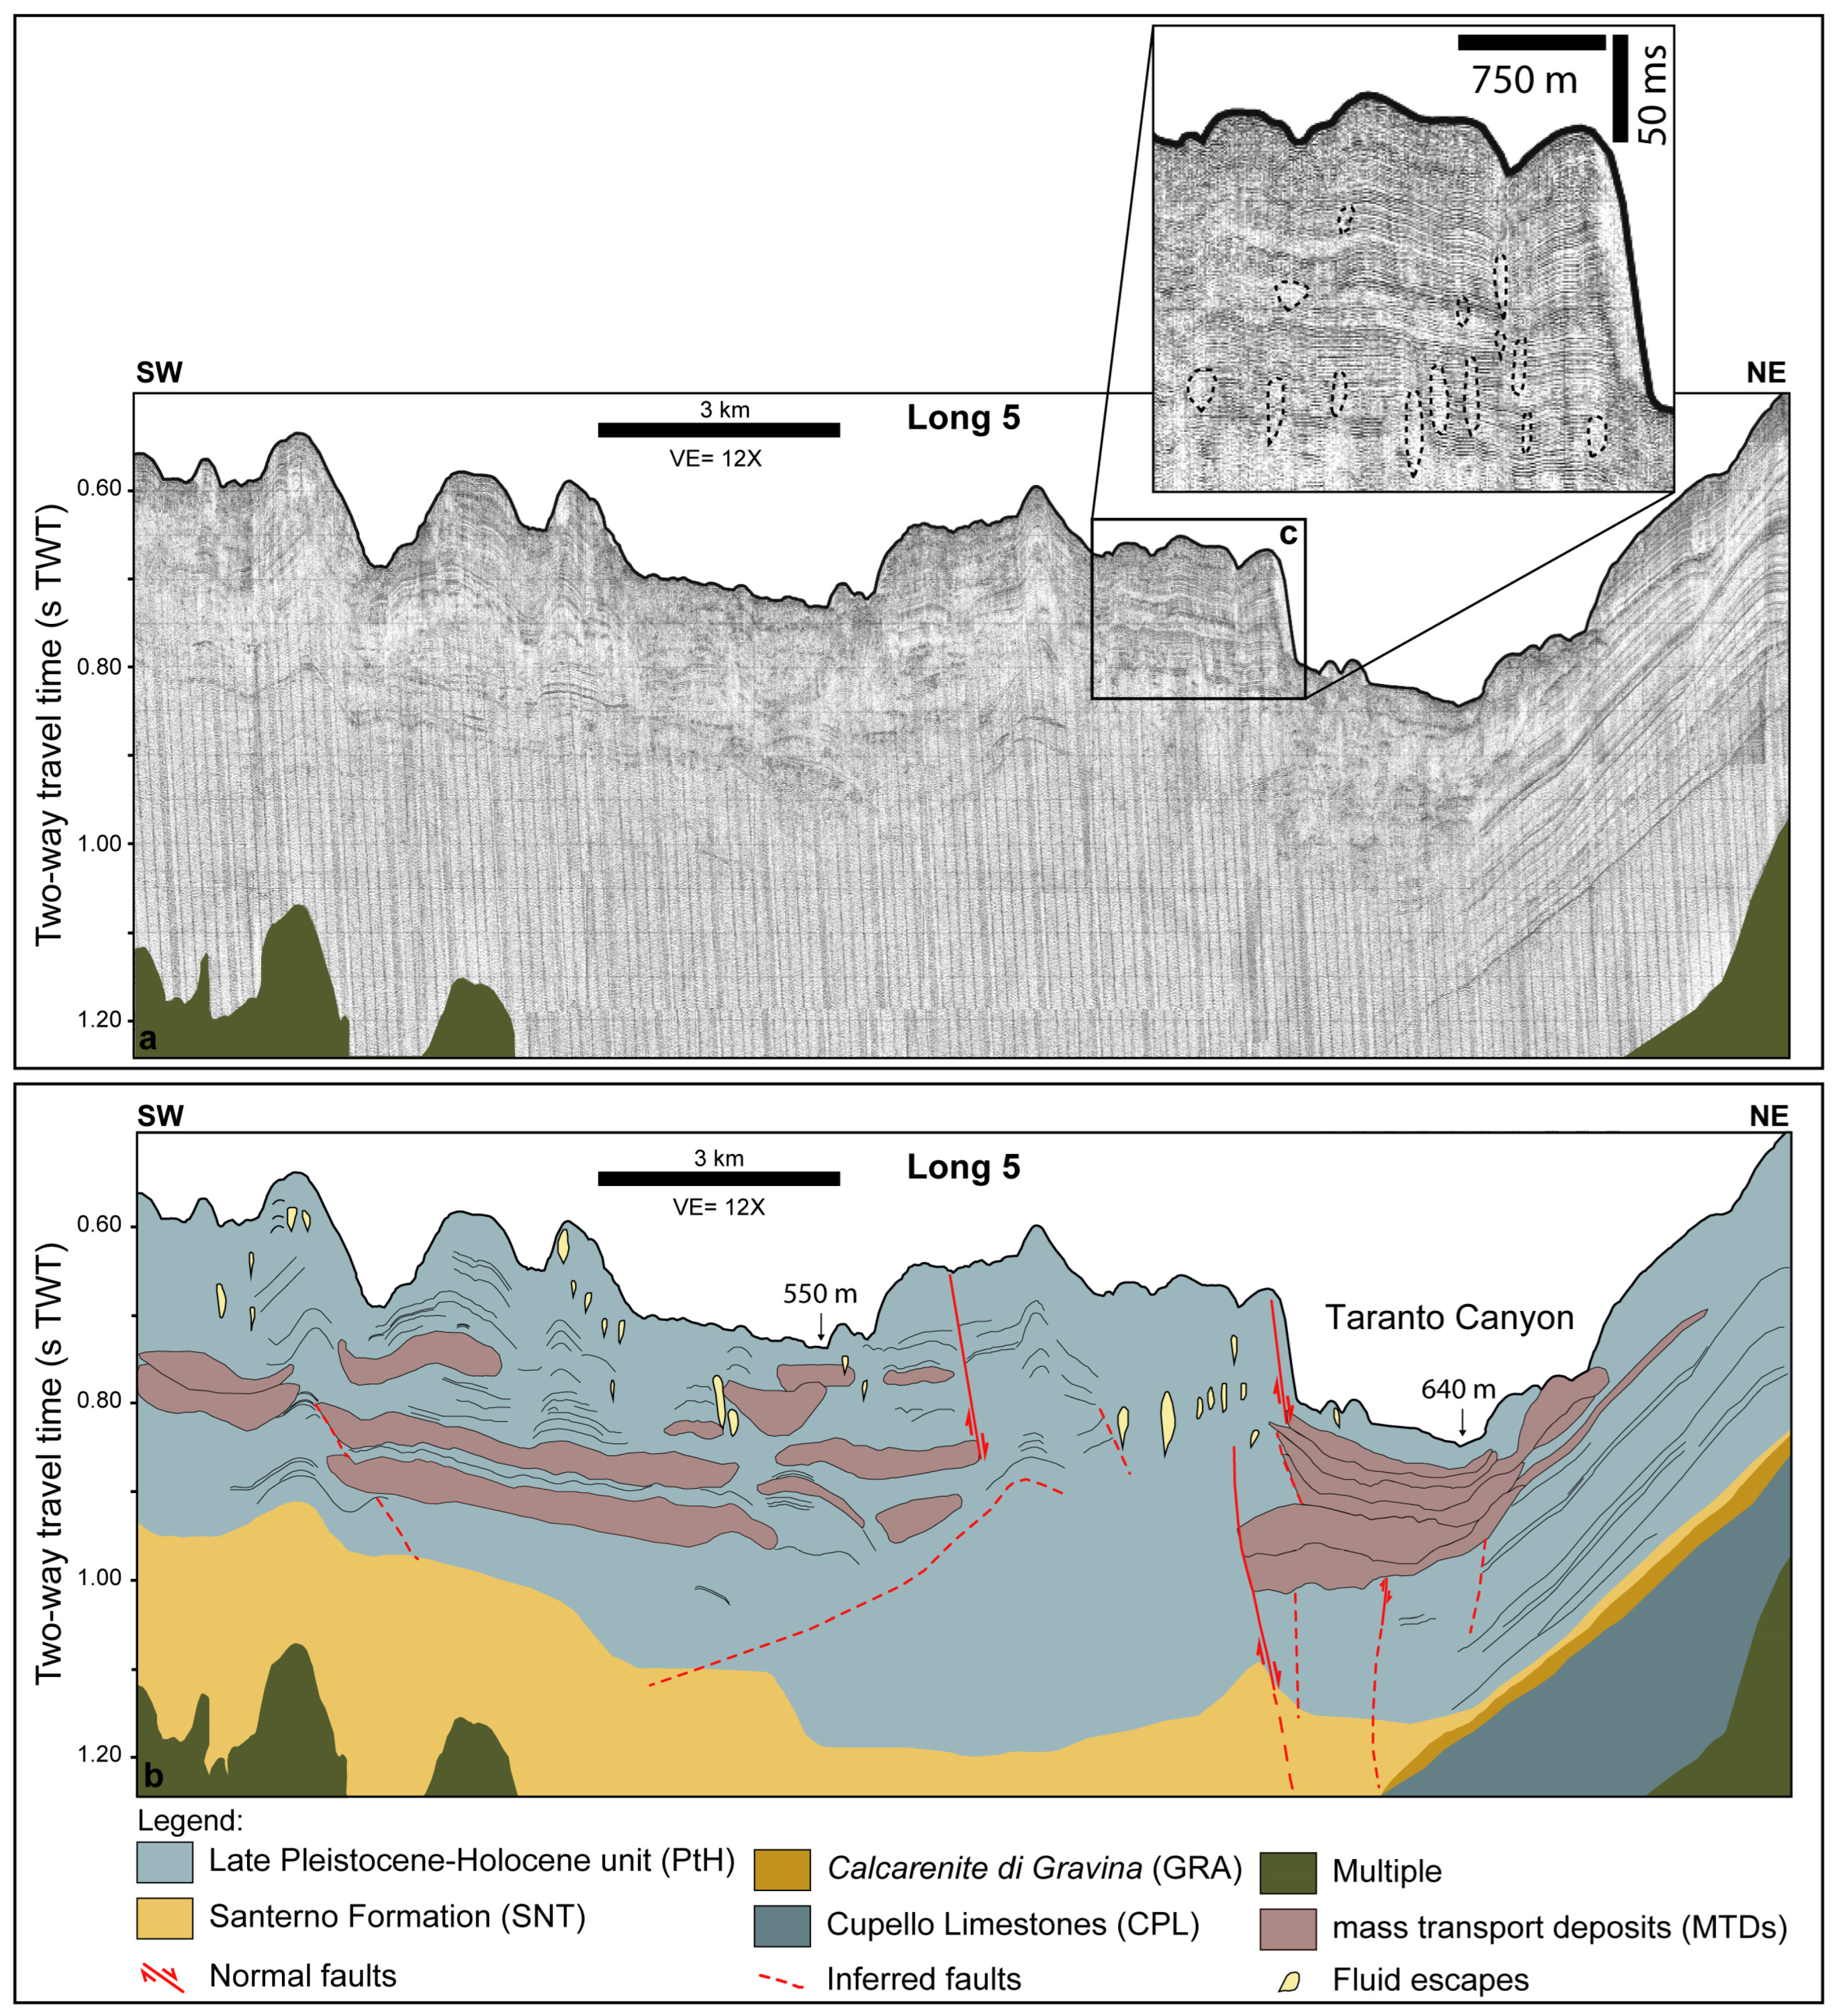
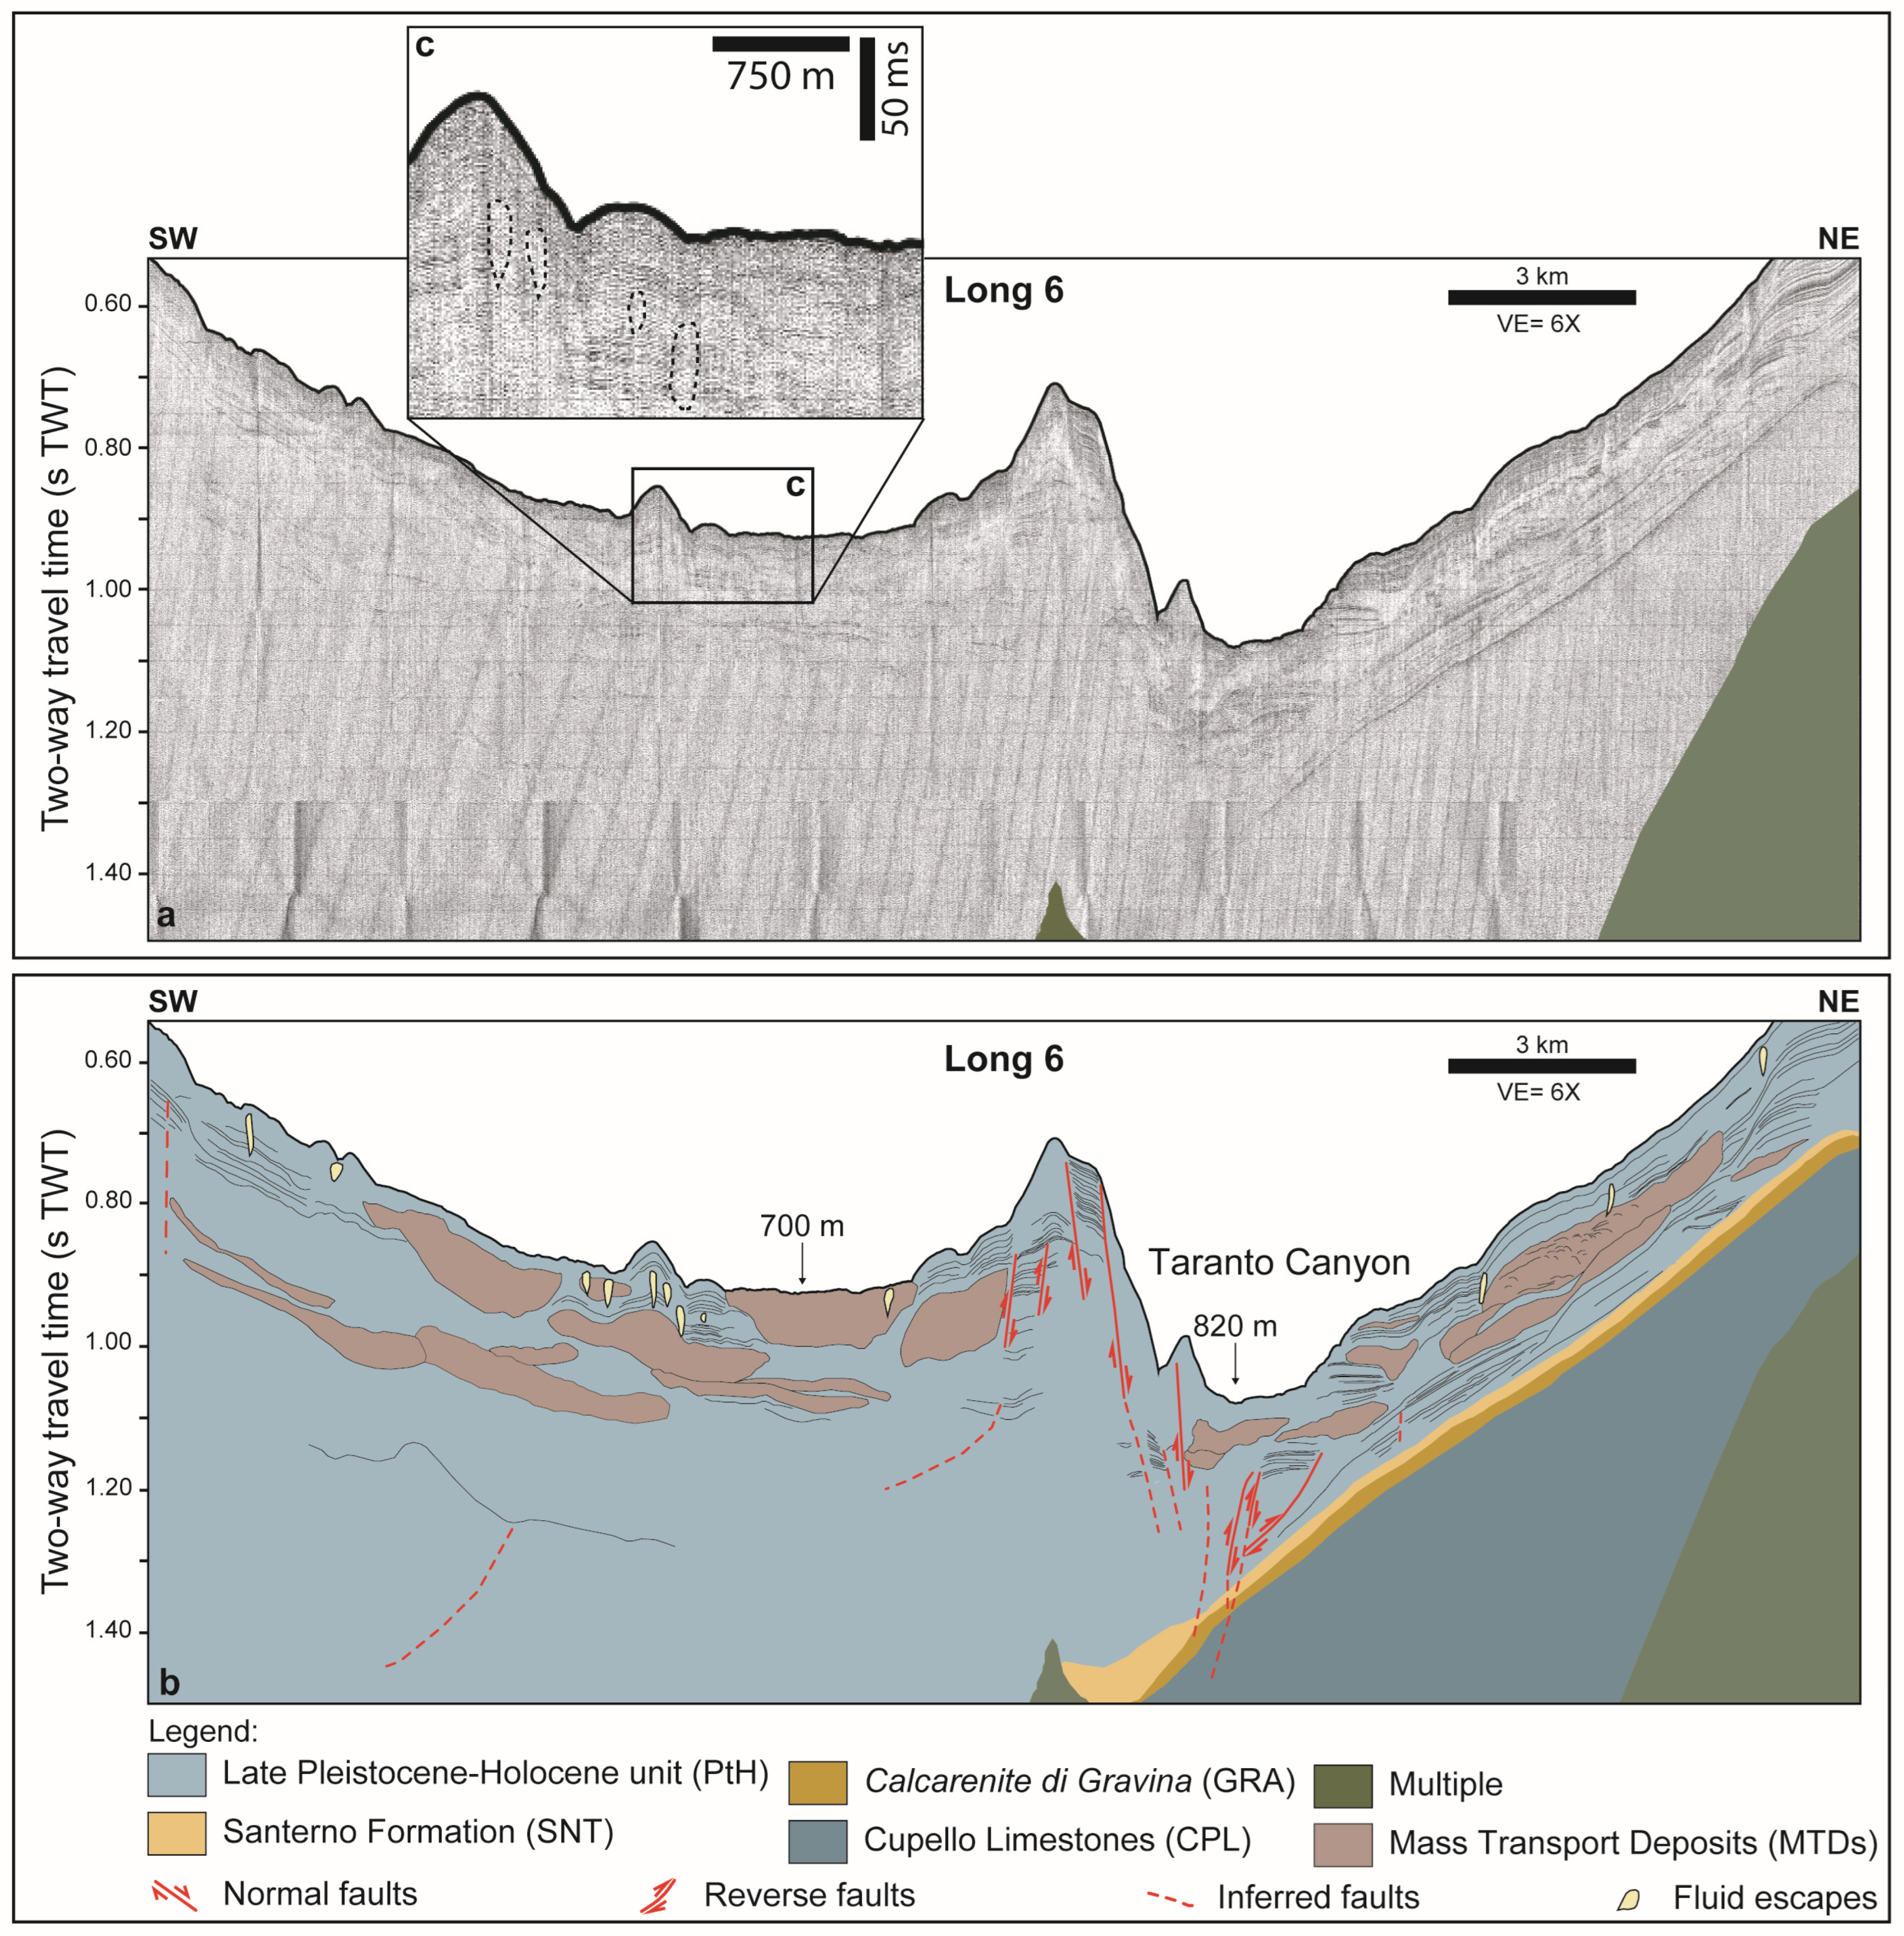
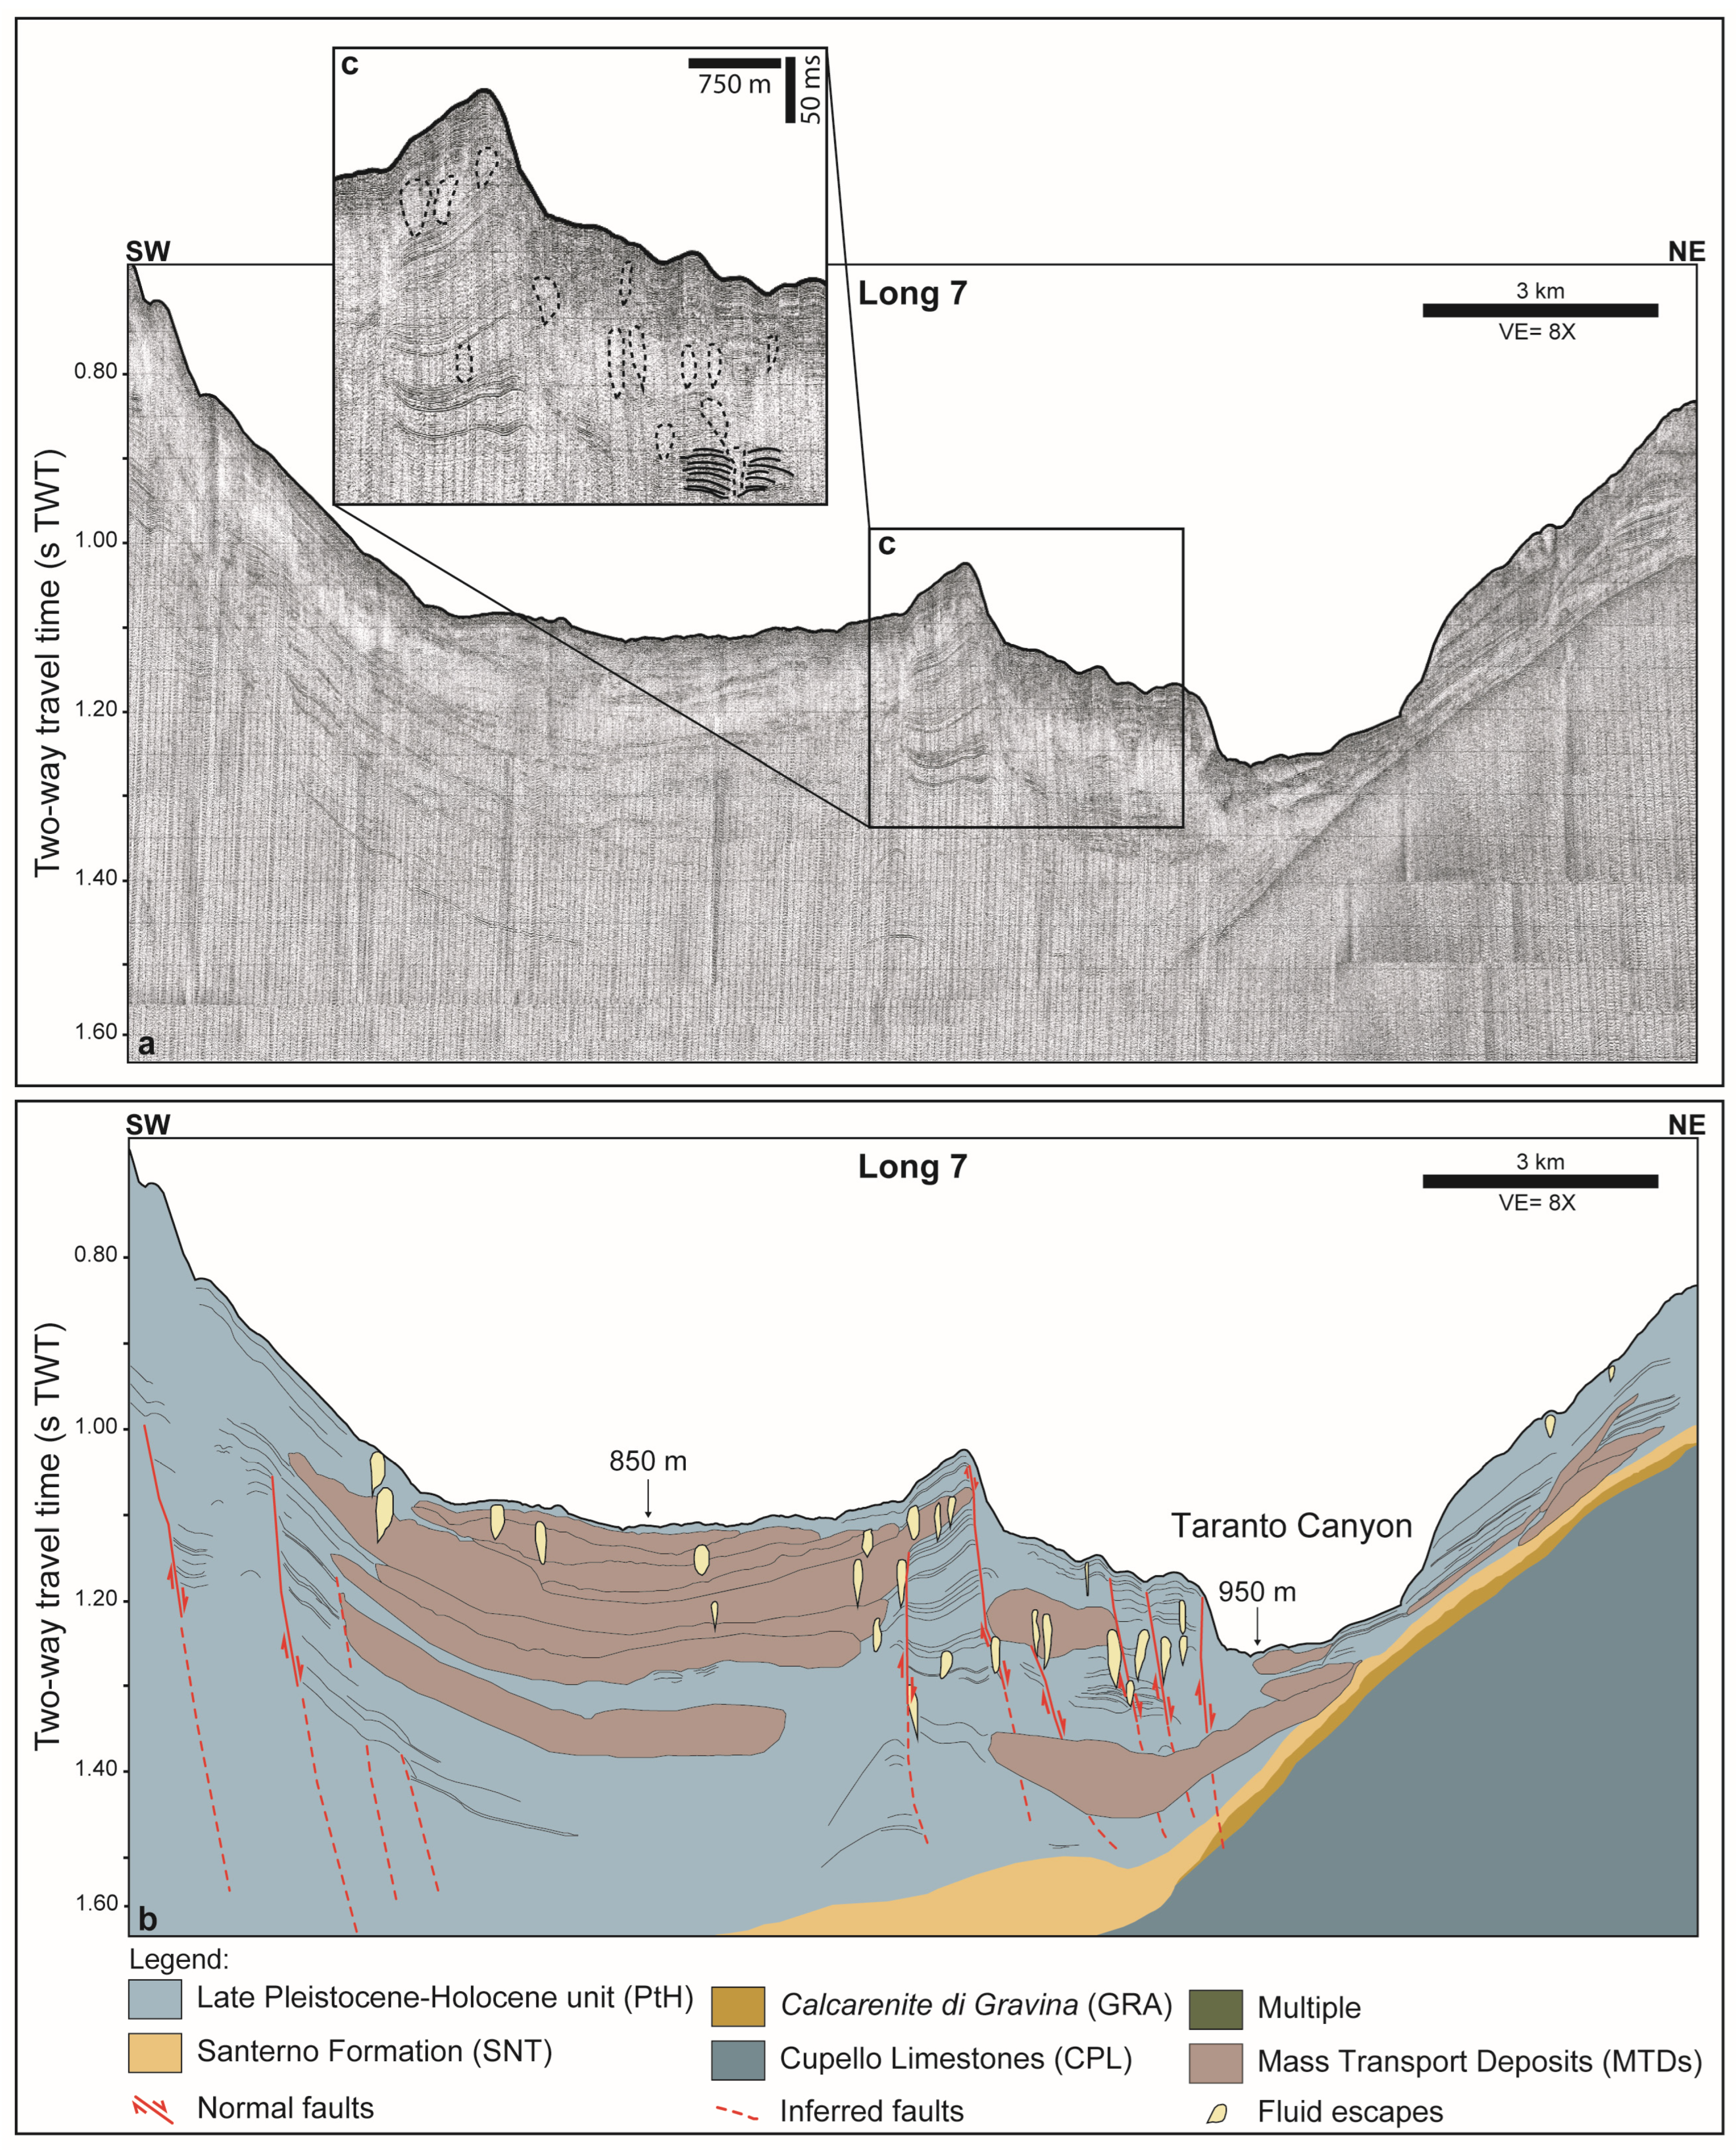
High-resolution Sparker seismic profiles image a shallow, laterally continuous stratified sedimentary succession along the northeastern Gulf of Taranto continental margin and across the headwall of the Taranto Canyon (Figure 4, Figure 5 and Figure 6). The analysis of reflector configuration, bounding discontinuities, and seismic facies distribution—integrated with the Livia 001 well tie (Figure 2a–c) and selected ViDEPI profiles (Figure 2d)—supports the subdivision of the imaged succession into four main seismic units: the late Pleistocene–Holocene unit (PtH), the Santerno Formation (SNT), the Calcarenite di Gravina (GRA), and the Cupello Limestones (CPL).
The PtH unit occurs immediately below the seafloor and typically exhibits medium to high amplitude, laterally continuous reflectors, and a predominantly parallel to sub-parallel internal configuration. Within the PtH unit, the profiles locally display acoustically disturbed intervals, ranging from chaotic to semi-transparent facies. These intervals are expressed as lens-shaped to tabular bodies with disrupted to poorly organized internal reflections and irregular basal surfaces (Figure 4b, Figure 5b and Figure 6b). Such bodies are preferentially developed within the upper part of the succession and are particularly frequent along canyon headwalls, flanks, and slope sectors adjacent to the Taranto Canyon, where they may appear stacked and laterally amalgamated over short distances.
All investigated profiles also display recurrent sub-vertical acoustic anomalies within the shallow succession (Figure 4c, Figure 5c and Figure 6c). These features are expressed as narrow to broad, columnar zones characterized by acoustic blanking or attenuation, reduced reflector amplitude, and local loss of reflector continuity, vertically disrupting otherwise coherent stratification. They mainly affect the PtH unit and, in several cases, extend downward toward the PtH–SNT boundary (Figure 4c, Figure 5c and Figure 6c). Spatially, they occur both in intercanyon slope sectors and near canyon margins, including intervals where reflector continuity is locally reduced and internal facies variability is higher.
The underlying SNT unit exhibits predominantly parallel to sub-parallel reflectors of moderate amplitude and good lateral continuity (Figure 4b, Figure 5b and Figure 6b). Compared to the PtH unit, acoustically disturbed facies are less common within SNT, which is characterized by a more uniform internal reflector configuration. A laterally persistent reflector marks the upper boundary of the SNT, separating the PtH from the underlying stratified succession and remaining traceable across the profiles.
The top of the GRA unit is identified by a sharp, high-amplitude reflector traceable across all profiles (Figure 4b, Figure 5b and Figure 6b). Internal reflections within GRA display moderate continuity and a medium-frequency behavior. The lowermost CPL unit is imaged as a package of lower-amplitude, laterally discontinuous reflections, locally affected by reduced signal penetration and acoustic attenuation (Figure 4b, Figure 5b and Figure 6b).
Based on the picked unit boundaries, the PtH thickness ranges between ~350 and 530 ms TWT, corresponding to approximately ~315–475 m assuming an average acoustic velocity of 1800 m/s [11] (Table 1). The SNT unit shows lower thickness values and locally reaches ~45–65 ms TWT, corresponding to ~50–72 m using an average velocity of 2200 m/s [11] (Table 1). The combined thickness of the GRA and CPL units exceeds ~300 ms TWT, corresponding to a minimum thickness of ~450 m based on average velocities of 2500 m/s and 3000 m/s, respectively (Table 1).
Several steeply dipping discontinuities are visible in the profiles (Figure 4b, Figure 5b and Figure 6b). These are expressed by reflector terminations, clear vertical separation, and localized bending of reflectors. Locally, these discontinuities affect the PtH and/or SNT units and coincide with changes in reflector continuity and subtle internal deformation of bedding. One prominent steeply dipping zone is repeatedly observed as a laterally confined corridor of disrupted and truncated reflections, traceable from the shallow succession to the deepest imaged unit (CPL; Figure 4b, Figure 5b and Figure 6b). Sub-vertical acoustic anomalies are locally adjacent to these discontinuities and/or occur within intervals characterized by increased reflector disruption and facies variability (Figure 4c, Figure 5c and Figure 6c).

4.2. Morpho-Structural Lineaments from Multibeam Bathymetry

The morpho-structural map derived from the undersampled 10 m resolution multibeam DTM (Figure 3a) shows a dense set of linear seafloor features across the outer shelf, shelf break, and upper to lower slope, including the Taranto Canyon. Mapped lineaments include aligned slope breaks, linear escarpments, elongated depressions, and ridge-like features identifiable on the map (Figure 3a).
Figure 3b (length-weighted rose diagram) summarizes the directional distribution of lineaments, highlighting multiple dominant orientation families. Two main azimuth clusters are evident, with a major NE–SW to NNW–SSE trend and a secondary NW–SE trend (Figure 3b). Spatially, NE–SW lineaments are more prominent in the northeastern part of the mapped area, whereas the central–southern sectors show a broader spread of orientations, with a clearer representation of NW–SE to NNW–SSE trends (Figure 3a,b). Cross-cutting relationships between lineaments of different orientations are observable in several sectors (Figure 3a), where linear features terminate against or are interrupted by differently oriented elements.

4.3. Submarine Channel Network Extraction and Strahler Stream Orders

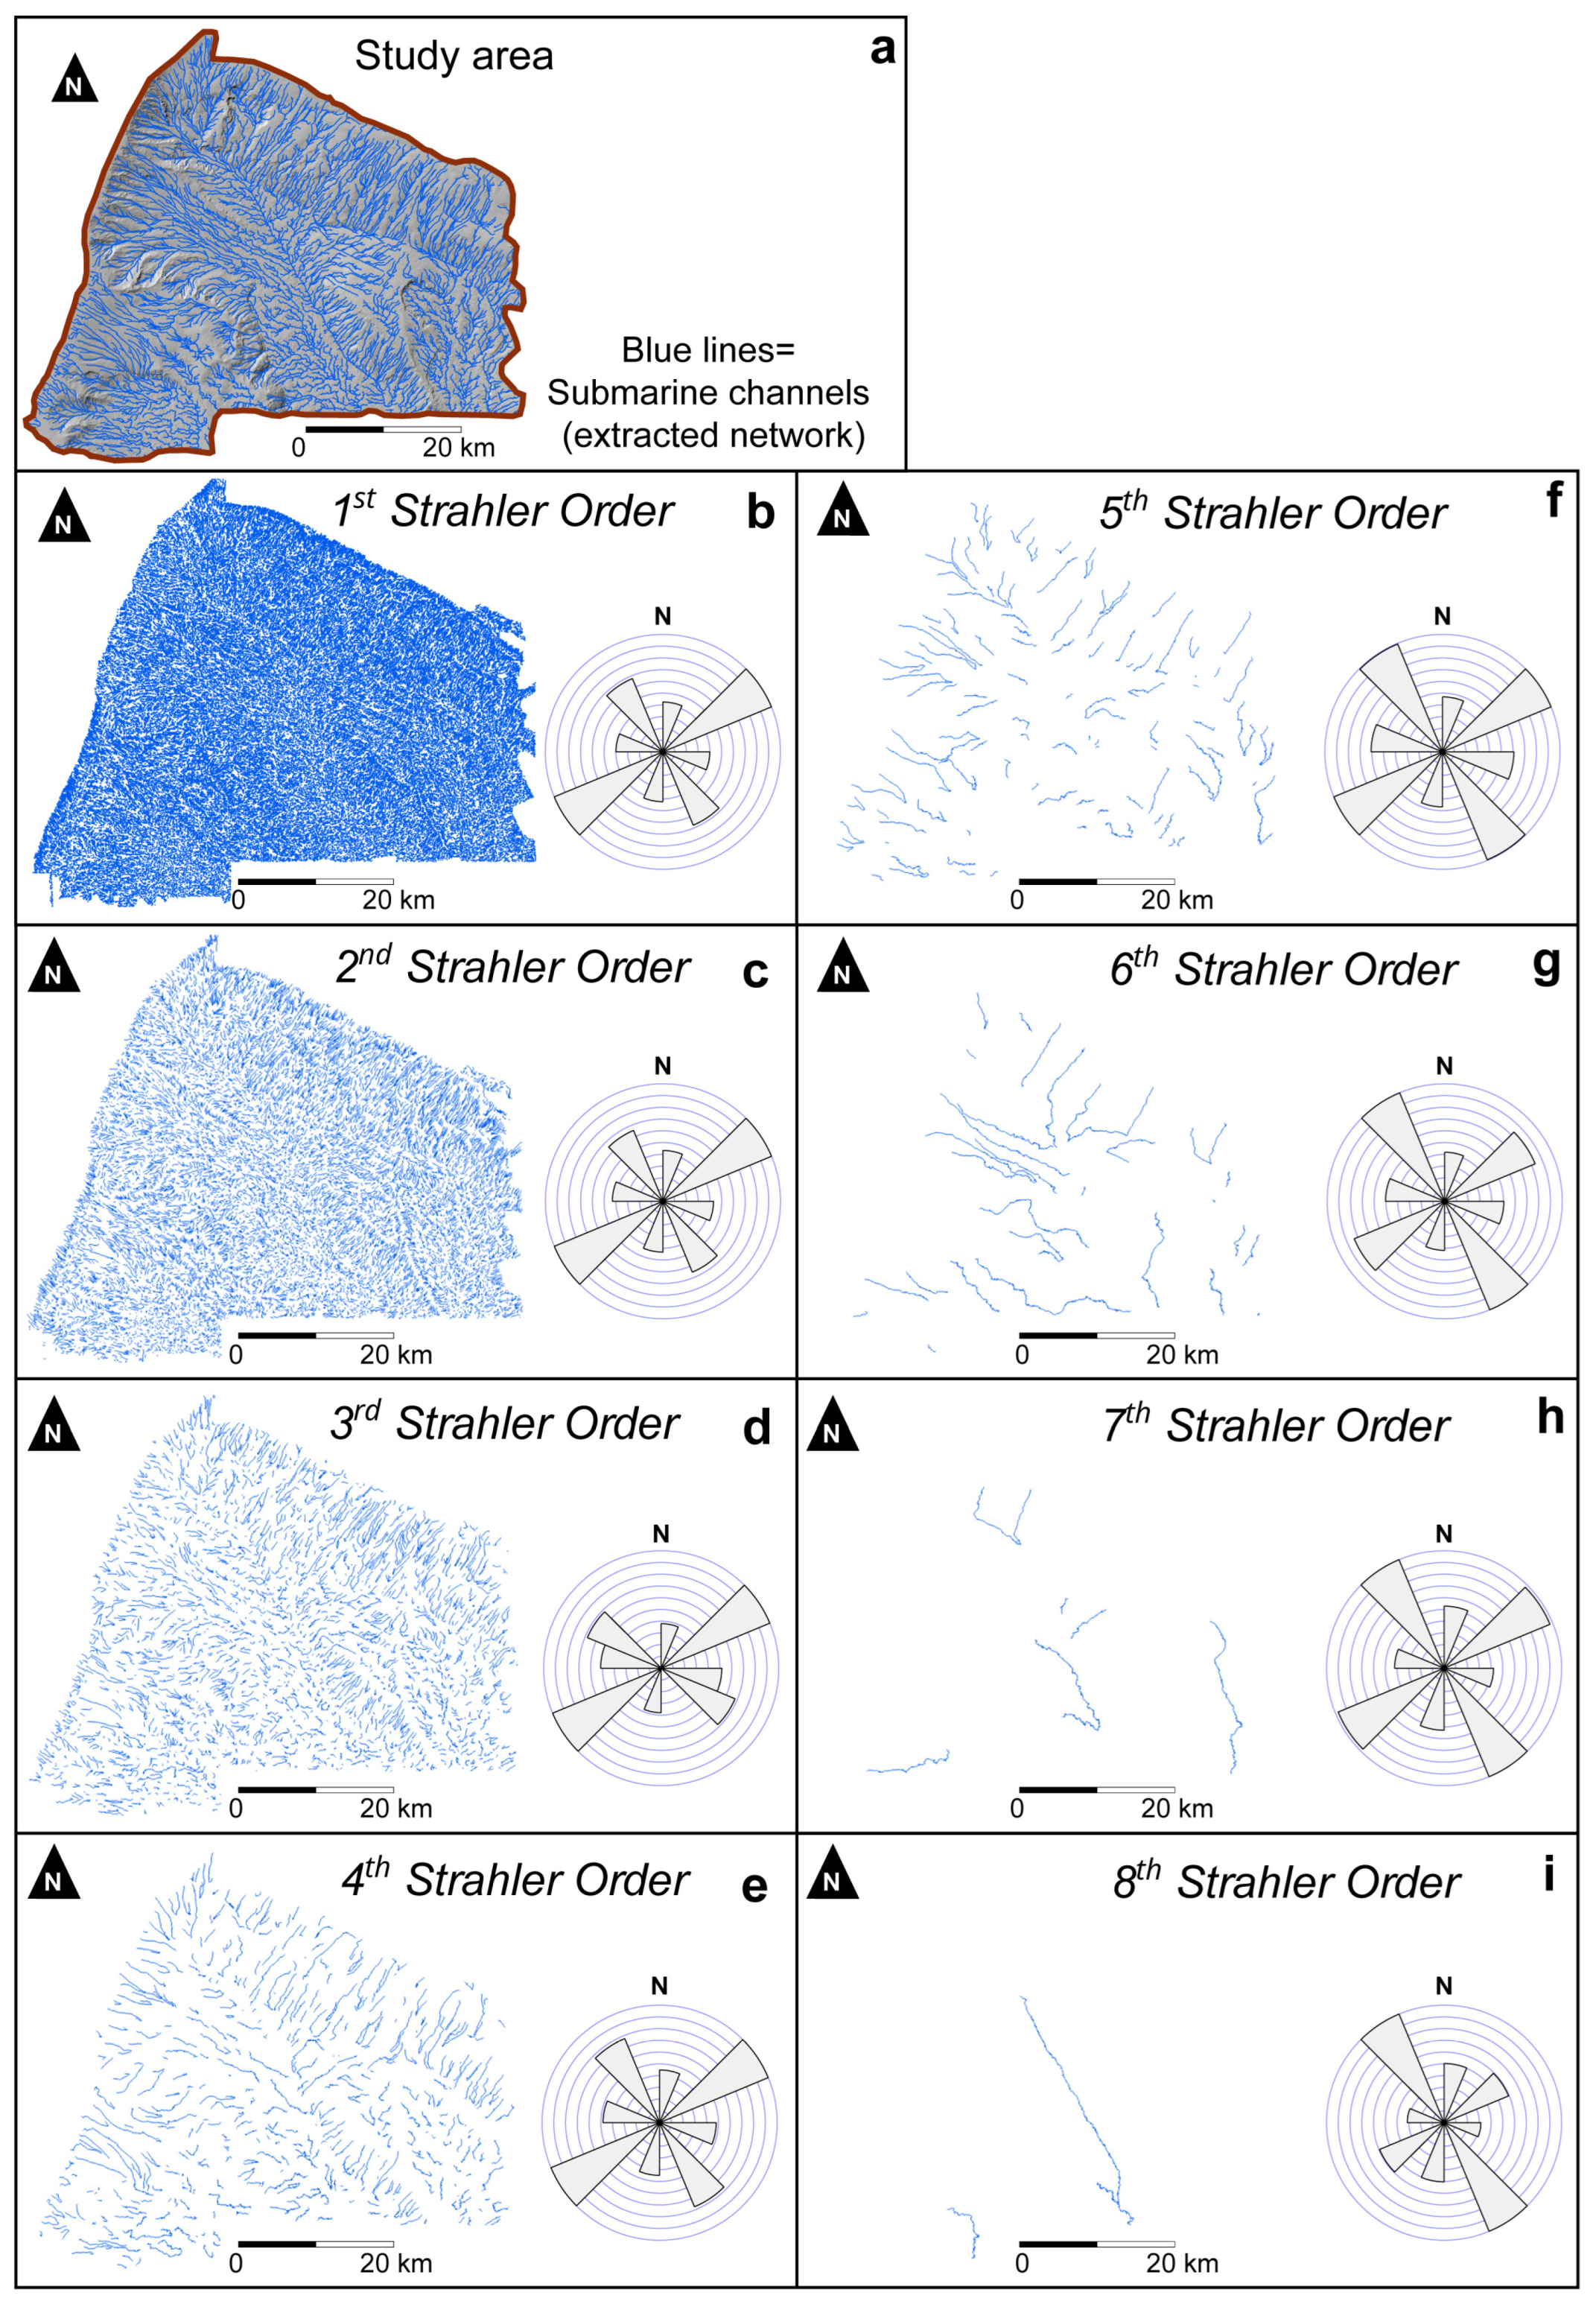
The multibeam DTM enables the extraction of a submarine channel network across the study area and its classification by Strahler order (Figure 7). Lower-order channels (first to second) display highly dispersed orientations, consistent with the high density of short channel segments at 10 m DTM resolution (Figure 7b,c). From the third order upward, directional clustering becomes more evident. Third-order segments show a dominant NE–SW cluster with a secondary population rotated toward ESE–WNW (Figure 7d). Fourth-order channels retain a predominant NE–SW cluster together with a distinct NW–SE component (Figure 7e). Fifth-order channels show a more balanced distribution between NE–SW and NW–SE trends (Figure 7f). Sixth-order channels are dominated by NW–SE orientations relative to NE–SW (Figure 7g). Seventh-order channels show a mixed distribution between NE–SW and NW–SE trends (Figure 7h). Eighth-order channels, although fewer and more continuous, are dominated by NW–SE orientations (Figure 7i). Overall, the length-weighted rose diagrams document order-dependent variations in channel segment orientations across the network hierarchy, with recurrent NE–SW and NW–SE families expressed across multiple orders (Figure 7).

5. Discussion

High-resolution Sparker profiles integrated with 10 m multibeam bathymetry provide a robust basis for discussing the late Pleistocene–Holocene evolution of the outer shelf–upper slope domain in the northeastern Gulf of Taranto (GoT), a key transition sector between the Southern Apennines frontal thrust system and the Calabrian subduction prism. In this setting, the shallow seismo-stratigraphic framework (PtH, SNT, GRA, and CPL), calibrated by the Livia 001 well tie and placed in a regional context through comparison with deep-penetration seismic interpretation (Figure 2), allows a consistent link between near-surface stratigraphic architecture and the inherited structural template described by regional tectono-stratigraphic reconstructions [11].
The PtH unit represents the uppermost depositional interval and exhibits the strongest internal variability across the study area, whereas the underlying SNT unit shows a comparatively more regular reflector configuration dominated by laterally continuous, sub-parallel reflections. This contrast is consistent with late Quaternary glacio-eustatic sea-level fluctuations and associated changes in sediment supply and accommodation, which are widely documented in the Mediterranean and along the Apulian–Ionian margin [67,68,69,70]. The short-distance lateral variability observed within PtH suggests that late Quaternary accumulation in the canyon–slope system was spatially heterogeneous rather than uniformly aggradational at the scale of the investigated margin segment.
A key feature of the PtH interval is the occurrence of acoustically disturbed, laterally discontinuous bodies that cluster along canyon headwalls, flanks, and adjacent slope-break sectors. Their seismic character (chaotic to semi-transparent facies and disrupted internal reflections) and geometry (lens-shaped to tabular bodies with irregular basal surfaces) match the first-order seismic expression commonly attributed to mass-transport deposits (MTDs) in comparable continental margin settings [14,15,16,17,18,19,71,72,73]. Given the bandwidth and resolution limits of Sparker data, this interpretation is intended as a facies-based classification grounded on geometry and acoustic character, consistent with established criteria [62,63], rather than as a detailed diagnosis of individual failure mechanisms.
Steep discontinuities affecting the PtH–SNT interval provide additional control on stratigraphic architecture and the distribution of disturbed facies. Where constrained by reflector terminations and localized bending, shallow discontinuities most commonly display dip–slip normal faulting with minor vertical separation. In foredeep margin and outer wedge settings, shallow normal faulting and small offset deformation can develop through flexural bending, differential compaction, and gravitational readjustment of the uppermost sedimentary cover, particularly above a mechanically heterogeneous and structurally segmented substrate [6,42]. In the GoT, this framework is consistent with regional interpretations documenting thrust propagation, segmentation, and along-strike variability in deformation style across the transition between the Apennine wedge and the Calabrian arc domain [10,11,46,47,74,75]. Importantly, the present dataset does not demonstrate large-magnitude emergent thrusting within the Sparker window; instead, it indicates localized shallow deformation affecting the PtH–SNT interval, which may contribute to the development of short-wavelength accommodation zones and influence depositional patterns and slope stability.
Sub-vertical acoustic anomalies are recurrent within the PtH–SNT interval and are expressed as chimney-like zones of attenuation/blanking with reduced reflector amplitude and local loss of reflector continuity (Figure 4c, Figure 5c and Figure 6c). Their spatial association with steep discontinuities and with intervals characterized by higher internal facies variability suggests preferential vertical pathways within the shallow succession. Because Sparker data alone do not allow robust discrimination of fluid composition, it is more rigorous to describe these features as fluid escape acoustic anomalies, without implying a specific origin. Similar acoustic expressions have been linked elsewhere to focused fluid flow, transient pore-pressure changes, and sediment-property contrasts in late Quaternary successions (e.g., [18,70,71,72]. Focused fluid migration can act as a preconditioning factor for slope instability by locally reducing effective stress and sediment strength, especially where fluid pathways intersect mechanically heterogeneous intervals and structurally segmented sectors [18,68,70,71,72].
Independent geomorphic evidence from multibeam bathymetry supports a structurally conditioned framework guiding seafloor morphology and sediment routing. The mapped morphostructural lineaments, extracted from the DTM (Figure 3), define dominant NE–SW and secondary NW–SE to WNW–ESE orientation families. The channel network analysis shows that higher-order channel segments preferentially align with the same main azimuth families, suggesting that structural anisotropy influences canyon development and channel organization at the margin scale [20,21]. This correspondence is best interpreted in terms of shared orientation families rather than a one-to-one correspondence between individual lineaments and specific channels because channel pathways also respond to local gradients, confinement, and autogenic reorganization within the canyon–slope system.
At the basin scale, the shallow patterns documented offshore are compatible with independent geomorphic indicators of Late Quaternary tectonic activity in adjacent onshore sectors, including marine terrace staircases and evidence of differential vertical motions along the Ionian coastal belt [76,77,78,79]. Although the present dataset does not constrain deformation rates, it provides new high-resolution evidence that the late Pleistocene–Holocene stratigraphic record in the northeastern GoT is locally affected by shallow deformation, structural segmentation, and focused vertical pathways. Collectively, these observations refine the shallow expression of regional tectono-stratigraphic models [11,73] by showing that in this transition zone, deformation may be expressed indirectly through localized normal fault geometries and reflector bending, structurally influenced organization of seafloor lineaments and channel pathways, and spatial coupling between discontinuities, fluid escape acoustic anomalies, and repeated sediment remobilization. This interpretation is consistent with regional evidence of active deformation and segmentation in the Ionian domain and Calabrian arc system [32,46,47,48,49], while remaining conservative with respect to the magnitude and kinematics of shallow structures imaged by the Sparker dataset.

6. Conclusions

High-resolution Sparker seismic profiles integrated with 10 m multibeam bathymetry and tied to the Livia 001 well define a four-unit shallow seismo-stratigraphic framework (PtH, SNT, GRA, and CPL) for the outer shelf–upper slope of the northeastern Gulf of Taranto and document marked along-slope variability within the PtH–SNT interval.
The PtH unit shows the strongest internal heterogeneity and contains numerous acoustically disturbed bodies concentrated along canyon margins and slope-break sectors, consistent with repeated sediment remobilization within the canyon–slope system. Recurrent sub-vertical fluid escape acoustic anomalies and steep discontinuities affecting PtH and locally SNT indicate localized vertical pathways and shallow deformation expressed by reflector terminations, minor vertical separation, and localized bending.
With the correspondence between morphostructural lineament families and higher-order channel orientations, these observations support a structurally conditioned template that influences seafloor morphology and sediment routing. In the Apennine–Calabrian transition zone, the predominance of shallow normal fault geometries is consistent with strain partitioning and gravitational readjustment of the shallow cover above a deeper contractional system reconstructed in regional models [11,73], refining the shallow expression of deformation and providing a framework for future work on deformation rates, fluid circulation, and slope instability dynamics.

Author Contributions

Conceptualization, A.M. and B.M.; methodology, A.M. and B.M.; validation, S.C. and M.R.S.; analysis, A.M. and B.M.; resources, M.R.S., S.C. and B.M.; writing—original draft preparation, A.M. and B.M.; writing—review and editing, A.M., B.M., S.C. and M.R.S.; supervision, M.R.S. and S.C. All authors have read and agreed to the published version of the manuscript.

Funding

The research was supported by FRA 2024 and 2025 (Fund of Academic Research; PIs: S. Ciarcia, M.R. Senatore and B. Massa).

Data Availability Statement

The original contributions presented in this study are included in the article. Further inquiries can be directed to the corresponding author.

Acknowledgments

The authors acknowledge the Italian National Research Project, MaGIC (Marine Geological Hazard along the Italian Coast), funded by the Italian Civil Protection Department and the Scientific Coordinator, Francesco Latino Chiocci, of the “Sapienza”—University of Rome. The authors thank all editors and reviewers for their helpful comments and suggestions.

Conflicts of Interest

The authors declare no conflicts of interest.

References

  1. Lort, J.M. The tectonics of the eastern Mediterranean: A geophysical review. Rev. Geophys. 1971, 9, 189–216. [Google Scholar] [CrossRef]
  2. Mazzoli, S.; Helman, M. Neogene patterns of relative plate motion for Africa-Europe: Some implications for recent central Mediterranean tectonics. Geol. Rundsch. 1994, 83, 464–468. [Google Scholar] [CrossRef]
  3. Merlini, S.; Mostardini, F. Appennino centro-meridionale: Sezioni geologiche e proposta di modello strutturale. Geol. Dell’italia Cent. Congr. Naz. 1986, 73, 147–149. (In Italian) [Google Scholar]
  4. Lentini, F.; Catalano, S.; Carbone, S. The external thrust system in southern Italy; a target for petroleum exploration. Pet. Geosci. 1996, 2, 333–342. [Google Scholar] [CrossRef]
  5. Doglioni, C.; Merlini, S.; Cantarella, G. Foredeep geometries at the front of the Apennines in the Ionian Sea (central Mediterranean). Earth Planet. Sci. Lett. 1999, 168, 243–254. [Google Scholar] [CrossRef]
  6. Butler, R.W.H.; Corrado, S.; Mazzoli, S.; De Donatis, M.; Di Bucci, D.; Naso, G.; Scrocca, D.; Nicolai, C.; Zucconi, V. Time and space variability of «thin-skinned» and «thick-skinned» thrust tectonics in the Apennines (Italy). Rend. Fis. Acc. Lincei 2000, 11, 5–39. [Google Scholar] [CrossRef]
  7. Noguera, A.M.; Rea, G. Deep structure of the Campanian–Lucanian arc (southern Apennine, Italy). Tectonophysics 2000, 324, 239–265. [Google Scholar] [CrossRef]
  8. Patacca, E.; Scandone, P. Late thrust propagation and sedimentary response in the thrust-belt—Foredeep system of the Southern Apennines (Pliocene-Pleistocene). In Anatomy of an Orogen: The Apennines and Adjacent Mediterranean Basins; Springer: Dordrecht, The Netherlands, 2001; pp. 401–440. [Google Scholar]
  9. Patacca, E.; Scandone, P. Geological interpretation of the CROP-04 seismic line (Southern Apennines, Italy). Boll. Soc. Geol. Ital. 2007, 7, 297–315. [Google Scholar]
  10. Senatore, M.R.; Normark, W.R.; Pescatore, T.; Rossi, S. Structural framework of the Gulf of Taranto (Ionian Sea). Mem. Della Soc. Geol. D’italia 1988, 41, 533–539. [Google Scholar]
  11. Teofilo, G.; Antoncecchi, I.; Caputo, R. Neogene-Quaternary evolution of the offshore sector of the Southern Apennines accretionary wedge, Gulf of Taranto, Italy. Tectonophysics 2018, 738, 16–32. [Google Scholar] [CrossRef]
  12. Sartori, R. The Tyrrhenian back-arc basin and subduction of the Ionian lithosphere. Epis. J. Int. Geosci. 2003, 26, 217–221. [Google Scholar] [CrossRef]
  13. Volpi, V.; Del Ben, A.; Civile, D.; Zgur, F. Neogene tectono-sedimentary interaction between the Calabrian Accretionary Wedge and the Apulian Foreland in the northern Ionian Sea. Mar. Pet. Geol. 2017, 83, 246–260. [Google Scholar] [CrossRef]
  14. Artoni, A.; Polonia, A.; Carlini, M.; Torelli, L.; Mussoni, P.; Gasperini, L. Mass transport deposits and geo-hazard assessment in the Bradano Foredeep (Southern Apennines, Ionian Sea). Mar. Geol. 2019, 407, 275–298. [Google Scholar] [CrossRef]
  15. Meo, A.; Chiocci, F.L.; Senatore, M.R. Morphometric measures to assess the maturity of the submerged drainage basins: The case of the Taranto Canyon upper reach. In Proceedings of the IMEKO International Conference on Metrology for the Sea (MetroSea), Naples, Italy, 11–13 October 2017; IMEKO: Budapest, Hungary, 2017; pp. 133–137. [Google Scholar]
  16. Meo, A.; Senatore, M.R. Morphological and seismostratigraphic evidence of Quaternary mass transport deposits in the North Ionian Sea: The Taranto landslide complex (TLC). Front. Earth Sci. 2023, 11, 1168373. [Google Scholar] [CrossRef]
  17. Senatore, M.R.; Meo, A.; Budillon, F. Measurements in Marine Geology: An Example in the Gulf of Taranto (Northern Ionian Sea). In Measurement for the Sea; Daponte, P., Rossi, G.B., Piscopo, V., Eds.; Springer Series in Measurement Science and Technology; Springer: Cham, Switzerland, 2022. [Google Scholar] [CrossRef]
  18. Ceramicola, S.; Senatore, M.R.; Cova, A.; Meo, A.; Forlin, E.; Critelli, S.; Markezic, N.; Zecchin, M.; Civile, D.; Bosman, A.; et al. Geohazard features of the Gulf of Taranto. J. Maps 2024, 20, 2431073. [Google Scholar] [CrossRef]
  19. Meo, A.; Falco, M.; Chiocci, F.L.; Senatore, M.R. Kinematics and the tsunamigenic potential of Taranto Landslide (northeastern Ionian Sea): Morphological analysis and modeling. In Landslides and Engineered Slopes. Experience, Theory and Practice; CRC Press: Boca Raton, FL, USA, 2018; pp. 1409–1416. [Google Scholar] [CrossRef]
  20. Mitchell, N.C. Morphologies of knickpoints in submarine canyons. Geol. Soc. Am. Bull. 2006, 118, 589–605. [Google Scholar] [CrossRef]
  21. Micallef, A.; Mountjoy, J.J.; Barnes, P.M.; Canals, M.; Lastras, G. Geomorphic response of submarine canyons to tectonic activity: Insights from the Cook Strait canyon system, New Zealand. Geosphere 2014, 10, 905–929. [Google Scholar] [CrossRef]
  22. DISS Working Group. Database of Individual Seismogenic Sources (DISS). 2025. Available online: http://diss.ingv.it/data/ (accessed on 15 January 2026).
  23. Ministero dello Sviluppo Economico UNMIG, Società Geologica Italiana, Assomineraria Italia. Progetto ViDEPI Visibilità Dati Esplorazione Petrolifera in Italia. 2009. Available online: https://unmig.mase.gov.it/ricerca-e-coltivazione-di-idrocarburi/dati-storici-progetto-videpi/ (accessed on 27 January 2026). (In Italian)
  24. Akimbekova, A.; Carboni, F.; Mancinelli, P.; Barreca, G.; Scarfì, L.; Pauselli, C.; Monaco, C.; Barchi, M.R. Gravity modelling of the Tyrrhenian-Calabrian-Ionian subduction system. Front. Earth Sci. 2023, 11, 1259831. [Google Scholar] [CrossRef]
  25. Chizzini, N.; Artoni, A.; Torelli, L.; Polonia, A.; Qadir, A.; Gasperini, L. Accretionary wedge collision in the Ionian Sea: Timing and movement of the Calabrian arc and the Mediterranean ridge in the central Mediterranean Sea. Gondwana Res. 2025, 144, 212–238. [Google Scholar] [CrossRef]
  26. Ridente, D.; Fracassi, U.; Di Bucci, D.; Trincardi, F.; Valensise, G. Middle Pleistocene to Holocene activity of the Gondola Fault Zone (Southern Adriatic Foreland): Deformation of a regional shear zone and seismotectonic implications. Tectonophysics 2008, 453, 110–121. [Google Scholar] [CrossRef]
  27. Di Bucci, D.; Burrato, P.; Vannoli, P.; Valensise, G. Tectonic evidence for the ongoing Africa-Eurasia convergence in central Mediterranean foreland areas: A journey among long-lived shear zones, large earthquakes, and elusive fault motions. J. Geophys. Res. Solid Earth 2010, 115, B12404. [Google Scholar] [CrossRef]
  28. Del Gaudio, V.; Pierri, P.; Frepoli, A.; Calcagnile, G.; Venisti, N.; Cimini, G.B. A critical revision of the seismicity of Northern Apulia (Adriatic microplate—Southern Italy) and implications for the identification of seismogenic structures. Tectonophysics 2007, 436, 9–35. [Google Scholar] [CrossRef]
  29. Van Dijk, J.P. Late Neogene Fore-Arc Basin Evolution in the Calabrian Arc (central Mediterranean); Tectonic Sequence Stratigraphy and Dynamic Geohistory. Ph.D. Thesis, Faculteit Aardwetenschappen, Amsterdam, The Netherlands, 1992. [Google Scholar]
  30. Van Dijk, J.P.; Bello, M.; Brancaleoni, G.P.; Cantarella, G.; Costa, V.; Frixa, A.; Golfetto, F.; Merlini, S.; Riva, M.; Torricelli, S.; et al. A regional structural model for the northern sector of the Calabrian Arc (southern Italy). Tectonophysics 2000, 324, 267–320. [Google Scholar] [CrossRef]
  31. Faccenna, C.; Becker, T.W.; Lallemand, S.; Lagabrielle, Y.; Funiciello, F.; Piromallo, C. Subduction-triggered magmatic pulses: A new class of plumes? Earth Planet. Sci. Lett. 2010, 299, 54–68. [Google Scholar] [CrossRef]
  32. Prada, M.; Ranero, C.R.; Sallarès, V.; Grevemeyer, I.; de Franco, R.; Gervasi, A.; Zitellini, N. The structure of Mediterranean arcs: New insights from the Calabrian Arc subduction system. Earth Planet. Sci. Lett. 2020, 548, 116480. [Google Scholar] [CrossRef]
  33. D’Argenio, B.; Pescatore, T.S.; Scandone, P. Schema Geologico Dell’appennino Meridionale (Campania e Lucania); Accademia Nazionale dei Lincei: Rome, Italy, 1973. (In Italian) [Google Scholar]
  34. Carannante, G.; Graziano, R.; Ruberti, D.; Simone, L. Upper Cretaceous Temperate-Type Open Shelves from Northern (Sardinia) and Southern (Apennines-Apulia) Mesozoic Tethyan Margins. In Cool-Water Carbonates; James, N.P., Clarke, J.A.D., Eds.; SEPM Society for Sedimentary Geology: Tulsa, OK, USA, 1997. [Google Scholar] [CrossRef]
  35. Catalano, R.; Doglioni, C.; Merlini, S. On the mesozoic Ionian basin. Geophys. J. Int. 2001, 144, 49–64. [Google Scholar] [CrossRef]
  36. Mazzoli, S.; Barkham, S.; Cello, G.; Gambini, R.; Mattioni, L.; Shiner, P.; Tondi, E. Reconstruction of continental margin architecture deformed by the contraction of the Lagonegro Basin, southern Apennines, Italy. J. Geol. Soc. 2001, 158, 309–319. [Google Scholar] [CrossRef]
  37. Iannace, A.; Capuano, M.; Galluccio, L. “Dolomites and dolomites” in Mesozoic platform carbonates of the Southern Apennines: Geometric distribution, petrography and geochemistry. Palaeogeogr. Palaeoclimatol. Palaeoecol. 2011, 310, 324–339. [Google Scholar] [CrossRef]
  38. Vitale, S.; Ciarcia, S. The dismembering of the Adria platforms following the Late Cretaceous-Eocene abortive rift: A review of the tectono-stratigraphic record in the southern Apennines. Int. Geol. Rev. 2022, 64, 2866–2889. [Google Scholar] [CrossRef]
  39. Malinverno, A.; Ryan, W.B. Extension in the Tyrrhenian Sea and shortening in the Apennines as result of arc migration driven by sinking of the lithosphere. Tectonics 1986, 5, 227–245. [Google Scholar] [CrossRef]
  40. Doglioni, C. A proposal for the kinematic modelling of W-dipping subductions-possible applications to the Tyrrhenian-Apennines system. Terra Nova 1991, 3, 423–434. [Google Scholar] [CrossRef]
  41. Patacca, E.; Sartori, R.; Scandone, P. Tyrrhenian basin and Apenninic arcs: Kinematic relations since late Tortonian times. Mem. Della Soc. Geol. Ital. 1990, 45, 425–451. [Google Scholar]
  42. Scrocca, D.; Carminati, E.; Doglioni, C. Deep structure of the southern Apennines, Italy: Thin-skinned or thick-skinned? Tectonics 2005, 24, TC3005. [Google Scholar] [CrossRef]
  43. Scrocca, D.; Carminati, E.; Doglioni, C.; Marcantoni, D. Slab Retreat and Active Shortening along the Central-Northern Apennines. In Thrust Belts and Foreland Basins; Lacombe, O., Roure, F., Lavé, J., Vergés, J., Eds.; Frontiers in Earth Sciences; Springer: Berlin/Heidelberg, Germany, 2007. [Google Scholar] [CrossRef]
  44. Milia, A.; Torrente, M.M.; Iannace, P. Pliocene-Quaternary orogenic systems in central mediterranean: The Apulia-southern Apennines-Tyrrhenian Sea example. Tectonics 2017, 36, 1614–1632. [Google Scholar] [CrossRef]
  45. Patacca, E.; Scandone, P. Post-Tortonian mountain building in the Apennines. The role of the passive sinking of a relic lithospheric slab. Atti Convegni Lincei 1989, 80, 157–176. [Google Scholar]
  46. Del Ben, A.; Barnaba, C.; Taboga, A. Strike-slip systems as the main tectonic features in the Plio-Quaternary kinematics of the Calabrian Arc. Mar. Geophys. Res. 2008, 29, 1–12. [Google Scholar] [CrossRef]
  47. Ferranti, L.; Palano, M.; Cannavò, F.; Mazzella, M.E.; Oldow, J.S.; Gueguen, E.; Mattia, M.; Monaco, C. Rates of geodetic deformation across active faults in southern Italy. Tectonophysics 2014, 621, 101–122. [Google Scholar] [CrossRef]
  48. Rossi, S.; Sartori, R. A seismic reflection study of the external Calabrian Arc in the northern Ionian Sea (eastern Mediterranean). Mar. Geophys. Res. 1981, 4, 403–426. [Google Scholar] [CrossRef]
  49. Polonia, A.; Torelli, L.; Mussoni, P.; Gasperini, L.; Artoni, A.; Klaeschen, D. The Calabrian Arc subduction complex in the Ionian Sea: Regional architecture, active deformation, and seismic hazard. Tectonics 2011, 30, TC5018. [Google Scholar] [CrossRef]
  50. Maesano, F.E.; Volpi, V.; Civile, D.; Basili, R.; Conti, A.; Tiberti, M.M.; Accettella, D.; Conte, R.; Zgur, F.; Rossi, G. Active extension in a foreland trapped between two contractional chains: The South Apulia fault system (SAFS). Tectonics 2020, 39, e2020TC006116. [Google Scholar] [CrossRef]
  51. Civile, D.; Zecchin, M.; Tosi, L.; Da Lio, C.; Muto, F.; Sandron, D.; Affatato, A.; Accettella, D.; Mangano, G. The Petilia-Sosti Shear Zone (Calabrian Arc, southern Italy): An onshore-offshore regional active structure. Mar. Pet. Geol. 2022, 141, 105693. [Google Scholar] [CrossRef]
  52. Fiorentino, A.; Agate, M.; Battaglini, L.; Busetti, M.; Civile, D.; Crispini, L.; Dal Cin, M.; Del Ben, A.; D’Angelo, S.; Ferrante, V.; et al. Structural Map of Seas Surrounding Italy; ISPRA: Rome, Italy, 2025. [CrossRef]
  53. Basili, R.; Barba, S. Migration and shortening rates in the northern Apennines, Italy: Implications for seismic hazard. Terra Nova 2007, 19, 462–468. [Google Scholar] [CrossRef]
  54. Petricca, P.; Barba, S.; Carminati, E.; Doglioni, C.; Riguzzi, F. Graviquakes in italy. Tectonophysics 2015, 656, 202–214. [Google Scholar] [CrossRef]
  55. Chiaribba, C.; De Gori, P. The seismogenic thickness in Italy: Constraints on potential magnitude and seismic hazard. Terra Nova 2016, 28, 402–408. [Google Scholar] [CrossRef]
  56. Ceramicola, S.; Praeg, D.; Cova, A.; Loher, M.; Bohrmann, G.; Mascle, J. Mud volcanoes and seafloor fluid seepage on the Calabrian accretionary prism (Ionian Sea). Mem. Descr. Carta Geol. D’italia 2022, 150, 77–83. Available online: https://hal.science/hal-03551598v1/document (accessed on 27 January 2026).
  57. Servizio Geologico d’Italia. Carta Geologica d’Italia Alla Scala 1:50.000, F. 508 Policoro; ISPRA: Rome, Italy, 2016. (In Italian) [CrossRef]
  58. Cilumbriello, A.; Sabato, L.; Tropeano, M. Note Illustrative Della Carta Geologica d’Italia Alla Scala 1: 50.000, F° 508" Policoro"; ISPRA: Rome, Italy, 2016. (In Italian) [CrossRef]
  59. Chiocci, F.L. The magic project: Genesis, implementation, and results. J. Maps 2025, 21, 2596316. [Google Scholar] [CrossRef]
  60. Gamberi, F.; Piacentini, T.; Miccadei, E.; Paglia, G.; Budillon, F.; Ceramicola, S.; Falese, F.G.; Orrù, P.E.; Chiocci, F.L. MAGIC Project collection–Marine Geohazards along the Italian Coasts. J. Maps 2025, 21, 2593962. [Google Scholar] [CrossRef]
  61. Van Wagoner, J.C.; Posamentier, H.W.; Mitchum, R.M.; Vail, P.R.; Sarg, J.F.; Loutit, T.S.; Hardenbol, J. An overview of the fundamentals of sequence stratigraphy and key definitions. In SEPM Special Publication Sea-Level Changes: An Integrated Approach; Society of Economic Paleontologists and Mineralogists: Tulsa, OK, USA, 1988; Volume 42. [Google Scholar] [CrossRef]
  62. Catuneanu, O.; Abreu, V.; Bhattacharya, J.P.; Blum, M.D.; Dalrymple, R.W.; Eriksson, P.G.; Fielding, C.R.; Fisher, W.L.; Galloway, W.E.; Gigling, M.R.; et al. Towards the standardization of sequence stratigraphy. Earth-Sci. Rev. 2009, 92, 1–33. [Google Scholar] [CrossRef]
  63. Zecchin, M.; Catuneanu, O. High-resolution sequence stratigraphy of clastic shelves I: Units and bounding surfaces. Mar. Pet. Geol. 2013, 39, 1–25. [Google Scholar] [CrossRef]
  64. Zecchin, M.; Catuneanu, O.; Caffau, M. Wave-ravinement surfaces: Classification and key characteristics. Earth-Sci. Rev. 2019, 188, 210–239. [Google Scholar] [CrossRef]
  65. Catuneanu, O. Model-independent sequence stratigraphy. Earth-Sci. Rev. 2019, 188, 312–388. [Google Scholar] [CrossRef]
  66. European Space Agency (ESA). EGNOS: The European Geostationary Navigation Overlay System–A Cornerstone of Galileo (ESA SP-1303); ESA Publications Division (ESTEC): Noordwijk, The Netherlands, 2006; ISBN 92-9092-453-5. Available online: https://www.esa.int/esapub/sp/sp1303/sp1303toc.pdf (accessed on 23 February 2026).
  67. Waelbroeck, C.; Labeyrie, L.; Michel, E.; Duplessy, J.C.; Mcmanus, J.F.; Lambeck, K.; Balbon, E.; Labracherie, M. Sea-level and deep water temperature changes derived from benthic foraminifera isotopic records. Quat. Sci. Rev. 2002, 21, 295–305. [Google Scholar] [CrossRef]
  68. Trincardi, F.; Cattaneo, A.; Correggiari, A.; Ridente, D. Evidence of soft sediment deformation, fluid escape, sediment failure and regional weak layers within the late Quaternary mud deposits of the Adriatic Sea. Mar. Geol. 2004, 213, 91–119. [Google Scholar] [CrossRef]
  69. Sultan, N.; Cochonat, P.; Canals, M.; Cattaneo, A.; Dennielou, B.; Haflidason, H.; Laberg, J.S.; Long, D.; Mienert, J.; Trincardi, F.; et al. Triggering mechanisms of slope instability processes and sediment failures on continental margins: A geotechnical approach. Mar. Geol. 2004, 213, 291–321. [Google Scholar] [CrossRef]
  70. Rohling, E.J.; Foster, G.L.; Grant, K.M.; Marino, G.; Roberts, A.P.; Tamisiea, M.E.; Williams, F. Sea-level and deep-sea-temperature variability over the past 5.3 million years. Nature 2014, 508, 477–482. [Google Scholar] [CrossRef]
  71. Ceramicola, S.; Cova, A.; Forlin, E.; Markezic, N.; Mangano, G.; Civile, D.; Zecchin, M.; Fanucci, F.; Colizza, E.; Corselli, C.; et al. Geohazard features of the Ionian Calabrian margin. J. Maps 2024, 20, 2349785. [Google Scholar] [CrossRef]
  72. Rebesco, M.; Neagu, R.C.; Cuppari, A.; Muto, F.; Accettella, D.; Dominici, R.; Cova, A.; Caburlotto, A. Morphobathymetric analysis and evidence of submarine mass movements in the western Gulf of Taranto (Calabria margin, Ionian Sea). Int. J. Earth Sci. 2009, 98, 791–805. [Google Scholar] [CrossRef]
  73. Meo, A.; Senatore, M.R. Late Pleistocene to Holocene Depositional Environments in Foredeep Basins: Coastal Plain Responses to Sea-Level and Tectonic Forcing—The Metaponto Area (Southern Italy). Geosciences 2026, 16, 5. [Google Scholar] [CrossRef]
  74. Ferranti, L.; Burrato, P.; Pepe, F.; Santoro, E.; Mazzella, M.E.; Morelli, D.; Passaro, S.; Vannucci, G. An active oblique-contractional belt at the transition between the Southern Apennines and Calabrian Arc: The Amendolara Ridge, Ionian Sea, Italy. Tectonics 2014, 33, 2169–2194. [Google Scholar] [CrossRef]
  75. Senatore, M.R. Comparazione tra i Depositi Plio-Pleistocenici del Bacino di Gallipoli (Golfo di Taranto) e la Successione Miocenica del Flysch di Faeto (Unità Irpine, Monti della Daunia): Confront tra l’avanfossa Attuale e Quella Miocenica Dell’appennino Meridionale (Italia). Ph.D. Dissertation, Consorzio Univ. Napoli e Palermo, Sede Consorziata Napoli, Napoli, Italy, 1988. (In Italian) [Google Scholar]
  76. Corrado, G.; Di Leo, P.; Gioia, D.; Schiattarella, M. The marine terrace staircase of the Metaponto coastal belt, southern Italy: From geomorphological mapping to uplift rate estimates revised. In Proceedings of the 10th International Conference on Geomorphology, Coimbra, Portugal, 12–16 September 2022. ICG2022-340. [Google Scholar] [CrossRef]
  77. Caputo, R.; Bianca, M. Morphological evidence of late Quaternary thrusting in the Bradanic Foredeep. Rend. Della Soc. Geol. Ital. 2005, 1, 75–76. [Google Scholar]
  78. Caputo, R.; Bianca, M.; D’Onofrio, R. Ionian marine terraces of southern Italy: Insights into the Quaternary tectonic evolution of the area. Tectonics 2010, 29, TC4005. [Google Scholar] [CrossRef]
  79. Gioia, D.; Corrado, G.; Amodio, A.M.; Schiattarella, M. Uplift rate calculation based on the comparison between marine terrace data and river profile analysis: A morphotectonic insight from the Ionian coastal belt of Basilicata, Italy. Geomorphology 2024, 447, 109030. [Google Scholar] [CrossRef]
Figure 3. (a) Morphostructural map of the northeastern Gulf of Taranto based on the 10 m multibeam bathymetric DTM. Bathymetric contours are shown at 20 m intervals. Red lineaments represent morpho-structural lineaments mapped from multibeam dataset (e.g., aligned scarps, slope breaks, and linear ridges/depressions) and are interpreted as potential morphological expressions of structural inheritance and/or shallow deformation. (b) Rose diagram showing the azimuthal distribution of mapped lineaments (statistics computed on lineament azimuths and weighted by lineament length). Dominant orientation sets are highlighted, with prevailing NE–SW and NW–SE trends.
Geosciences 16 00141 g003
Figure 4. High-resolution Sparker seismic profile Long 5 across the Taranto Canyon sector (location in Figure 1c). (a) Processed seismic section; the depths are related to the seafloor. (b) Interpreted section showing the main seismo-stratigraphic units (PtH, SNT, GRA, and CPL) and key bounding reflectors. Acoustically disturbed intervals within the PtH unit, expressed by chaotic to transparent facies and lens-shaped/tabular bodies with irregular basal surfaces, are interpreted as mass-transport deposits (MTDs). (c) Sub-vertical acoustic anomalies (zones of reduced amplitude/blanking and local loss of reflector continuity) are highlighted as fluid escape/acoustic anomaly facies.
Geosciences 16 00141 g004
Figure 5. High-resolution Sparker seismic profile Long 6 across the northeastern Gulf of Taranto slope (location in Figure 1c). (a) Processed seismic section; the depths are related to the seafloor. (b) Interpreted section highlighting the seismo-stratigraphic subdivision into PtH, SNT, GRA, and CPL units and associated reflector geometries. Chaotic to semitransparent bodies within PtH are interpreted as MTDs, showing disrupted internal reflections and irregular basal surfaces. (c) Sub-vertical acoustic anomalies characterized by acoustic blanking/attenuation and reduced reflector continuity are indicated as fluid escape/acoustic anomaly facies, locally extending toward the PtH–SNT boundary.
Geosciences 16 00141 g005
Figure 6. High-resolution Sparker seismic profile Long 7 imaging the outer shelf–upper slope transition in the northeastern Gulf of Taranto (location in Figure 1c). (a) Processed seismic section; the depths are related to the seafloor. (b) Interpreted section showing the distribution of PtH and SNT reflectors and the deeper carbonate units (GRA and CPL) where imaged. The PtH interval includes acoustically disturbed chaotic to transparent bodies interpreted as MTDs, particularly in proximity to slope breaks and canyon-related relief. (c) Sub-vertical acoustic anomalies (acoustic blanking/attenuation) are marked as fluid escape/acoustic anomaly facies.
Geosciences 16 00141 g006
Figure 7. Submarine channel network directional analysis by Strahler order in the study area. (a) Extracted submarine channel network draped on the shaded relief DTM (blue polylines). (bi) Channel segments grouped by Strahler order (first to eighth), shown together with a rose diagram summarizing the segment orientation distributions for each order. Rose diagrams report length-weighted frequencies of segment azimuths (i.e., weighted by segment length).
Geosciences 16 00141 g007
Table 1. Main characteristics of the seismic units identified in the study area. The table summarizes the stratigraphic attribution, internal seismic facies, reflector configuration, and estimated thicknesses expressed in two-way travel time (TWT; milliseconds) and meters. Depth conversion was performed using average acoustic velocities from [11]. Seismic facies classification follows the criteria from [62,63].
Seismic
Unit
Dominant Seismic
Facies
Internal
Configuration/
Geometry
Reflector Attributes (Amplitude/Continuity/Frequency)InterpretationEstimate Mean
Thickness
(ms TWT)
Estimated Thickness (m)
PtHPredominantly stratified package with interbedded acoustically disturbed bodies (chaotic to transparent) and local sub-vertical acoustic anomalies (blanking/attenuation columns)Laterally continuous layering with lens-shaped to tabular disturbed bodies (stacked/amalgamated locally); irregular basal surfaces; local truncations; vertical columns disrupting reflectorsMedium–high amplitude; generally high continuity; locally reduced amplitude/continuity within disturbed bodies and vertical anomalies; medium–high frequencyUppermost mixed shelf–upper slope succession with local remobilized sediment bodies and fluid escape indicators within the shallow stratigraphy~405~365
SNTLaterally persistent stratified package with minor disturbed intervals; overall more uniform than PtHParallel to sub-parallel reflectors; tabular geometry; gently dipping regional surfaces; locally subtle thickness changesModerate amplitude; high continuity; medium frequency; low proportion of chaotic/transparent faciesPredominantly fine-grained marine succession (hemipelagic/pelitic deposits)~55~60
GRAThin–moderate package defined by sharp high-amplitude top and internally layered reflectorsTabular to gently wedge-shaped where preserved; locally affected by minor deformation; commonly reduced internal resolutionHigh-amplitude top reflector; internal medium amplitude; moderate continuity; medium frequencyShallow marine carbonate (calcarenitic) unit/high-impedance carbonate layer~28~35
CPLHigh-impedance acoustic basement/low-resolution carbonate substrate; locally affected by multiples and limited penetrationMassive/indistinct acoustic basement; truncations; locally disrupted by steep discontinuities; penetration-limitedVery low to absent internal reflectivity; discontinuous to chaotic basement response; strong attenuation belowCompetent carbonate substratum (structural/acoustic basement in Sparker window)≥~280≥~420
Disclaimer/Publisher’s Note: The statements, opinions and data contained in all publications are solely those of the individual author(s) and contributor(s) and not of MDPI and/or the editor(s). MDPI and/or the editor(s) disclaim responsibility for any injury to people or property resulting from any ideas, methods, instructions or products referred to in the content.