Article

Marine Hydraulic Process Modelling Using SMC-Brasil on the Semi-Arid Brazilian Coast

by
Thiago Cavalcante Lins Silva
1,
Marco Túlio Mendonça Diniz
1,*,
Paulo Victor do Nascimento Araújo
2 and
Bruno Ferreira
3
1
Centre for Humanities, Literature and Arts, Federal University of Rio Grande do Norte, Natal 59078-970, Brazil
2
Federal Institute of Education, Science and Technology of Rio Grande do Norte, Macau 59500-000, Brazil
3
Institute of Geography, Development, and Environment, Federal University of Alagoas, Maceió 57072-900, Brazil
*
Author to whom correspondence should be addressed.
Geosciences 2025, 15(9), 344; https://doi.org/10.3390/geosciences15090344
Submission received: 17 June 2025 / Revised: 19 July 2025 / Accepted: 19 August 2025 / Published: 3 September 2025
(This article belongs to the Section Hydrogeology)

Abstract

Understanding coastal hydraulic processes is essential for sustainable coastal planning and management, especially in semi-arid regions where data scarcity represents a significant challenge. This study sought to apply the Brazilian Coastal Modelling System (SMC-Brasil) to analyse the coastal hydraulic processes present on the Brazilian semi-arid coast in Rio Grande do Norte, seeking to understand its boundary conditions given the scarcity of data and limited monitoring network. The methodological procedures followed five main stages: data collection and processing, running the models, statistical analysis, and interpretation of the results. The simulations identified wave propagation and dissipation patterns influenced by local bathymetric features such as sandy banks and submarine canyons. The modelling indicated waves with an average Hs50% of 1.14 m, with dominant directions from ENE to ESE. Longitudinal flows ranged from 1 to 8 m3/h, with a predominance of east to west at medium and high tides. The modelling indicated spatial gradients of energy and sediment transport compatible with historical records and field observations. The results show that submerged relief irregularities play a central role in regional coastal dynamics, conditioning current flows and deposition. The application of SMC-Brasil has shown potential to fill monitoring gaps in regions with low infrastructure, offering affordable and effective technical support for adaptive coastal planning in the face of climate change impacts.

1. Introduction

Coastal zones are places where multiple processes take place, which in their propagation end up making these areas very dynamic and consequently vulnerable in comparison to continental environments. In large countries such as Brazil, which has a coastline approximately 9200 km long [1], understanding its modelling dynamics is essential for coastal planning, especially when it comes to understanding the processes and their impacts on coastal populations, given that approximately 26% of the Brazilian population lives on its coast [2].
Despite this, the country currently lacks a qualified, up-to-date and adequate monitoring network for its territorial extensions to record coastal variables such as wave patterns, tidal ranges, and the percentage of transport of up-to-date sediments, as well as the identification of extreme events. The existing network is restricted to the state capitals and some harbours, in some cases using data that are 2 to 3 decades out of date, adjusted to a predictive harmonic model, carried out by the Directorate of Hydrography and Navigation—DHN [3].
The lack of structure limits the ability to characterise and predict local hydraulic processes, while at the same time restricting the capacity of public authorities to respond, especially in regions with physical and social vulnerability such as the Brazilian semi-arid coast, especially on the northern coast of the state of Rio Grande do Norte, where recurrent processes of erosion, flooding, and shoreline retreat have been reported [4,5,6,7].
In this scenario, tools capable of integrating different databases and carrying out representative predictive simulations have become essential, specifically those aimed at modelling.
Marine wave modelling evolved significantly in recent decades, moving from simplified, deterministic methods to third-generation spectral schemes capable of simulating more accurately the processes of wave generation, propagation, refraction, dissipation, and interaction in coastal and oceanic environments [8,9,10,11,12,13]. Models such as Simulating Waves Nearshore (SWAN) are often applied in coastal areas, with high demands on spatial and temporal resolution, and obtain excellent results. The same is true of other models such as WAM [8] and WA-VEWATCH III [9], which have been very useful in obtaining time series and sampling data, which supplied empirical and semi-empirical mathematical systems.
Semi-empirical systems such as SMC-Spain and SMC-Brasil emerged as adapted solutions for contexts with limited in situ data, using derivations of global climatological data, combining statistical representations and simplified physical modules aimed at regional analysis and support for coastal management [14,15]. The Coastal Modelling System (SMC), developed by the Hydraulic Institute of Cantabria—IH-Cantabria and adapted to the Brazilian context, is an alternative. The premise of SMC-Brasil is to assist coastal management, and the planning of actions related to the coast when generating data. It consists of a set of computer models that simulate coastal processes and provide valuable information for decision-making [8].
The system enables analyses of marine dynamics based on the coupling of hydrodynamic and morphodynamic models, using reanalysis products and validated global data to simulate wave propagation, analyse the effect of tides, and calculate longitudinal transport and the evolution of the coastline [15]. Its application has already been demonstrated in different regions of the country, such as studies on the coasts of the states of Santa Catarina [16], Sergipe [17], Pernambuco [18], Rio de Janeiro [19], and the east coast of Rio Grande do Norte [20], demonstrating its usefulness in analyses of the Brazilian coast.
It is important to mention that the use of SMC-Brasil in studies on a regional or even local scale requires some attention and a series of precautions, especially with regard to the resolution of the input data, the simplifications in the semi-empirical models, and the low availability of data for calibration, factors that can compromise the accuracy of the results and/or generate unexpected results. Even so, these limitations are common in applications of numerical models of various kinds, since even the best model will not be able to fully reflect reality, especially in coastal environments, given their complexity. Brazil’s semi-arid coast is a clear example of this difficulty in accessing data of the right density and quality for analyses. With its low river sediment supply, seasonally wind-driven wave regime, and irregular coastal interactions with estuarine environments [7,21,22,23], the region requires modelling approaches that can address both large-scale oceanographic forcing and small-scale coastal responses.
The relevance of modelling hydraulic processes on the Brazilian semi-arid coast lies in the recurrence of extreme events and the observed coastal retreat, which impact both the coastal environment and human activities. Araújo et al. [6], Aguiar et al. [4], and Rabelo et al. [24] highlight the worsening of erosion processes and flood risks in these areas in recent years, citing extreme events, which with the scenario projected by the IPCC 2022 [25], could intensify, including unfavourable developments without adequate predictive and monitoring tools. Regional models, even when based on semi-empirical tools such as SMC-Brasil, can offer a useful first level of understanding for managers and stakeholders, especially in contexts such as the study area where municipalities have limited management links.
Faced with the challenges posed by the scarcity of data and the complexity of coastal processes in semi-arid tropical regions, it is worth asking some questions, specifically to what extent models, such as SMC-Brasil, serve to represent regional dynamics at intermediate scales, such as 1:50,000, and what impact they have. One of the hypotheses guiding this research is that bottom morphological features, such as channels, platforms, and sandbanks, play a relevant role in the dynamics of coastal circulation, interfering with wave propagation and sediment transport, redirecting flows and deposition vectors. In addition, another hypothesis is that depositional processes may be related to the orientation of the coastline, tending to develop barrier-type features more frequently in stretches in the W-E direction and presenting greater stability in others. If confirmed, these hypotheses could suggest a pattern or direct relationship between exposure, coastal direction, and sedimentary configuration, the identification of which could be made possible through numerical simulations, which could prove the potential for analysing the SMC-Brasil.
The originality of this study lies in the regional application of the model in areas of low monitoring density, with limited continuity, using a methodological approach adapted to the regional scenario, adopting qualitative validation based on remote sensing and the state of the art on the subject.
Given this scenario, the main objective of this study is to apply SMC-Brasil to the Brazilian semi-arid coast, especially the northern coast of Rio Grande do Norte, with the aim of understanding the propagation and dynamics of the main marine hydraulic processes and evaluating the system’s ability to represent regional dynamics. To this end, the study aims to accomplish the following: (i) to verify the influence of submerged features on wave propagation; (ii) to identify local hydrodynamic forces; (iii) to evaluate the resolution and sensitivity of SMC-Brasil on a regional scale; and (iv) to discuss implications for coastal management. Overall, the work aims to advance hydrodynamic modelling in semi-arid tropical regions with limited data, strengthening instruments for public policy decision-making.

2. Materials and Methods

2.1. Study Area

The study area is located on the northern coast of the state of Rio Grande do Norte, covering the mouths of the Piranhas-Açu and Apodi-Mossoró rivers, two of the region’s main hydrographic systems. The coastal sector analysed is approximately 140 km (139,531 m) long, with a general orientation of convex curvature and an average azimuth of 67° to geographic north. The total delimited area covers around 2574 km2 and has a perimeter of 296 km. This area includes the municipalities of Porto do Mangue, Grossos, Tibau, Macau, and Areia Branca (Figure 1).
The stretch analysed has significant sinuosity, surrounded by various deltaic formations and the high salinity of its watercourses, which internalise due to the low amplitude of the coast, combined with the minimum flow of ephemeral and intermittent rivers, forming drowned estuaries, which facilitates salt production, one of the main activities in the region [26]. The area is still occupied by mangroves, tidal flats, mobile dunes, and urbanised sectors, all strongly conditioned by local hydrodynamic processes.
The predominant climate in the area is tropical equatorial, of the semi-arid subtype [27], with irregular rainfall distribution throughout the year. Rainfall is mainly concentrated between summer and autumn (February to May), and the rest of the year is characterised by a long dry season of around eight months. Average annual rainfall is less than 800 mm with average potential evapotranspiration of over 2000 mm per year [28], which intensifies the semi-arid condition. The scarcity of rainfall generates hypersalinity in the estuaries, making salt production possible.
Preliminarily, it was observed that the area has a semi-diurnal meso-tidal regime with an average tidal variation of approximately 2.66 metres, which varies throughout the year; in spring they can reach 2.85 metres [29]. The hydrodynamic processes are influenced by north-easterly waves of between 10 and 80 cm and periods of between 4 and 8 s [30,31], the main hydraulic factor being the action of the tides, which have a direct influence on the modelling of the coast.
The study area is set in a context of low-lying coastlines, which represent only around 2% of the global land surface and are home to approximately 11% of the world’s population, making it naturally vulnerable to coastal flooding and rising sea levels [32]. In areas such as these, flooding during exceptional tides is relatively common due to a combination of extreme events and inadequate drainage infrastructure [4,5].

2.2. Methodology

The methodological procedures of this study were carried out in five specific stages, structured sequentially: (I) general surveys, which involved collecting and organising bibliographic information and topobathymetric data; (II) data processing, which consisted of preparing and adjusting the compatibility of the bases to the SMC; (III) running the models and extracting statistical parameters, carried out using SMC-Brasil; and (IV) interpreting the results based on the related bibliography and field observations; and finally the construction and final writing of the study.

2.2.1. General Survey (I)

Initially, the survey enabled bibliographical research, where studies dealing with coastal dynamics and hydraulic processes in the study area were gathered and organised. Additionally collected were publications that addressed the functioning, applications, and potential of the SMC-Brasil, contributions that were the main scientific direction of this work.
With regard to the data, local topobathymetric information was captured in order to improve the model’s response, as well as the accuracy of this data. Since the standard topobathymetric data set provided by SMC-Brasil comes from Brazilian Navy nautical charts [33] obtained indirectly, although useful for large-scale evaluations, it has limitations in terms of accuracy and distribution, which often leads to unexpected results that are far from reality due to the low refinement of the data when intended for local or regional analysis.
The captured sets were replaced by a combination of altimetric data from the Copernicus Digital Elevation Model (GLO-30), a global digital elevation model based on WorldDEM with a spatial resolution of 30 m and distributed by the European Space Agency (ESA), calibrated by local geodetic level references in a process similar to Araújo et al. [34], and then resampled to 90 metres of resolution. This information was combined with data obtained by an acoustic doppler current profiler, ADCP, compiled by Gomes and Vital [35], and also calibrated by level references. These data were originally prepared at varying spatial resolutions, generally between 30 and 100 metres. For the purposes of this study, the set was resampled to a resolution of 90 metres in order to balance the model’s computational performance with the need to capture relevant morphological features.

2.2.2. Data Processing (II)

The bibliographic information was organised and processed, generating an up-to-date bibliographic review and supporting the discussion of the results achieved. The topobathymetric data were harmonised and entered into the SMC-Brasil environment, with the three-dimensional values adjusted to the depth standard, interpolation, and area adjustment, with a view to texturing and the appropriate limits for the proposed study.
The final bathymetric data after harmonisation showed detailed aspects, as can be seen in Figure 2, with a significant improvement in the bottom morphologies when compared to the standard SMC-Brasil data, the bathymetry and nautical charts of the coast (BACO), where there is excessive smoothing in shallow areas due to the interpolation of widely spaced datum points. The absence of complementary bathymetric data contributes to distortions in the propagation of simulated cases, generating underestimated or overestimated values, so detailed bathymetry improves the quality of the products.

2.2.3. Running the Models (III)

The full modelling was carried out in SMC-Brasil, a software program that integrates semi-empirical models, which relate simplified physical equations with empirical data (observational or statistical) to simulate environmental processes, with structured mesh inputs, adjusted in a sequential execution process. There is coupling between waves and currents occurring in a punctual way on detailed grids.
In general, physical processes are modelled by combining a series of tide gauge data with tidal and wave data applied to physical–mathematical equations. Wave propagation is simulated in the OLUCA module using a parabolic model for monochromatic waves. Currents induced by breaking waves are modelled in the COPLA module, based on the physical formulation proposed by Longuet-Higgins and Stewart [36] applied to the grid of generated waves. Finally, sediment transport is propagated by the EROS module using a beach evolution model, based on the sequential chain developed by Soulsby [37], using subsequent data.
Current modelling is carried out by calculating the water gradients from wave simulations, coupled with hydrodynamic models, to generate the simulated products of wave–current interactions. In turn, sediment transport is calculated from longitudinal flows using the wave field and induced currents obtained, thus generating total transport, which is the sum of suspended transport and bottom transport using Soulsby’s formulations [37].
The boundary conditions used in the modelling were provided by the downscaled ocean waves (DOW) point, derived from downscaling the global ocean waves (GOW) data developed by Reguero et al. [38] to coastal waters using the SWAN model [39]. The database is pre-installed at SMC-Brasil with data available from 1948 to 2008, so representative percentiles were used (50%, 90% and extremes) as defined by Camus, Mendez, and Medina [40]. In addition, global ocean surge (GOS) data were also used, derived from the ROMS model with meteorological tide time series over 60 years (1948–2008), and global ocean tides (GOT), from the TPXO model and satellite levels, made up of astronomical tide data over the same time interval as the previous one.
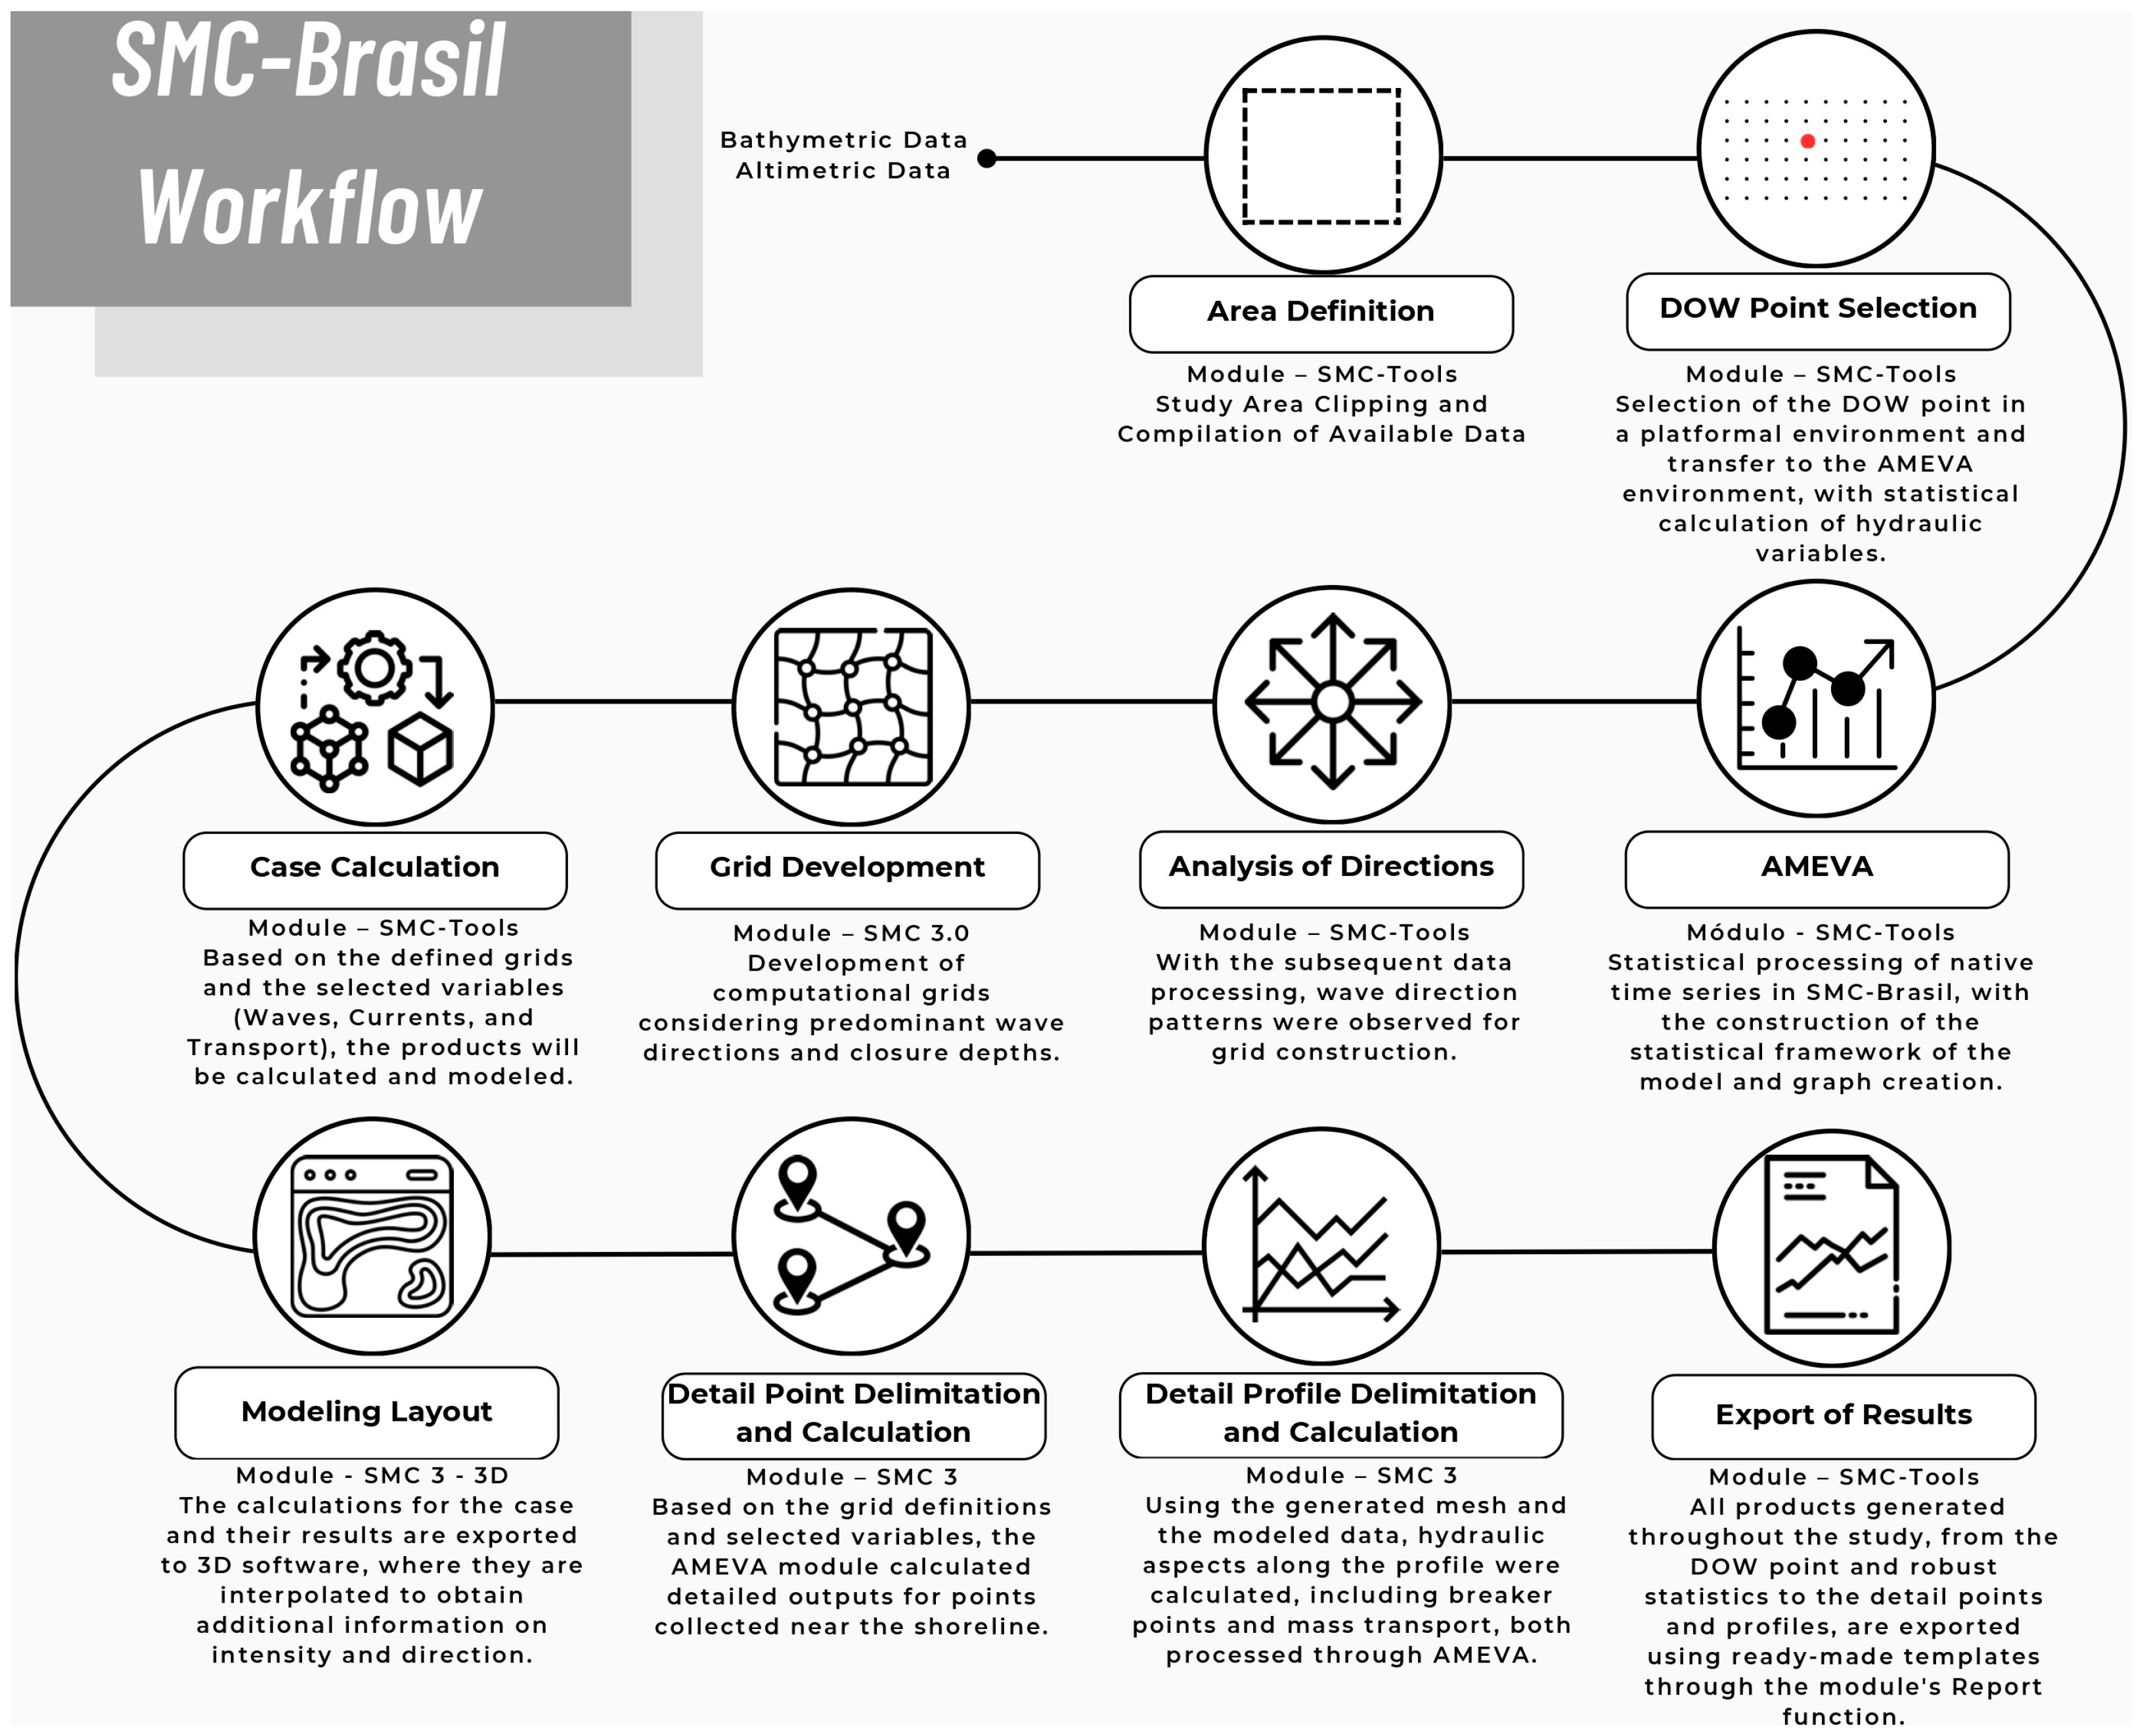
The models were run in ten different stages, following the standard flow of data processing and model execution: 1—delimitation of the modelling area; 2—choice of the DOW point; 3—module of mathematical and statistical analysis of environmental variables (AMEVA); 4—analysis of the propagation directions; 5—preparation of the meshes; 6—calculation of the cases; 7—layout of the models; 8—delimitation of the detail points and calculation; 9—delimitation of the break profiles and calculation; and 10—reporting of the results, stages described in Figure 3.
The steps carried out strictly followed the manuals and procedures enshrined in the tool [41], as well as its theoretical framework, which can be found in renowned national studies that used the tool to generate data [6,15,16,17,18,19,20,42,43,44,45,46,47,48], as well as in international studies [14,15,49,50,51,52,53,54]. The series of studies cited, which provided the basis for the procedures adopted, made use of practically all the stages of the workflow to obtain the hydraulic variables, whether they were statistical or the propagation mesh itself.
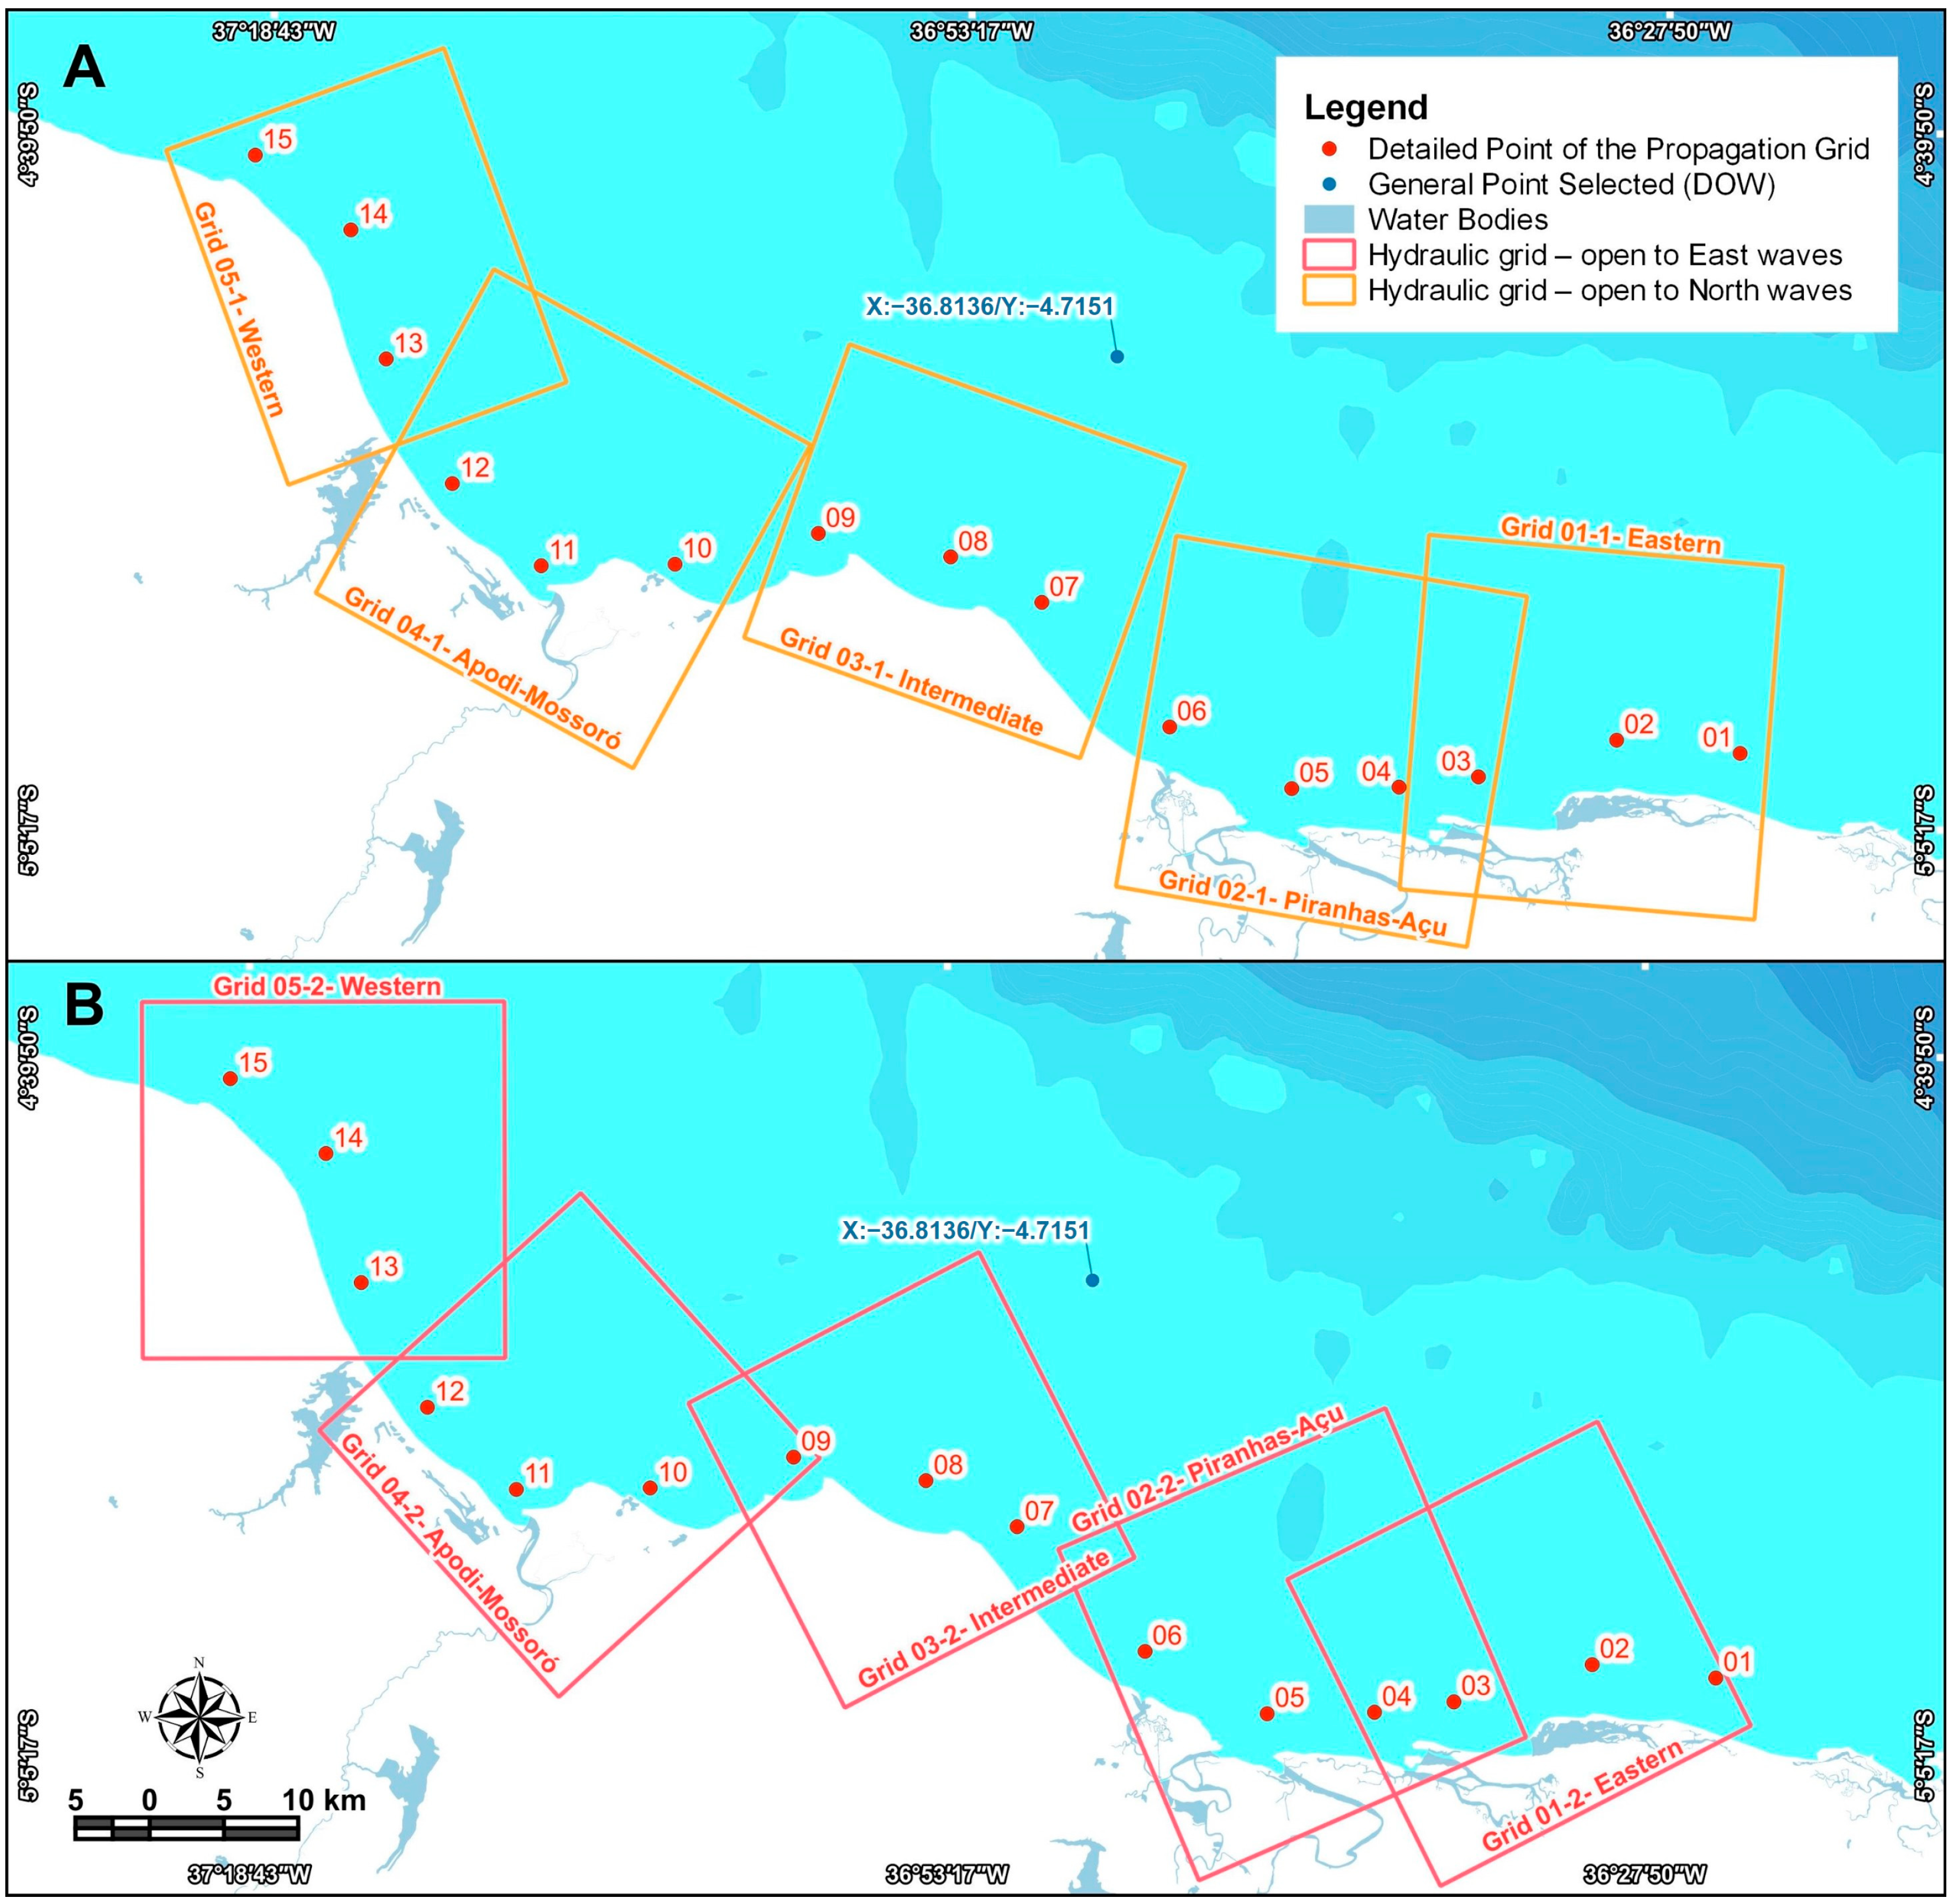
The choice of sampling area respected the study area, as well as the downscaled ocean waves (DOW) point, data extracted from the SWAN numerical model [10] pre-installed at SMC-Brasil, located in the middle portion of the area at a depth of 20 metres 50 km from the coast (Figure 4). In order to cover the entire area, 10 specific grids were drawn up, with an opening in the nor-northeast to east direction orientated to the local wave trend measured by AMEVA, a module for the statistical mathematical analysis of environmental variables, which had an average size of 25 × 25 km covering the land–ocean interface.
The subdivision into 10 grids was necessary in order to analyse the contexts in detail, as well as to respect the angular limitation of the OLUCA model (±45°), considering the angular difference between the grid and the incident propagation vector, so as not to exceed the limits of the quadrants under analysis; thus the grids are necessary to respect the physics of the model. In this sense, two grids were built for each context, both designed to correctly propagate the main related wave spectra, from north to east, and are therefore essential for understanding the processes. The technical details of each mesh are shown in Table 1.
In the grid environment, several cases with high probabilities of occurrence were propagated, following the recommendations for choosing cases proposed by Camus, Mendez, and Medina [40], co-opted through the historical series present in the pre-installed SMC-Brasil database (DOW, GOS, and GOT). For the simulations, standardised sea states were used between the grids in order to make a regional comparison in a common process. Thus, the patterns defined were associated with a medium or dominant regime with typically seasonal conditions with Hs values between 1 and 1.2 m and Tp between 7 and 9 s, obtained from the statistical analysis.
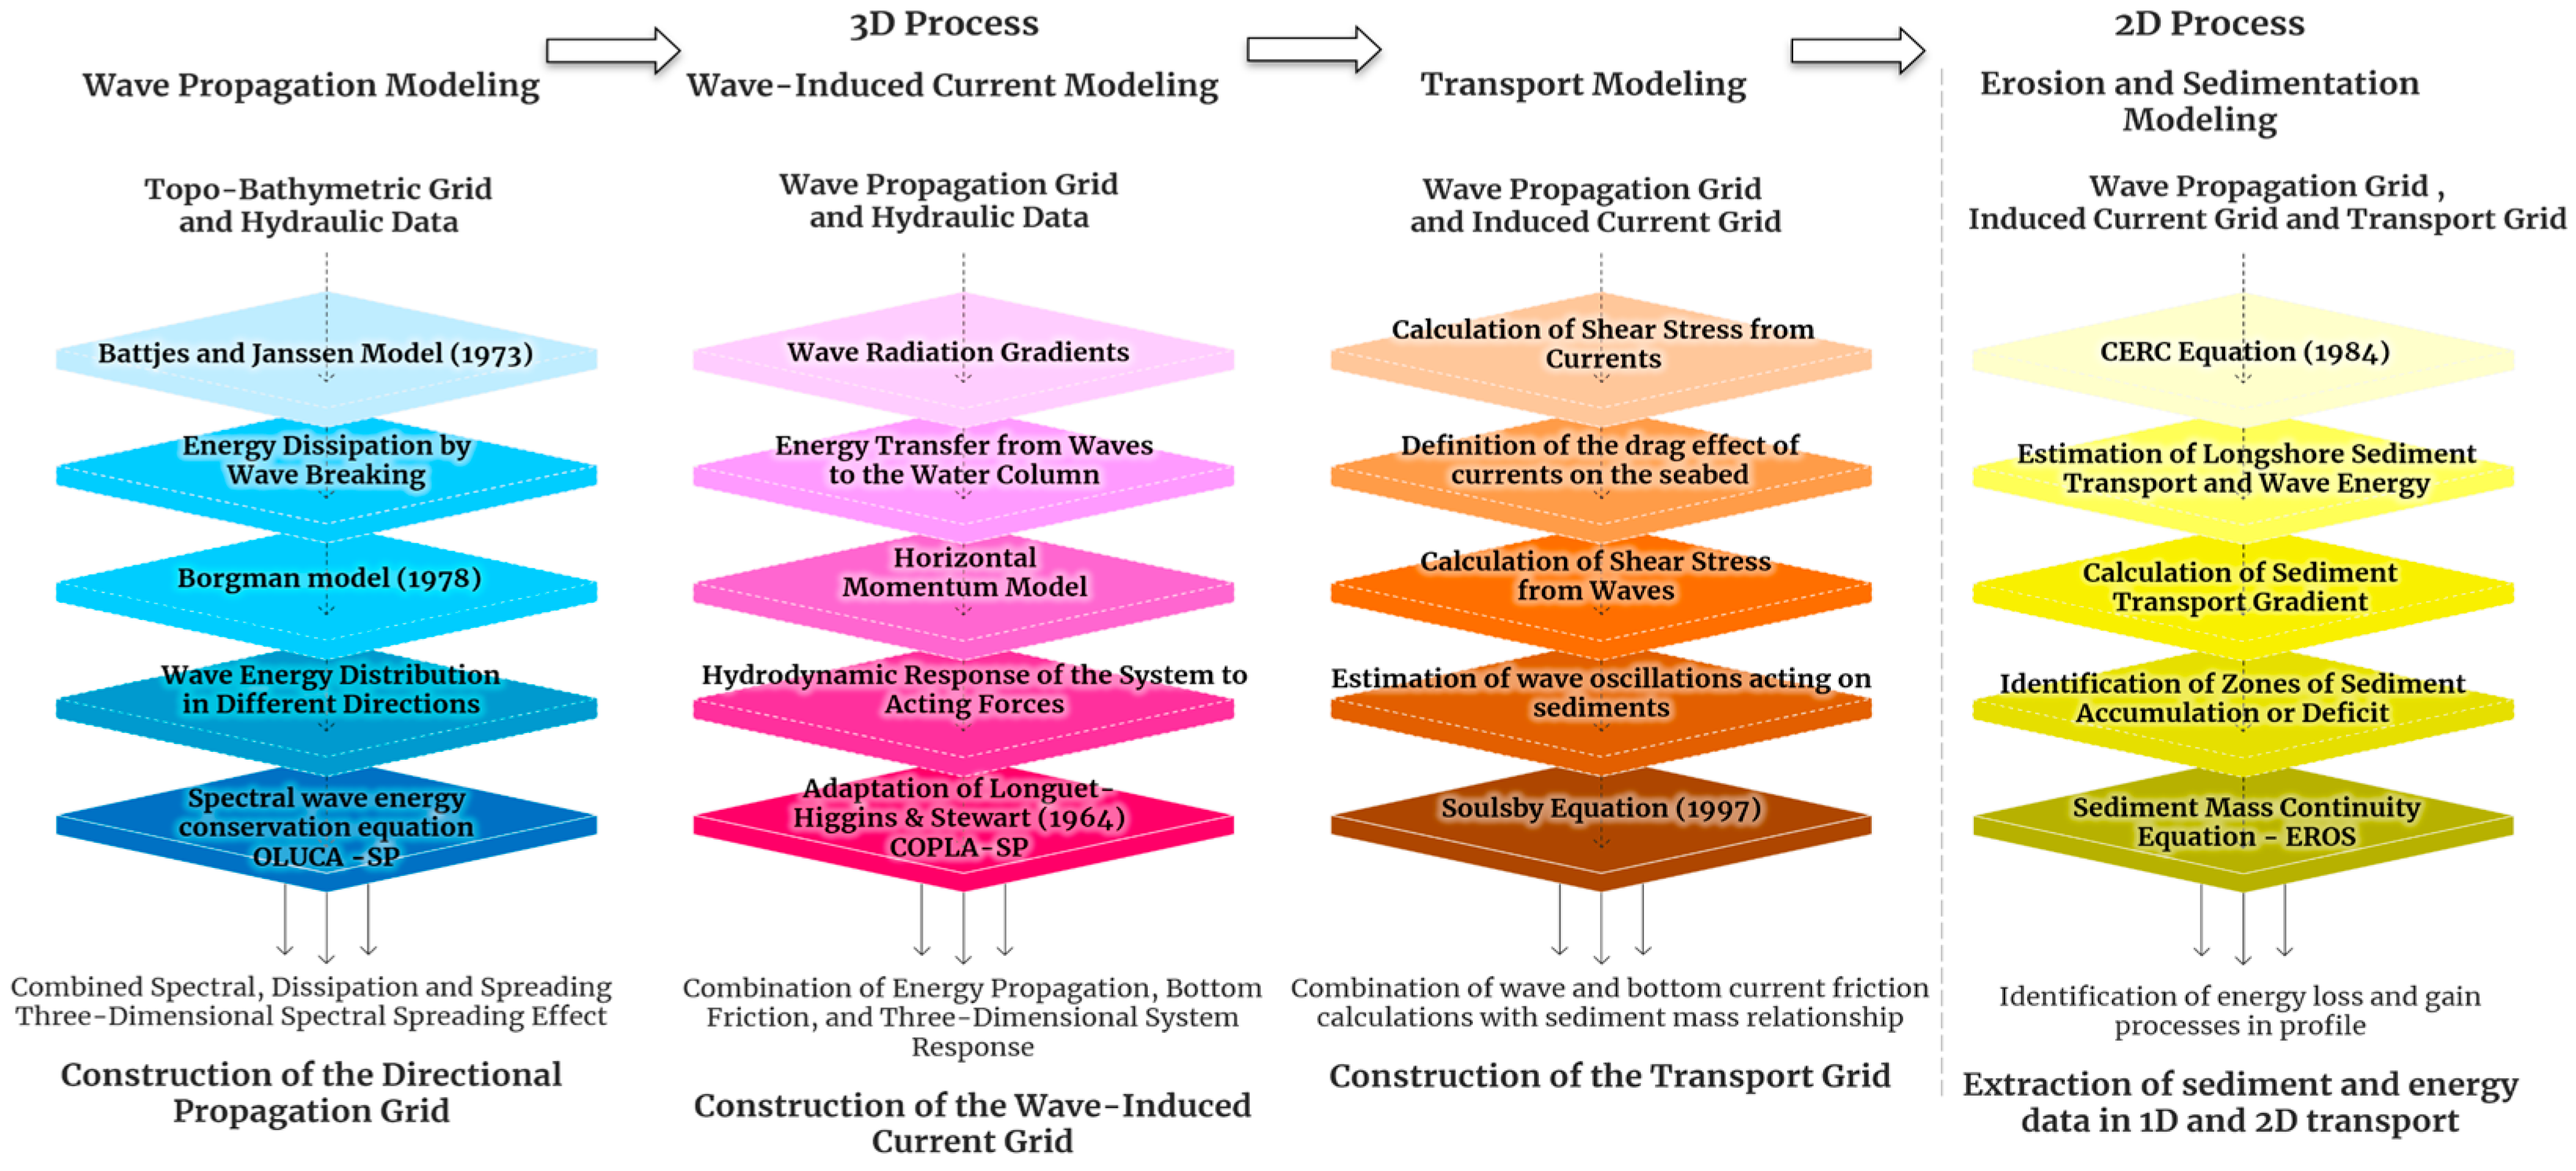
The simulations propagated the directions and patterns of the following: waves, induced currents, sediment transport, and erosion/sedimentation processes in profile, all adjusted to the stages and models described in the (Figure 5), to arrive at the final modelling. Using the propagations, it was possible to calculate the detailed parameters at 15 points along the study area, which enabled a detailed analysis.
The cases were simulated and interpreted from three tidal perspectives: low tides (obtained from the average of the minimum tides), medium tides (obtained from the average of the time series), and high tides (average of the maximum tides), where the propagation respected the same sea state parameters defined in all the context grids. In order to make a complete comparison between the modelled scenarios, understanding the dynamics of the advance and retreat of the waterline in the region is necessary.

2.2.4. Interpretation of Results (IV)

In interpreting the results, a detailed analysis was made of the products generated by the hydrodynamic models, making a direct comparison between the patterns generated in the simulation and the concrete reality of the region.
The following were used: orbital sensor data from the LandSat 2, 5, 6, 7, and 8 series, resampled to 60 metres of resolution, with subsequent plundering through pixel statistics carried out in Google Earth Engine, obtaining the surface variability or resistance index; high-resolution Google Earth Pro images corrected and georeferenced in the QGIS 3.22 environment; and field visits for findings and correlations.
These data were compared to bibliographic references, allowing us to read about the model’s assertiveness in identifying processes already found in the field, as predicted in other works, in an attempt to validate the relevance of the proposed regional analysis.

3. Results

The SMC-Brasil has its propagations linked to a DOW point in a marine platform environment. With this in mind, the results presented below show the evaluations obtained on the platform (depth above 20 m) and later in the detailed analyses (study area sectored), which made it possible to verify part of the marine processes in the open sea and in detail, identifying the wave climate, the probability of breaking, the refraction pattern, currents, and sediment transport.
Therefore, the coastal dynamics on the Platform and in the area studied will be presented below.

3.1. Marine Dynamics on the Continental Shelf

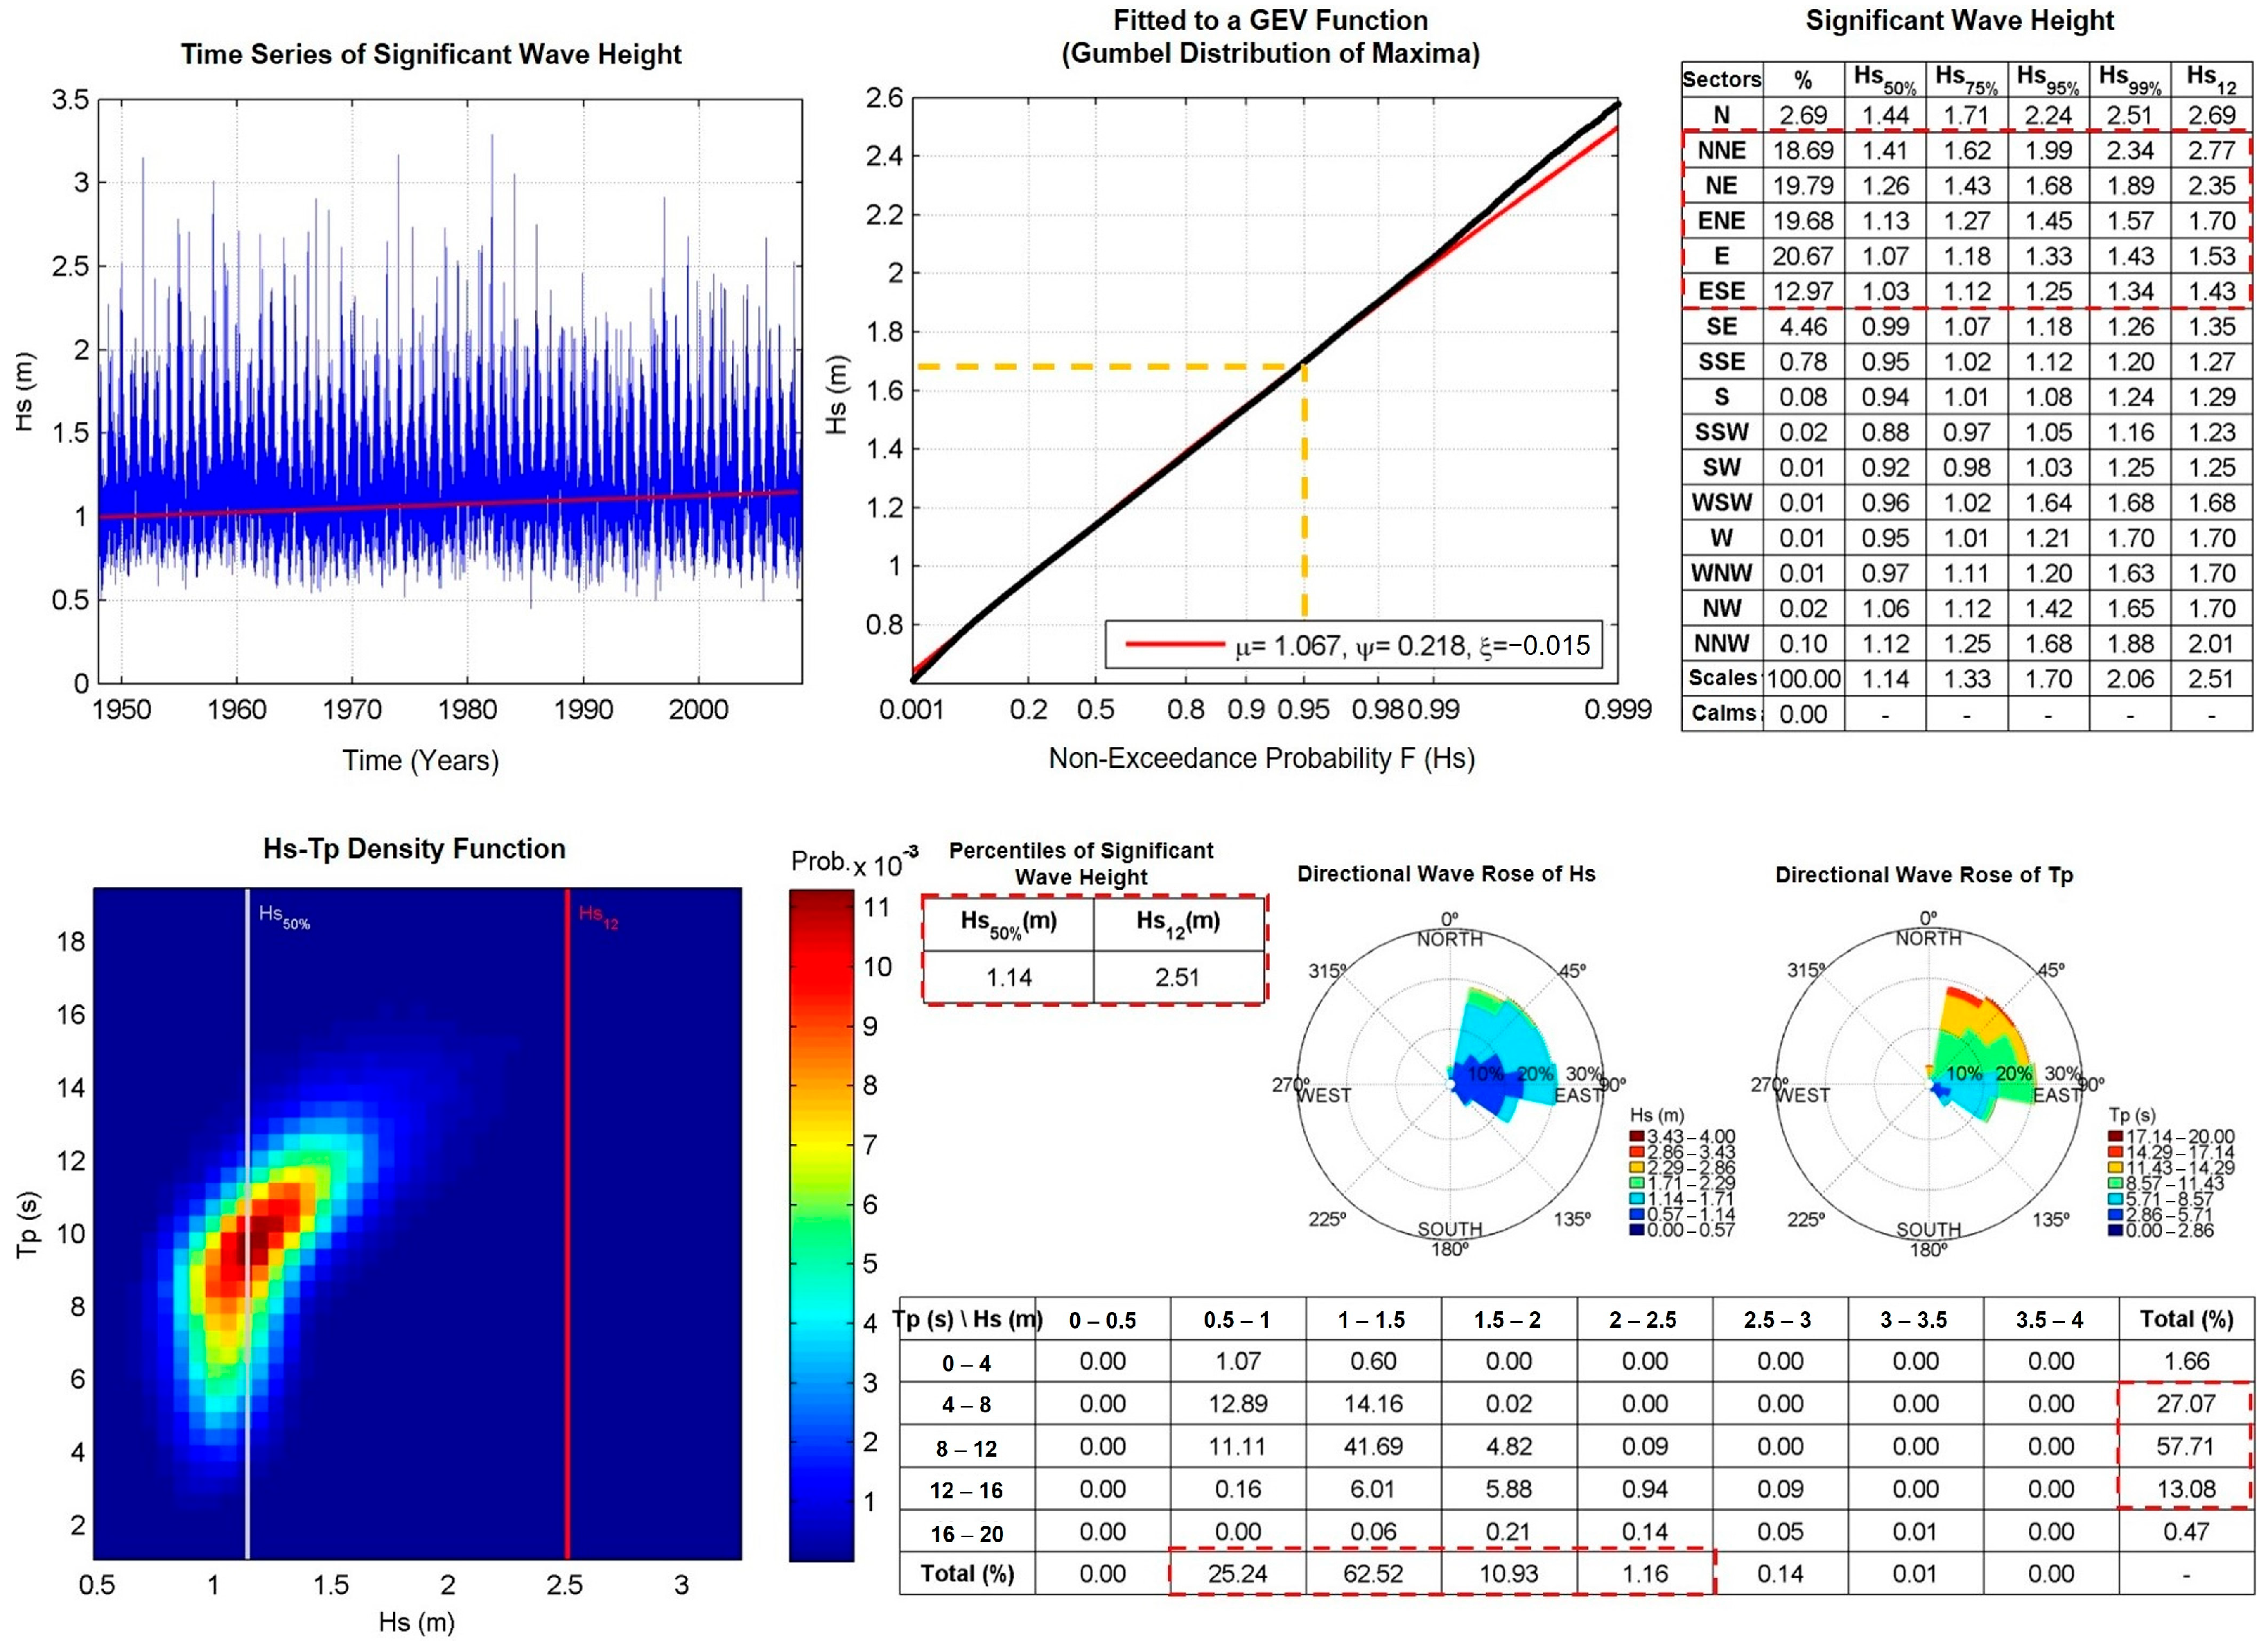
From a temporal point of view, the significant wave heights (Hs) varied between 0.57 m and 2.30 m in the period between 1948 and 2008, however, 78.62% of the records showed Hs of less than 1.4 m. The Hs50% value, representing the average sea state with a 50% probability of occurrence, was 1.14 m, while the Hs12%, associated with storm conditions with a probability of less than 1%, reached 2.51 m.
The wave analysis identified four predominant wave propagation directions: NNE, NE, ENE, and, above all, E, which corresponds to around 20 percent of all the wave patterns recorded at the sampled point. Despite being the most frequent direction, easterly waves have lower relative energy, with significant heights (Hs) of up to 1.07 metres and peak periods (Tp) of up to 9 s. The NNE and NE directions, on the other hand, although not very frequent on the coast, showed greater wave energy, with Hs above 1.20 m and Tp between 11 and 13 s (Figure 6). In general, the GEV distribution indicates a non-exceedance value of 1.70 m for Hs, with a probability of 95%, which is in line with the elevations in 98.69% of the records, presenting a context of wave heights already found on the Rio Grande do Norte continental shelf, as verified by Pinheiro et al. [56] and Pinheiro et al. [57].
The peak period (Tp) varied between 5 and 13 s in 97.86% of the cases, where 85.41% of the records had Tp of less than 11 s. The joint Hs-Tp analysis (Figure 6) indicated that the most frequent waves have Hs between 1.4 and 1.6 m, with a probability of 80% occurrence, and Tp between 7 s and 11 s in around 70% of recurrences. There was also a higher incidence of storm waves in the intervals close to Hs of 2.91 m, with periods between 14 s and 16 s, but the probability of occurrence is less than 1%.
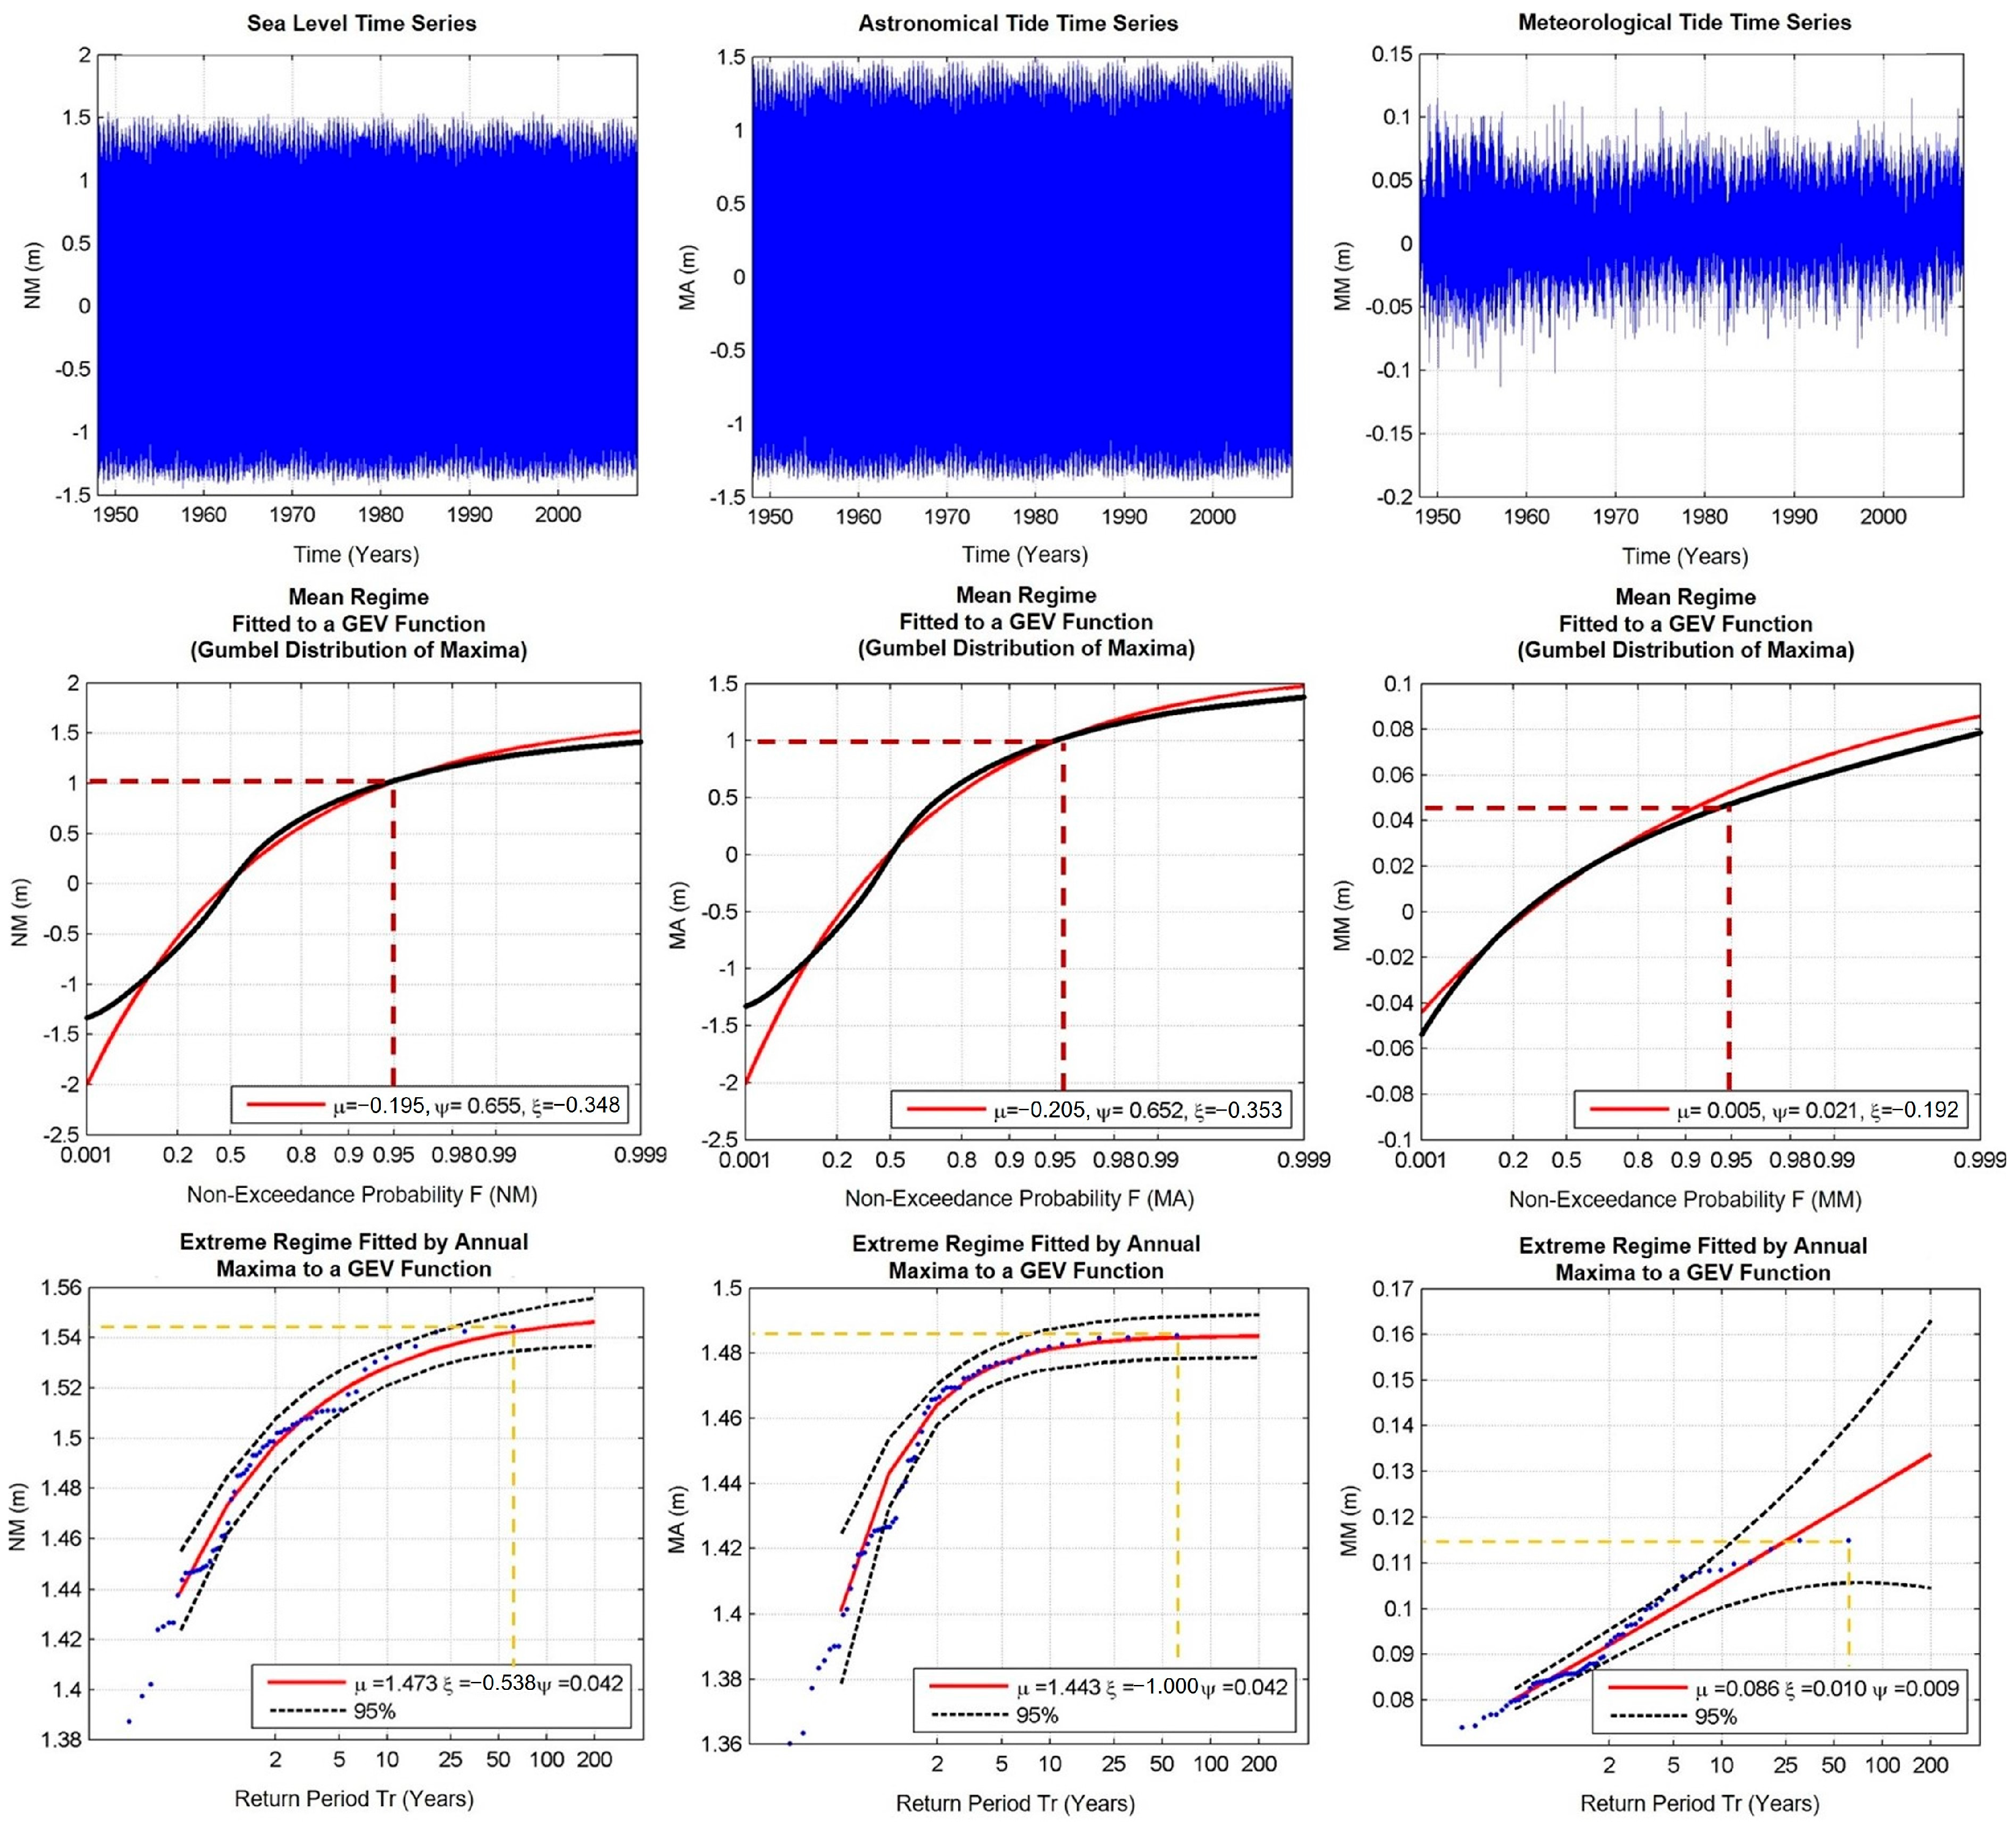
With regard to maritime fluctuations not related to waves, the area has tide levels with average oscillations of ±1.47 metres. Analysis of the time series revealed that average tide levels do not exceed 1 metre with a 95% probability of occurrence. It is important to note, however, that the values quoted are relative levels, which may differ from reality due to the nature of the data. However, the interpretation of the data is a valid exercise, where comparisons indicate that tidal level changes of more than one metre are infrequent. This type of predominance of sub-metre levels may suggest a situation of low energy associated with the tidal forcing, which in equatorial contexts is regular [7,58].
Astronomical tides showed oscillations of around ±1.50 m, with most events maintaining levels of up to 1 metre, with a 95% non-exceedance rate (Figure 7), reflecting the regular pattern, with recurrent occurrence. Meteorological tides, meanwhile, show little influence, with variations close to ±0.1 m and average maximum values of around 4 cm, indicating little or no interference in the local regime. The tide values found by the simulation are in line with previous findings by Araújo et al. [6] and Frota and Truccolo [59], who found the variability of sea level in the sub-FT, indicating a non-astronomical sea-level signal, with low oscillation reaching a maximum of 0.12 metres.
In the simulations, in extreme scenarios for a period of approximately 50 years, the values reached 1.54 metres for the tide level, 1.48 metres for the astronomical tide, and 0.11 metres for the meteorological tide, suggesting a significant increase in the pattern found. However, these projections should be interpreted with caution, as they have statistical limitations in relation to the real variability of coastal dynamics, but nevertheless comprise important data.
The Hs, Tp, and tide data from the DOW point indicate that the swells on the continental shelf are relatively homogeneous, with regular patterns and a main vector of action in an easterly and east-southeasterly direction, with wave and tide patterns that do not exceed 2 metres. Matos et al. [60,61] found that the wave climate was relatively similar at the DOW point, and Pinheiro et al. [21] found Hs and Tp directions that are in agreement with the data presented, with some differences in area.
Matos et al. [62] also consider the influence of the sea floor on wave propagation, identifying different responses of the directional spectra in the blistering over the ocean trough, influencing the direction and potential for transposition to the coast. In this sense, the wave propagation process seen here can be directly influenced by the relief of the platform, reaching the coast with attenuated wave energy.

3.2. Detailed Hydraulic Processes

3.2.1. Wave Climate of the Detail Areas

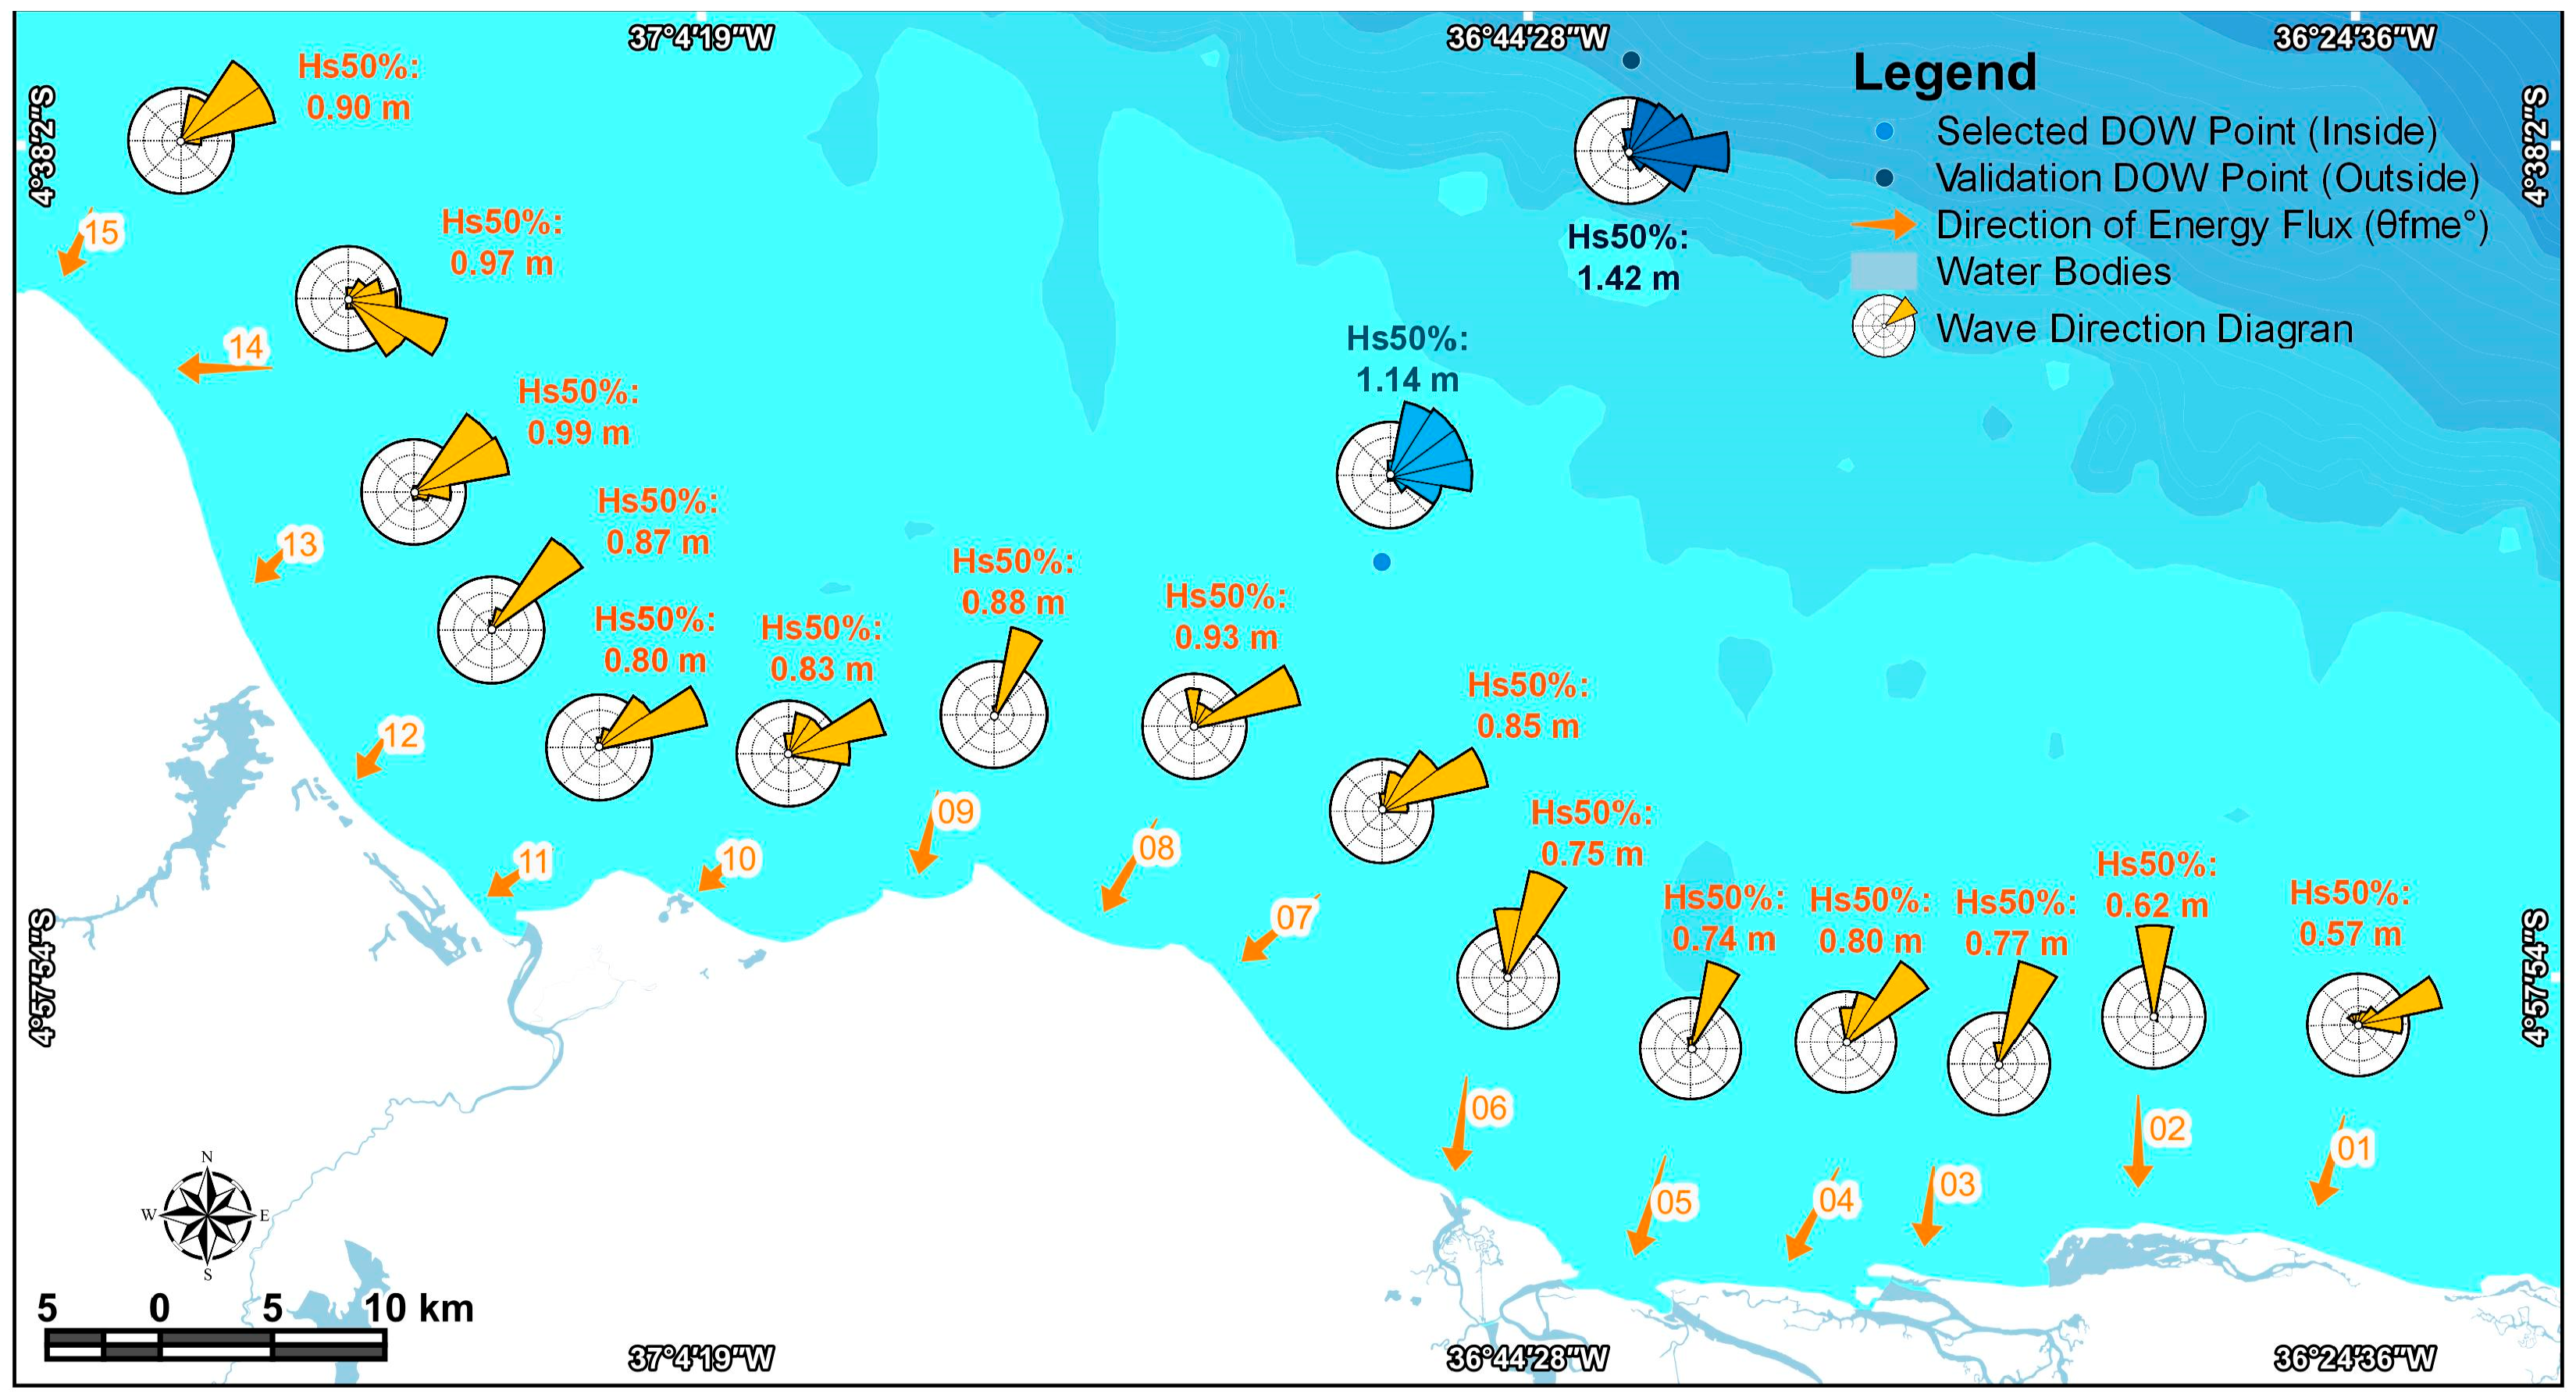
The wave climate shows fairly similar patterns over the 15 points analysed in Figure 8, with the average direction distributed between the north (26.6% of the points), north-east (33.3%), side-north-east (33.3%), and north-north-east (20%) quadrants. This scenario is significantly different from the realities of the platform, as well as the outer portions, where there is a predominance of patterns coming from the eastern sector.
The difference in direction in relation to the inner and outer DOW points is mainly attributed to the influence of propagation over the continental shelf, which is a determining factor in the redirection of the waves. Although there are rare exceptions with directions towards the east, east-southeast, and southeast sectors, these are possibly related to local imperfections in the shelf or uncertainties in the model, and even so, they are not very representative due to their low frequency, being restricted to isolated focal points.
The average values of Hs50% of the points indicate medium sea conditions, with conditions not exceeding 1 m in any of the quadrants analysed. The closer to the west quadrant, the greater the average Hs amplitudes and, consequently, the greater the associated mechanical potential. Even the Hs50% patterns are in line with what has already been analysed in the region by other authors [21,60,61,62]. The hydrodynamic dispersion potential is in line with the internal and external DOW points, where there is a clear decrease in energy through dissipation, which is consequently associated with the material deposited on the coast [62,63].
The potions with the lowest Hs50% are in shallower portions of the coast, possibly impacted by the successive sandbanks in the region, as can be seen in context 01 and 02 (Figure 8).
The detail points showed varied energy flow directions, with intensities ranging from 127,897 to 320,478 J/(m/s). Although there were occasional fluctuations, there was a systematic distinction between the initial and final values in practically all the grids, suggesting contrasts between the eastern and western sectors of the coast. In terms of direction, the easternmost points had flows towards the north quadrant, while the others varied between north-northeast and northeast. A specific deviation was observed in context 01 and 05, probably related to coastal curvature or even longitudinal currents, which influence the incidence of waves coming from the eastern sector.

3.2.2. Exploratory Sea Level Analysis

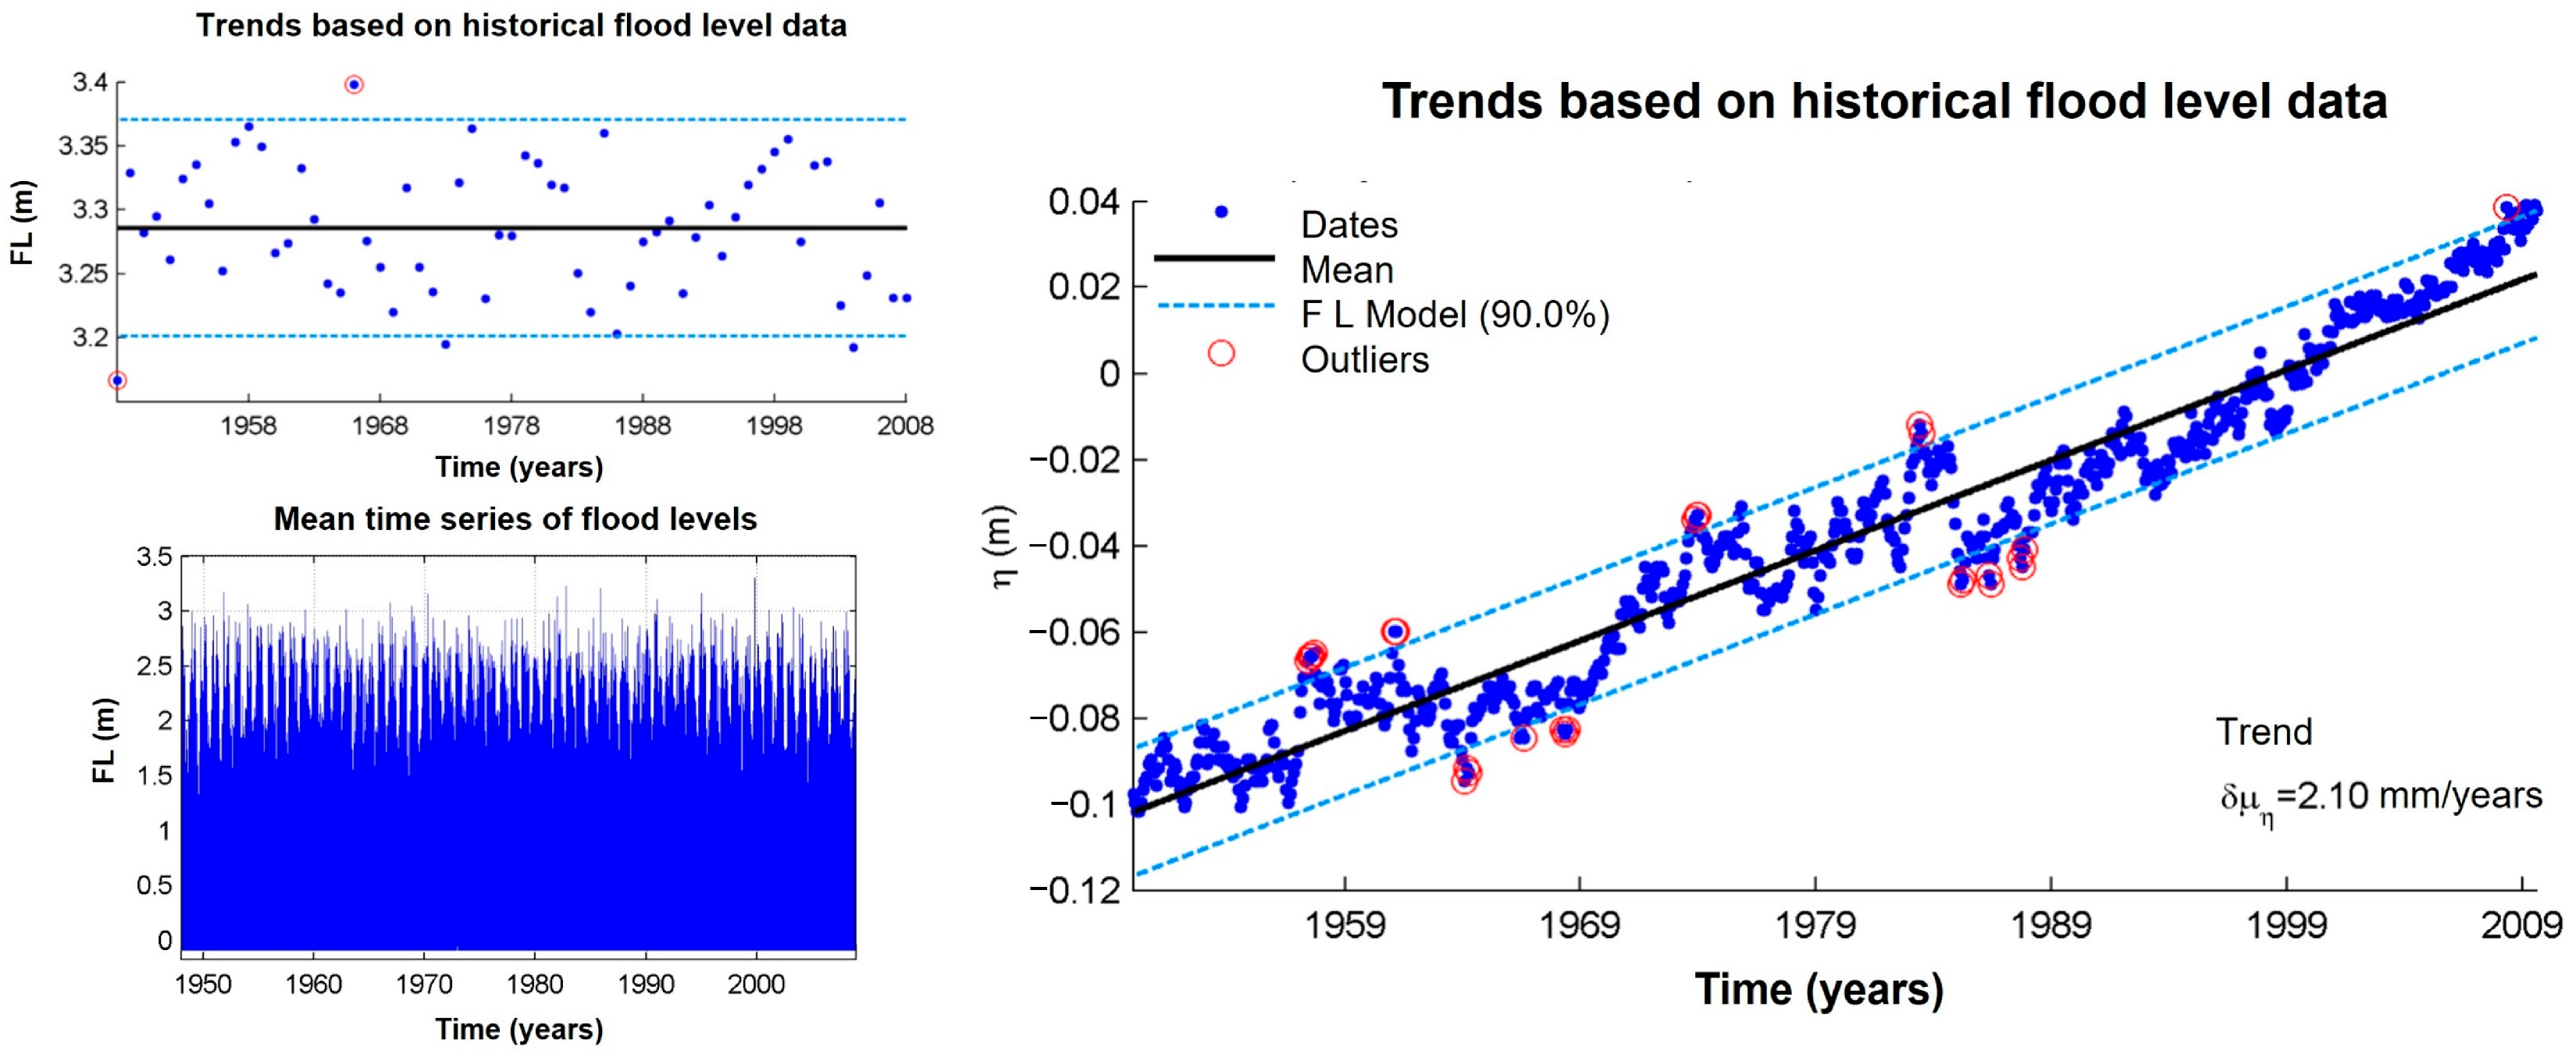
From the exploratory statistical analysis applied to the 15 detail points distributed throughout the area, it was possible to identify a relatively consistent pattern in the average sea levels, oscillating between 2.5 and 3 m (Figure 9). These values were obtained based on historical series that also indicate an average astronomical tide of up to 1.53 m, and a typical meteorological tide of around 0.05 m, making up a coastal scenario exposed to significant variations in the water regime.
These parameters made it possible to estimate the regional flood level, considering the superimposition of tidal effects, average sea level rise, and historical extremes. Based on the data, a recurring flood threshold of around 2.89 metres was identified, with maximum trends reaching up to 3 metres in events of greater energy or coincidence of tidal peaks. The average rate of sea level rise observed over the time series was approximately 2.10 mm/year, which is compatible with the most optimistic local projections from the IPCC’s AR6 [25] and NOAA [64] predicting a rate of 4.00 mm/year, taking into account the limitations of the data.

3.2.3. Hydraulic Process Simulations

In the simulations carried out, the refraction patterns were propagated considering the predominant directions for each grid, making it possible to spatially analyse the openings for wave propagation from the north to east quadrants, encompassing all the previously identified transects.
Throughout the area, wave refraction is strongly influenced by energy dissipation in areas with bathymetric roughness, especially in breaking zones. The model by Battjes and Janssen [65] underpins this approach by considering the energy loss associated with breaking in shallow water regions.
The main elements of roughness that interfere in the area analysed are, to the east, the longitudinal dune morphologies at the mouth of the Piranhas-Açu River associated with siliciclastic sandy deposits, which border the frontal portion of the mouth, act as submerged “steps”, interfering in the dissipation of waves, and redirecting the energy of the action vectors towards the coast [66]. Other important elements in the propagation of processes are the banks of the submarine canyons and palaeochannels of the Piranhas-Açu and Apodi-Mossoró Rivers [67], which can act as “hydraulic slopes” in the propagation of waves [68], comprising deceleration and reorientation barriers, altering the flow and hydraulic dynamics [69,70] despite the interior allowing free passage.
Underground features act as natural barriers, altering trajectories and reducing the mechanical potential of waves, which is already limited when they rub against the continental slope, especially waves from the north, north-east, and lee-north-east quadrants, which concentrate the main flows. Even in areas with lower bathymetric roughness, where propagation occurs in a predictable way, interaction with the shallow shelf still causes reorientations and energy losses, limiting the impact of waves on the coast.
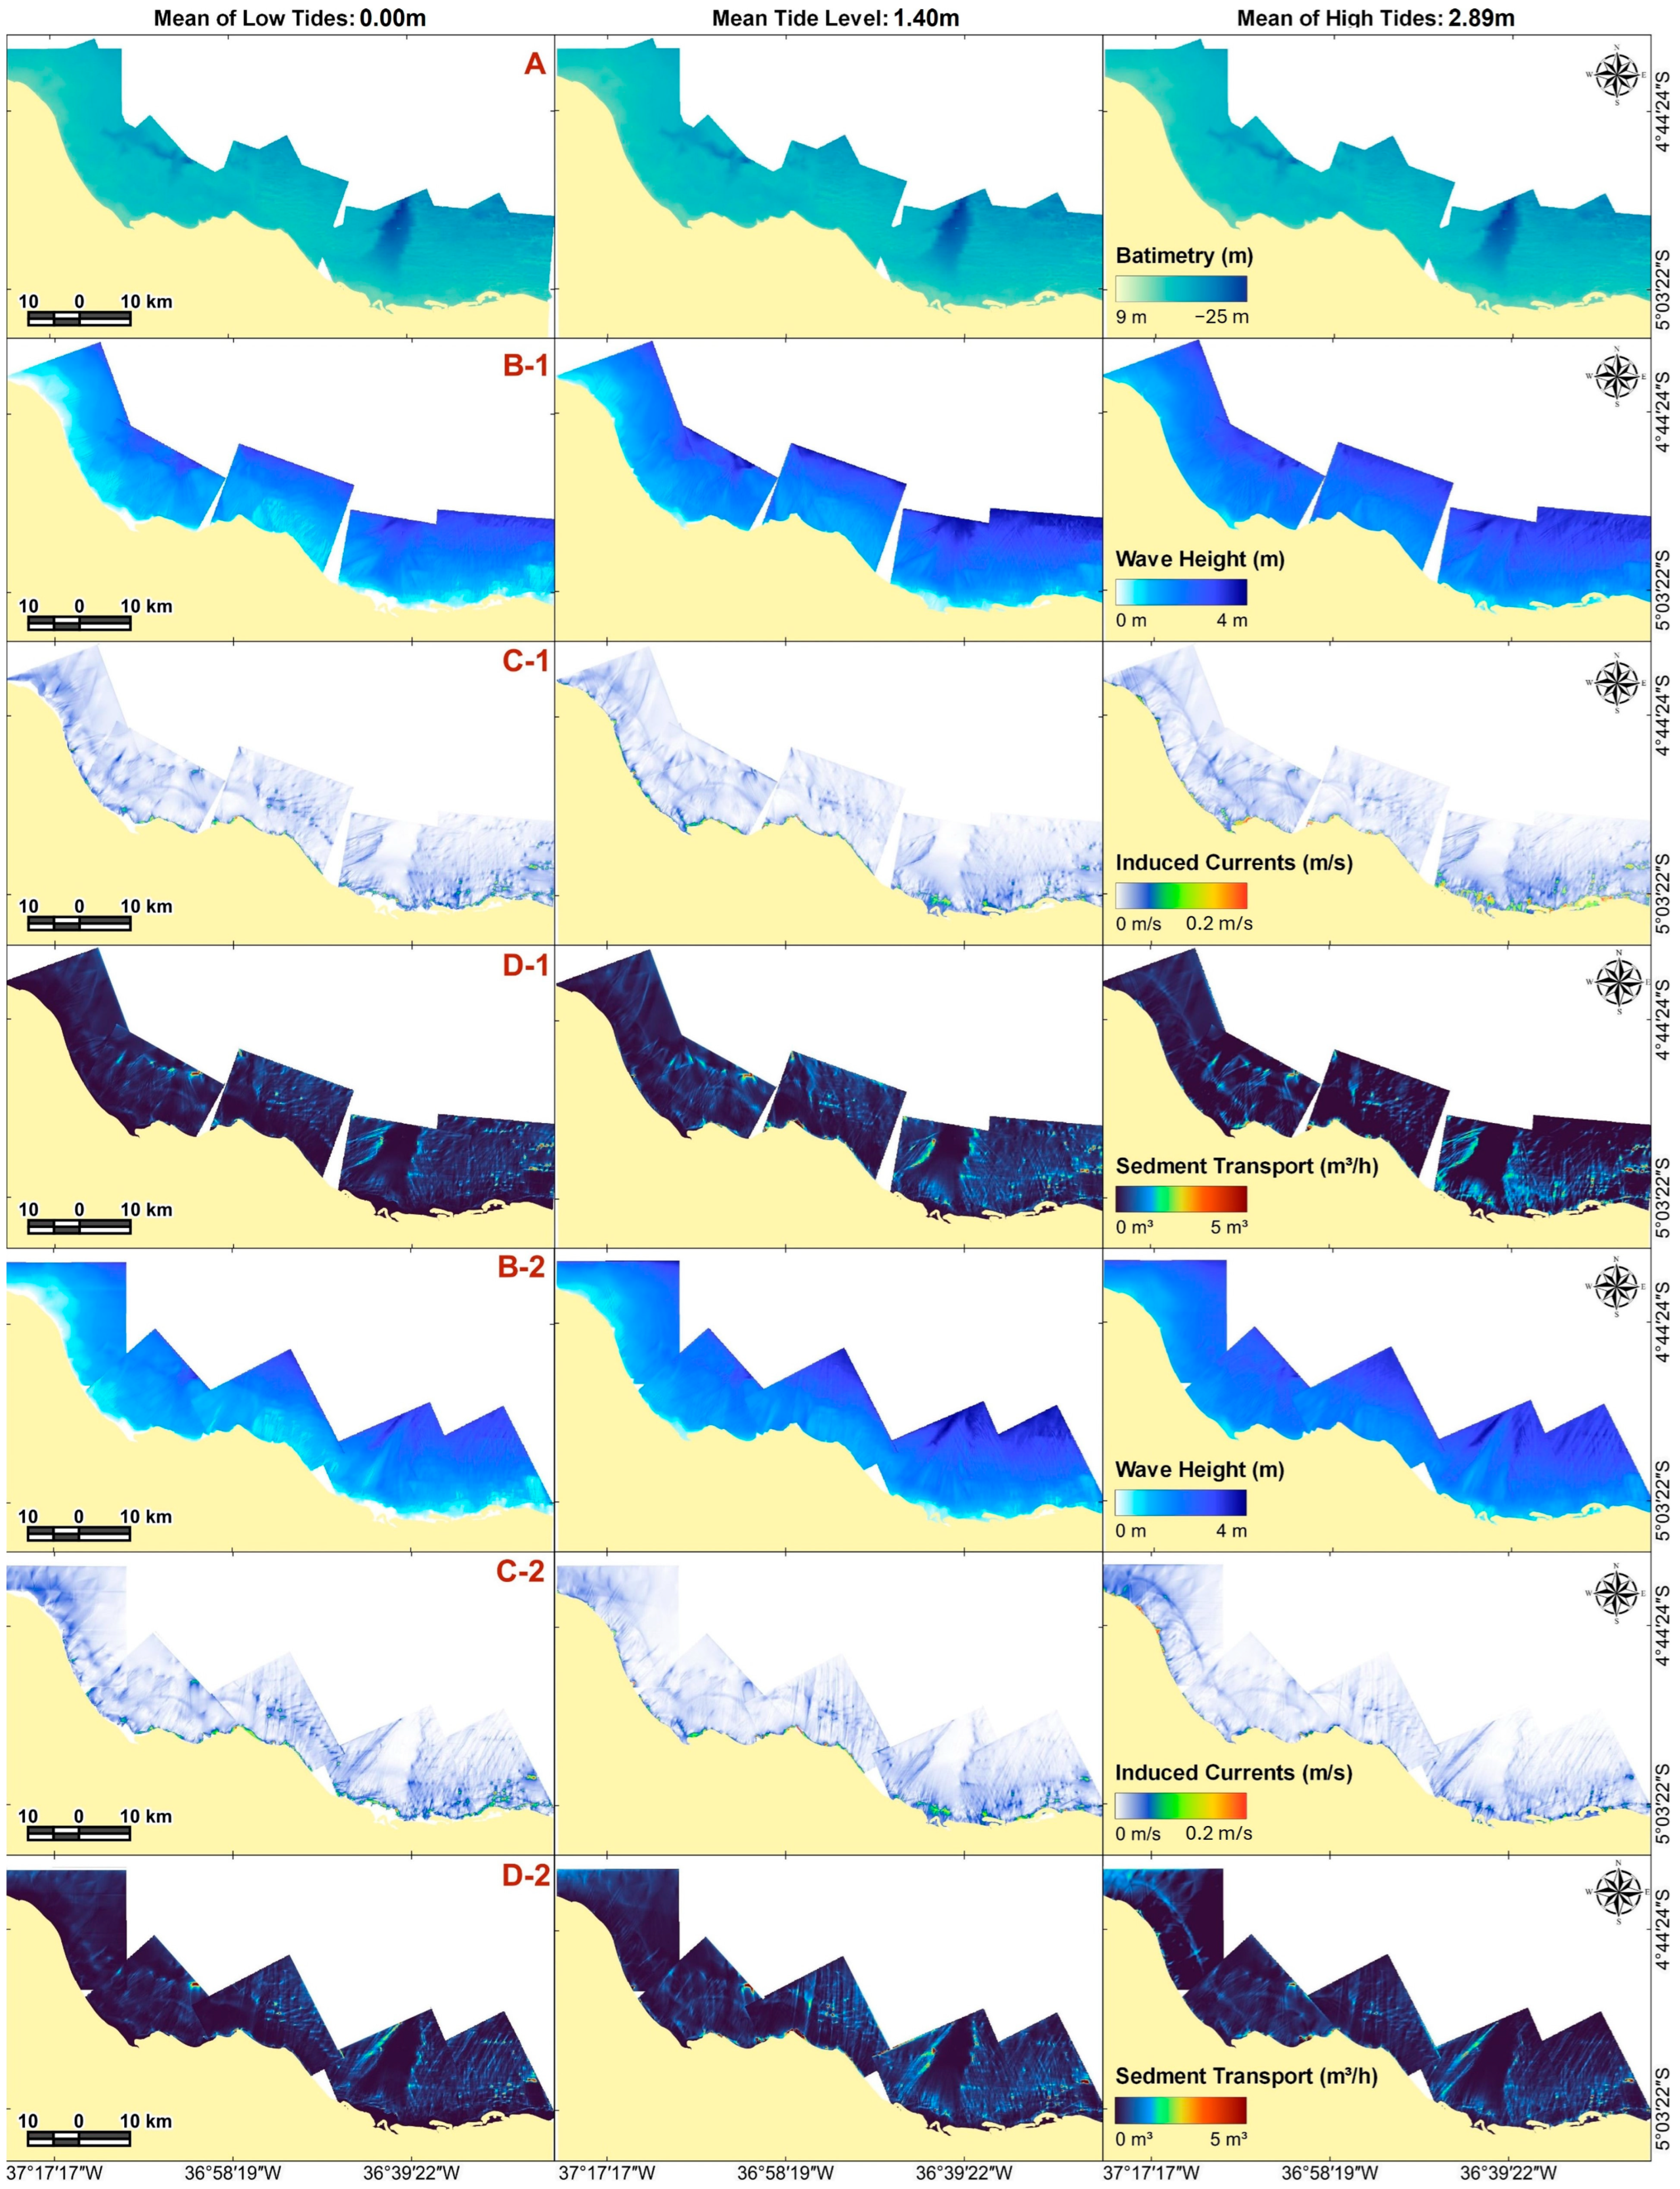
The bathymetric irregularities can be seen in the multiple sections of Figure 10, where the highest and lowest portions of the study area can be seen.
The wave simulations made it possible to draw some relationships regarding their dispersion (Figure 10). As they approach the coast, the presence of sandy banks, paleochannels, and submarine canyons can intensify the refraction and dissipation processes throughout the area, significantly reducing the height of the waves (Hs), which generally reach the coast between 0.8 and 0.6 m before they even break. A similar process was seen in the Galinhos spit [71,72], to the east of the study area, where a regional trend was seen.
In the absence of subterranean features, there is a free flow of waves across the platform until they reach the coast, promoting the arrival of waves of 1 to 0.9 metres at the coastline. Even the interior portions of the canyons and the platform imperfections are free flowing, which means that the coastal portions related to these underground features have wave patterns of one metre or more close to the coastline.
In the different tidal regimes, the behaviour is similar, but there is a consequent decrease at low tide, with waves that do not exceed 1 m and a progressive retreat of the water levels, reaching distances of up to 2.4 km. At high tide, there is an increase in the potential of the waves, which exceed 1 metre almost everywhere and can reach heights of up to 2.3 metres. In this context, the tide invades various estuarine portions of the coast, reaching distances of up to 100 metres. An envelope of tidal variation can even be drawn in relation to high and low tide in the study area (Figure 11).
The simulated waves, when interacting with the bottom or breaking, generate a variety of induced currents throughout the area. Similar to waves, the main dynamic driving force behind currents is the interaction between the scour gradient and the energy incident on the waves in friction with the irregularities of the submarine relief, which generates a variety of flow vectors that can take on frontal or longitudinal directions in relation to the coastline.
The modelling carried out Indicates that the current vectors are aligned with the wave breaking profiles near the coastline, intensifying in erosive promontories, indentations, and areas with sandy banks, especially in estuarine regions, although the general pattern is compatible with a calm sea environment and low transport potential.
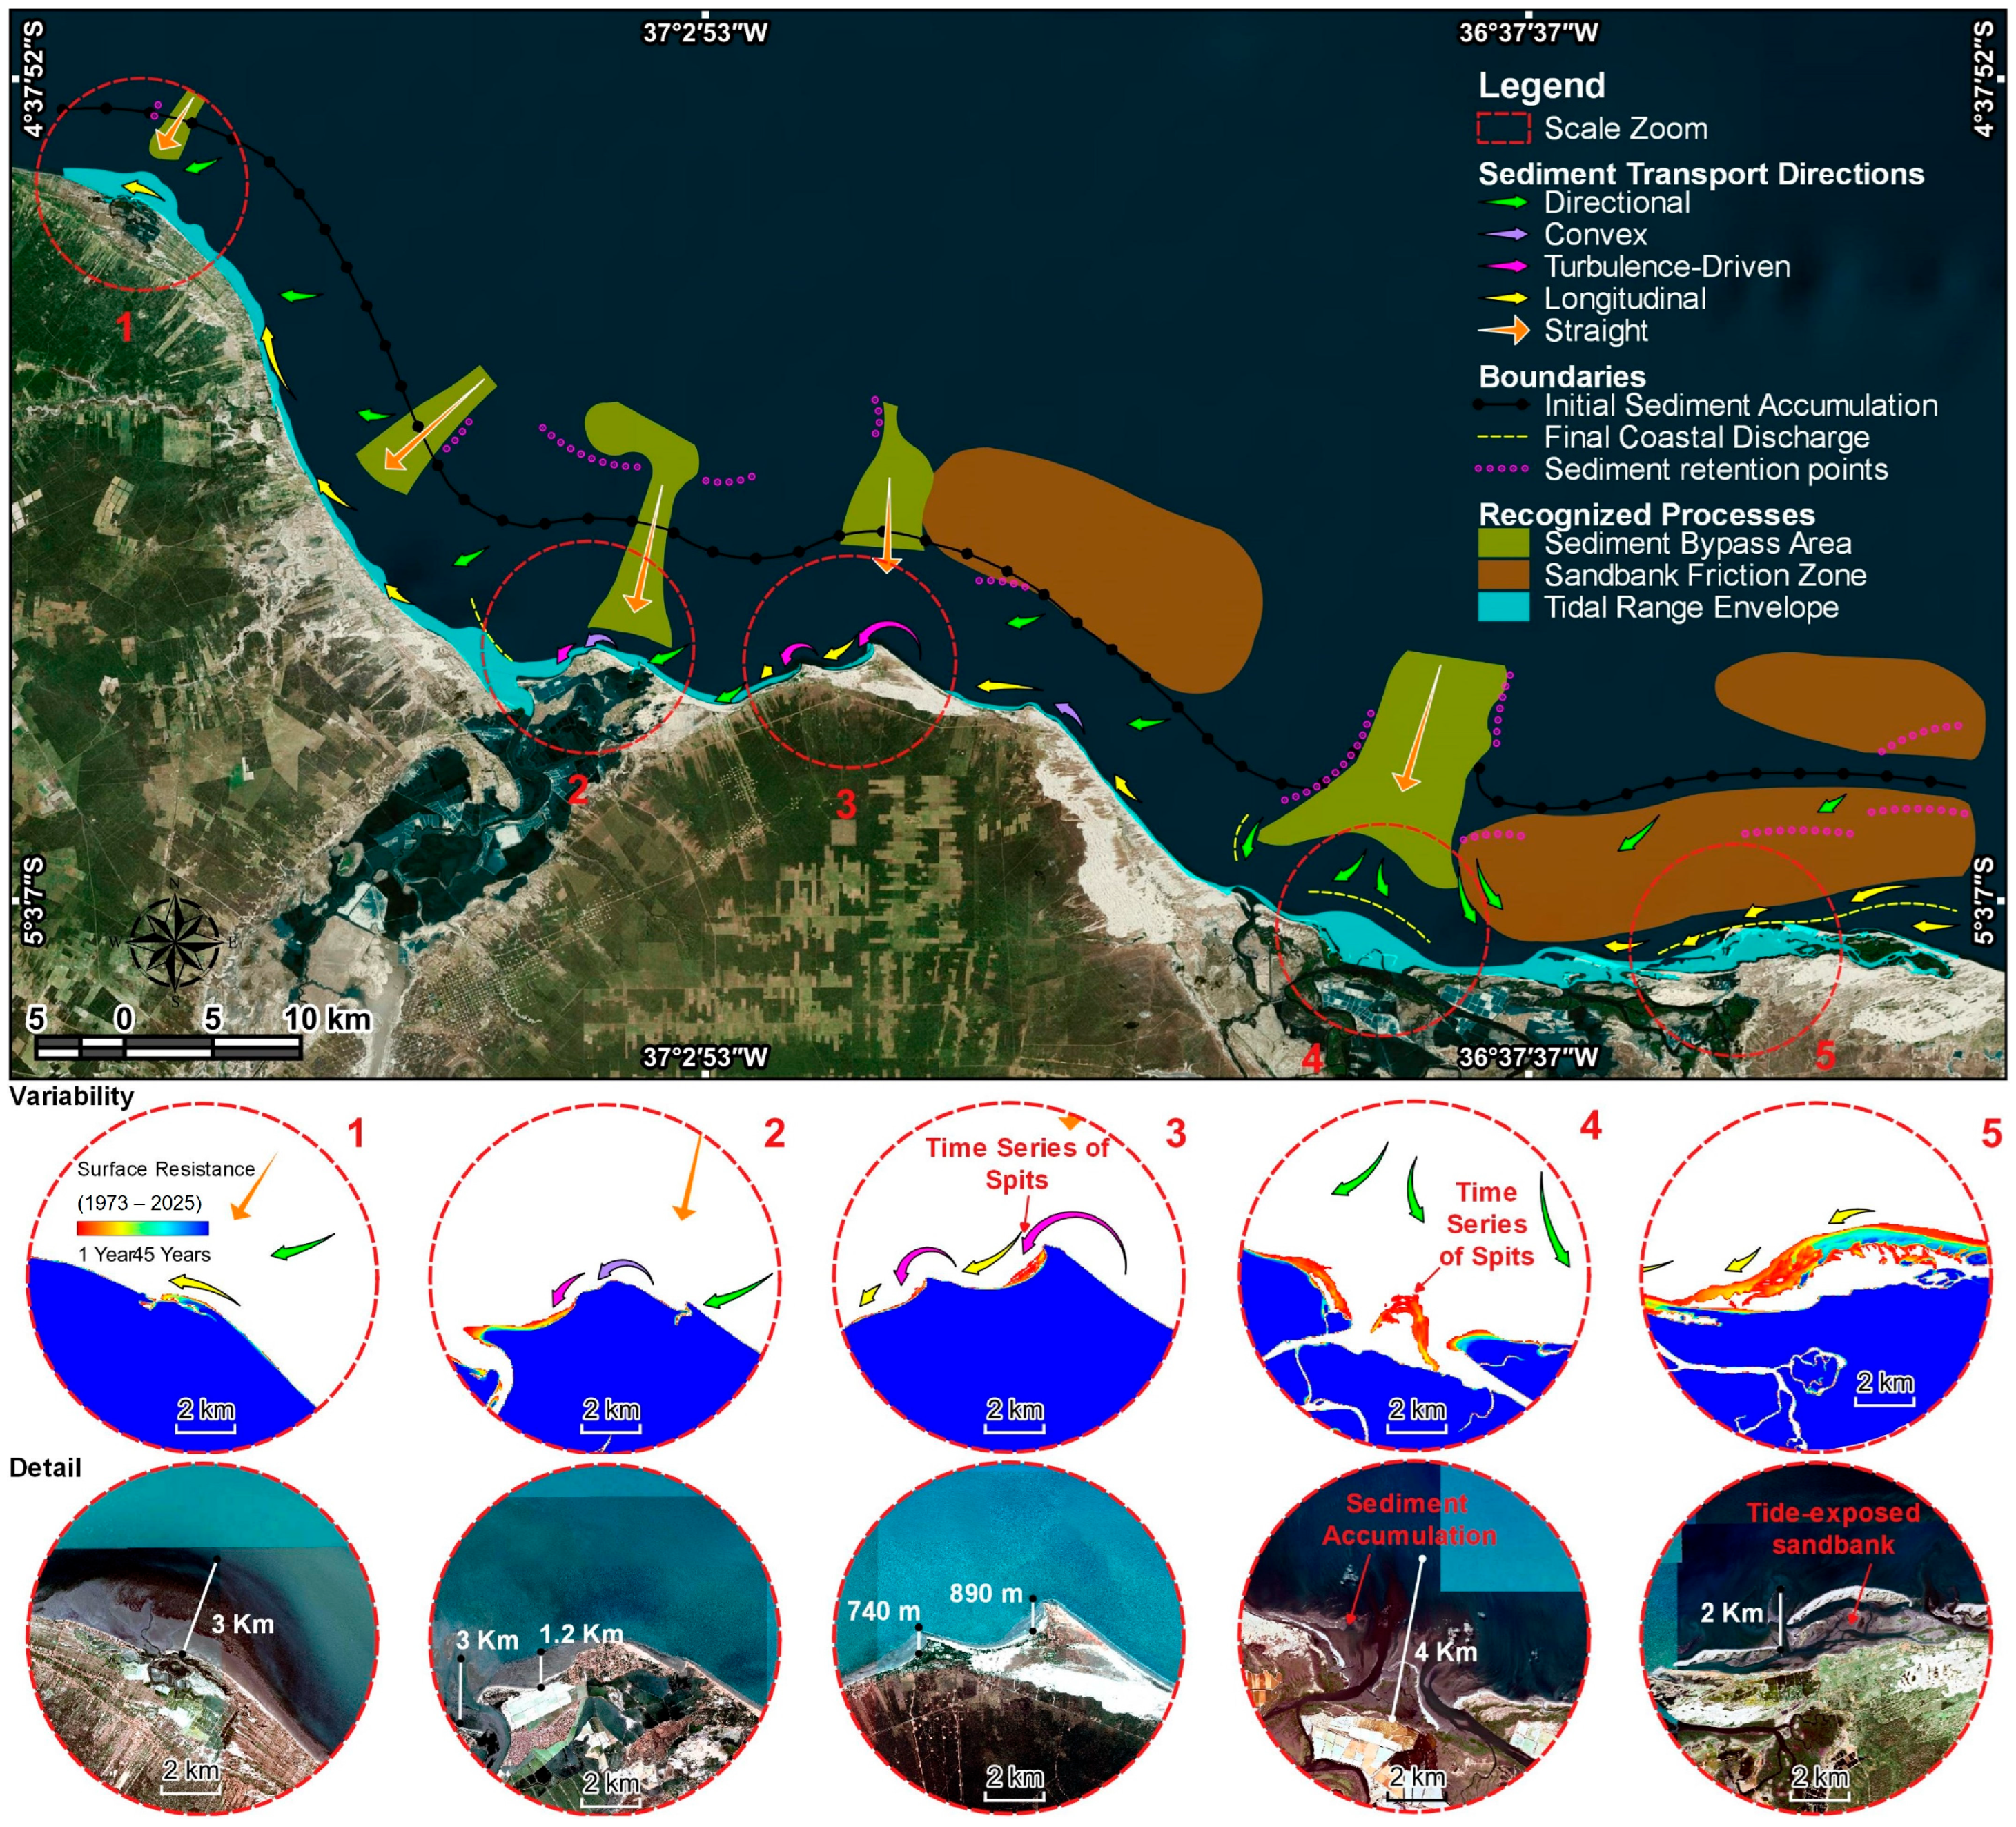
Still, on the subject of currents, there is a marked agglomeration of them at the mouth of the Piranhas-Açu River, the fastest in the region, which due to their potential, end up moving more material, offering the region a peculiar coastal dynamic, with constant alternations of their forms, such as sandy spits and barrier islands, which are constantly remodelled in the coastal structure (Figure 11). Other portions with a direct relationship to the currents are the localities with indentations that are located transversely to the wave direction, which occur mainly in the middle portion of the study area, where there is a concentration of currents generating a kind of vortex that are related to the accumulation of sedimentary material forming seasonal sand banks and some sandy spits (Figure 11), similar to what occurs on the coast of the state of Ceará [73].
The currents in different astronomical scenarios are intensified at high tide, reaching approximately 0.18 m/s, and are milder at low tide, not exceeding 0.15 m/s, with hydraulic transport varying in both contexts. Currents recede at low tide and advance at high tide, internalising between estuarine channels and intensifying currents close to the coast.
With regard to the mass transported, which would be the final intersection in the relationship between the bottom and the currents, the wells in the study area varied from 1 to 8 m3/h, concentrated at the river mouths as well as the wells on the shallow platform, where there is fiction with the longitudinal dune clusters and the features of the submarine canyons, including the presence of some retentions on the banks of elevated wells, since the submarine relief has a dynamic influence on the propagation of transport flow [74].
The data sets obtained made it possible to make some observations and correlations regarding the region’s hydraulic processes, such as delimiting some longitudinal transport vectors and patterns, correlating current data with the transport obtained, identifying zones of preferential mobility, discharge limits, and sediment accumulation points, as can be seen in Figure 11. It was also possible to establish relationships with historical data from orbital sensors and high-resolution images to complement the interpretation.
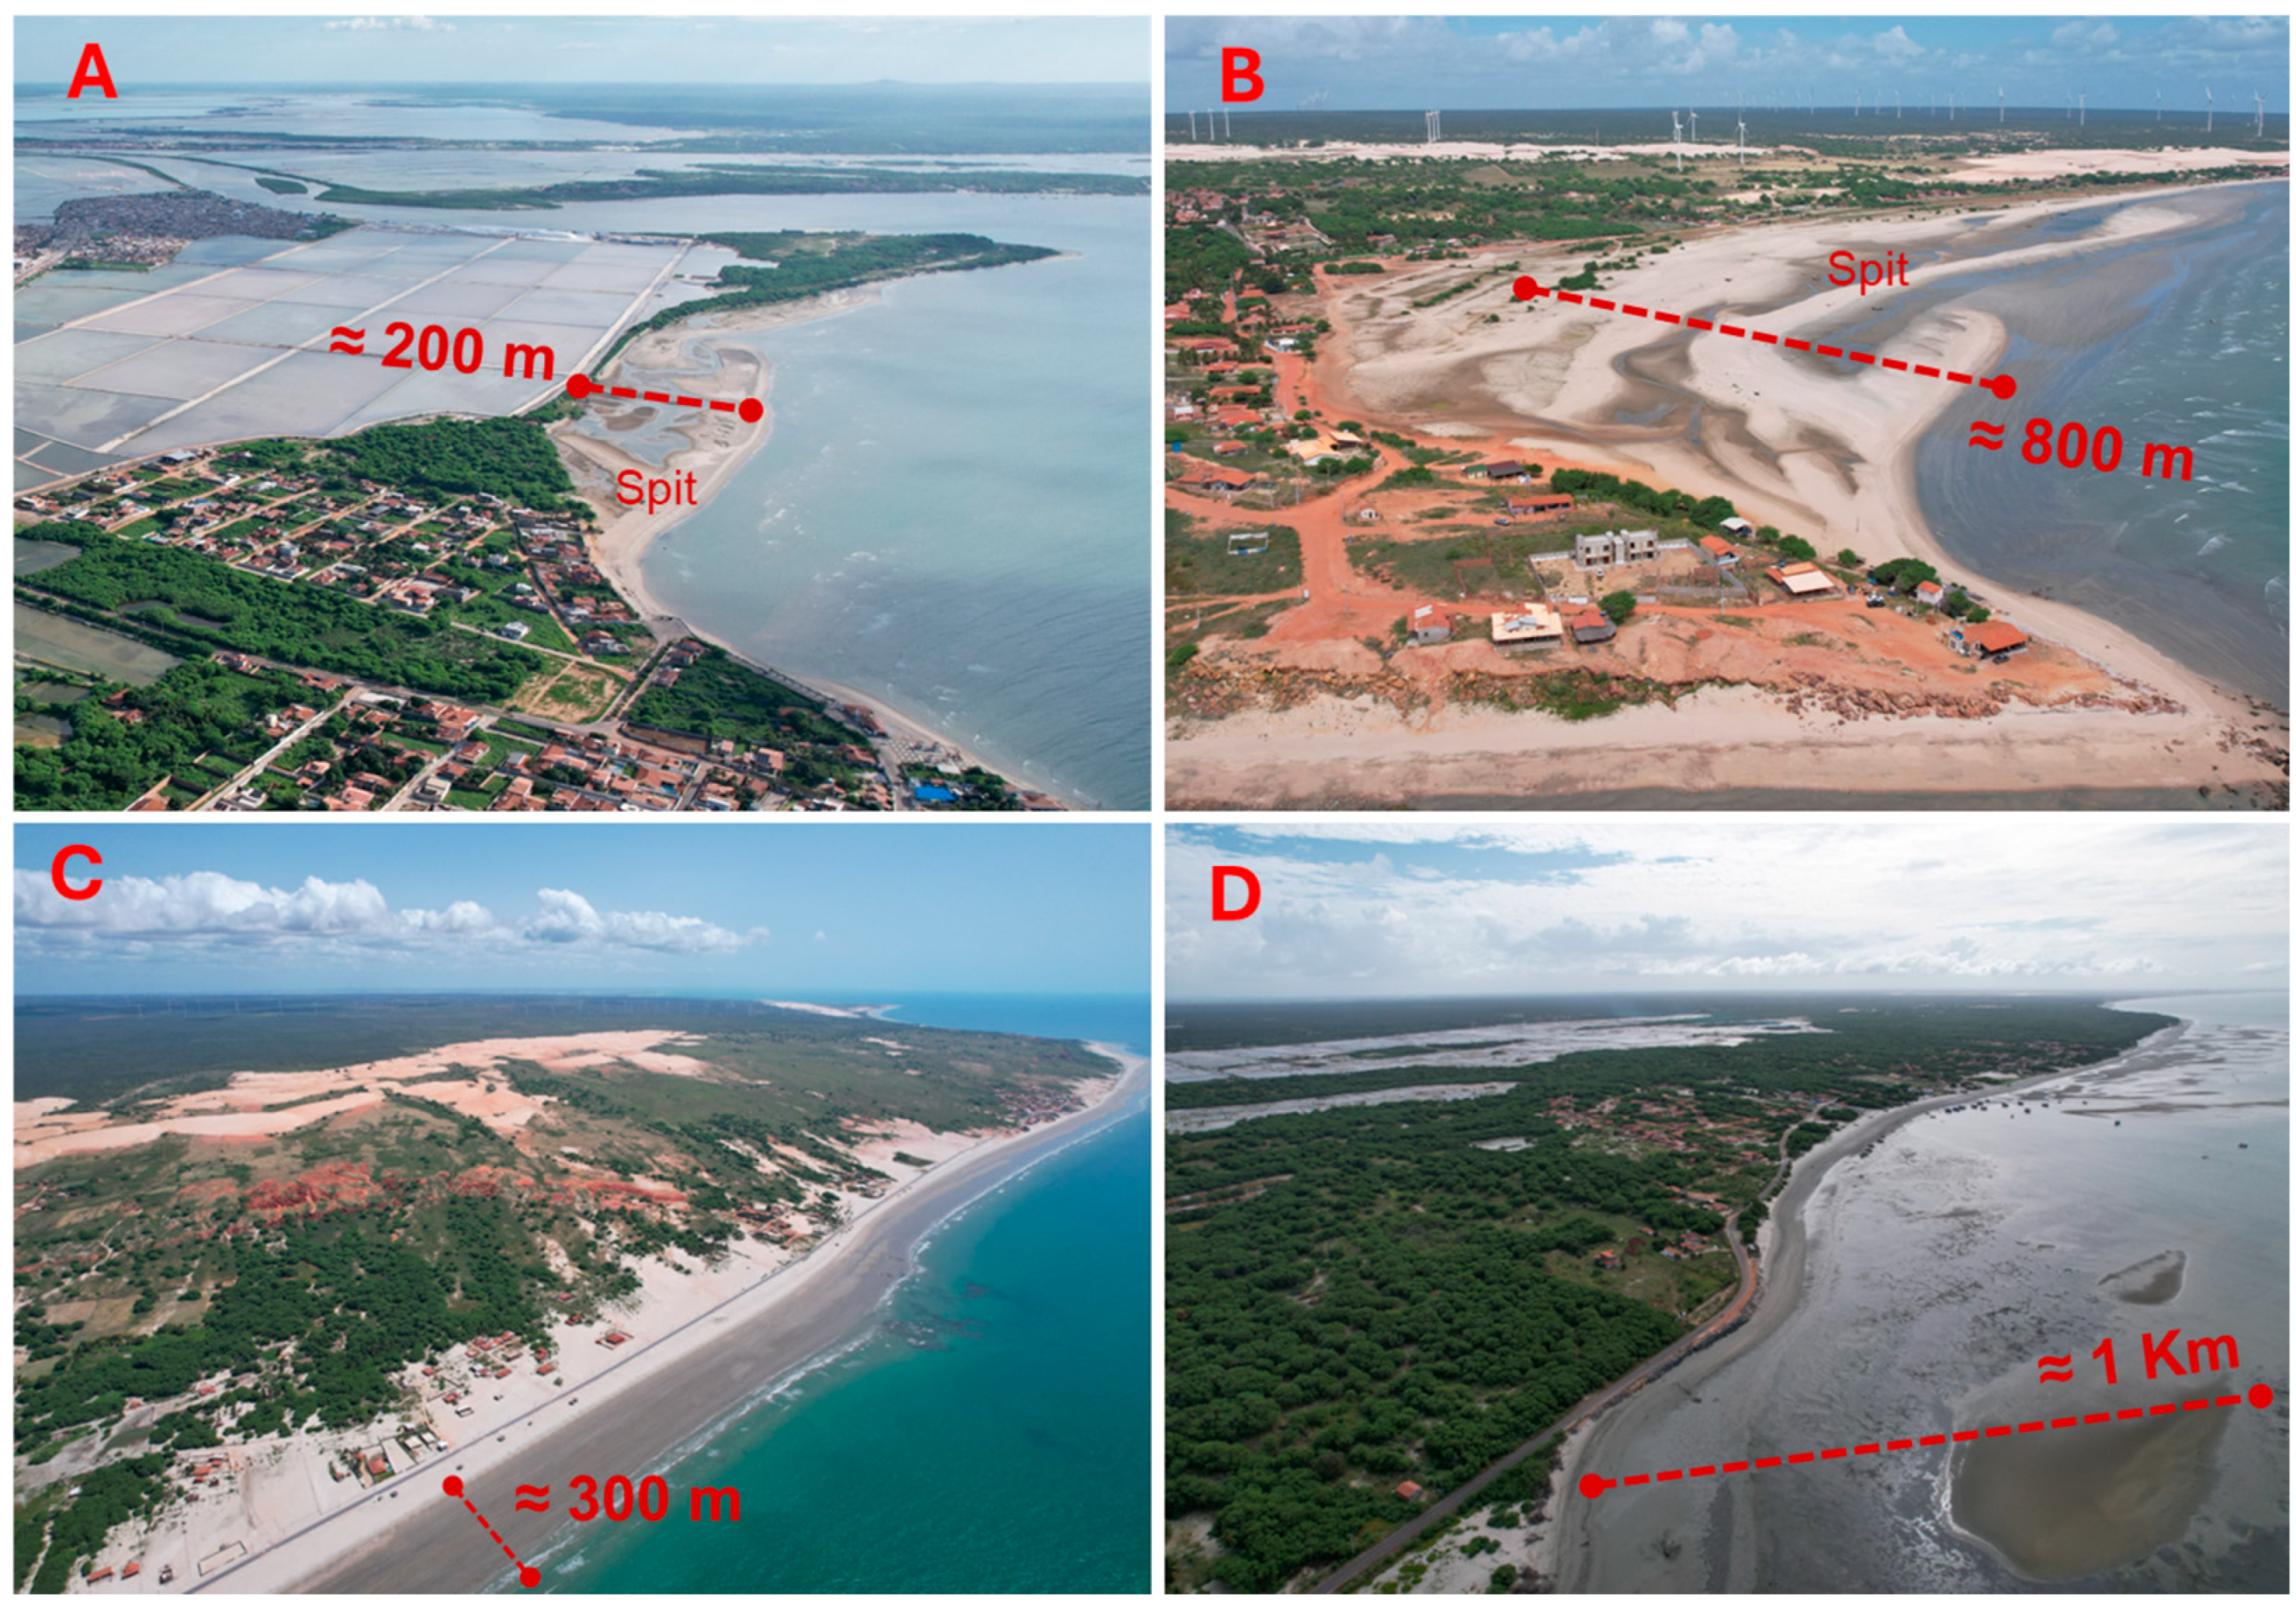
In the region, there is a clear limit to initial deposition, located near the shallow platform, where the vectors of action, initially orientated in the northeast and east-northeast quadrants, are reoriented as they interact with different morphological configurations of the bottom. In areas of friction, such as sand banks and longitudinal dunes, sediment transport is directional and/or diffuse, while in more rectilinear features, such as submarine canyons and preferential paths, the flow is concentrated, forming bypass zones that transfer large volumes of sediment to coastal discharge regions. In the lower sections 1, 2, 4, and 5 of Figure 11, it is possible to identify historical depositional structures, such as sandy spits, as well as temporal variations in the surfaces. In the detail sections, sedimentary packages from these discharges can be seen, reaching up to 4 km from the coastline, a value consistent with the patterns simulated in the modelling, where a maximum retreat of 2.4 km was obtained, and this process was even verified in the field with tidal retreats of up to 1 km in the ebb regime (Figure 12).
The directional and rectilinear vectors, when they reach the coastline, generate longitudinal transport currents that run along the entire coast, and convex and swirling currents when they come into contact with transverse indentation zones, promoting the deceleration of the currents and the consequent deposition, generating extensive, highly dynamic sandbanks, as can be seen in detail sections 2 and 3 of Figure 11, where historically the beaches had several mobile sandbanks, and the process in question has even been verified in the field (Figure 12).
Based on the data, as well as the interpretations and correlations made, it was possible to observe a more unstable dynamic behaviour near the mouth of the Piranhas-Açu River and in the far east of the study area, where the interaction between morphological and hydrodynamic factors results in less predictable patterns. In contrast, the westernmost portions show relatively more organised and consistent processes, indicating a more controlled dynamic, even if it is still subject to seasonal variations and external forcings.
The dynamics and correlations obtained with the data have a coherent scientific basis, since Diniz and Oliveira [75], when compartmentalising the portions of north-eastern Brazil, discuss the dynamics related to the coastline of the study area, identifying that the portions with a W-E orientation have a tendency towards the deposition of material and the formation of barriers, possibly due to the friction of the coastal discharge flow with the sandbanks. This is not the case in the SE-NW portions, where there is a relationship with the predominance of longitudinal currents as identified, which in turn end up dumping materials in sheltered portions such as the re-entrant areas that are located transversely in the wave direction, generating successive sandbanks (Figure 12A,B).
This phenomenon can be explained by the efficiency of sediment transport along the coast, where transport is minimal when the waves are perpendicular (0°) or parallel (90°) to the coastline and reaches its maximum around 45° due to the ideal combination of energy and direction [76]. In the region, the portions in the W-E direction have incident waves close to 90°; consequently, their longitudinal transport is not as active, with a tendency towards deposition, while the portions in the SE-NW tend to transport materials at speed, which are deposited on the coast in a NW-SE direction.
The correlations established between the data obtained and the studies reviewed in this study were based on both modelled products and field observations, which naturally implies a margin of uncertainty. As such, their interpretation must be carried out with due caution. Even so, the results offer coherent explanations within the scope of the proposed analysis and are useful for a regional understanding of the hydrodynamics of the area studied, enabling correlations with similar areas. Although there are approaches that can present more robust models, the discussions presented here are valid given the limitations of the data available and make a relevant contribution to understanding coastal processes at a regional level.

4. Discussion

The results obtained reveal consistent patterns of wave propagation and dissipation, as well as correlations between bathymetric morphology and the dynamics of coastal currents, corroborating previous findings in shallow shelf regions in the aforementioned studies [57,60,61,62], which found wave trends in the northeast and east direction of wave direction, as well as spreading in portions with concordant underground morphology. The influence of underwater structures, such as canyons and sandy banks, plays a relevant role in the transformation of the wave field and the orientation of currents, reinforcing the importance of detailed bathymetry for hydrodynamic modelling in the region, since more refined data tend to generate more robust and assertive information.
The wave climate data and modelling indicated different procedural responses at the two mouths analysed, where the Piranhas-Açu River mouth has a more dynamic limit than the Apodi-Mossoró River, with a constant erosive and depositional trend, mostly controlled by longitudinal transport currents. This justifies the presence of the morphologies identified during the fieldwork.
From the data in different astronomical scenarios, it was possible to observe different patterns of wave propagation at high and low tides (Figure 10), where an initial relationship can be drawn about the hydraulic potentials in the different contexts; there are even references on the subject, and authors who defend the tides as the main hydraulic engine in the region, classifying it as a tide-dominated coast [7], which was confirmed in the models, showing an alternation in the hydraulic processes in the face of tidal variations.
Understanding these regional dynamics is significant for understanding coastal morphodynamics, especially in areas subject to natural variation, and confirms the hypothesis that submarine terrain irregularities condition energy dissipation and sediment transport, influencing the impact of waves and modelling coastal morphologies.
In the context of climate change, which tends to intensify extreme events and raise the average sea level, characterising these dynamics is of fundamental importance, especially with commonly encountered processes such as the predicted 100-year rise based on local morphodynamics, which is strategic for the development of adaptive initiatives, on different scales and appropriate to each region. The potential impact of rising sea levels, combined with changes in current patterns, can accelerate erosion processes, especially in shallow areas such as the study area.
Numerical trend modelling with recent data, such as the one carried out, is emerging as a viable alternative for generating data that can support coastal planning in regions with limited infrastructure and high exposure to risk. Even against a backdrop of technical limitations related to the scarcity of data, it was possible to generate valid information and coherent interpretations.
In addition, the results highlight the significant gap in robust, high-resolution data, which limits the accuracy and reliability of applied hydrodynamic modelling. Strategies that prioritise filling this gap through accessible methodologies, including periodic bathymetric surveys, the development of a simplified monitoring network, and the use of open-source technologies, are essential for strengthening the scientific base and improving the prediction of impacts in the region. This is particularly important to support public policies and coastal management actions, promoting evidence-based decisions that integrate environmental resilience with sustainable socio-economic development.
The consistency of the results is based on temporal data from orbital sensors, bibliographic data, and field observations, which ensures the reliability of what was surveyed, a set of accessible strategies to prove the findings with a high degree of reliability given that the area lacks a continuous monitoring network. Therefore, analysing the results from an analytical perspective, the main conceptual contribution of this work was the identification of the role of submerged irregularities in modulating wave propagation and inducing currents, influencing deposition and erosion along the coast. The conceptual contributions found were consistent with reference publications [56,57,58,59,60,61,62] in terms of wave direction, but differed in terms of flow intensity, suggesting local morphological control not captured in previous studies.
It should be noted, however, that the modelling presented has inherent limitations and should be interpreted as references for regional and local hydrodynamic trends and not as exact representations of coastal reality. Interpretations carry an associated margin of error, which must be taken into account when applying these results in practical contexts. In addition, the modelling process itself within SMC-Brasil has technical limitations, specifically with regard to the time series, which, although robust, is limited to 2008. Another point is the lack of validation mechanisms with field data, which shows a certain limitation in performance in representing real processes in more detail.
Future research trends in the study area should focus on integrating current empirical data and more refined dynamic modelling, as well as exploring the integration between hydrodynamic and socio-economic processes under future climate change scenarios, broadening the understanding of coastal systems and the effectiveness of adaptive measures.
In addition to the technical and scientific advances presented, this research reinforces the relevance of renewing and continuing the SMC-Brasil project, initially carried out between 13 December 2011 and 31 May 2019. The continuation of the project is strategic to provide adequate technical support to Brazilian researchers, as well as making up-to-date data available, which is essential for improving modelling and ensuring the quality of the information generated. The renewal of SMC-Brasil would therefore be a decisive step towards tackling the current limitations related to the scarcity of coastal data, thus strengthening Brazil’s capacity to effectively monitor and manage its vast and diverse coastal environment.

5. Conclusions

When analysing the study as a whole, it can be said that the application of SMC-Brasil to the Brazilian semi-arid coast provided a detailed and general characterisation and discussion of the main hydraulic processes operating in the region. The simulations were similar to wave propagation patterns, indicating a certain consistency when looking at historical data, as well as observations made in the field. In addition, the sandy banks and submarine canyons were found to influence energy dissipation, partially redirecting energy flows and sediment transport. The induced currents behaved relatively in line with the break profiles, with a certain intensification identified in recesses and promontories.
The analyses also showed hydrodynamic differences between the eastern and western sectors of the study area, with more unstable patterns at the mouth of the Piranhas-Açu and more controlled processes in the portions adjacent to the Apodi-Mossoró. In addition, an exploratory analysis of the estimated flood level, based on time series, revealed an average sea level rise threshold of 2.10 mm/year, compatible with global projections, although relatively lower. This estimate can support coastal management strategies in future risk scenarios.
The results obtained during this study confirm the hypotheses previously raised, broadly demonstrating that bottom features have a significant influence on coastal circulation processes and that the orientation of the coastline is associated with different forms of sedimentation, specifically related to the degrees of exposure to the hydrodynamic regime.
The application of the SMC-Brasil on a regional scale of 1:50,000 demonstrated an important capacity to represent local hydrodynamic patterns, with a low margin of error when compared to in situ observations, which reinforces its consistency. The coherence of the simulated data and the observed physical processes, as well as the compatibility with the theoretical references available in the literature, confirm the viability of the model as a tool for generating strategic data for public authorities.
Despite the limitations associated with model calibration and the scarcity of high-resolution data, the results offer a reading of regional hydrodynamic trends. Finally, the study reinforces the potential of SMC-Brasil as a low-cost and highly applicable tool in vulnerable contexts, highlighting the strategic relevance of the partnership promoted by the Brazilian government. There is an urgent need to renew and continue the SMC-Brasil project in order to guarantee permanent technical support and provide up-to-date databases, which are essential for more robust and accurate research. Future research should seek greater integration between modelling and empirical observations, as well as contribute to developing regional continuous monitoring systems that strengthen public policies aimed at coastal resilience.

Author Contributions

Conceptualisation, T.C.L.S. and M.T.M.D.; methodology, T.C.L.S. and M.T.M.D.; software, T.C.L.S.; validation, P.V.d.N.A., B.F. and M.T.M.D.; formal analysis, M.T.M.D.; investigation, T.C.L.S.; resources, M.T.M.D.; data curation, T.C.L.S. and P.V.d.N.A.; writing—original draft preparation, T.C.L.S.; writing—review and editing, T.C.L.S.; visualisation, B.F.; supervision, B.F., M.T.M.D. and P.V.d.N.A.; project administration, M.T.M.D.; funding acquisition, M.T.M.D. All authors have read and agreed to the published version of the manuscript.

Funding

This research was funded by the National Council for Scientific and Technological Development—CNPq and Coordenação de Aperfeiçoamento de Pessoal de Nível Superior—Brasil (CAPES—Finance Code 001). The APC was funded by Foundation for the Support and Promotion of Science, Technology, and Innovation of the State of Rio Grande do Norte.

Data Availability Statement

Data set available on request from the authors.

Acknowledgments

The authors thank the Ministry of the Environment (MMA), the Environmental Hydraulics Institute of Cantabria (IHCantabria) at the University of Cantabria, the Spanish Ministry of Agriculture, Food and Environment, the Federal University of Santa Catarina (UFSC), and the University of São Paulo (USP) for their sponsorship, development, support, promotion, and dissemination of SMC-Brasil. Foundation for the Support and Promotion of Science, Technology, and Innovation of the State of Rio Grande do Norte (FAPERN), Brazil, as the funding agency responsible for paying the APC.

Conflicts of Interest

The authors declare no conflicts of interest.

References

  1. Nicolodi, J.L.; Petermann, R.M. Potential vulnerability of the Brazilian coastal zone in its environmental, social, and technological aspects. Panam. J. Aquat. Sci. 2010, 5, 12–32. [Google Scholar] [CrossRef]
  2. Pardal, A.; Christofoletti, R.A.; Martinez, A.S. Urbanisation on the Coastline of the Most Populous and Developed State of Brazil: The Extent of Coastal Hardening and Occupations in Low-Elevation Zones. Anthr. Coasts 2024, 7, 15. [Google Scholar] [CrossRef]
  3. Franz, G.; Garcia, C.A.E.; Pereira, J.; de Freitas Assad, L.P.; Rollnic, M.; Garbossa, L.H.P.; da Cunha, L.C.; Lentini, C.A.D.; Nobre, P.; Turra, A.; et al. Coastal Ocean Observing and Modelling Systems in Brazil: Initiatives and Future Perspectives. Front. Mar. Sci. 2021, 8, 681619. [Google Scholar] [CrossRef]
  4. Aguiar, L.S.; Amaro, V.E.; Araújo, P.V.N.; Santos, A.L.S. Low Cost Geotechnology Applied to Flood Risk Assessment in Coastal Urban Areas in Climate Change Scenarios. Geosci. Inst. Yearb. 2019, 42, 267–290. [Google Scholar] [CrossRef]
  5. Boori, M.S. Coastal vulnerability, adaptation and risk assessment due to environmental change in Apodi-Mossoro estuary, Northeast Brazil. Int. J. Geomat. Geosci. 2010, 1, 620. [Google Scholar]
  6. Araújo, V.N.; Amaro, V.E.; Aguiar, L.S.; Lima, C.C.; Lopes, A.B. Tidal flood area mapping in the face of climate change scenarios: Case study in a tropical estuary in the Brazilian semi-arid region. Nat. Hazards Earth Syst. Sci. 2021, 21, 3353–3366. [Google Scholar] [CrossRef]
  7. Vital, H.; Silveira, I.M.d.; Tabosa, W.F.; Lima, Z.M.C.; Lima-Filho, F.P.; Souza, F.E.S.; Chaves, M.S.; Pimenta, F.M.; Gomes, M.P. Beaches of Rio Grande do Norte. In Brazilian Coastal Zone: Coastal Evolution, Management and Sustainability; Vieira, J., de Lacerda, L.D., Krelling, A.P., Eds.; Coastal Research Library; Springer: Cham, Switzerland, 2016; Volume 19, pp. 201–229. [Google Scholar] [CrossRef]
  8. The WAM Group. The WAM Model—A Third Generation Ocean Wave Prediction Model. J. Phys. Oceanogr. 1988, 18, 1775–1810. [Google Scholar] [CrossRef]
  9. Tolman, H.L.; Balasubramaniyan, B.; Burroughs, L.D.; Chalikov, D.V.; Chao, Y.Y.; Chen, H.S.; Gerald, V.M. Development and Implementation of Wind-Generated Ocean Surface Wave Models at NCEP. Weather Forecast 2002, 17, 311–333. [Google Scholar] [CrossRef]
  10. Booij, N.; Ris, R.C.; Holthuijsen, L.H. A Third-Generation Wave Model for Coastal Regions: 1. Model Description and Validation. J. Geophys. Res. Oceans 1999, 104, 7649–7666. [Google Scholar] [CrossRef]
  11. Holthuijsen, L.H. Waves in Oceanic and Coastal Waters; Cambridge University Press: Cambridge, UK, 2007. [Google Scholar] [CrossRef]
  12. Komen, G.J.; Cavaleri, L.; Donelan, M.A.; Hasselmann, K.; Hasselmann, S.; Janssen, J. Dynamics and Modelling of Ocean Waves; Cambridge University Press: Cambridge, UK, 1994. [Google Scholar] [CrossRef]
  13. Liu, Q.-X.; Rogers, W.J.; Babanin, A.V.; Young, I.S.; Romero, L.; Zieger, S.; Qiao, F.; Guan, C. Observation-Based Source Terms in the Third-Generation Wave Model WAVEWATCH III: Updates and Verification. J. Phys. Oceanogr. 2019, 49, 489–517. [Google Scholar] [CrossRef]
  14. Quetzalcóatl, O.; González, M.; Cánovas, V.; Medina, R.; Espejo, A.; Klein, A.; Tessler, M.G.; Almeida, L.R.; Jaramillo, C.; Garnier, R.; et al. SMC, a coastal modelling system for assessing beach processes and coastal interventions: Application to the Brazilian coast. Environ. Model. Softw. 2019, 116, 131–152. [Google Scholar] [CrossRef]
  15. González, M.; Gutiérrez, O.; Cánovas, V.; Kakeh, N.; Medina, R.; Espejo, A.; Mendez, F.; Abascal, A.J.; Castanedo, S.; Martinez, C.; et al. The New Coastal Modelling System SMC-Brasil and Its Application to the Erosional Problem in the Massaguaçu Beach (São Paulo, Brazil). Proc. Int. Coast. Conf. Eng. 2014, 1, 49. [Google Scholar] [CrossRef]
  16. Julio, F.M.S.; Manzolli, R.P.; Portz, L.; Barboza, E.G. Geomorphological responses due to storm wave events at Praia da Barra, Garopaba—Santa Catarina State, Southern Brazil. J. Coast. Res. 2020, 95, 474. [Google Scholar] [CrossRef]
  17. Rodrigues, T.K.; Dominguez, J.M.L. Use of the Coastal Modeling System (SMC-Brasil) in the study of the dynamics of the coast of the Aracaju-Sergipe. Rev. GeoNordeste 2017, 2, 95–116. [Google Scholar]
  18. Gomes, G.; da Silva, A.C. Coastal erosion case at Candeias Beach (NE-Brazil). J. Coast. Res. 2014, 71, 30–40. [Google Scholar] [CrossRef]
  19. Fernandes, D.; Castro, J.W.A. Longshore sediment transport rate in Formosa Bay, Rio de Janeiro State-Southeast Brazil. J. S. Am. Earth Sci. 2024, 137, 104834. [Google Scholar] [CrossRef]
  20. Almeida, L.R.d.; Amaro, V.E.; Marcelino, A.M.T.; Scudelari, A.C. Wave Climate Evaluation of Ponta Negra Beach (RN, Brazil) through the Use of SMC-Brasil and Its Contribution to Coastal Management. Rev. Gestão Costeira Integr. 2015, 15, 135–151. [Google Scholar] [CrossRef]
  21. Onofre, J.; Rodrigues, A.; Silva, R.; de Lira, S. Morphological and sedimentary patterns of a semi-arid shelf, Northeast Brazil. Geo-Mar. Lett. 2019, 40, 835–842. [Google Scholar] [CrossRef]
  22. Lacerda, L.D.; Ferreira, A.C.; Borges, R.; Ward, R. Challenges to mangroves of the semiarid equatorial coast of Brazil in the Anthropocene. Camb. Prisms Coast. Futures 2024, 2, 16. [Google Scholar] [CrossRef]
  23. Soares, M.S.; Campos, C.C.; Bastos, P.; Barroso, H.S.; Marins, R.V.; Teixeira, C.; Ozilea, M.L.; Feitosa, C.V.; Sánchez-Botero, J.I.; Ernesto, L.; et al. Challenges and perspectives for the Brazilian semi-arid coast under global environmental changes. Perspect. Ecol. Conserv. 2021, 19, 267–278. [Google Scholar] [CrossRef]
  24. Rabelo, T.O.; Túlio, M.; Gabriela, I.; Luiza, M.; Queiroz, L.S.; Paulo; Pereira, P. Risk of Degradation and Coastal Flooding Hazard on Geoheritage in Protected Areas of the Semi-Arid Coast of Brazil. Water 2023, 15, 2564. [Google Scholar] [CrossRef]
  25. Intergovernmental Panel on Climate Change (IPCC). Climate Change 2022: Impacts, Adaptation and Vulnerability; Contribution of Working Group II to the Sixth Assessment Report of the Intergovernmental Panel on Climate Change; Pörtner, H.-O.O., Roberts, D.C., Tignor, M., Poloczanska, E.S., Mintenbeck, K., Alegría, A., Craig, M., Langsdorf, S., Löschke, S., Möller, V., et al., Eds.; Cambridge University Press: Cambridge, UK, 2023; 3056p. [Google Scholar]
  26. Diniz, M.T.M.; Vasconcelos, F.P.; Martins, M.B. Technological innovation in Brazilian sea salt production and the resulting socio-territorial changes: An analysis from the perspective of Schumpeter’s Theory of Entrepreneurship. Soc. Nat. 2015, 27, 421–437. [Google Scholar] [CrossRef]
  27. Kelly, B.; Lucio, P.S. Characterisation of risk/exposure to climate extremes for the Brazilian Northeast-Case study: Rio Grande do Norte. Theor. Appl. Climatol. 2014, 122, 59–67. [Google Scholar] [CrossRef]
  28. Medeiros, F.J.; Gomes, R.S.; Coutinho, M.D.L.; Lima, K.C. Meteorological droughts and water resources: Historical and future perspectives for Rio Grande do Norte State, Northeast Brazil. Int. J. Climatol. 2022, 42, 6976–6995. [Google Scholar] [CrossRef]
  29. Barbosa, M.E.F.; Boski, T.; Bezerra, F.H.R.; Lima-Filho, F.P.; Gomes, M.P.; Pereira, L.C.; Maia, R.P. Late Quaternary Infilling of the Assu River Embayment and Related Sea Level Changes in NE Brazil. Mar. Geol. 2018, 405, 23–37. [Google Scholar] [CrossRef]
  30. Vital, H.; Rocha, G.R.; Plácido, J.S. Morphodynamics of Arrombado Tidal Inlet, Macau-RN (NE Brazil). In Proceedings of the Coastal Sediments 2011; World Scientific: Singapore, 2011; pp. 327–338. [Google Scholar] [CrossRef]
  31. Vital, H. The Mesotidal Barriers of Rio Grande do Norte. In Geology and Geomorphology of Holocene Coastal Barriers of Brazil; Dillenburg, S.R., Hesp, P.A., Eds.; Lecture Notes in Earth Sciences, vol. 107; Springer: Berlin/Heidelberg, Germany, 2009; pp. 231–261. [Google Scholar] [CrossRef]
  32. McGranahan, G.; Balk, D.; Anderson, B. The rising tide: Assessing the risks of climate change and human settlements in low elevation coastal zones. Environ. Urban 2007, 19, 17–37. [Google Scholar] [CrossRef]
  33. Directorate of Hydrography and Navigation (DHN). Raster Nautical Charts—Navy Hydrography Centre. 2025. Available online: https://www.marinha.mil.br/chm/dados-do-segnav/cartas-raster (accessed on 7 May 2025).
  34. Araújo, P.V.N.; Amaro, V.E.; Alcoforado, A.V.C.; Santos, A.L.S. Vertical Accuracy and Calibration of Digital Elevation Models (DEMs) for the Piranhas-Assu River Basin, Rio Grande do Norte. Yearb. Inst. Geosci. 2018, 41, 351–364. [Google Scholar] [CrossRef]
  35. Vital, H.; Gomes, M.P.; Tabosa, W.F.; Pires, F.E.; Claude, S.; Saraiva, J. Characterisation of the Brazilian continental shelf adjacent to Rio Grande do Norte State, NE Brazil. Braz. J. Oceanogr. 2010, 58, 43–54. [Google Scholar] [CrossRef]
  36. Longuet-Higgins, M.S.; Stewart, R.W. Radiation stresses in water waves; a physical discussion, with applications. Deep Sea Res. Oceanogr. Abstr. 1964, 11, 529–562. [Google Scholar] [CrossRef]
  37. Soulsby, R. Dynamics of Marine Sands: A Manual for Practical Applications; Thomas Telford: London, UK, 1997; 245p. [Google Scholar]
  38. Reguero, B.G.; Menéndez, M.; Méndez, F.J.; Mínguez, R.; Losada, I.J. A Global Ocean Wave (GOW) Calibrated Reanalysis from 1948 Onwards. Coast. Eng. 2012, 65, 38–55. [Google Scholar] [CrossRef]
  39. Camus, P.; Mendez, F.J.; Medina, R.; Tomas, A.; Izaguirre, C. High resolution downscaled ocean waves (DOW) reanalysis in coastal areas. Coast. Eng. 2013, 72, 56–68. [Google Scholar] [CrossRef]
  40. Camus, P.; Mendez, F.J.; Medina, R. A Hybrid Efficient Method to Downscale Wave Climate to Coastal Areas. Coast. Eng. 2011, 58, 851–862. [Google Scholar] [CrossRef]
  41. González, M.; Medina, R.; Gonzalez-Ondina, J.; Osorio, A.; Méndez, F.J.; García, E. An integrated coastal modelling system for analysing beach processes and beach restoration projects, SMC. Comput. Geosci. 2007, 33, 916–931. [Google Scholar] [CrossRef]
  42. Gomes, G.; Costa, A. Nearshore wave analysis in the Brazilian Northeast based on observations and numerical models. J. Oper. Oceanogr. 2018, 11, 44–53. [Google Scholar] [CrossRef]
  43. Sprovieri, F.C.; Scotti, A. Scheme of the wave climate in shallow water for numerical modelling (2DH) of sand transport potential on the Cassino Beach, Rio Grande, Brazil. In Proceedings of the Coastal Sediments 2011; World Scientific: Singapore, 2015. [Google Scholar] [CrossRef]
  44. Silva, P.G.; Klein, A.H.F.; González, M.; Gutierrez, O.; Espejo, A. Performance assessment of the database downscaled ocean waves (DOW) on Santa Catarina coast, South Brazil. An. Acad. Bras. Ciênc. 2015, 87, 623–634. [Google Scholar] [CrossRef] [PubMed]
  45. Oliveira, T.C.A.; Albino, J.; Venancio, I. Longitudinal sediment transport on the coast of the Rio Doce deltaic plain. Quat. Environ. Geosci. 2015, 6, 20–25. [Google Scholar] [CrossRef]
  46. Eguchi, B.M.M.; Albino, J. Bluff retreat induced by wave action on a tropical beach, in Espírito Santo, Brazil. Rev. Bras. Geofísica 2018, 36, 569–580. [Google Scholar] [CrossRef]
  47. Silva, I.R.; Guimarães, J.K.; Rodrigues, T.K.; Fernandino, G. Wave climate and sediment transport modelling using SMC-Brasil: Applications to Praia do Forte, northern coast of Bahia State. Rev. Bras. Geomorfol. 2016, 17, 4. [Google Scholar] [CrossRef]
  48. Rodríguez, M.G.; Nicolodi, J.L.; Gutiérrez, O.Q.; Losada, V.C.; Hermosa, A.E. Brazilian coastal processes: Wind, wave climate and sea level. In Brazilian Beach Systems; Short, A., Klein, A., Eds.; Coastal Research Library; Springer: Cham, Switzerland, 2016; Volume 17, pp. 37–66. [Google Scholar] [CrossRef]
  49. Costa, G.; Pinto, F.T. Modelling of the coastal defence scheme of Espinho, Portugal. J. Coast. Conserv. 2012, 16, 211–221. [Google Scholar] [CrossRef]
  50. Molina, R.; Manno, G.; Villar, A.C.; Jigena-Antelo, B.; Muñoz-Pérez, J.J.; Cooper, J.A.G.; Pranzini, E.; Anfuso, G. The Effects of Anthropic Structures on Coastline Morphology: A Case Study from the Málaga Coast (Spain). J. Mar. Sci. Eng. 2025, 13, 319. [Google Scholar] [CrossRef]
  51. Ortega, A.Y.; Otero Díaz, L.J.; Cueto, J.E. Assessment and management of coastal erosion in the marine protected area of the Rosario Island archipelago (Colombian Caribbean). Ocean Coast. Manag. 2023, 239, 106605. [Google Scholar] [CrossRef]
  52. Abdelay, M.M.; Rashwan, I.M.; Shalby, A.; Omara, H.M. Modelling of Nearshore Wave Transformations behind Submerged Breakwaters. J. Eng. Res. 2023, 7, 6. [Google Scholar]
  53. Jaramillo Cardona, C.; Pellón de Pablo, E.; de Freitas Pereira, L.; González Rodríguez, M. Assessment of Coastal Morphodynamics in the Reef-Sheltered Littoral of Sosúa, Dominican Republic. 2025. Available online: https://ssrn.com/abstract=5184858 (accessed on 7 May 2025).
  54. Barman, N.K. Nearshore Morphological Alteration through Sediment Dynamics: An Integrated Software Based (Coastal Modelling System-SMC) Approach for Deltaic Balasore Coast, Odisha, India. In Crisis on the Coast and Hinterland; Paul, A.K., Paul, A., Eds.; Springer: Cham, Switzerland, 2023. [Google Scholar] [CrossRef]
  55. Camus, P.; Mendez, F.; Medina, R.; Cofiño, A.S. Analysis of clustering and selection algorithms for the study of multivariate wave climate. Coast. Eng. 2011, 58, 453–462. [Google Scholar] [CrossRef]
  56. Pinheiro, L.R.S.G.; Souza, R.F.; Amaro, V.E.; Spyrides, M.H.C. 40 Years Extreme Offshore Waves off the Eastern Continental Shelf of Rio Grande do Norte, Northeast Brazil. Rev. Bras. Geogr. Física 2023, 16, 1040–1059. [Google Scholar] [CrossRef]
  57. Pinheiro, L.R.S.G.; Gurgel, D.F.; Barros, J.E.C.; Teixeira, A.F.N.; Scudelari, A.C.; Amaro, V.E. Wave Climate Characterisation on the Continental Shelf of Rio Grande do Norte, NE/Brazil, through SMC-Brasil. Rev. Geol. 2017, 30, 283–302. [Google Scholar]
  58. Klein, A.H.F.; Short, A.D. Brazilian Beach Systems: Introduction. In Brazilian Beach Systems; Short, A.D., Klein, A.H.F., Eds.; Coastal Research Library; Springer: Cham, Switzerland, 2016; Volume 17. [Google Scholar] [CrossRef]
  59. Frota, F.F.; Truccolo, E.C.; Schettini, C.A.F. Tidal and Sub-Tidal Sea Level Variability at the Northern Shelf of the Brazilian Northeast Region. An. Acad. Bras. Ciênc. 2016, 88, 1371–1386. [Google Scholar] [CrossRef]
  60. Matos, M.F.A.; Scudelari, A.C.; Amaro, V.E.; Fortes, C.J.E.M. Integration of Numerical Modelling (SWAN) and Field Data in the Determination of Wave Climate on the Northern Coast of Rio Grande do Norte. Rev. Bras. Geomorfol. 2017, 18, 311–328. [Google Scholar] [CrossRef]
  61. Matos, M.F.A.; Amaro, V.E.; Fortes, C.J.; Scudelari, A.C. Interaction between Ocean Waves and Seafloor: Results from the Northern Continental Shelf of Rio Grande do Norte. Rev. Bras. Geomorfol. 2014, 15, 511–524. [Google Scholar] [CrossRef]
  62. Matos, M.F.A.; Amaro, V.E.; Scudelari, A.C.; Bezerra, A.C.N. Statistical Analysis of Significant Wave Heights from Short-Term Time Series on the Coast of Rio Grande do Norte. Res. Geosci. 2019, 46, e0731. [Google Scholar] [CrossRef]
  63. Stewart, R.H. Ocean Waves. In Introduction to Physical Oceanography; Stewart, R.H., Ed.; A & M University: College Station, TX, USA, 2006. [Google Scholar]
  64. NASA—National Aeronautics and Space Administration. Sea Level Projection Tool. NASA, 2023. Available online: https://sealevel.nasa.gov/ipcc-ar6-sea-level-projection-tool (accessed on 4 May 2024).
  65. Battjes, J.A.; Janssen, J.P.F.M. Energy Loss and Set-Up Due to Breaking of Random Waves. Coast. Eng. 1978, 1, 569–587. [Google Scholar] [CrossRef]
  66. Nascimento, F.C.; Vital, H.; Araújo, I.R.F.; Gomes, M.P. Sand Ridges Field in the North Inner Shelf of Rio Grande do Norte, Adjacent to Galinhos-Guamaré, Brazil. Anuário Inst. Geociênc. UFRJ 2019, 42, 50–58. [Google Scholar] [CrossRef]
  67. Cabral, A.P.; Noernberg, M.A. Morphological Characteristics of an Open Shelf Ridge at Rio Grande do Norte Continental Shelf, NE Brazil. J. Coast. Res. 2024, 40, 6. [Google Scholar] [CrossRef]
  68. Almeida, N.M.d.; Vital, H.; Gomes, M.P. Morphology of Submarine Canyons along the Continental Margin of the Potiguar Basin, NE Brazil. Mar. Pet. Geol. 2015, 68, 307–324. [Google Scholar] [CrossRef]
  69. Figueroa, P.A.; Saldías, G.S.; Allen, S.E. The influence of a submarine canyon on the wind-driven downwelling circulation over the continental shelf. Ocean Sci. 2025, 21, 643–659. [Google Scholar] [CrossRef]
  70. Kämpf, J. On the Dynamics of Canyon-Flow Interactions. J. Mar. Sci. Eng. 2018, 6, 129. [Google Scholar] [CrossRef]
  71. Marcelino, A.M.T.; Pinheiro, L.R.S.G.; Costa, J.R.S. Participatory Planning for Coastal Zone Management in Galinhos/RN, Northeastern Brazil, Supported by Remote Sensing and Coastal Modelling. Dev. Environ. 2018, 44, 118–139. [Google Scholar] [CrossRef]
  72. Silva, F.E.; Vital, H. Quantifying the High Coastal Dynamics of Tropical Mesotidal Barrier Island-Spit Systems: Case Study in Northeast Brazil. Geo-Mar. Lett. 2019, 40, 897–909. [Google Scholar] [CrossRef]
  73. Claudino-Sales, V.; Carvalho, A.M.d. Coastal dynamics controlled by headlands in the state of Ceará, Northeastern Brazil. Geosciences (UNESP) 2014, 33, 579–595. [Google Scholar]
  74. Monaco, A.P.; Courp, T.; Heussner, S.; Carbonne, J.; Fowler, S.W.; Deniaux, B. Seasonality and Composition of Particulate Fluxes during ECOMARGE-I, Western Gulf of Lions. Oceanol. Acta 1990, 10, 959–987. [Google Scholar] [CrossRef]
  75. Diniz, M.T.M.; Oliveira, G.P.d. Proposal for Meso-Scale Compartmentalisation of the Northeastern Brazilian Coast. Rev. Bras. Geomorfol. 2016, 17, 597–610. [Google Scholar] [CrossRef]
  76. Ashton, A.D.; Murray, A.B. High-Angle Wave Instability and Emergent Shoreline Shapes: 1. Modelling of Sand Waves, Flying Spits, and Capes. J. Geophys. Res. 2006, 111, F04011. [Google Scholar] [CrossRef]
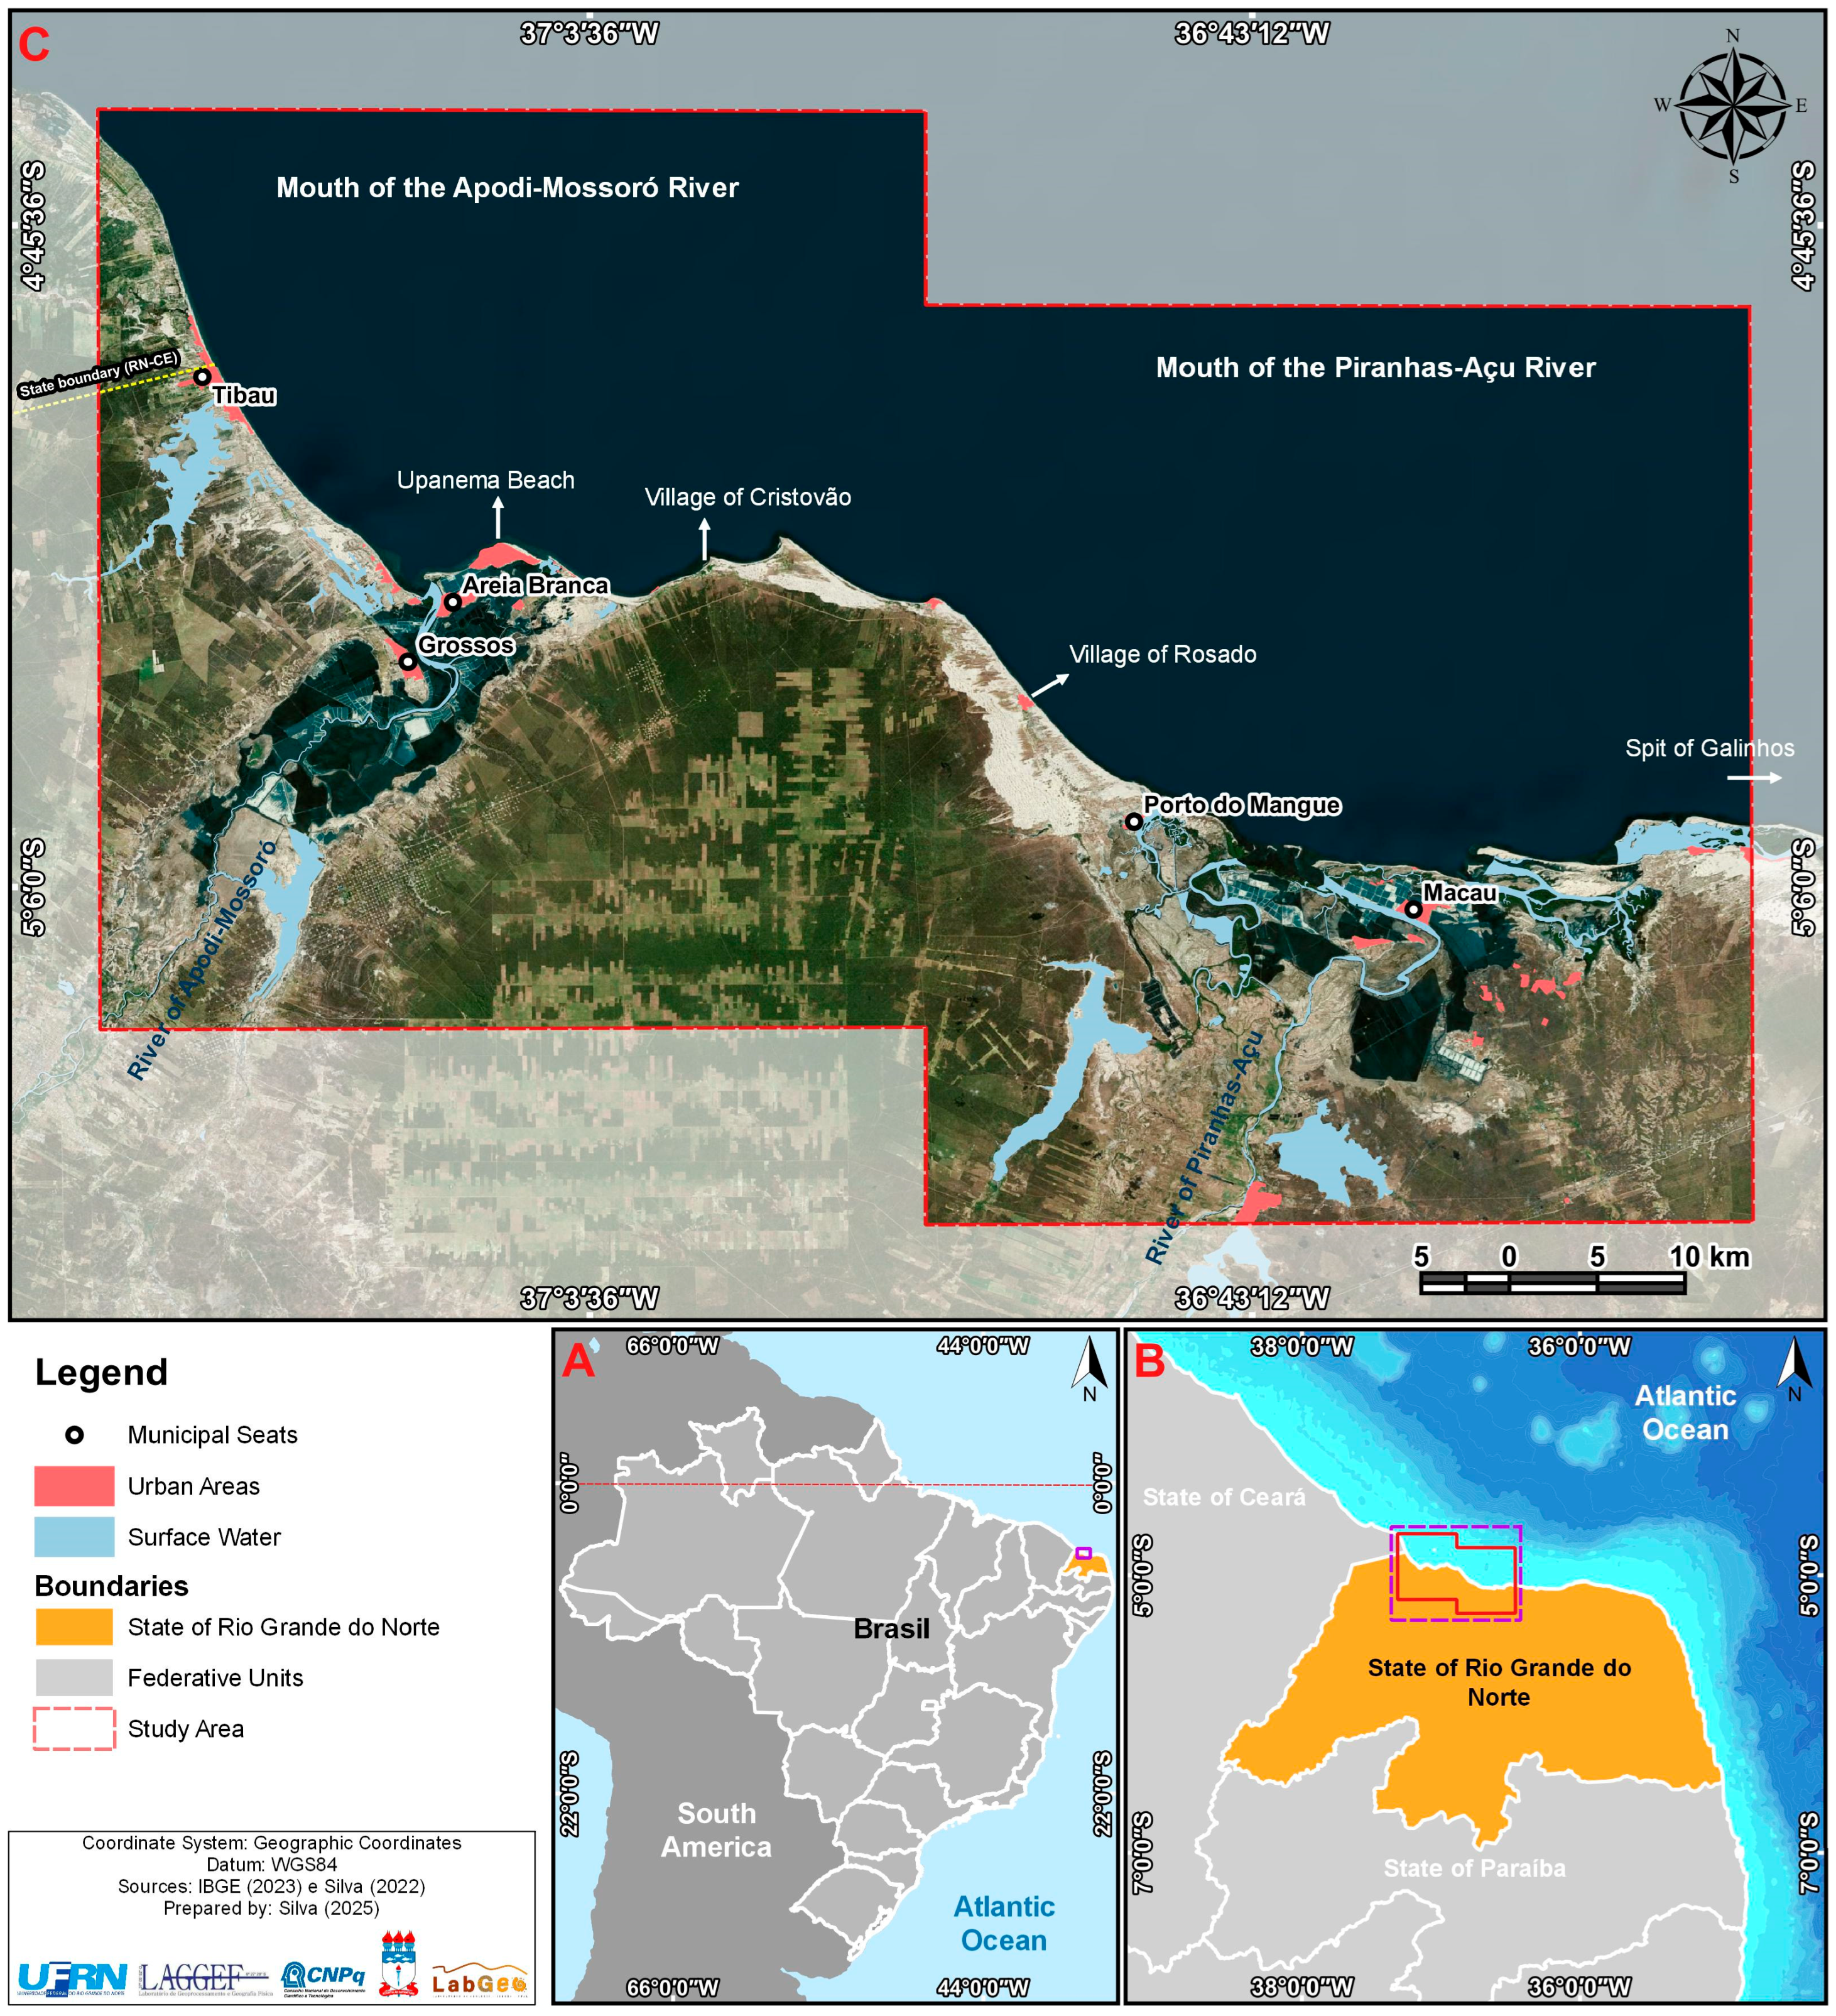
Figure 1. Study area showing the boundaries of Costa Branca and the main urbanised zones in the region, highlighting the extensive salt flats in the estuarine areas. (A)—Brazil; (B)—State of Rio Grande do Norte; and (C)—study area.
Geosciences 15 00344 g001
Figure 2. Comparison of bathymetries. (A)—Bathymetry derived from BACO, default configuration of the SMC-Brasil platform; (B)—harmonised bathymetry refined with detailed data. The insertion of detailed bathymetry is essential for the quality of the output product.
Geosciences 15 00344 g002
Figure 3. Development stages of processes and model execution within the SMC-Brasil system. The red dot represents the DOW point collected.
Geosciences 15 00344 g003
Figure 4. Propagation grids and analysis execution points of SMC-Brasil. (A)—Grids configured for wave propagation from the northern spectrum; (B)—grids for wave propagation from the east. The same detail points were used for each grid, as well as the same DOW reference point.
Geosciences 15 00344 g004
Figure 5. Stepwise dynamics with models used [40,41,42,43,44,45,46,47,48,49,50,51,52,53,54,55] and their purposes in the present study. It is important to note that the propagation processes are complementary, with relationships in the execution stages of OLUCA, COPLA, and EROS, having dependencies on input data and subprocesses.
Geosciences 15 00344 g005
Figure 6. Wave climate characterisation on the continental shelf: preferential incidence directions and non-exceedance parameters. The red line indicates strategic percentages of the region’s marine dynamics. The orange line indicates the average position of the 95% non-exceedance value. The red rectangles indicate the predominant indicators of marine processes.
Geosciences 15 00344 g006
Figure 7. Collected patterns of tidal levels, astronomical tides, and meteorological tides, along with detailed statistical analyses. The red dashed lines indicate the position of the 95% non-exceedance probability value; the orange lines indicate the position of return periods of approximately 50 years.
Geosciences 15 00344 g007
Figure 8. Detailed wave climate from sampling points 1 to 15 and the direction of the predominant energy flux. It is important to mention that the DOW point used exhibited directional patterns correlated with the detail points and the energy flux directions, derived from the average pattern in wave modelling from north to east, allowing for a comparative parallel between the two data sets when analysed in light of the selected point outside the platform, initially collected for the purpose of validating the collected DOW point.
Geosciences 15 00344 g008
Figure 9. Historical series with calculated flood level. Trends based on historical flood level (FL) data. On the left, mean and annual time series of flood levels. On the right, trend of relative flood level elevation (η) from 1948 to 2008, with mean line (black), 90% confidence interval (blue dashed), and outliers (red circles). The estimated increase rate is 2.10 mm/year.
Geosciences 15 00344 g009
Figure 10. Simulations were performed on the grid under low, mid, and high tide conditions. (A)—Shows the bathymetric mesh used, which remained the same for all scenarios; the suffixes indicate grid openings, where 1 refers to grids open to northern wave directions and 2 to eastern directions; (B)—illustrates wave modelling under different astronomical conditions; (C)—represents wave-induced currents; and (D)—presents the different sediment transport scenarios. Distinct propagation patterns can be observed among the scenarios.
Geosciences 15 00344 g010
Figure 11. Processes observed in the study area, with zoom-in views of the most dynamic zones as defined by the modelling, including indicators of variability and detailed aspects of these areas.
Geosciences 15 00344 g011
Figure 12. Spatial configurations observed in situ. (A)—Sandy spit at Upanema Beach, northern Areia Branca municipality; (B)—beach and sandbars in the village of São Cristovão, eastern Areia Branca municipality; (C)—tidal retreat in the village of Rosado, in the central portion of the study area, northern Porto do Mangue municipality; and (D)—ebb tide regime at the mouth of the Apodi-Mossoró River, in the northern portion of Grossos municipality.
Geosciences 15 00344 g012
Table 1. Characteristics of the computational grids used in propagation modelling.
Grid (Context)—Number-
Name Grid
Resolution (m)Orientation (°)Directional Wave Spreading
Grid 01-1—Eastern2545North
Grid 01-2—Eastern25117East
Grid 02-1—Piranhas-Açu2510North
Grid 02-2—Piranhas-Açu25135East
Grid 03-1—Intermediate2520North
Grid 03-2—Intermediate2563East
Grid 04-1—Apodi-Mossoró2529North
Grid 04-2—Apodi-Mossoró2548East
Grid 05-1—Western250North
Grid 05-2—Western2570East
Disclaimer/Publisher’s Note: The statements, opinions and data contained in all publications are solely those of the individual author(s) and contributor(s) and not of MDPI and/or the editor(s). MDPI and/or the editor(s) disclaim responsibility for any injury to people or property resulting from any ideas, methods, instructions or products referred to in the content.