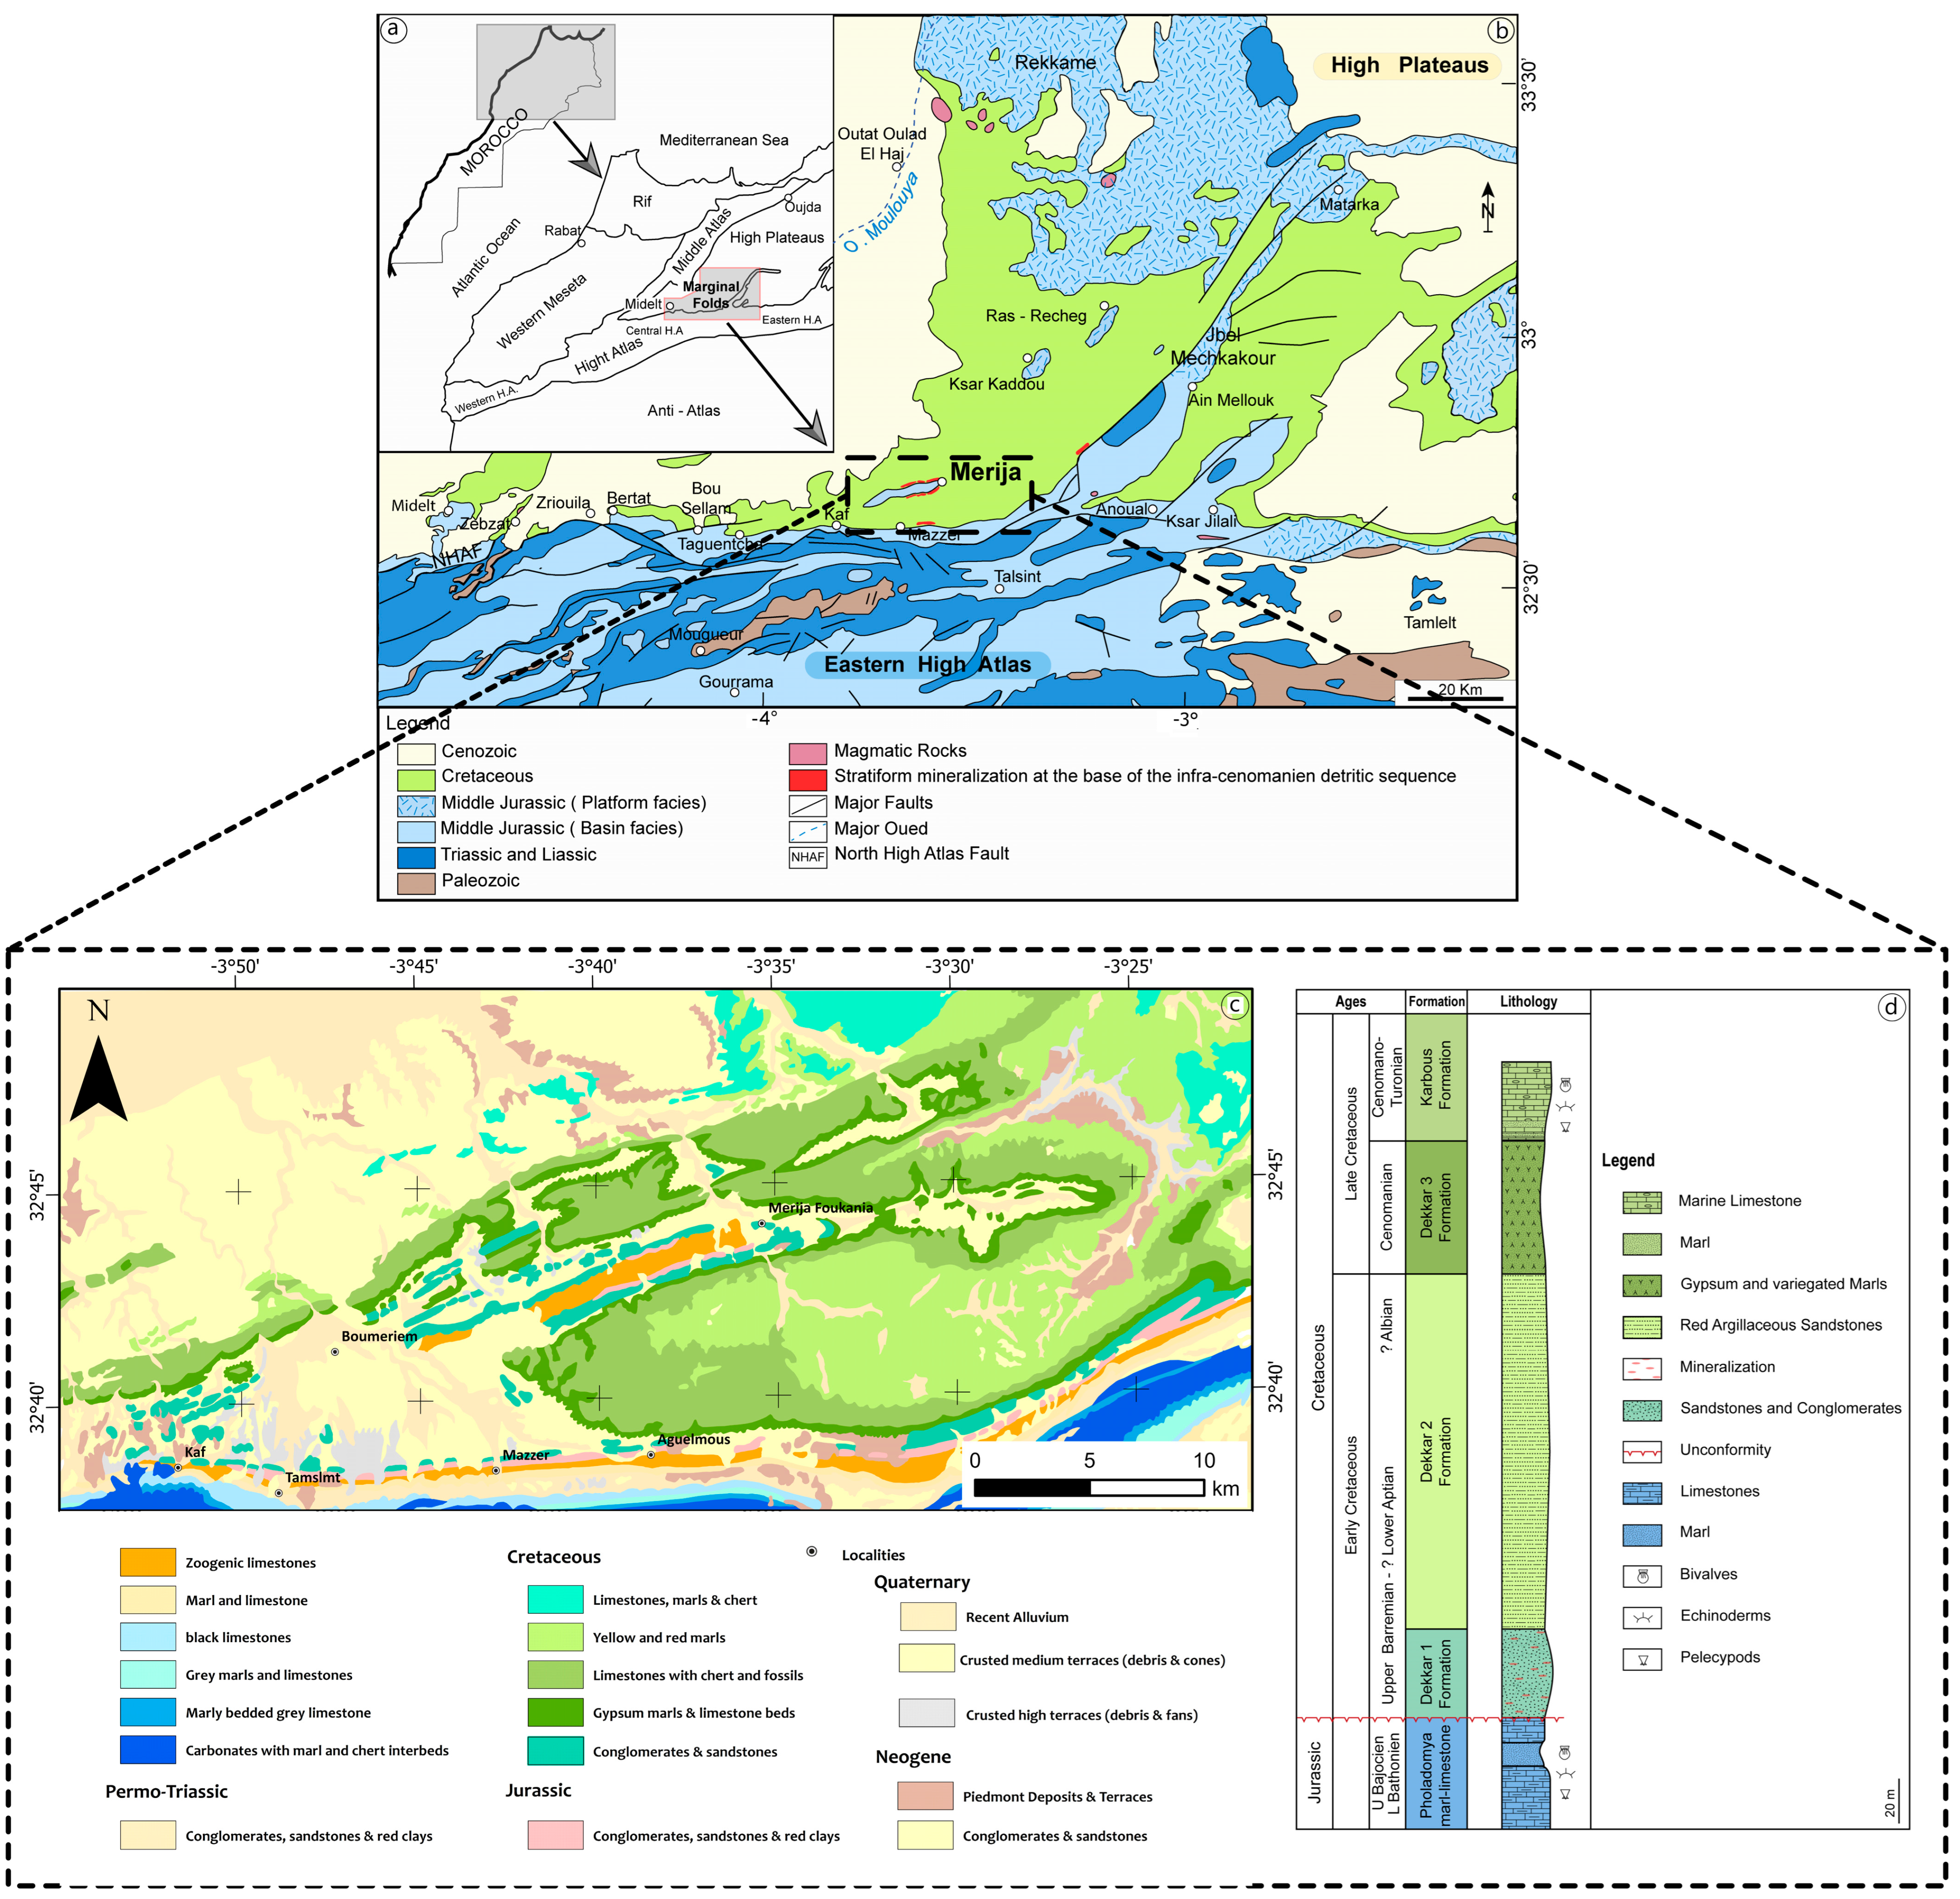
1. Introduction
Africa hosts significant mining potential, particularly for sedimentary copper deposits. The Lower Cretaceous detrital formations, which are widespread across the continent, are especially conducive to the accumulation of copper mineralization, as exemplified by the Central African Copperbelt [
1,
2,
3,
4,
5] and the deposits in Angola [
6,
7,
8]. These districts share common geological features, fluid-controlling structures, and reactive host rocks that favor copper precipitation. In Morocco, the Merija region is a prime exploration target thanks to its NE–SW-oriented anticline structure and its favorable geological setting. The Merija mine, the only historical copper exploitation in the Missour Basin [
9,
10,
11], is located within Lower Cretaceous formations, locally known as Infracenomanian. These unfossiliferous detrital rocks unconformably overlie marine and continental Jurassic formations, remnants of a rift basin related to the breakup of Pangea during the Triassic [
12]. The Cenozoic Alpine Orogeny subsequently inverted the basin’s tectonics, reactivating ancient normal faults as thrusts, thereby forming anticline structures and the Atlas Mountains [
13,
14,
15].
The Merija mine has experienced several phases of activity. First exploited in the 1960s [
9,
10,
11], it remained inactive until exploration activities resumed in the 2000s. Since 2019, the mine has been producing approximately 260 tons of ore per month, with an average grade between 0.6% and 0.8% Cu. The ore, rich in malachite, is processed by flotation, following crushing and grinding, using vegetable oil, sodium hydrosulfide, and amyl xanthate to produce a concentrate grading around 30% Cu and 200 ppm Ag. The mineralization is hosted in infracenomanian sandstones and conglomerates, with thicknesses of up to 5 m and a lateral continuity of about 70 m. Mineralogically, it is characterized by malachite (Cu
2CO
3(OH)
2), with occasional traces of cuprite, chalcocite, and galena. Arrowhead structures of galena have been reported in the paleochannels of the conglomerates [
11].
Several recent studies have deepened our understanding of the geology and copper mineralization of the Merija region. Caïa proposed a fundamental sedimentary model linking mineralization to Lower Cretaceous sandstones and their sedimentological and paleogeographic context [
9]. Haddoumi et al. 2019 refined the age of the Infracenomanian formations of the eastern High Atlas marginal folds, dating them to the upper Barremian–lower Aptian, and highlighted a paleogeographic evolution marked by restricted marine environments [
16]. Bouzekraoui et al. 2022 confirmed the stratiform nature of the mineralization, emphasizing the role of fluvial–deltaic paleocurrents in the heterogeneous distribution of mineralization [
17]. Finally, Zouggarh et al. 2024 used reflectance spectroscopy and multispectral data to map fractures and hydrothermal alterations, demonstrating the key role of NE–SW and N–S faults as conduits for mineralizing fluids [
18].
Despite the quality of the outcrops and previous work, the deep rooting of the Merija anticline remains poorly defined, particularly beneath the thick Quaternary cover that obscures part of the geological formations. This often-thick cover limits direct observation and complicates the characterization of deep-seated structures and potential mineralization traps. To overcome these limitations, the present study adopts a multi-method geophysical approach combining gravity, electrical resistivity (ER), and induced polarization (IP) methods. A high-resolution gravity survey was conducted to highlight density contrasts and trace the continuity of the anticline beneath the Quaternary cover. In addition, ER and IP surveys were carried out to characterize lithological variations and assess the geoelectrical response of mineralized zones. An additional resistivity profile perpendicular to a major regional fault was also implemented to estimate the thickness of Quaternary deposits.
Electrical methods have proven effective in the exploration of sediment-hosted copper deposits. IP is especially sensitive to disseminated sulfides such as chalcopyrite and bornite, commonly associated with stratiform copper mineralization. However, these methods tend to be less responsive to oxide copper phases like malachite and cuprite, which are more resistive and exhibit lower chargeability [
19,
20,
21,
22]. This limitation is particularly relevant in the Merija area, where malachite is the dominant mineralization phase. One of the key objectives of this study was to evaluate whether malachite-rich zones can generate detectable IP signals under real field conditions. Recent studies have shown that when electrical methods are combined with geological context and borehole validation, they can greatly enhance the accuracy of mineral exploration in sedimentary settings [
23,
24,
25,
26].
Gravity methods, in parallel, offer valuable insights for imaging deep structures in regions masked by thick alluvial or sedimentary cover. Through the detection of rock density variations, gravity surveys can delineate buried anticlines, basement highs, and major faults that are not accessible through surface mapping alone [
27,
28]. This makes gravity a particularly suitable tool in complex structural contexts such as Merija, where conventional geological methods are constrained by the extent of the Quaternary deposits.
This integrated approach aims to improve the understanding of the structural basement of the Merija region and to identify new exploration targets for stratiform copper within the marginal folds of the eastern High Atlas.
3. Materials and Methods
3.1. Materials
This study employed two complementary geophysical methods to investigate the subsurface structures associated with the Merija anticline. Gravity measurements were acquired using a high-resolution Scintrex CG-5 gravimeter to detect density variations related to deep geological features beneath the Quaternary cover. In parallel, electrical resistivity and induced polarization (IP) data were collected using the Elrec Pro receiver and VIP 5000 transmitter to characterize the electrical behavior of subsurface formations and to assess the presence of mineralized zones. The integration of these methods allows for a more complete understanding of the geometry and geophysical signatures of the buried anticline structure.
3.1.1. Gravity Survey
The gravity survey covered a total area of 99 km2, with stations spaced at 100 m intervals to ensure high-resolution coverage. Data acquisition was performed using a Scintrex CG-5 gravimeter, a high-precision instrument capable of detecting slight gravitational variations with a sensitivity and resolution of 0.001 mGal, offering a measurement range of more than 8000 mGal. To enhance the accuracy of the results, several standard corrections were applied to the raw data, including drift correction, latitude correction, terrain correction, free-air correction, and Bouguer anomaly correction. Additionally, outlier suppression techniques were employed to eliminate potential measurement errors. The gravity data were processed using Geosoft Oasis Montaj software, incorporating the minimum curvature interpolation technique to generate Bouguer anomaly maps, as well as the trend filter to remove regional-scale trends and highlight local structural features. A total of nine gravity profiles were acquired across the study area, covering a transect from the northeast, where the Merija anticline outcrops, to the southwest. This configuration was designed to capture the full extent of the structural variations within the surveyed area.
Polynomial filters and statistical tools are commonly used to handle large volumes of geophysical data, among which are spatial one-dimensional (1D) filters that allow for data smoothing, either with or without nonlinear filtering. One of the most used 1D filters is the polynomial filter, which estimates an
n-th order polynomial trend, up to nine, for a data channel using a least-squares best-fit approach. The estimated trend is then stored in a new channel, and an optional residual channel can also be generated by subtracting the regional trend from the original data. Polynomial surfaces are among the most commonly applied methods for analyzing gravity anomalies [
36,
37]. These surfaces provide an approximation of the regional anomaly by fitting a polynomial function to the Bouguer anomaly map. The regional component extracted from this approximation is then subtracted from the Bouguer anomaly to obtain the residual anomaly, which highlights local geological structures of interest. The trend filter was applied in this study to eliminate regional gravitational effects caused by the presence of extensive Quaternary cover, thereby isolating signals associated with deeper structural features. The method consists of approximating the measurement points using an
n-degree polynomial function based on the spatial coordinates (
x,
y), expressed as follows:
The variables
x and
y represent the coordinates of the measurement points. The coefficient
is determined using the least-squares method, ensuring an optimal fit of the polynomial function to the data. This polynomial function serves as an approximation of the regional anomaly, allowing for its separation from the observed Bouguer anomaly and thereby enhancing the visibility of local geological structures [
36,
37].
3.1.2. Electrical Resistivity (ER) and Induced Polarization (IP) Survey
Electrical resistivity and induced polarization (IP) measurements were carried out using the Elrec Pro system (Iris Instruments) in conjunction with the VIP 5000 transmitter, which is capable of delivering high-current injections into the subsurface. During the survey, the injected current ranged from 1 to 2 amperes, depending on the electrical resistivity of the subsurface and the contact resistance. Measurements were acquired using the pole-dipole configuration with a fixed electrode spacing of 25 m, and values were recorded up to n = 10, resulting in a maximum current electrode separation of 250 m. This setup enabled an estimated depth of investigation of approximately 100 m.
To ensure data quality and reduce noise, each measurement was acquired with a stacking of four cycles and a 2 s acquisition window. Real-time monitoring was performed using Prosys II software, which enabled immediate assessment of signal stability and electrode contact. In total, 437 data points were validated following post-acquisition quality control. The data were subsequently processed and inverted using Res2Dinv software, applying a least-squares smoothness-constrained inversion algorithm to generate two-dimensional subsurface models of both resistivity and chargeability.
Four profiles were implemented across the Merija area: PM1, initially acquired in a less structurally constrained area, was excluded from the final interpretation due to its poor data quality; two profiles (PM2 and PM3) were aligned along the limbs of the anticline, coinciding with known mineralized outcrops; and the third profile (PM4) was oriented perpendicular to a major fault identified by gravity data, aiming to image the rooting of the structure. The inverted models revealed pronounced contrasts in resistivity (ranging from 0.02 to 2365 ohm.m) associated with variations between conductive clay-rich units and more resistive sandstone-conglomerate formations. Similarly, chargeability values ranged from 0.2 to 4 mV/V, highlighting potential zones of copper mineralization, particularly within the Lower Cretaceous formations.
3.2. Methods
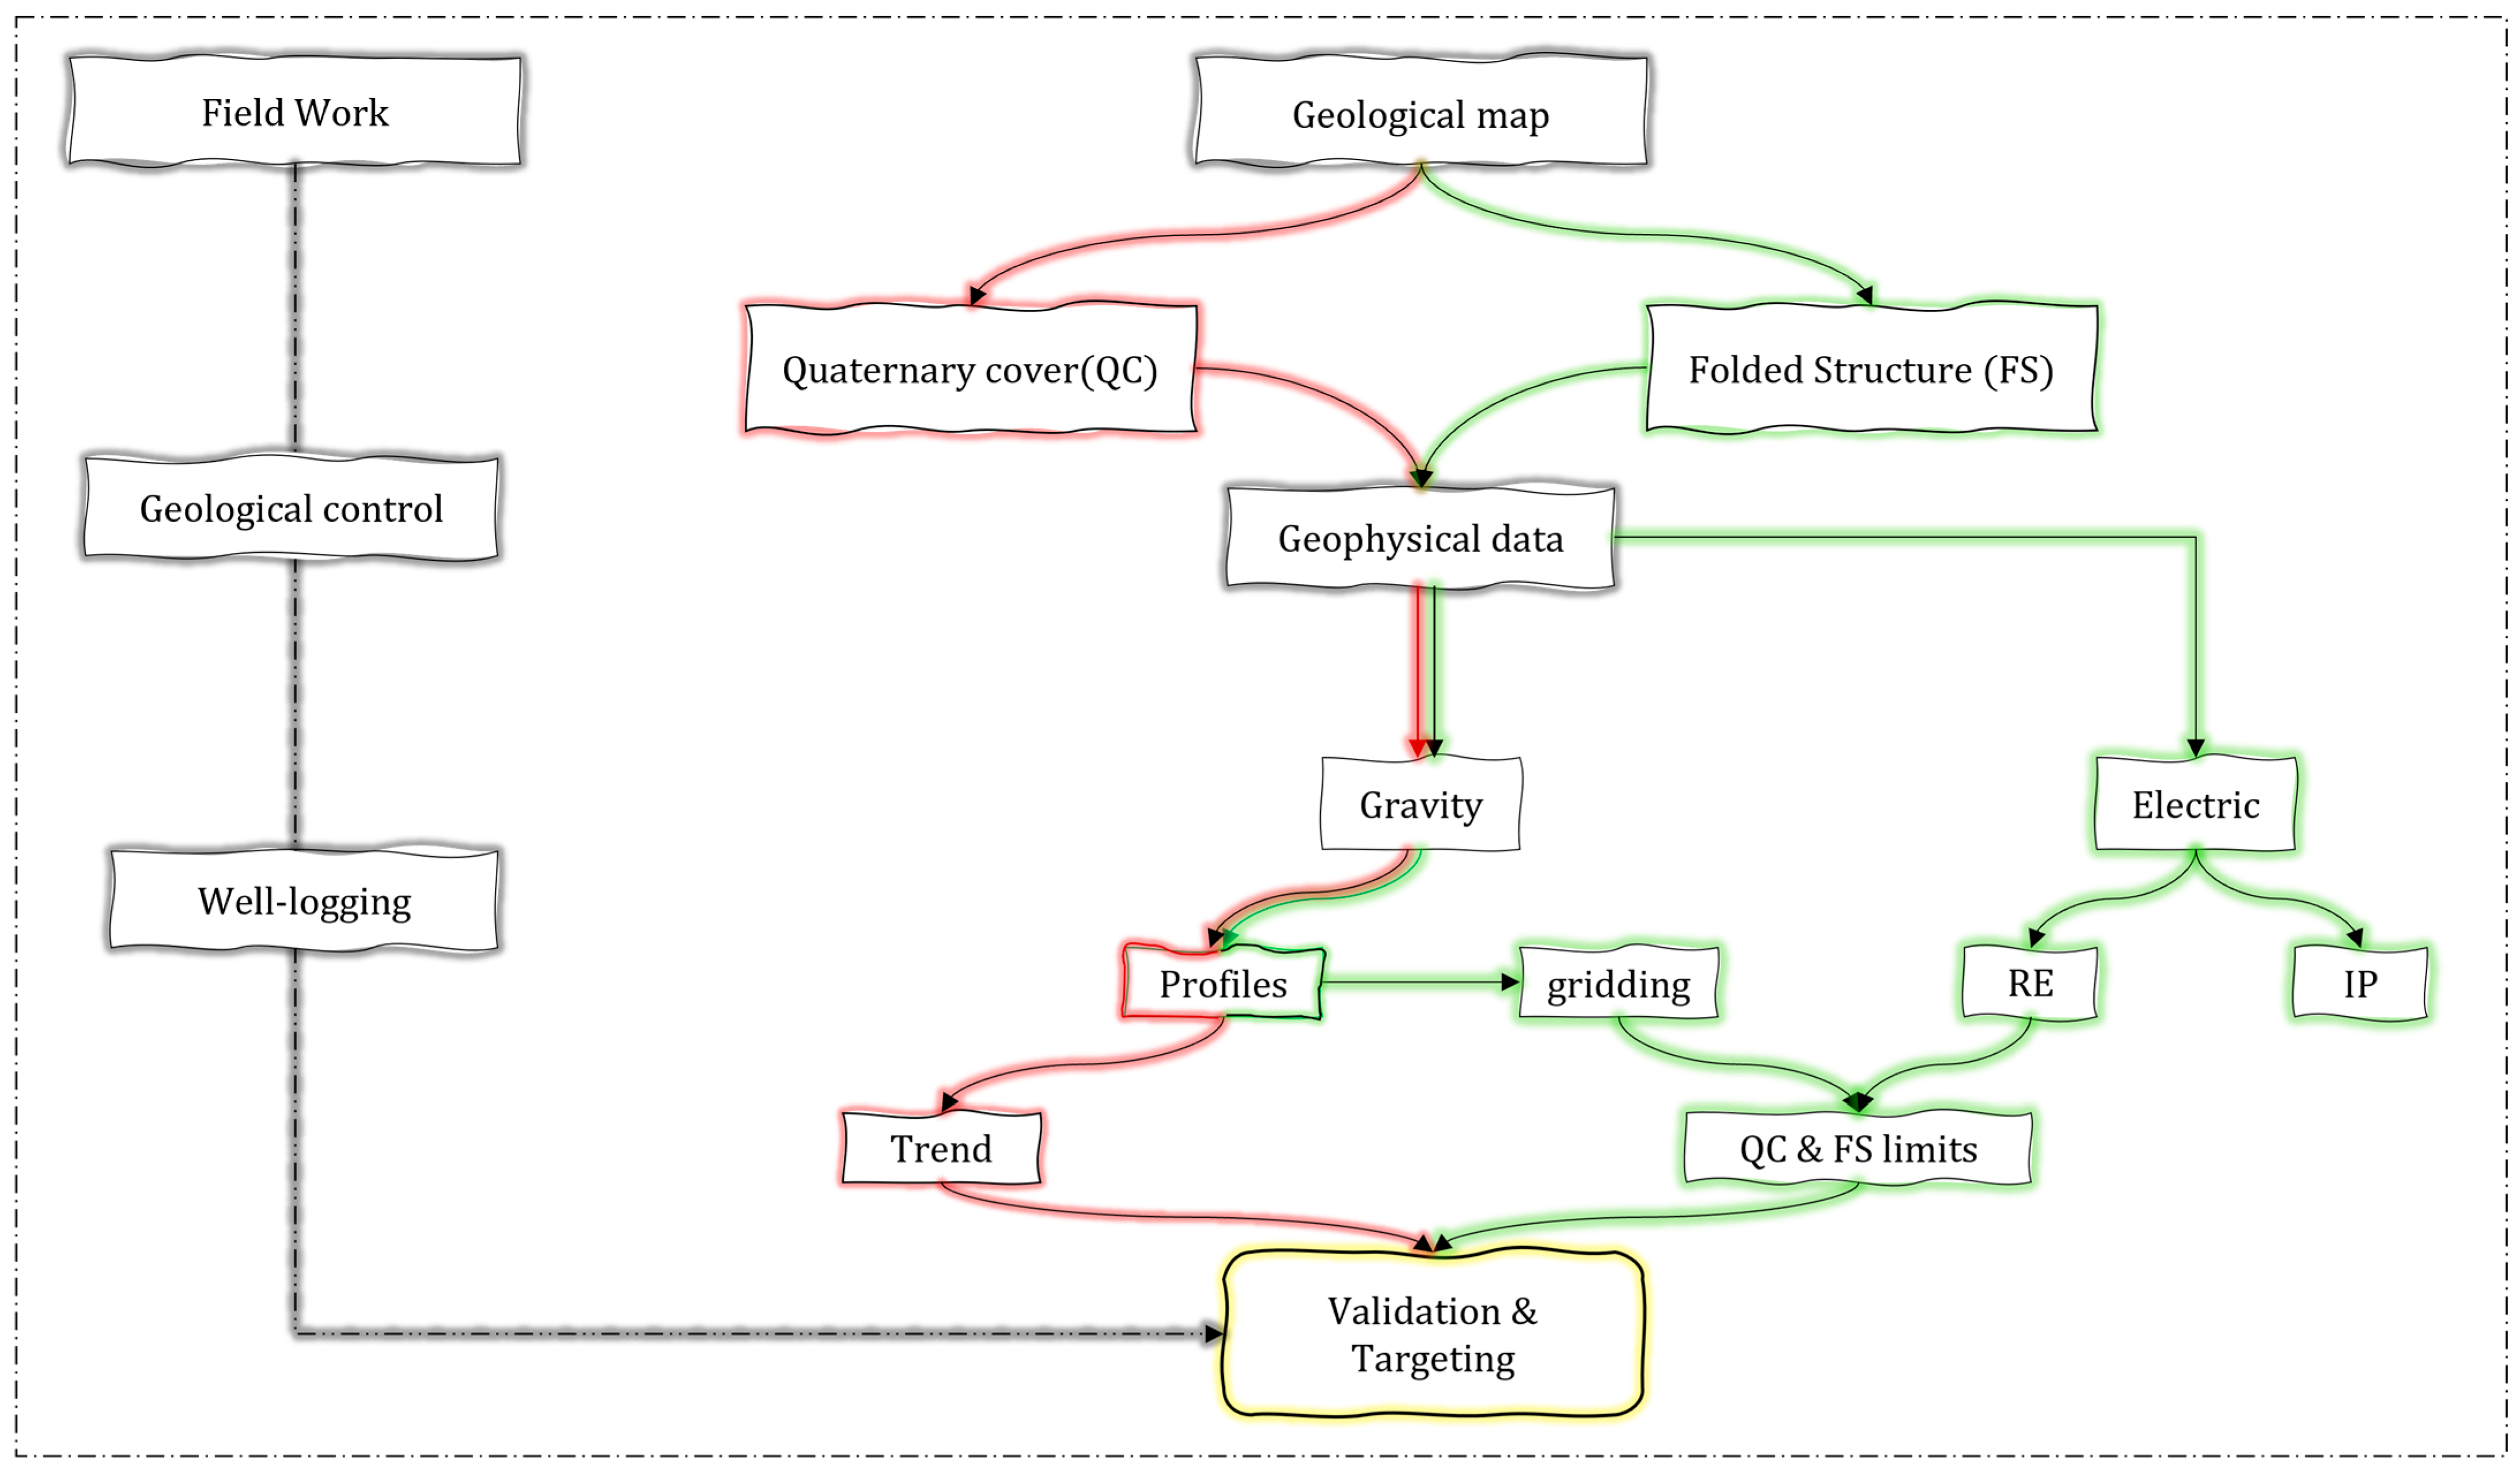
To characterize the deep rooting of the Merija anticline and to clarify the distribution of geological formations beneath the Quaternary cover, a multi-method geophysical approach was adopted. This strategy relied on the sequential and complementary integration of gravity, electrical resistivity, and induced polarization (IP) methods, as summarized in the flowchart in
Figure 2.
The methodological approach adopted in this study aimed to characterize the subsurface architecture of the Merija anticline and identify new targets for copper exploration under Quaternary cover. It integrated geological, geophysical, and validation datasets in a progressive and complementary workflow. The investigation began with geological mapping and field control to delineate lithological units and structural features at the surface. Based on this initial framework, a high-resolution gravity survey was implemented along spaced profiles extending from outcropping Jurassic–Cretaceous formations toward the southwest, where Quaternary deposits mask the geology (
Figure 3).
Analysis of gravity profiles in outcrop areas showed a strong correlation with the mapped anticline structure. In covered areas, trend filtering was applied to suppress regional effects and isolate residual anomalies. Gridding of corrected profiles allowed the generation of a continuous gravity map, revealing a major discontinuity interpreted as a regional fault likely controlling the rooting of the anticline. To refine this interpretation, a targeted electrical resistivity profile was acquired perpendicular to the identified fault to image lithological variations and assess the deep geometry of the structure. Additionally, IP profiles were conducted in mineralized zones near the Merija mine to evaluate the chargeability response of copper-bearing formations, particularly those rich in malachite.
The geophysical interpretation was further refined by integrating structural boundaries between the Quaternary cover and the folded Mesozoic units. A targeted drilling campaign, conducted after the acquisition and preliminary interpretation of the geophysical data, provided essential validation. This campaign included nine boreholes carried out by (National Office of Hydrocarbon and Mines) ONHYM using rotary drilling techniques. Although several boreholes were completed across the area, only MR4 could be presented in this study due to confidentiality restrictions on internal ONHYM data.
This multi-step approach ensured that each method contributed to and reinforced the next, enhancing the overall understanding of the structural framework and mineralization potential of the Merija anticline.
4. Results and Discussion
4.1. Gravity Data
4.1.1. Bouguer Anomaly Variations Along Gravity Profiles
Bouguer anomalies were analyzed along nine gravity profiles, allowing for a detailed investigation of lateral variations in subsurface densities.
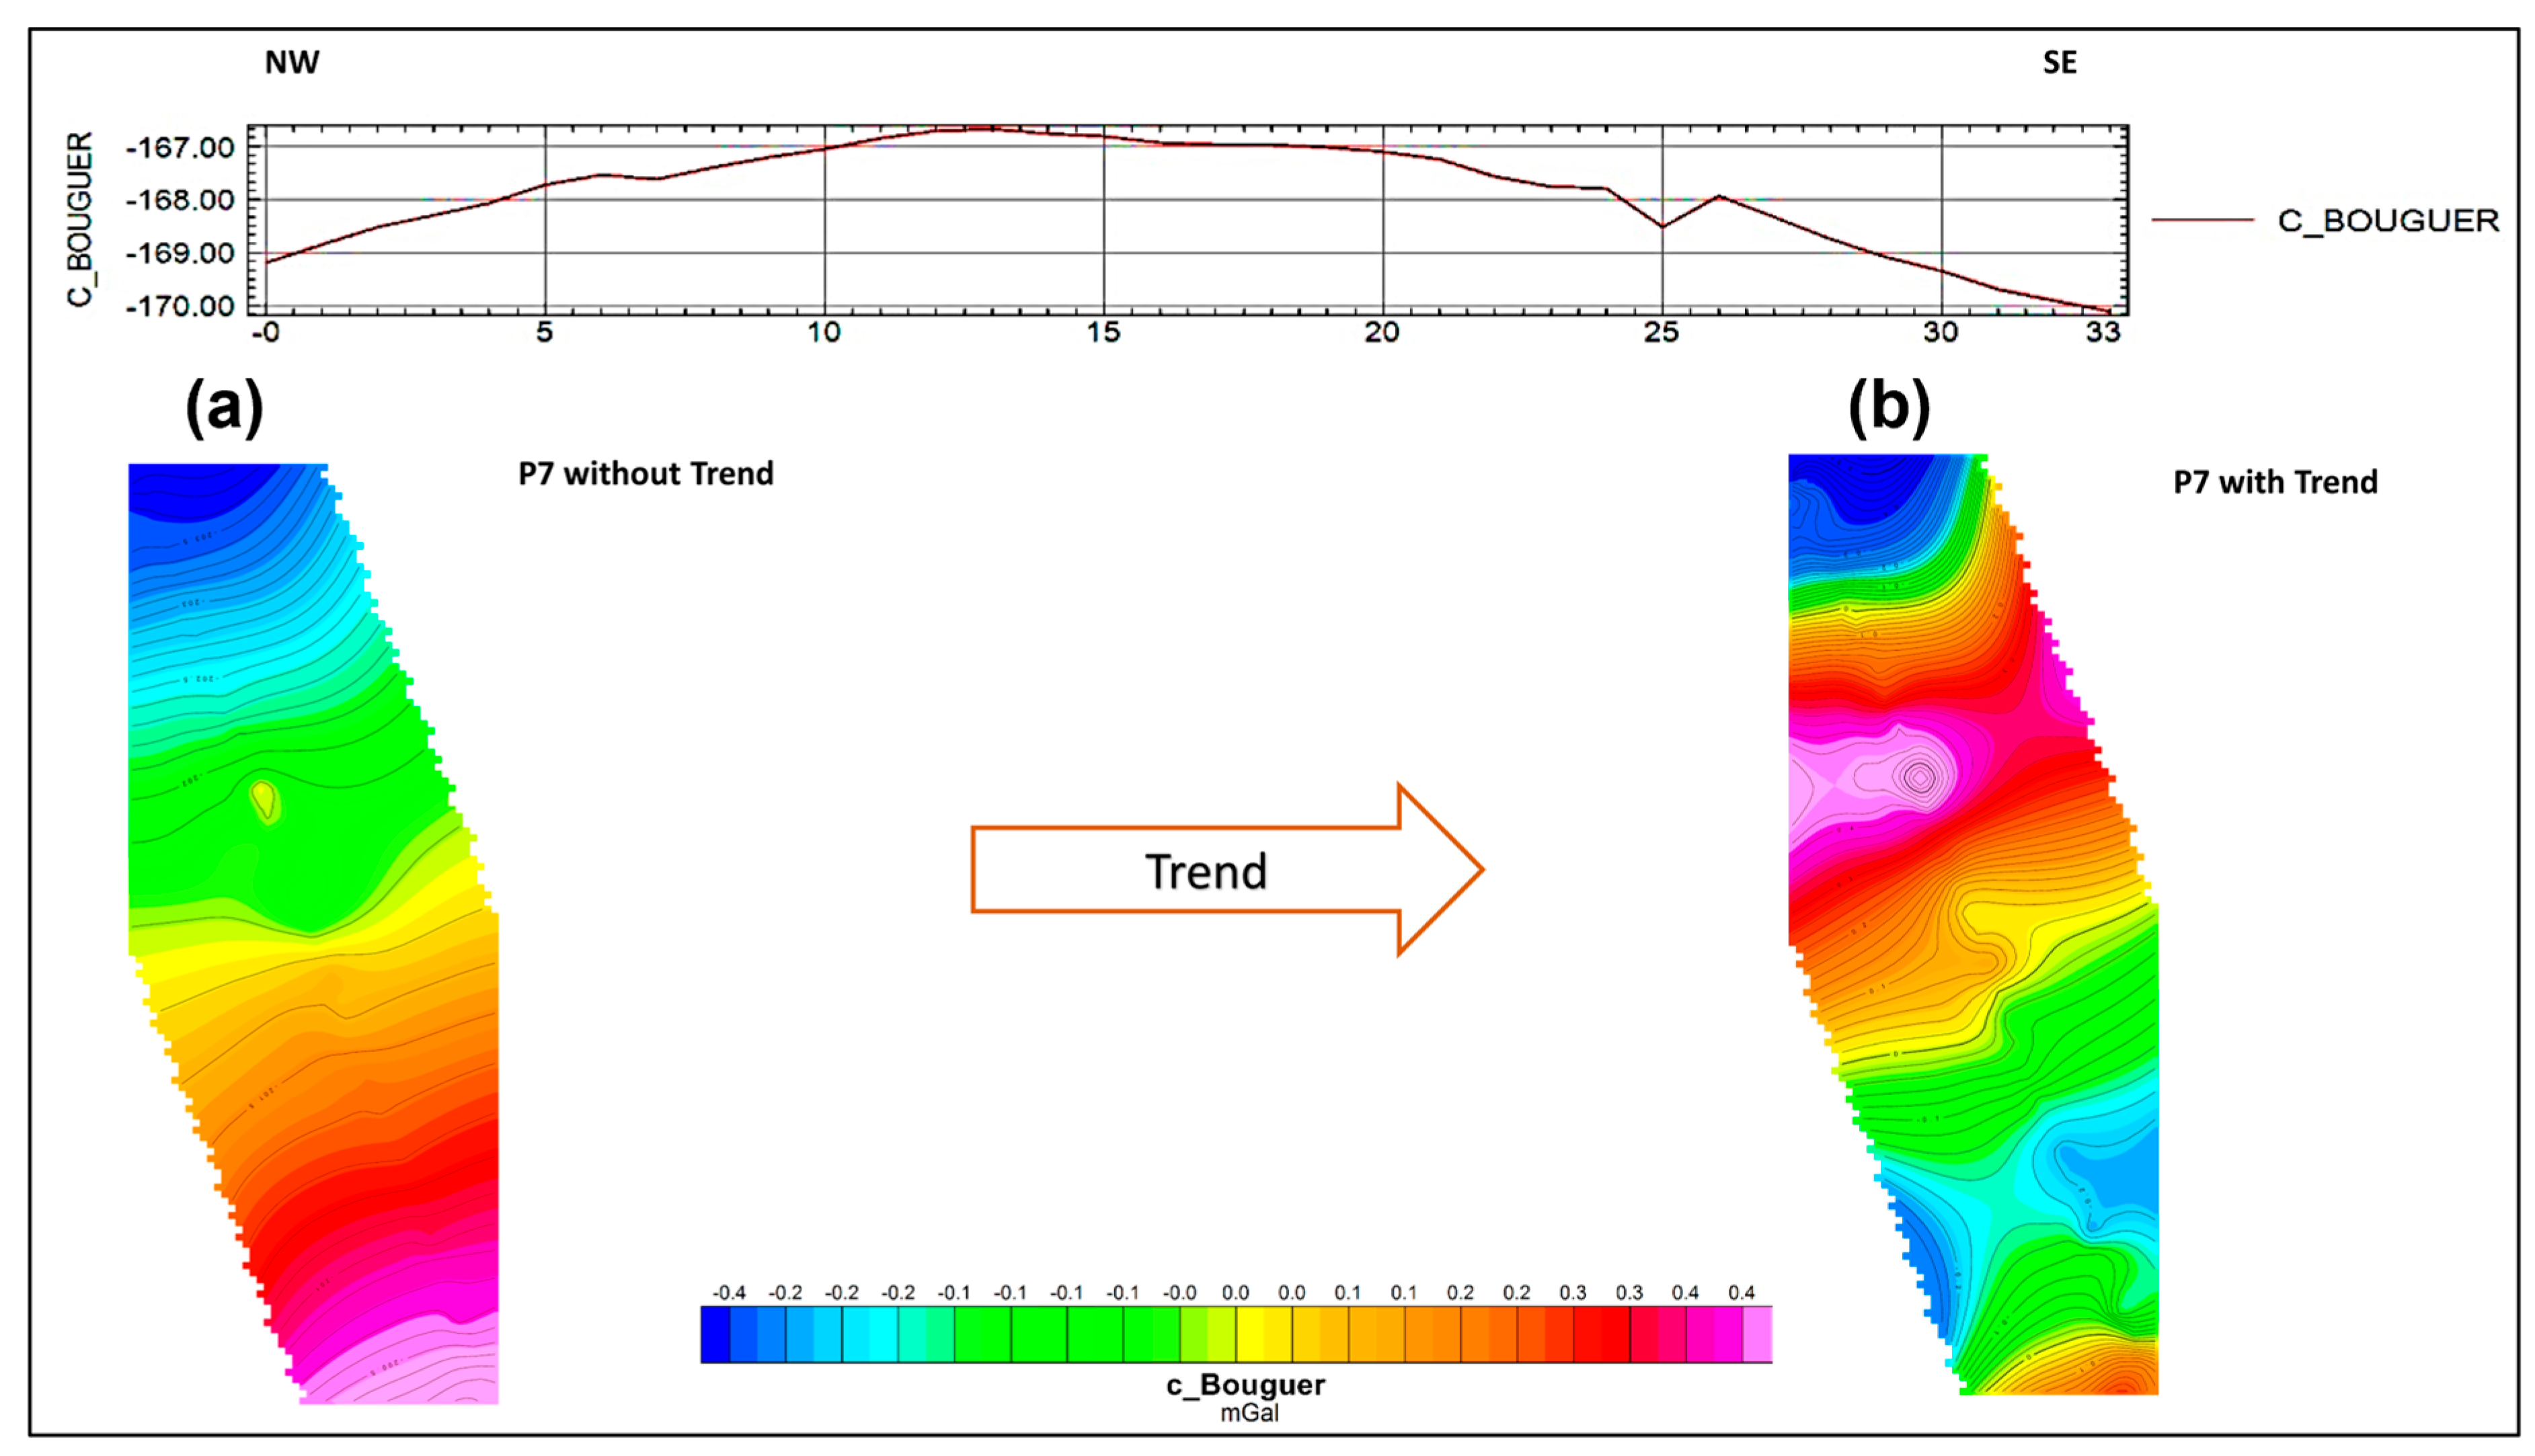
Figure 4a presents the variation of Bouguer anomalies along the first NW–SE-oriented gravity profile, located in the area where the anticline outcrops, providing a representative cross-section of local gravity contrasts. This profile reveals a clear structure, with the highest Bouguer anomaly values (around −167.00 mGal) located at the center of the anticline. These high values reflect the denser Jurassic rocks (Bajocian to Bathonian) that crop out at the core of the anticline. Moving toward both flanks of the anticline, the Bouguer anomaly values gradually decrease, reaching approximately −170.00 mGal at the profile’s edges. This decrease is consistent with the lateral transition from denser Jurassic formations at the center to less dense conglomerates and sandstones of the Lower Cretaceous (Infracenomanian) on the flanks. On the SE flank of the anticline, the decrease in Bouguer anomaly values is more pronounced due to the steeper dip observed on this side of the structure. This asymmetry aligns with regional geological observations indicating a steeper SE limb and a gentler NW limb, as reported by previous studies [
17]. Importantly, the copper mineralization in the Merija area typically concentrates within the flanks of the anticline, particularly at the transition between the Infracenomanian conglomerates and sandstones and the underlying Upper Jurassic formations. This distribution pattern reflects the structural and stratigraphic control exerted by the anticline on the mineralization, guiding exploration efforts towards these critical transitional zones.
4.1.2. Trend Filter Processing
Following the application of the trend filter, which aims to eliminate regional trends associated with large-scale density variations, particularly those induced by recent Quaternary deposit, while isolating residual anomalies, the resulting data exhibit an enhanced resolution of local structures (
Figure 3d). An example of trend filtering applied to the seventh profile is shown in
Figure 4b. The gravity profiles were strategically distributed to ensure comprehensive coverage of the study area, extending from the northeast, where the Merija anticline outcrops, to the southwest. This spatial arrangement allowed for a homogeneous assessment of Bouguer anomaly variations across region (
Figure 3). The profiles reveal a distinct contrast in Bouguer anomalies, ranging from −169.6 mGal to −166.7 mGal. Their general trend indicates an increase in anomaly values toward the central portions of the profiles, whereas lower anomaly values are observed at the extremities. This overall pattern reflects subsurface density variations that are likely influenced by lithological and structural heterogeneities within the study area.
4.1.3. Interpolation and Analysis of Bouguer Anomalies
A global Bouguer anomaly map was generated using the minimum curvature interpolation method with a grid cell size of 25 m, ensuring a continuous representation of density variations across the study area (
Figure 3d). This interpolation enhanced the spatial resolution of gravity anomalies, facilitating a more detailed analysis of subsurface structural features. The interpolated Bouguer anomalies range from −205.5 mGal to −188.8 mGal, with a general trend of increasing intensity from the northeast to the southwest. This trend aligns with the outcrop of the Merija anticline and suggests its structural continuity toward the southwest, indicating a deep-rooted fold system. Additionally, the gravity contrast gradually diminishes in certain areas, which can be attributed to the progressive thickening of recent sedimentary deposits that mask the underlying density variations. A NNW-oriented fault was interpreted from the gravity data, marked by a distinct boundary in the gravimetric variations. This structural discontinuity is of particular interest, as an electrical resistivity profile is planned perpendicular to this boundary to further investigate its subsurface characteristics.
4.1.4. Three-Dimensional Gravity Inversion and Cross-Sectional Analysis
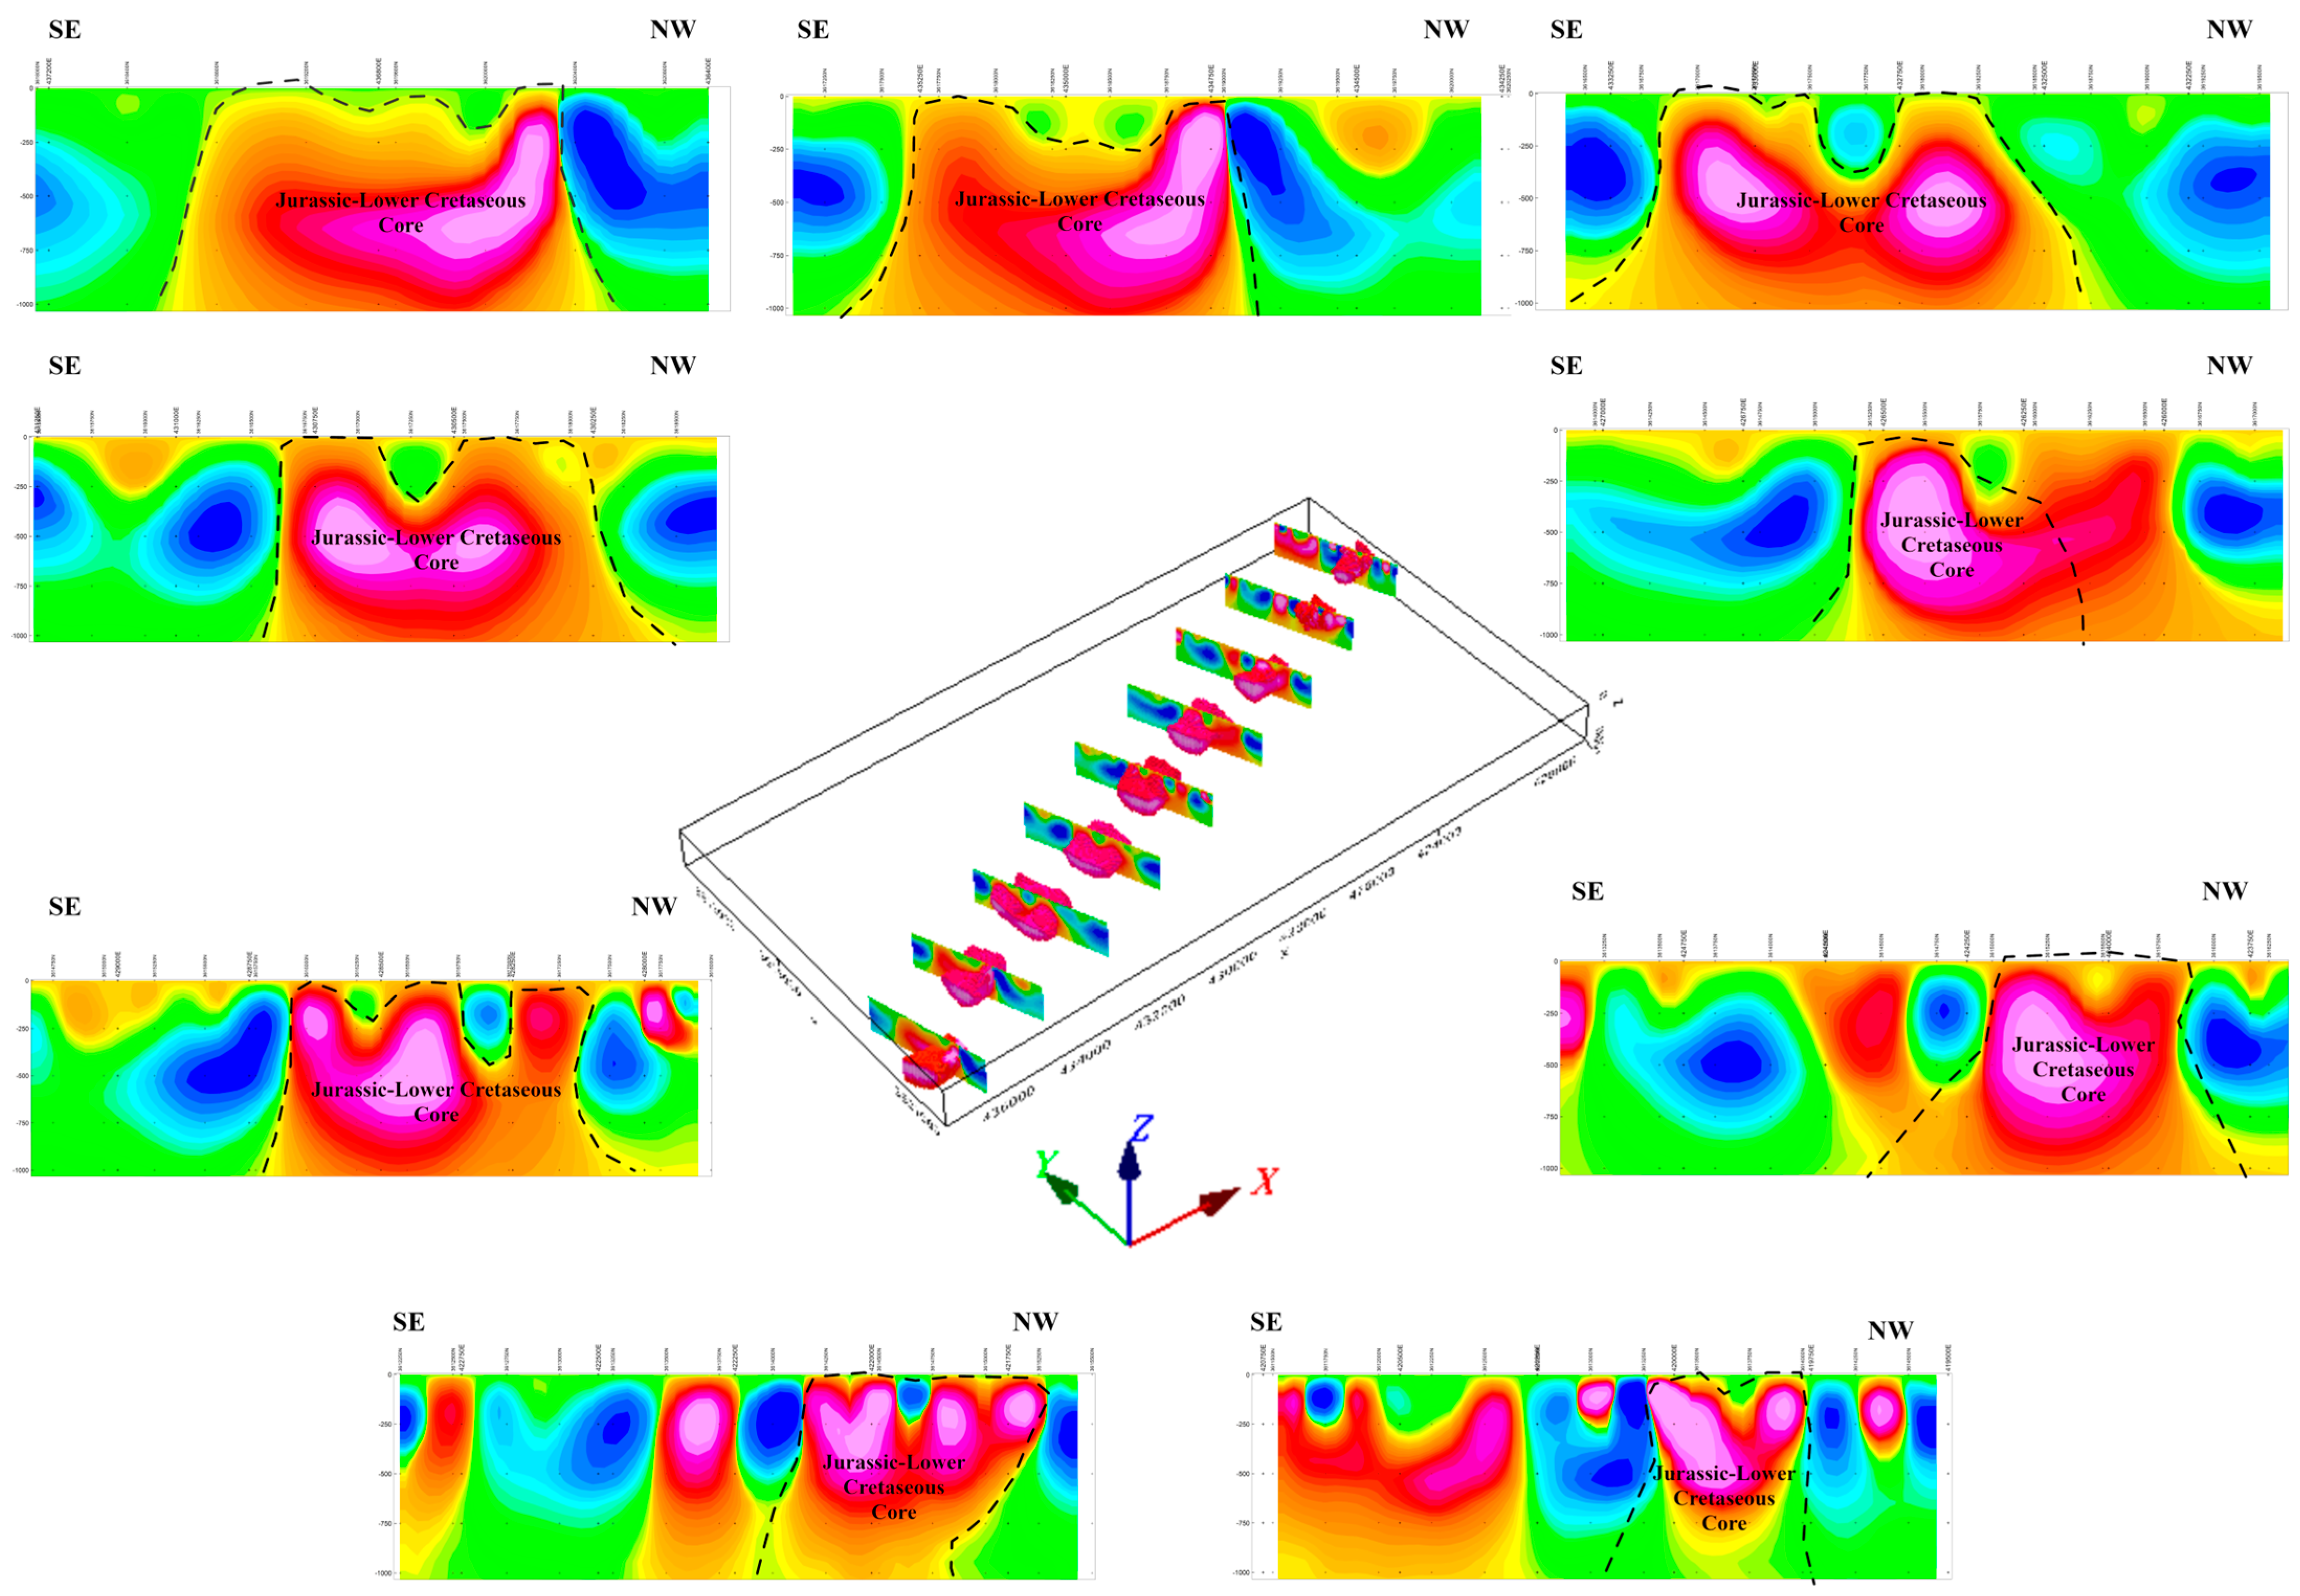
To better constrain the geometry and density distribution of the Merija anticline at depth, a three-dimensional gravity inversion was performed using the VOXI Earth Modelling module in Oasis Montaj. Separate inversions were conducted for each of the gravity profiles, based on the gridded Bouguer anomaly data. The inversion was set to estimate subsurface density distribution, with an absolute error fit of 0.1304 mGal. The model mesh was defined with a cell size of 25 × 75 × 12.5 m (X, Y, Z) and extended to a depth of −1000 m, with appropriate padding and expansion ratios to reduce boundary effects. The resulting voxel model was resampled using a uniform 12.5 m cell size in all directions to allow for detailed interpretation and cross-section extraction.
Vertical sections were then extracted from the voxel along a SE–NW direction, aligned with the original gravity survey profiles. These sections (
Figure 5) clearly delineate a dense central core, associated with the Jurassic–Lower Cretaceous units forming the heart of the Merija anticline, and flanking lower-density zones interpreted as the limbs of the fold. The inversion results exhibit excellent resolution in the outcropping zones, accurately matching the surface geology. Although the data quality decreases in the Quaternary-covered areas, the model still successfully captures the structural continuity of the anticline beneath the cover.
To better visualize the internal architecture of the fold, the voxel was clipped by density threshold to isolate the dense core region, emphasizing the deep rooting and lateral extent of the anticline (
Figure 5). These results significantly enhance the understanding of subsurface folding and support the integration of geological and geophysical interpretations.
4.2. Electrical Resistivity (ER) and Induced Polarization (IP)
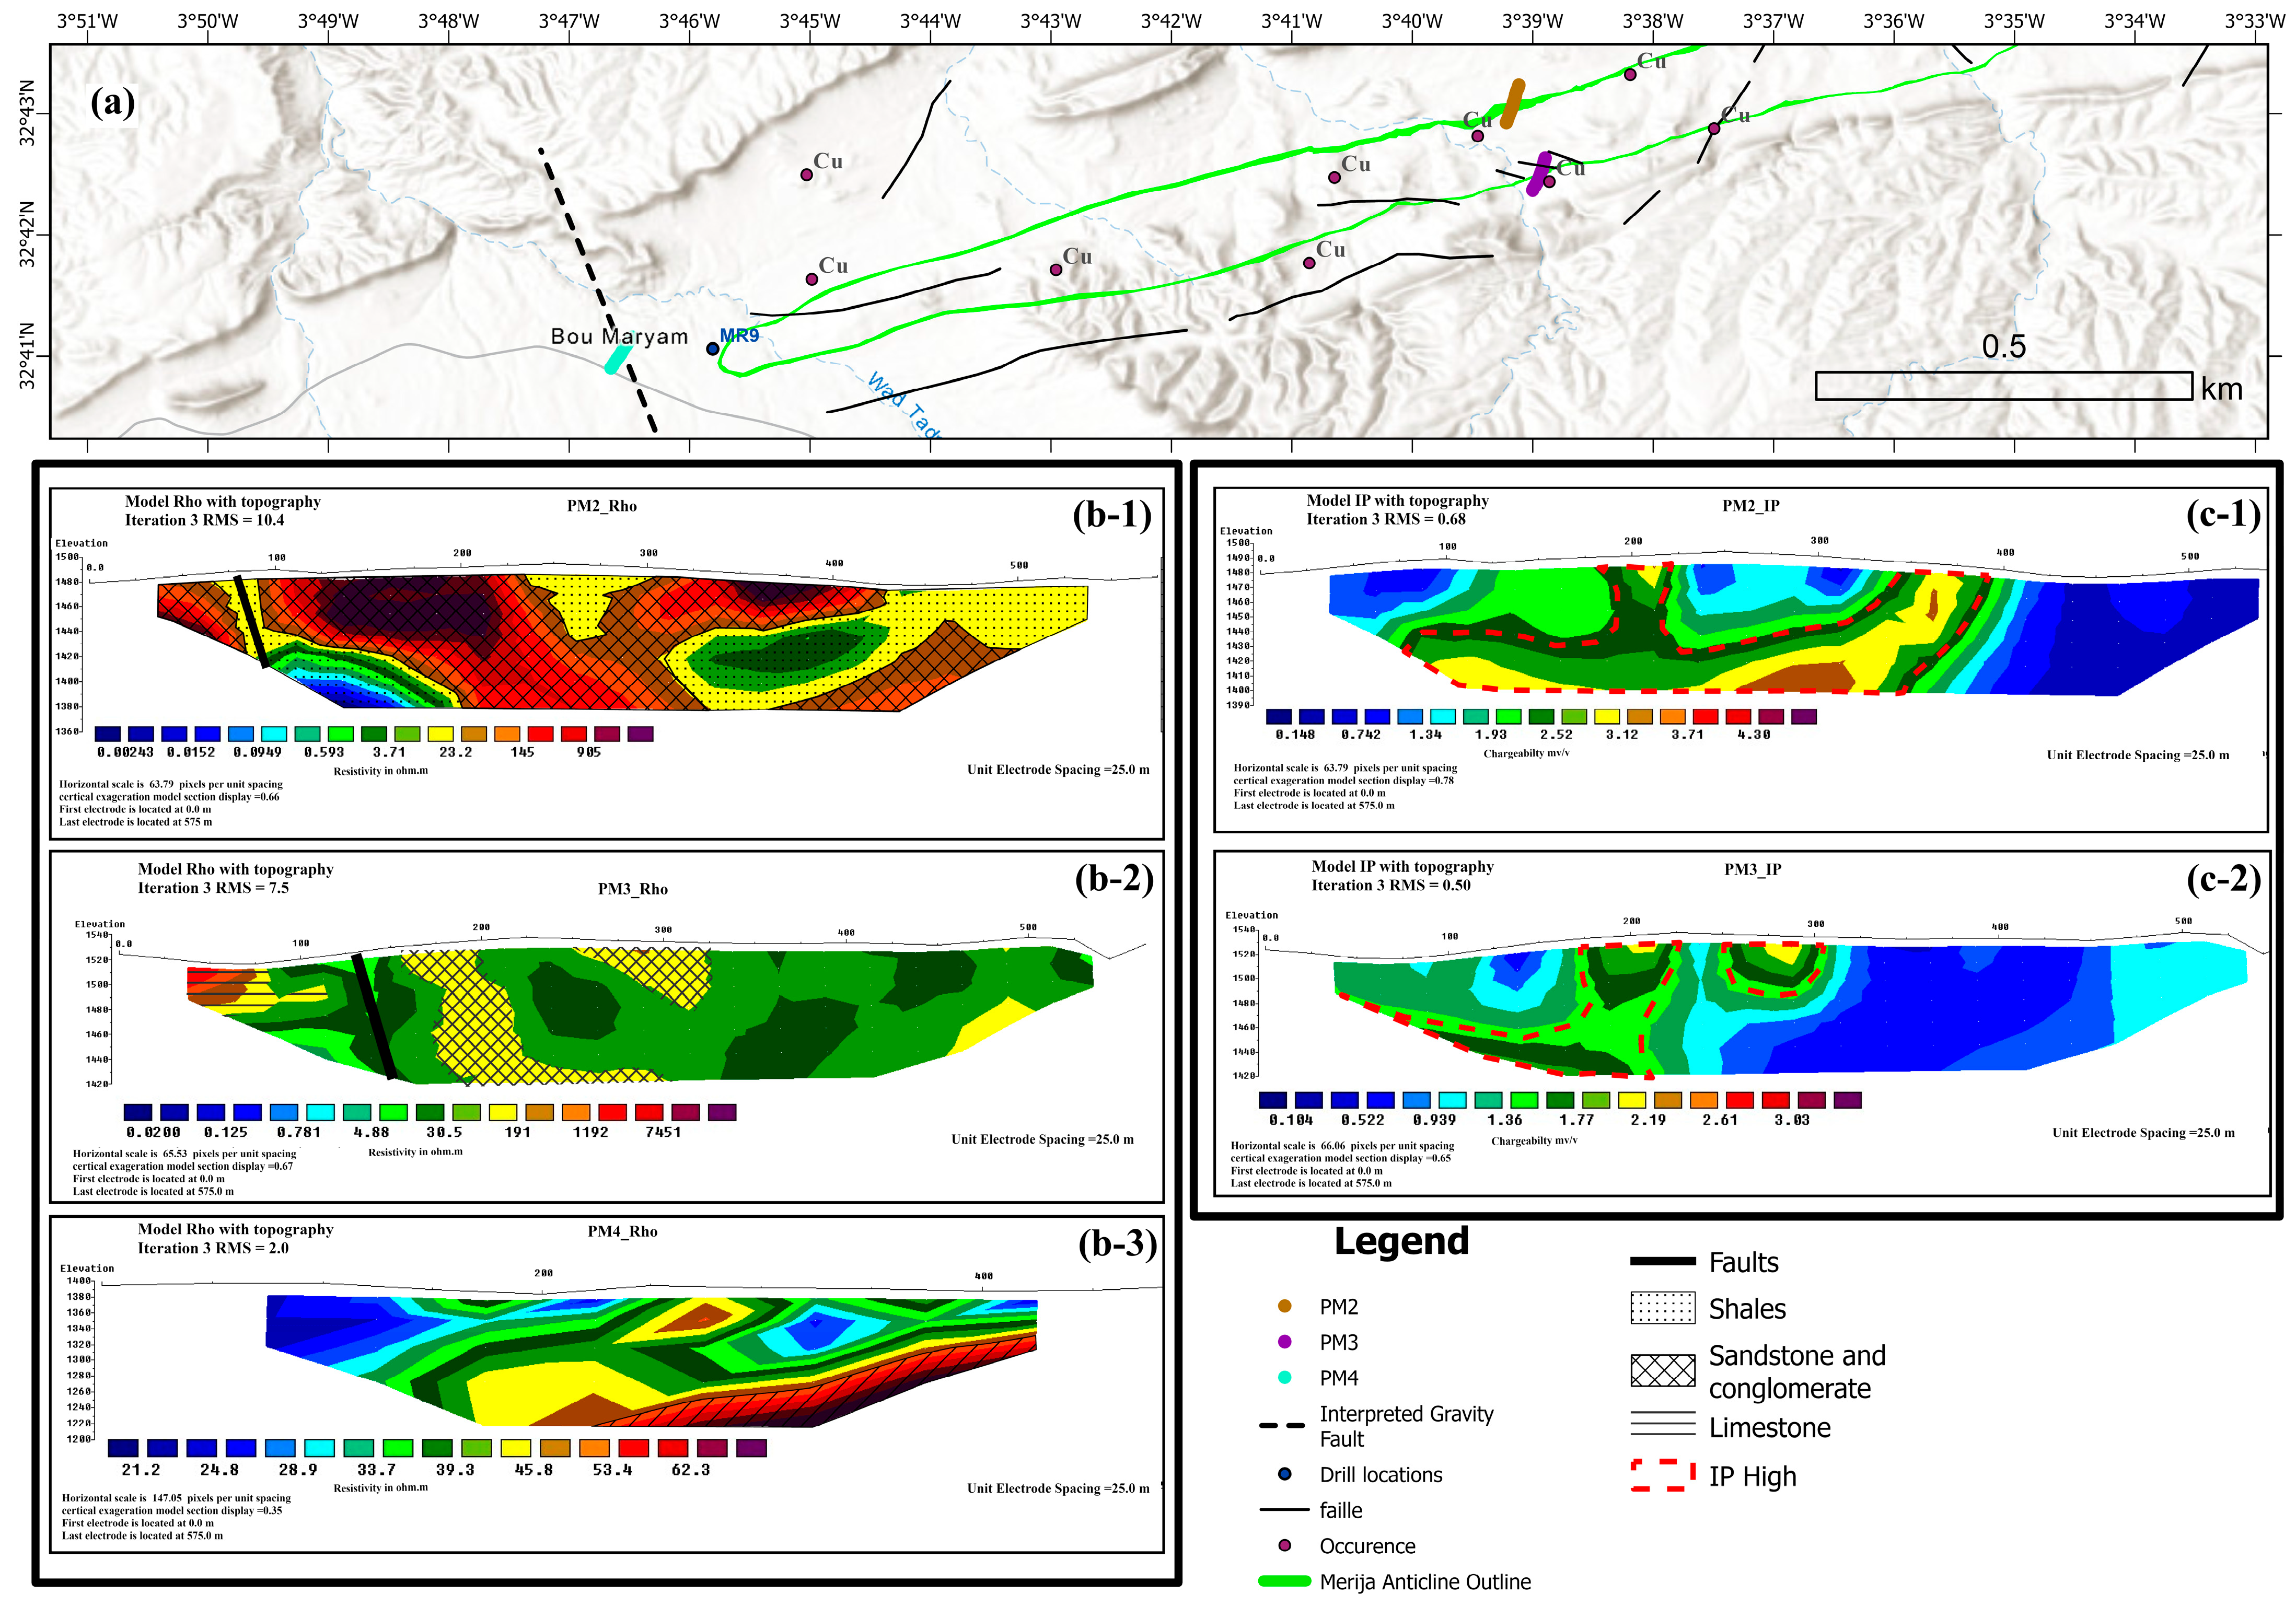
Four electrical resistivity and chargeability profiles were carried out at the Merija mine to investigate whether there is a direct response of the copper mineralization in terms of chargeability (
Figure 6). The presence of clay-rich formations and marls resulted in extremely low potential differences, even with a current injection of 2000 mA. As a result, the measurement of chargeability variations was limited. The resistivity values obtained are generally low. However, the detailed measurement grid with 25 m spacing allowed for the discrimination of the alternation between different geological formations based on their resistivity signatures. Preliminary analysis of these data suggests that values below 100 ohm.m correspond to the resistivity of the clays and marls, while values above 100 ohm.m are likely associated with the sandstones and conglomerates of the infracenomanian sequence. The number of iterations and the root mean square (RMS) misfit values for each profile are shown in
Figure 6, allowing for direct evaluation of model reliability.
Profile PM1 was excluded from the interpretation due to the absence of measurable potential difference beyond the fourth depth level. This limitation is likely related to the presence of a subvertical fault parallel to the profile, which may have disrupted current flow. Furthermore, a thick clay-rich layer in this area likely reduced signal penetration, affecting both ER and IP measurements.
The PM2 profile was set up with a 25 m spacing over a total length of 600 m and was measured at 10 depth levels. The upper levels display relatively stable potential differences, providing reliable chargeability values. The observed decay curves (representing the time-dependent voltage response after current shut-off) are smooth and well-defined, likely related to mineralization, and correlate well with the outcrops (
Figure 6(c-1)). At greater depths, the potential difference becomes very low, and the chargeability curves become noisy and irregular, resulting in unreliable deep chargeability values. Resistivity measurements collected along this profile revealed significant contrasts, with values ranging from 0.02 ohm.m to 20,976 ohm.m. These variations are consistent with the lithological observations made in the field (
Figure 6(b-1)).
The PM3 profile was set up with a 25 m spacing over a total length of 600 m and was measured at 10 depth levels. The measured potential difference remains generally low throughout the profile due to the presence of a thick layer of clays and marls. This resulted in unstable chargeability values along the profile. A general correlation can be established between the measured chargeability values and the surface outcrop of mineralization. However, a clear differentiation and identification of chargeable zones directly associated with mineralization at depth could not be achieved due to the low values and the instability of the measurements (
Figure 6(c-2)). Resistivity measurements collected along this profile reveal significant contrasts, with values ranging from 0.02 ohm.m to 2365 ohm.m. A preliminary analysis of this data, combined with outcrop observations, suggests that values below 100 ohm.m correspond to clay and marl facies. Values above 100 ohm.m are probably associated with alternations of sandstones and conglomerates, while the highest values are generally linked to Jurassic limestones. This interpretation is consistent with the results obtained from profile PM2, confirming the lateral continuity of lithological units (
Figure 6(b-2)).
The PM4 profile was established with a spacing of 50 m over a total length of 500 m and was measured at 7 depth levels. The primary objective of this profile was to verify the existence of the regional fault identified from the gravity survey, to better constrain the rooting of the anticline axis, and to estimate the thickness of the Quaternary cover. ER measurements acquired along with this profile effectively delineate the fault and provide a clear image of the anticline’s rooting. This rooting is characterized by relatively high resistivity values, indicating the presence of Jurassic marls that are more resistant than the Quaternary clays. The anticline’s rooting is particularly well imaged: it shows that within the first 200 horizontal meters traversed at the surface; the rooting depth reaches approximately 100 m (
Figure 6(b-3)). The resistivity values recorded on this profile range from 20 ohm.m to 75 ohm.m. A preliminary analysis of these data, supported by field outcrop observations, suggests that values below 50 ohm.m correspond to Quaternary clay facies, while values above 50 ohm.m are likely associated with Jurassic marls. Finally, all of the faults identified on this profile were confirmed by surface field checks, reinforcing the reliability of the geophysical interpretations.
4.3. Geological Confirmation by Drilling and Stratigraphic Section
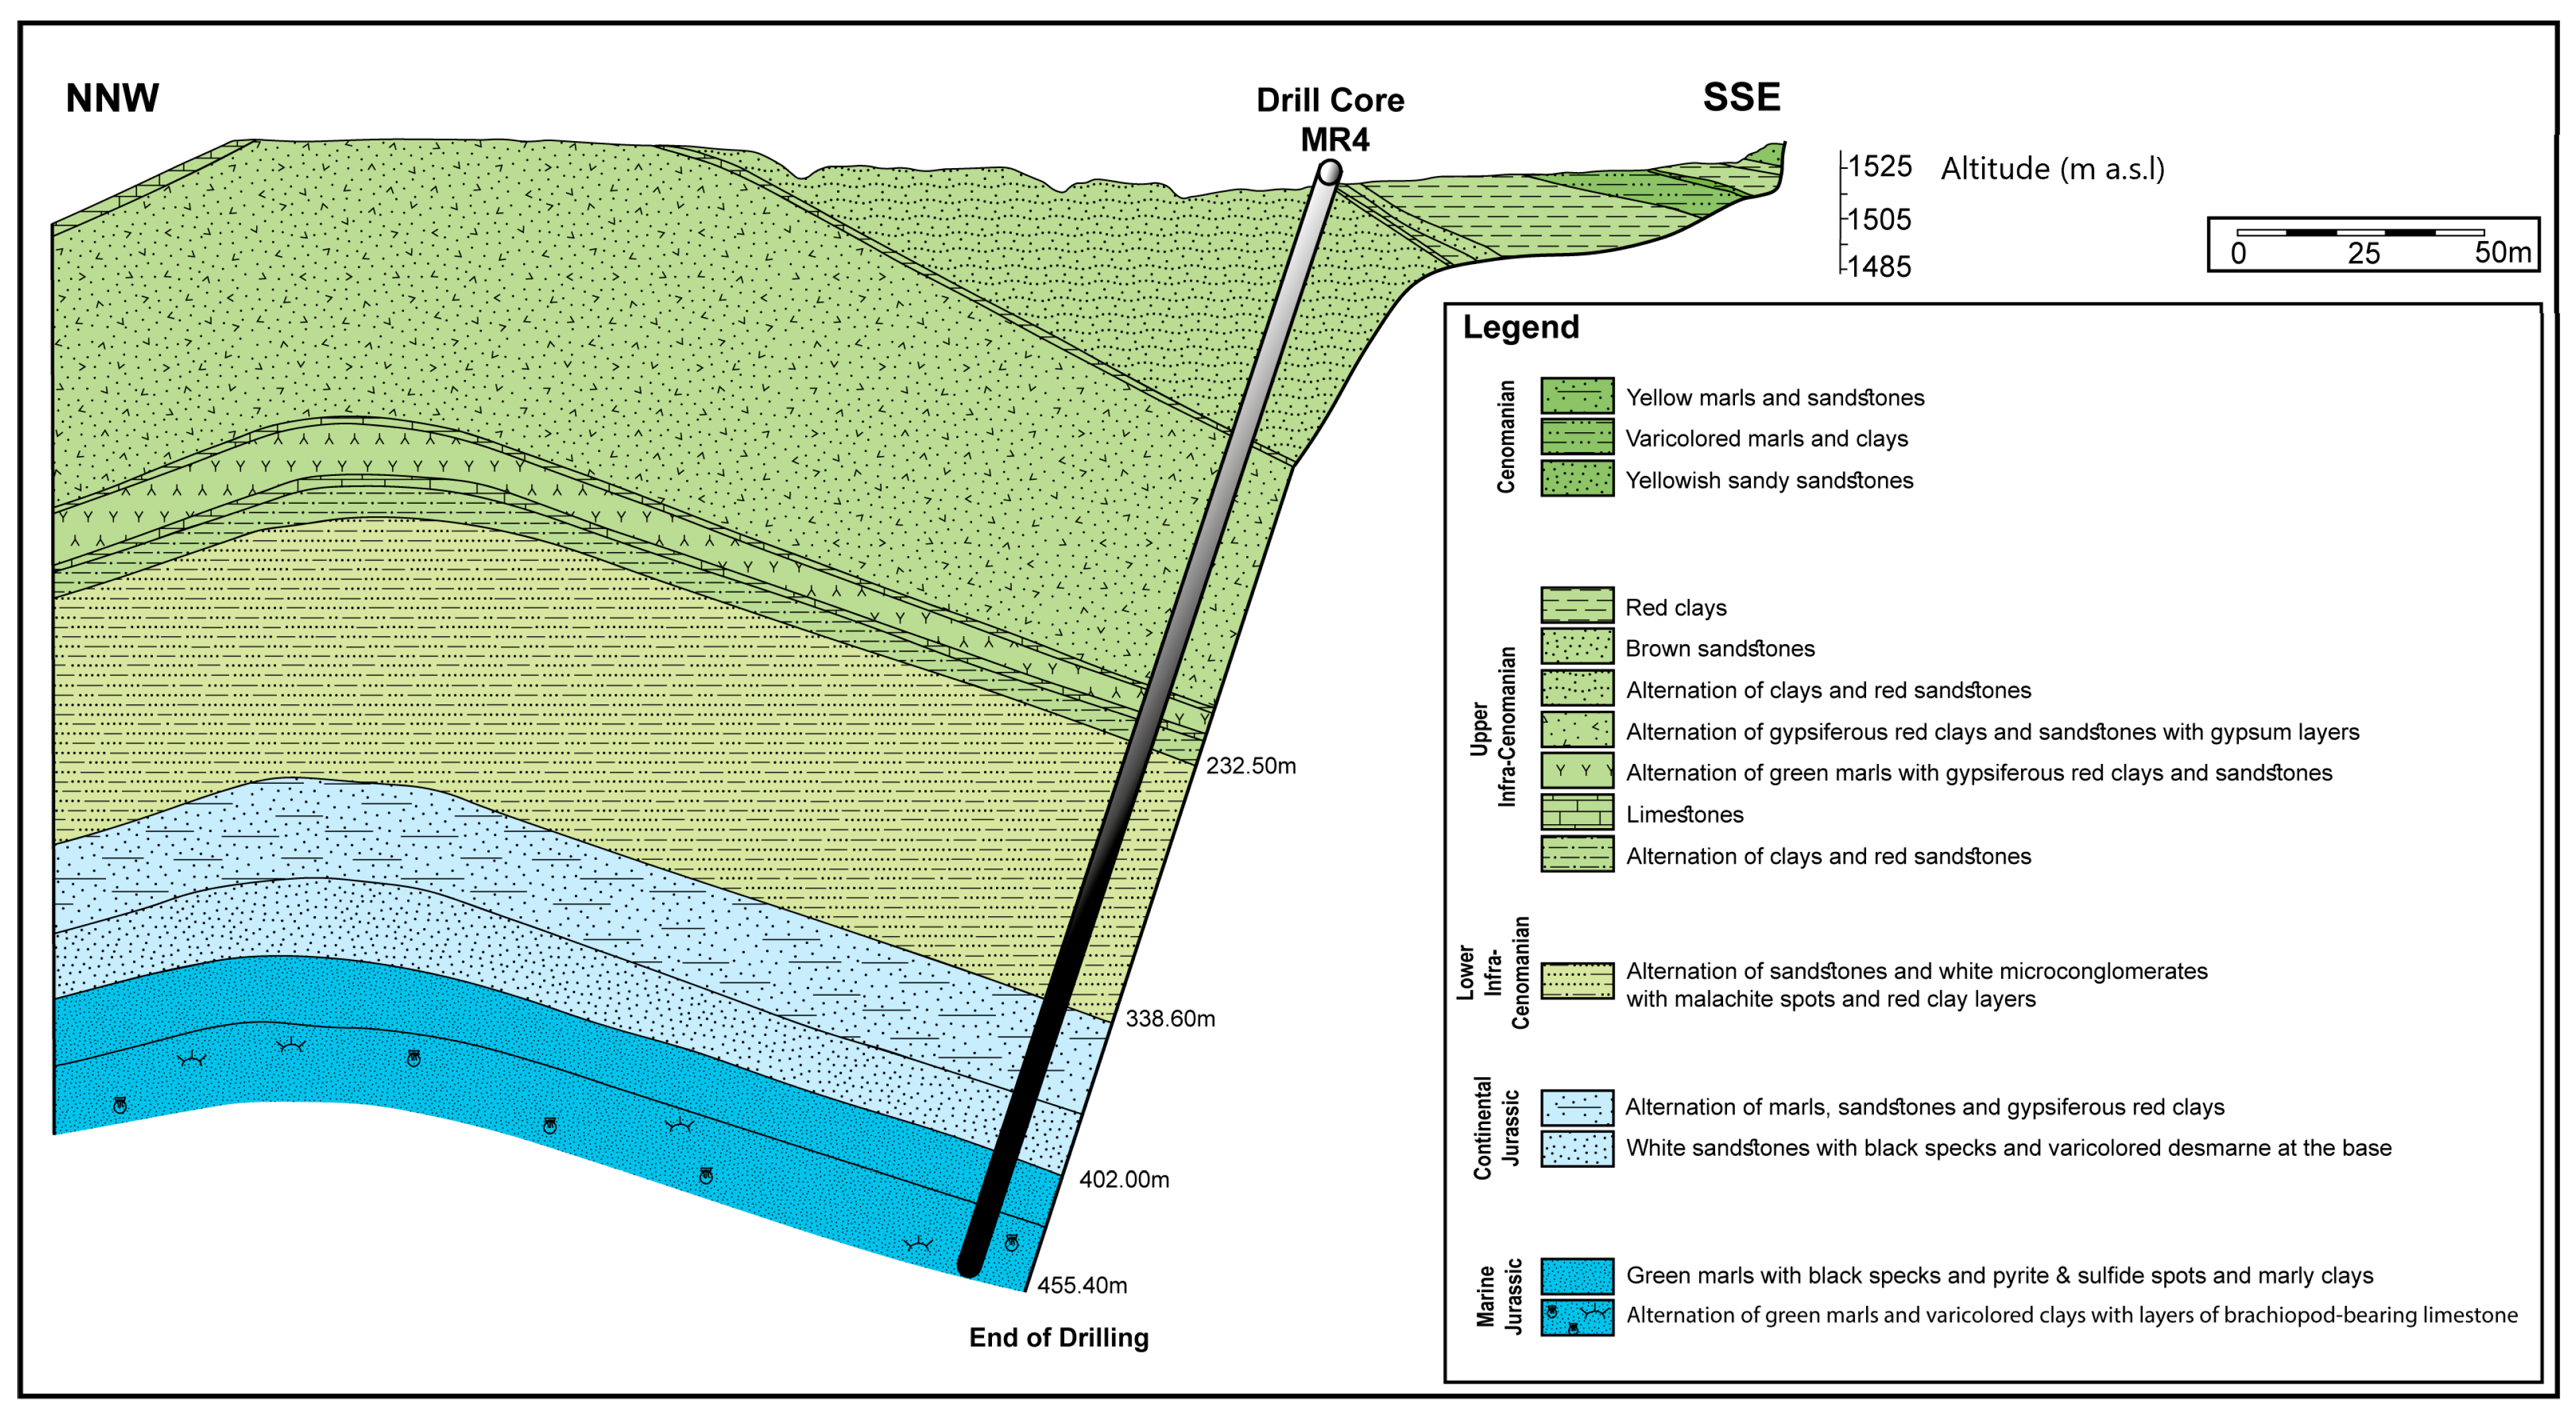
A drilling program was implemented to verify the geophysical interpretations derived from the gravity and electrical surveys conducted in the Merija region (
Figure 7). The borehole MR4, drilled on the southern limb of the anticline, provided a stratigraphic section that confirmed the deep rooting of the structure, and the distribution of geological formations as previously interpreted from the geophysical data. The geological section constructed from borehole MR4 illustrates the complete stratigraphic succession of the region, from the Upper Cretaceous superficial formations to the deeper Jurassic levels. This section highlights the characteristic lithological alternations of the area, including the marls and sandstones of the Upper Cretaceous, the clay and sandy sequences of the Infracenomanian, and the green marls and limestones of the Jurassic. This section clearly depicts the deep rooting of the Merija anticline and confirms the presence of the geological structures and formations identified through gravity and electrical surveys. It notably reveals the presence of more resistant marly levels associated with the anticline, as well as the transition to the more clayey Quaternary cover formations. Although the Quaternary layer was not initially reported in the borehole logs, since it is commonly removed during drilling operations, it is well evidenced in both the geological map and the near-surface features of the resistivity model (PM4). This concordance between geophysical data and borehole results thus validates the integrated approach adopted in this study.
4.4. Two-Dimensional Gravity Modeling Validation of the Geological Cross-Section
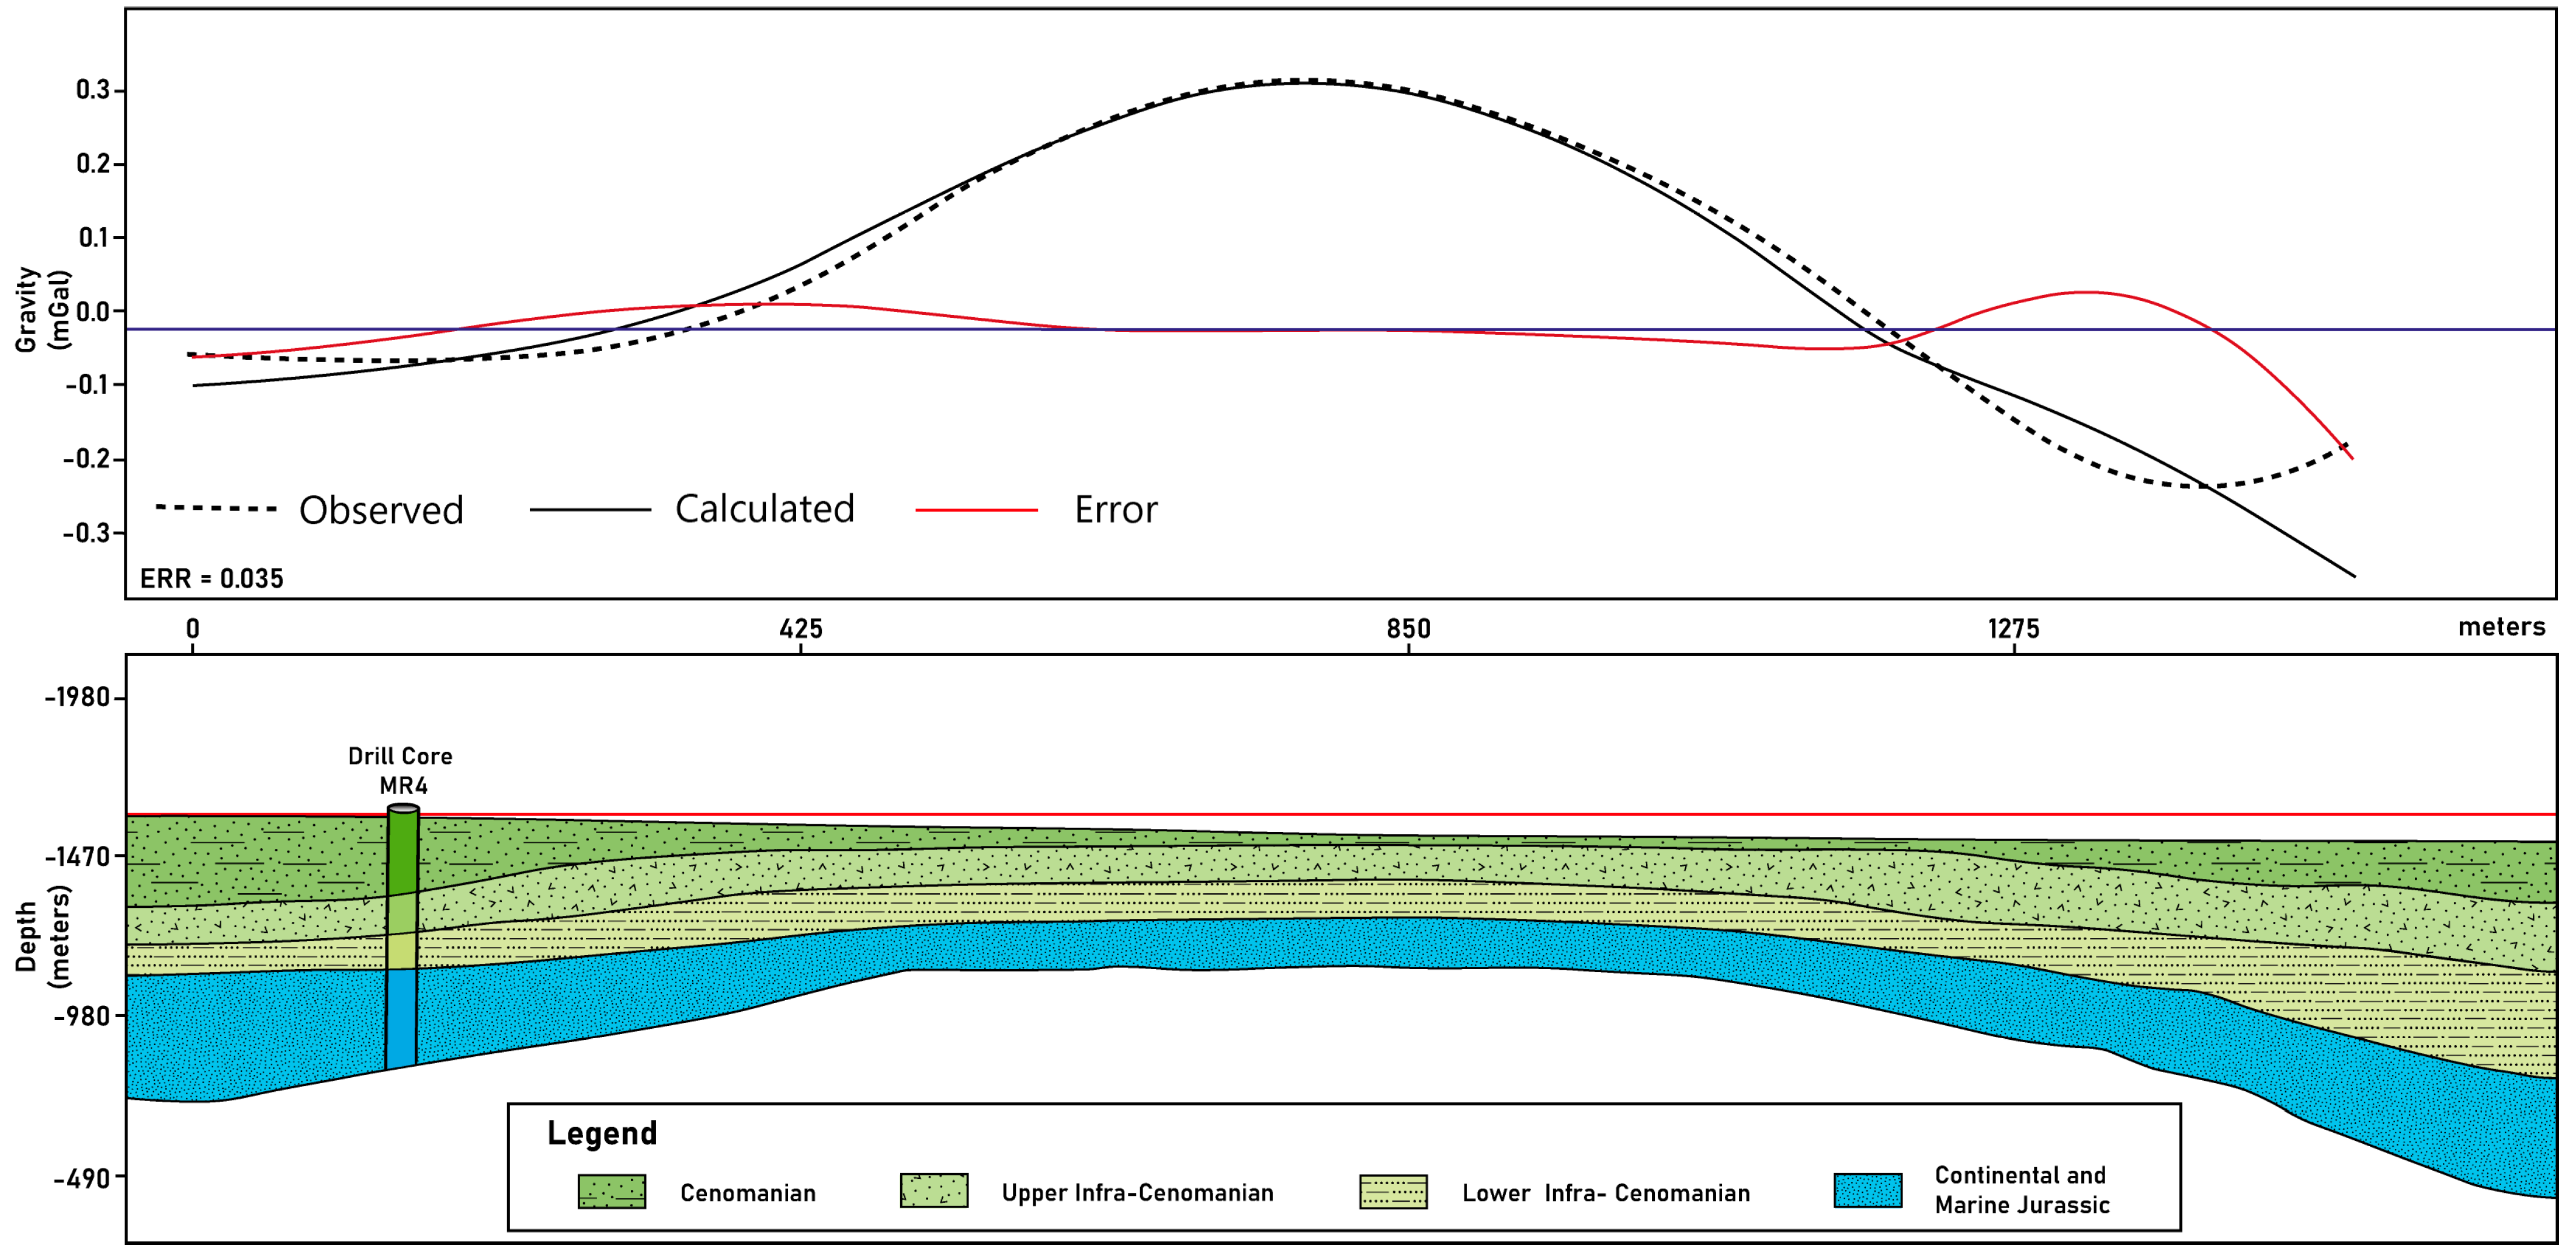
To validate the structural interpretation and assess the depth geometry of the Merija anticline, a 2D gravity forward model was constructed using the GM-SYS module of Oasis Montaj. The model was developed along the same profile used for drilling (MR4), integrating Bouguer anomaly data and constrained by the stratigraphic layering observed in the borehole. Layer thicknesses were fixed based on drill-core observations, while average density values were assigned from the literature [
27,
28].
The synthetic gravity response closely matches the observed data, with a minimal misfit (error ≈ 0.035 mGal), confirming the presence of a dense Jurassic–Lower Cretaceous core overlain by progressively lighter Cenomanian formations (
Figure 8). The 2D model supports the geometry derived from the geological cross-section and provides additional confidence in the anticline’s subsurface continuity.
4.5. Contribution of Integrated Geophysical Data to Copper Mineralization Targeting
The integrated geophysical approach, based on resistivity (ER), induced polarization (IP), and gravity data, has proven essential in characterizing the subsurface structure of the Merija anticline and improving the understanding of associated copper mineralization processes. The copper mineralization, of the red-bed type and hosted in Early Cretaceous detrital formations, appears to be strongly controlled by a redox front where oxidizing and reducing fluids interacted, causing copper to precipitate. This process is favored at the transition zones between the axis of the anticline dominated by Jurassic carbonates and the flanks composed of Cretaceous sandstones and conglomerates, often under structural control.
IP data were particularly useful for identifying these redox transition zones, as chargeability anomalies were detected even in areas where copper is predominantly present as malachite, a secondary oxidized mineral. This observation demonstrates that IP methods can still yield meaningful responses in oxidized mineralized systems, contrary to common assumptions.
Resistivity sections clearly highlight the alternation of conductive clayey and resistive sandstone units. Clay-rich formations act as physical and chemical barriers (“sealing mirrors”) that limit vertical fluid flow and trap mineralizing solutions in permeable units just beneath or laterally adjacent. These impermeable units play a key role in focusing mineral precipitation and help explain the strata-bound nature of the copper deposit.
Among the resistivity profiles, PM4 was particularly instrumental in constraining the deep rooting of the anticline, a structural feature that may control the upward migration of mineralizing fluids. This observation is critical for future drilling strategies, which should consider testing deeper levels within such structural traps.
Gravity data also provided valuable insights. The application of regional trend filtering helped trace the anticline continuity beneath Quaternary cover, in areas lacking outcrop data. Subsequently, a 3D inversion of the Bouguer anomaly clarified the geometry of dense subsurface structures associated with the anticline, validating its lateral extension. A 2D forward gravity model, constructed along a profile parallel to the geological section, was also developed to test the consistency of structural interpretation. This model integrates lithological and density constraints from outcrops and boreholes and supports the geophysical delineation of the anticline and its rooting geometry.
These findings are summarized in
Figure 9, highlighting zones with the highest mineralization potential, particularly where sedimentary and structural controls intersect.
5. Conclusions
This study has enabled the characterization of the rooting of the Merija anticline and significantly improved the understanding of the underlying geological structures, particularly beneath the Quaternary cover, through the implementation of an integrated geophysical approach. The adopted methodology, combining gravity surveying, electrical resistivity (ER), and induced polarization (IP), demonstrated its effectiveness in mapping deep structures and in validating the structural and mineralogical hypotheses derived from field data observations.
Gravity profiles, deployed from the outcropping Jurassic and Lower Cretaceous zones to areas covered by Quaternary deposits, revealed a remarkable correlation between gravity anomalies and the geometry of the Merija anticline in exposed areas. The application of a trend filter to the gravity data in the covered zones allowed the removal of regional effects and isolation of residual anomalies, thus extending the traceability of the anticline beneath the Quaternary cover. This process highlighted a central dense core consistent with the Jurassic–Cretaceous nucleus of the anticline and helped to delineate a large regional fault interpreted as controlling the structure’s rooting.
Three-dimensional inversion of the Bouguer anomaly grids was performed for each profile using VOXI (Oasis Montaj), producing voxel models later clipped by density to isolate the core structure. Cross-sections extracted from the 3D model provided a clearer visualization of the anticline’s continuity, particularly in the outcrop zones where inversion quality was highest. Although the resolution decreased beneath the Quaternary cover, the core geometry remained traceable, reinforcing structural interpretations. The electrical resistivity (ER) and induced polarization (IP) profiles complemented the gravity observations. The resistivity profile, conducted perpendicular to the regional fault allowed imaging of the anticline’s rooting and identification of deep lithological contrasts. The induced polarization profiles, for their part, revealed chargeability values characteristic of stratiform copper mineralization, concentrated in the sandstones and conglomerates of the Infracenomanian, and mainly located on the flanks of the anticline. The spatial correlation between chargeability anomalies and known mineralized outcrops suggests that, despite the dominance of oxide copper minerals such as malachite, IP measurements can still provide meaningful indications of mineralization zones under favorable field conditions.
Validation of the geophysical interpretations was ensured through a drilling campaign, the results of which confirmed the rooting of the anticline and the lithological succession identified from the gravity and electrical profiles. Borehole MR4, drilled on the southern flank of the anticline, notably revealed a complete stratigraphic succession from the Upper Cretaceous to the Jurassic, thereby confirming the robustness of the methodological approach adopted. In addition, a two-dimensional forward gravity model was constructed using GM-SYS to test the consistency of the interpreted structure. The model was constrained by borehole data for layer thicknesses, and average densities were assigned based on literature values. The calculated gravity profile showed good agreement with the observed anomaly, thus reinforcing the interpreted geometry of the Merija anticline and supporting the results of both the inversion and field observations. The overall results obtained demonstrate the relevance of integrating gravity and electrical methods for detecting and characterizing deep structures in covered areas. This multi-method approach provides a powerful tool for mineral exploration, particularly for the search for stratiform copper mineralizations in complex geological settings such as the Merija region. It can be extended to other regions with similar anticline structures and contribute to the development of geological knowledge and the optimization of exploration strategies.
