Article

Integrated Capuchin Search Algorithm-Optimized Multilayer Perceptron for Robust and Precise Prediction of Blast-Induced Airblast in a Blasting Mining Operation

1
Department of Earth Resources Engineering, Kyushu University, Fukuoka 819-0395, Japan
2
Department of Mining Engineering, Botswana International University of Science and Technology, Palapye Private Bag 16, Botswana
*
Author to whom correspondence should be addressed.
Geosciences 2025, 15(8), 306; https://doi.org/10.3390/geosciences15080306
Submission received: 24 June 2025 / Revised: 28 July 2025 / Accepted: 4 August 2025 / Published: 6 August 2025
(This article belongs to the Section Geomechanics)

Abstract

Blast-induced airblast poses a significant environmental and operational issue for surface mining, affecting safety, regulatory adherence, and the well-being of surrounding communities. Despite advancements in machine learning methods for predicting airblast, present studies neglect essential geomechanical characteristics, specifically rock mass strength (RMS), which is vital for energy transmission and pressure-wave attenuation. This paper presents a capuchin search algorithm-optimized multilayer perceptron (CapSA-MLP) that incorporates RMS, hole depth (HD), maximum charge per delay (MCPD), monitoring distance (D), total explosive mass (TEM), and number of holes (NH). Blast datasets from a granite quarry were utilized to train and test the model in comparison to benchmark approaches, such as particle swarm optimized artificial neural network (PSO-ANN), multivariate regression analysis (MVRA), and the United States Bureau of Mines (USBM) equation. CapSA-MLP outperformed PSO-ANN (RMSE = 1.120, R2 = 0.904 compared to RMSE = 1.284, R2 = 0.846), whereas MVRA and USBM exhibited lower accuracy. Sensitivity analysis indicated RMS as the main input factor. This study is the first to use CapSA-MLP with RMS for airblast prediction. The findings illustrate the significance of metaheuristic optimization in developing adaptable, generalizable models for various rock types, thereby improving blast design and environmental management in mining activities.

1. Introduction

Rock blasting is an essential method in quarrying and surface mining operations that enables rock mass fragmentation to provide aggregate of appropriate size, suitable for civil engineering purposes [1]. The primary aim of blasting operations is to optimize fragmentation size, minimize operational expenditure, and ensure maximum safety at all times. Therefore, blasting operations require precise engineering practices to attain the intended outcomes. About 20–30% of the explosive energy generated during the explosive detonation is used for the breakage of the rock mass, while the remaining energy results in adverse environmental effects such as ground vibration, airblast, flyrock, and backbreak. Airblast and ground vibration are the most prevalent issues within blasting operations, and they require appropriate, well-designed blast planning and management practices. This helps reduce the damage they are likely to cause to the nearby buildings, community disruptions, and ensure compliance with the set safety rules and regulations.
When the explosive detonation occurs, a temporary pressure wave, known as the airblast, is released into the surrounding atmosphere. Airblast occurs when the overpressure generated during a blasting activity surpasses normal atmospheric pressure, and it is usually measured in decibels (dB) or pascals (Pa). Despite the risk of damage to structures from airblast, it is typically less than that from ground vibration; however, if it is left uncontrolled, it can still endanger roof panels, walls, and windows, leading to disputes from the nearby residents [2,3,4,5,6]. The frequency spectrum of the airblast waveform can be categorized into inaudible low-frequency (below 20 Hz) and audible high-frequency (greater than 20 Hz). The infrasound phase is primarily linked to the highest airblast levels and far-reaching transmission [7]. The magnitude and propagation of the airblast wave are controlled by a combination of controllable parameters, which include powder factor, burden, spacing, stemming length, and explosive charge, as well as the uncontrollable factors such as atmospheric conditions, including temperature, wind, and precipitation. Moreover, geological factors also have an impact on airblast, and these include Poisson’s ratio, rock discontinuity structures, and rock mass classification.
Several approaches have been proposed to mitigate the effects of airblast, such as the use of obstacles as shields to provide structural integrity to the buildings and doors fitted with glass [8]. However, their effectiveness has not considerably improved [9,10]. Furthermore, empirical methods have also been developed for determining airblast to help control it; however, they have demonstrated poor performance in predicting airblast [11,12]. In recent years, machine-learning techniques have been widely used to further improve the prediction accuracy of airblast. Artificial neural networks (ANNs), support vector machines (SVMs), adaptive neuro-fuzzy inference systems (ANFIS), and genetic algorithms (GAs) have been utilized, and they exhibit varying levels of performance. Mohamad et al. [6] built an artificial neural network utilizing 38 airblast datasets, incorporating inputs such as hole depth, diameter, spacing, stemming, burden, number of rows, and powder factor. The model demonstrated considerable predictive accuracy. Khandelwal and Kankar [13] evaluated 75 airblast events across three distinct mining areas using a support vector machine (SVM). The SVM model had a better precision compared to traditional predictive models. Mohamad et al. [14] predicted airblast with 76 datasets using three non-linear methods, namely empirical, artificial neural network (ANN), and a hybrid model of genetic algorithm (GA)-ANN. Only two input parameters were used for this study (the monitoring distance from the blast face and maximum charge per delay). They found that the GA-ANN model had higher prediction accuracy of airblast compared to other predictive methods. Khandelwal and Singh [15] evaluated an ANN against the USBM predictor utilizing monitoring distance and MCPD as inputs, and the results revealed that the ANN outperformed the empirical USBM model.
Despite these advancements, there are still some significant shortcomings that remain in the current literature. Initially, common input parameters such as hole depth, explosive properties, and monitoring distance were typically implemented; however, the impact of rock mass strength (RMS) on airblast propagation has been significantly overlooked, despite laboratory and field research indicating its substantial effect on pressure wave attenuation and energy coupling. On the other hand, previous machine-learning investigations frequently consider rock quality designation (RQD) as a substitute for rock competency, which inadequately represent both intact rock strength and discontinuity conditions. Ureel and Momayez (2017) [16] conducted Los Angeles abrasion tests on quartzite and found an R2 of 0.018 between RQD and abrasion loss, showing that RQD does not reflect the rock’s resistance to wear. Moreover, Naiem (2013), [17] performed uniaxial compressive strength tests on sandstone cores and found an R2 of 0.235 between RQD and UCS. These relatively small correlations demonstrate the importance of a more comprehensive index, such as RMS, which incorporates both intact rock strength and the geometry of joints and fractures better than RQD. Furthermore, the majority of ANN implementations still employ classic backpropagation (BP) for training, characterized by slow convergence and a tendency to become trapped in local minima, thereby restricting predictive accuracy [18,19,20]. Although particle swarm optimization (PSO) has been utilized to enhance the weights and biases of artificial neural networks (ANN), less research has been conducted on alternative global-search metaheuristics methods that provide more unbiased exploration–exploitation techniques and use fewer tuning parameters. In addition, comparative evaluation methods such as multivariate regression analysis (MVRA) and empirical models tend to be limited, therefore hindering a detailed assessment of model ability across various geological environments. Table 1 shows some previous studies on airblast.
In addition to predictive studies using hybrid metaheuristic machine learning techniques, some researchers are using new methods such as reptile search algorithm-optimized neural networks, PSO-YUKI, and salp swarm-augmented gradient boosting, which have significantly enhanced prediction accuracy in other fields such as structural health monitoring, water treatment applications [28,29,30,31]. As a result, the capuchin search algorithm (CapSA) is used in the study because of its dependence on just two straightforward control parameters, its fast exploration and exploitation by jump, swing, and climb operators, and its demonstrated better rate of convergence and solution performance on engineering optimization benchmarks in comparison with PSO and GA [32,33].
This study presents, for the first time, a hybrid CapSA-MLP designed for the prediction of blast-induced airblast and integrating RMS to address gaps in existing approaches. Traditional empirical formulas and other machine learning approaches frequently depend on a narrow range of inputs, namely hole diameter (HD), maximum charge per delay (MCPD), distance from blast face (D), total explosive mass (TEM), and number of holes (NH), which are important, but inadequately represent the mechanical properties of the rock mass. By incorporating direct measurements of RMS with traditional design parameters, the elastic and fracture characteristics of the in situ rock mass will be accurately represented. RMS is determined by uniaxial compressive strength testing on intact cores and discontinuity assessments on the quarry face. In addition, it involves the strength of the intact material and the effects of joints, bedding planes, and other weaknesses; as a result, it governs how explosive energy couples into rock and propagates through it, consequently directly affecting crack initiation, propagation, and pressure-wave attenuation. In a competent rock formation, energy transmission is efficient and results in an increased airblast, whereas in weaker, fractured formations, the energy dissipates through cracks, and this causes less energy to be released to the air, resulting in lower airblast intensity.
Previous machine learning studies in this subject matter have frequently used RQD as an indicator of rock competency, as illustrated in Table 1. However, since RQD measures joint spacing, it does not directly assess the strength of unbroken rock or the state of joint surfaces, which are both vital factors in pressure-wave transmission. Therefore, integrating RMS addresses this deficiency, thus enabling the model to accommodate significant changes in geological conditions, such as the transitions from solid rock mass to a more fractured state. This improves the representation of subsurface conditions and expands the model’s applicability across several quarries, where local variations in porosity, weathering, and discontinuity patterns can significantly affect airblast behavior.
To benchmark against CapSA-MLP, this study compares its performance against three alternative approaches:
  • PSO-ANN: uses particle swarm optimization to tune weights and biases but lacks CapSA’s multiphase search operators.
  • MVRA: offers a transparent linear regression baseline.
  • USBM predictor: depends on scaled distance and charge weight correlations.
This research shows that a hybrid CapSA-MLP is capable of predicting blast-induced airblast (AB). Moreover, it is the first research to incorporate rock mass strength into a metaheuristic-optimized MLP for airblast prediction. This results in an improved model robustness and adaptability, thus leading to reduced necessity for extensive site-specific calibration. Furthermore, the model will provide useful information to blast and environmental engineers to optimize mitigation. The paper is structured as follows. Section 2 describes the materials and methods, including the blasting data, correlation matrix, the geology of the area, and rock mass characterization. Section 3 presents the proposed CapSA-MLP model, the PSO-ANN model, MVRA, and the USBM predictor approach. Section 4 reports the results and discusses their implications. Finally, Section 5 offers the conclusions.

2. Materials and Methods

2.1. Data Acquisition

Blasting datasets were acquired from a Bela Bela granite quarry in Botswana. The Bela Bela quarry is located in southeastern Botswana, approximately 15 km northeast of Gaborone, at approximately latitude 24°32′18.6″ S and longitude 26°02′13.8″ E. The monthly output of the granite quarry varies from roughly 13,000 tonnes to approximately 45,000 tonnes. Seventy-four blasting datasets, containing various combinations of blast design parameters, were gathered and applied, with details of each parameter listed in Table 2. The data collection included blast design parameters, such as hole depth (HD), maximum charge per delay (MCPD), distance from the blast face (D), total explosive mass (TEM), number of holes (NH), and rock samples to evaluate the rock mass strength (RMS) of the quarry. The study also included detailed qualitative and quantitative assessments of the fracture intensity of quarry faces.
Numerous studies show that accurate prediction of blast-induced airblast depends on understanding both the blast design parameters and the geomechanical properties. The selection of hole depth is essential as it determines the confinement of the detonation, which influences the energy release pattern [34], maximum charge per delay shows the instantaneous energy input that produces the primary shock wave [35], and the distance from the blast face is vital for assessing the attenuation of the pressure pulse as it traverses through air [25]. The total explosive mass represents the overall energy available for wave generation [6], whereas the number of holes regulates the geographic distribution of charges and their mutual interference impacts [36]. Furthermore, rock mass strength was used as an entirely new input parameter, which incorporates the elastic and fracture properties of the in situ rock mass and greatly impacts the propagation of explosive energy. This parameter was determined by uniaxial compressive strength (UCS) tests performed on collected rock samples, together with the geological strength index (GSI) approximated based on visual assessments and quantitative analyses of fracture intensity encountered on quarry faces.
Moreover, emulsions are used as the principal explosive substance, pentolites act as booster variants, and shock tubes operate as the initiating mechanism. Also, fine gravel functions as stemming material for the blast holes. A VibraZEB seismograph, with an effective sensitivity range of about 78 to 150 dB, was used in this study for recording airblast data via its microphone channel. During every blast, the microphone was pointed toward the blast face and coupled with the first channel of the VibraZEB. The microphone captured peak airblast values ranging from 81 dB to 143 dB. Devices were set up at distances ranging from 200 m to 900 m from the blast face. The waveforms were captured during each blasting event and then retrieved using a USB for further analysis and study of their impact on the environment.
Furthermore, Figure 1 shows the correlation matrix of the dataset’s parameters (NH, D, HD, RMS, MCPD, TEM, AB). It can be noted that none of the input parameters has a strong linear relationship with AB. The monitoring distance (D) shows the greatest correlation, while hole depth (HD) and maximum charge per delay (MCPD) are uncorrelated. Rock mass strength (RMS) has little correlation, illustrating the weakness of single-variable regression models for the prediction of airblast. However, TEM and NH are highly correlated (0.78), while HD correlates significantly with both MCPD and TEM. MCPD and TEM display a strong connection (0.65), indicating their dependence on each other. Therefore, metaheuristic neural network methodologies, specifically the CapSA-MLP, will be used to model non-linear interactions and mitigate the negative implications of highly correlated inputs.
In addition, through integration of CapSA’s global search strategy with explicit regularization by λ (L2 weight decay), dropout rate, and the other hyperparameters outlined in Table 3, the multicollinearity among input parameters is effectively mitigated, resulting in more stable and generalizable CapSA-MLP models. Furthermore, CapSA-MLP offers global exploration and exploitation capabilities to identify weight configurations that minimize duplicate contributions.
Moreover, CapSA continuously changes and evaluates the entire weight vector instead of adhering to a singular gradient direction, allowing it to bypass local minima caused by correlated inputs that can lead to inappropriate weight assignment. This results in a stable solution where the network allocates varying significance to TEM and NH, as validated by sensitivity analysis. Sensitivity analysis demonstrated that, despite the interdependence and multicollinearity of parameters, each input exhibits an independent impact on airblast, as described in results and discussion section. Therefore, despite the interrelated relationships between some of the input parameters, their inclusion for the development of models will not cause instability or compromise the reliability of the predictive models. The following subsections describe the local geology of the area, the procedures for applying CapSA-MLP, PSO-ANN, empirical formula (USBM), and MVRA for predicting airblast.

2.2. Geology of the Area

The local geology is as follows:
  • Lithology: The primary rock is a large granite with coarse grains that is part of the Gaborone Granite Complex. Moreover, the mineralogy of the area consists of equigranular Quartz, K-feldspar, plagioclase, and biotite with fresh exposures that are light grey to pinkish [37].
  • Weathering and overburden profile: It consists of topsoil that is less than 1 m, characterized by aeolian silts, calcrete nodules, and sparse vegetation. The saprolite is between 1 m to 3 m, made of soft, clay-laden, orange-brown material with remnants of the original granitoid structure. In addition, saprock lies between 2 m to 5 m and it is made up of blocky, fractured granite corestones that are friable and micro-fractured. Moreover, the fresh granite lies deeper than 5 m and serves as the primary aggregate resource.
  • Quarry bench geometry: The quarry has bench heights ranging from 8–10 m, while the bench angles are 70–75 degrees. Furthermore, berm widths are 3–5 m and act as catch benches for loose rocks. The overall depth of pit is more than fifty meters below the initial ground surface.
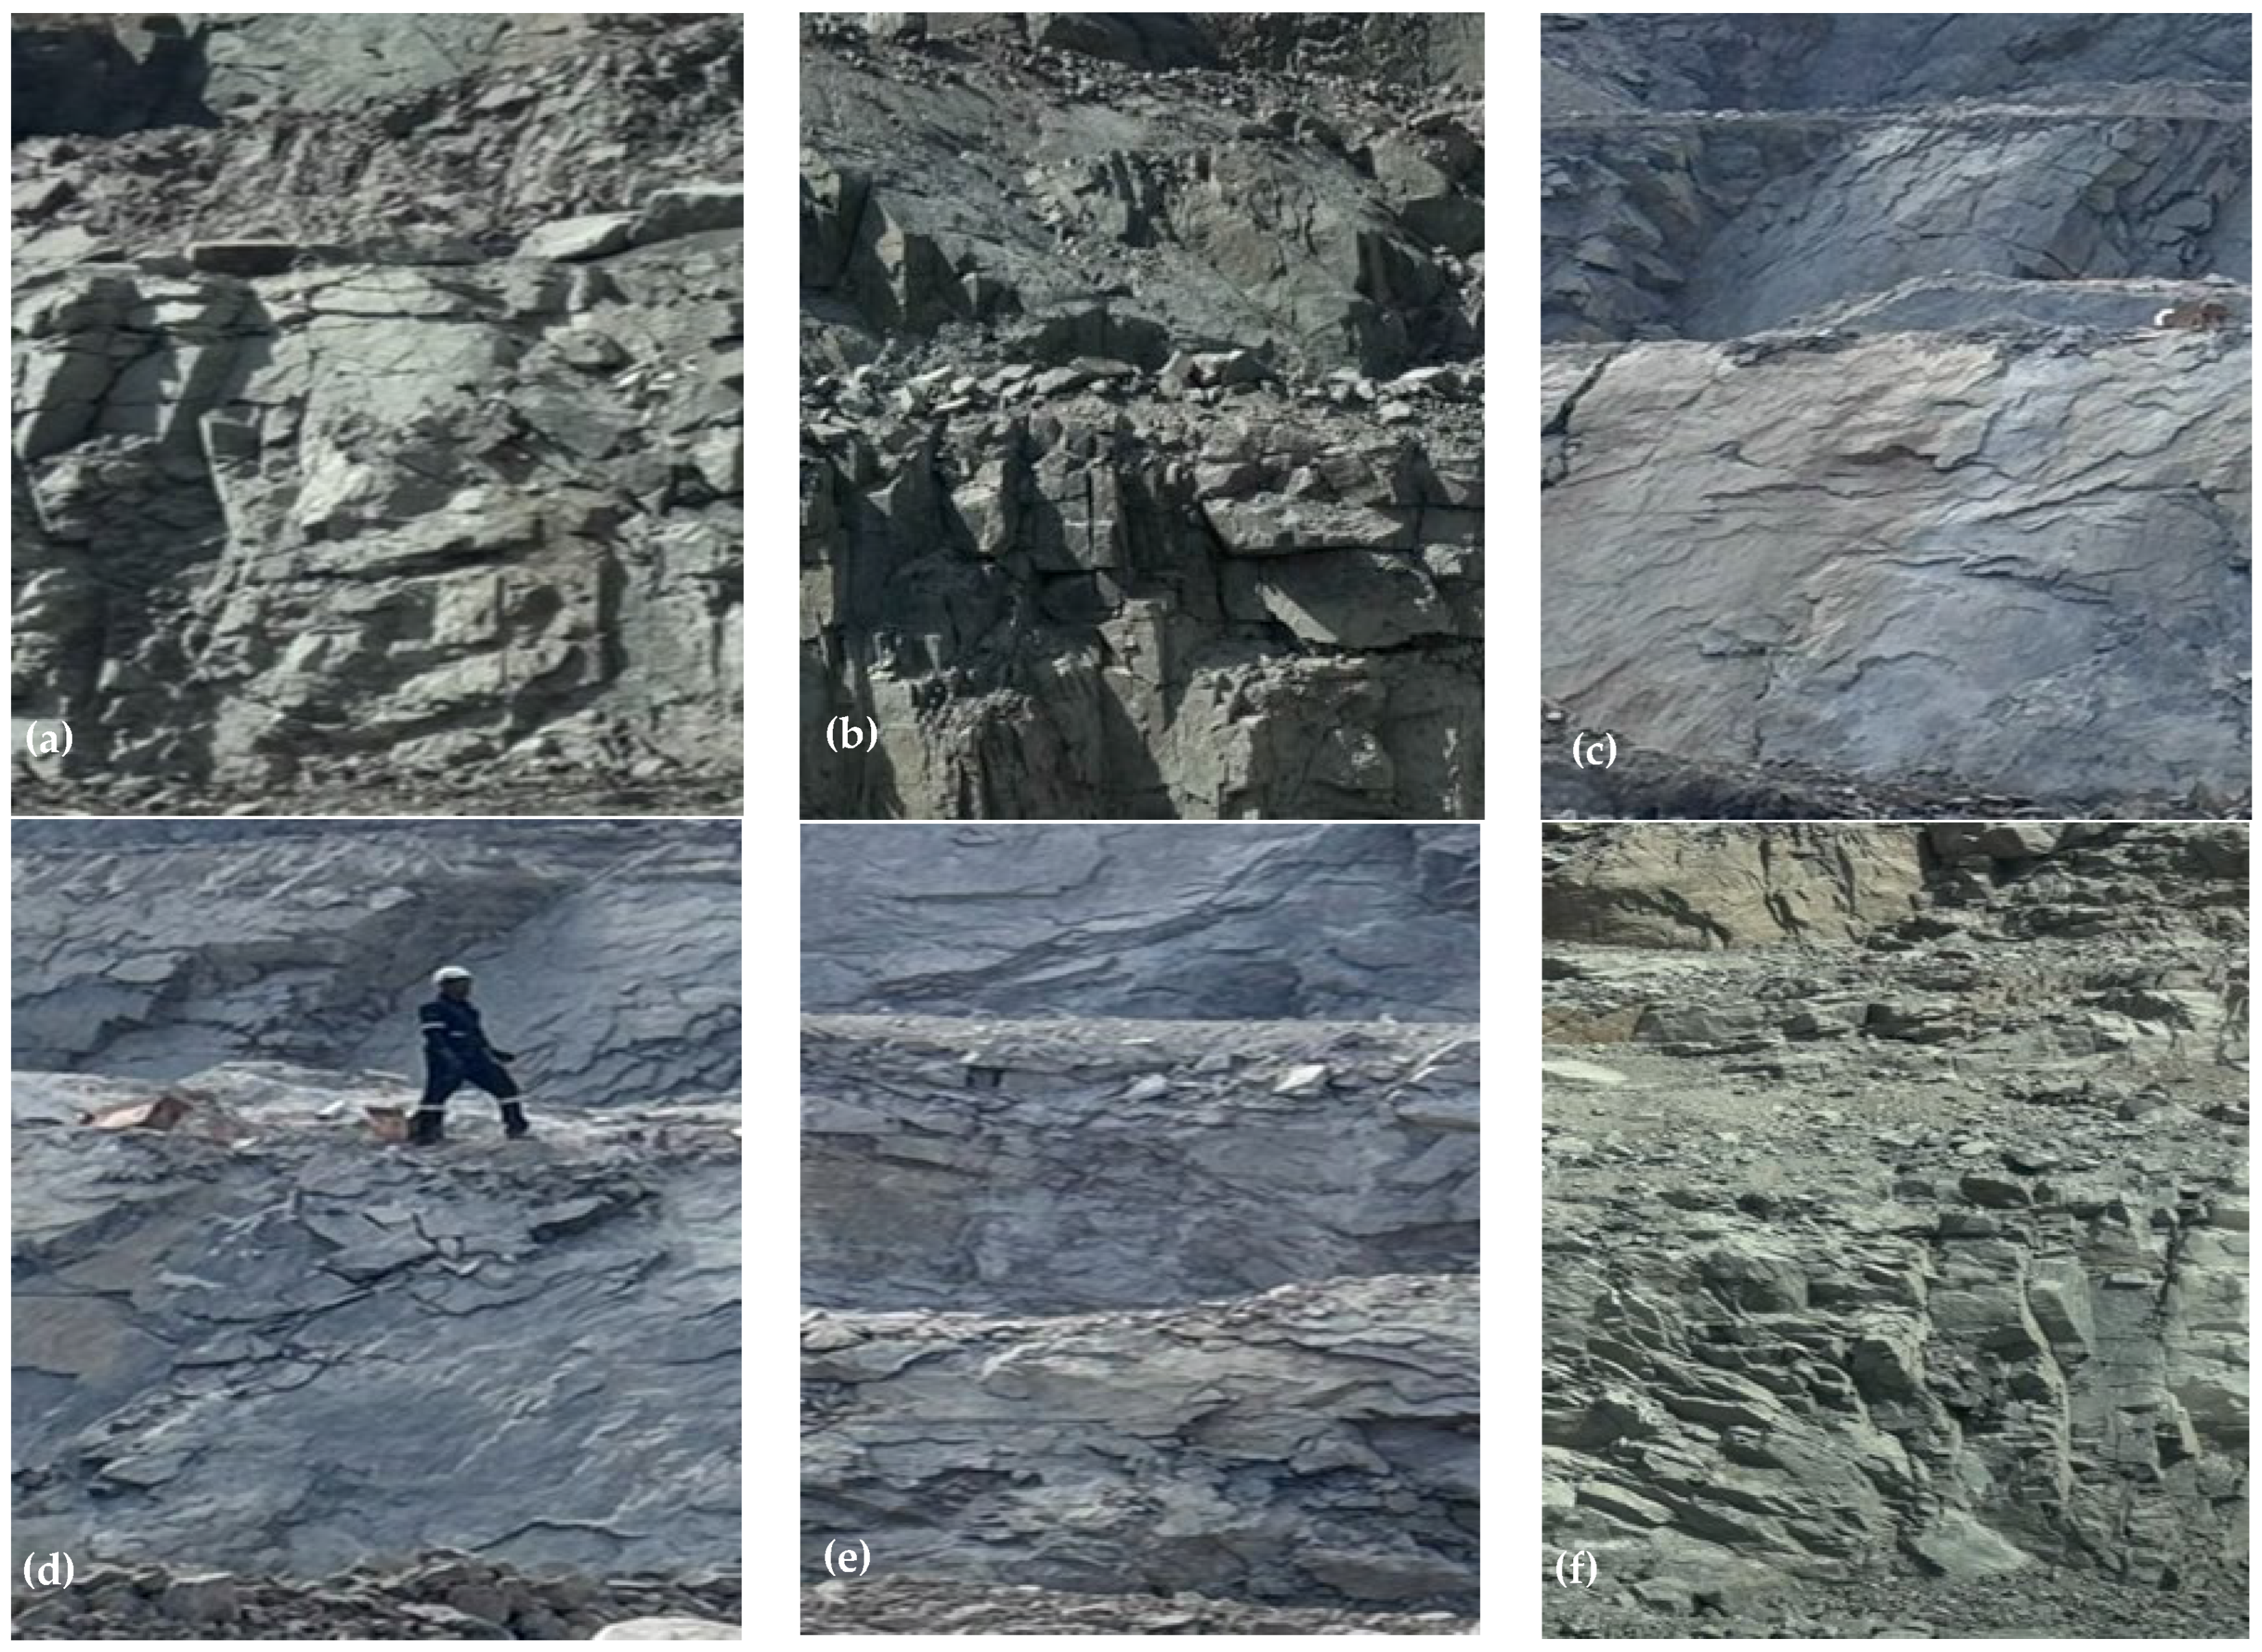
  • Structural and discontinuity features: There are two main sets of joints in the quarry, which are subvertical NE-SW and steeply sloping NW-SE. The spacing between them is 1.5 m, and there are irregular vein-like intrusions of about less than 0.5 m thickness in some areas. Furthermore, it can be observed that the bench faces show different rock fracture intensities as shown in Figure 2.
  • Hydrogeology and ground conditions: The quarry has poor natural drainage, which results in a buildup of rainfall and seepage in the lower benches, resulting in water pools. However, the operators use portable centrifugal pumps, which are rated between 5–10 horsepower, to pump water buildups to settling ponds and other natural drainage channels. Furthermore, regular dewatering is done to keep bench surfaces free of water, thus decreasing pore pressures around drillholes, and this leads to improved drilling efficiency while mitigating the risks of drill rig instability, bit slippage, and worker slips or falls. This level of water monitoring and pumping of buildups ensures secure and uninterrupted drilling.

2.3. Rock Mass Characterization

Utilizing the Hoek–Brown GSI chart shown in Figure 3 in conjunction with some quarry observations shown in Figure 2, it can be proposed that the Bela Bela granite mass can be perfectly characterized as very blocky, and forms multi-faceted blocks (a, b, and f). The surface quality differs from fair (moderately weathered, blast-damaged faces in c, d, and e) to good (fresh, rough surfaces on newer benches) as shown in Figure 2. Cross-referencing these observations on the GSI chart yields an estimated GSI of 55 ± 5, which serves as the foundation for subsequent rock mass strength calculations. Furthermore, the GSI for each face was assessed independently by three observers, and the mean ± standard deviation was determined to quantify inter-observer variability, resulting in a GSI of 55 ± 5. Rock samples collected from different blasting faces were laboratory-tested for unconfined compressive strength (UCS) and the GSI. Moreover, both lower and upper bounds of UCS and GSI were then used in the generalized Hoek–Brown equations (Equations (9–13)) to calculate RMS. The degree of variability in GSI was incorporated during the calculation of the Hoek–Brown parameters m_b, s, and a, resulting in lower and upper bounds for each RMS.

3. Proposed CapSA-MLP, PSO-ANN, MVRA, and the USBM Predictor Approaches for Predicting Blast-Induced Airblast

This section describes the prediction methods used in this study: CapSA-MLP, PSO-ANN, the empirical formula (USBM), multivariate regression analysis (MVRA), and rock mass strength calculation. The literature shows that there are no defined guidelines for the minimum or maximum dataset size necessary to create an effective airblast prediction model. Table 1 demonstrates that previous research has utilized diverse dataset sizes across multiple techniques, demonstrating the adaptive data requirements prevalent in this field of study.

3.1. Capuchin Search Algorithm–Optimized Multilayer Perceptron

The Capuchin Search Algorithm-optimized multilayer perceptron (CapSA-MLP) is a novel hybrid method that uses the global search capabilities of the Capuchin Search Algorithm (CapSA) to optimize the network architecture and weight initialization of a multilayer perceptron (MLP). CapSA, first proposed by Braik, Sheta, and Al-Hiary in 2021 [32], is inspired by the foraging methods of capuchin monkeys, especially their jumping, swinging, and climbing behaviors, to achieve a balance between exploration and exploitation. By integrating these metaheuristic approaches into the training process, CapSA-MLP mitigates common drawbacks of gradient-based backpropagation, including slow convergence and entrapment in local minima. Moreover, the integration of the essential input parameters, such as rock mass strength, helps improve model accuracy in predicting blast-induced airblast. Furthermore, a population of capuchin agents explores a multidimensional parameter space, with each agent representing a potential MLP configuration. In every iteration, agents use one of three operators, namely, jump, swing, or climb, to produce new configurations, evaluate their fitness, and update both individual and global optimal solutions. This iterative approach runs until convergence requirements are satisfied, confirming that the final MLP architecture achieves optimal predictive performance. The procedure of the mechanisms is as follows:
  • Jump operator: With probability pjump capuchin executes a large random perturbation:
    x i j u m p = x i   + l a r g e , l a r g e U σ j u m p , σ j u m p
    where x i represents network hyperparameters and initial weights, and σjump is a scaling parameter that promotes prolonged exploration.
  • Swing operator: as a substitute, with probability, Pswing, the capuchin advances toward the present global optimum x via weighted vector shift:
    x i s w i n g = x i + r ( x + x i ) , r U 0 , 1
This generates a measured, targeted approach that balances exploration and exploitation.
  • Climb operator: If neither Jump nor Swing is activated, the capuchin conducts a localized fine-tuning, defined as follows:
    x i c l i m b = x + , N 0 , σ c l i m b 2 I
    where σ c l i m b is a minor standard deviation that enables accurate weight and hyperparameter modifications to reduce RMSE.
After generating a new candidate x i n e w by one of these operators, the fitness of x i n e w is evaluated. If the RMSE is less than that of the earlier x i , the algorithm substitutes x i with x i n e w . The global optimum x is updated whenever a capuchin produces a lower RMSE than all others. This method continues until either a maximum iteration limit has been reached or the difference in global best RMSE drops below the set threshold. Furthermore, throughout the repeated execution of Jump, Swing, and Climb, CapSA develops an evolving balance among global exploration and local exploitation, thus mitigating the risk of entrapment in local minima and promoting convergence toward the optimum MLP configuration for airblast prediction. Table 4 shows the comparison between the CapSA and PSO. The next sections outline the sequential procedures of the PSO-ANN model, the empirical formula (USBM), and MVRA.
In this method, each particle signifies a whole potential solution, including a complete array of interconnection weights and bias values for the network. Particles are first distributed randomly over the multidimensional search space, with each particle’s velocity initialized randomly. In each iteration, the velocity of particle i in dimension d is modified according to Equation (4) as follows:
υ i d ( t + 1 ) = w υ i d × ( t ) + C 1 × r a n d ( ) × ( p b e s t i d χ i d ( t ) ) + C 2 × r a n d ( ) × ( g b e s t d χ i d ( t ) )
while its position is updated as
χ i d ( t + 1 ) = χ i d ( t ) + υ i d ( t + 1 )
where w is the inertia weight regulating momentum, C1 and C2 are the cognitive and social acceleration coefficients, rand() generates a uniform random number in the interval [0, 1], and pbestid is the personal best position of particle i in dimension d, gbestd is the global best position among all particles in dimension d, and xid(t) is the current position of particle i in dimension d at iteration t [39,40]. Moreover, xid(t + 1) is the position of particle i in dimension d at iteration t + 1. In each iteration, an artificial neural network is built utilizing the weights and biases represented by each particle’s current position. The network is determined by using the training dataset, which includes blasting design parameters such as hole depth, maximum charge per delay, distance to the monitoring location, total explosive mass, number of holes, and rock mass strength, by calculating the mean squared error (MSE) between the predicted and actual airblast values. The calculated MSE functions as the fitness value for that particle. If a particle’s current mean squared Error (MSE) is less than its prior personal best, the personal best (pbest) is adjusted, and if it is also less than the global best, the global best (gbest) is updated. This method continues until either the maximum iteration limit has been reached or the variation in gbest MSE drops below a specified threshold, signifying convergence [27]. Once the global optimum solution is reached, the ANN is adjusted by backpropagation, which changes weights using local gradient information to minimize error further. Furthermore, backpropagation fine-tuning commenced with an initial damping parameter μ0 = 0.01, where μ0 represents the initial value of the Levenberg–Marquardt damping factor. The parameter μ was afterward adjusted by multiplying it with the damping decrease factor (β = 0.1), resulting from effective error reduction when an update was declined, thereby thoroughly regulating the Gauss-Newton and gradient-descent behavior. Training continued for a maximum of 50 epochs, with identical conditions applied to both CapSA-MLP and PSO-ANN in order to ensure performance comparison fairness.

3.2. Multivariate Regression Analysis (MVRA)

This is a traditional statistical approach used to measure the linear relationship between the dependent variable and several independent variables. Its expression is as follows:
Z = b0 + biXi + b2X2bkXk
where Z represents the predicted output, Xi refers to the input variables, b0 is the intercept, and bi are the regression coefficients corresponding to each predictor. MVRA depends on the assumptions that the remaining values are independent and equally distributed, with a mean of zero and constant variance. In addition, each predictor Xi exhibits a linear connection with the dependent variable Z, and lastly, the predictors are not perfectly collinear. The MVRA approach is frequently employed in many research studies as a benchmark for comparing machine learning techniques [12,41,42,43].

3.3. USBM Predictor

It was initially proposed by the U.S. Bureau of Mines, and it relates airblast directly to charge weight and distance. In the USBM Equation (8), P signifies the airblast magnitude (in decibels, dB, or pascals, Pa), β and H are site constants. The scale distance (SD) is determined by Equation (7), where W represents the charge weight (kg or lb), D indicates the distance from the blast face to the monitoring position (m or ft). SD and USBM are as follows, respectively:
S D = D W 0.33
P = H × ( S D ) β

3.4. Rock Mass Strength Calculation

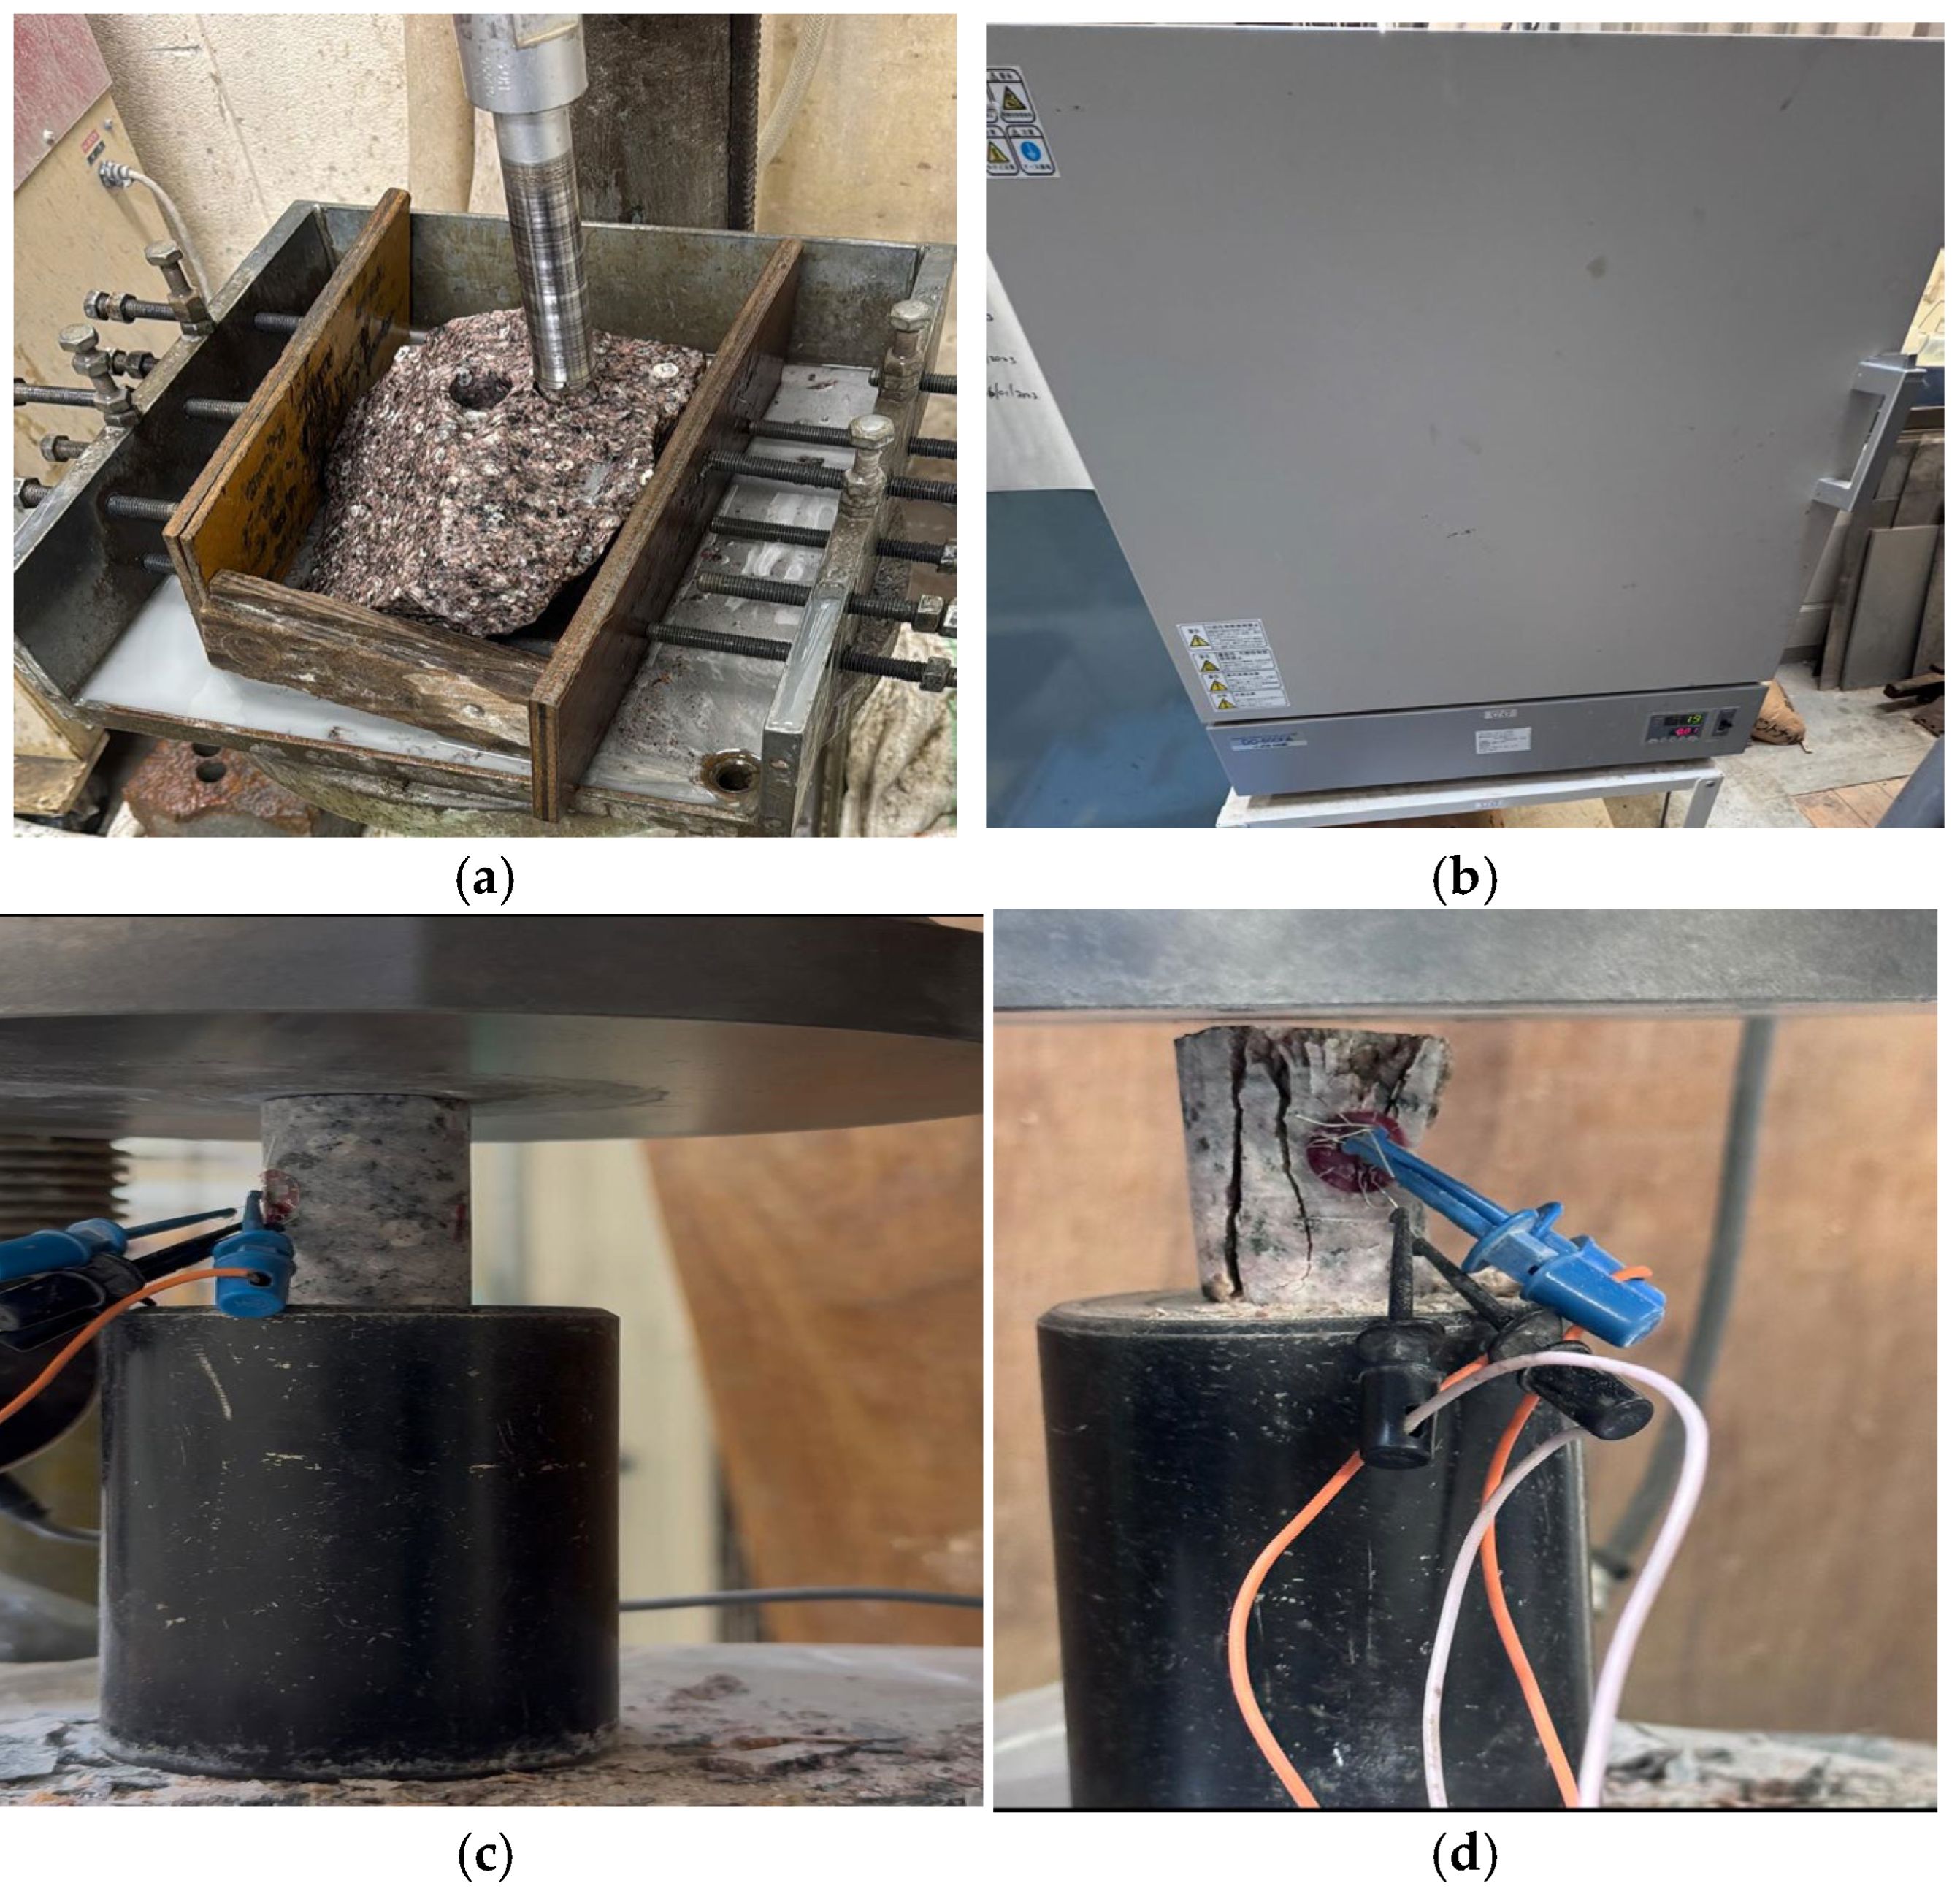
Rock samples were obtained from the Bela Bela quarry from different blasting cases. Figure 4 shows the test procedure done for the UCS tests. Granite cores measuring 2.5 cm in diameter and 5 cm in length were created and afterward subjected to oven drying at 105 °C for 72 h to remove all moisture. The rock core specimens prepared were subsequently placed in an automatic uniaxial compression testing device and subjected to axial force under displacement control. Moreover, the core specimens failed under maximum load through a characteristic axial-splitting mechanism, resulting in the fragmented wreckage shown in Figure 4d. The uniaxial compressive strength tests resulted in values ranging from 56.76 MPa to 58.90 MPa, with an average strength of 55.08 MPa. In addition, the rock mass strength (RMS) for the Bela Bela quarry is determined by using the average intact rock UCS of 55.08 MPa and core length of 50 mm, diameter of 25 mm, and L/D ratio of 2:1 and GSI of 55 in the following generalized Hoek–Brown equations:
σ 1 = σ 3 + σ c i ( m b σ 3 σ c i + s ) a
m b = m i e x p ( G S I 100 28 )
s = e x p ( G S I 100 9 )
a = 0.5 + 1 6 ( e G S I 15 e 20 3 )
where σ 1 and σ 3 are the major and minor effective principal stresses at failure, σ c i is the uniaxial compressive strength of the intact rock material, m i the Hoek–Brown constant for intact rock; m b denotes the reduced Hoek–Brown constant for the rock mass; GSI is the Geological Strength Index; s is material constants, where s = 1 for intact rock; and a is the exponent regulating the curve form and non-linearity.
The rock mass strength ( σ c m ) is obtained by setting σ 3 = 0, thus resulting in Equation (13):
σ c m = σ c i × s a
The calculated average rock mass strength of the Bela Bela quarry, with a GSI of 55 and an intact UCS average of 55.08 MPa, is 4.4 MPa. The rock mass strength is 4.6 MPa for the minimum UCS and 4.7 MPa for the maximum UCS.

3.5. Implementation of CapSA-MLP, PSO-ANN, MVRA, and USBM Models

Predictive models were implemented in MATLAB R2024a, integrating both built-in and custom scripts for algorithm building and training. During the field trip at Bela Bela Quarries in Gaborone, Botswana, a total of 75 blasting events were documented. The input parameters are maximum charge per delay (MCPD), hole depth (HD), distance from the blast face to the monitoring point (D), total explosive mass (TEM), and number of holes (NH), along with one output parameter, airblast (AB). The other input, rock mass strength (RMS), was determined by performing UCS on the rock samples collected, qualitative and quantitative analysis of fractures and discontinuities, and cross-checking with the GSI chart. Figure 5 illustrates the overall schematic workflow used in this study.
  • Data segmentation and preprocessing: A total of 75 blasting datasets were randomly partitioned into training (80%) and testing (20%) sets. Also, additional independent validation of 15 new blasting datasets was set aside to be used for final model verification. No missing values were identified, as all parameters were obtained on site and determined through laboratory uniaxial compressive strength testing (RMS).
  • CapSA-MLP: A feedforward multilayer perceptron architecture was employed with one hidden layer. The input layer included six neurons representing MCPD, RMS, HD, D, TEM, and NH, whereas the output layer featured a single neuron that generated the predicted airblast. A hyperbolic tangent sigmoid transfer function was applied in the hidden layer, while a linear transfer function was implemented in the output layer. Table 3 shows the statistics of the parameters used in developing CapSA-MLP models. Moreover, CapSA-MLP was set with a population size between 40 and 400 and allowed to run for a maximum of 200 iterations. Convergence was detected when the change in RMSE between successive iterations dropped below 1 × 10⁻⁴; at this moment, the search ended immediately. Lastly, it also stopped automatically after the 200th iteration.
  • PSO-ANN: The total number of hidden neurons was set at the optimal value established by CapSA to provide a balanced comparison. The network comprised an input layer featuring six neurons (MCPD, RMS, HD, D, TEM, and NH) and an output layer containing one individual neuron that generated the estimated airblast. The hidden layer employed a hyperbolic tangent sigmoid activation function, while the output layer utilized a linear activation function. Table 5 shows the statistics of parameters used in developing the PSO models.
  • MVRA: Applying Equation (6) to our dataset of blasts, the resultant equation for airblast is as follows:
    AB = 46.732 + 0.108NH + 0.019D + 1.591HD + 12.06RMS + 0.0099MCPD − 0.0011TEM
Each regression coefficient indicates the anticipated variance in airblast (dB) for any increase or decrease of the respective parameters, while all others remain constant. A 1-meter increase in hole depth (HD) results in a 1.591 dB increase in predicted airblast, while a 1 MPa increase in rock mass strength (RMS) produces a 12.06 dB increase, indicating the more effective transfer of explosive energy into stronger, less fractured rock. In addition, the positive coefficients for the number of holes (NH), distance from the blast face to the monitoring station (D), and hole depth (HD) show that increased values of these input parameters correspond to increased airblast levels. However, the negative values for maximum charge per delay (MCPD) indicate that an increased amount of it slightly diminishes the airblast. Also, model performance metrics such as R2 and RMSE are used to check how well the model fits and to ensure that the convergence between predictors stays below acceptable levels. MVRAs serve as a significant benchmark for the application of non-linear or metaheuristic-enhanced techniques.
  • USBM predictor: For this study, we adopted the commonly used USBM predictor, as seen in many previous studies. The values of H and −β of the USBM predictor were determined based on the training datasets. A simple linear regression analysis was performed on datasets, with a training-to-testing ratio of 80% to 20%. The USBM predictor Equation (6) was transformed into the usual form of a linear equation, y = mx + c, by applying logarithms to both sides of the equation. Taking the logarithm on both sides gives the USBM predictor (8):
    logP = logH − βlogSD
where AOp is site airblast levels (dBL); H and β are site constants (dimensionless). Y is LogP; C is Log H; X is Log SD; and M is −β. The determined site constants for β and H were 0.146 and 102.216. This makes Equation (8) as follows:
P = 164.561 × (SD)(−2.216)

3.6. Performance Metrics

The models’ performances were assessed using the coefficient of determination (R2), root mean squared error ( R M S E ) . Their equations are as follows:
R M S E = 1 n i = 1 n ( α i β i ) 2
R 2 = 1 i = 1 n ( α i ω i ) 2 i = 1 n ( ω - ω ) 2
where β is the mean of the real values, n presents the total number of data, α, and ω are the real and predicted ith values. In summary, R M S E yields an absolute evaluation of prediction error in the same values as the dependent variable, whereas R2 provides a normalized evaluation of the extent to which the model accounts for the observed variation. Overall, the above metrics provide an comprehensive evaluation of the accuracy of prediction models.

4. Results and Discussion

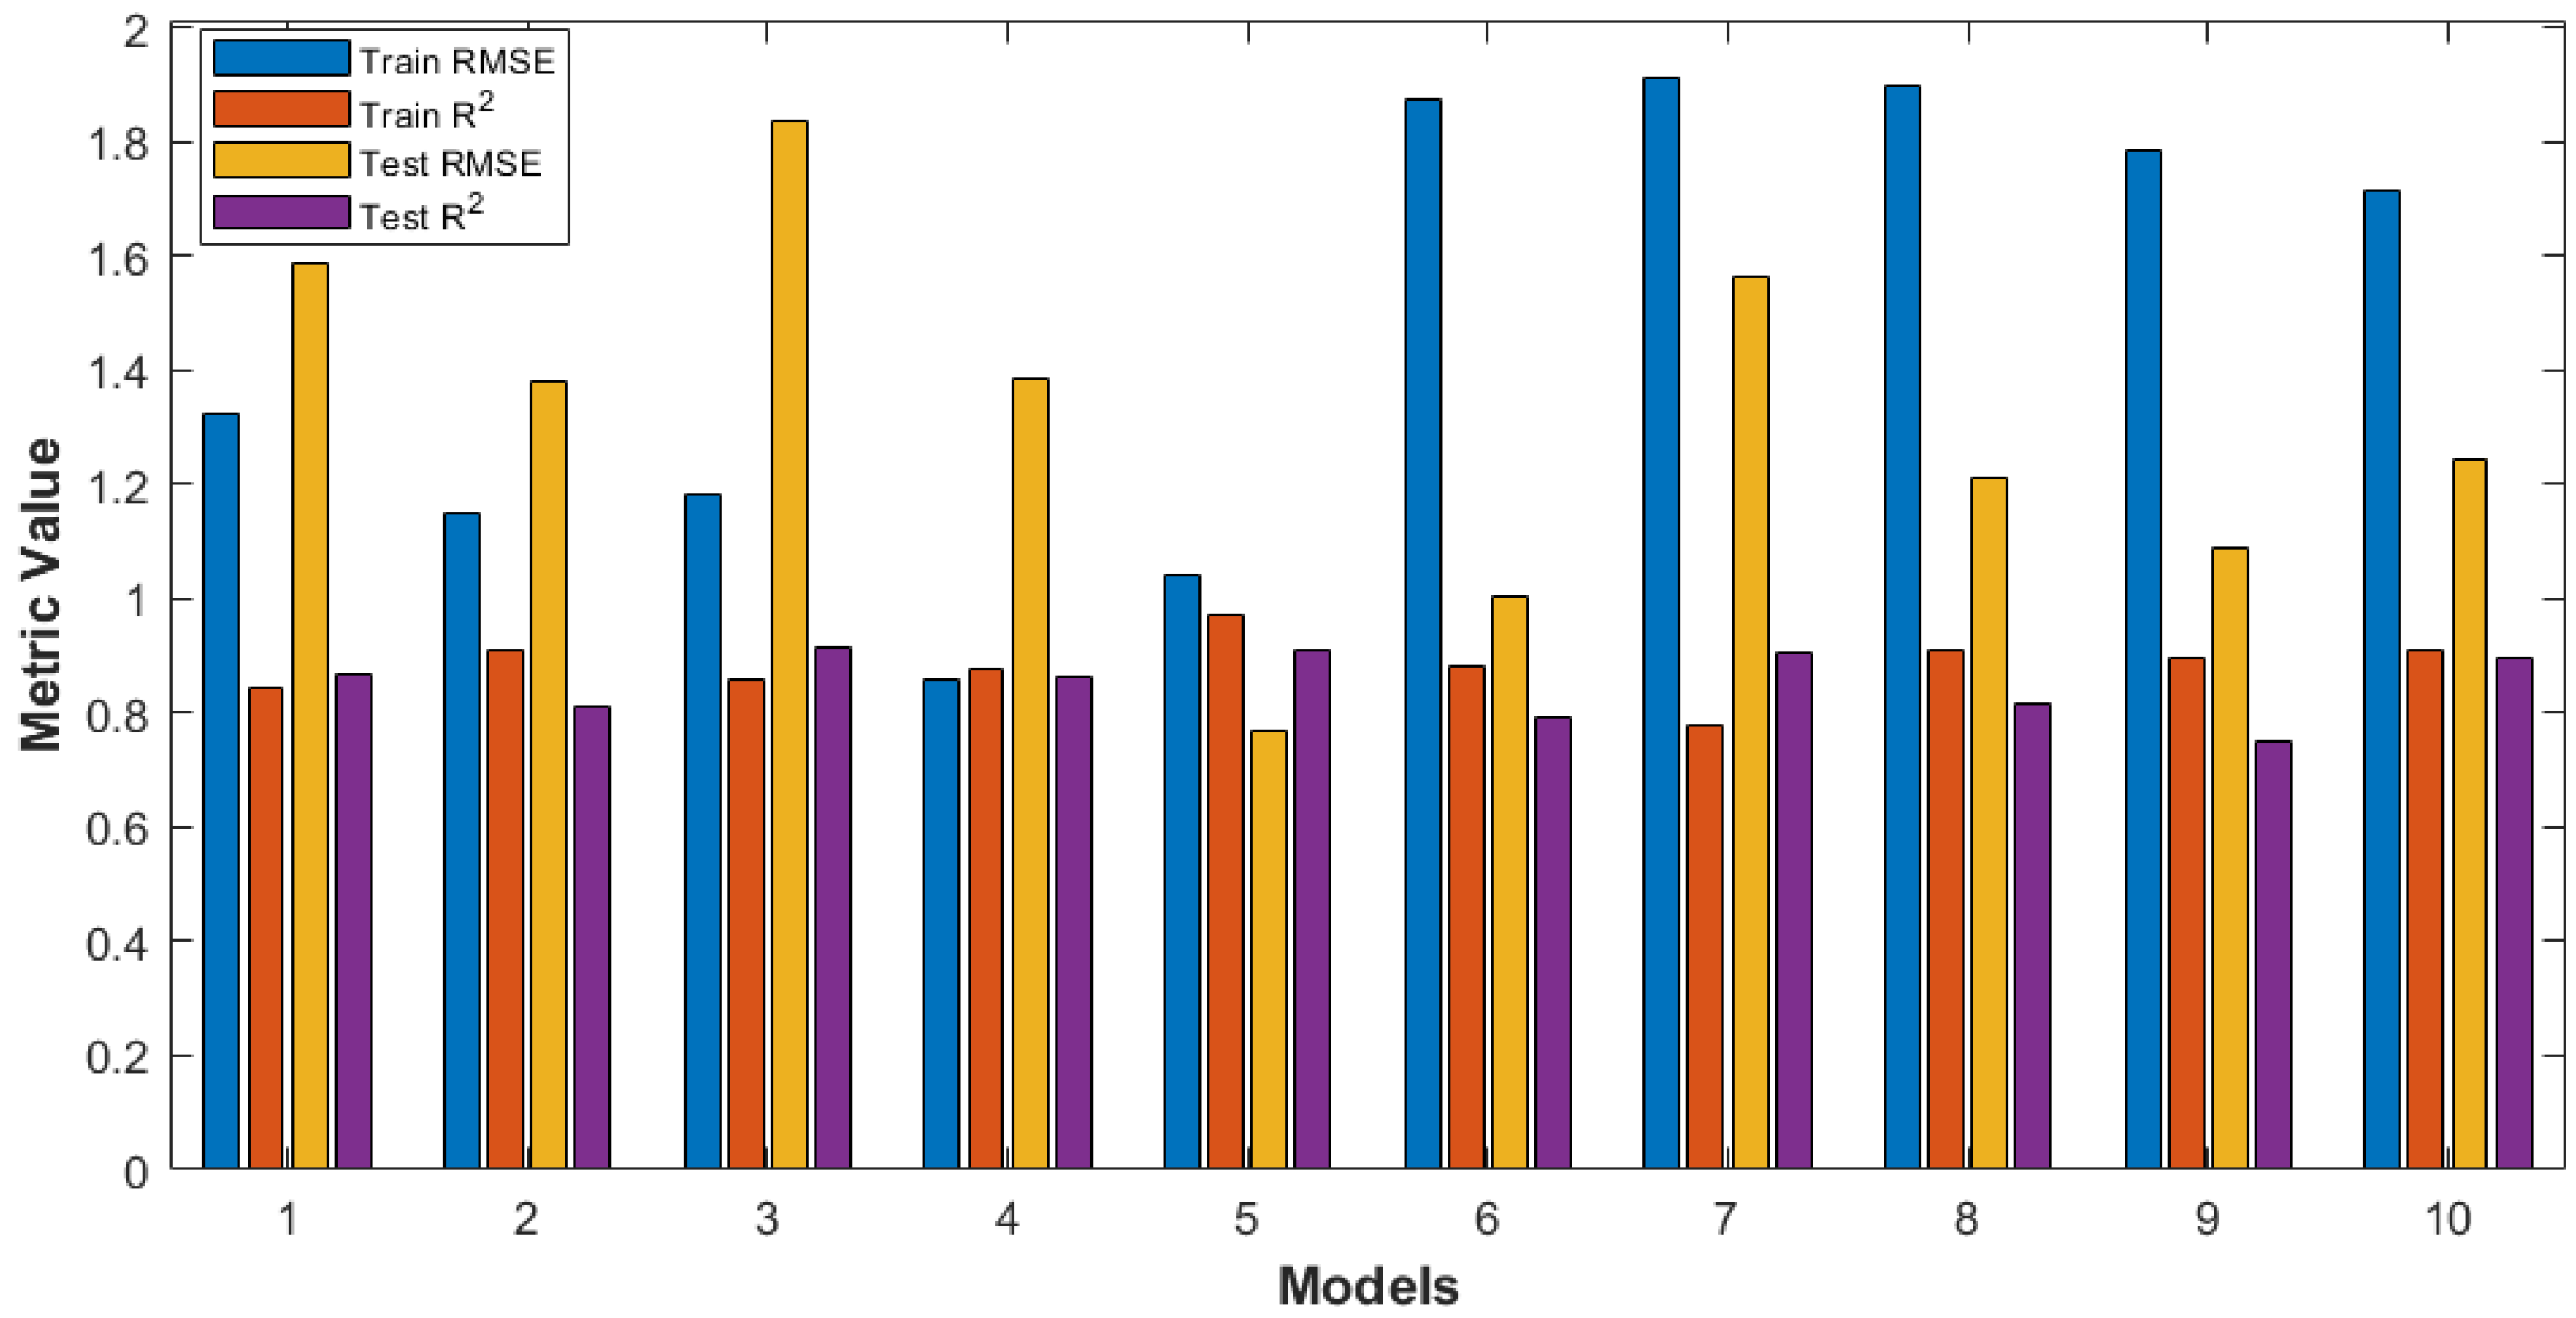
This research aimed to predict blast-induced airblast with the utmost accuracy and determine the most influential parameter on airblast. Firstly, the effectiveness of the CapSA-MLP and PSO-ANN models was compared using a train (80%) and test (20%) split of the 75 blasting datasets. Ten different models of PSO-ANN were evaluated, as shown in Table 6. The PSO-ANN model featuring 22 hidden neurons obtained an RMSE = 0.771 and an R2 = 0.911, making it the optimal one. Even though alternative models, such as those with 26 hidden neurons, yielded better test R2 values, they also resulted in higher errors, demonstrated by a test RMSE of 1.836 for the PSO-ANN model with 26 hidden neurons, as illustrated in Figure 6. This indicates that the specific PSO-ANN configuration has high variance. Furthermore, PSO-ANN models with fewer hidden neurons of less than 20 or more than 25 hidden neurons demonstrated a tendency toward unstable convergence, as shown by increased RMSE on the training and unsatisfactory performance while testing.
Moreover, CapSA-MLP was trained and evaluated using identical data divisions and the same number of hidden neurons for a fair comparison, as displayed in Table 7. Among the ten CapSA-MLP models evaluated, the model with 26 hidden neurons proved to be the most efficient, with testing RMSE = 1.1821 and R2 = 0.941, as shown in Table 7 and Figure 7, and this indicates similar performance. However, the 26-hidden-neurons network reliably represented a larger proportion of variance during testing. Furthermore, the CapSA-MLP models demonstrated reduced R2 from training and testing in comparison to PSO-ANN, indicating better reliability in generality. For illustration, the optimal CapSA-MLP model with 26 hidden neurons achieved R2 of 0.965 and 0.941 for training and testing, respectively, while the optimal PSO-ANN model with 22 hidden neurons reduced from 0.969 and 0.911, each. In another comparison of the two best models, the PSO-ANN model with 22 hidden neurons achieved a slightly lower RMSE of 0.771 during testing, while CapSA-MLP with 26 hidden neurons attained 1.182. However, CapSA-MLP captured a larger fraction of the testing variability, with RMSE and R2 for testing being 1.182 and 0.941, respectively, compared to PSO-ANN with 22 hidden neurons, which had a learning rate of 0.025 and a momentum coefficient of 0.65, resulting in training (RMSE = 1.042 and R2 = 0.969) and testing (RMSE = 0.771 and R2 = 0.911) performance. In addition, 5-fold cross-validation was performed, and CapSA-MLP achieved a mean RMSE of 1.120 ± 0.049 and R2 of 0.904 ± 0.011, while PSO-ANN resulted in a mean RMSE of 1.284 ± 0.027 and R2 of 0.846 ± 0.011. These findings demonstrate that CapSA-MLP displays superior consistency in performance across random train-test splits, with a lower RMSE and a better average R2 compared to PSO-ANN.
Furthermore, validation of these findings was continued with 15 new blasting datasets that were not used in any prior phase and were used on the selected CapSA-MLP (26 hidden neurons) and PSO-ANN (22 hidden neurons). Figure 8 presents the recorded airblast values when compared with the predictions from each model, as well as with multivariate regression analysis (MVRA) and the USBM predictor. CapSA-MLP’s predictions regularly fell within ±2 dB compared to the measured values, whereas the average absolute error of PSO-ANN for the same 15 blasts was second best to the CapSA-MLP model.
The MVRA method performed poorly, whereas the USBM empirical predictor, which solely depended on scaled distance derived from MCPD, significantly underestimated airblast. CapSA-MLP’s ± 2 dB average errors relate to a variance of less than 2% in peak airblast predictions (ranging from 80 to 142 dB), remaining comfortably within standard regulatory limits of ±5 dB. The ability to include rock mass strength (RMS) as an input was essential because stronger and more competent rock transmits energy more effectively, resulting in increased airblast, while weaker, severely fractured rock dissipates energy more quickly. CapSA-MLP effectively adjusts to geological changes throughout the validation blasts by explicitly modeling this impact. Based on these results, CapSA-MLP with 26 hidden neurons is the optimal model, as it provides a strong equilibrium of minimal error and significant explained variation on both the first test partition and completely different datasets. Moreover, PSO-ANN (22 neurons) is a viable option as well, as it focuses on minimizing absolute RMSE for a particular dataset; however, the CapSA-MLP’s superior generalization makes it more reliable for predicting under different quarry environments. Table 8 presents hyperparameters for the optimal CapSA-MLP and PSO-ANN models.
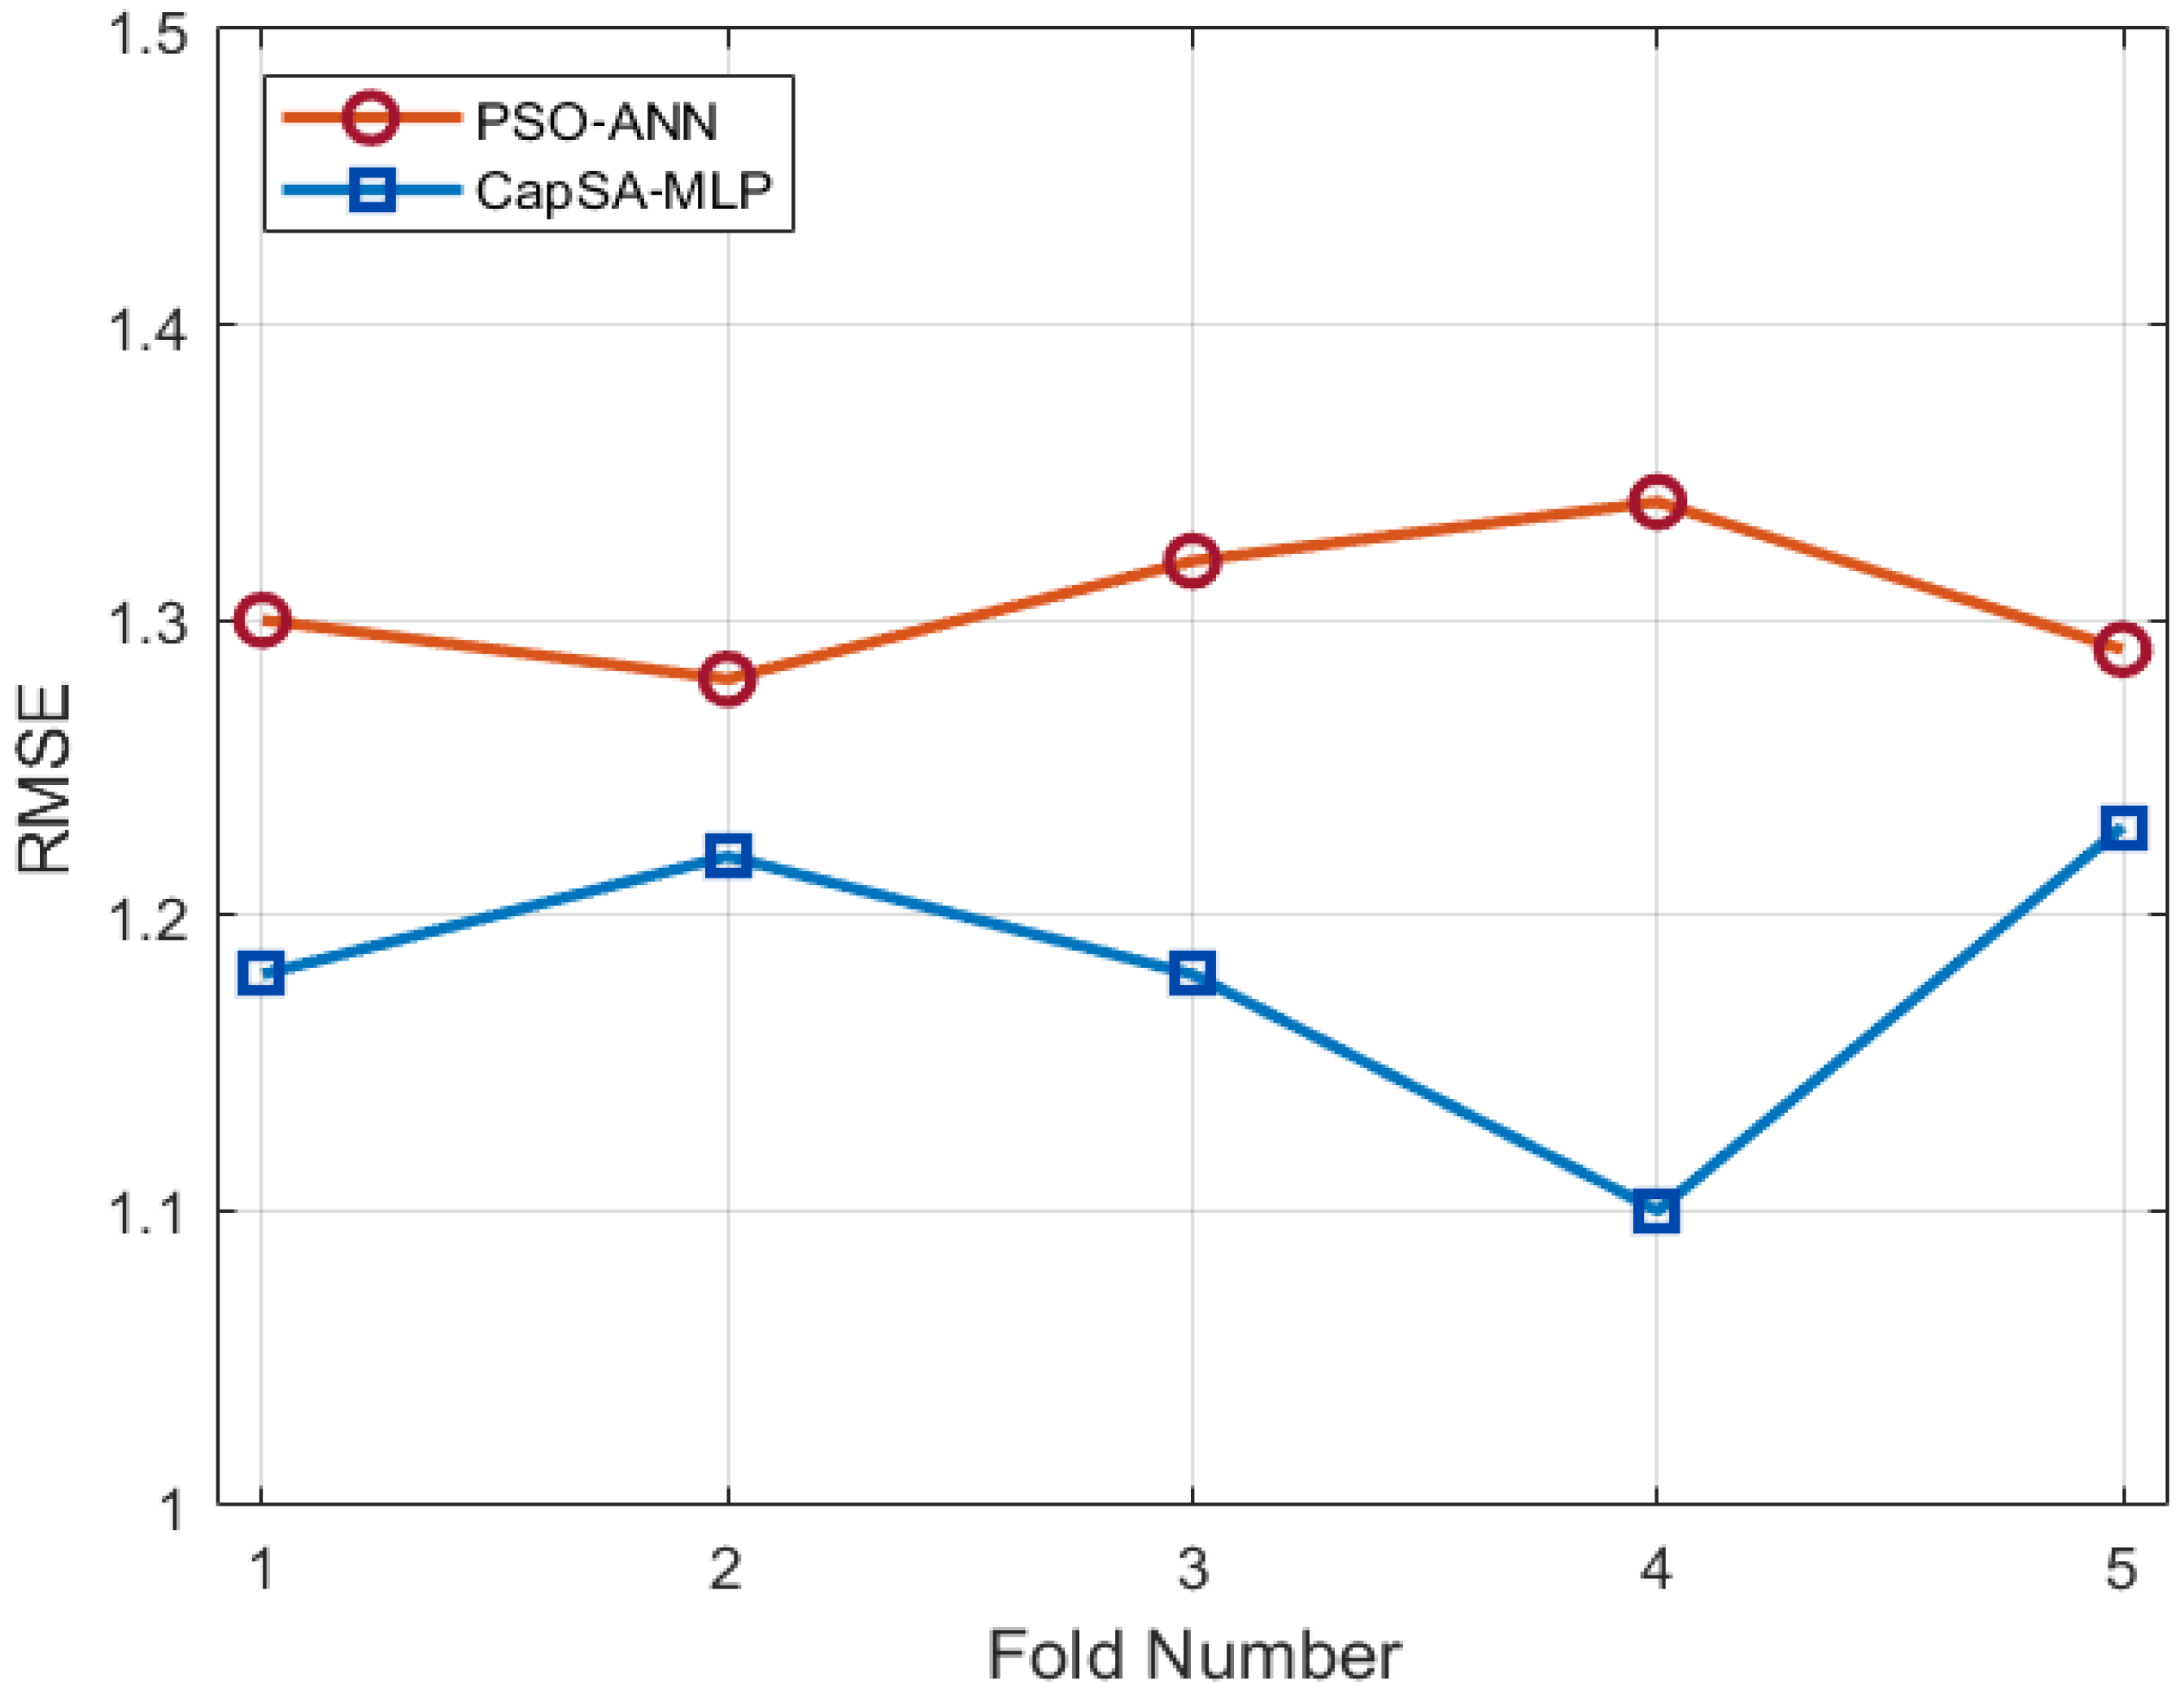
Moreover, cross-validation was done to further evaluate the PSO-ANN and CapSA-MLP models, as shown in Figure 9. PSO-ANN, in all five splits, repeatedly shows an increased error, with fold RMSEs, converging between 1.27 and 1.32. On the other hand, CapSA-MLP obtains a lower RMSE throughout all folds, ranging from almost 1.05 in Fold 4 to 1.20 in Fold 2, and demonstrates considerably smaller variation within the folds. When the error range is small, like that of CapSA-MLP, it shows that the model has improved robustness through the use of capuchin-inspired leap, swing, and climb operators, and more consistently evades local minima and converges to a well-generalizing solution on each random split. Therefore, CapSA-MLP reduces the average RMSE by approximately 0.15 dB in comparison to PSO-ANN, and it provides considerably better, steady performance. This indicates that it is a useful model and can be selected as the prediction model for blast-induced airblast. Figure 10 and Figure 11 show the structure of the optimum CapSA-MLP model. Table 8 shows the performance results of the optimum CapSA-MLP and PSO-ANN models.
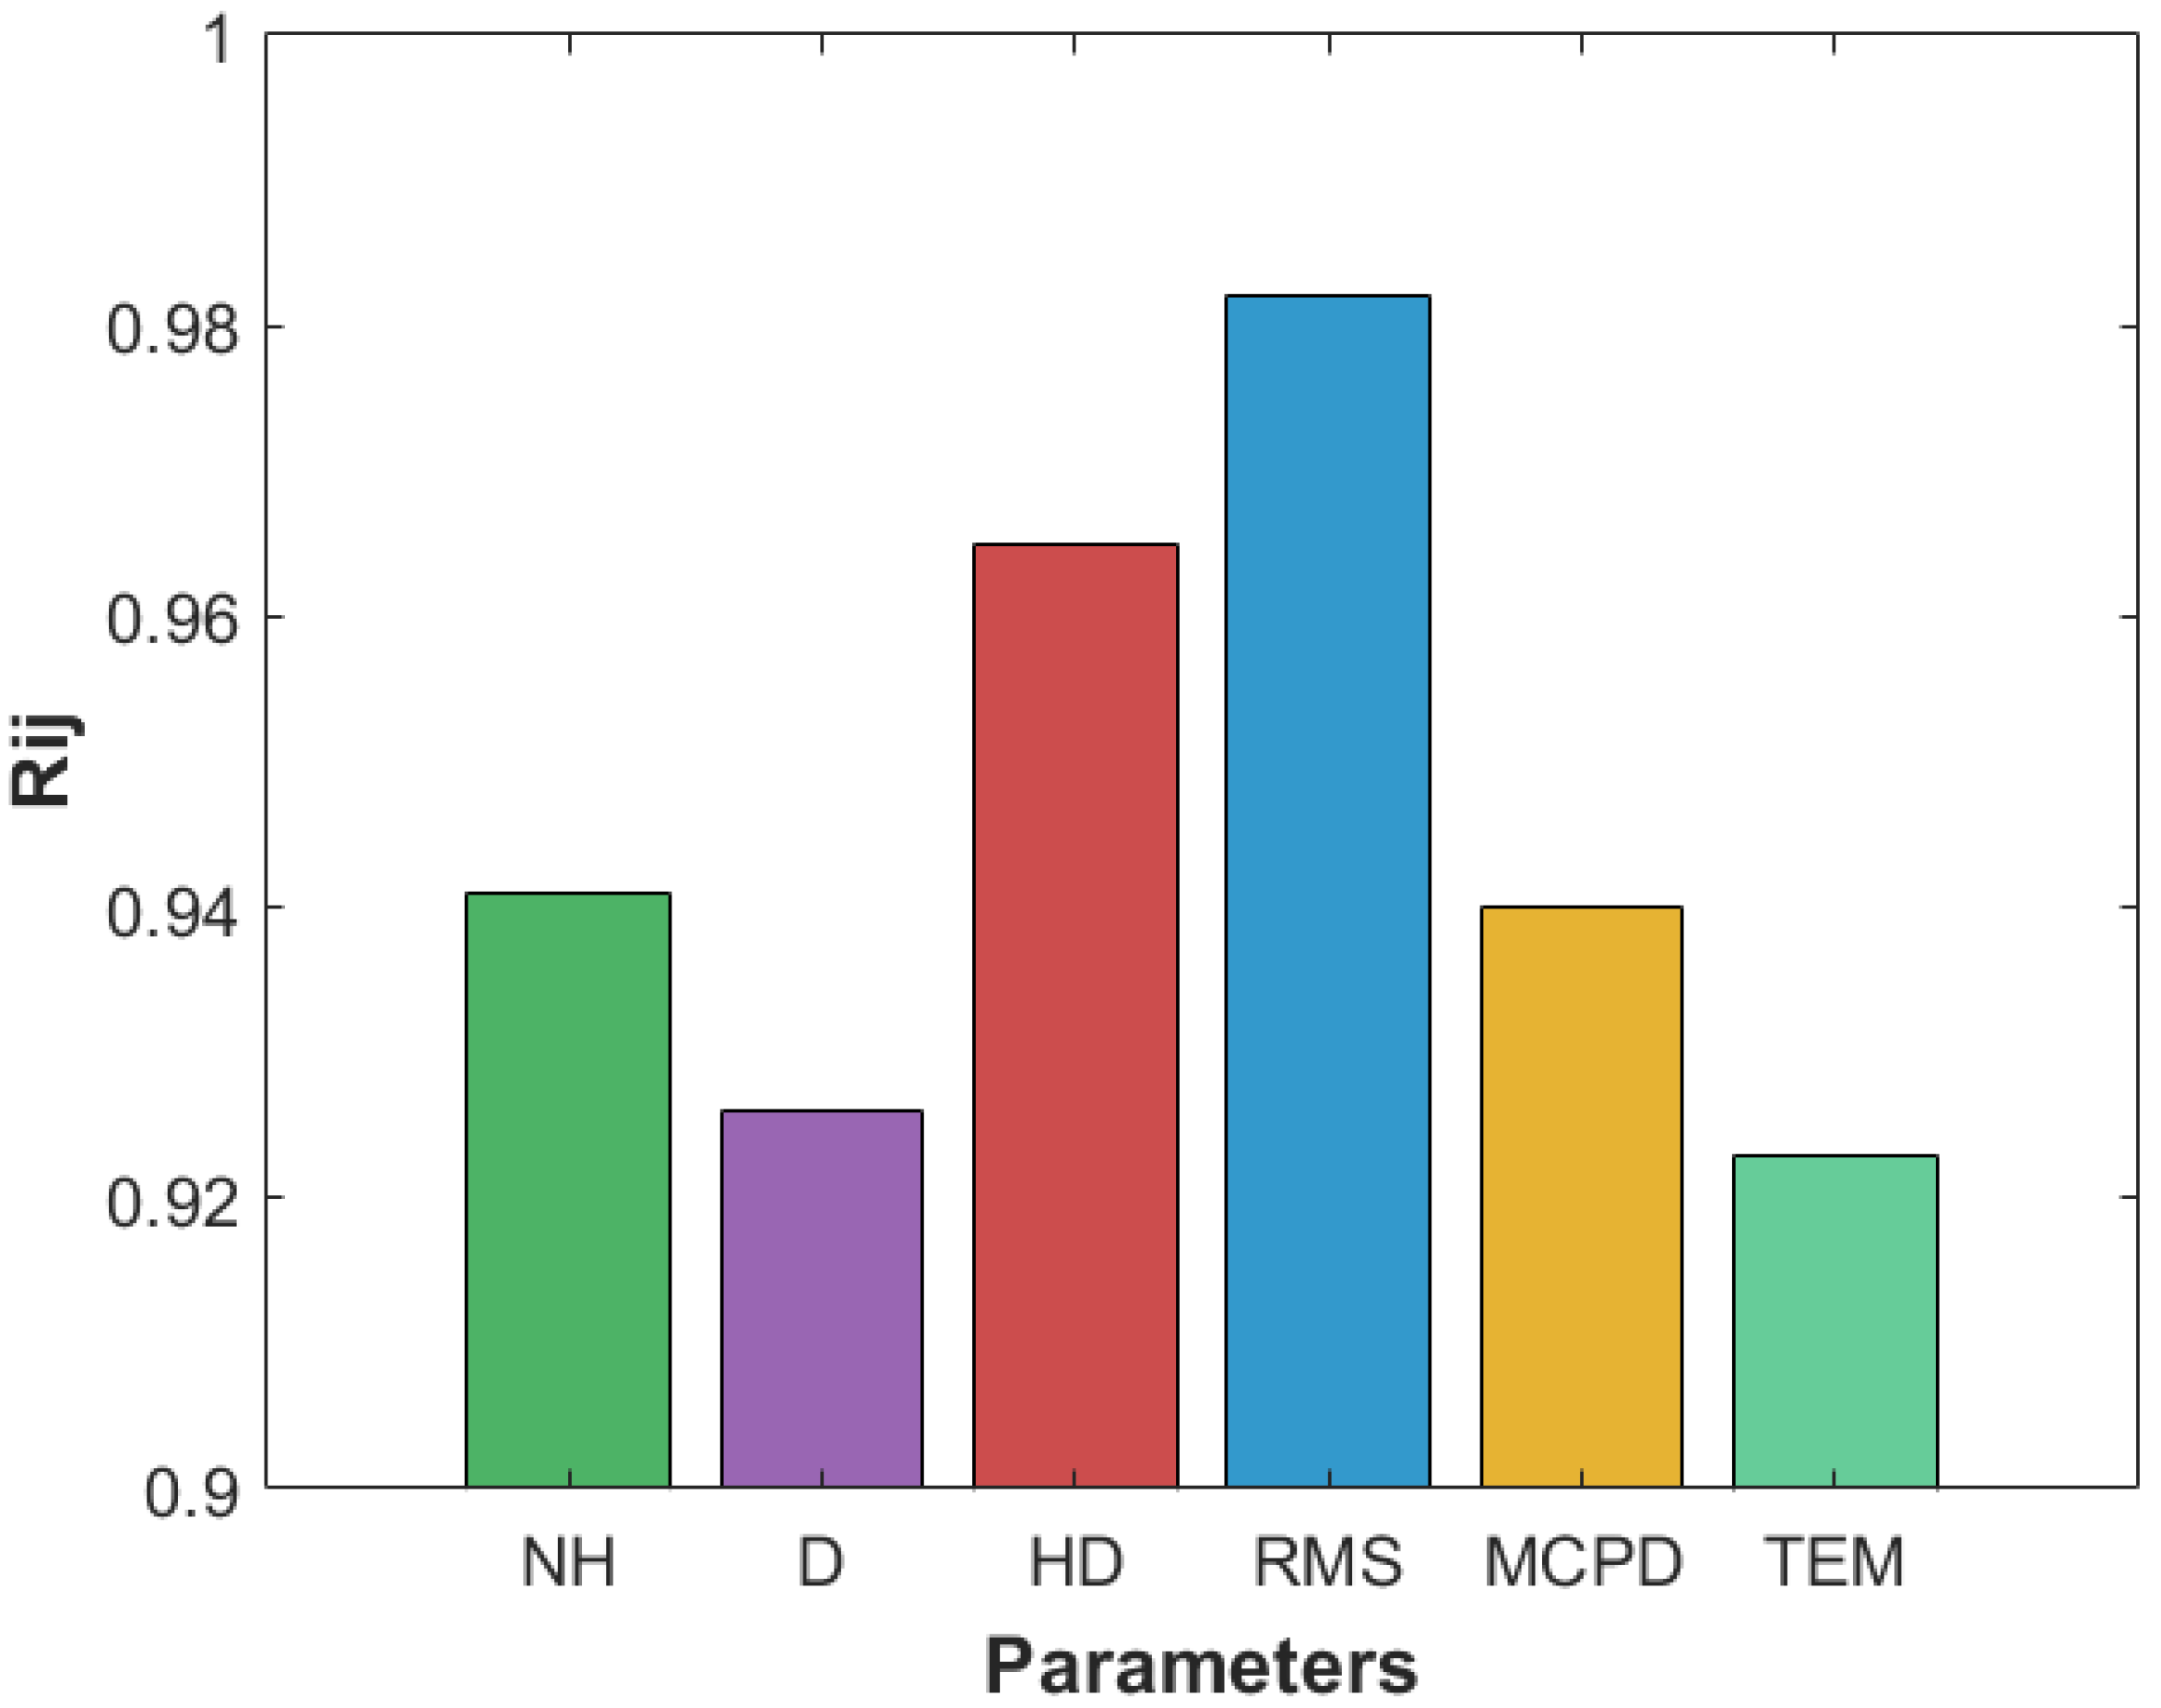
Additionally, airblast was evaluated for its responsiveness to the given input parameters. Understanding the sensitivity of input parameters allows for the comprehension of their impact on the airblast (objective function). To conduct a sensitivity analysis, the cosine amplitude method (CAM) was applied using Equation (19) as follows:
R I J = Σ k = 1 m ( x i k × x j k ) Σ k = 1 m x i k 2 × Σ k = 1 m x j k 2
where R I J signifies the strength of the input parameter, Xi represents the input parameters, and Xj indicates the output parameter (airblast).
Figure 12 shows the influence of each parameter on airblast. The analysis reveals that each blasting parameter has a significant influence on the airblast, with rock mass strength (RMS) having the highest influence at 0.982. This study shows that RMS is a critical parameter that influences the magnitude of the airblast generated. Also, hole depth (HD) has the second-highest influence at 0.965, showing the significance of HD in guiding explosive energy into the rock mass and influencing pressure wave generation. Furthermore, the number of holes (NH) and maximum charge per delay (MCPD) have influences of of 0.941 and 0.940, respectively, both showing a positive overall impact on airblast. Lastly, both distance (D) and total explosive mass (TEM) had a less significant effect, with 0.923 and 0.926, respectively; however, they reliably demonstrate a positive influence within the multivariate input structure. The sensitivity analysis demonstrates that both geomechanical and blast design parameters significantly affect airblast levels. Integrating vital parameters like rock mass strength (RMS) and hole depth (HD) into blast design can result in improved airblast control, thus promoting safer and more environmentally sustainable blasting operations.

5. Conclusions

The rapid rise in the use of machine learning models for blast-induced effects, such as airblast, ground vibration, flyrock, etc., has significantly surpassed our ability to evaluate them in actual mining environments. As a result, many prediction methods with impressive statistical results do not include rock mass strength (RMS), although it is known to have an impact on energy transfer and pressure-wave attenuation. It is often substituted with an indirect proxy parameter or entirely neglected. Moreover, to transform innovative algorithms into reliable methods, models must be based on repeatable experiments, evaluated against common datasets, and proven through the implementation of the studies.
In this study, we have shown that the Capuchin Search Algorithm-optimized multilayer perceptron (CapSA-MLP) provides a reliable and highly generalizable model for predicting blast-induced airblast when rock mass strength is included along with commonly used traditional parameters. Also, CapSA-MLP performed better compared to PSO-ANN, multivariate regression (MVRA), and the USBM predictor. Moreover, regardless of PSO-ANN achieving a slightly lower RMSE on just one test split during cross-validation, it was inadequate compared to that of CapSA-MLP, which generated stable RMSE across all the test splits, demonstrating better stability provided by the capuchin-inspired leap, swing, and climb operators. Also, in a separate validation with 15 new blasting datasets, CapSA-MLP predicts airblast with greater consistency in accuracy compared to measured values, while empirical and regression methods were significantly inconsistent.
Furthermore, sensitivity analysis validated the significant influence of RMS on airblast as it was the most influential parameter, whereas hole depth, number of holes, and maximum charge per delay demonstrated a strong positive influence. Both monitoring distance and total explosive mass have the least influence, despite having a positive linear influence. Therefore, based on these findings, future studies should obtain larger and more diversified blasting datasets and integrate other rock mass properties to improve the model’s prediction precision and generalizability across different geological settings. Also, due to the restricted dataset used in this study, more study is required to confirm the effectiveness and dependability of the CapSA-MLP technique for predicting airblast and mitigating it in larger operating mining environments. In addition, future work will also explore the use of global variance-based techniques to examine the sensitivity of input parameters under altered settings to enhance the model’s resilience and accuracy in predicting airblast. To the best of our knowledge, this is the first study applying CapSA-MLP and rock mass strength to predict airblast. This study showed the successful application of the CapSA-MLP method, which combines the Capuchin Search Algorithm with a multilayer perceptron and integrated rock mass strength (RMS) to predict blast-induced airblast. The findings show that both the hybrid modeling method and the use of RMS can greatly mitigate risk inside the blast safety area, therefore improving safety protocols and supporting enhanced blast design in blasting operations.

Author Contributions

Conceptualization, K.G. and T.S.; methodology, K.G. and H.S.; formal analysis, H.S. and A.H.; investigation, K.G. and A.H.; data curation, K.G.; writing—original draft preparation, K.G. and A.H.; writing—review and editing, T.S. and A.H.; visualization, K.G. and T.S.; supervision, T.S. and H.S. All authors have read and agreed to the published version of the manuscript.

Funding

The research work is part of a doctoral program supported by JICA.

Data Availability Statement

The data presented in this study are available on request from the corresponding author due to federal collaboration requirements.

Acknowledgments

This research work was supported by the Japan International Cooperation Agency (JICA) and Bela Bela Quarries.

Conflicts of Interest

The authors declare no conflicts of interest.

Abbreviations

The following abbreviations are used in this manuscript:
AcronymFull Form
RMSRock mass strength
CapSA-MLPCapuchin search algorithm-optimized multilayer perceptron
PSO-ANNParticle swarm optimized–artificial neural network
MVRAMultivariate regression analysis
USBMUnited States Bureau of Mines
MCPDMaximum charge per delay
TEMTotal explosive mass
NHNumber of holes
HDHole depth
DMonitoring distance
RQDRock quality designation
SVMSupport vector machine
GAGenetic algorithm
ANFISAdaptive neuro-fuzzy inference system
ANNArtificial neural network
STStemming length
RDRock density
SSpacing
BHBench height
BBurden

References

  1. Wharton, R.K.; Formby, S.A.; Merrifield, R. Airblast TNT Equivalence for a Range of Commercial Blasting Explosives. J. Hazard. Mater. 2000, 79, 31–39. [Google Scholar] [CrossRef] [PubMed]
  2. Wu, C.; Hao, H. Modeling of Simultaneous Ground Shock and Airblast Pressure on Nearby Structures from Surface Explosions. Int. J. Impact Eng. 2005, 31, 699–717. [Google Scholar] [CrossRef]
  3. Rodríguez, R.; Toraño, J.; Menéndez, M. Prediction of the Airblast Wave Effects near a Tunnel Advanced by Drilling and Blasting. Tunn. Undergr. Space Technol. 2007, 22, 241–251. [Google Scholar] [CrossRef]
  4. Drew, L.J.; Langer, W.H.; Sachs, J.S. Environmentalism and Natural Aggregate Mining. Nat. Resour. Res. 2002, 11, 19–28. [Google Scholar] [CrossRef]
  5. Dehghani, H.; Alimohammadnia, F. Estimation of Air Over-Pressure Using Bat Algorithm. Min. Scince 2021, 28, 77–92. [Google Scholar] [CrossRef]
  6. Mohamad, E.T.; Hajihassani, M.; Armaghani, D.; Marto, A. Simulation of Blasting-Induced Air Over-pressure by Means of Artificial Neural Networks. Int. Rev. Model. Simul. 2012, 5, 2501–2506. [Google Scholar]
  7. Stachura, V.J. Airblast and Ground Vibration Generation and Propagation from Contour Mine Blasting; Bureau of Mines: Washington, DC, USA, 1984. [Google Scholar]
  8. Stachura, V.J.; Siskind, D.E.; Engler, A.J. Airblast Instrumentation and Measurement Techniques from Surface Mine Blasting; Bureau of Mines: Washington, DC, USA, 1981. [Google Scholar]
  9. Siskind, D.E. Vibrations from Blasting; International Society of Explosives Engineers: Cleveland, OH, USA, 2002. [Google Scholar]
  10. Balkema, A. Rock Blasting Terms and Symbols; Rustan, A., Ed.; Balkema Publishers: Rotterdam, The Netherlands, 1998; ISBN 9780429190650. [Google Scholar]
  11. Kuzu, C.; Fisne, A.; Ercelebi, S.G. Operational and Geological Parameters in the Assessing Blast Induced Airblast-Overpressure in Quarries. Appl. Acoust. 2009, 70, 404–411. [Google Scholar] [CrossRef]
  12. Segarra, P.; Domingo, J.F.; López, L.M.; Sanchidrián, J.A.; Ortega, M.F. Prediction of near Field Overpres-sure from Quarry Blasting. Appl. Acoust. 2010, 71, 1169–1176. [Google Scholar] [CrossRef]
  13. Khandelwal, M.; Kankar, P.K. Prediction of Blast-Induced Air Overpressure Using Support Vector Ma-chine. Arab. J. Geosci. 2011, 4, 427–433. [Google Scholar] [CrossRef]
  14. Mohamad, T.E.; Jahed Armaghani, D.; Hasanipanah, M.; Murlidhar, B.R.; Alel, M.N.A. Estimation of Air-Overpressure Produced by Blasting Operation through a Neuro-Genetic Technique. Environ. Earth Sci. 2016, 75, 174. [Google Scholar] [CrossRef]
  15. Khandelwal, M.; Singh, T.N. Prediction of Blast Induced Air Overpressure in Opencast Mine. Noise Vib. Worldw. 2005, 36, 7–16. [Google Scholar] [CrossRef]
  16. Ureel, S.; Momayez, M. An Investigation of the Present and Future Testing Methods of Rock Abrasion Resistance. Int. J. Min. Eng. Miner. Process. 2014, 3, 10–19. [Google Scholar]
  17. Naiem, M.M.A.A. Correlation of Sandstone Rock Properties Obtained from Field and Laboratory Tests. Int. J. Civ. Struct. Eng. 2013, 4, 45–55. [Google Scholar]
  18. Priddy, K.; Keller, P.E. Artificial Neural Networks: An Introduction; SPIE Press: Bellingham, WA, USA, 2005. [Google Scholar]
  19. Adhikari, R.; Agrawal, R.K.; Adhikari, R. Effectiveness of PSO Based Neural Network for Seasonal Time Series Forecasting. In Proceedings of the Fifth Indian International Conference on Artificial Intelligence, Tumkur, India, 14–16 December 2011; Volume 3, pp. 231–244. [Google Scholar]
  20. Wang, X.G.; Tang, Z.; Tamura, H.; Ishii, M.; Sun, W.D. An Improved Backpropagation Algorithm to Avoid the Local Minima Problem. Neurocomputing 2004, 56, 455–460. [Google Scholar] [CrossRef]
  21. Kazemi, M.M.K.; Nabavi, Z.; Khandelwal, M. Prediction of Blast-Induced Air Overpressure Using a Hybrid Machine Learning Model and Gene Expression Programming (GEP): A Case Study from an Iron Ore Mine. AIMS Geosci. 2023, 9, 357–381. [Google Scholar] [CrossRef]
  22. Zhang, R.; Li, Y.; Gui, Y.; Zhou, J. Prediction of Blasting Induced Air-Overpressure Using a Radial Basis Function Network with an Additional Hidden Layer. Appl. Soft Comput. 2022, 127, 109343. [Google Scholar] [CrossRef]
  23. Zeng, J.; Jamei, M.; Nait Amar, M.; Hasanipanah, M.; Bayat, P. A Novel Solution for Simulating Air Over-pressure Resulting from Blasting Using an Efficient Cascaded Forward Neural Network. Eng. Comput. 2022, 38, 2069–2081. [Google Scholar] [CrossRef]
  24. Faradonbeh, R.S.; Armaghani, D.J.; Amnieh, H.B.; Mohamad, E.T. Prediction and Minimization of Blast-Induced Flyrock Using Gene Expression Programming and Firefly Algorithm. Neural Comput. Appl. 2018, 29, 269–281. [Google Scholar] [CrossRef]
  25. Jahed Armaghani, D.; Hasanipanah, M.; Tonnizam Mohamad, E. A Combination of the ICA-ANN Model to Predict Air-Overpressure Resulting from Blasting. Eng. Comput. 2016, 32, 155–171. [Google Scholar] [CrossRef]
  26. Hajihassani, M.; Jahed Armaghani, D.; Monjezi, M.; Mohamad, E.T.; Marto, A. Blast-Induced Air and Ground Vibration Prediction: A Particle Swarm Optimization-Based Artificial Neural Network Approach. Environ. Earth Sci. 2015, 74, 2799–2817. [Google Scholar] [CrossRef]
  27. Jahed Armaghani, D.; Hajihassani, M.; Sohaei, H.; Tonnizam Mohamad, E.; Marto, A.; Motaghedi, H.; Moghad-dam, M.R. Neuro-Fuzzy Technique to Predict Air-Overpressure Induced by Blasting. Arab. J. Geosci. 2015, 8, 10937–10950. [Google Scholar] [CrossRef]
  28. Khatir, A.; Capozucca, R.; Khatir, S.; Magagnini, E.; Cuong-Le, T. Enhancing Damage Detection Using Reptile Search Algorithm-Optimized Neural Network and Frequency Response Function. J. Vib. Eng. Technol. 2025, 13, 88. [Google Scholar] [CrossRef]
  29. Khatir, A.; Capozucca, R.; Khatir, S.; Magagnini, E.; Benaissa, B.; Le Thanh, C.; Abdel Wahab, M. A New Hybrid PSO-YUKI for Double Cracks Identification in CFRP Cantilever Beam. Compos. Struct. 2023, 311, 116803. [Google Scholar] [CrossRef]
  30. Ouadi, B.; Khatir, A.; Magagnini, E.; Mokadem, M.; Abualigah, L.; Smerat, A. Optimizing Silt Density Index Prediction in Water Treatment Systems Using Pressure-Based Gradient Boosting Hybridized with Salp Swarm Algorithm. J. Water Process Eng. 2024, 68, 106479. [Google Scholar] [CrossRef]
  31. Osmani, A.; Shamass, R.; Tsavdaridis, K.D.; Ferreira, F.P.V.; Khatir, A. Deflection Predictions of Tapered Cellular Steel Beams Using Analytical Models and an Artificial Neural Network. Buildings 2025, 15, 992. [Google Scholar] [CrossRef]
  32. Braik, M.; Sheta, A.; Al-Hiary, H. A Novel Meta-Heuristic Search Algorithm for Solving Optimization Problems: Capuchin Search Algorithm. Neural Comput. Appl. 2021, 33, 2515–2547. [Google Scholar] [CrossRef]
  33. Eker, E. Performance Evaluation of Capuchin Search Algorithm Through Non-Linear Problems, and Optimization of Gear Train Design Problem. Eur. J. Tech. 2023, 13, 142–149. [Google Scholar] [CrossRef]
  34. He, Z.; Armaghani, D.J.; Masoumnezhad, M.; Khandelwal, M.; Zhou, J.; Murlidhar, B.R. A Combination of Expert-Based System and Advanced Decision-Tree Algorithms to Predict Air-Overpressure Resulting from Quarry Blasting. Nat. Resour. Res. 2021, 30, 1889–1903. [Google Scholar] [CrossRef]
  35. Hosseini, S.; Poormirzaee, R.; Hajihassani, M. Application of Reliability-Based Back-Propagation Causality-Weighted Neural Networks to Estimate Air-Overpressure Due to Mine Blasting. Eng. Appl. Artif. Intell. 2022, 115, 105281. [Google Scholar] [CrossRef]
  36. Nguyen, H.; Bui, X.-N.; Drebenstedt, C.; Choi, Y. Enhanced Prediction Model for Blast-Induced Air Over-Pressure in Open-Pit Mines Using Data Enrichment and Random Walk-Based Grey Wolf Optimization–Two-Layer ANN Model. Nat. Resour. Res. 2024, 33, 943–972. [Google Scholar] [CrossRef]
  37. Mabogo, J.; Cotterill, D.K. The Gaborone Granite Complex: Petrology and Structure; Bulletin of the Geological Survey of Botswana: Gaborone, Botswana, 1989; Volume 23. [Google Scholar]
  38. Hoek, E.; Marinos, P.; Benissi, M. Applicability of the Geological Strength Index (GSI) Classification for Very Weak and Sheared Rock Masses. The Case of the Athens Schist Formation. Bull. Eng. Geol. Environ. 1998, 57, 151–160. [Google Scholar] [CrossRef]
  39. Dreyfus, G. Neural Networks: Methodology and Application; Springer: Berlin/Heidelberg, Germany, 2005; ISBN 3-540-22980-9. [Google Scholar]
  40. Kennedy, J.; Eberhart, R. Particle Swarm Optimization. In Proceedings of the ICNN’95—International Conference on Neural Networks, Perth, Australia, 27 November–1 December 1995; IEEE: New York, NY, USA, 1995; pp. 1942–1948. [Google Scholar]
  41. Lawal, A.I.; Aladejare, A.E.; Onifade, M.; Bada, S.; Idris, M.A. Predictions of Elemental Composition of Coal and Biomass from Their Proximate Analyses Using ANFIS, ANN and MLR. Int. J. Coal Sci. Technol. 2021, 8, 124–140. [Google Scholar] [CrossRef]
  42. Onifade, M.; Lawal, A.I.; Aladejare, A.E.; Bada, S.; Idris, M.A. Prediction of Gross Calorific Value of Solid Fuels from Their Proximate Analysis Using Soft Computing and Regression Analysis. Int. J. Coal Prep. Util. 2022, 42, 1170–1184. [Google Scholar] [CrossRef]
  43. Said, K.O.; Onifade, M.; Lawal, A.I.; Githiria, J.M. An Artificial Intelligence-Based Model for the Prediction of Spontaneous Combustion Liability of Coal Based on Its Proximate Analysis. Combust. Sci. Technol. 2021, 193, 2350–2367. [Google Scholar] [CrossRef]
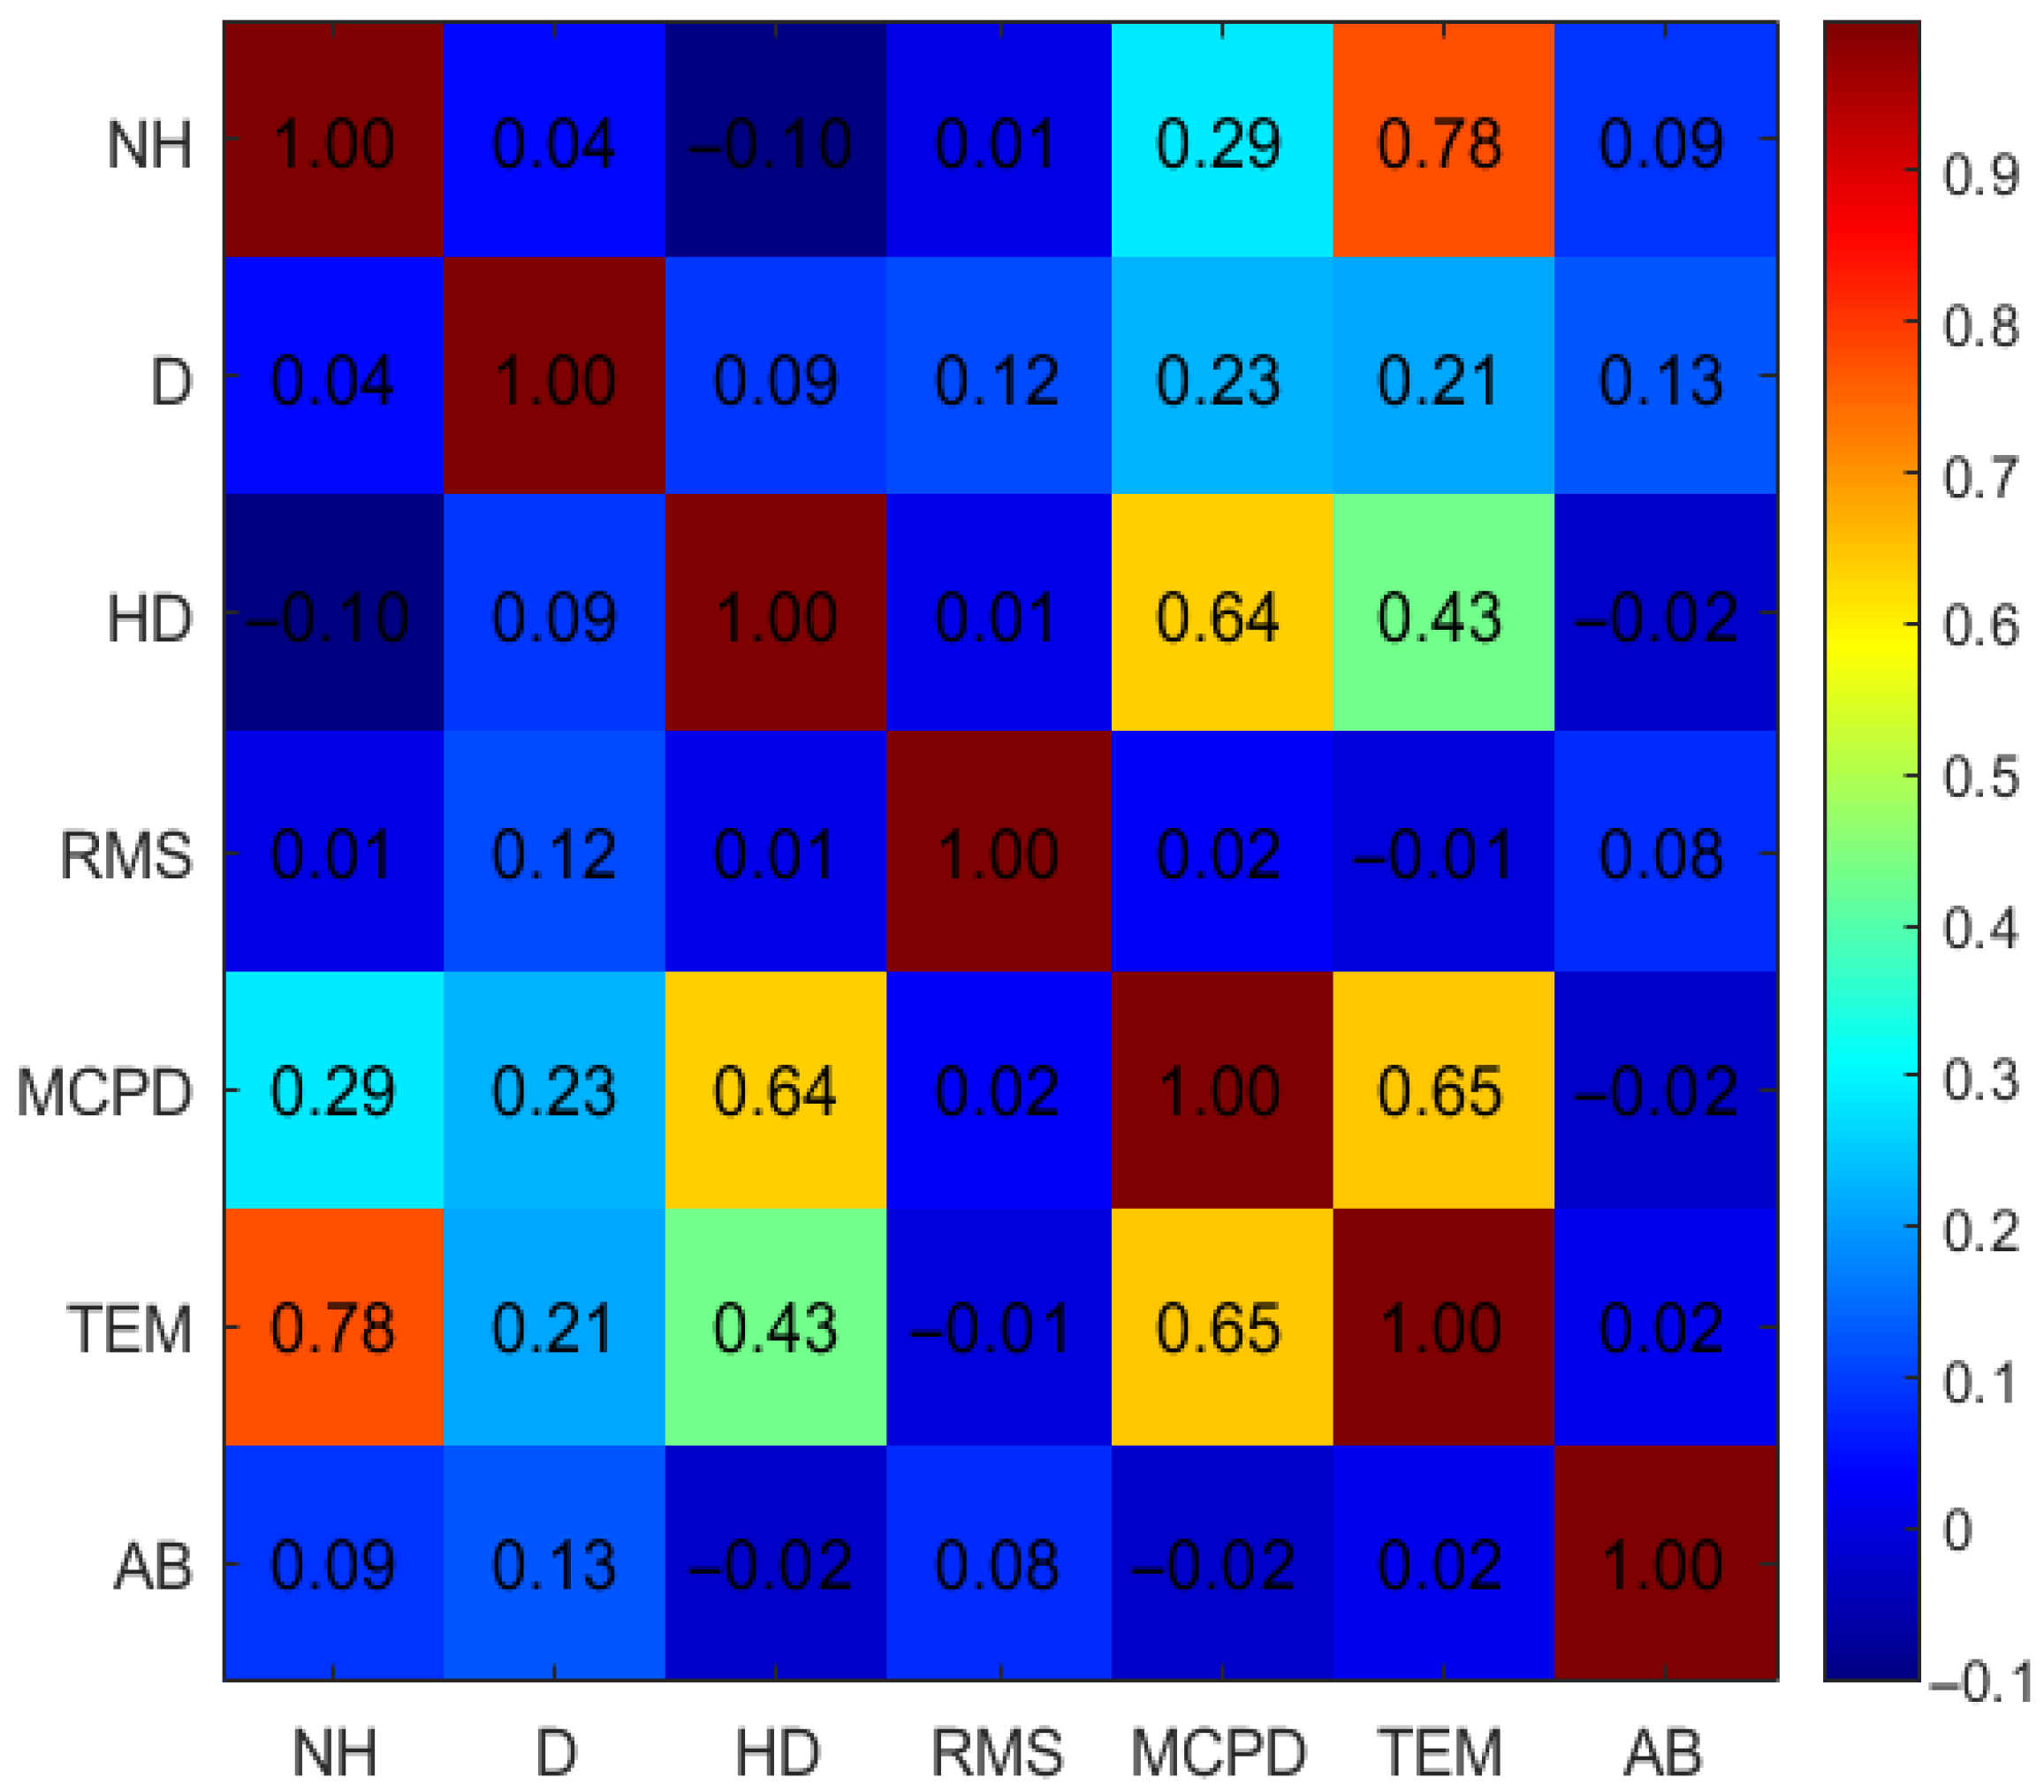
Figure 1. Correlation matrix of the blast datasets.
Geosciences 15 00306 g001
Figure 2. Photos demonstrating the fracture intensity: (a,b,f) are significantly fractured, while (ce) show a lesser degree of fracturing.
Geosciences 15 00306 g002
Figure 3. Characterization of a blocky rock mass based on particle interlocking and discontinuity conditions [38].
Geosciences 15 00306 g003
Figure 4. (a) Making of rock cores, (b) drying rock cores in the oven for 3 days, (c) uniaxial compressive strength test, (d) fractured rock core after axial loading.
Geosciences 15 00306 g004
Figure 5. Schematic workflow used in this study. Arrows illustrate the order of tasks.
Geosciences 15 00306 g005
Figure 6. Performance of the PSO-ANN models.
Geosciences 15 00306 g006
Figure 7. Performance of the CapSA-MLP models.
Geosciences 15 00306 g007
Figure 8. Comparison between the measured vs. predicted AB across different models.
Geosciences 15 00306 g008
Figure 9. Cross-validation of the CapSA-MLP and PSO-ANN models.
Geosciences 15 00306 g009
Figure 10. The best CapSA-MLP (hidden-layer activation function: hyperbolic tangent sigmoid).
Geosciences 15 00306 g010
Figure 11. The best CapSA-MLP structure (6-26-1).
Geosciences 15 00306 g011
Figure 12. Significance of each input parameter for airblast.
Geosciences 15 00306 g012
Table 1. Examples of recent machine learning–based research on blast-induced airblast prediction.
ReferenceAlgorithmInput ParametersNumber of Blasting
Datasets
Kazemi et al., 2023 [21]XGBoost optimized via grey wolf optimization (XGB-GWO)MCPD, D, RQD, stemming length (ST), burden (B), and spacing (S)66
Zhang et al., 2022 [22]Radial basis function network with two hidden layers (RBF-2)MCPD, D, rock density, bench height (BH), and HD76
Zeng et al., 2021 [23]Cascaded forward neural network trained via Levenberg–MarquardtHD, powder factor (PF), TEM, ST, S, B, RQD, NH, and D62
Faradonbeh et al., 2018 [24]Gene programming (GP) and gene expression programming (GEP)MCPD, D, B, S, ST, and BH97
Armaghani et al., 2016 [25]ICA-ANN (imperialist competitive algorithm-optimized ANN)MCPD, D, B, ST, and BH70
Hasanipanah et al., 2015 [26]Adaptive neuro-fuzzy inference system (ANFIS)MCPD, ST, B, RQD, and D77
Hajihassani et al., 2015 [27]Neuro-fuzzy (ANFIS) vs. standard ANN and multiple regression (MR)MCPD, D, RQD, ST, B, and S38
Table 2. Input and output parameters used in the prediction model.
ParameterNHDHDRMSMCPDTEMAirblast
CategoryInputInputInputInputInputInputOutput
Unit mmMpaKgKgdB
Minimum742005.84.689.13742.581
Maximum32190015.34.7368.1233,102.8142
Average196.45371.0711.484.4229.7915,674.72126.59
Table 3. Statistical information of CapSA-MLP parameters.
ParametersValues
Hidden layers1
Hidden neurons per layer14, 17, 18, 19, 20, 22, 23, 25, 26, 27
Activation functionHyperbolic tangent sigmoid
Learning rate (η)0.005–0.1
Momentum (α)0.1–0.9
L2 weight-decay (λ) (log10)1 × 10⁻⁶–1 × 10⁻³
Dropout rate0.0–0.5
Batch size30–70
CapSA population size40–400
CapSA local-search radius0.2–0.8
Table 4. Comparison of computational and memory requirements, as well as convergence behavior, between CapSA and PSO.
ComponentCapSAPSO
Computation per cycleEvaluates fitness for each capuchin and then applies leap, swing, and climb behaviors across all decision variables, carrying an extra constant overhead beyond the basic updates.Evaluates fitness for each particle and then updates velocity and position across all decision variables, so that time grows with swarm size and problem dimension.
Memory requirementsStores position data and a small set of behavioral parameters for each capuchin, resulting in similar linear growth with only modest additional memory usage.Stores both position and velocity vectors for every particle, leading to linear growth in memory with respect to swarm size and variable count.
Convergence behaviorEmploys multiple local-search operators that yield stronger refinement per cycle and can reach target accuracy in fewer overall cycles, despite a longer time per cycle.Simple update rules foster broad exploration early on but often require more cycles to achieve fine-tuned solutions.
Table 5. Statistical information of PSO-ANN parameters.
ParametersValues
Hidden layers1
Hidden neurons per layer14, 17, 18, 19, 20, 22, 23, 25, 26, 27
Activation functionHyperbolic-tangent sigmoid
Learning rate (η)0.005–0.1
Momentum (α)0.1–0.9
L2 weight-decay (λ) (log10)10−6–10−3
Dropout rate0.0–0.5
Batch size30–70
PSO swarm size40–400
Inertia weight (w)0.4–0.9
Cognitive coefficient (c1)0.5–2.5
Social coefficient (c2)0.5–3
Table 6. Performance results of the PSO-ANN models.
ModelHidden NeuronsTrain RMSETrain
R2
Test RMSETest
R2
1231.3260.8441.5890.867
2201.1490.9111.3790.812
3261.1830.8581.8360.917
4170.8560.8771.3860.865
5221.0420.9690.7710.911
6251.8730.8821.0020.792
7141.9130.7801.5640.905
8181.8990.9111.2130.817
9191.7840.8971.0870.751
10271.7140.9091.2450.896
Table 7. Performance results of the CapSA-MLP models.
ModelHidden NeuronsTrain RMSETrain
R2
Test RMSETest
R2
1231.0960.8921.0980.905
2201.3910.9681.0870.893
3261.4590.9651.1820.941
4171.3160.9831.3910.883
5221.3020.8811.2160.935
6251.1290.8141.0920.917
7141.0110.9291.0900.842
8181.8420.8481.5280.861
9191.2460.9141.6280.882
10271.3510.8941.4230.921
Table 8. Performance results of the optimum models.
MethodHidden NeuronsLearning Rate (η)Momentum (α)
CapSA-MLP260.0690.480
PSO-ANN220.0250.650
Disclaimer/Publisher’s Note: The statements, opinions and data contained in all publications are solely those of the individual author(s) and contributor(s) and not of MDPI and/or the editor(s). MDPI and/or the editor(s) disclaim responsibility for any injury to people or property resulting from any ideas, methods, instructions or products referred to in the content.