Article

Evaluation of Proppant Placement Efficiency in Linearly Tapering Fractures

1
College of Petroleum Engineering, Northeast Petroleum University, Daqing 163318, China
2
Sanya Offshore Oil & Gas Research Institute, Northeast Petroleum University, Sanya 572025, China
3
Jianghan Oilfield Branch of Sinopec Group, Qianjiang 433123, China
4
West East Gas Pipeline Branch of National Petroleum and Natural Gas Pipeline Network Group Co., Ltd., Shanghai 200122, China
*
Author to whom correspondence should be addressed.
Geosciences 2025, 15(7), 275; https://doi.org/10.3390/geosciences15070275
Submission received: 15 June 2025 / Revised: 15 July 2025 / Accepted: 18 July 2025 / Published: 21 July 2025

Abstract

With growing reliance on hydraulic fracturing to develop tight oil and gas reservoirs characterized by low porosity and permeability, optimizing proppant transport and placement has become critical to sustaining fracture conductivity and production. However, how fracture geometry influences proppant distribution under varying field conditions remains insufficiently understood. This study employed computational fluid dynamics to investigate proppant transport and placement in hydraulic fractures of which the aperture tapers linearly along their length. Four taper rate models (δ = 0, 1/1500, 1/750, and 1/500) were analyzed under a range of operational parameters: injection velocities (1.38–3.24 m/s), sand concentrations (2–8%), proppant particle sizes (0.21–0.85 mm), and proppant densities (1760–3200 kg/m3). Equilibrium proppant pack height was adopted as the key metric for pack morphology. The results show that increasing injection rate and taper rate both serve to lower pack heights and enhance downstream transport, while a higher sand concentration, larger particle size, and greater density tend to raise pack heights and promote more stable pack geometries. In tapering fractures, higher δ values amplify flow acceleration and turbulence, yielding flatter, “table-top” proppant distributions and extended placement lengths. Fine, low-density proppants more readily penetrate to the fracture tip, whereas coarse or dense particles form taller inlet packs but can still be carried farther under high taper conditions. These findings offer quantitative guidance for optimizing fracture geometry, injection parameters, and proppant design to improve conductivity and reduce sand-plugging risk in tight formations. These insights address the challenge of achieving effective proppant placement in complex fractures and provide quantitative guidance for tailoring fracture geometry, injection parameters, and proppant properties to improve conductivity and mitigate sand plugging risks in tight formations.

1. Introduction

In recent years, significant progress has been made worldwide in the exploration and development of unconventional oil and gas resources. Resources such as tight gas, shale gas, tight oil, and coalbed methane have become key focuses of China’s energy development. According to statistics from 2023, China’s oil and gas production exceeded 390 million tons of oil equivalent, and the recoverable shale gas reserves reached 21.8 trillion cubic meters, making shale gas an important driver of domestic natural gas production growth [1,2,3]. Tight hydrocarbon plays predominantly occur in low-porosity, low-permeability, and low-saturation shale, sandstone, and carbonate formations [4,5,6]. The native fluid mobility in these reservoirs is severely constrained by factors such as limited pore space, extremely poor permeability, and low hydrocarbon saturation, rendering conventional extraction methods inefficient and economically unviable [7,8].
Hydraulic fracturing is an indispensable technology for the economic and effective development of such tight formations. In recent years, fracturing techniques have notably evolved toward volumetric fracturing approaches [9,10,11]. This methodology employs large-scale, multi-stage, multi-cluster perforation and fracturing operations to maximize the creation of a complex fracture network within the target reservoir. An ideal volumetric fracture treatment does not produce a single planar main fracture; rather, it induces a hierarchy of branching microfractures emanating from the primary fracture, interweaving to form a three-dimensional network with extensive contact surface area [12,13,14].
Within this intricate fracture network, proppant serves as the key medium for sustaining long-term conductivity. The transport and distribution behavior of the proppant directly determine the ultimate effectiveness of the fracturing treatment. After being injected with the high-pressure fracturing fluid, proppant transport is a highly dynamic and complex process involving settling, secondary migration, re-suspension, and even local clogging phenomena [15,16,17]. Whether the proppant is effectively placed at the target location to establish highly conductive proppant packs—rather than prematurely settling near the wellbore or aggrading into sand dams that obstruct the fracture—constitutes a core issue governing production enhancement [18].
Fracture aperture in hydraulic fracturing is not constant but varies dynamically over time. The principal factor controlling this variation is the differential between fluid pressure within the fracture and the surrounding formation closure stress, which directly dictates the fracture opening [19,20,21]. During treatment, parameters such as pump rate, fluid viscosity, formation fluid loss, and rock mechanical properties influence the net pressure, causing temporal fluctuations in the fracture width. Additionally, aperture is spatially heterogeneous along both the length and height of the fracture. Significant differences in in situ stresses—particularly vertical stress and minimum horizontal principal stress—exist across different depths and lithological boundaries [22,23,24]. When a hydraulic fracture propagates upward or downward through relatively weak shale into a stratum with higher closure stress, a stress shadow effect occurs. At the interface, the local net pressure abruptly decreases because the closure stress of the high-stress interlayer far exceeds that of the underlying shale, impeding fracture opening and significantly altering the fracture geometry [25].
In proppant transport research, Fernández et al. developed a smooth-walled, linearly tapering fracture model (with aperture varying linearly with length) to analyze the effects of the injection rate and proppant size, though the model diverged substantially from actual fracture aperture distributions [26]. Kou and Chun constructed models incorporating vertical and inclined fractures to investigate proppant velocity and transport trajectories, finding that inclined fractures exhibit higher transport efficiency than vertical ones due to side-wall contact forces counteracting gravity [27,28]. Their further studies revealed that 100-mesh proppant has the highest placement efficiency in both fracture geometries; that injection point location affects distribution uniformity in inclined fractures; and that fracture inclination and proppant size are critical factors. Moreover, Xie’s numerical simulations of supercritical CO2-based proppant transport employed a linearly dilating fracture model with various taper angles, confirming that higher taper rates increase required injection time but reduce proppant bed height [29].
Efficient proppant transport and placement are crucial for hydraulic fracturing but remain inadequately understood, with fluid types, transport mechanisms, and field challenges still under debate. Viscoelastic surfactants (VESs) have shown promise as fracturing fluids, yet their stability often declines under high temperature and salinity. Recent studies explore nanoparticle-enhanced VES systems to improve rheology and carrying capacity. Meanwhile, data-driven approaches such as the proppant filling index (PFI) are being developed to quantitatively assess proppant distribution in reservoirs. These advances collectively aim to optimize fracturing performance and support broader applications in oil, gas, and emerging energy systems [23,30,31,32].
A review of existing literature on proppant transport and placement within hydraulic fractures indicates a paucity of studies focusing on transport behavior in linearly tapering fractures. Most research has concentrated on single planar fractures, complex fracture networks, or curved fracture geometries, overlooking the inherently uneven aperture distributions observed in actual fractures. There remains an unclear understanding of proppant transport and placement under different fracture taper rates. In this study, we established fracture models with various linear taper rates to investigate proppant transport and placement behaviors under diverse geometric configurations and operational parameters, providing theoretical guidance for optimizing proppant placement in linearly tapering fractures.

2. Materials and Methods

2.1. Modeling of Fracture

Based on field fracturing data, a geometrically similar linear-taper fracture model was established to replicate actual operating conditions. Field statistics indicate that fracturing pump rates typically range from 16 to 20 m3/min, single-stage fluid volumes are between 1500 and 2000 m3, individual fracture lengths vary from 100 to 150 m, and fracture widths are controlled within 6–8 mm. Shale oil reservoirs exhibit thin layer characteristics, significantly restricting vertical fracture height growth; single cluster heights generally lie between 7 and 20 m. Regarding aperture design, extensive experiments and numerical simulations by Cipolla et al. demonstrated that, within complex fracture networks, the minimum aperture variation can be as small as 2.5 mm. Drawing on these findings and field conditions, we employed similarity criteria to construct a linear-taper fracture model reflecting actual geometry: a total length of 3 m, height of 0.6 m, an initial inlet width of 8 mm at the left end, and four minimum outlet widths—8 mm, 6 mm, 4 mm, and 2 mm—at the right end to simulate gradual taper along the fracture length.
We defined the fracture width taper rate (δ) to characterize the non-uniformity of an induced fracture over a given length. This parameter quantifies how the aperture varies per unit length along the fracture and is given by the ratio of the total width change (Δw) to the fracture length (L).
Because the laboratory fracturing model consists of a single wing, the flow rates used in the experiment must be scaled based on the inlet area ratio to match the field-scale injection flow rates. In other words, multiplying the actual inter-field injection rate by the inlet area of the modeled fracture and dividing the inlet area of the actual fracture twice gives the actual field injection rate. Here, the actual injection rate is the volume injected into the real crack per minute, the modeled injection rate is the volume injected into the reduced crack per hour, and the two inlet areas correspond to the inlets of the real and modeled cracks, respectively.
This yielded four distinct taper rate models. Additionally, a rectangular inlet measuring 0.1 m × 8 mm was designed at the model’s left end as the injection port for fracturing fluid and proppant (see Figure 1).
By selecting simulation volumes corresponding to different injection velocities, and using four proppant sizes—50/120 mesh (0.21 mm), 30/50 mesh (0.45 mm), 20/40 mesh (0.64 mm), and 20 mesh (0.85 mm)—we designed a study to investigate proppant transport and placement in fractures under varying velocities, grain sizes, densities, and sand concentrations. The simulation parameters are summarized in Table 1.

2.2. Grid Independence Testing and Segmentation

To balance computational cost with accuracy, a grid independence test was performed to select the optimal mesh size. Four mesh densities were generated, and the equilibrium proppant pack height was adopted as the key metric for pack morphology. By simulating and tracking how the equilibrium pack height varied with an increasing mesh count, the optimal mesh was identified. As shown in Figure 2, the pack height changes leveled off as the mesh count increased; beyond 480,000 cells, further mesh refinement had a negligible impact on the results but imposed a substantial computational penalty. Accordingly, a mesh of 480,000 cells was chosen for all subsequent numerical simulations.

2.3. Mathematical Models

For both the particles and the fluid within the circular domain, the continuity and momentum equations are formulated in [33].
Continuity equation:
α l ρ l t + α l ρ l u l = 0
α s ρ s t + α s ρ s u s = 0
Momentum equation:
α l ρ l u l t + α l ρ l u l u l = α l p + α l τ + α l ρ l g β v l v s
α s ρ s u s t + α s ρ s u s u s = α s p p s + α s τ + α s ρ s g + β v 1 v s
In this context, the subscripts l and s denote the drilling fluid and cuttings, respectively. Here, α represents the volume fraction, ρ the density, g/cm3, u the velocity vector, p the pressure, Pa, ps the pressure of the solid phase, Pa, τ the stress tensor, N/m2, g the gravitational acceleration, m/s2, and β the interphase momentum transfer coefficient.
In this study, we chose Reynolds-averaged Navier–Stokes equations using the Realizable k–ε turbulence model with standard wall functions. The Realizable k–ε model was chosen for its proven ability to predict anisotropic turbulent stresses and vortex structures in moderate-Reynolds-number confined flows, while offering the computational efficiency required to couple an Eulerian fluid phase with Lagrangian discrete-particle tracking. Under our injection velocities (1.38–3.24 m/s) and tapering fracture geometries, this approach strikes a practical balance between accuracy and run-time. We note, however, that RANS models can underpredict fine-scale turbulence compared to Large-Eddy Simulation (LES); future extensions of this work may explore hybrid RANS–LES or full LES to better resolve turbulence–particle interactions.
The expression of the solid phase pressure ps is as follows [34]:
p s = α s ρ s Θ s + 2 ρ s ( 1 + e s s ) α s 2 g 0 , s s Θ s
where ess represents the restitution coefficient of particle collision; Θs represents the granular temperature, m2/s2; additionally, g0,ss denotes the radial distribution function, given by the following expression:
g 0 , s s = 1 α s α s , max 1 3 1
The expression for the granular temperature Θs is given as follows:
Θ s = 1 3 u s , i u s , i
In the two-fluid model, the viscosity of the solid phase comprises collision viscosity, kinetic viscosity, and friction viscosity [35,36]:
μ s = μ s , c o l + μ s , k i n + μ s , f r
The expressions for collision viscosity μs,col, kinetic viscosity μs,kin, and friction viscosity μs,fr are as follows:
μ s , col = 4 5 α s ρ s d s g 0 , s s 1 + e s s Θ s π 1 / 2 α s
μ s ,   kin   = 10 ρ s d s Θ s π 96 α s 1 + e s s g 0 , s s 1 + 4 5 g 0 , s s α s 1 + e s s 2 α s
μ s , f r = p s sin ϕ 2 I 2 D
Volume viscosity represents the resistance of particles to compression and expansion within the flow. According to Lun et al., the volume viscosity is described as follows [37]:
λ S = 4 3 α S 2 ρ S d s g 0 , s s 1 + e s s Θ S π 1 / 2
The momentum exchange coefficient between the solid and liquid phases was determined using the Huilin–Gidaspow et al. model, which integrates both the Ergun model and the Wen and Yu model [38]. The Huilin–Gidaspow drag law performs well for dilute, spherical-particle suspensions, but may underpredict drag in high-concentration slurries or for non-spherical grains. Future work will address hindered-settling and shape-factor corrections. The equation is presented as follows:
β Huilin-Gidaspow = φ β Ergun + ( 1 φ ) β Wen & Yu
φ = arctan 262.5 α s 0.2 π + 0.5
When α ≤ 0.8,
β Ergun   = 150 α s 1 α 1 μ 1 α 1 d s 2 + 1.75 ρ 1 α s u s u 1 d s
When α > 0.8,
β Wen & Yu = 3 4 C D α s α 1 ρ 1 u s u 1 d s α 1 2.65
In this formula, CD represents the drag coefficient, which is calculated as follows:
C D = = 24 R e s 1 + 0.15 R e s 0.687                 R e s 1000 0.44                                                                             R e s > 1000
In this formula, the particle Reynolds number Res can be defined as follows:
R e s = ρ 1 d s u s u 1 μ 1
In this formula, ds denotes the particle diameter in meters. The expression for the stress tensor of the cuttings and drilling fluid is as follows:
τ l ¯ ¯ = μ l u l + u l T 2 3 u l I ¯ ¯
τ s ¯ ¯ = μ s u s + u s T + ζ s 2 3 μ s u s I ¯ ¯
In this formula, I ¯ ¯ is the unit vector; μ1 and μs represent the fluid viscosity and shear viscosity, respectively, Pa·s; and ζs denotes the volume viscosity of the solid phase, Pa·s.
Please refer to abbreviation part for detailed parameter specifications.

3. Results and Analysis

3.1. Model Validation

To more accurately replicate proppant transport under field-like conditions, we translated on-site fracturing parameters into laboratory settings and, using an indoor experimental rig, made minor adjustments to certain parameters for model validation. The validation tests employed a flow rate of 3–6 m3/h, proppant particle diameter of 0.45 mm, proppant density of 2450 kg/m3, and a sand concentration of 0.04%. Figure 3 compares the proppant pack geometries from experiment and simulation. At the lowest flow rate (3 m3/h), the in-fracture velocity was reduced, yielding a pack that formed closer to the inlet; although the equilibrium pack height deviated slightly from the numerical prediction, the discrepancy remained under 5 %. The details of the experimental setup are shown in Table 2.
While the maximum deviation between simulated and experimental equilibrium proppant packet heights remained below 5% under test conditions, it is important to recognize that this agreement reflects only a limited subset of operating parameters. Potential reasons for the discrepancy include simplifying assumptions such as perfectly rigid spherical particles, ignoring slight fracture surface roughness, and idealized inlet velocity profiles. In addition, small variations in mud concentration, flow stability, or visualization resolution may also contribute to experimental uncertainty. Overall, the low relative error suggests that the model captured the main migration and deposition mechanisms under these conditions.

3.2. Effect of the Injection Rate

To investigate the influence of fracturing fluid injection rate on proppant transport and placement, we converted field pumping volumes into laboratory-scale parameters and simulated injection rates from 3 to 7 m3/h. All other operational parameters were held constant: proppant diameter 0.45 mm, proppant density 2770 kg/m3, and a sand concentration of 4%. We then analyzed proppant transport and deposition within each of the four linearly tapering fracture models under these varying injection rates.
Figure 4 presents proppant streamlines at successive time steps for two representative taper geometries. At the onset of injection, low in-fracture velocities cause a small volume of proppant to settle and accumulate near the inlet, generating pronounced vortices and turbulent eddies; as the injection continues, particle accumulation increases, turbulence subsides, and the streamlines progressively align more smoothly along the fracture length. In every model, proppant transport and settling follow the same sequence: initial settling at the inlet forms a nascent pack whose height rises until it matches the incoming slurry height and attains a dynamic equilibrium; thereafter, growth shifts to the main proppant pack, which continues to build in height downstream until it reaches the equilibrium proppant pack height, beyond which the pack morphology remains essentially constant, with a groove-like structure between the entrance end and the main sand dike, and further settling occurs predominantly on the downstream face of the stabilized pack, extending it toward the fracture’s distal end at the equilibrium height.
Figure 5 presents the proppant pack morphology under varying injection velocities for both conventional fractures (δ = 0) and tapering fractures (δ = 1/500). Specifically, Figure 5a–d shows the results in the uniform-width fracture at velocities of 1.38, 1.85, 2.08, and 2.31 m/s, respectively. As the injection velocity increases, the fluid’s carrying capacity becomes more dominant relative to gravity, resulting in reduced equilibrium pack height and a noticeable rearward shift of the main pack. The inlet pack quickly reaches a stable height, while the pack’s front edge advances deeper into the fracture, effectively extending the placement length.
Similarly, Figure 5e–h illustrates the tapering fracture case under the same velocities. Compared to the uniform-width fracture, the tapering geometry induces an accelerating flow along the fracture length, further lowering the equilibrium pack height and pushing the proppant farther downstream. This effect becomes especially pronounced at higher velocities, confirming that the combination of increased injection rate and fracture taper synergistically promotes deeper, more uniform proppant placement.
Figure 6 presents the variation in equilibrium proppant pack height with in-fracture velocity for fracture models of different taper rates. Across the entire velocity range, linearly tapering fractures yield lower equilibrium pack heights than the uniform-width case (δ = 0), and this discrepancy grows as velocity increases. At low velocities, differences among models are modest, but when the flow speed rises from 1.38 m/s to 3.24 m/s, the uniform fracture’s pack height falls from 0.3528 m to 0.2381 m (a 32.5% reduction), while the δ = 1/500 taper model drops from 0.3344 m to 0.1342 m (a 59.9% reduction). The greater sensitivity of tapering fractures highlights their enhanced capacity to transport proppant deeper into the fracture, yielding an overall lower final equilibrium proppant pack height. By systematically characterizing proppant transport and placement across various taper rates and injection velocities, these findings offer a solid theoretical basis for optimizing field fracturing parameters and mitigating sand plugging effects on treatment efficiency.

3.3. Effect of Sand Concentration

Sand concentration is one of the key factors controlling the equilibrium proppant pack height, and must generally be kept below 10% to avoid excessive buildup and sand-plugging at the fracture inlet. To quantify its influence on in-fracture proppant transport, we performed simulations at concentrations of 2%, 4%, 6%, and 8%, holding the proppant diameter at 0.45 mm, density at 2770 kg/m3, and injection velocity at 1.85 m/s, and examining each concentration across the four taper-rate models.
Figure 7 illustrates the evolution of proppant streamlines at 8 % sand concentration. As injection proceeds, the main proppant pack height increases steadily. Near the inlet, the interaction between high-shear fluid flow and the fracture walls generates pronounced vortices during the initial stages—especially in the uniform-width fracture—whereas in tapering fractures, the narrowing aperture suppresses turbulence, yielding smoother flow. Over time, fluid drag, gravity, and inertial forces act in concert to transport particles farther downstream; by the later stages of injection, streamlines in the tapering models become almost parallel to the fracture axis, and most settling occurs on the downstream face of the pack. This downstream deposition causes that face to grow more rapidly, transforming the pack shape from a rounded, dome-like profile to a flatter, more uniformly topped morphology, indicative of improved proppant distribution within the fracture.
Analysis of the pack geometries in Figure 8 under different sand concentration conditions shows that, as the sand concentration increases, interparticle collisions and friction rise markedly, enlarging the proppant fully entrained zone, and rendering particles within this region dynamically unstable. Higher sand concentrations also drive a significant increase in pack height within the fully entrained zone. Across all fracture models, pack formation follows the same pattern: the inlet pack grows until it matches the height of the incoming slurry and then stabilizes, with further changes in sand concentration having little effect on this inlet height; meanwhile, the main pack within the fracture continues to build until it reaches its own stable morphology.
However, the fracture-width taper rate δ exerts a growing influence on pack shape. As δ increases, the tendency for the main pack to extend downstream at its equilibrium height becomes more pronounced. Under an 8 % sand concentration in the δ = 1/500 taper model (Figure 8c,d and Figure 9), settling occurs predominantly on the downstream face of the main pack, which, in turn, translates farther toward the fracture tip. The pack profile evolves from a rounded, dome-like form into a flatter “table-top” morphology with a more uniform proppant distribution. Compared with the traditional dome-shaped pack, the flatter profile of the pack reduces localized fluid acceleration and minimizes scouring effects at the pack surface, and lessen local velocity gradients, thereby diminishing shear stresses and enhancing pack stability.

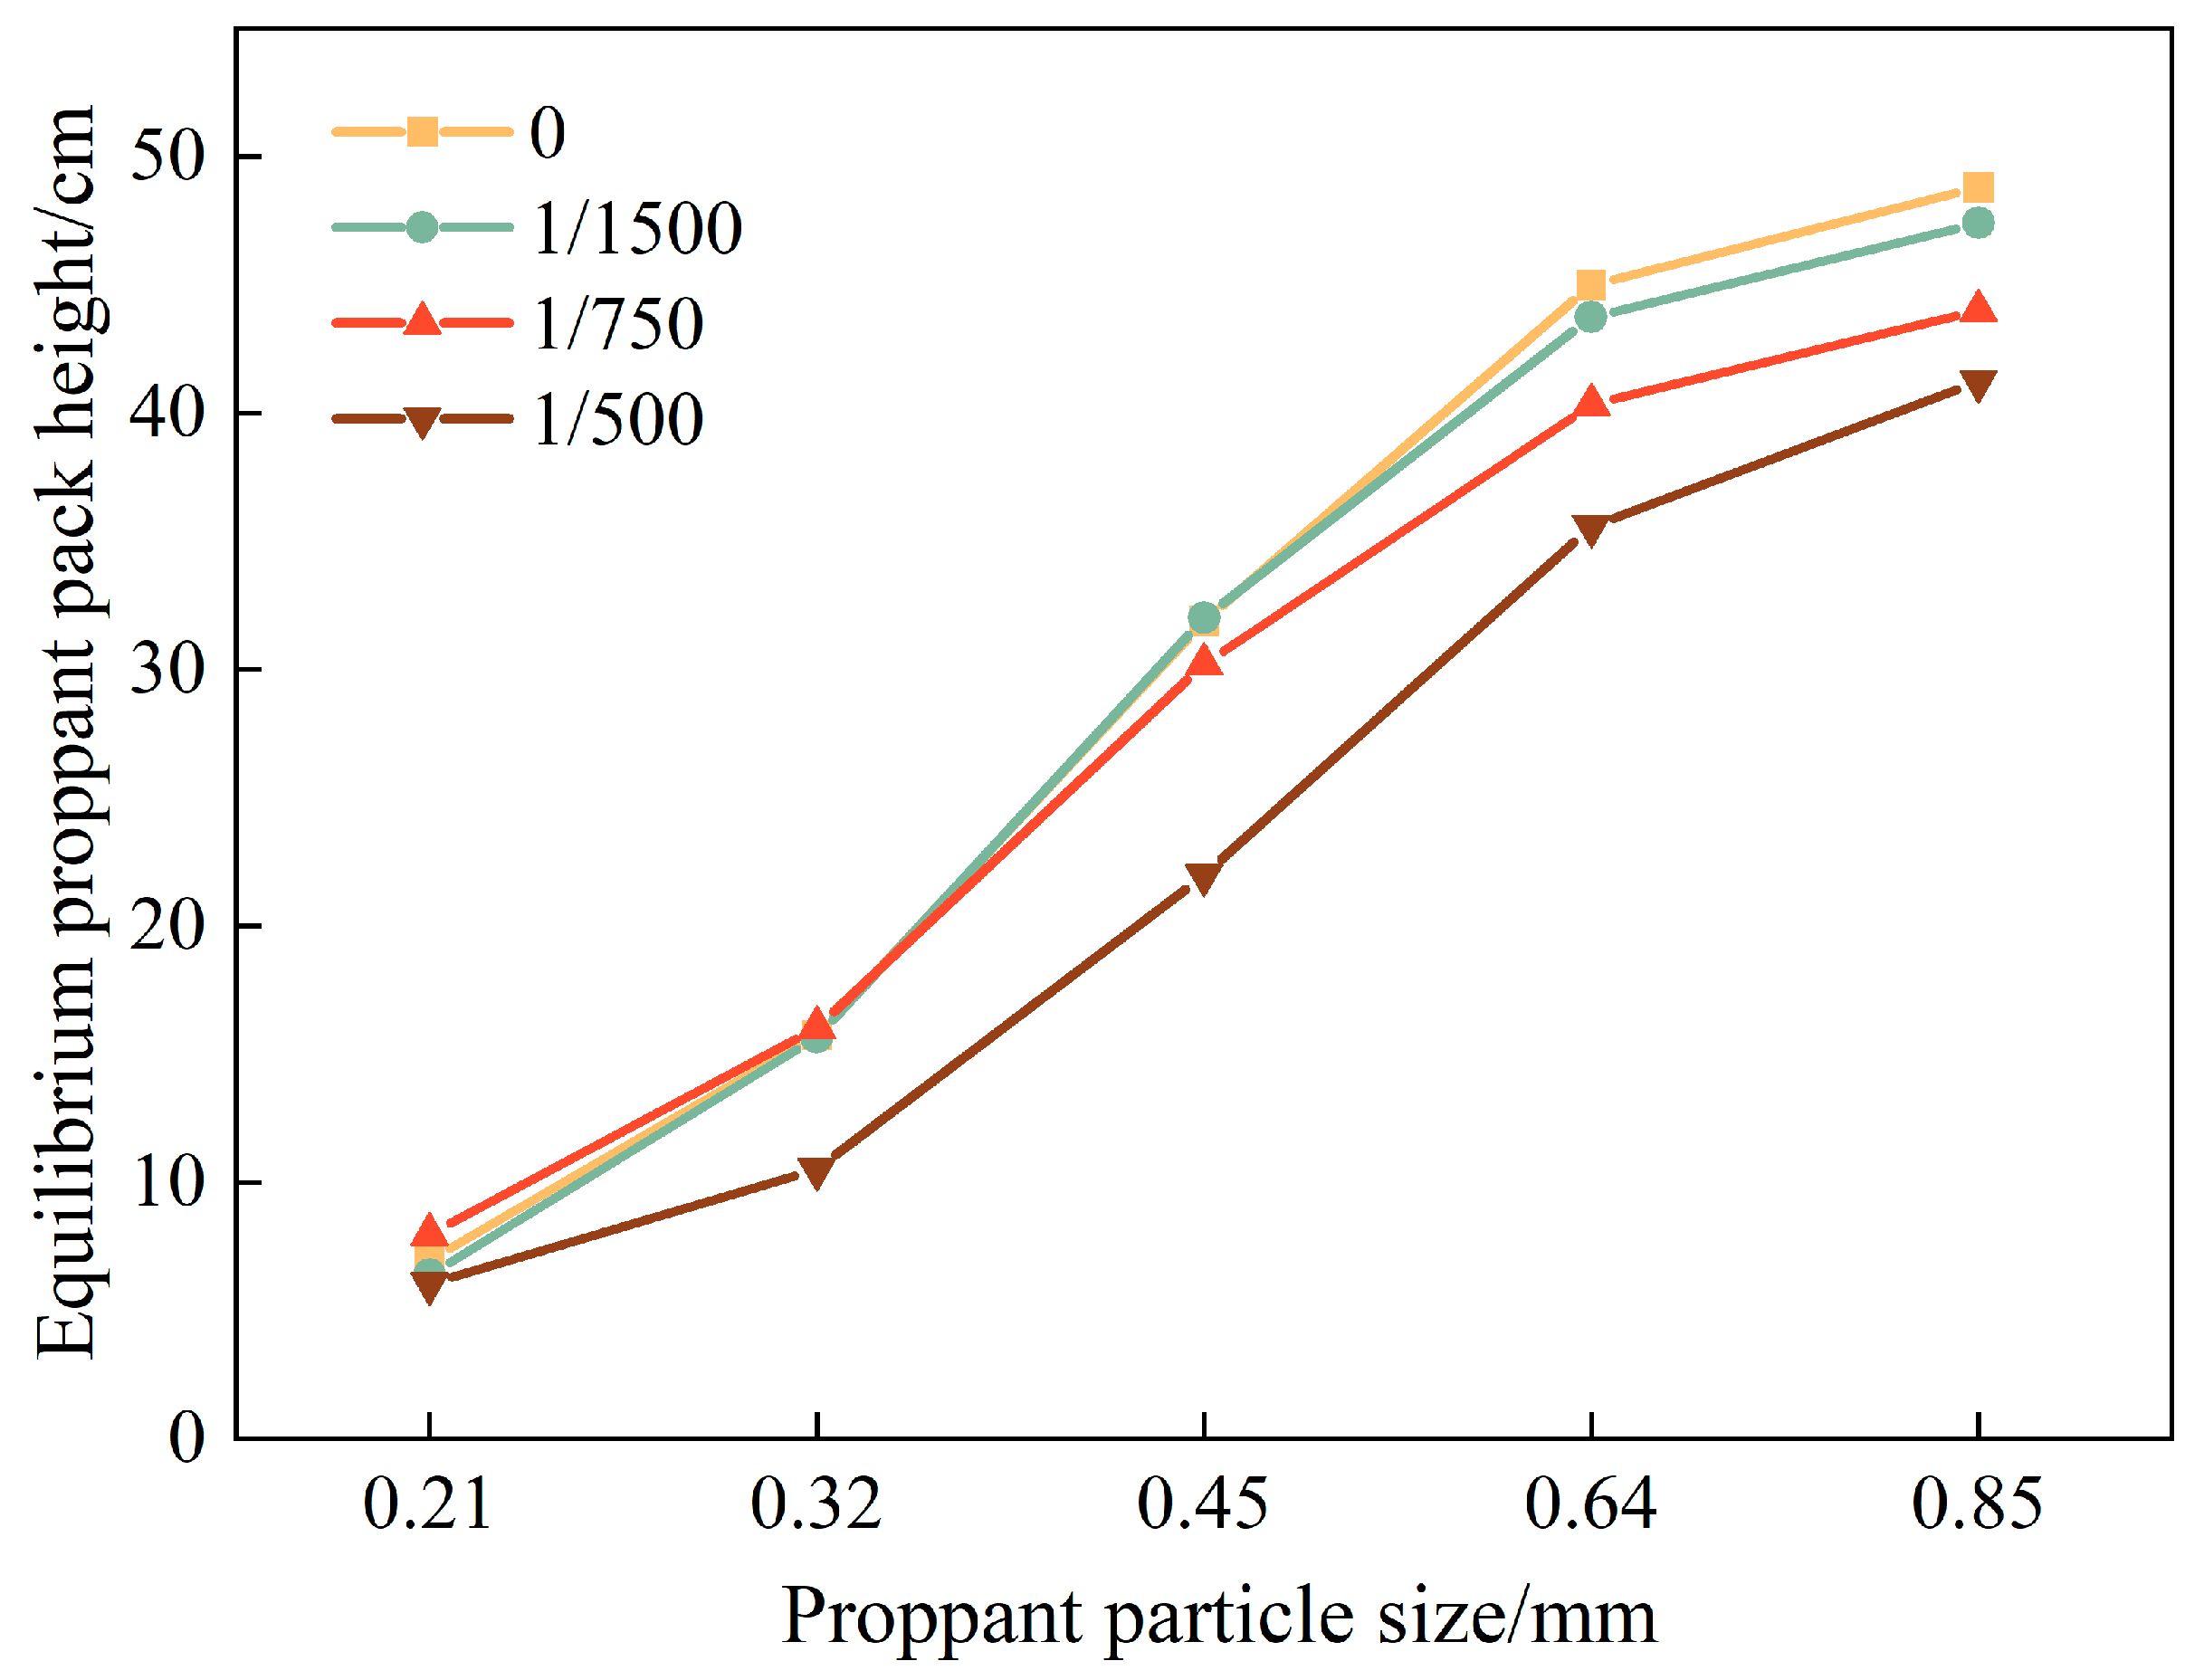
3.4. Effect of Proppant Particle Size

To assess the influence of proppant particle size on transport and placement within fractures, we carried out numerical simulations using five commonly employed diameters—0.21 mm, 0.32 mm, 0.45 mm, 0.64 mm, and 0.85 mm—while all other injection parameters were held constant. The injection velocity was set to 2.31 m/s and the sand concentration to 4 %. For each particle size, we examined the resulting equilibrium proppant pack morphology to identify how particle diameter affects pack height, shape, and downstream penetration.
The influence of particle size is shown in Figure 10, where diameters of 0.21 mm, 0.45 mm, 0.64 mm, and 0.85 mm were tested at a fixed injection velocity of 2.31 m/s. Smaller particles, due to their low settling velocity and higher drag-to-weight ratio, remained suspended longer and were more readily transported to the distal ends of the fracture. In contrast, larger particles settled rapidly under gravity, forming higher equilibrium packs closer to the inlet. Notably, the shape of the pack also evolved: as particle size increased, the pack transitioned from a flat-topped to a dome-like morphology, with more pronounced turbulence above the pack due to stronger wake effects.
In tapering fractures (higher δ), even large particles experienced increased local velocities downstream, improving their transport distance and flattening the pack slope. This highlights how fracture geometry can partially offset the reduced mobility of coarse particles.
As the fracture aperture narrowed downstream (higher δ), the requirement of mass continuity forced the fluid velocity to increase. This local acceleration steepened both the streamwise and wall normal velocity gradients, which directly enhanced the shear-production term in the turbulence kinetic energy budget. In practical terms, the stronger velocity gradients intensified wall shear stresses and promoted Kelvin–Helmholtz instabilities in the shear layers, leading to a more vigorous roll-up of vortical structures. These enhanced vortices and eddy interactions elevated turbulent mixing and fluctuation levels throughout the advancing flow. The net effect was a robust increase in turbulent intensity in regions of high taper, which, in turn, improved the fluid’s capacity to suspend and transport proppant farther into the fracture.
As the fracture-width taper rate δ increased, the transport and placement of fine proppant (e.g., 0.21 mm and 0.32 mm) remained largely unaffected; these small particles were readily entrained by the flowing fluid and continued to penetrate toward the fracture tip regardless of the aperture narrowing. In contrast, coarser particles (0.64 mm and 0.85 mm) behaved quite differently: the progressive narrowing of the downstream flow channel sharply raised the local fluid velocity compared with a uniform fracture, enhancing the drag force on these larger particles. Consequently, instead of settling immediately at the inlet, they were carried farther into the fracture, forming an extended proppant pack that advances toward the distal end at its equilibrium proppant pack height and ultimately develops a flatter, “table-top” morphology. At the same time, the pack’s equilibrium height decreased and the slope of its downstream face became more gradual, significantly lengthening the effective placement distance and producing a more uniform proppant distribution.
Figure 11 quantifies how equilibrium proppant pack height varies with particle size across different taper rates. As particle diameter increased, the gravitational force on each particle grew, raising the energy barrier for long-distance transport, thus delivering coarse proppant to the fracture tip becomes more challenging, and a larger fraction of the material settles closer to the inlet, driving up the overall pack height. This effect was particularly pronounced for 0.64 mm and 0.85 mm proppant, where equilibrium pack heights spiked noticeably. Simultaneously, narrowing the flow channel elevated velocity and intensified the fluid agitation of suspended particles, which pushed the proppant deeper into the fracture. The result was an increase in both the equilibrium displacement of particles and the effective placement length of the pack, underscoring the dual role of the particle size and taper rate in optimizing fracture fill strategies.

3.5. Effect of Proppant Density

To assess the influence of proppant density on transport and placement, we simulated four common densities—1760, 2450, 2770, and 3200 kg/m3—at a fixed injection velocity of 1.85 m/s, proppant diameter of 0.45 mm, and sand concentration of 4%.
Denser proppant was dominated by gravity during its migration: the higher fluid drag relative to buoyant support made it difficult for heavy particles to be entrained by inlet vortices and transported deep into the fracture. In contrast, lighter proppant settled more slowly and remains suspended longer, allowing for the fluid to carry it farther toward the fracture tip (Figure 12). Changes in density only had a minor effect on the proppant pack height at the inlet, but they markedly influenced the main pack’s equilibrium proppant pack height and its downstream displacement. Once the main pack reached its equilibrium height—where settling and re-entrainment are balanced—increasing density enlarged both the fully entrained zone and the dynamic equilibrium region, making particles more readily carried by the flow. Although all taper rate models shared identical inlet conditions and thus formed similar inlet pack heights, the downstream distribution of proppant became increasingly uneven as the density rose, producing a pack with a distinct slope. Moreover, as the fracture-width taper rate increased, the final equilibrium proppant pack height decreased and the effective placement length grew, since particles were more efficiently transported to distal locations. At a given density, higher taper rates also shifted the pack’s highest point farther downstream, flattening the pack profile and extending the overall placement distance.
From the equilibrium proppant pack height curves for the different densities shown in Figure 13, it can be seen that under identical proppant density and injection conditions, tapering fractures exhibited a gradual decline in pack height from inlet to outlet. This occurred because the aperture narrowed downstream, accelerating fluid flow and making particle settling increasingly difficult; the effect was most pronounced in the δ = 1/500 model.
High-density proppants—owing to their greater mass and larger particle volume—had lower mobility and, once a stable pack formed, could sustain fracture conductivity over a longer period, thereby enhancing overall fracturing support stability. However, at high injection concentrations, they also raised the risk of near-wellbore sand plugging. By contrast, low-density proppants remained suspended more easily, reducing accumulation at the inlet and helping to mitigate plugging. In field operations, judiciously increasing the proppant density can optimize pack height and achieve effective fracture support, but once the desired support level is reached, further injection of a high-density proppant should be curtailed to avoid excessive pack buildup and potential blockage.

3.6. Sensitivity to Key Modeling Choices

To assess the stability of our morphological findings, we examined two principal modeling decisions. First, replacing the standard Schiller–Naumann drag correlation with the Gidaspow formulation produced modest shifts in equilibrium pack heights but preserved the same trends with respect to the fracture taper rate, injection velocity, and particle properties. Second, coarsening or refining the mesh around our 480,000-cell baseline influenced local flow details and convergence behavior, yet the large-scale proppant pack morphology and relative comparisons across cases remained consistent. These checks demonstrate that, although absolute values may vary, the qualitative relationships between δ, injection conditions, and pack geometry are robust to common modeling choices.

4. Conclusions

This study employed CFD simulations to investigate proppant transport and placement in four linearly tapering fracture models with width taper rates (δ) of 0, 1/1500, 1/750, and 1/500, under a variety of operational parameters. The key findings are as follows:
(1)
Regardless of the taper rate, proppant pack formation follows the same overall sequence. The equilibrium proppant pack height increases with higher sand concentration, greater proppant density, and larger particle size, but decreases as injection rate rises. Higher sand concentrations and injection rates improve proppant placement but can worsen perforation erosion and screen-out, risking uncontrolled fracture growth. Operators should balance these trade-offs via the real-time monitoring and adaptive adjustment of sand concentration and injection rate.
(2)
As δ increases and the fracture aperture narrows downstream, the flow channel constricts and turbulence intensifies, enhancing the fluid’s carrying capacity. Raising the in-fracture velocity from 1.38 m/s to 3.24 m/s reduces the main pack height by about 32.5 % in the uniform (δ = 0) model and by approximately 59.9 % in the δ = 1/1500 taper model; inlet pack height is largely unaffected.
(3)
Variations in sand concentration and particle size significantly alter the morphology of the main pack. In fractures with higher taper rates, higher sand concentrations or larger particles lead to a transition from a dome shaped to a flatter “table top” pack. During late injection stages, settling predominantly occurs on the downstream face, and the pack advances toward the fracture tip at its equilibrium height with gentler slopes and more uniform placement.
(4)
A low-density proppant, with its lower settling velocity, remains suspended and resists build up, whereas a high-density proppant forms more stable packs. In tapering fractures, the peak of the equilibrium pack shifts farther downstream as δ increases, indicating longer transport distances and a flatter pack profile for a heavy proppant.
(5)
Operators can leverage high taper rates (δ) in reservoirs with strong stress contrasts to accelerate downstream flow, lower pack heights, and extend the propped half-length. By tailoring perforation spacing, cluster sequencing, and proppant design to create controlled aperture narrowing—alongside optimized injection rates and particle properties—fracture conductivity can be maximized while minimizing near-wellbore plugging.
To achieve uniform proppant placement in tapering fractures, sand concentration needs to be increased and/or larger particles used to promote table top pack shapes. Higher injection rates improve distal placement by lowering pack heights and driving proppant deeper. Employing a high-density proppant in tapering geometries can sustain long-term conductivity, but its volume should be carefully managed to avoid near-wellbore plugging once the desired support is established.

Author Contributions

Methodology, X.S.; Validation, H.Y.; Investigation, S.Y.; Data curation, J.B.; Writing—original draft, L.T.; Writing—review & editing, J.Q. All authors have read and agreed to the published version of the manuscript.

Funding

This research was funded by the National Key Research and Development Program of China (2023YFC2811003).

Data Availability Statement

The original contributions presented in this study are included in the article. Further inquiries can be directed to the corresponding author.

Conflicts of Interest

Author Jinxin Bao is employed by the Jianghan Oilfield Branch of Sinopec Group, and Shangkong Yao is employed by the West East Gas Pipeline Branch of National Petroleum and Natural Gas Pipeline Network Group Co., Ltd. The remaining authors declare that the research was conducted in the absence of any commercial or financial relationships that could be construed as potential conflicts of interest.

Abbreviations

Model parameters and interpretation.
SymbolDescriptionUnit
δFracture width taper rate, defined as Δw/L
ΔwTotal change in fracture aperture (win − wout)m
LDistance over which fracture aperture tapersm
w(x)Fracture aperture at position x along the fracturem
QInjection flow ratem3/h
vAverage fluid velocity in the fracturem/s
dpProppant particle diameterm
ρpProppant densitykg/m3
CsSand concentration (volumetric fraction of slurry)
HeqEquilibrium proppant pack heightm
NnellsNumber of mesh cells (grid resolution)
kTurbulent kinetic energym2/s2
εTurbulent dissipation ratem2/s3

References

  1. Krzaczek, M.; Nitka, M.; Kozicki, J.; Tejchman, J. Simulations of Hydro-Fracking in Rock Mass at Meso-Scale Using Fully Coupled DEM/CFD Approach. Acta Geotech. 2020, 15, 297–324. [Google Scholar] [CrossRef]
  2. Raimbay, A.; Babadagli, T.; Kuru, E.; Develi, K. Quantitative and Visual Analysis of Proppant Transport in Rough Fractures. J. Nat. Gas Sci. Eng. 2016, 33, 1291–1307. [Google Scholar] [CrossRef]
  3. Liu, D.; Lecampion, B. Propagation of a Plane-Strain Hydraulic Fracture Accounting for a Rough Cohesive Zone. J. Mech. Phys. Solids 2021, 149, 104322. [Google Scholar] [CrossRef]
  4. Xu, J.; Ding, Y.; Yang, L.; Liu, Z.; Gao, R.; Wang, Z.; Mo, S. Numerical Analysis of Proppants Transport in Tortuous Fractures of Shale Gas Reservoirs after Shear Deformation. J. Nat. Gas Sci. Eng. 2020, 78, 103285. [Google Scholar] [CrossRef]
  5. Bandara, K.M.A.S.; Ranjith, P.G.; Rathnaweera, T.D. Laboratory-Scale Study on Proppant Behaviour in Unconventional Oil and Gas Reservoir Formations. J. Nat. Gas Sci. Eng. 2020, 78, 103329. [Google Scholar] [CrossRef]
  6. Chen, Y.; Li, W.; Wang, X.; Wang, Y.; Fu, L.; Wu, P.; Wang, Z. Research and Application of Geomechanics Using 3D Model of Deep Shale Gas in Luzhou Block, Sichuan Basin, Southwest China. Geosciences 2025, 15, 65. [Google Scholar] [CrossRef]
  7. Zhang, Q.; Yan, X.; Wang, X.; Feng, G.; Yao, W.; Yin, Y.; Zhang, K. Investigating the Impacts of Nonuniform Proppant Distribution and Fracture Closure on Well Performance in Shale Gas Reservoirs. Front. Earth Sci. 2022, 10, 1–9. [Google Scholar] [CrossRef]
  8. Lee, J.; Babadagli, T. Effect of Roughness on Fluid Flow and Solute Transport in a Single Fracture: A Review of Recent Developments, Current Trends, and Future Research. J. Nat. Gas Sci. Eng. 2021, 91, 103971. [Google Scholar] [CrossRef]
  9. Zhang, B.; Lu, N.; Guo, Y.; Wang, Q.; Cai, M.; Lou, E. Modeling and Analysis of Sustained Annular Pressure and Gas Accumulation Caused by Tubing Integrity Failure in the Production Process of Deep Natural Gas Wells. J. Energy Resour. Technol. 2021, 144, 063005. [Google Scholar] [CrossRef]
  10. Suri, Y.; Islam, S.Z.; Hossain, M. Effect of Fracture Roughness on the Hydrodynamics of Proppant Transport in Hydraulic Fractures. J. Nat. Gas Sci. Eng. 2020, 80, 103401. [Google Scholar] [CrossRef]
  11. Sun, X.; Tao, L.; Qu, J.; Yao, D.; Hu, Q. Evaluating the Effectiveness of Cleaning Tools for Enhanced Efficiency in Reamed Wellbore Operations. Geoenergy Sci. Eng. 2025, 246, 213620. [Google Scholar] [CrossRef]
  12. Michael, F.M.; Krishnan, M.R.; Li, W.; Alsharaeh, E.H. A Review on Polymer-Nanofiller Composites in Developing Coated Sand Proppants for Hydraulic Fracturing. J. Nat. Gas Sci. Eng. 2020, 83, 103553. [Google Scholar] [CrossRef]
  13. Movassagh, A.; Haghighi, M.; Zhang, X.; Kasperczyk, D.; Sayyafzadeh, M. A Fractal Approach for Surface Roughness Analysis of Laboratory Hydraulic Fracture. J. Nat. Gas Sci. Eng. 2021, 85, 103703. [Google Scholar] [CrossRef]
  14. Li, S.Q.; Tong, Y.S.; Yan, T.; Zhou, Y.C.; Li, W.; Sun, X.F. Numerical Simulation of Rock Breaking by Resonance Coring Based on Laboratory Experiments. SPE J. 2025, 30, 1162–1176. [Google Scholar] [CrossRef]
  15. Katende, A.; O’Connell, L.; Rich, A.; Rutqvist, J.; Radonjic, M. A Comprehensive Review of Proppant Embedment in Shale Reservoirs: Experimentation, Modeling and Future Prospects. J. Nat. Gas Sci. Eng. 2021, 95, 104143. [Google Scholar] [CrossRef]
  16. Sahai, R.; Moghanloo, R.G. Proppant Transport in Complex Fracture Networks—A Review. J. Pet. Sci. Eng. 2019, 182, 106199. [Google Scholar] [CrossRef]
  17. Tang, Y.; Ranjith, P.G.; Perera, M.S.A. Major Factors Influencing Proppant Behaviour and Proppant-Associated Damage Mechanisms during Hydraulic Fracturing. Acta Geotech. 2018, 13, 757–780. [Google Scholar] [CrossRef]
  18. Bandara, K.M.A.S.; Ranjith, P.G.; Rathnaweera, T.D. Improved Understanding of Proppant Embedment Behavior under Reservoir Conditions: A Review Study. Powder Technol. 2019, 352, 170–192. [Google Scholar] [CrossRef]
  19. Qu, H.; Tang, S.; Liu, Z.; Mclennan, J.; Wang, R. Experimental Investigation of Proppant Particles Transport in a Tortuous Fracture. Powder Technol. 2021, 382, 95–106. [Google Scholar] [CrossRef]
  20. Zhang, C.P.; Liu, S.; Ma, Z.Y.; Ranjith, P.G. Combined Micro-Proppant and Supercritical Carbon Dioxide (SC-CO2) Fracturing in Shale Gas Reservoirs: A Review. Fuel 2021, 305, 121431. [Google Scholar] [CrossRef]
  21. Barboza, B.R.; Chen, B.; Li, C. A Review on Proppant Transport Modelling. J. Pet. Sci. Eng. 2021, 204, 108753. [Google Scholar] [CrossRef]
  22. Yao, S.; Chang, C.; Hai, K.; Huang, H.; Li, H. A Review of Experimental Studies on the Proppant Settling in Hydraulic Fractures. J. Pet. Sci. Eng. 2022, 208, 109211. [Google Scholar] [CrossRef]
  23. Isah, A.; Hiba, M.; Al-Azani, K.; Aljawad, M.S.; Mahmoud, M. A Comprehensive Review of Proppant Transport in Fractured Reservoirs: Experimental, Numerical, and Field Aspects. J. Nat. Gas Sci. Eng. 2021, 88, 103832. [Google Scholar] [CrossRef]
  24. Zhang, C.P.; Cheng, P.; Ranjith, P.G.; Lu, Y.Y.; Zhou, J.P. A Comparative Study of Fracture Surface Roughness and Flow Characteristics between CO2 and Water Fracturing. J. Nat. Gas Sci. Eng. 2020, 76, 103188. [Google Scholar] [CrossRef]
  25. Sun, X.; Bao, J.; Li, Z.; Qu, J. Numerical Investigation of Proppant Transportation Characteristics in Hydraulically Fractured Wedge Fractures. Petroleum 2024, 10, 660–671. [Google Scholar] [CrossRef]
  26. Fernández, M.E.; Baldini, M.; Pugnaloni, L.A.; Sánchez, M.; Guzzetti, A.R.; Carlevaro, C.M. Proppant Transport and Settling in a Narrow Vertical Wedge-Shaped Fracture. In Proceedings of the 49th U.S. Rock Mechanics/Geomechanics Symposium, San Francisco, CA, USA, 28 June–1 July 2015; p. ARMA-2015-135. [Google Scholar]
  27. Chun, T.; Zhu, D.; Zhang, Z.; Mao, S.; Wu, K. Experimental Study of Proppant Transport in Complex Fractures with Horizontal Bedding Planes for Slickwater Fracturing. SPE Prod. Oper. 2021, 36, 83–96. [Google Scholar] [CrossRef]
  28. Kou, R.; Moridis, G.J.; Blasingame, T.A. Analysis and Modeling of Proppant Transport in Inclined Hydraulic Fractures. In Proceedings of the SPE Hydraulic Fracturing Technology Conference and Exhibition, The Woodlands, TX, USA, 23–25 January 2018; p. D011S002R001. [Google Scholar]
  29. Xie, J.; Hu, Y.; Kang, Y.; Chen, H.; Liu, Q. Numerical Study on Proppant Transport in Supercritical Carbon Dioxide under Different Fracture Shapes: Flat, Wedge-Shaped, and Bifurcated. Energy Fuels 2022, 36, 10278–10290. [Google Scholar] [CrossRef]
  30. Mohammadi, S.; Hemmat, A.; Afifi, H.; Mahmoudi Alemi, F. Improvement of the Rheological Behavior of Viscoelastic Surfactant Fracturing Fluids by Metallic-Type Nanoparticles. ACS Omega 2024, 9, 28676–28690. [Google Scholar] [CrossRef] [PubMed]
  31. Mohammadi, S.; Afifi, H.; Mahmoudi Alemi, F. Review on Enhancing Rheological Characteristics of Viscoelastic Surfactant Fracturing Fluids by Nanoparticles: Advances, Challenges, and Perspectives. Energy Fuels 2024, 38, 4921–4945. [Google Scholar] [CrossRef]
  32. Hou, L.; Elsworth, D.; Zhang, F.; Wang, Z.; Zhang, J. Evaluation of Proppant Injection Based on a Data-Driven Approach Integrating Numerical and Ensemble Learning Models. Energy 2023, 264, 126122. [Google Scholar] [CrossRef]
  33. Ghazanfari, V.; Imani, M.; Shadman, M.M.; Amini, Y.; Zahakifar, F. Numerical Study on the Thermal Performance of the Shell and Tube Heat Exchanger Using Twisted Tubes and Al2O3 Nanoparticles. Prog. Nucl. Energy 2023, 155, 104526. [Google Scholar] [CrossRef]
  34. Walton, O.R.; Braun, R.L. Viscosity, Granular-temperature, and Stress Calculations for Shearing Assemblies of Inelastic, Frictional Disks. J. Rheol. 1986, 30, 949–980. [Google Scholar] [CrossRef]
  35. Brilliantov, N.V.; Pöschel, T. Rolling Friction of a Viscous Sphere on a Hard Plane. Europhys. Lett. 1998, 42, 511–516. [Google Scholar] [CrossRef]
  36. Mathiesen, V.; Solberg, T.; Hjertager, B.H. Predictions of Gas/Particle Flow with an Eulerian Model Including a Realistic Particle Size Distribution. Powder Technol. 2000, 112, 34–45. [Google Scholar] [CrossRef]
  37. Lun, C.K.K.; Savage, S.B.; Jeffrey, D.J.; Chepurniy, N. Kinetic Theories for Granular Flow: Inelastic Particles in Couette Flow and Slightly Inelastic Particles in a General Flowfield. J. Fluid Mech. 1984, 140, 223–256. [Google Scholar] [CrossRef]
  38. Huilin, L.; Gidaspow, D.; Bouillard, J.; Wentie, L. Hydrodynamic Simulation of Gas-Solid Flow in a Riser Using Kinetic Theory of Granular Flow. Chem. Eng. J. 2003, 95, 1–13. [Google Scholar] [CrossRef]
Figure 1. Modeling of fracture with different degrees of linear narrowing.
Geosciences 15 00275 g001
Figure 2. Grid independence test.
Geosciences 15 00275 g002
Figure 3. Model validation and error analysis.
Geosciences 15 00275 g003
Figure 4. Flowline diagram of the sandbank at different moments at 1.85 m/s.
Geosciences 15 00275 g004
Figure 5. Morphology of the sandbank at different injection rates.
Geosciences 15 00275 g005aGeosciences 15 00275 g005b
Figure 6. Equilibrium proppant pack height at different injection rates.
Geosciences 15 00275 g006
Figure 7. Streamlines at different moments at 8% sand concentration.
Geosciences 15 00275 g007
Figure 8. Morphology of the sandbanks at different sand concentrations.
Geosciences 15 00275 g008aGeosciences 15 00275 g008b
Figure 9. Diagram of the equilibrium proppant pack height.
Geosciences 15 00275 g009
Figure 10. Morphological map of the sandbanks at different proppant particle sizes.
Geosciences 15 00275 g010
Figure 11. Morphological change curve of the equilibrium proppant pack height.
Geosciences 15 00275 g011
Figure 12. Morphological map of the sandbanks at different particle densities.
Geosciences 15 00275 g012
Figure 13. Equilibrium proppant pack height at different densities.
Geosciences 15 00275 g013
Table 1. The key simulation parameters and their respective levels.
VariableValues
Pumping rate (m3/h)3, 4,.4.5, 5, 5.5, 6, 6.5, 7
Corresponding velocity (m/s)1.38, 1.85, 2.08, 2.31, 2.55, 2.78, 3, 3.24
Sand concentration (%)2, 4, 6, 8
Proppant size (mm)0.21, 0.32, 0.45, 0.64, 0.85
Proppant density (kg/m3)1760, 2450, 2770, 3200
Fracture taper rate (δ)0; 1/1500; 1/750; 1/500
Table 2. Experimental parameters.
Number of Runs (Group No.)Flow Rate (m3/h)Slot Flow
Velocity (m/s)
Particle
Diameter (mm)
Viscosity of
Proppant–Carrying Fluid (mPa·s)
Proppant Density (kg/m3)Proppant Concentration (%)
13–61.38–2.550.45124500.04
252.310.45124500.04–0.08
Disclaimer/Publisher’s Note: The statements, opinions and data contained in all publications are solely those of the individual author(s) and contributor(s) and not of MDPI and/or the editor(s). MDPI and/or the editor(s) disclaim responsibility for any injury to people or property resulting from any ideas, methods, instructions or products referred to in the content.

