

A Review on the Impact of Fallback Factor on Intermittent Gas and Gas-Assisted Plunger Lifts


Abstract
1. Introduction
1.1. Intermittent Gas Lift (IGL)
1.2. Fallback Factor
1.3. Gas-Assisted Plunger Lift (GAPL)
2. Intermittent Gas Lift (IGL) and Fallback Factor
2.1. Experimental Studies on IGL and Fallback Factor
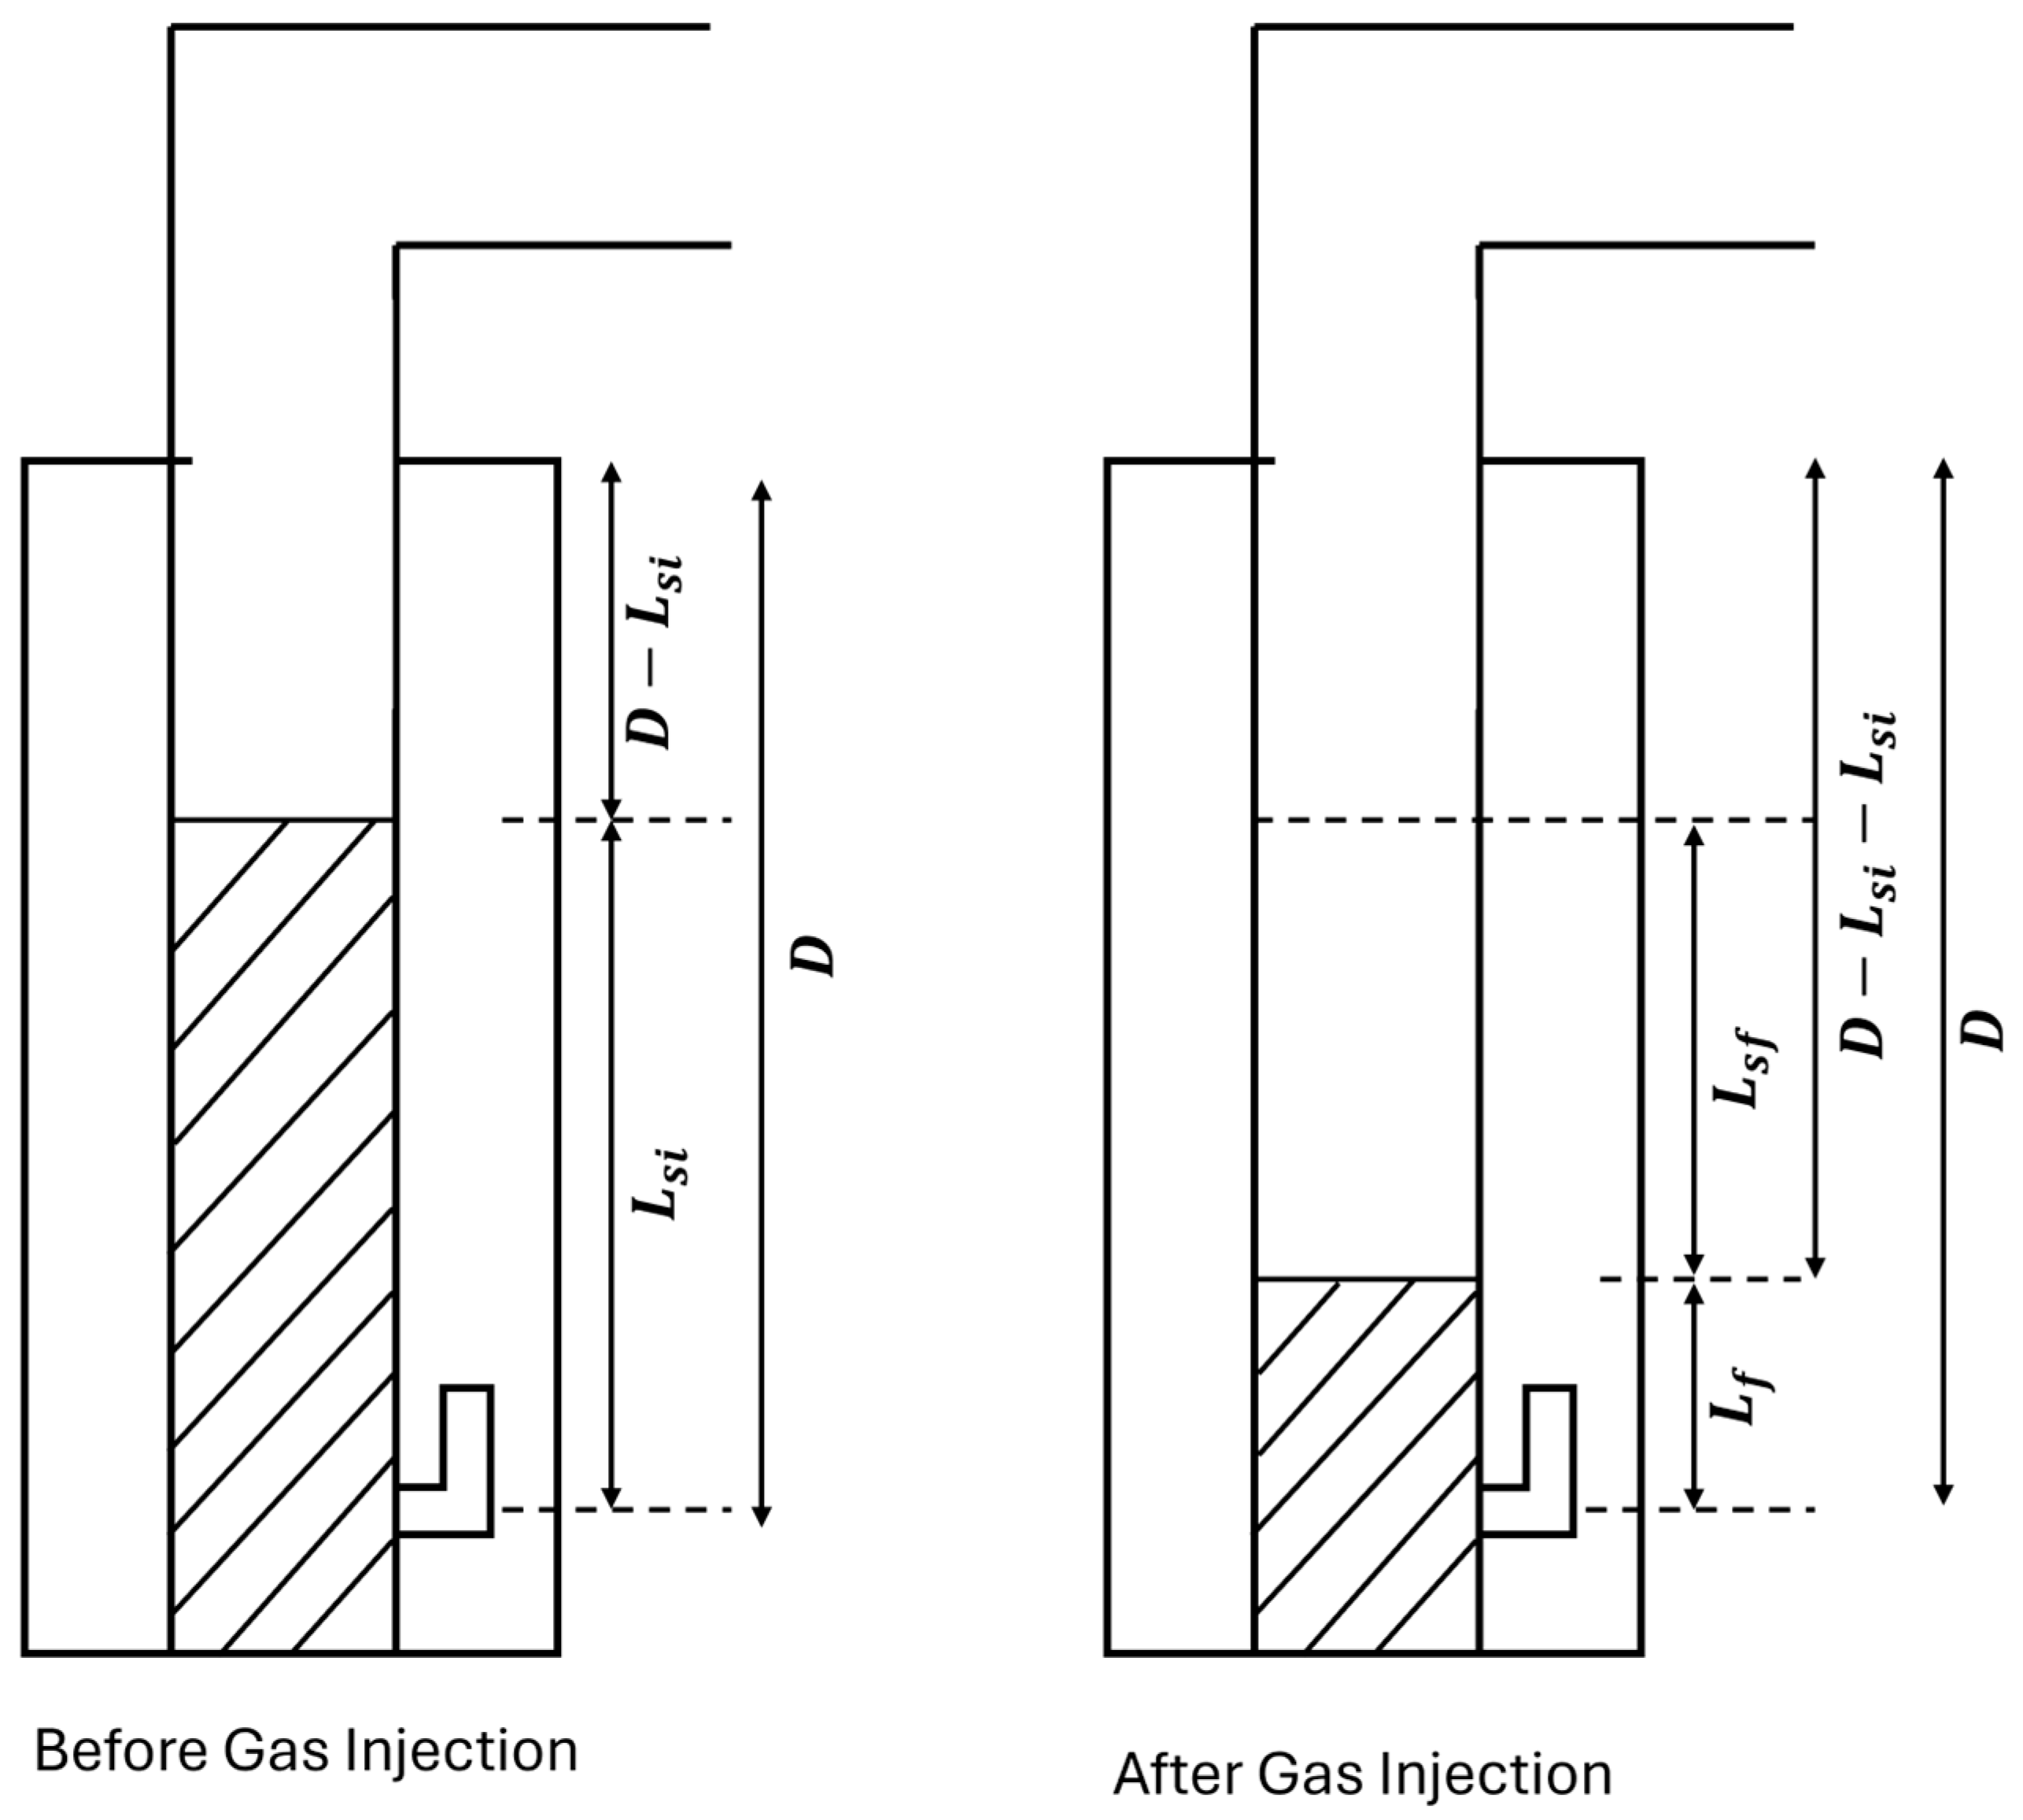
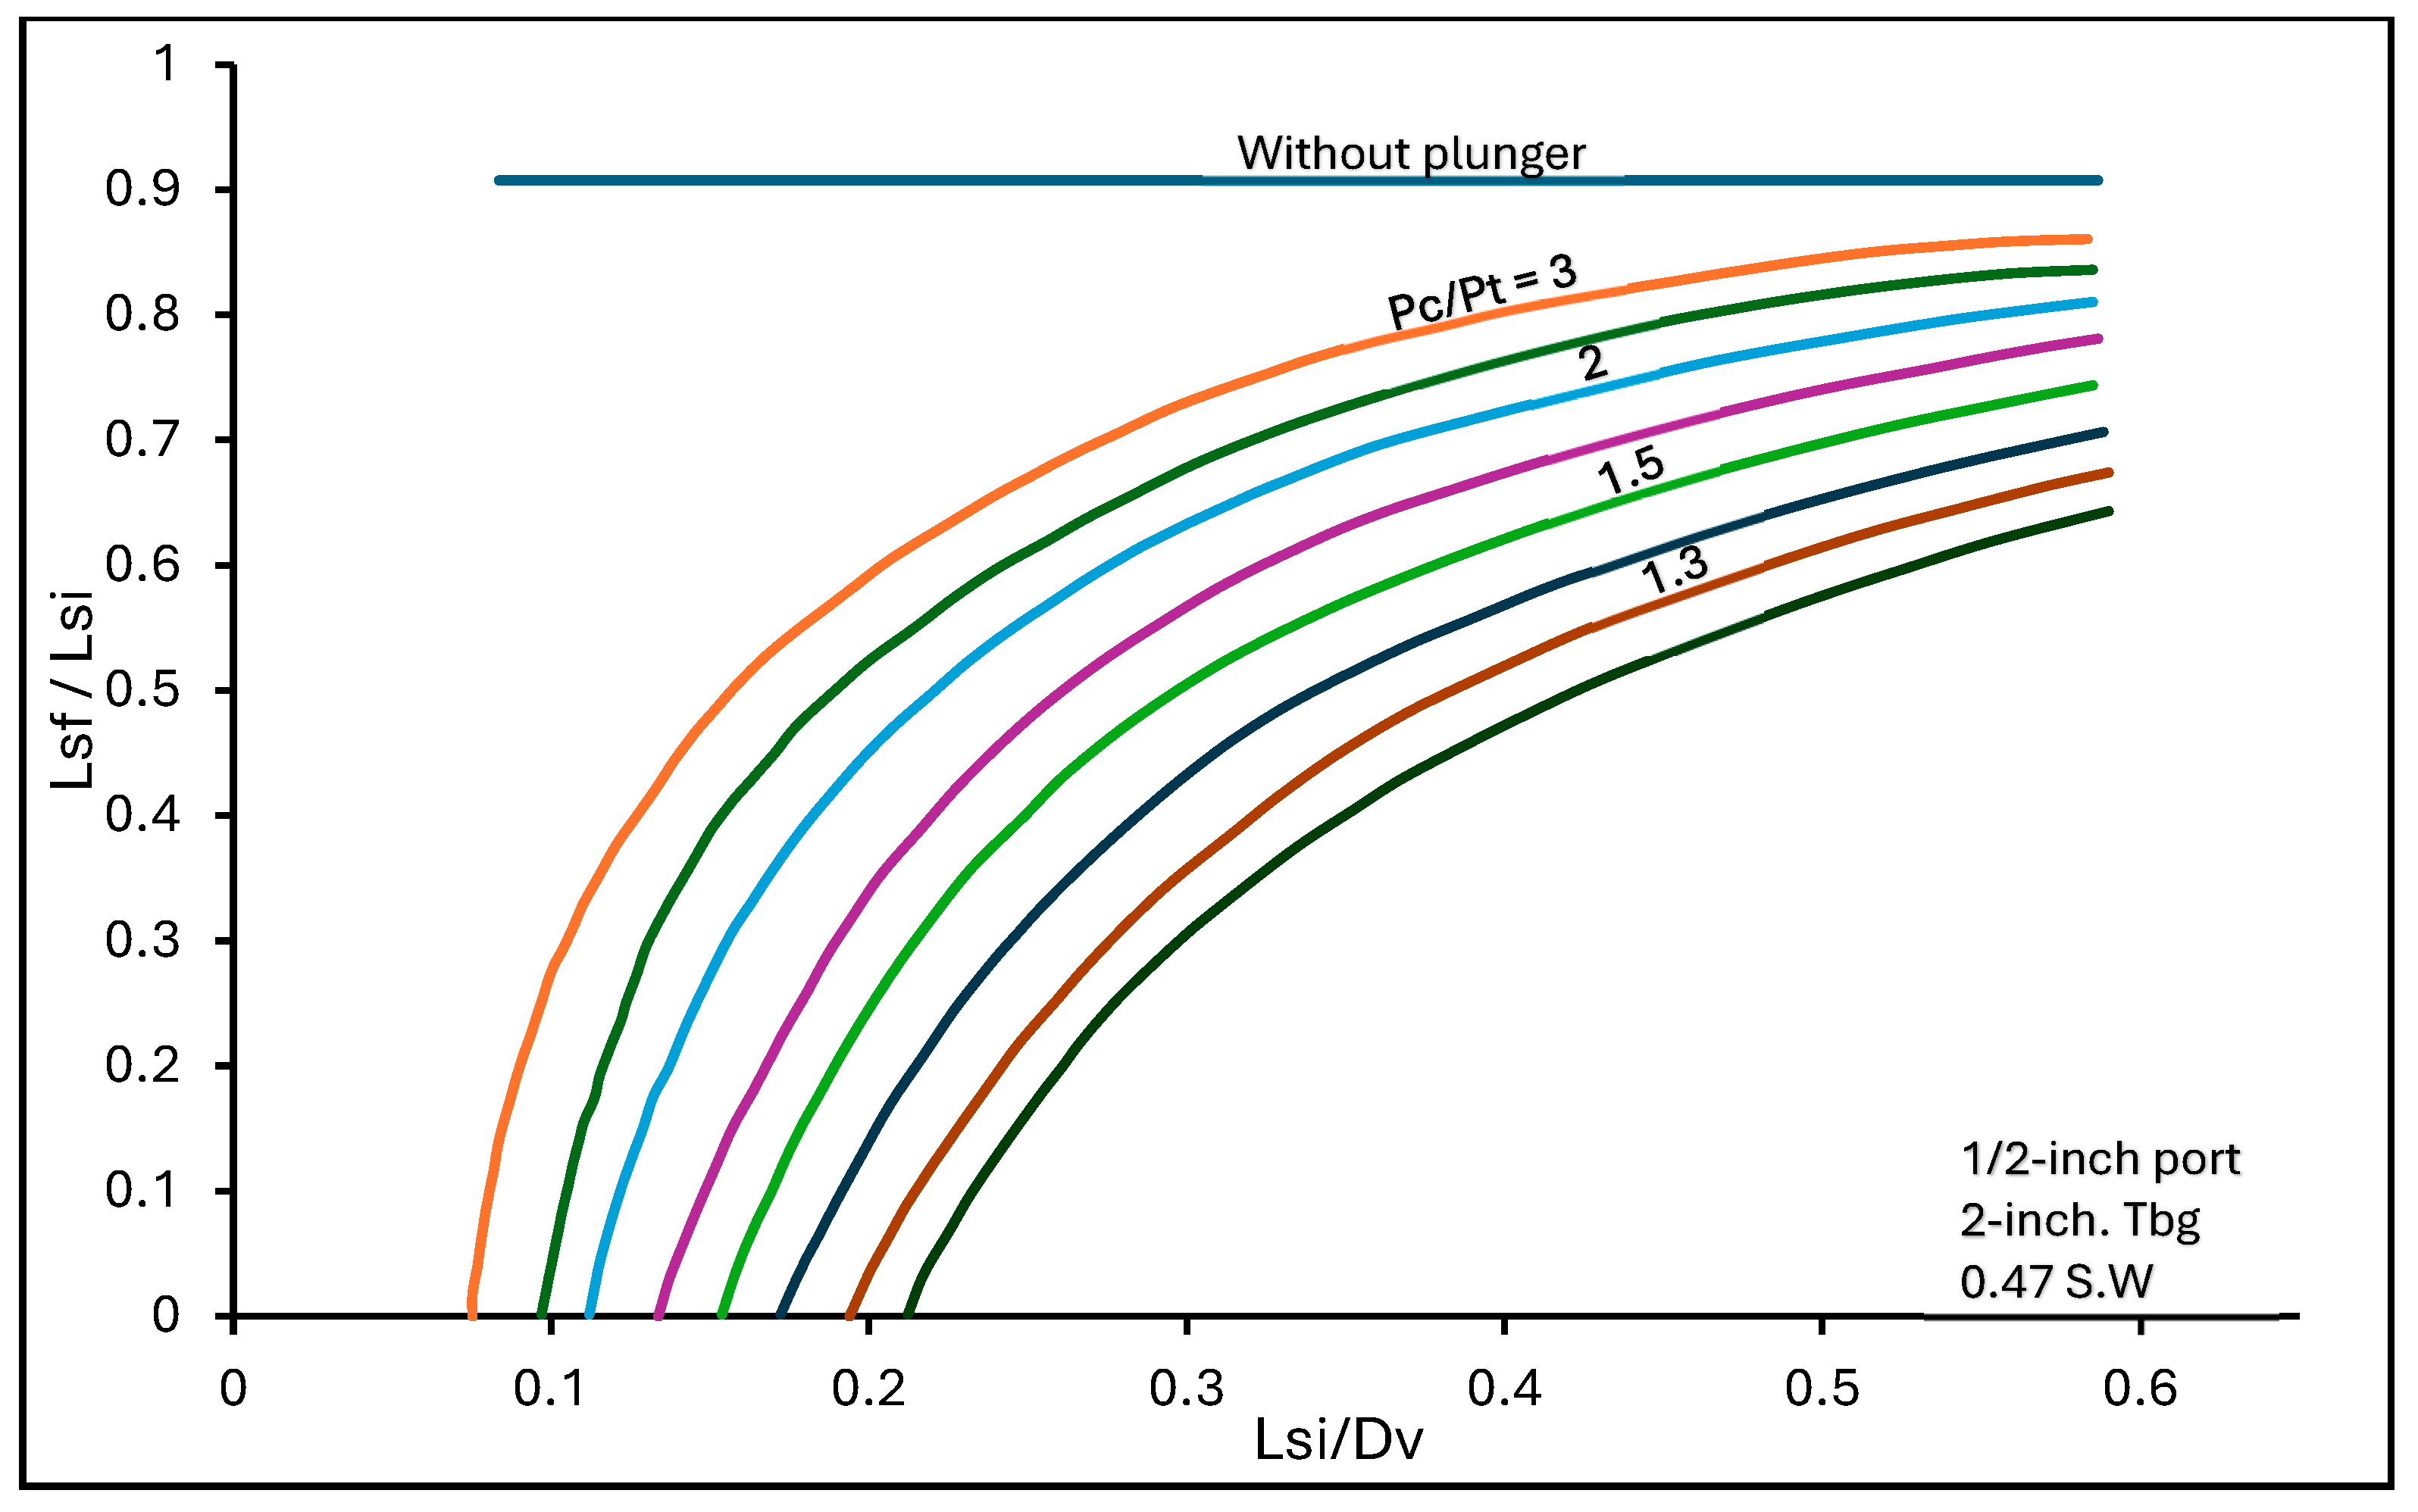
- is the fallback factor; is the initial length of the liquid slug; is the length of the produced liquid per cycle; is the depth of the gas lift valve.
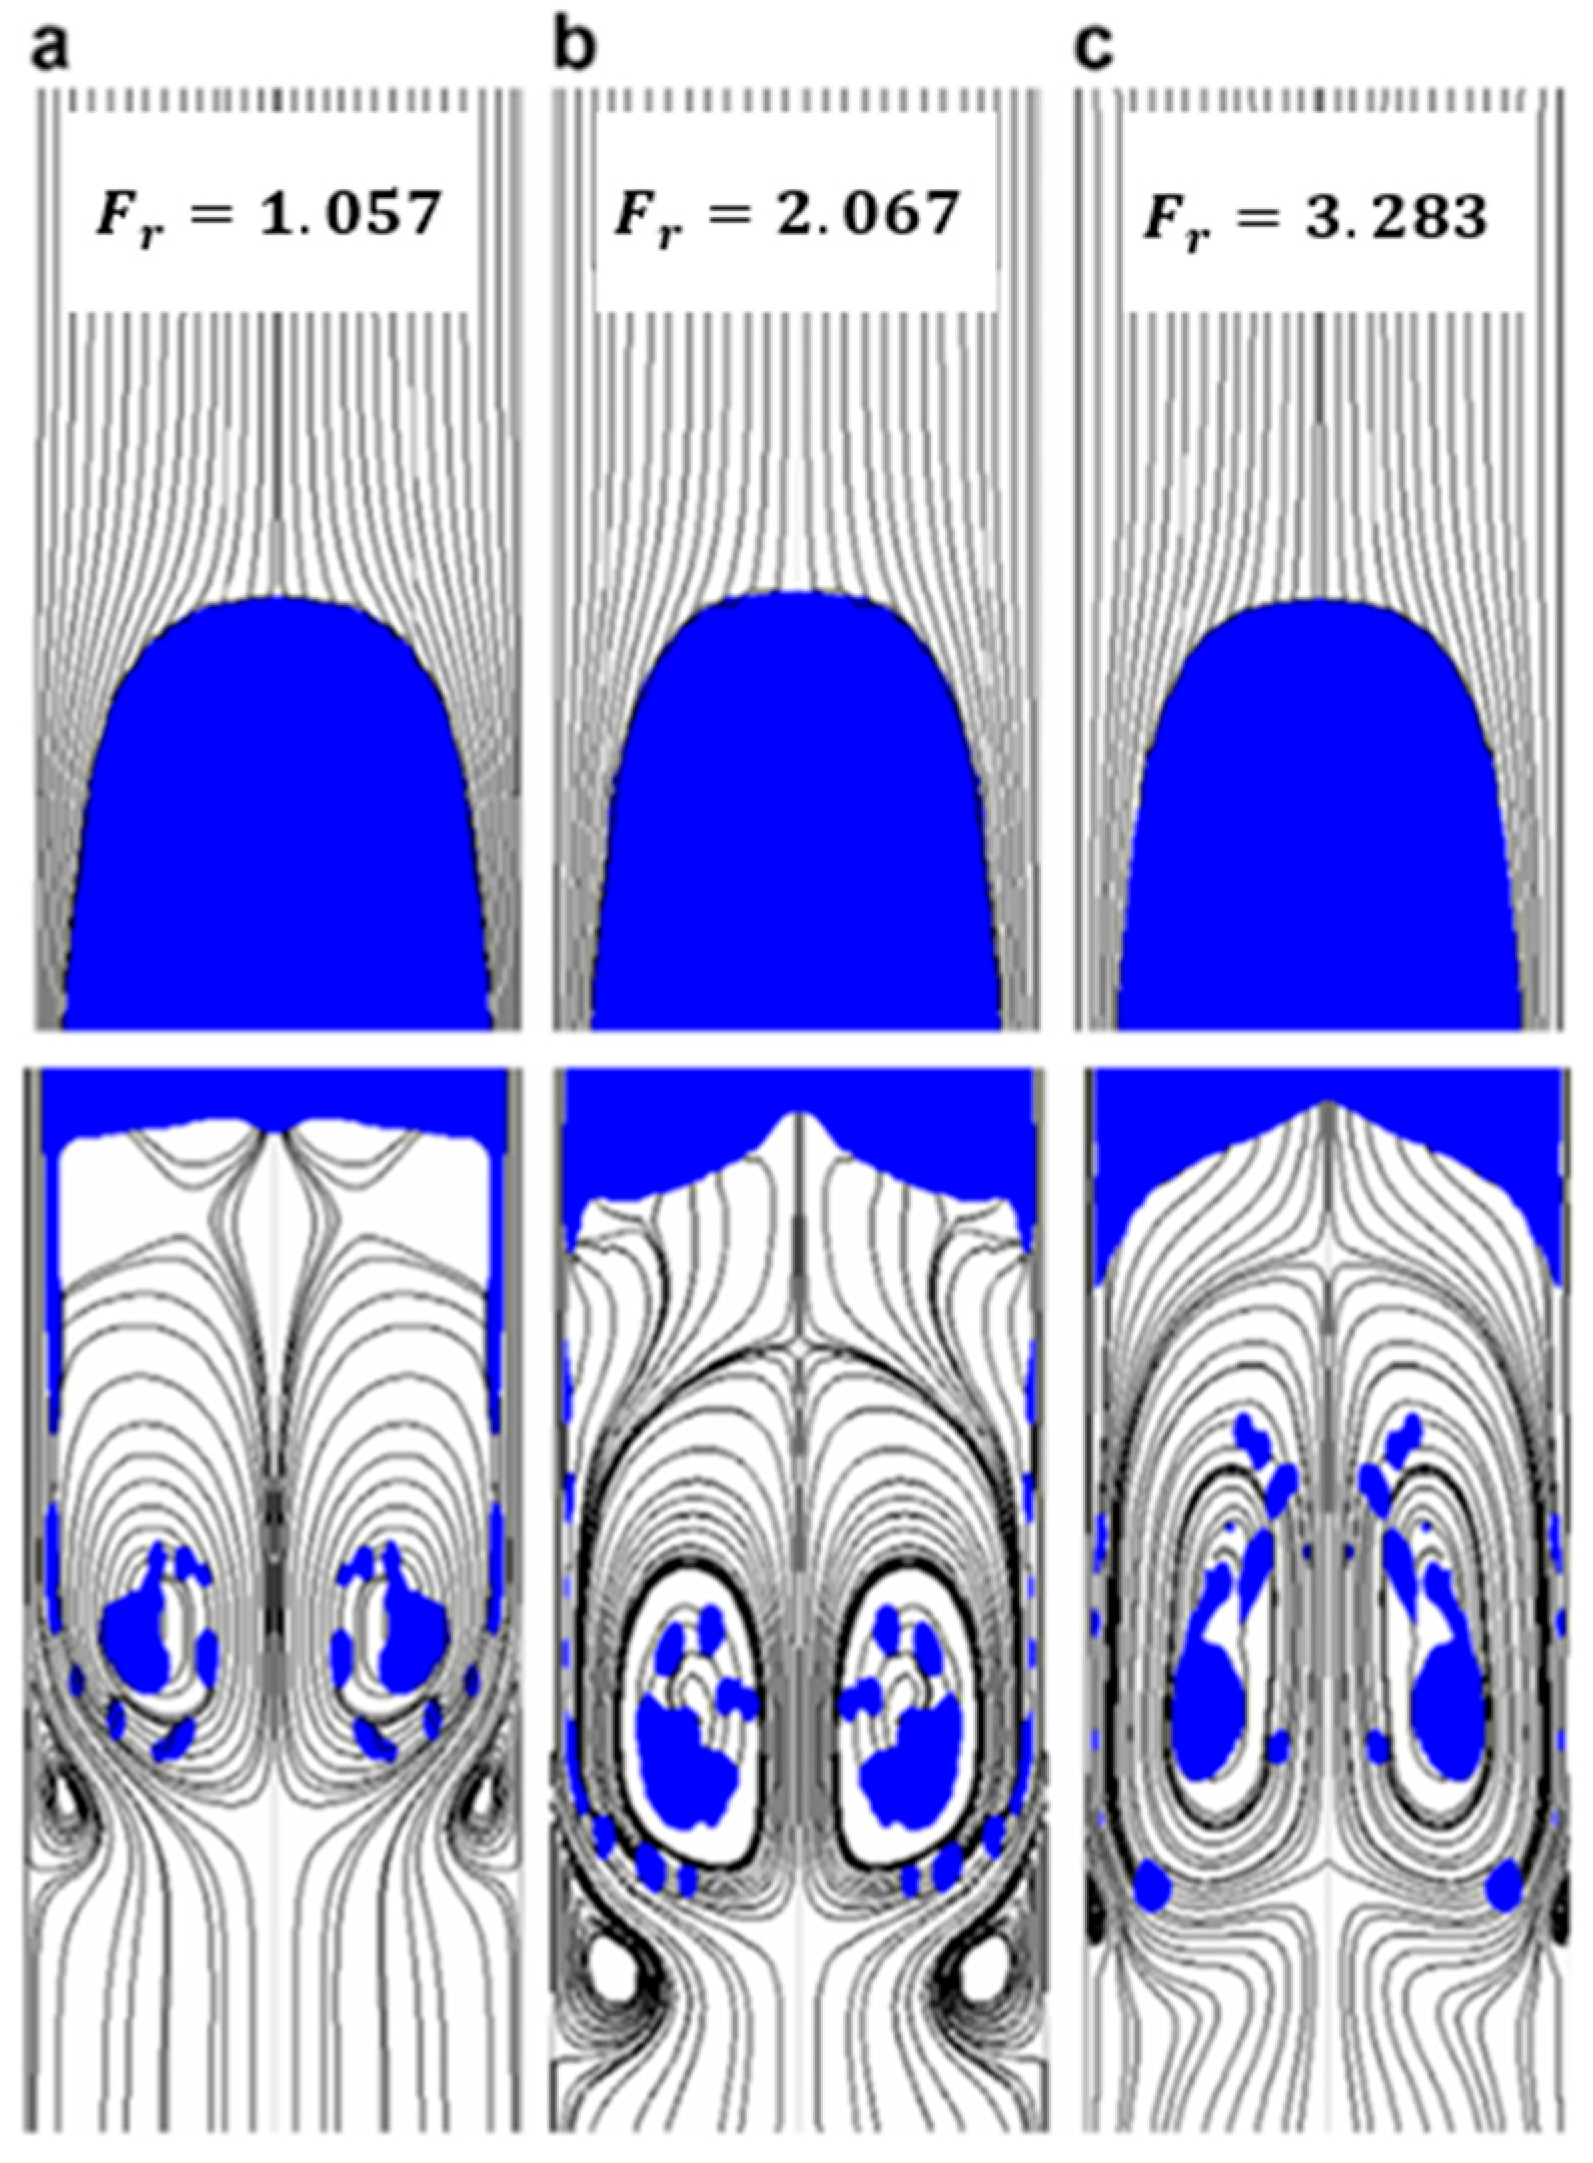
2.2. Numerical Studies on IGL and Fallback Factor
3. Gas Assisted Plunger Lift (GAPL) and Fallback Factor
3.1. Experimental Studies on GAPL and Fallback Factor
3.2. Numerical Studies on GAPL and Fallback Factor
4. Discussion
4.1. Comparison Between Experimental and Numerical Studies
4.2. Feasibility Analysis on Methods to Reduce Fallback Factor
5. Conclusions
- Surface restrictions such as chokes increase the fallback factor, and efforts should be made to eliminate surface restrictions and reduce the number of sharp bends at the surface [11].
- Higher percentages of recoveries are observed when the gas injection continues until the liquid slug reaches the surface [6].
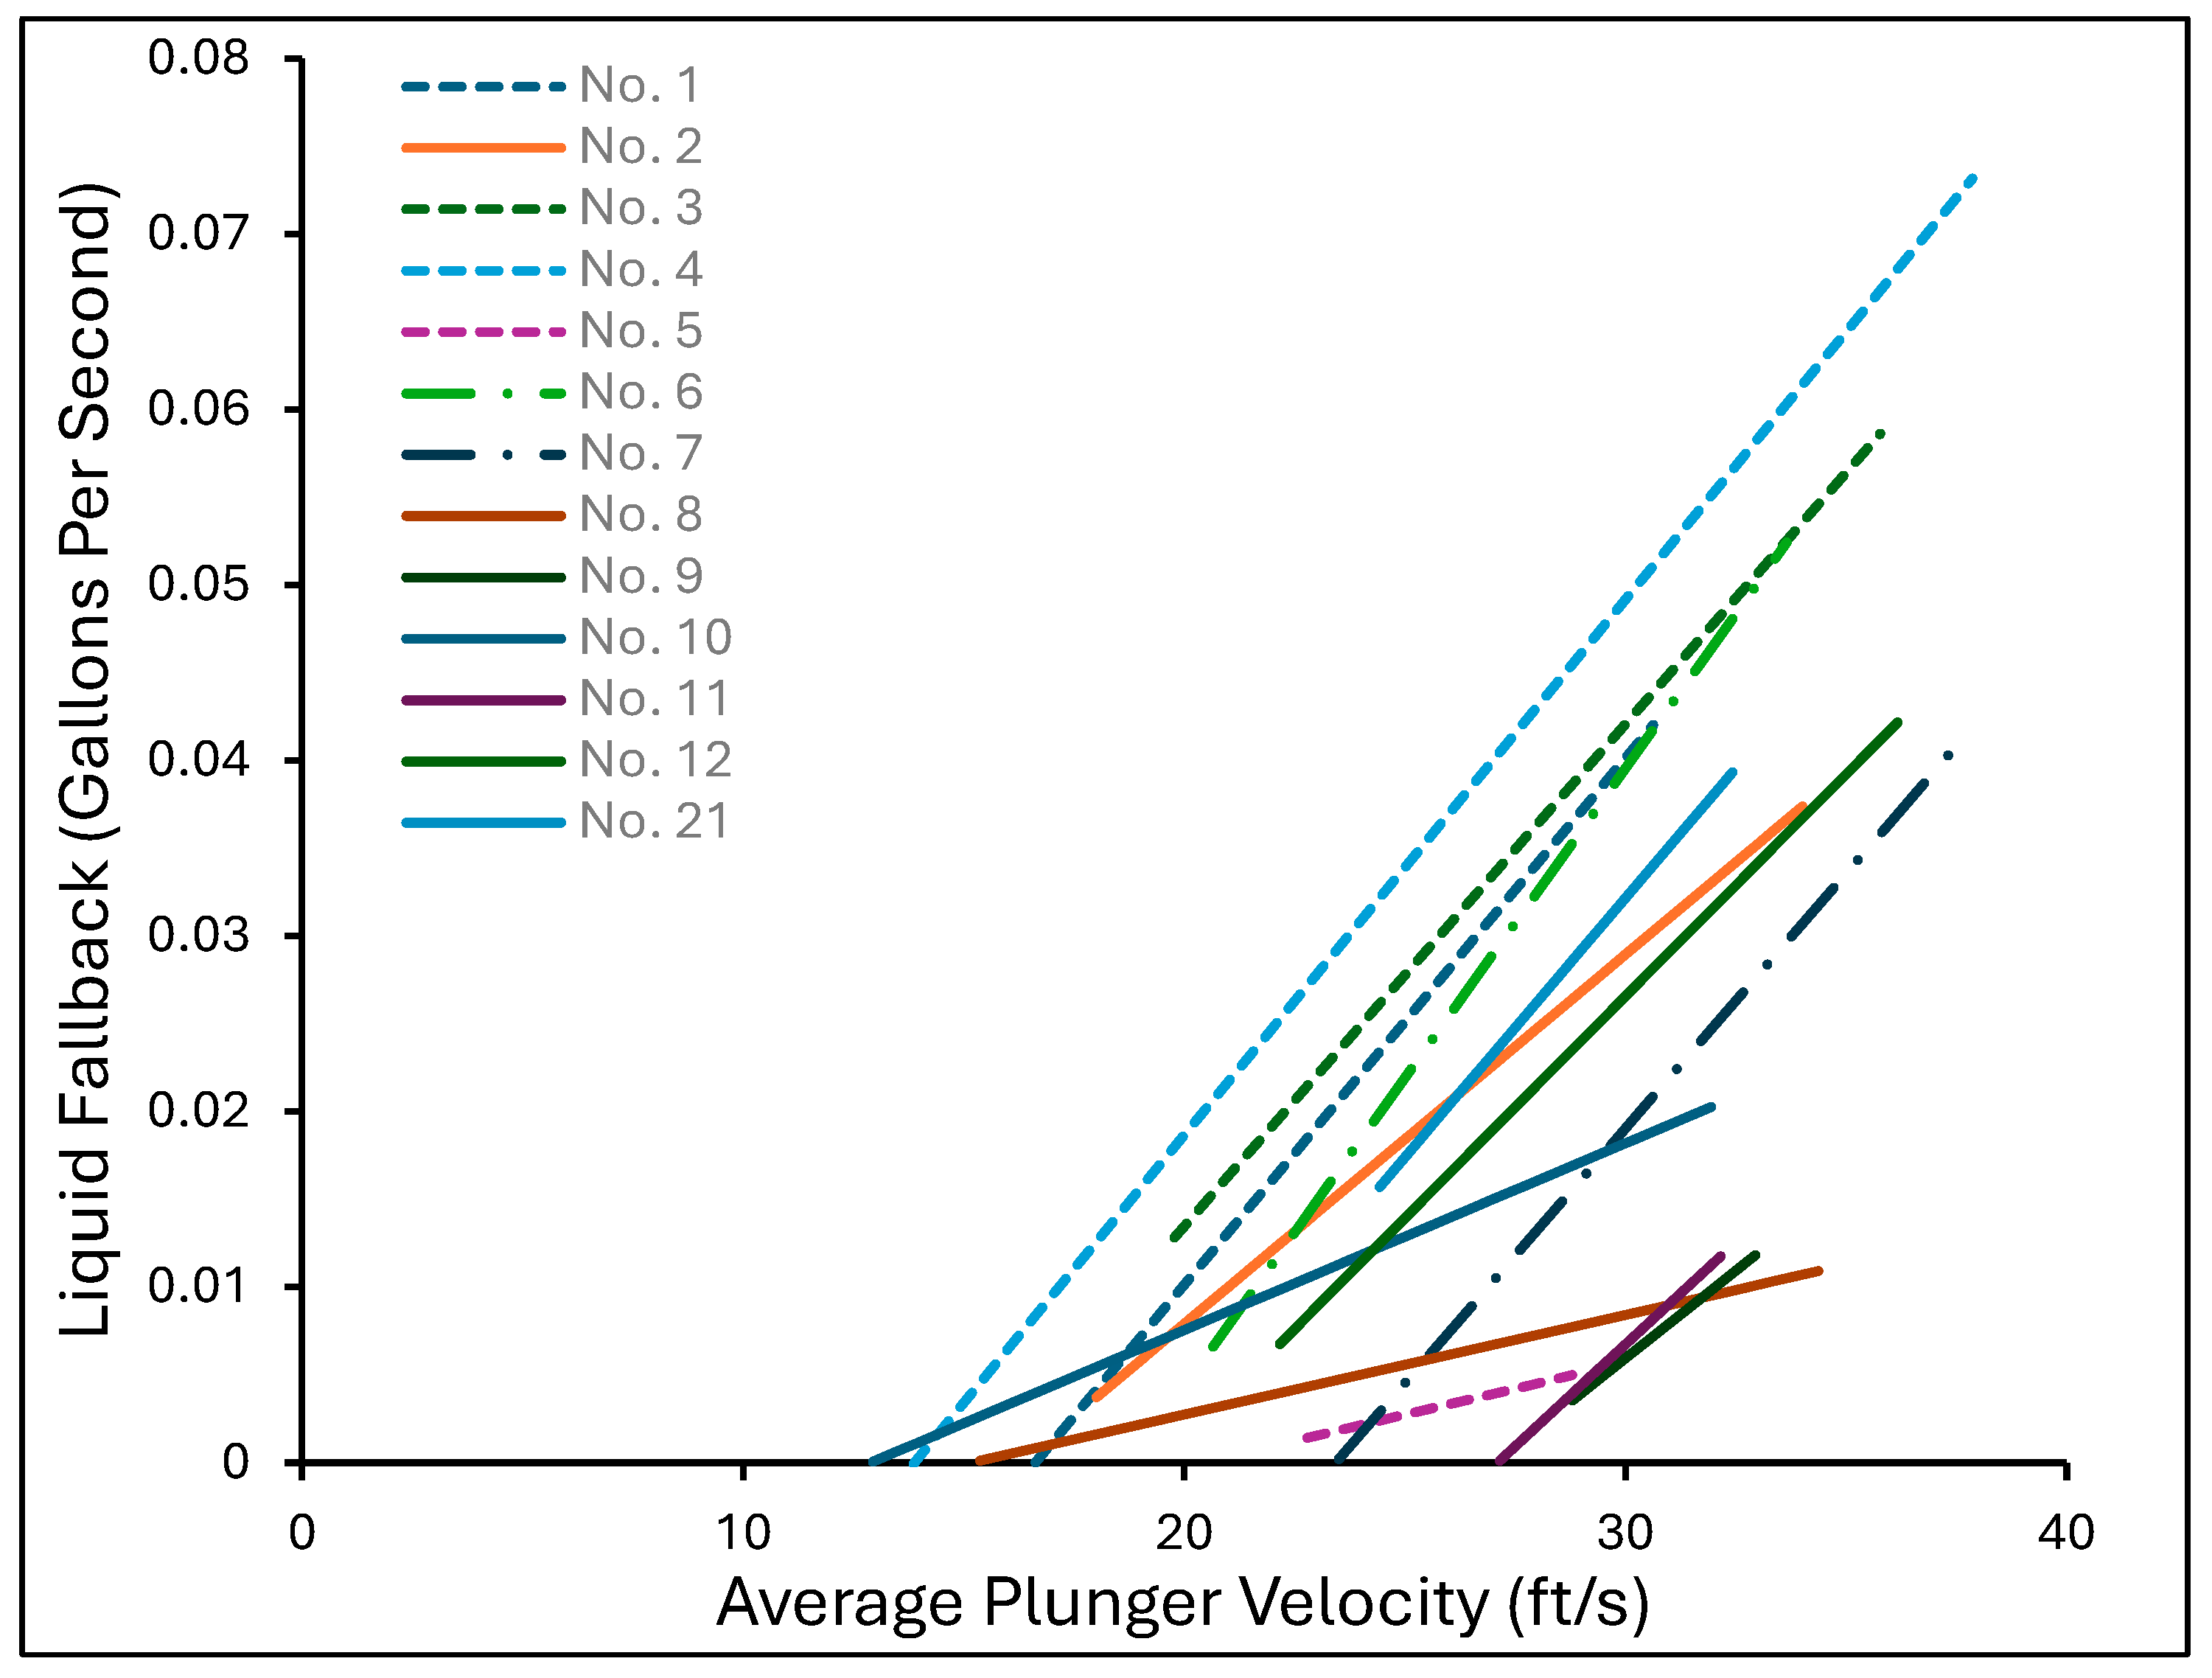
- Fallback factor decreases with increasing slug velocity [6].
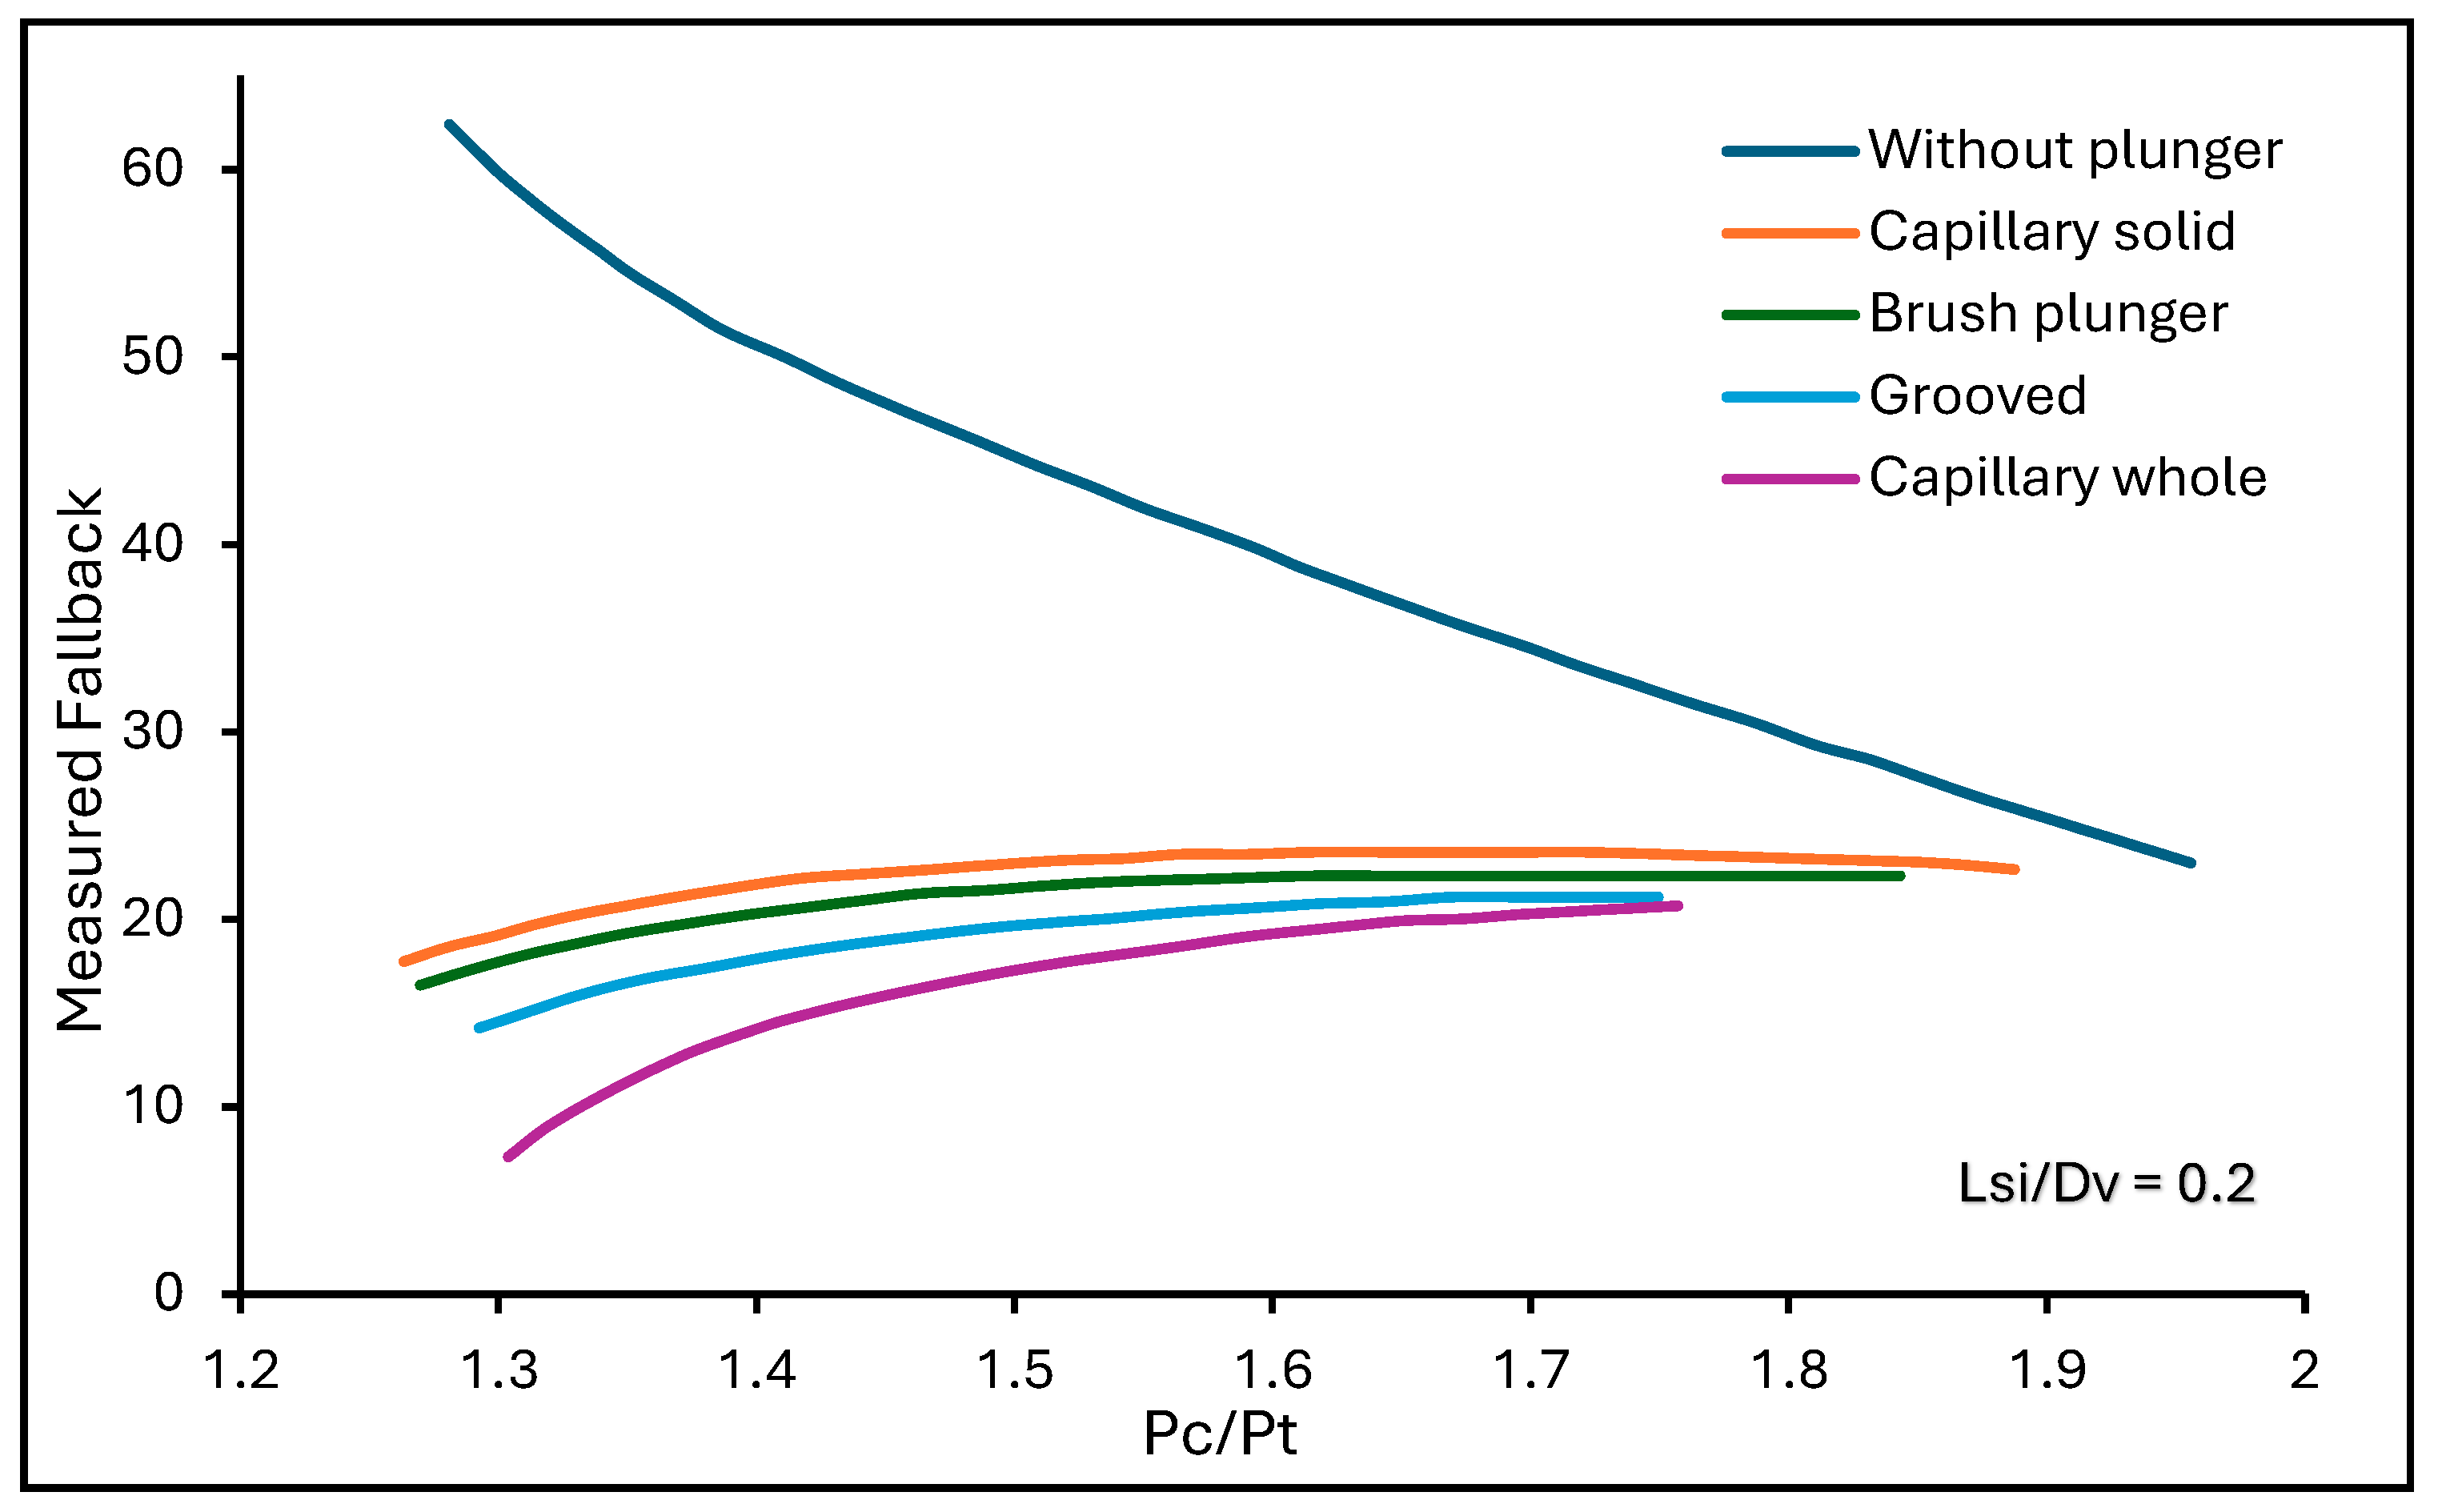
- Fallback factor decreases with increasing casing–tubing pressure ratio [12].
- Fallback factor increases with increase in viscosity [13].
- Fallback factor increases with increasing the diameter of the tubing for the same gas injection rate and volume [2].
- Employing GAPL minimizes the fallback factor by a significant amount compared to IGL. This is because the solid interface (plunger) reduces the gas penetration in the liquid slug at lower velocities [27].
- GAPL also reduces the injection gas requirement [27].
- Not only does GAPL minimize the fallback factor, but it also makes it possible to lift from deeper wells, which increases the life of artificial lift by delaying switching to rod pumping [8].
Author Contributions
Funding
Data Availability Statement
Acknowledgments
Conflicts of Interest
References
- Chacin, J.E. Selection of Optimum Intermittent Lift Scheme for Gas Lift Wells. In Proceedings of the University of Tulsa Centennial Petroleum Engineering Symposium, Tulsa, OK, USA, 29–31 August 1994; pp. 301–313. [Google Scholar]
- Carlson, O.; Bordalo, S.N. Experimental Study of the Dynamics and Stability of Intermittent Gas-Lift in a Laboratory Scale Model. In Proceedings of the Society of Petroleum Engineers—SPE Latin America and Caribbean Mature Fields Symposium, Salvador, Bahia, Brazil, 15–16 March 2017; pp. 6–8. [Google Scholar]
- Pittman, R.W. Gas Lift Design and Performance. In Proceedings of the International Petroleum Exhibition and Technical Symposium of the Society of Petroleum Engineers, Dallas, TX, USA, 18–26 March 1982; p. 1. [Google Scholar]
- Hernandez, A.; Luisana, M.; Gonzalo, G.; Miguel, M.; Sergio, C.; Oswaldo, R.; Intevep, S.A. Field Scale Research on Artificial Lift. In Proceedings of the Fifth Latin American and Caribbean Petroleum Engineering Conference and Exhibition, Rio de Janeiro, Brazil, 30 August–3 September 1997; pp. 2–7. [Google Scholar]
- Mantecon, J. Gas-Lift Optimisation on Barrow Island, Western Australia. In Proceedings of the SPE Asia Pacific Oil & Gas Conference & Exhibition, Singapore, 8–10 February 1993; pp. 237–242. [Google Scholar]
- Brill, J.P.; Doerr, T.C.; Aime, J.M.; Brown, K.E. An Analytical Description of Liquid Slug Flow in Small-Diameter Vertical Conduit. J. Pet. Technol. 1967, 19, 419–431. [Google Scholar] [CrossRef]
- Maggard, J.B.; Wattenbarger, R.; Scott, S.L. Texas A&M University Modeling Plunger Lift for Water Removal from Tight Gas Wells. In Proceedings of the SPE/CERI Gas Technology Symposium, Calgary, AB, Canada, 3–5 April 2000; pp. 2–6. [Google Scholar]
- Kannan, S.K.; Boyer, M.; Petroleum, A.; Yuan, G.; Lu, H.; Fai-Yengo, G. Modeling and Optimization of Gas-Assisted Plunger Lift GAPL by a Transient Simulator: A Case Study of a Permian Shale Well. In Proceedings of the SPE Eastern Regional Meeting, Charleston, WV, USA, 15–17 October 2019; pp. 2–13. [Google Scholar]
- Burns, M. Plunger-Assisted Gas Lift and Gas-Assisted Plunger Lift. In Proceedings of the SPE Artificial Lift Conference and Exhibition—Americas, The Woodlands, TX, USA, 28–30 August 2018; pp. 2–5. [Google Scholar]
- Winkler, H.W. The Application of Pressure and Temperature Surveys to Gas Lift Installations. In Proceedings of the Southwestern Petroleum Short Course, Lubbock, TX, USA, 23–24 April 1959; p. 49. [Google Scholar]
- Brown, K.; Jessen, F. Members AIME Evaluation of Valve Port Size, Surface Chokes and Fluid Fall-Back in Intermittent Gas-Lift Installations. J. Pet. Technol. 1962, 14, 315–322. [Google Scholar] [CrossRef]
- White, G.W.; O’connell, B.T.; Davis, R.C.; Berry, R.F.; Leon, A.; Stacha, A. An Analytical Concept of the Static and Dynamic Parameters Of Intermittent Gas Lift. J. Pet. Technol. 1963, 15, 301–307. [Google Scholar] [CrossRef]
- Hernandez, A.; Gasbarri, S.; Machado, M.; Marcano, L.; Manzanilla, R.; Guevara, J. Field-Scale Research on Intermittent Gas Lift. In Proceedings of the SPE Mid-Continent Operations Symposium, Oklahoma City, OK, USA, 28–31 March 1999; pp. 1–5. [Google Scholar]
- Doerr, T.C. Experimental Study of Liquid Loss in Intermittent Gas-Lift Systems; The University of Texas at Austin: Austin, TX, USA, 1972. [Google Scholar]
- Neely, A.B.; Montgomery, J.W.; Vogel, J. A Field Test and Analytical Study of Intermittent Gas Lift. Soc. Pet. Eng. J. 1974, 14, 502–511. [Google Scholar] [CrossRef]
- Schmidt, Z.; Of Tulsa, U.; Doty, D.R.; Lukong, P.B.; Of Tulsa, S.U.; Fernandez, O.F.; James, S.A.; Brill, P. Hydrodynamic Model for Intermittent Gas Lifting of Viscous Oil. J. Pet. Technol. 1984, 36, 475–484. [Google Scholar] [CrossRef]
- Hernandez, A.; Garcia, G.; Concho, A.M.; Garcia, R.; Navarro, U. Downhole Pressure and Temperature Survey Analysis for Wells on Intermittent Gas Lift. In Proceedings of the SPE International Petroleum Conference and Exhibition, Villahermosa, Mexico, 3–5 March 1998; pp. 205–212. [Google Scholar]
- Yadav, M.P.; Malhotra, S.K.; Kumar, A.; Devshali, S. Production Enhancement in Intermittent Gas Lift Wells Using Sweeping Pipe Bend-Successful Case Histories from Various Onshore Fields in India. In Proceedings of the Abu Dhabi International Petroleum Exhibition & Conference, Abu Dhabi, United Arab Emirates, 15–18 November 2021; pp. 4–7. [Google Scholar]
- Liao, T. Mechanistic Modeling of Intermittent Gas Lift. Ph.D Dissertation, The University of Tulsa, Tulsa, OK, USA, 1991. [Google Scholar]
- Pestana, T.; Bordalo, S.; Filho, A.B.; Brasileiro, P. Numerical Simulation in the Time Domain of the Intermittent Gas-Lift and Its Variants for Petroleum Wells. In Proceedings of the SPE Artificial Lift Conference-Americas, Cartagena, Colombia, 21–22 May 2013; pp. 2–6. [Google Scholar]
- Croce, D.; Zerpa, L. Mechanistic Model for the Design and Operation of an Intermittent Gas Lift System for Liquid Loaded Horizontal Gas Wells. In Proceedings of the SPE Annual Technical Conference and Exhibition, Dubai, United Arab Emirates, 21–23 September 2021; p. 3. [Google Scholar]
- White, E.T.; Beardmore, R.H. The Velocity of Rise of Single Cylindrical Air Bubbles through Liquids Contained in Vertical Tubes. Chem. Eng. Sci. 1961, 17, 351–361. [Google Scholar] [CrossRef]
- Zheng, D.; He, X.; Che, D. CFD Simulations of Hydrodynamic Characteristics in a Gas-Liquid Vertical Upward Slug Flow. Int. J. Heat Mass Transf. 2007, 50, 4151–4165. [Google Scholar] [CrossRef]
- Foss, D.L.; Gaul, R.B. Plunger-Lift Performance Criteria with Operating Experience-Ventura Avenue Field. In Proceedings of the Pacific Coast District, API Division of Production, Los Angeles, CA, USA, 2 May 1965; pp. 124–140. [Google Scholar]
- Hacksma, J. Users Guide to Predict Plunger Lift Performance. In Proceedings of the Southwestern Petroleum Short Course, Lubbock, TX, USA, 20–21 April 1972; pp. 109–118. [Google Scholar]
- Lea, J.F. Dynamic Analysis of Plunger Lift Operations. J. Pet. Technol. 1982, 34, 2617–2629. [Google Scholar] [CrossRef]
- White, G.W. Combine Gas Lift, Plungers to Increase Production Rate. World Oil 1982, 195, 69–74. [Google Scholar]
- Mower, L.N.; Lea, J.F.; Beauregard, E.; Ferguson, P.L. Defining the Characteristics and Performance of Gas-Lift Plungers. In Proceedings of the Annual Technical Conference and Exhibition of the Society of Petroleum Engineers, Las Vegas, NV, USA, 22–26 September 1985; pp. 1–12. [Google Scholar]
- Marcano, L.; Chacin, J. Mechanistic Design of Conventional Plunger-Lift Installation. In Proceedings of the Second Latin American Petroleum Engineering Conference, Caracas, Venezuela, 8 March 1992; pp. 15–24. [Google Scholar]
- Hernandez, A.; Maracano, L.; Caicedo, S.; Cabunaru, R.; Members, S.A. Liquid Fall-Back Measurements in Intermittent Gas Lift with Plunger. In Proceedings of the Annual Technical Conference and Exhibition of the Society of Petroleum Engineers, Houston, TX, USA, 3–6 October 1993; pp. 3–6. [Google Scholar]
- Baruzzi, J.O.A.; Alhanati, F.J.S. Optimum Plunger Lift Operation. In Proceedings of the Production Operations Symposium, Oklahoma City, OK, USA, 2–4 April 1995; pp. 117–131. [Google Scholar]
- Akhiiartdinov, A.; Pereyra, E.; Sarica, C. Experimental and Theoretical Analysis of a Pressure-Driven Logging Piston During the Liquid Displacement Process. Exp. Therm. Fluid Sci. 2020, 115, 110090. [Google Scholar] [CrossRef]
- Tan, X.; Deng, Y.; Luo, A.; Li, X.; Tian, W.; Li, X.; Liu, Y.; Zhou, C. Experimental and Numerical Simulation Research on Sealing Performance and Drainage Efficiency of Different Types of Plungers. Geoenergy Sci. Eng. 2023, 224, 211517. [Google Scholar] [CrossRef]
- Bello, O.; Falcone, G.; Xu, J.; Scott, S. Performance Evaluation of a Plunger Assisted Intermittent Gas Lift System. In Proceedings of the SPE Production and Operations Symposium, Oklahoma City, OK, USA, 27–29 March 2011; pp. 1–20. [Google Scholar]


| Author(s) | Experimental Setup | Review of Study | Findings | |||
|---|---|---|---|---|---|---|
| Depth | Tubing Diameter | Liquid | Gas | |||
| [10] | 5200 ft | 2-inch | Water | * | Fallback factor can be estimated from pressure survey. | Calculated the fallback of the well to be 63%. |
| [11] | 8000 ft | 2 3/8-inch | Water | * | Analysis of the effects of port sizes of gas lift valves and chokes on fallback factor. | Reduction in the number of surface chokes and 90-degree bends reduces the fallback factor. |
| [12] | 93 ft | ½, 3/4, 1, 1½ pipes, 2 3/8 OD, 2 7/8 OD, 2-inch ID | Fresh water, salt water, and oil | Air | Analytical model for fallback factor, based on depth of gas lift valve, slug velocity, and gas penetrating velocity. | The slug velocity reaches a constant value quickly after gas injection; there is no accurate method to estimate gas penetrating velocity. |
| [6] | 1500 ft | 1¼, 1½-inch Nominal pipe | Water and oil | * | A conceptual model for IGL and an empirical fallback correlation for different slug lengths. | The developed empirical fallback correlation is unique for different slugs and tubing sizes. |
| [15] | 5000 ft | Water | * | Fallback model that accounts for liquid afterflow. | The fallback factor can be computed from the average gas velocity below the slug and continuous flow correlations. | |
| [16] | 60 ft | 3-inch | Oil | Air | Proposed a hydrodynamic model for IGL and observed a significant portion of the produced liquid could be due to afterflow. | The fallback factor increases as gas injection pressure increases. |
| [4] | 8000 ft | 3½ in | 32 oAPI oil | * | Study of the behavior of fallback factor and some operational parameters. | For a particular separator pressure, the fallback factor decreases with an increase in injection gas volume per cycle. |
| [17] | - | - | - | - | Relevance of temperature and pressure surveys on IGL | Proposed a formula for fallback factor based on length of slug. |
| [13] | 8000 ft | 2 7/8 in | 23 oAPI oil, 15 oAPI oil, and water | * | Study the behavior of the fallback factor on operational parameters at conditions like an IGL well in Lake Maracaibo. | Fallback factor decreases with increasing injection gas volume per cycle. |
| [2] | 49 ft | 1, 1½ and 2-inch | Water | Air | The behavior of the fallback factor as a function of operational parameters. | Fallback factor increases with diameter; fallback factor decreases with increase in injection gas volume; and fallback decreases with increase in rate of gas injection for a constant tubing size. |
| [18] | - | - | - | - | Recommended that a sweeping pipe bend be used at the Christmas tree to minimize fallback factor. | Recorded about a 20% average increase in production after implementing the idea on three wells. |
| Author(s) | Fallback Formula | Definition of Variables |
|---|---|---|
| [10] | = Liquid fallback = Initial volume of slug = Final volume of slug | |
| [12] | = Liquid fallback = Depth of valve = Slug velocity = Bubble penetrating velocity | |
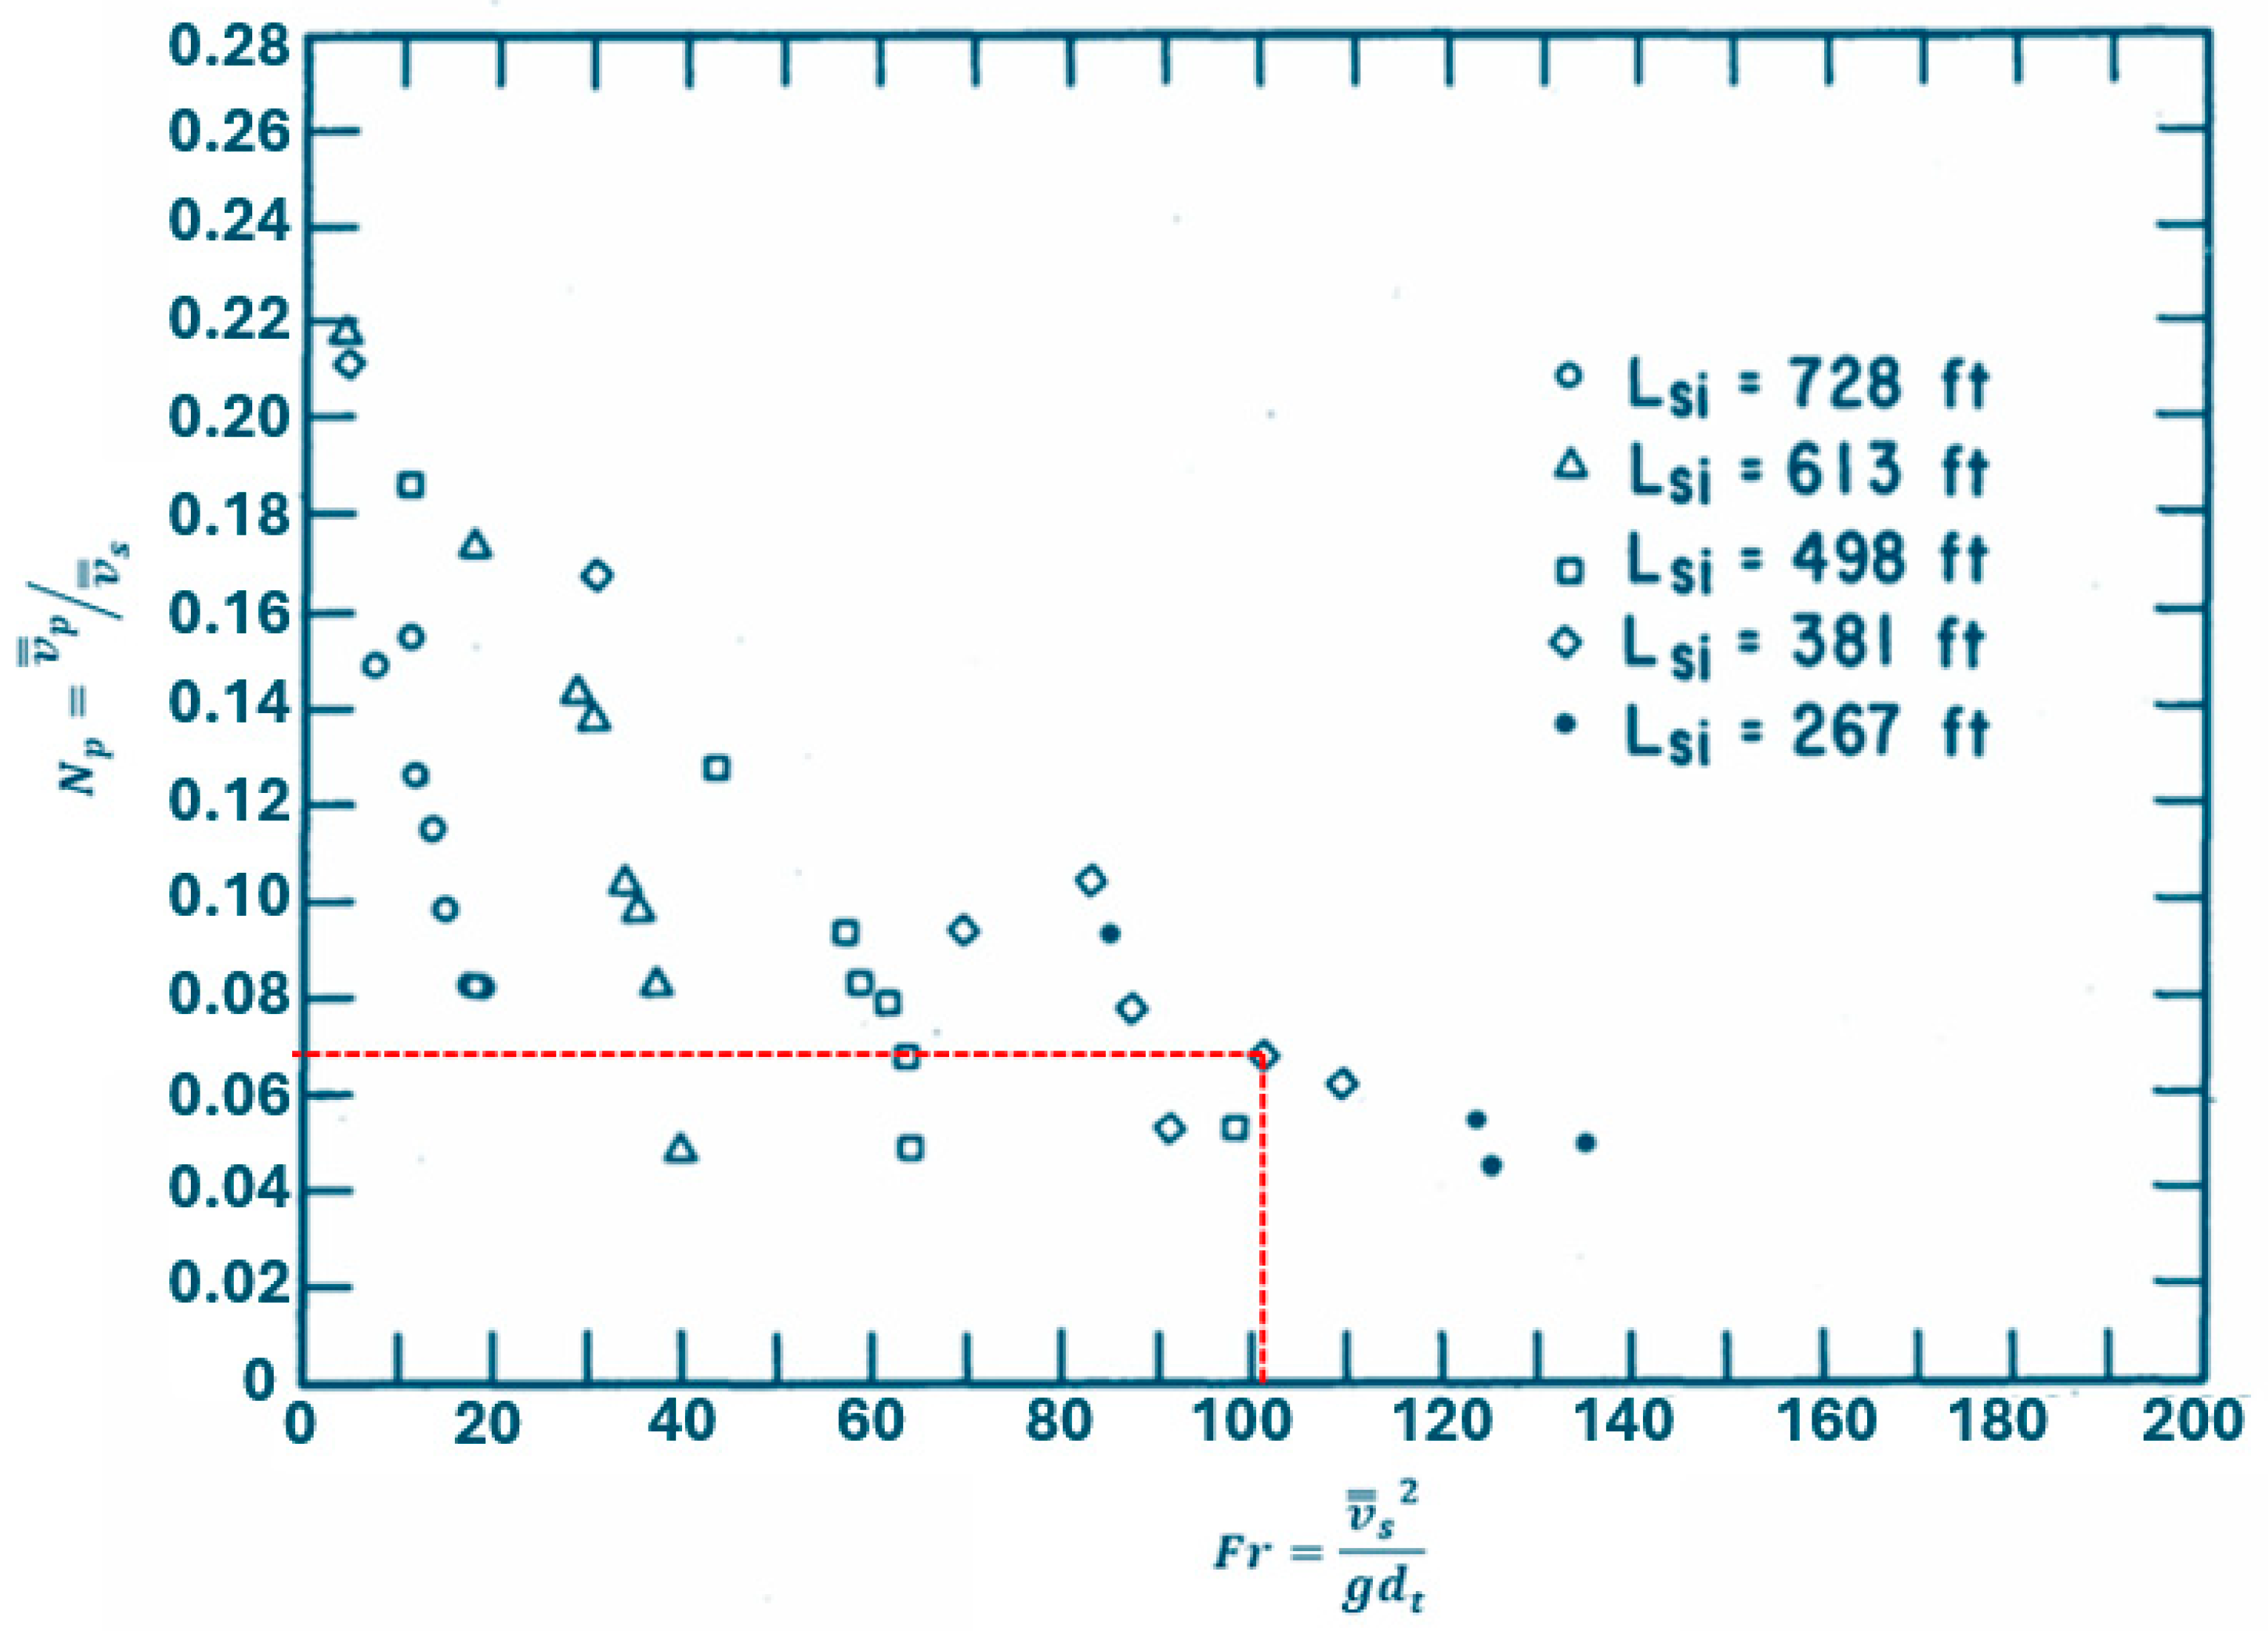
| [6] | = Fallback number (dimensionless) = Time-average penetrating velocity of gas = Time-average slug velocity | |
| [4] | = Liquid fallback = Initial length of slug = Final length of slug | |
| [2] | = Liquid fallback = Initial mass of slug = Final mass of slug |
| Author(s) | Review of Study | Conclusion |
|---|---|---|
| [19] | Mechanistic model for IGL and how the gas penetrating velocity affects the fallback factor. | Increasing the slip velocity coefficient increases the fallback factor. |
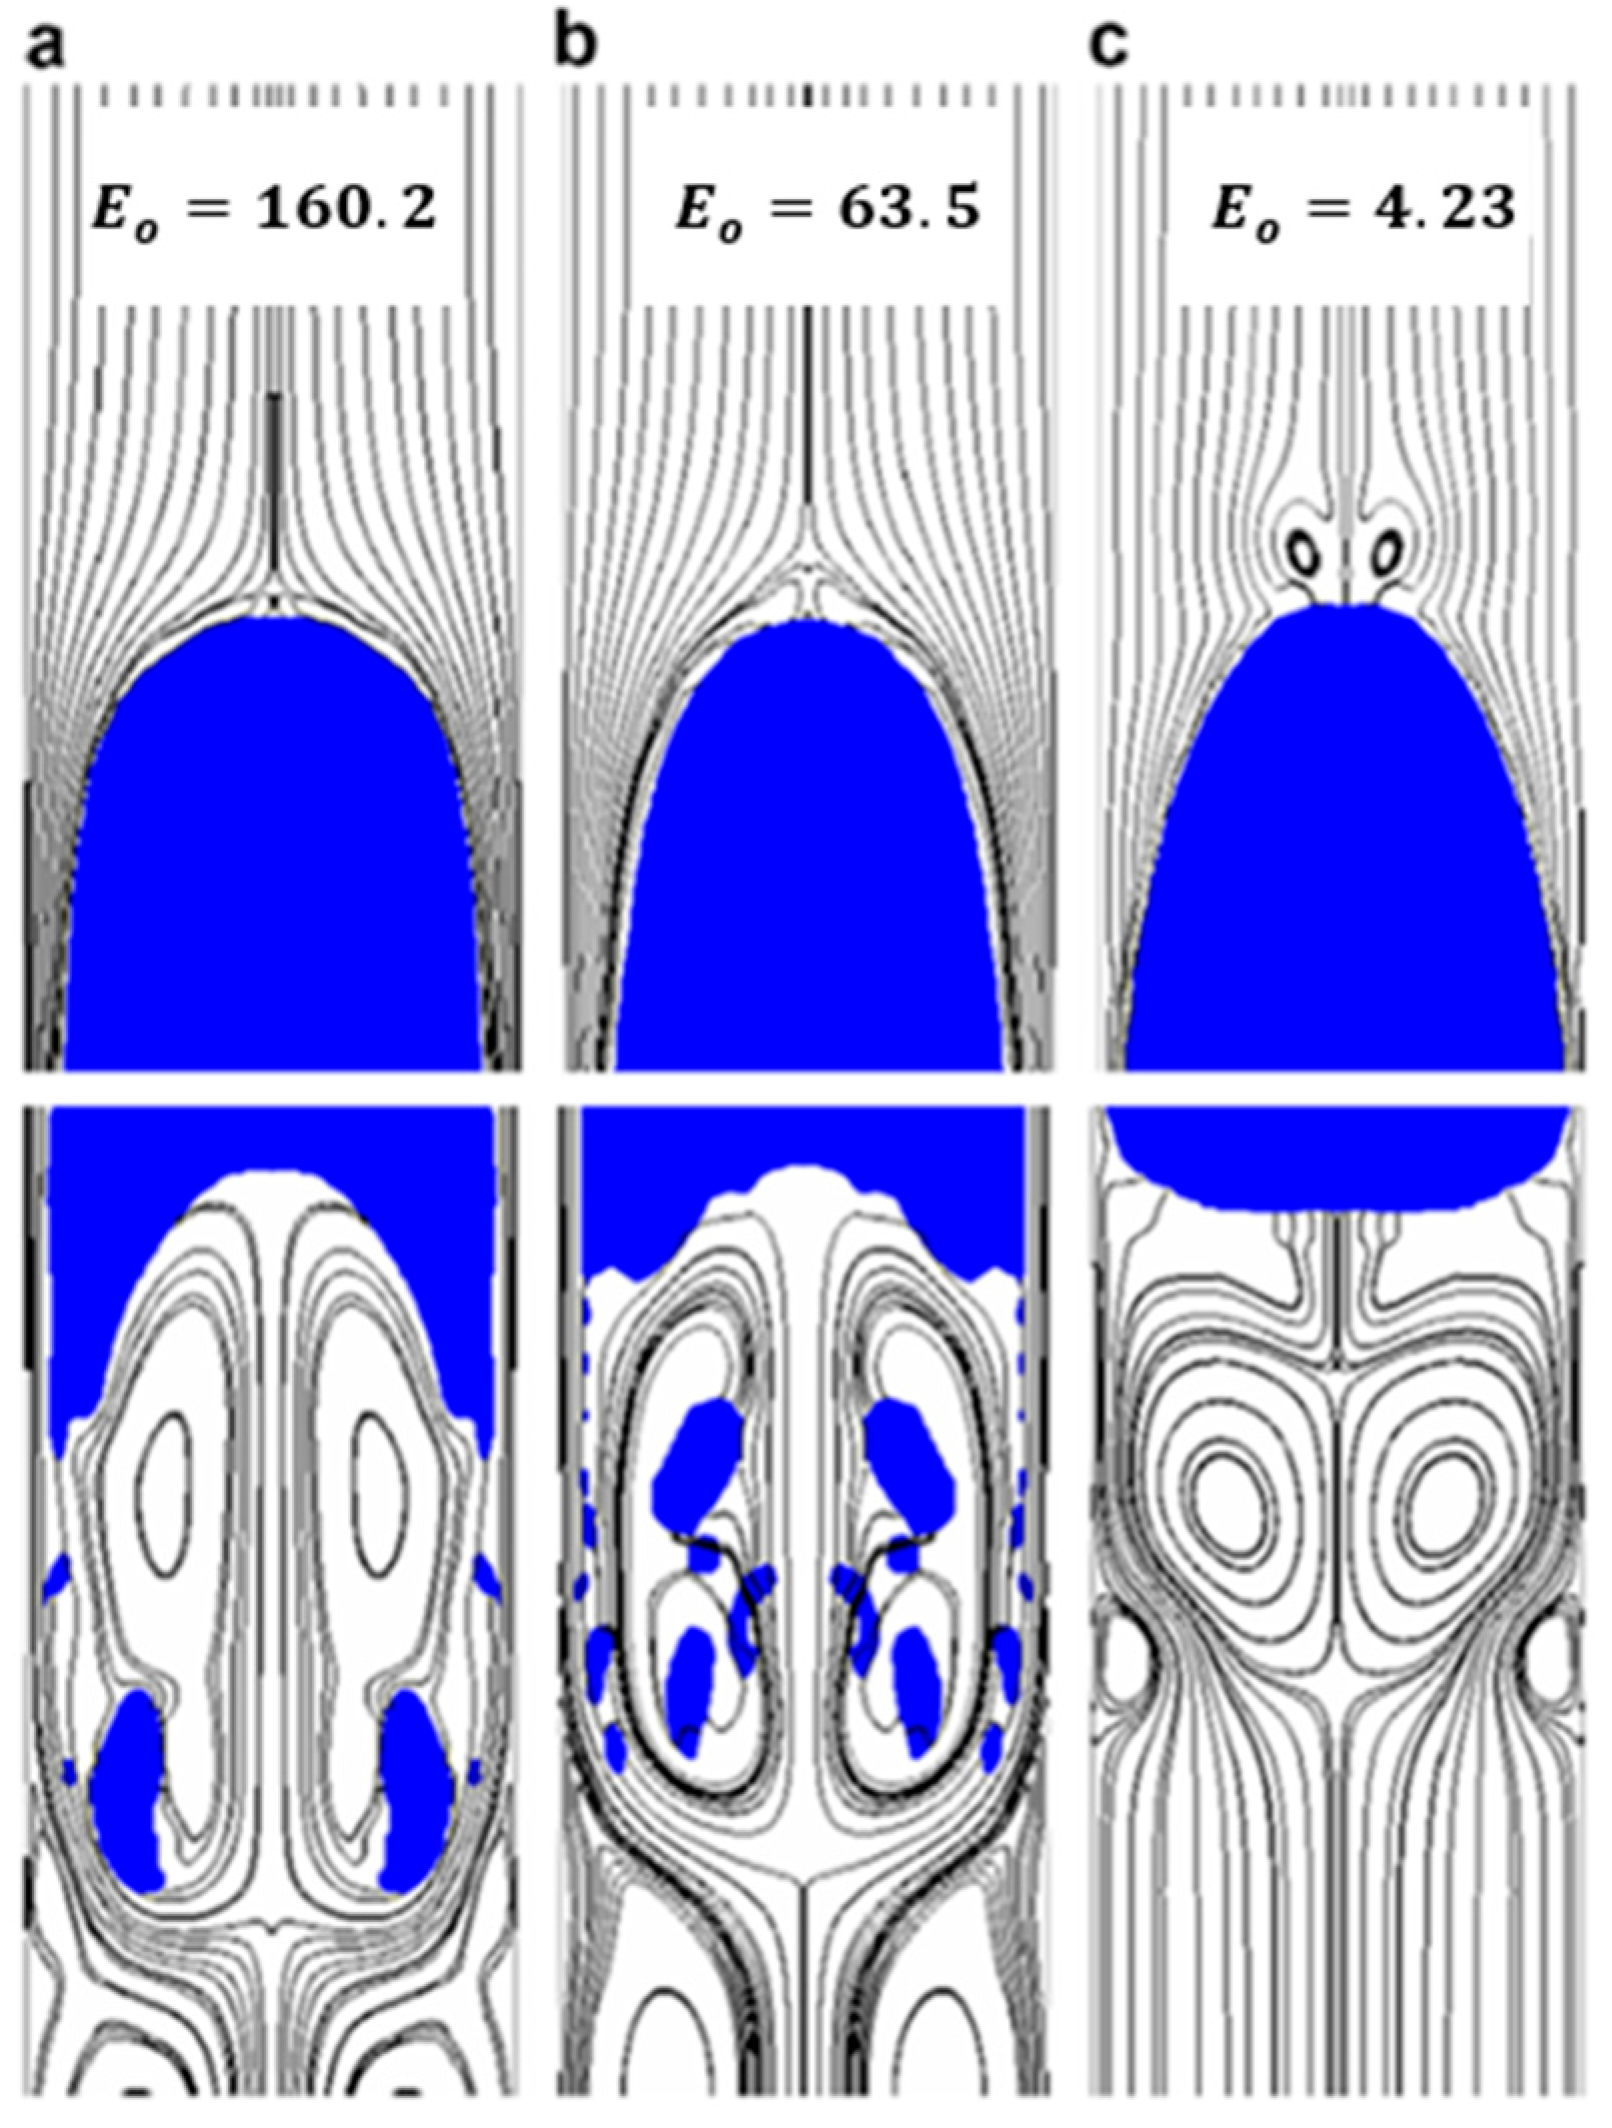
| [23] | CFD to model the shape of the Taylor bubble related to Froude, Eotvos, and viscosity numbers. | The lifting efficiency of the Taylor bubble depends on the shape of the Taylor bubble formed. |
| [20] | Numerical simulation to predict production, fallback, and amount of gas consumed for a given well. | The velocity of the gas during the decompression stage of the IGL cycle strongly influences the fallback factor. |
| Author(s) | Experimental Setup | Review of the Study | Findings | |||
|---|---|---|---|---|---|---|
| Depth | Tubing Diameter | Liquid | Gas | |||
| [24] | - | - | - | - | Development of a force balance on plunger conditions that gives the lowest casing head pressure to propel a plunger and a slug load. | Assumed constant plunger rise and fall velocities to predict the cycle of the plunger and production amounts for a continuous cycle. |
| [25] | - | - | - | - | Estimation of the minimum GLR for plunger lift and optimum GLR that gives maximum production. | Plunger-lifted wells with gas available to propel represent the optimum cycle. |
| [26] | 700 ft | 2-inch ID | Water | Estimation of the velocity of the plunger and liquid slug during upward travel. | Plunger rise velocities are not constant. | |
| [27] | * | * | * | * | Study of fallback factor with and without a plunger. | The fallback factor was vastly reduced by the use of a plunger. |
| [28] | 735 ft | 2 3/8 in | Water | Air | Modification of the model by Foss and Gaul to include fallback factor and gas slippage. | The fallback factor increases with an increase in average plunger velocity. |
| [30] | 63 ft | 2 3/8 in | Water | Air | Study of the behavior of fallback factor as a function of injection pressure. | Fallback factor increases with an increase in average plunger velocity. |
| [5] | - | - | - | - | A study to optimize gas lift performance in Barrow Island. | Increase in oil production by about 19% and 20 MCFD decrease in gas injection in one of the two wells selected for GAPL. |
| [31] | 1.3 m | 45 mm ID | Water | Air | A small-scale experiment to analyze plunger lift performance. |
|
| [32] | 35 ft | 2-inch | Mineral oil | Air | Comparing experimental and theoretical analysis of plunger lift using a pressure-driven plunger. |
|
| [33] | 24 m | 43.4 mm | Water | Air | Plunger lifting efficency based on the clearance between the plunger and the tubing wall. |
|
Disclaimer/Publisher’s Note: The statements, opinions and data contained in all publications are solely those of the individual author(s) and contributor(s) and not of MDPI and/or the editor(s). MDPI and/or the editor(s) disclaim responsibility for any injury to people or property resulting from any ideas, methods, instructions or products referred to in the content. |
© 2025 by the authors. Licensee MDPI, Basel, Switzerland. This article is an open access article distributed under the terms and conditions of the Creative Commons Attribution (CC BY) license (https://creativecommons.org/licenses/by/4.0/).
Share and Cite
Mensah, E.; Leggett, S. A Review on the Impact of Fallback Factor on Intermittent Gas and Gas-Assisted Plunger Lifts. Geosciences 2025, 15, 237. https://doi.org/10.3390/geosciences15070237
Mensah E, Leggett S. A Review on the Impact of Fallback Factor on Intermittent Gas and Gas-Assisted Plunger Lifts. Geosciences. 2025; 15(7):237. https://doi.org/10.3390/geosciences15070237
Chicago/Turabian StyleMensah, Erasmus, and Smith Leggett. 2025. "A Review on the Impact of Fallback Factor on Intermittent Gas and Gas-Assisted Plunger Lifts" Geosciences 15, no. 7: 237. https://doi.org/10.3390/geosciences15070237
APA StyleMensah, E., & Leggett, S. (2025). A Review on the Impact of Fallback Factor on Intermittent Gas and Gas-Assisted Plunger Lifts. Geosciences, 15(7), 237. https://doi.org/10.3390/geosciences15070237