Article

Prestack Depth Migration Imaging of Permafrost Zone with Low Seismic Signal–Noise Ratio Based on Common-Reflection-Surface (CRS) Stack

1
Chinese Academy of Geological Sciences, Beijing 100037, China
2
Key Laboratory of Coal Resources Exploration and Comprehensive Utilization, Ministry of Natural Resources, Xi’an 710021, China
3
Physical Exploration and Survey Team, Shaanxi Coalfield Geological Bureau, Xi’an 710005, China
*
Author to whom correspondence should be addressed.
Geosciences 2025, 15(8), 276; https://doi.org/10.3390/geosciences15080276
Submission received: 28 April 2025 / Revised: 29 June 2025 / Accepted: 7 July 2025 / Published: 22 July 2025
(This article belongs to the Section Geophysics)

Abstract

The Qiangtang Basin (Tibetan Plateau) poses significant geophysical challenges for seismic exploration due to near-surface widespread permafrost and steeply dipping Mesozoic strata induced by the Cenozoic Indo-Eurasian collision. These seismic geological conditions considerably contribute to lower signal-to-noise ratios (SNRs) with complex wavefields, to some extent reducing the reliability of conventional seismic imaging and structural interpretation. To address this, the common-reflection-surface (CRS) stack method, derived from optical paraxial ray theory, is implemented to transcend horizontal layer model constraints, offering substantial improvements in high-SNR prestack gather generation and prestack depth migration (PSDM) imaging, notably for permafrost zones. Using 2D seismic data from the basin, we detailedly compare the CRS stack with conventional SNR enhancement techniques—common midpoint (CMP) FlexBinning, prestack random noise attenuation (PreRNA), and dip moveout (DMO)—evaluating both theoretical foundations and practical performance. The result reveals that CRS-processed prestack gathers yield superior SNR optimization and signal preservation, enabling more robust PSDM velocity model building, while comparative imaging demonstrates enhanced diffraction energy—particularly at medium (20–40%) and long (40–60%) offsets—critical for resolving faults and stratigraphic discontinuities in PSDM. This integrated validation establishes CRS stacking as an effective preprocessing foundation for the depth-domain imaging of complex permafrost geology, providing critical improvements in seismic structural resolution and reduced interpretation uncertainty for hydrocarbon exploration in permafrost-bearing basins.

1. Introduction

Geological surveys over three decades confirm significant hydrocarbon potential in the Qiangtang Basin, Tibetan Plateau [1,2,3], yet exploration has seen no substantial breakthroughs since the 1990s. This stagnation stems from unresolved questions regarding petroleum systems compounded by persistent near-surface geophysical challenges in seismic exploration—the primary method for identifying viable traps. The key technical hurdles include permafrost effects, wind noise contamination, low signal-to-noise ratios (SNRs), and complex structural imaging, critically constraining the seismic fidelity essential for assessing hydrocarbon accumulation elements like structural trap integrity and source rock distribution [3,4,5].
Unlike the Alaskan North Slope or Siberian cold regions, the Qiangtang Basin—situated on the Tibetan “Third Pole”—exhibits significantly more complex permafrost with thickness exceeding 100 m [1,6]. The region’s structure, significantly influenced by Tethyan dynamics during the Yanshanian–Himalayan orogenies, features widespread imbricate thrusts and nappe structures [1,2], evident in Figure 1. Since 2015, high-density wide-line 2D acquisition with small receiver intervals increased by a nominal fold of ~3000, yet seismic SNRs and imaging quality show limited improvement [5]. This stems from complex wavefields—characterized by intense reflections, diffractions, and scattering—caused by rapid lateral variations in the weathering layer and outcropping steep strata, severely challenging structural interpretation. Consequently, Qiantang’s seismic processing faces interdependent priorities: effective SNR enhancement underpins the accurate imaging of complex structures.
The combined influence of Tibetan Plateau permafrost and outcropping Mesozoic strata generates non-ideal subsurface conditions, deviating markedly from the horizontal layered model required for effective seismic acquisition [5,7]. These anomalies degrade seismic SNRs and complicate imaging. While conventional SNR enhancement methods—CMP stacking, prestack random noise attenuation (PreRNA), dip moveout (DMO), and CMP FlexBinning—exploit the advantages of multifold reflection, their efficacy remains limited in such settings. In contrast, the common-reflection-surface (CRS) stack excels in complex terrains like (ultra-)deep thrust structures and sub-volcanic low-SNR zones [8,9,10,11,12]. Rooted in optical paraxial ray theory, the CRS stack optimizes reflection traveltimes using three kinematic parameters—emergence angle, normal-incidence wavefront curvature, and normal wavefront curvature—establishing a geologically realistic model superior to horizontal layer assumptions [13,14].
Table 1 presents the conventional prestack time migration (PSTM) and prestack depth migration (PSDM) workflow, key methods, and parameters currently applied to seismic data from Qiangtang Basin permafrost zones. It reveals that for low-SNR prestack seismic data, the processing is typically restricted to PreRNA and does not specially account for inclined strata. While DMO processing handles non-horizontal reflections and improves RMS velocity analysis accuracy, it fails to significantly enhance the SNR of weak reflections and far-offset diffractions in prestack gathers.
This study theoretically and operationally compares CRS stacking with conventional methods—CMP stacking, PreRNA, CMP FlexBinning, and DMO—using Qiangtang Basin 2D seismic data through PSDM imaging. Focused on profile TS2008_SN## (Figure 1) crossing the Longmutso–Shuanghu suture zone (LSSZ), the results demonstrate that CRS stack boosts the seismic SNR, enhances velocity analysis reliability, and delivers high-quality prestack gathers with robust initial PSDM velocity models. For Qiangtang hydrocarbon exploration, CRS effectively addresses both low-SNR challenges and imaging complexities.

2. Common-Reflection-Surface Stacking

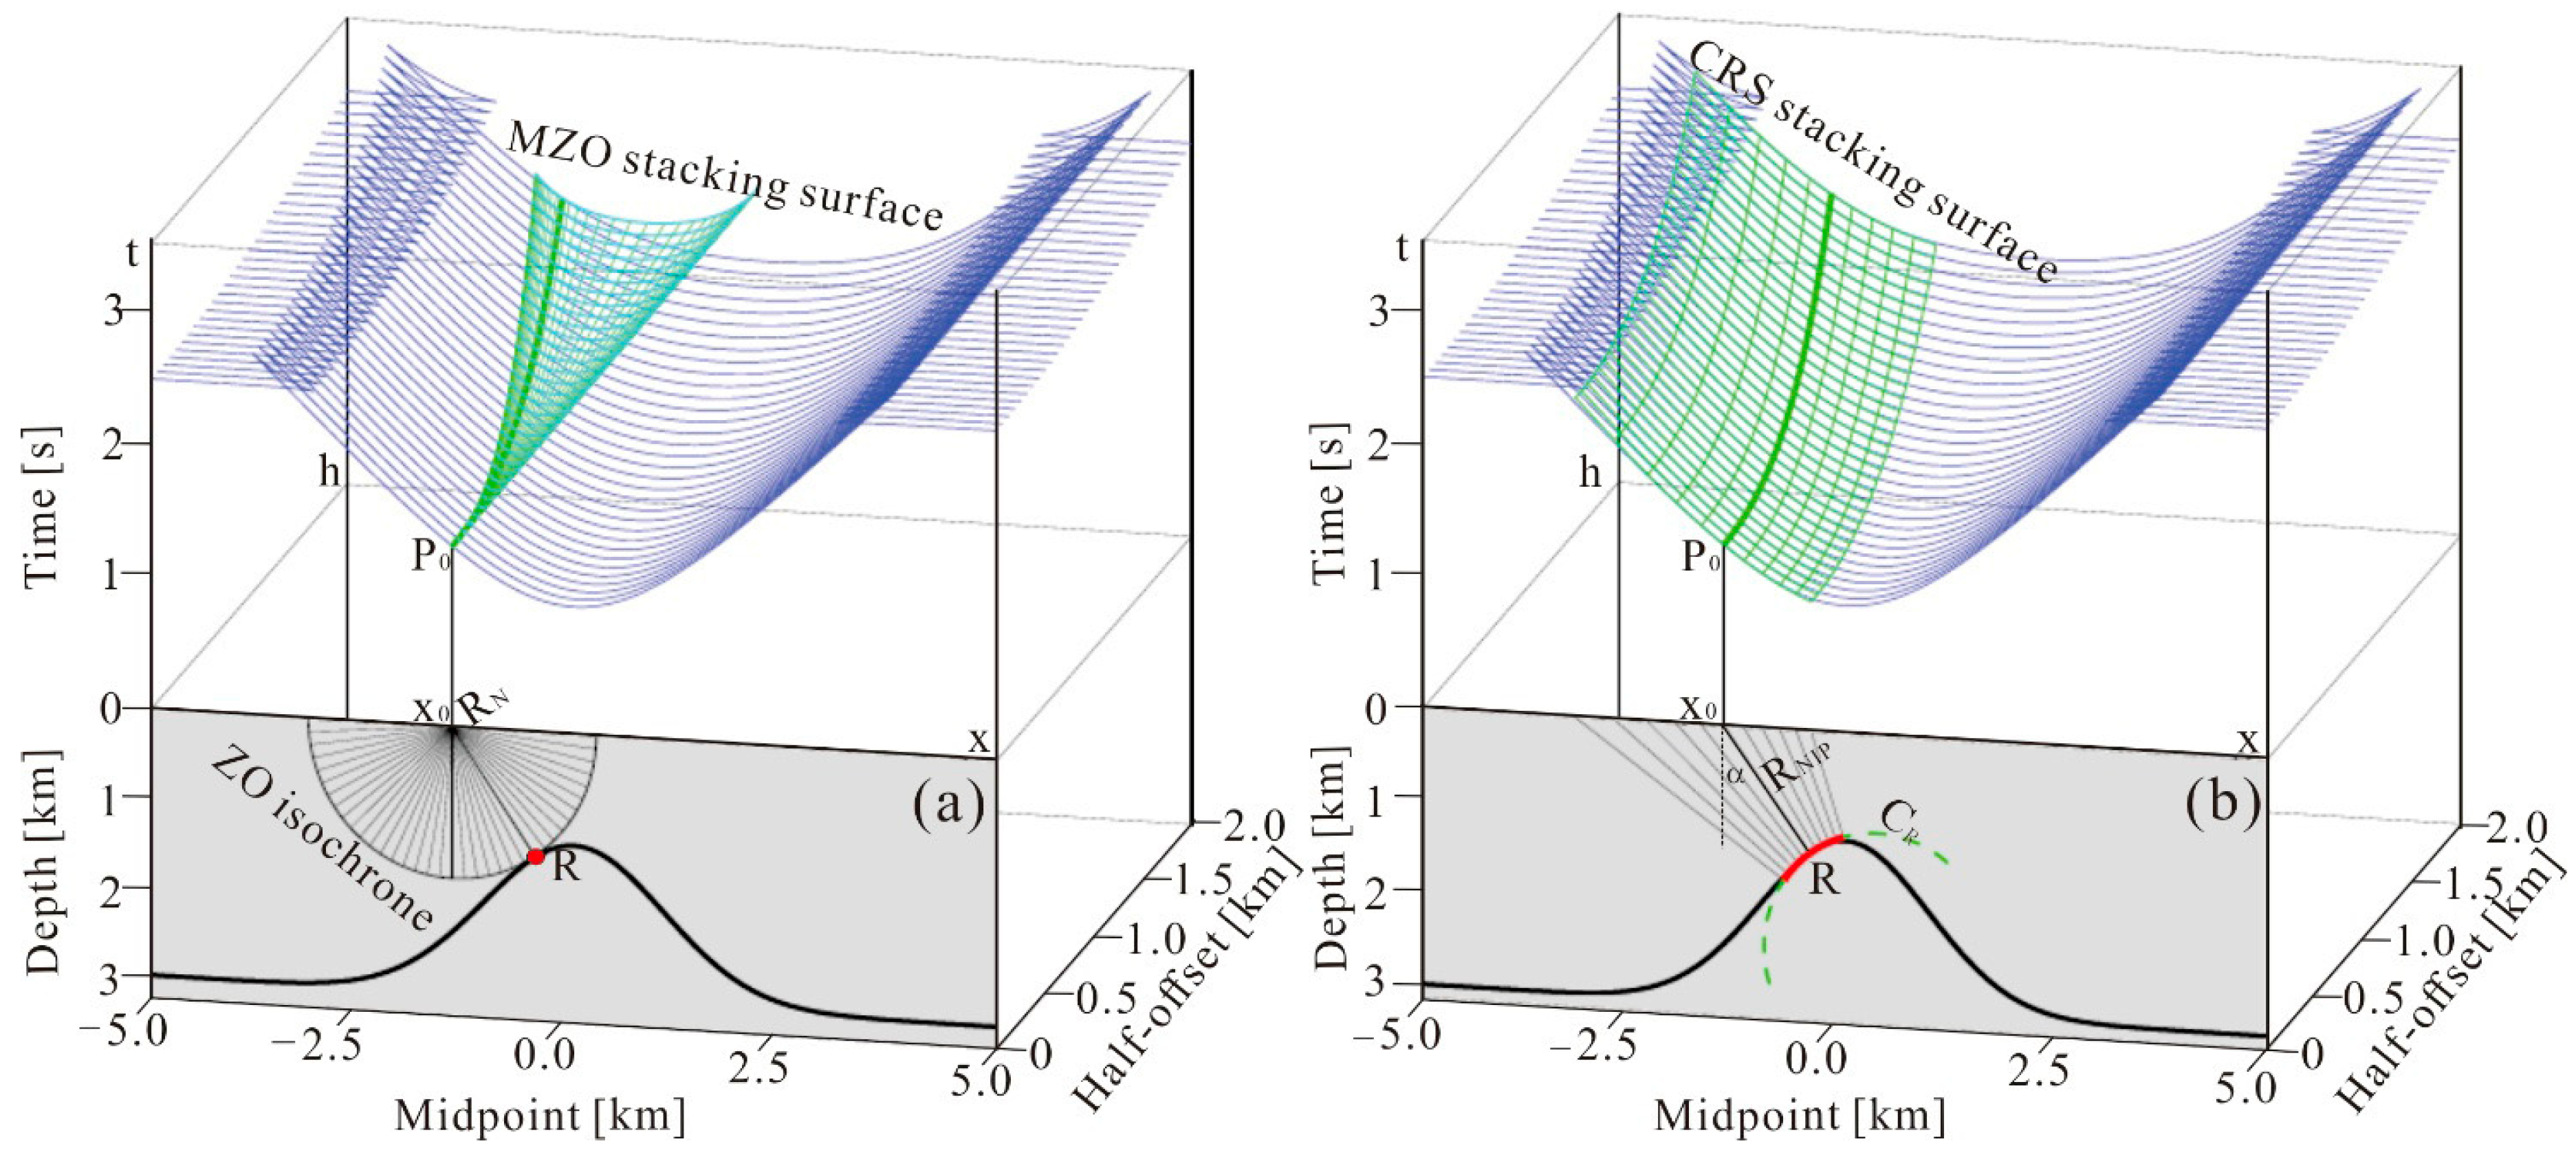
2.1. Principles of CRS Stacking

Modern hydrocarbon exploration increasingly targets complex near-surface and structural settings where conventional processing—limited by horizontal layer assumptions—fails to enhance the SNR or achieve true amplitude imaging under low-SNR conditions and complex wavefields from rough lateral velocity variations [13,14,15,16]. These limitations propagate interpretation ambiguities. To overcome such constraints, CRS stacking [17] emerges as an advanced solution grounded in geometric seismology. Analogous to optical paraxial ray theory, CRS stacking incorporates reflected waves within the first Fresnel zone of local reflection points, characterizing curved-interface kinematics in heterogeneous media through a traveltime expression defined for the central point x 0 and half-shot distance h :
t 2 ( x m , h ) = t 0 + 2 sin α v 0 ( x m x 0 ) 2 + 2 t 0 cos 2 α v 0 ( x m x 0 ) 2 R N + h 2 R N I P
where the reflection traveltimes t ( x m , h ) depend on three kinematic parameters, the emergence angle α , normal-incidence-point (NIP) wavefront curvature radius R N I P , and normal wavefront curvature radius R N [18,19,20,21,22], as shown in Figure 2.
CRS stacking optimally combines multifold reflections to generate high-fidelity zero-offset sections [16,23]. Its implementation requires the optimal estimation of α , R N I P , and R N for each subsurface point P 0 ( x m , t 0 ), achieved by coherence maximization within a Fresnel-zone-constrained 3D parameter space. A global optimization scheme initializes parameter ensembles, iteratively converging toward maximum coherence through wavefield semblance analysis [24,25,26]. The resulting zero-offset section reconstruction honors complex wavefront kinematics [20]. The optimization initializes via a predefined scheme, where parameter ensembles establish the searching space for iterative refinement. This strategy iteratively converges toward the optimal ( α , R N I P , R N ) triad through successive wavefield coherence maximization. The reconstructed zero-offset sections rigorously honor complex kinematics, as validated by kinematic modeling studies [18,26].
Figure 2 illustrates the kinematic distinction between CMP and CRS stacking. While CMP stacking uses hyperbolic traveltimes (green curves) that deviate from true reflection responses (blue curves) at far offsets, as shown in Figure 2a, CRS stacking incorporates non-hyperbolic moveout (blue curves) to accurately fit reflection traveltimes at surface point P 0 . As Figure 2b demonstrates, CRS stacking operates in curvilinear media by integrating reflections within the first Fresnel zone—particularly along structural dips—transcending single-point approximations. This enables the constructive superposition of reflected and diffracted energy, significantly enhancing fidelity in reconstructing complex subsurface geometries.

2.2. CRS Stacking vs. DMO Stacking

In complex non-horizontal media, normal moveout velocity v n m o (Equation (2)) usually exhibits angular dependence on stratum dip and interface curvature. This dependency critically constrains fault-zone analysis, where intersecting wavefronts from opposing fault blocks show divergent phase relationships [27,28]. Conventional v n m o estimation resolves only a single dominant velocity solution—failing to accommodate dual velocity fields. Consequently, horizontal layer-constrained CMP stacking inadequately preserves diffraction signatures from fault terminations, yielding stacked sections that diverge kinematically/dynamically from theoretical zero-offset responses [13,29].
t 2 = t 0 2 + 4 h 2 v n m o 2 = t 0 2 + 4 h 2 v 2 / cos 2 α
The late-20th-century shift toward prestack processing addressed dip-related imaging challenges. Yilmaz and Claerbout’s (1980) prestack partial migration (PSPM) pioneered solutions for velocity heterogeneity and diffraction focusing. Subsequent frequency–wavenumber DMO operators improved dipping-interface imaging by mitigating reflection-point smearing [15,30,31]. When implementing post-NMO in time–space or frequency–wavenumber domains, DMO preserves azimuthal velocity consistency for dipping reflectors, enhancing kinematic fidelity over conventional CMP stacking.
Nevertheless, DMO combined with poststack migration fails to achieve true CRP repositioning equivalent to PSTM. As Figure 3 shows, the DMO-corrected point P exhibits negligible resolution gain versus the conventional point N, evidenced by persistent phase/amplitude inconsistencies. While DMO-preconditioned gathers improve RMS velocity estimation via moveout coherence—justifying its enduring utility in PSTM workflows [32]—it remains fundamentally limited in complex-wavefield reconstruction.
Bazelaire (1988) and Gelchinsky (1988) established that wavefield superposition limited by the Fresnel zone requires a shift from CRP-based to CRS imaging. This approach replaces simple CMP stacking with multi-azimuth focusing operators, optimally integrating source–receiver wavefields over extended apertures. As Figure 2 illustrates, CRS stacking and migration-to-zero-offset (MZO) provide superior wavefield reconstruction by utilizing the multipath illumination of wide-azimuth geometries [33,34]. Consequently, CRS processing demonstrates technical superiority over DMO, particularly for low-SNR data and non-planar reflectors, by fully exploiting the kinematic information in multi-coverage wavefields.

2.3. CRS Stacking vs. CMP Flexbinning

Section 2.2 outlines the fundamental principles of CRS stacking, emphasizing its incorporation of both Fresnel zone wavefield superposition and dip compensation. This highlights a key methodological distinction: how CRS stacking fundamentally differs from CMP FlexBinning. Conventional CMP FlexBinning employs “stacking aperture borrowing”, strategically expanding CMP bin scales while preserving uniform offset distribution. This spatial regularization allows the selective inclusion of adjacent data to balance fold coverage and offset sampling [35]. CMP FlexBinning parameterization involves optimizing (1) expansion scales, (2) redistribution protocols, and (3) statistical weighting constraints. These parameters are calibrated through iterative geostatistical analysis to maximize interface fidelity.
CMP FlexBinning primarily aims to reduce acquisition footprint artifacts while preserving prestack spatial resolution. Under idealized isotropic media conditions with horizontal reflectors, adjacent CMPs exhibit phase-consistent reflections when wavelets are laterally invariant. This enables constructive interference through statistical averaging, effectively suppressing random noise while retaining coherent signal energy—an SNR enhancement mechanism exhibiting apparent similarity to CRS stacking results [20,23,36]. However, in structurally complex media with dipping interfaces, inherent limitations emerge. Even after optimal moveout correction, residual time shifts persist within expanded CMP bins due to differential ray path geometries. These kinematic discrepancies induce constructive and destructive interference during averaging, manifesting as (1) coherent noise amplification via spatial aliasing, and (2) resolution degradation due to wavelet stretching. Consequently, effective CMP FlexBinning requires dip-adaptive optimization through the inclusion of (1) structural dip steering filters and (2) offset–azimuth sector weighting schemes to minimize wavefield distortion.

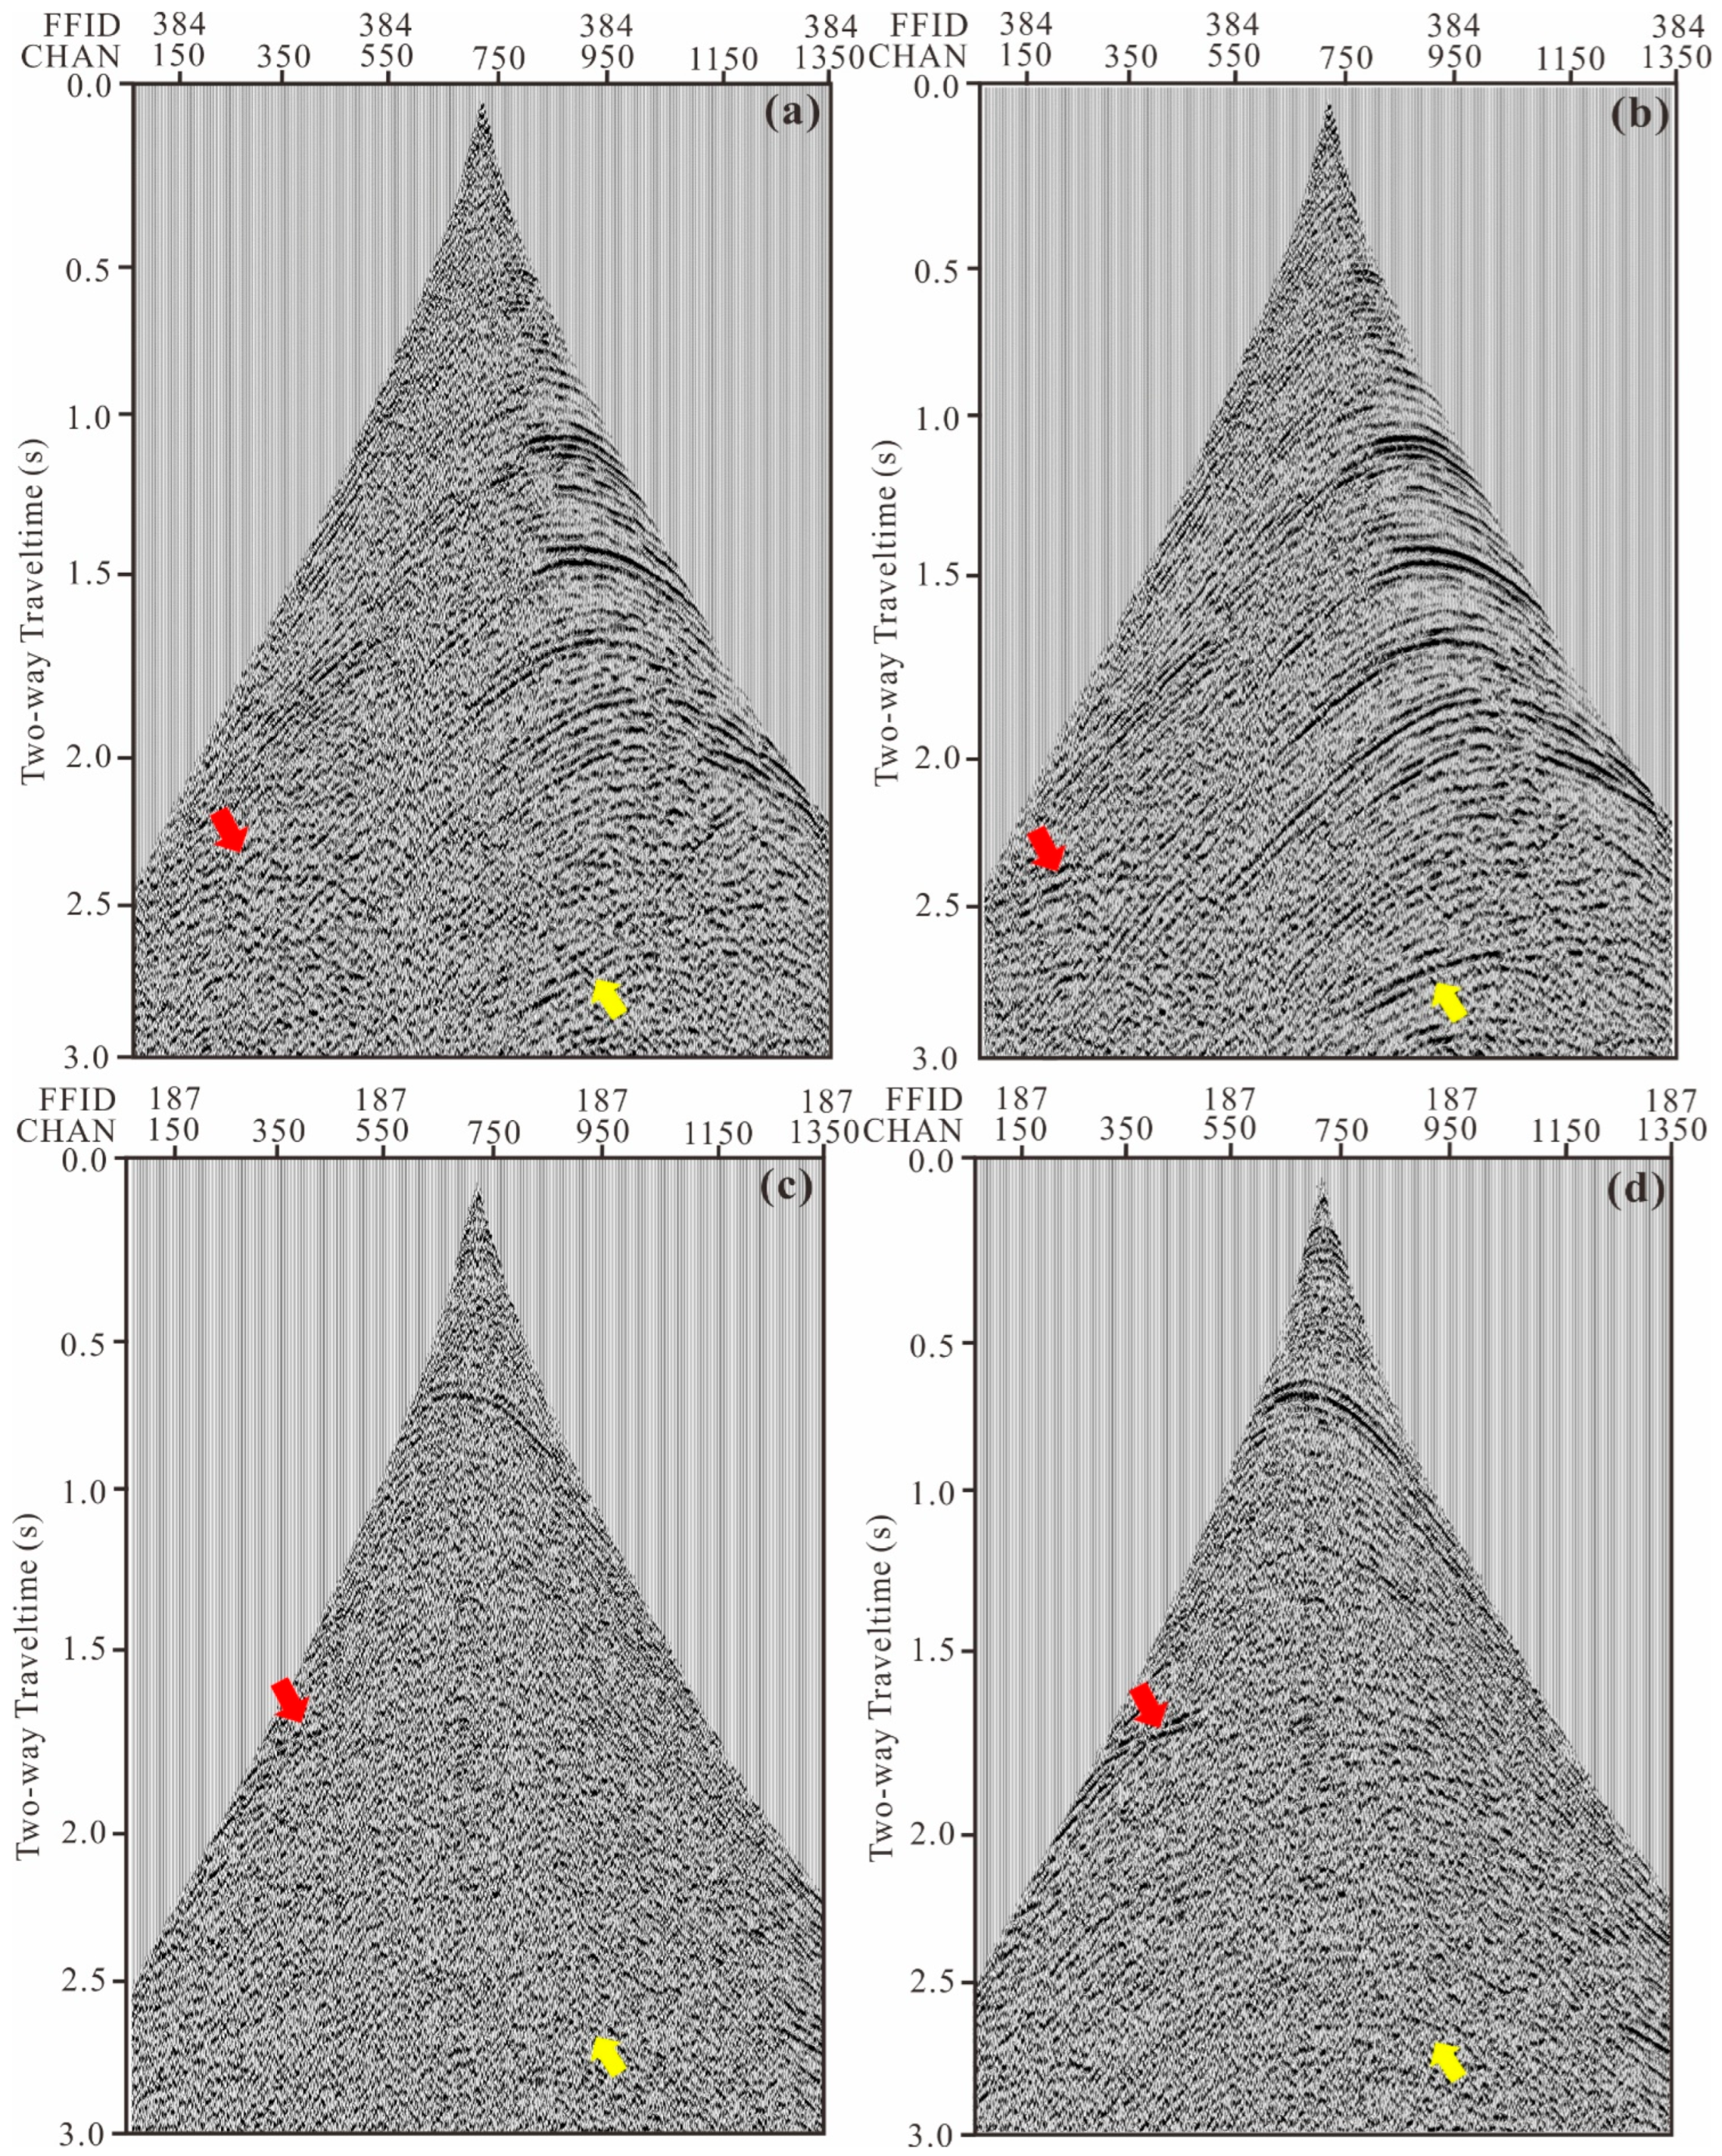
2.4. CRS Stacking vs. Prestack Noise Attenuation

Section 2.3 describes CMP stacking as a fundamental method to improve seismic SNRs, where effective random noise attenuation is key. This section compares the noise attenuation mechanisms of PreRNA and CRS stacking. The core principle of PreRNA in seismic preprocessing leverages the divergent predictability of useful signals versus random noise on prestack gathers in the non-spatiotemporal transform domain and designs prediction operators to suppress non-coherent noise. Typically, it employs statistical modeling (e.g., variance, mean) to identify abnormal amplitudes, frequencies, and white noise, followed by mathematically adaptive filtering [25]. The resulting SNR enhancement and improved lateral resolution are well-documented. As a recognized module in seismic processing, PreRNA plays a vital role in generating high-quality prestack gathers for migration and velocity analysis.
Building on geometric seismology (Section 2.1), CRS stacking generalizes traditional stacking by accounting for (1) dip variations within local reflection elements, and (2) reflections within first Fresnel zone. It replaces discrete reflection point assumptions with continuous surfaces, enabling multi-parameter traveltime approximations that better model finite-frequency wave propagation effects. Coherently summing adjacent CMP data within the first Fresnel zone produces extended CMP gathers, inherently suppressing random noise across this limited aperture.
Unlike the PreRNA operating through statistical modeling in transform domain, CRS stacking intrinsically incorporates geologic structures and optimizes prestack gathers while preserving amplitudes. This distinct advantage favorably supports amplitude-versus-offset (AVO) inversion and reservoir characterization using CRS-derived CMP or CRP gathers from prestack time/depth migration [37,38,39,40]. Both theory and field data confirm that CRS stacking surpasses PreRNA not only in prestack SNR enhancement but also in retaining critical amplitude information for quantitative seismic interpretation.

3. Imaging Application

3.1. Seismic Geological Conditions of the Qiangtang Basin

The Qiangtang Basin, central to the Tibetan Plateau, poses significant geological challenges with an average elevation > 4800 m. This high-altitude cryosphere features extreme winter–spring temperatures (−30 °C to −15 °C) and extensive permafrost, including seasonally active layers (0–3 m depth) and continuous permafrost (>100 m thickness) [7]. Mesozoic marine sequences surface as prominent klippen and tectonic windows, underlain by laterally heterogeneous low-velocity zones (LVZs) in shallow strata (Figure 1), establishing dual surface–subsurface complexity. Despite multi-phase Yanshanian (Jurassic–Cretaceous) and Himalayan (Cenozoic) tectonism within the eastern Tethyan framework, prospective hydrocarbon targets have been identified by integrated surveys (2015–2022), wherein the Amucuo–Tonamu structural belt (Northern Depression’s southern margin) exhibits the following:
(1)
Well-preserved Upper Triassic–Lower Jurassic source rocks;
(2)
Composite structural traps (thrust-related anticlines and stratigraphic pinch-outs);
(3)
Favorable reservoir-seal assemblages in Middle Jurassic carbonates.
Current exploration faces three key constraints:
(1)
Suboptimal acquisition parameters: Rugged topography (>1000 m relief) and permafrost-induced velocity anomalies compromise data integrity (S/N ratio < 2:1 across 40% of the study area).
(2)
Inadequate velocity modeling: LVZ heterogeneity introduces ~15% time-depth conversion errors, reducing trap delineation accuracy.
(3)
Ambiguous seismic interpretation: Limited bandwidth (8–35 Hz) and complex multiples yield > 30% uncertainty in reservoir thickness estimates.
During 2008–2015 seismic prospecting, the Chengdu Center of China Geological Survey (CC-CGS) acquired multiple 2D seismic lines across the Amucuo–Tonamu structural belt. Seismic imaging challenges include suboptimal SNRs, limited spatial resolution, and structural ambiguities within complex thrust systems [5]. Recent advances in permafrost seismic processing demonstrate that medium-to-long wavelength statics can be resolved via micro-logging-constrained tomographic inversion [6,7]. Nevertheless, enhancing seismic SNRs and achieving precise imaging remain critical challenges.
This study investigates seismic reflection signal enhancement through the comparative application of CRS stacking and PSDM to the seismic line TS2008_SN## (Tonamu region). Table 2 presents its seismic acquisition observation system. The integrated study framework comprises the following:
(1)
A quantitative evaluation of CRS stacking efficacy versus conventional workflows;
(2)
Systematic aperture parameterization for optimal SNR enhancement;
(3)
Kinematic validation via diffraction focusing analysis.

3.2. Application of CRS Stacking and Method Comparison

Prior to CRS stacking analysis, geometric validation of seismic acquisition parameters (shot/receiver spacing, fold coverage) and a quantitative assessment of raw gathers’ wavefield attributes (amplitude spectra, noise characteristics, spectral bandwidth) were systematically conducted. A signal-preservation-optimized preprocessing workflow was designed, mainly comprising (1) topography-consistent statics addressing near-surface velocity anomalies; (2) the suppression of irregular and linear noise; (3) surface-consistent amplitude balancing to mitigate radiation pattern distortions; (4) signature frequency compensation via deconvolution.
For permafrost-affected near-surface variation, static corrections were resolved through micro-logging-constrained tomographic inversion targeting medium–long-wavelength components (3–7 km), followed by residual statics on reflections via maximum energy coherence optimization for medium–short wavelengths (0.1–2 km).
The following noise suppression workflow implemented (1) multi-channel singular spectrum analysis to attenuate amplitude/frequency artifacts; (2) time-variant f-k filtering for progressive linear noise suppression (ground roll, refractions) prior to random noise reduction; (3) shot-domain amplitude balancing followed by CMP-domain phase regularization. The cascaded approaches suppressed >72% of non-reflective energy while maximally preserving reflections. Surface-consistent compensation included (1) deconvolution for frequency-dependent amplitude balancing; (2) zero-phase spiking deconvolution (120 ms operator) for side-lobe compression.
Figure 4a,c and Figure 5a,c demonstrate coherent hyperbolic reflections in preprocessed shot and CMP gathers, with consistent vertical/horizontal amplitude–frequency characteristics. These gathers reveal pronounced non-zero offset reflections in Mesozoic strata, indicating steeply dipping structures.
Using these optimized gathers, systematic parameterization tests for CRS stacking yielded the optimal configuration:
  • Near-surface velocity = 2500 m/s
  •   F r e s n e l   z o n e   a p e r t u r e = a t = 40   m   t = 0.0   s 120   m   t = 0.5   s 200   m   t = 1.0   s 400   m   t = 2.0   s 800   m   t = 4.0   s
  • Maximum dip = 45°
  • Offset regularization = 60–7180 m (80 m interval)
The resultant CRS-stacked gathers (Figure 4b,d and Figure 5b,d) were annotated with CMP positions cross-referenced to Figure 6. The permafrost layers at CMPs 1050/2060 were verified by micro-logging. The CRS-stacked CMP gather at 1750 and 2250 (Figure 4b,d) shows three key improvements: (1) Offset distribution optimization: Enhanced trace uniformity compensates for missing offsets, facilitating Kirchhoff-based migration. (2) Reflection continuity: There is improved coherency at far offsets with enhanced diffraction resolution despite minor frequency attenuation (red arrows, Figure 4b,d). (3) Deep reflector characterization: There are amplitude-consistent reflections at 2.5–3.0 s TWT (yellow arrows marked, Figure 4b,d). Figure 5b,d presents the CRS-stacked shot gather, with the SNR improvements highlighted (red and yellow arrows marked). Enhanced lateral continuity of the reflections and refined diffraction coda are evident.
When comparing deep reflections (2.5–3.0 s TWT) within shot gathers, the original gathers (Figure 5a,c, indicated by yellow arrows) display ambiguous or non-hyperbolic events, whereas the CRS-processed gathers (Figure 5b,d) exhibit an enhanced SNR and hyperbolic continuity. Structurally, Figure 5b shows the curvature difference in bilateral events (indicated by red and yellow arrows), and geological faults existing between left weak reflections and right steep strong-amplitude structures. These results confirm that CRS stacking effectively enhances the SNR in shallow/deep permafrost-affected prestack gathers while partially preserving amplitude–frequency relationships.
The velocity spectra calculation and stacking velocity analysis are compared using CMP gathers before and after CRS stacking. Figure 6 presents the velocity spectra for CMPs 400, 1150, 1750, and 2250. The upper panels show spectra derived from preprocessed CMP gathers, while the lower panels are from CRS-stacked data. The key observations are as follows:
(1)
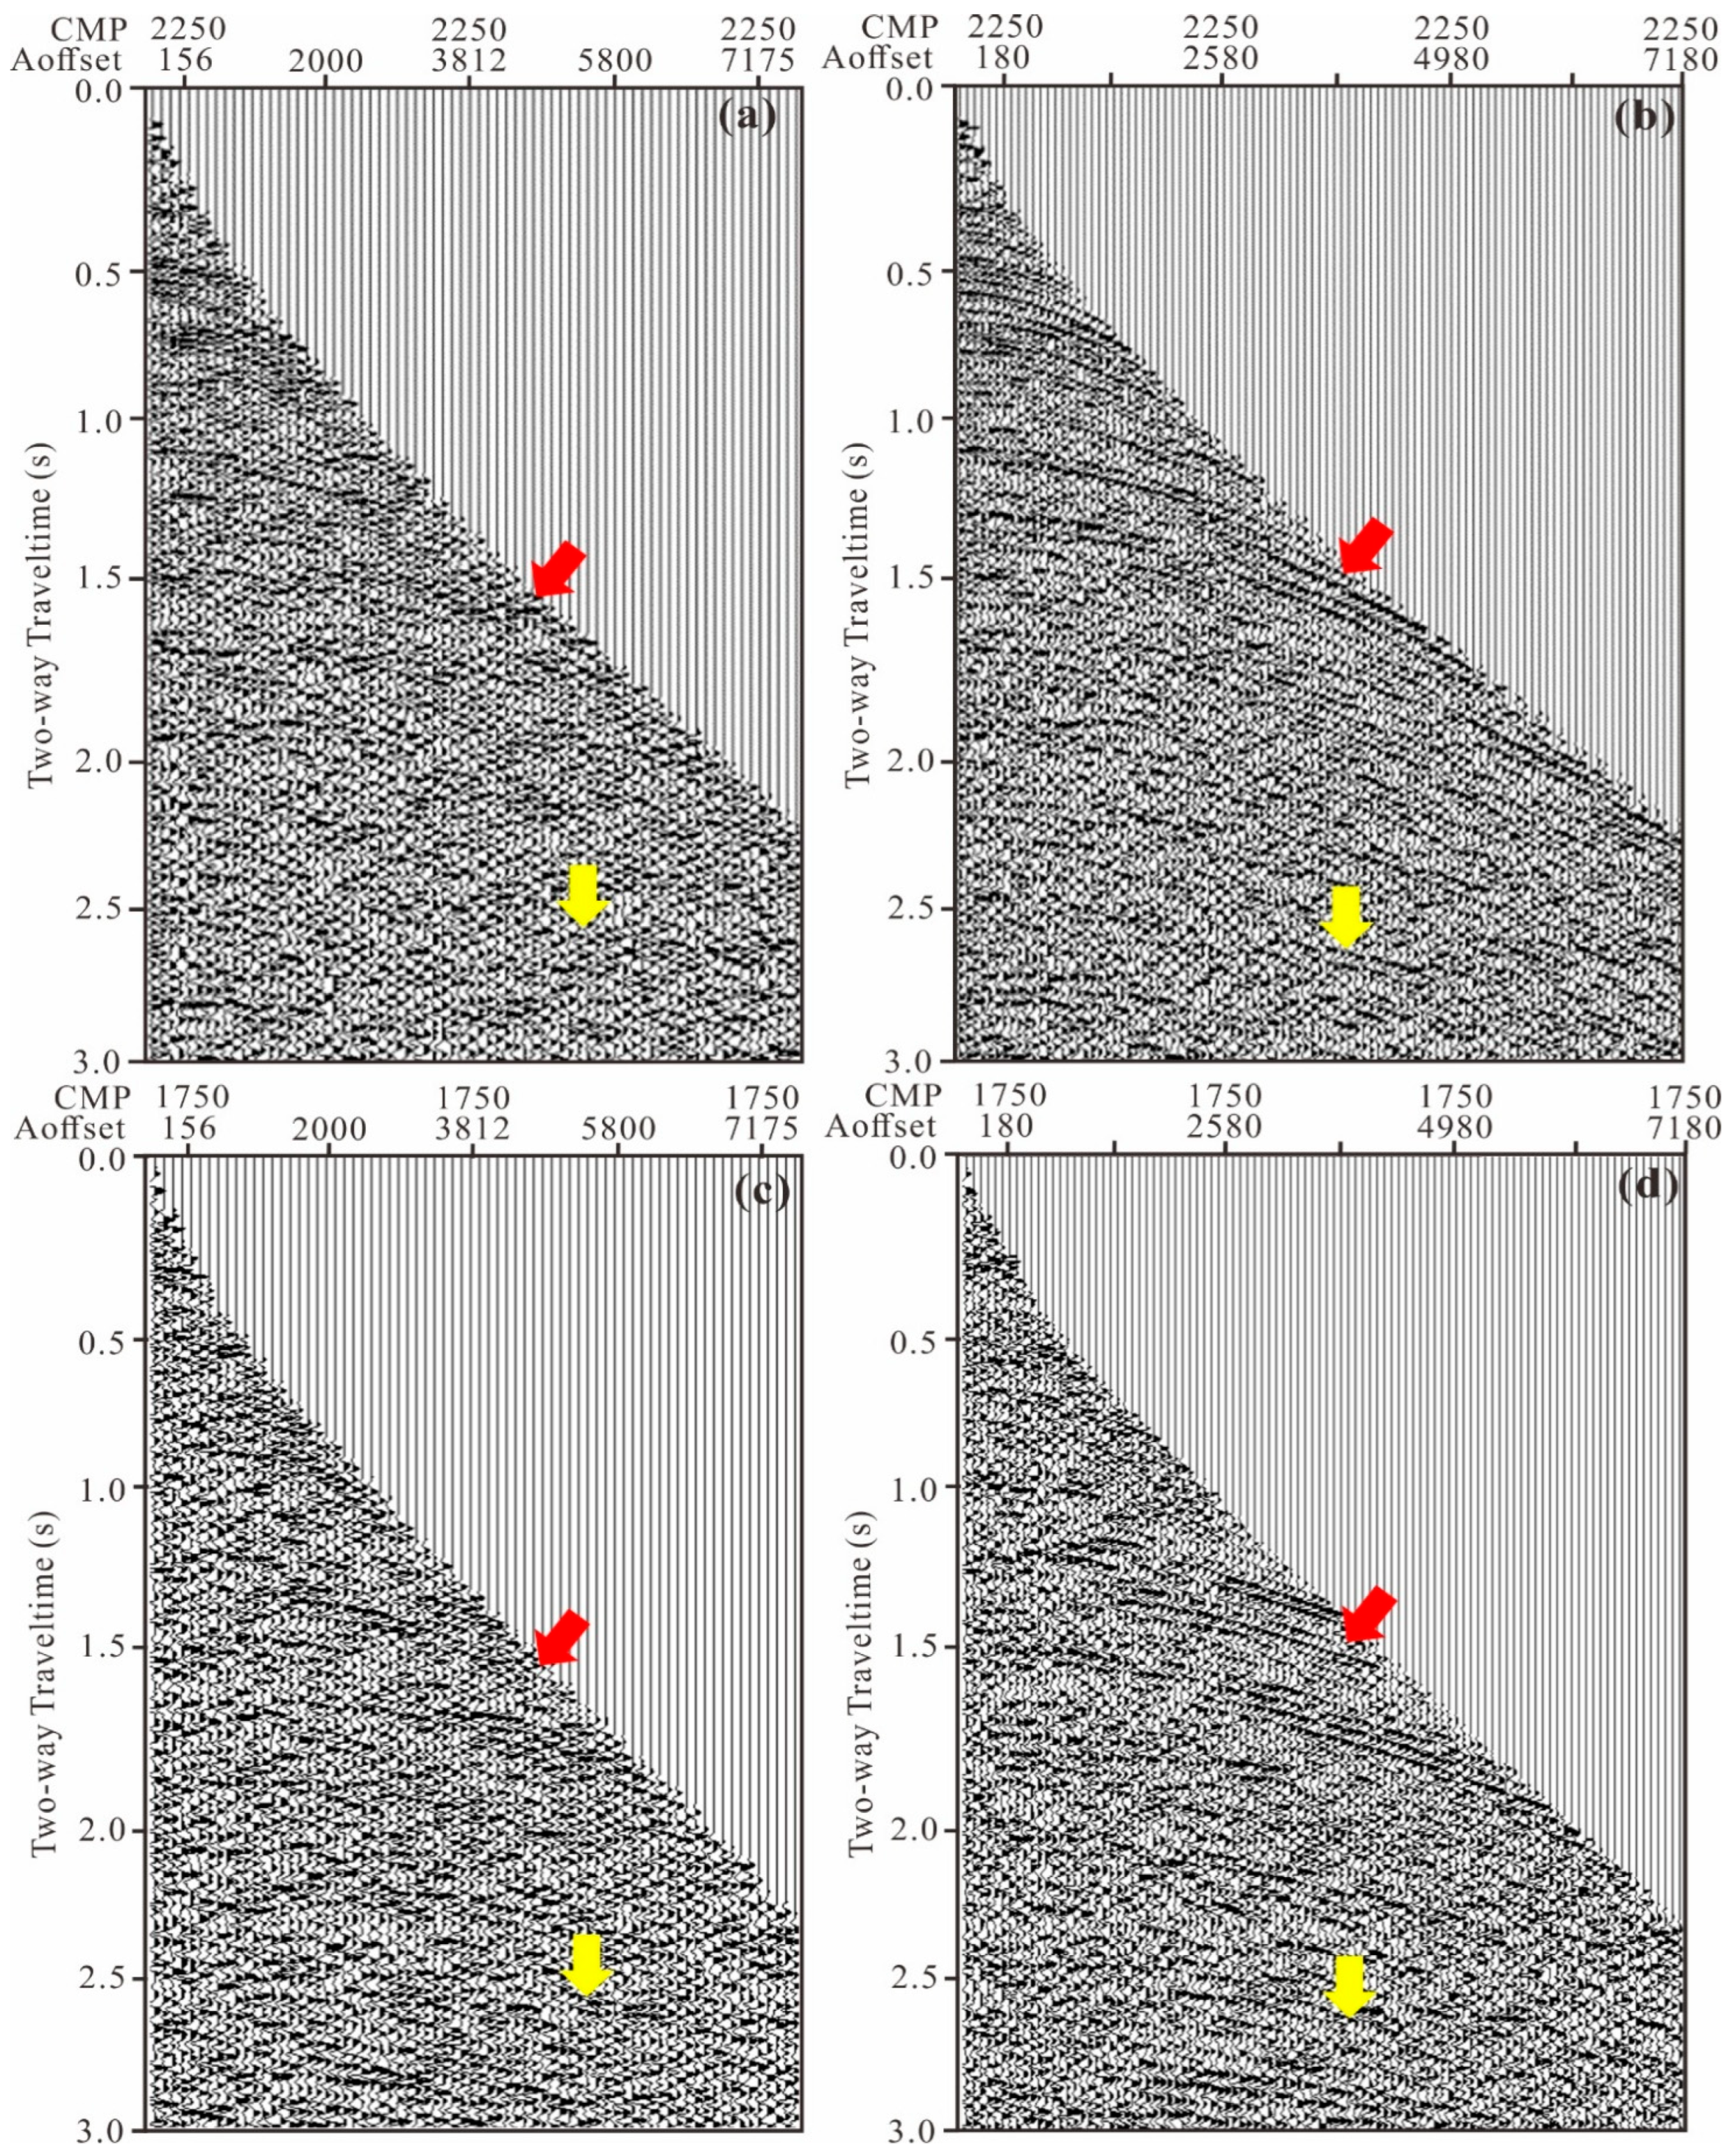
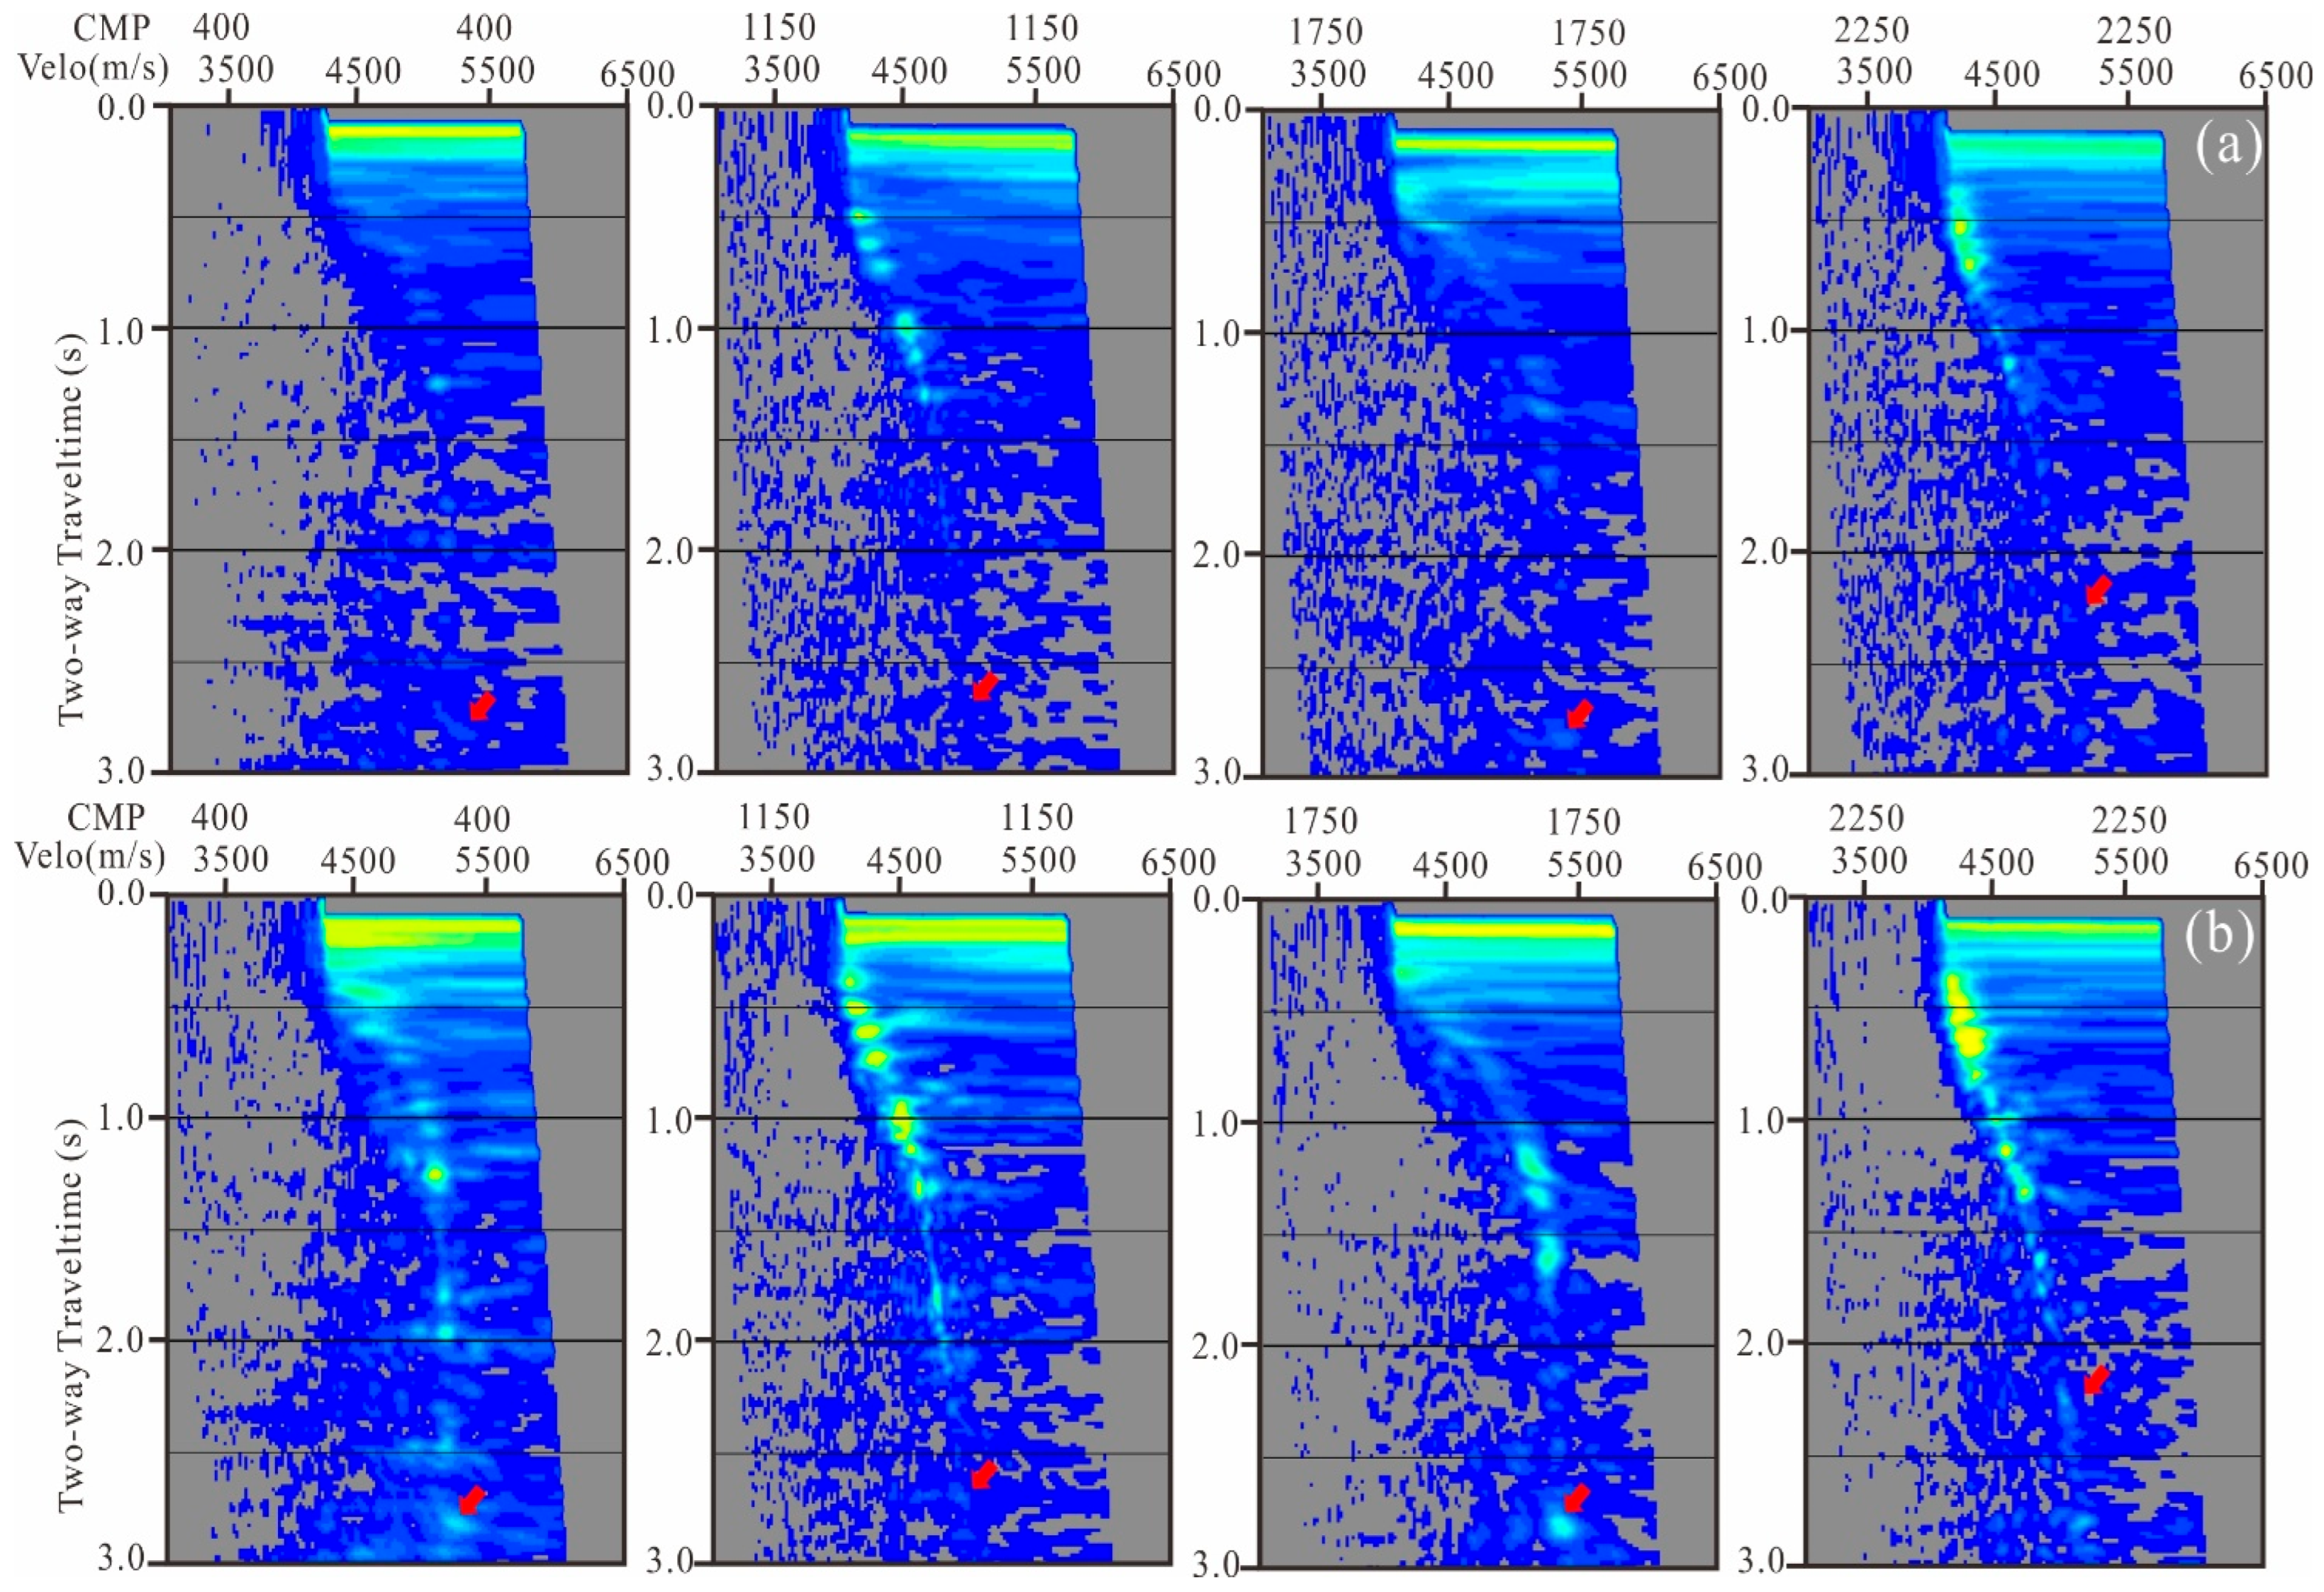
Shallow Layers: The CRS-stacked spectra show tightly focused energy clusters with laterally continuous velocity trends. At CMP 1750 (Figure 6b, lower third panel), the shallow cluster shifts to higher velocities, correlating with steep structural features near CMP 1150 evident in the stacked profile (Figure 7b). This velocity increase, consistent with structural dip effects, demonstrates an improved SNR via CRS stacking.
(2)
Deep Layers: SNR enhancement is evidenced by tighter energy clustering (red arrows marked, Figure 6b), especially at the maximum offset (7180 m), where stacking velocities remain below 5500 m/s. The velocity distribution indicates a generally increasing subsurface velocity gradient in the Tonamu area, with no significant reversals except in shallow permafrost zones. Reliable deep reflections within structural depressions are also identified.
Figure 7 compares a segment of the stacked profile (CMPs 1050–2250). Micro-logging interpretation confirms the presence of permafrost layers adjacent to a steeply northward-dipping structure (~45° dip). The key differences between the preprocessed (Figure 7a) and CRS-stacking (Figure 7b) profiles are as follows:
Figure 7. Comparison of stacking sections involving permafrost before and after applying CRS stacking. (a) Segment of the section after CMP stacking; (b) section derived from applied CRS stacking.
Geosciences 15 00276 g007
(1)
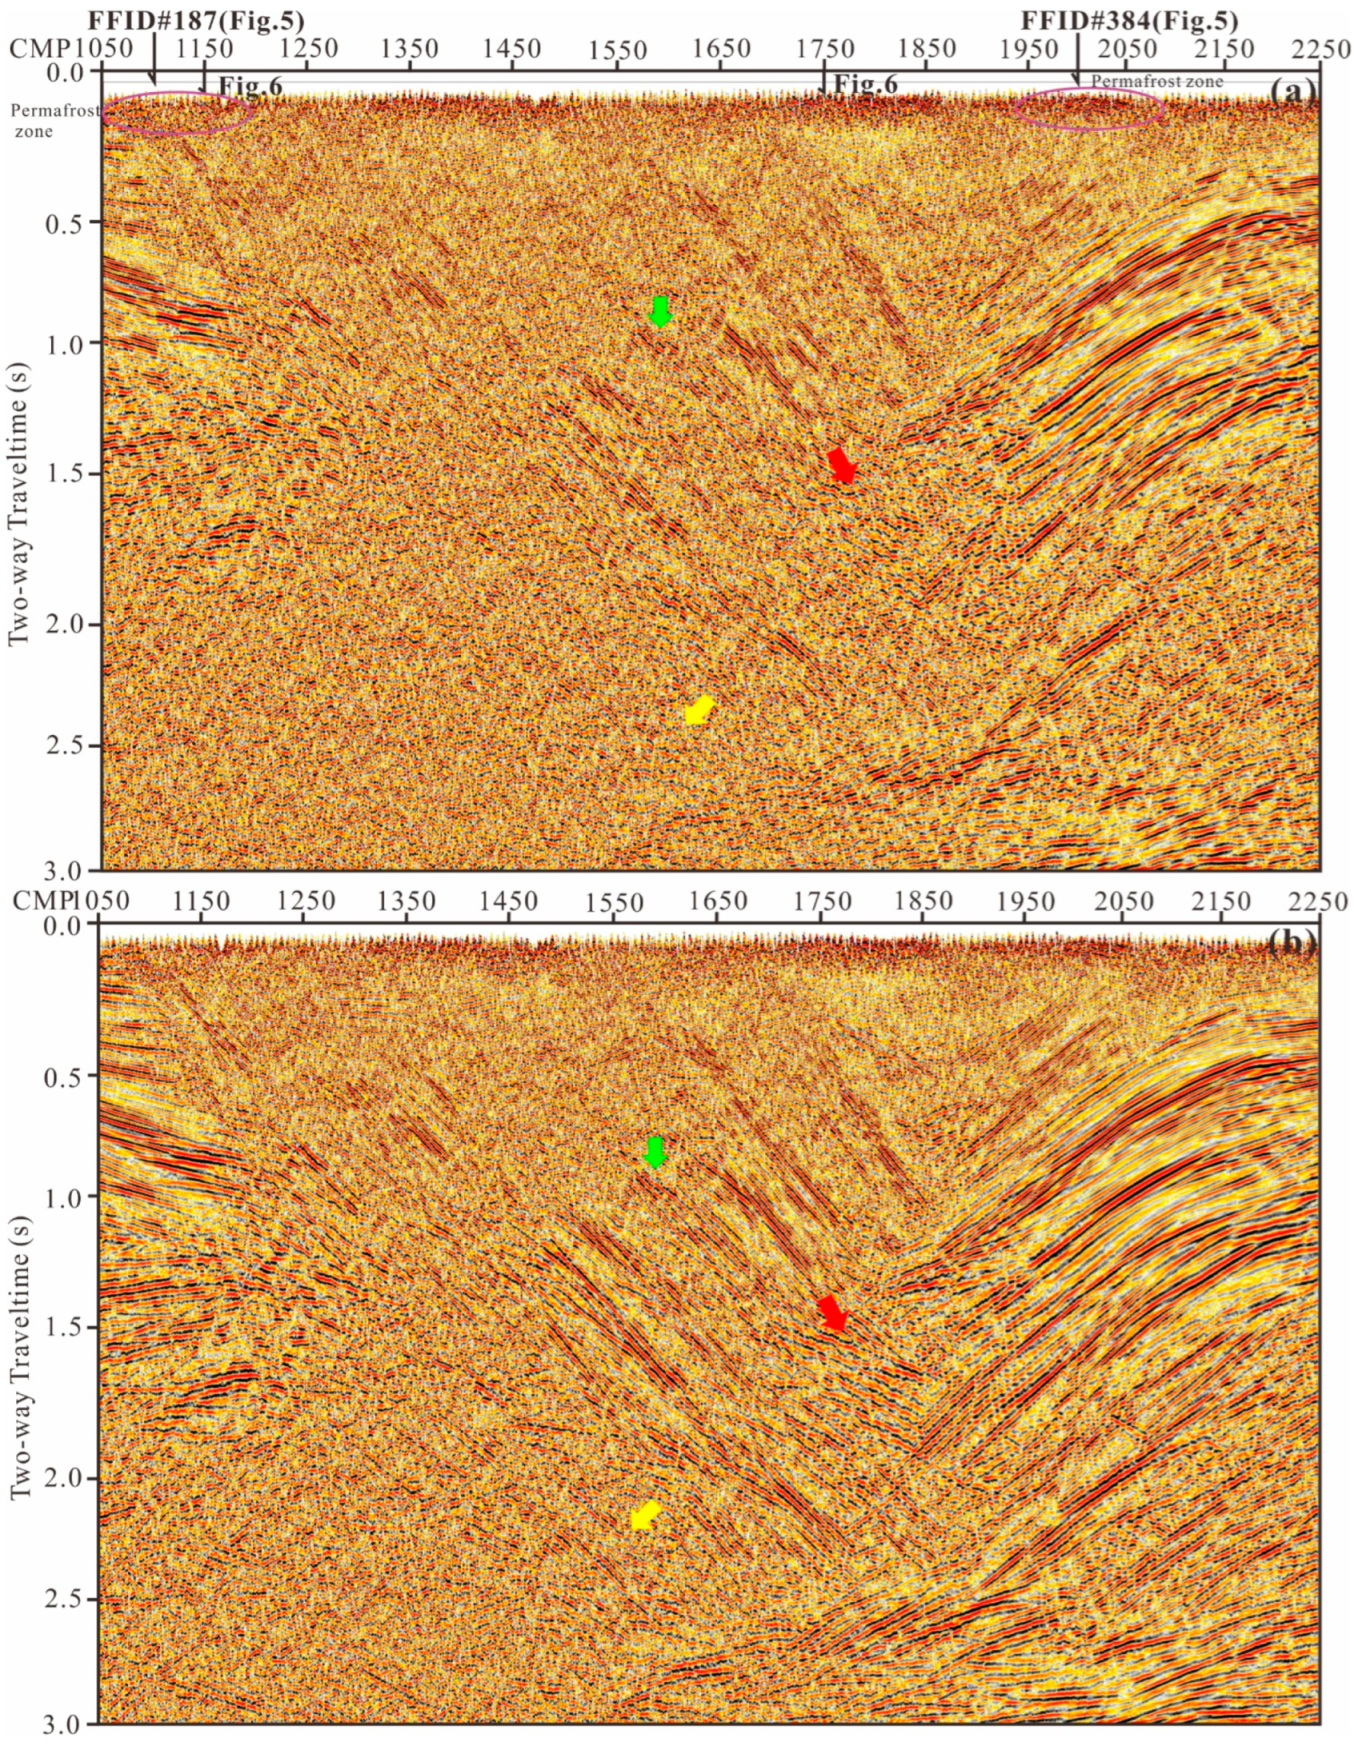
Preprocessed: A low SNR within shallow, steeply dipping structures and ambiguous deep fracture geometries below 2.0 s TWT.
(2)
CRS stacking: Enhanced continuity beneath permafrost zones, improved delineation of thin-bedded sandstone–mudstone/limestone interbeds, and stronger diffraction energy.
The most significant improvement is evident in the deep-layer imaging. Both fault-related diffractions and reflections from thrust block footwalls show a substantially increased SNR, thus validating its efficacy for imaging complex structures.
A comparative analysis of four methods—CRS stacking, CMP FlexBinning, PreRNA, and DMO stacking—was performed using identical preprocessed CMP gathers and stacking velocities.
Figure 8 presents the resultant stacked profiles, with key the details listed below:
(1)
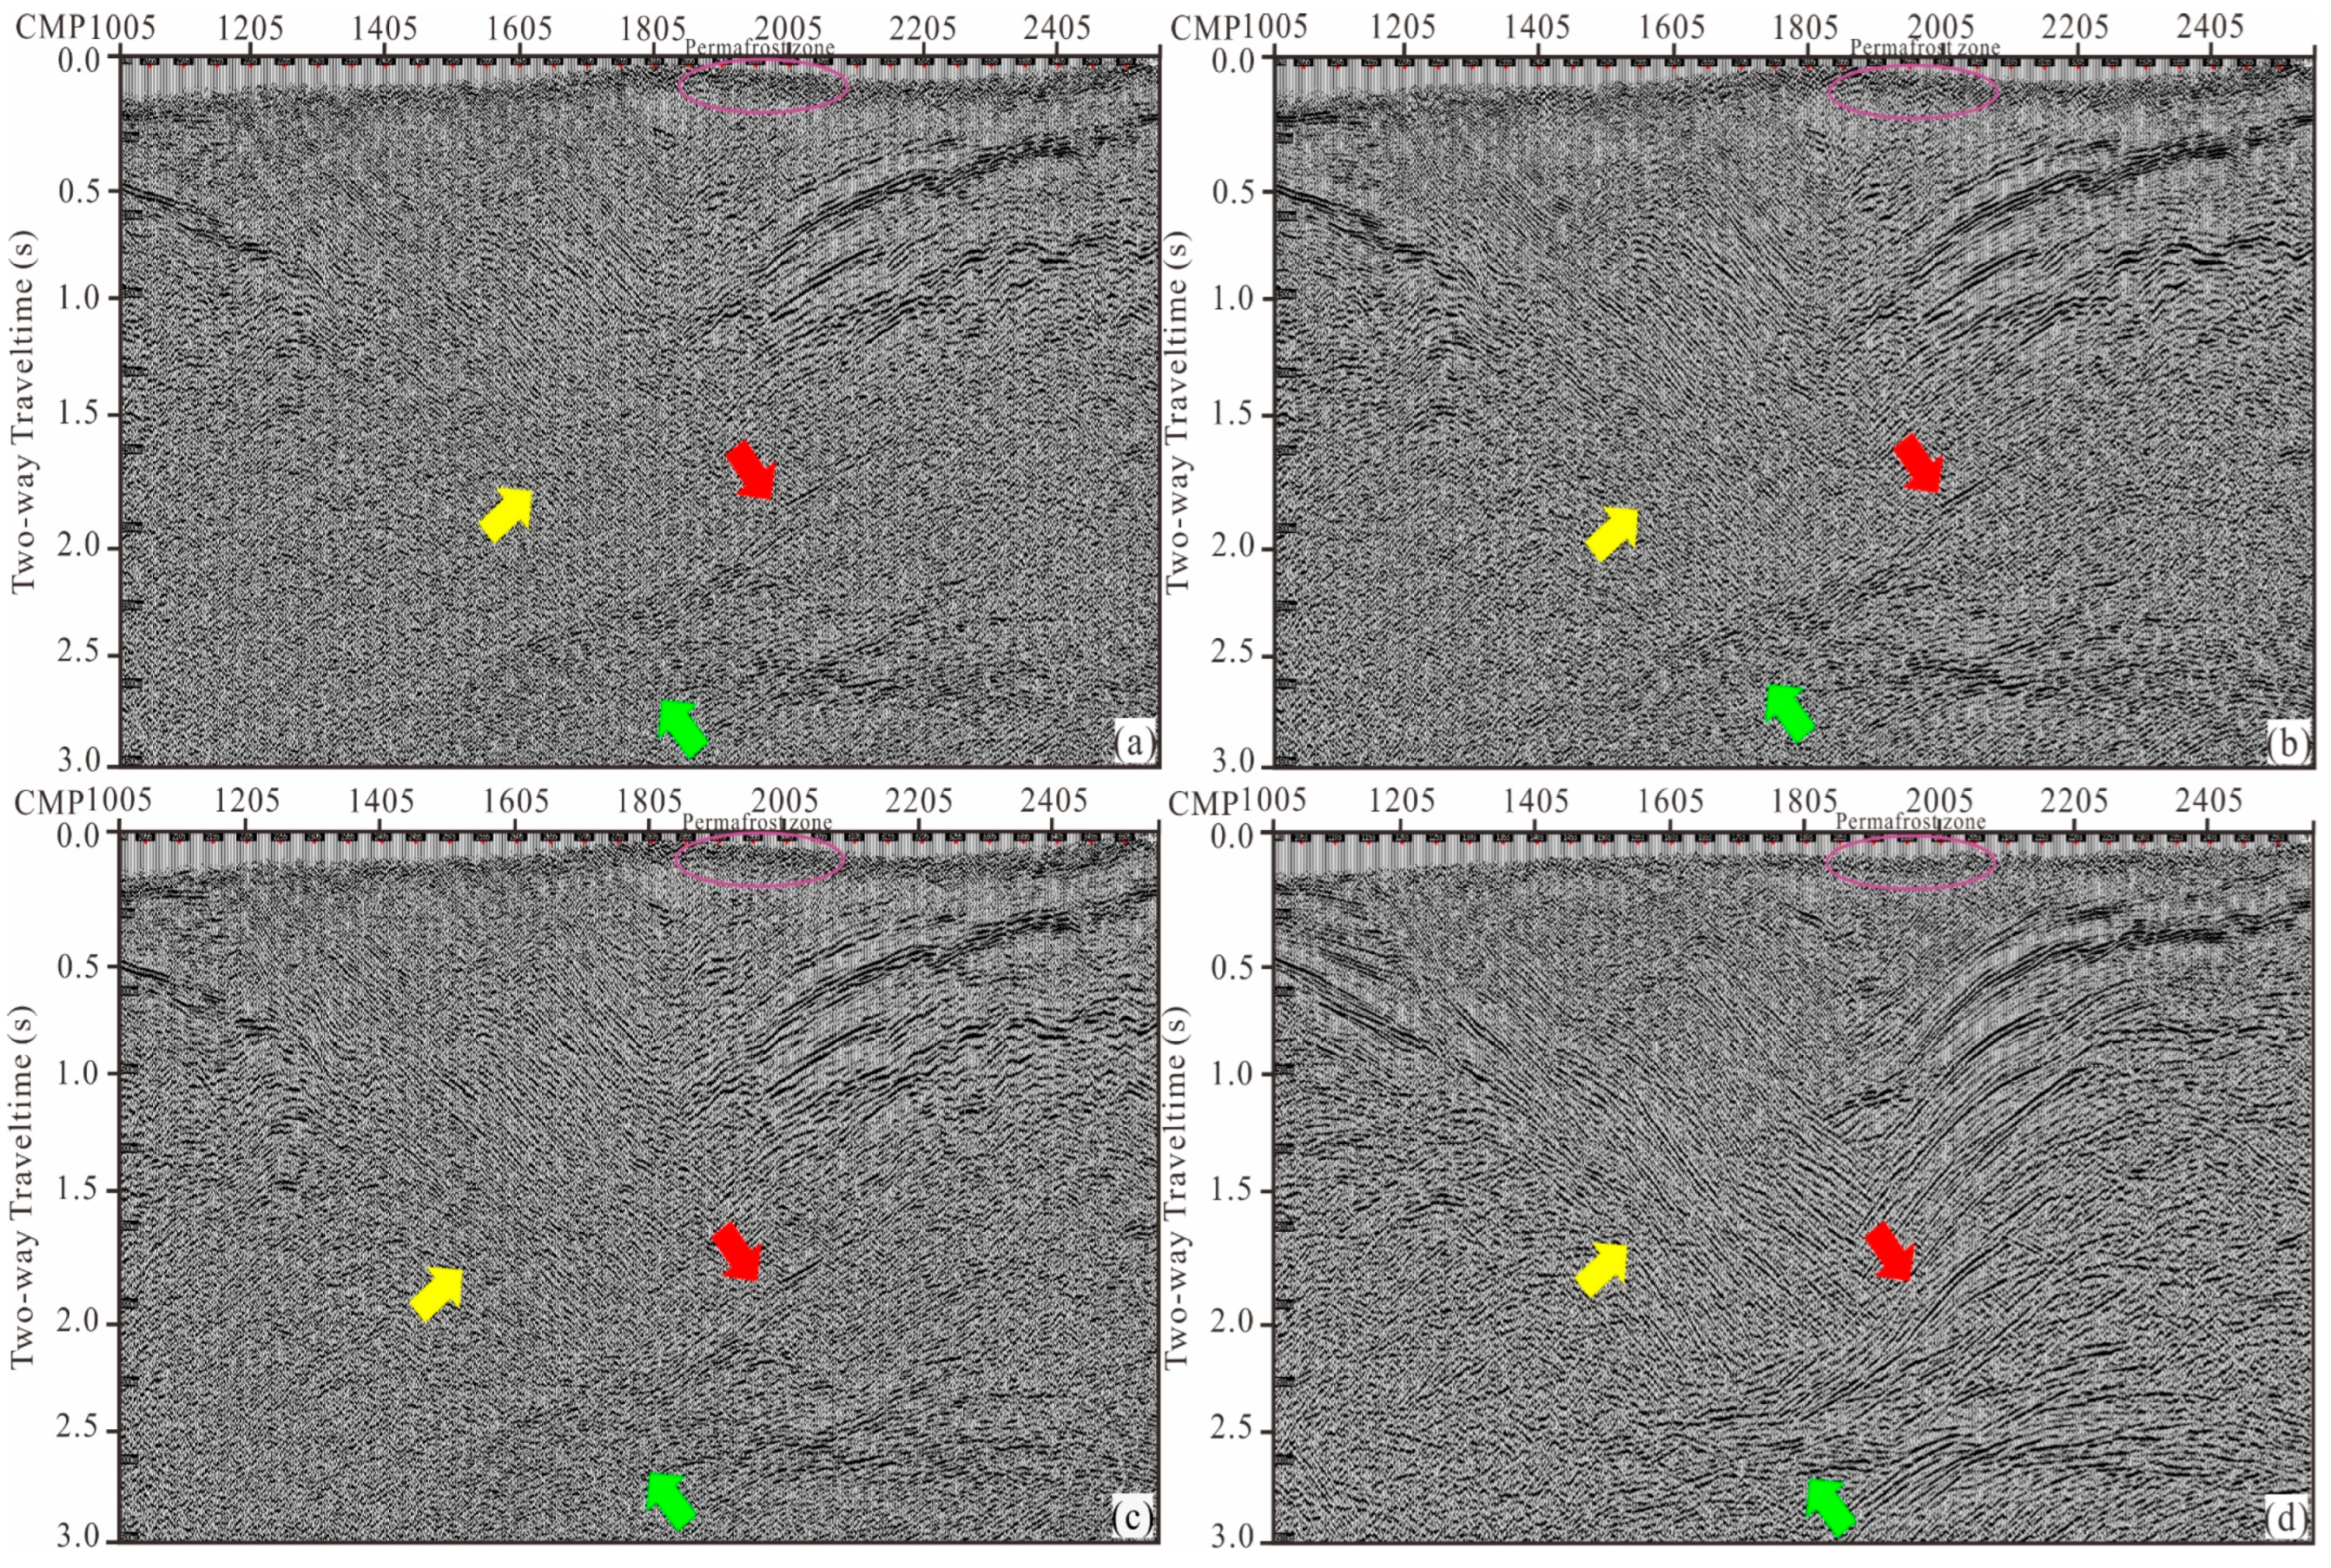
The CMP stacking profile (Figure 8a) shows general SNR improvement in shallow steep-structure zones, yet deep-layer enhancing is limited.
(2)
PreRNA processing (Figure 8b) exhibits a moderate deep-layer SNR and cleaner stratigraphic resolution relative to semblance smoothing, revealing distinct wave impedance features.
(3)
DMO Stacking enhances steeply dipping structures, oblique reflections, and diffraction tails, yielding improved section clarity (Figure 8c).
(4)
CRS Stacking shows a significant SNR across both shallow and deep intervals relative to the other methods (Figure 8d), confirming its technical superiority for processing low-SNR data within permafrost environments.
The integrated analysis of CMP/shot gathers, velocity spectra, and profiles demonstrates that CRS stacking, when applied to preconditioned prestack gathers, achieves optimal seismic SNR enhancement in permafrost regions.

3.3. Comparison of CRS Stacking Migration Imaging

Utilizing high-SNR regularized prestack gathers derived from CRS stacking and a robust RMS velocity field, this study systematically evaluated poststack and prestack time/depth migration imaging. PSDM employed Kirchhoff wave-equation integral algorithms. The construction of the velocity–depth model followed a two-stage process to ensure geological plausibility:
(1)
PSTM velocity modeling: The RMS velocity field, derived from CRS-stacked velocity analysis, was converted into interval velocities using the Dix (1955) formula. This initial interval velocity model was iteratively refined through the careful flattening of CRP gathers, a step crucial for mitigating velocity errors induced by complex overburden effects and improving lateral velocity resolution.
(2)
PSDM velocity model calibration: The smoothed, time-domain interval velocity model was subsequently depth-converted to generate an initial depth velocity volume. This depth model was then rigorously calibrated using near-surface well-defined QZ3 and the subsurface flattening of common-depth-point (CDP) gathers, and structural constraints to yield the final, geologically consistent PSDM velocity model used for imaging.
Figure 9 compares the CRS-stacked profile with profiles generated from three migration approaches, including poststack time migration (PostSM), PSTM, and PSDM, using different velocity models. The key seismic identifications and structural interpretations are as follows:
(1)
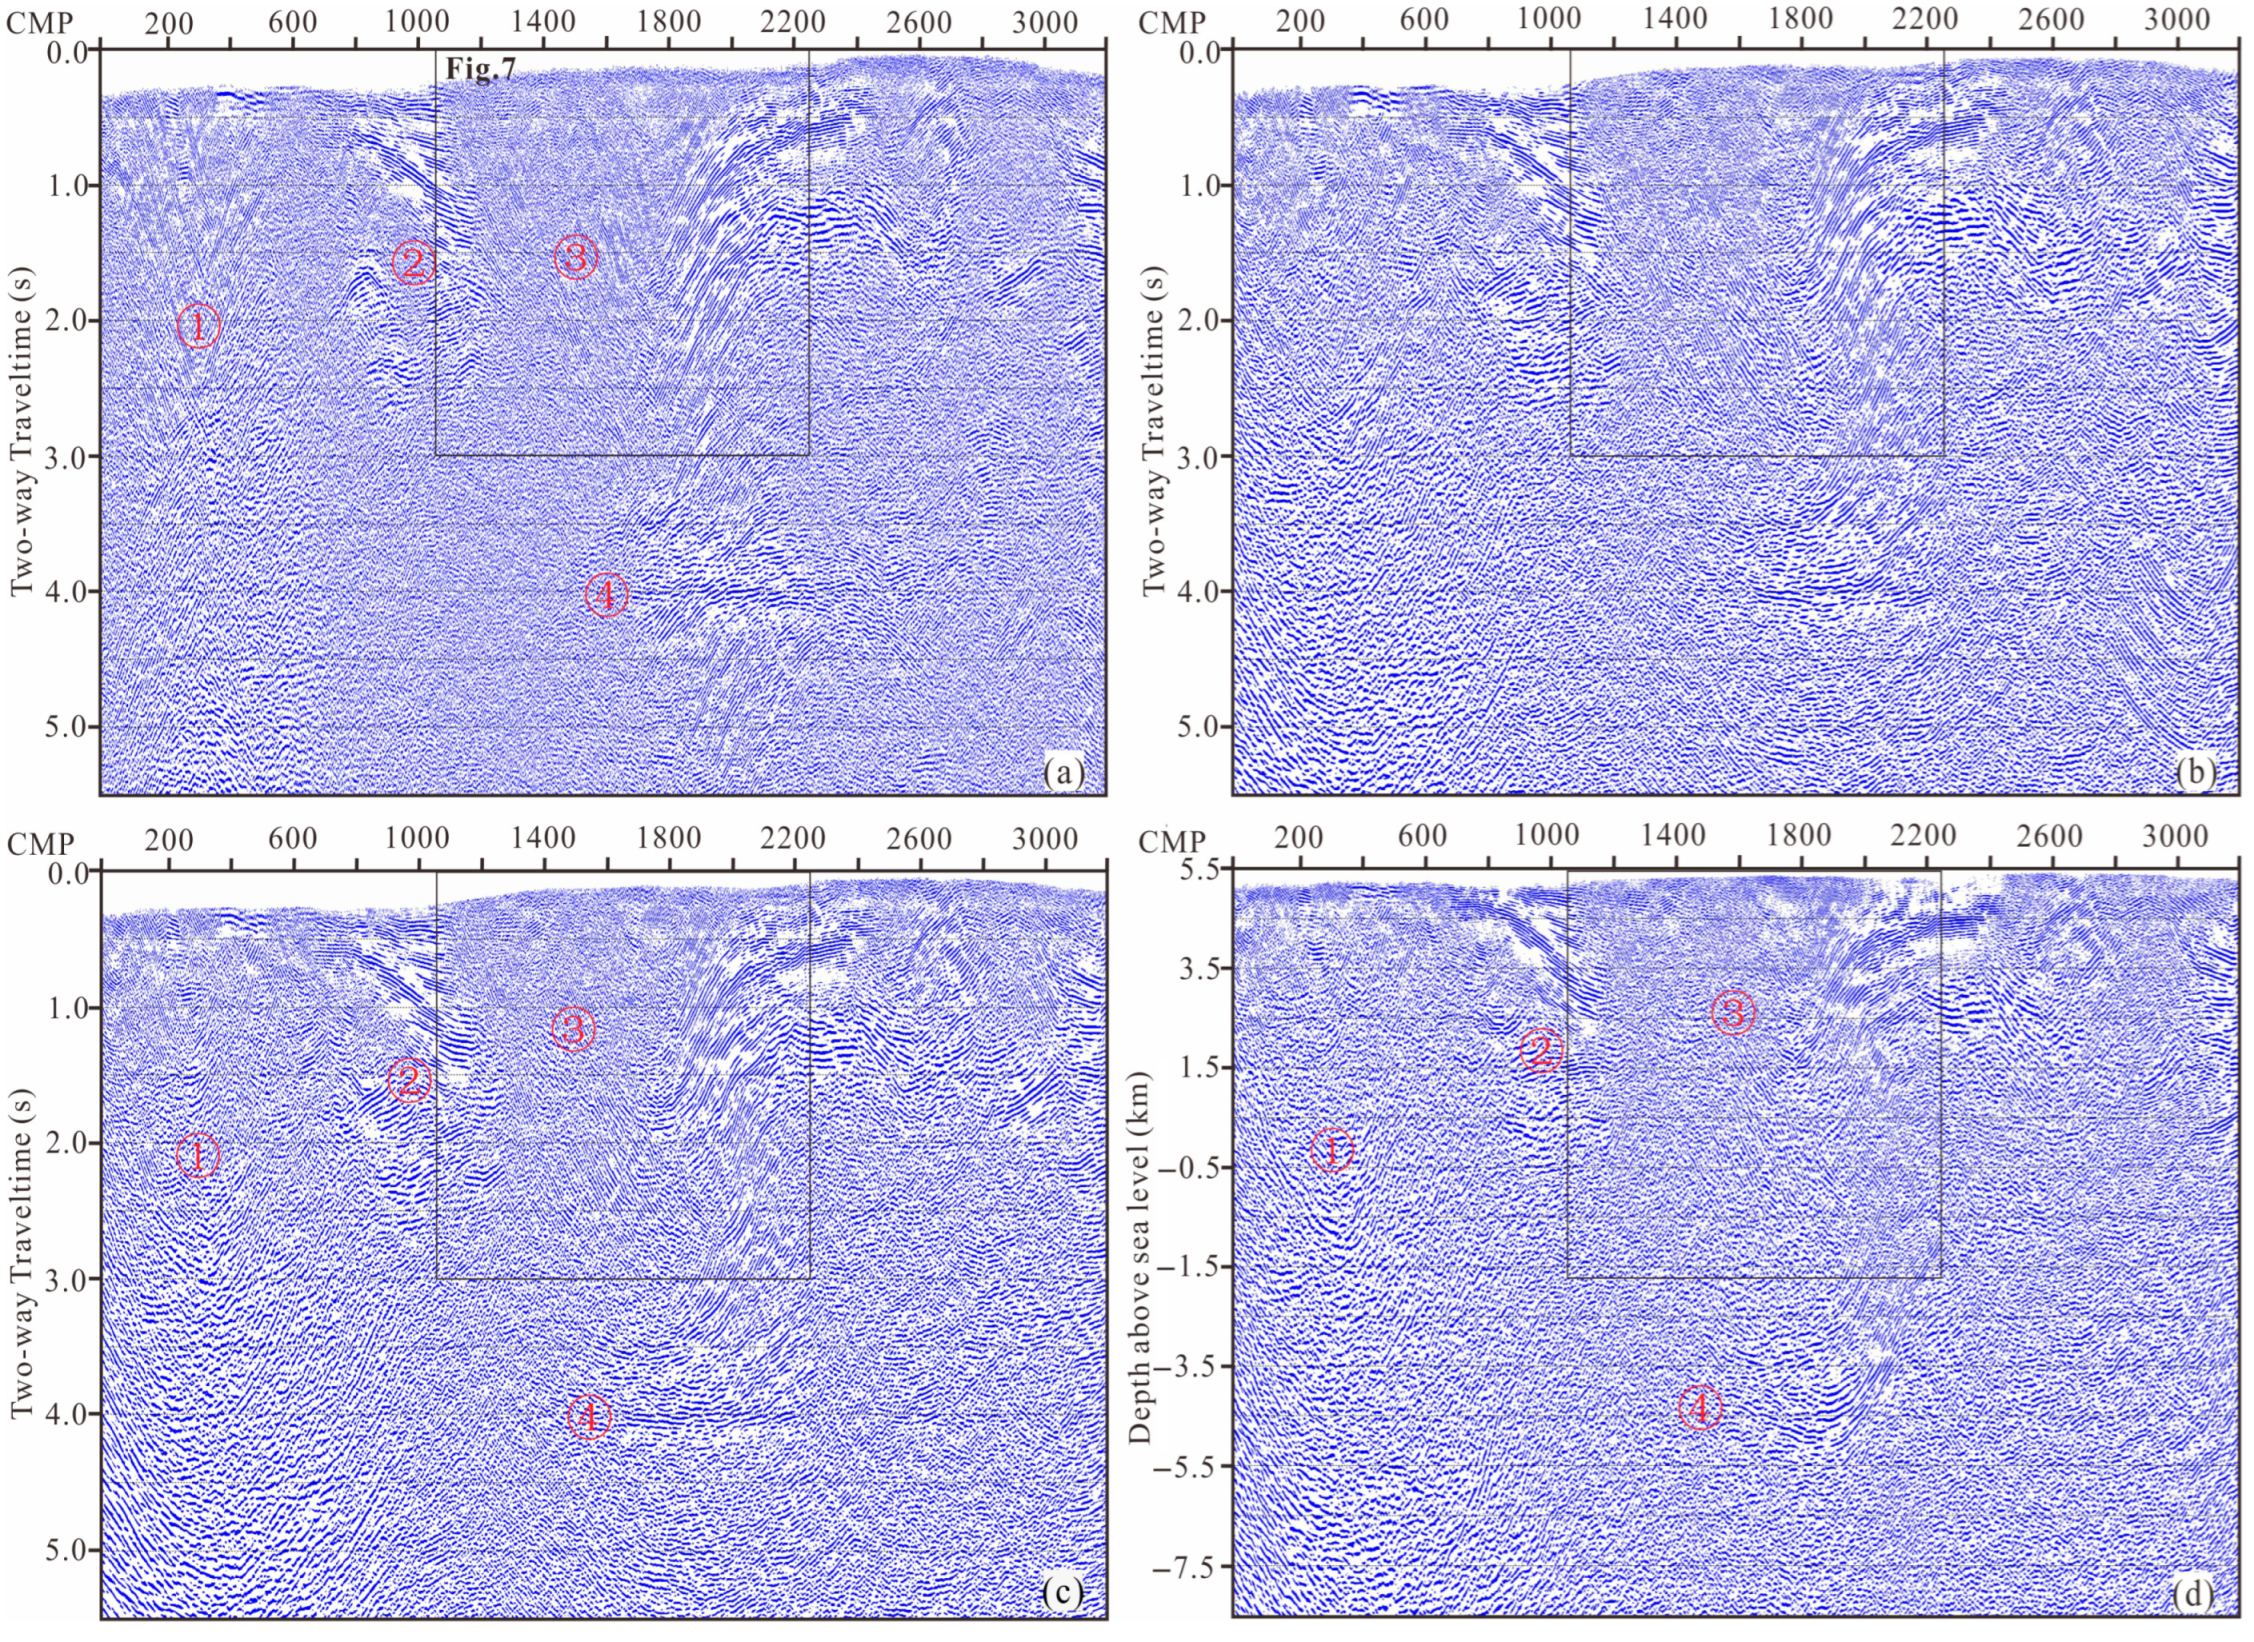
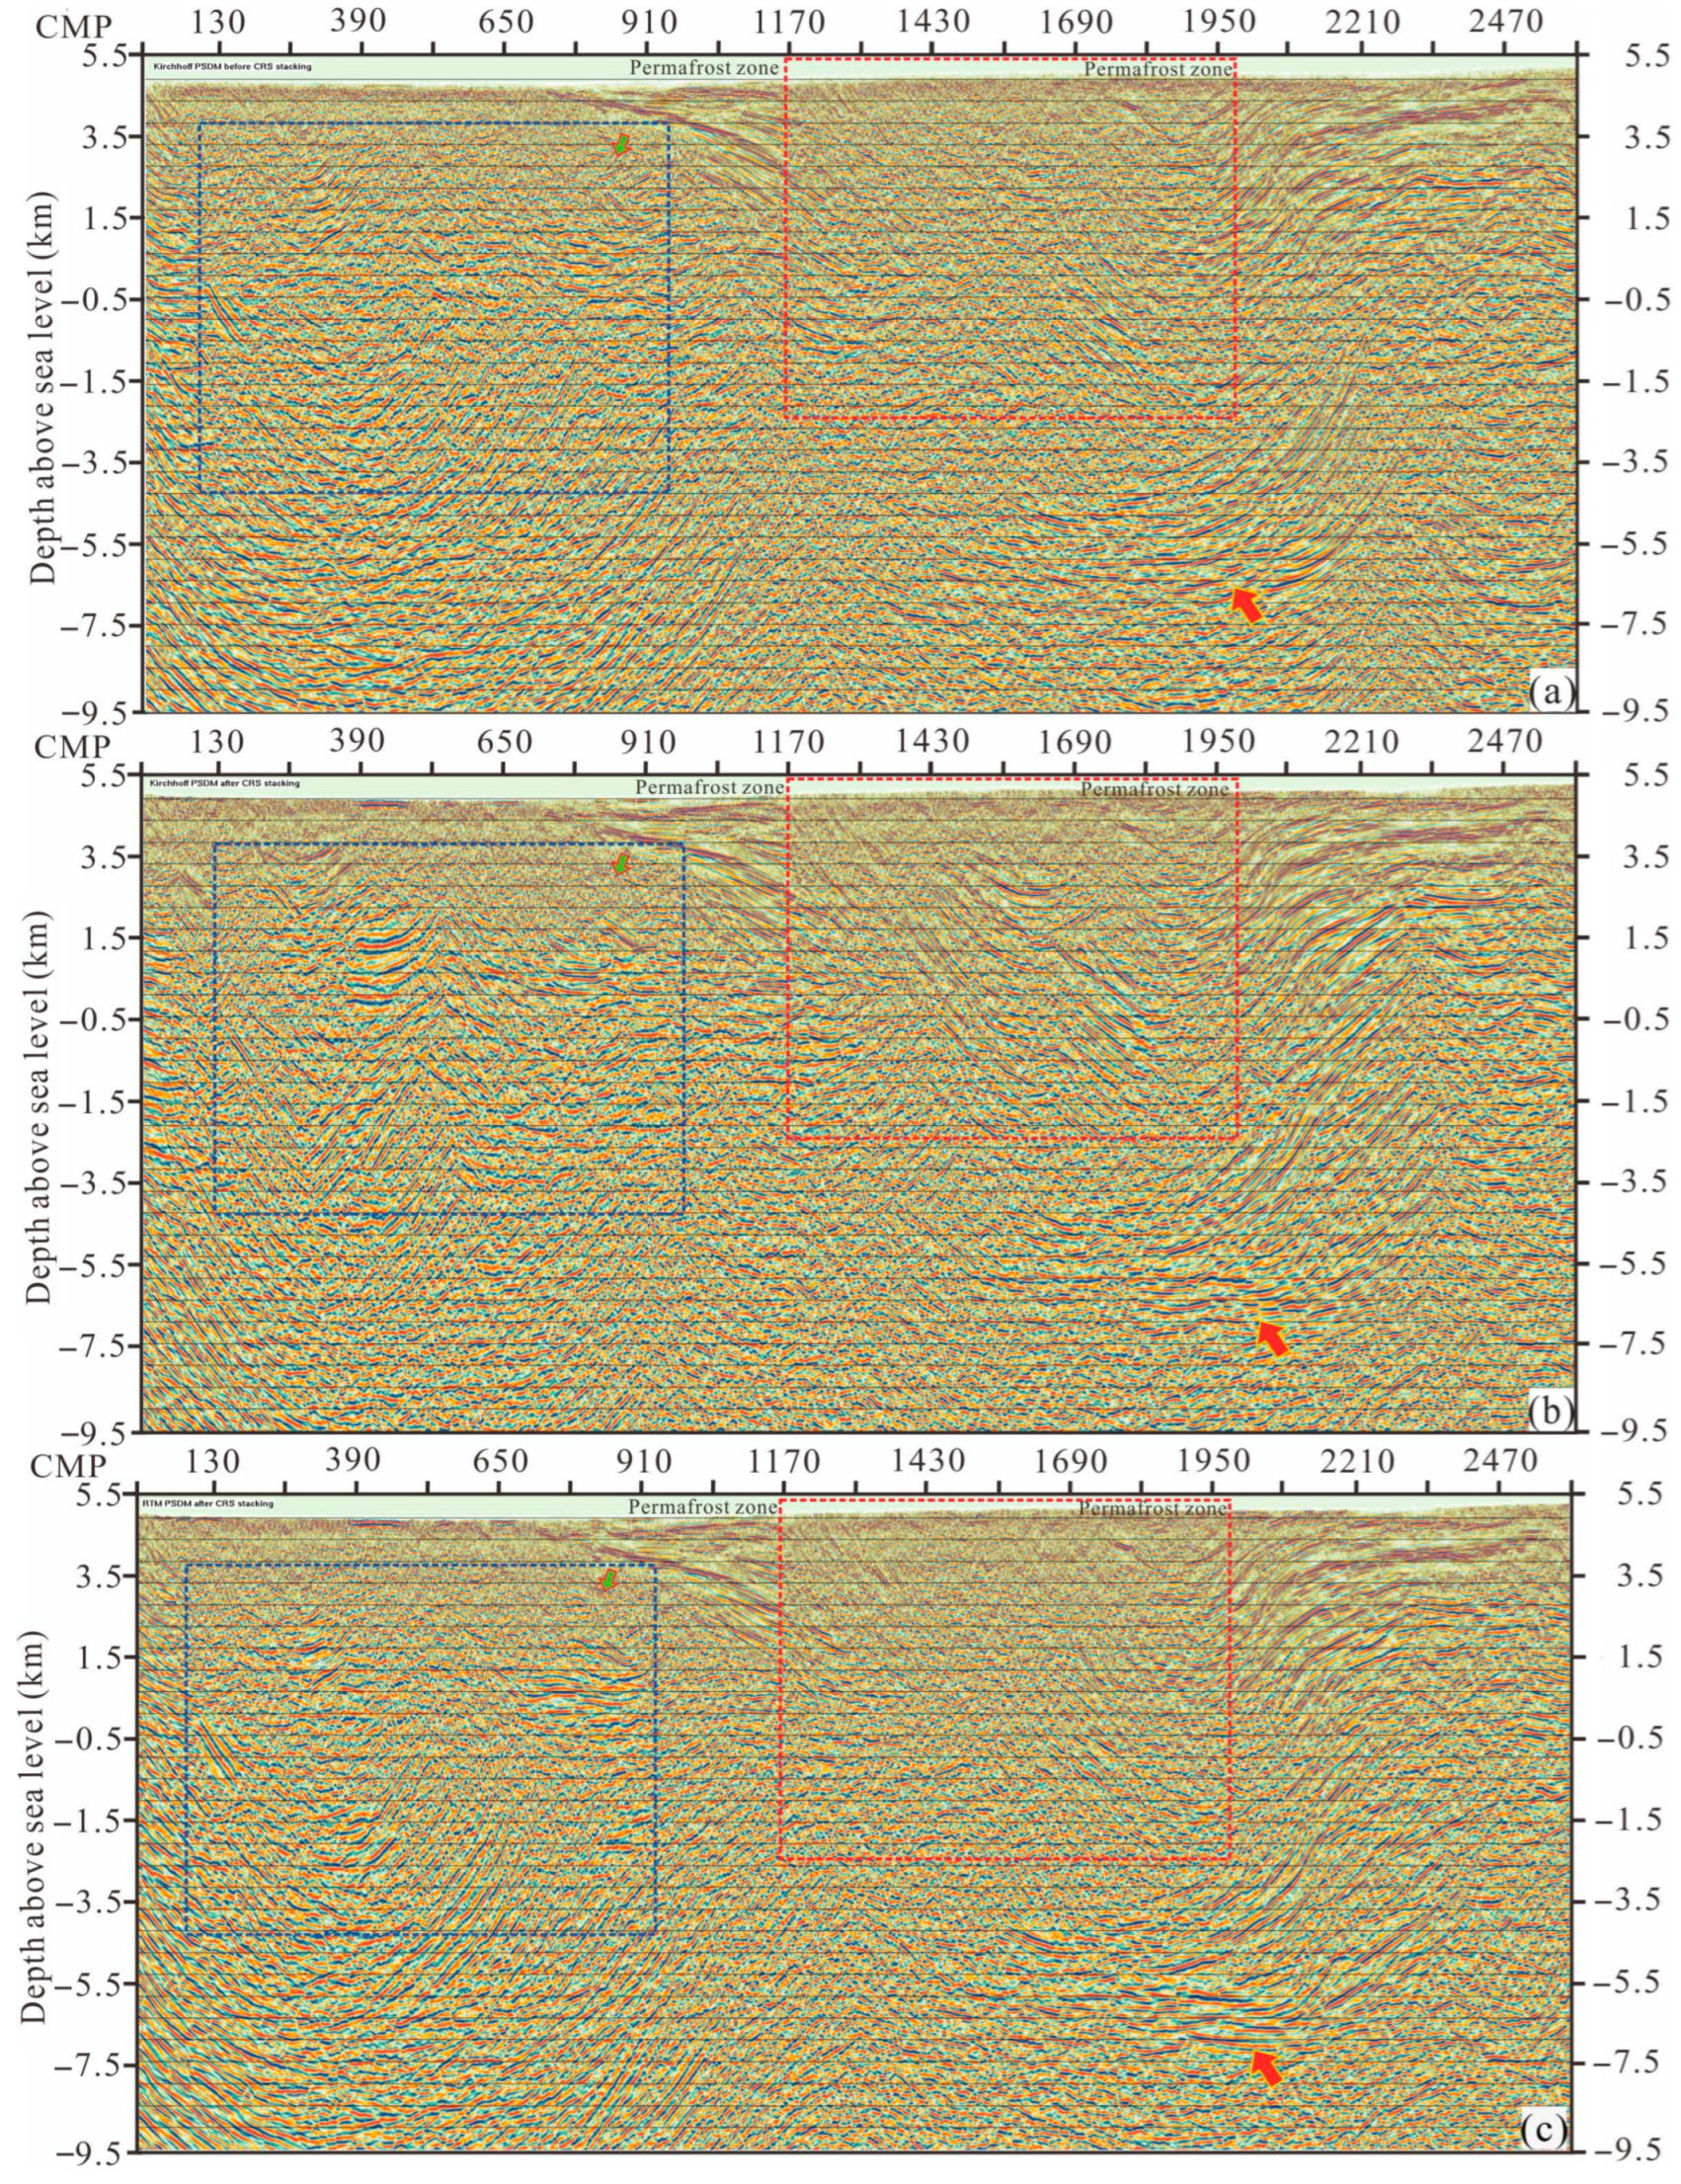
Position ④ (Deep LSSZ): The time-domain PostSM/PSTM profiles show horizontal interfaces where diffraction apexes indicate lateral fractures, while the depth-domain profiles reveal complex folding structures (Figure 9a,b). These features correspond to the LSSZ (Zhang et al., 2011) [12], interpreted as a tectonic response to paleo-ocean closure.
(2)
Position ① (Edged LSSZ): CRS stacking effectively preserves subtle, yet coherent, diffraction energy generated by complex rugosity at the edges of a deep structural depression. Kirchhoff PSDM successfully focuses this energy, yielding a well-defined image of the depression geometry, including its steeply dipping flanks and potential internal structural heterogeneities (Figure 8c,d).
(3)
Positions ②–③ (Shallow LSSZ): Within zones exhibiting significant structural complexity and steep dips, a critical observation is that both PSTM and PSDM, when applied to the CRS-optimized prestack gathers, maintained SNR levels comparable to the inherently smoother PostSM results. This demonstrates that the primary benefit of prestack migration in such contexts lies not merely in SNR enhancement—effectively achieved by the CRS stacking preconditioning—but in the significantly improved time/depth-domain velocity models.
This demonstrates that CRS-processed gathers, combined with iterative velocity analysis, critically support PSDM by enhancing both velocity model accuracy and data regularization. The workflow substantially improves imaging precision and structural interpretability in complex, permafrost-affected zones.
Figure 10 presents a comparison of Kirchhoff PSDM and reverse time migration (RTM) sections before and after CRS stacking, obtained using an identical depth-domain velocity model. Within deep target zones (indicated by the red arrow in Figure 10), all depth-domain sections exhibit high-SNR imaging, effectively revealing the geological structures of the basin basement and the northern flank of the LSSZ. In the near-surface permafrost zones and the deep structurally complex belt (red box in Figure 10), Kirchhoff PSDM with CRS stacking (Figure 10b) yields significantly enhanced imaging compared to Kirchhoff PSDM without CRS processing (Figure 10a), and compared to RTM with CRS stacking (Figure 10c). The less effective performance of RTM (Figure 10c) in this region is likely attributable to the lower velocity-model tolerance typical of RTM algorithms and their requirement for uniform shot-geometry distribution. Conversely, within deep sag areas (blue box in Figure 10), RTM (Figure 10c) outperforms CRS-based Kirchhoff PSDM by providing sharper delineation of sag-boundary features. This enhanced resolution aligns with the dense diffracted “bow-tie” patterns observed in Zone ① of the CMP stack (Figure 9a). Futhermore, a critical structural detail resolved by the CRS-enhanced Kirchhoff PSDM (green arrow in Figure 10b), not resolved as clearly in Figure 10a or Figure 10c, reveals both the lower boundary of monocline strata and an associated unconformity, indicative of syndepositional tectonic activity.

4. Discussion

The theoretical analyses and field applications presented herein demonstrate the significant technical advantages of CRS stacking for enhancing seismic SNRs within permafrost terrains. Beyond generating high-fidelity prestack gathers, CRS provides robust velocity model constraints essential for subsequent migration imaging. This is evidenced by the markedly improved imaging of steeply dipping structures (40–45° regional dip) and associated diffraction hyperbolae within the 2.0–3.0 s TWT interval of the Qiangtang Basin’s thrust system. The TS2008_SN## seismic profile, traversing the concealed Longmucuo–Shuanghu suture, reveals well-defined deep-seated suture characteristics between markers ① and ④ (corresponding to a 6–10 km depth in Figure 9d). These features, interpreted as tectonic imprints of Paleo-Tethyan oceanic closure, display enhanced coherency under CRS processing. Nevertheless, the precise characterization of compressional structures (e.g., thrust duplex geometries, fracture density) within this suture zone necessitates integration with regional geological mapping and complementary magnetotelluric (MT) datasets to resolve deep crustal conductivity variations [41].
CRS stacking efficacy is governed by three critically optimized parameters:
(1)
Fresnel Zone Aperture: Spatiotemporal aperture scaling (40 m at 0 s → 800 m at 4.0 s) dictates shallow-to-deep event coherency. Suboptimal values distort wavefront kinematics on inclined/curved interfaces, inducing the erroneous migration repositioning of diffraction apexes (Figure 7b and Figure 8d) and ambiguous fault-plane imaging—particularly problematic for fracture characterization in carbonates.
(2)
Maximum Structural Dip (45°): This dip constraint controls steep/reverse fault imaging. Time-domain migrations (Figure 9b,d) exhibit coherent event crossovers along deep depression margins, attributable to either 2D surface-wave mode contamination or excessive operator aperture. Depth-domain migration employing CRS-derived velocities effectively attenuates these artifacts, confirming that CRS gathers enhance both kinematic accuracy and amplitude fidelity during wavefield reconstruction.
(3)
Offset Regularization (60–7180 m, 80 m intervals): Angle-dependent parameter scanning requires the iterative calibration of mute functions and time-gate parameters to optimize AVA compliance, necessitating empirical testing for amplitude-preserving applications (e.g., AVO inversion).
While CRS stacking demonstrates efficacy in enhancing signal SNRs for permafrost-affected data and implementing PSDM, we explicitly acknowledge its inherent limitations in challenging low-SNR regimes or strong anisotropic media.
(1)
The hyperbolic traveltime assumption underlying CRS processing becomes unstable when the SNR falls below 5 dB. In such cases, automated data-driven parameter optimization (e.g., aperture selection) may converge toward noise-dominated solutions, particularly where ambient seismic interference exceeds −10 dB relative to primary amplitudes. This necessitates conservative aperture constraints and iterative geophysical QC (many crossing events are shown in Figure 8d).
(2)
CRS kinematics presume isotropic wave propagation, rendering it suboptimal for strongly anisotropic sequences (e.g., shale-dominated thrust belts with Thomsen parameters ε > 0.3). Many big dip-angles in the deep strata (Figure 10b,c) reveal lateral variation in the first Fresnel zone aperture in our study area’s ice-rich permafrost zones, attributable to unaccounted VTI effects. Such limitations compound in complex overburdens exhibiting azimuthal anisotropy.
These constraints do not negate CRS’s value for velocity model refinement, but mandate complementary processing (e.g., prestack azimuthal anisotropy correction) when drilling targets reside below high-dip anisotropic formations. Future implementations could integrate anisotropic CRS formulations [42].
Additionally, whilst CRS stacking offers clear imaging benefits, its computational demands present challenges for high-fold datasets (e.g., 3000-fold Qiangtang Basin 2D data). Offset regularization tests suggest a viable workflow: applying pre-CRS CMP-domain offset regularization reduces the effective fold by ~40% whilst maintaining processing efficacy—particularly advantageous for cost-effective regional 2D surveys targeting structural traps.
Key future research directions include:
(1)
Multi-geophysical integration: The joint inversion of seismic CRS attributes with electromagnetic (EM) and aeromagnetic datasets to resolve suture-zone geometry and basement involvement, particularly through the co-rendering of CRS-derived structural fabrics with magnetotelluric (MT) resistivity sections.
(2)
Algorithmic advancement: The development of dip-adaptive aperture schemes balancing diffraction preservation and migration-noise suppression using local wavefield curvature constraints, with explicit testing on 3D field datasets from permafrost-affected zones or petroliferous basins to evaluate scalability.
(3)
Physical-property inversion: The integration of CRS kinematic attributes as regularization constraints for full-waveform inversion (FWI) to refine data-driven velocity models in permafrost-affected zones and implement RTM imaging, leveraging the signal enhancement from CRS supergathers.
(4)
High-performance computing: The implementation of GPU-accelerated CRS kernels, enabling real-time QC for large 3D surveys and small offset intervals, while addressing memory bottlenecks through domain decomposition strategies.

5. Conclusions

This study pioneers the application of CRS stacking to PSDM in low-SNR permafrost terrains with complex structural geometries. Theoretical analysis and field validation demonstrate that CRS stacking overcomes limitations inherent to conventional layer-stripping approaches, offering distinct advantages for both signal enhancement and depth imaging in fold-and-thrust belts. The key findings from the Qiangtang Basin permafrost zone reveal the following:
  • CRS stacking surpasses legacy processing (CMP FlexBinning, DMO stacking, PreRNA) in improving SNRs across shallow-to-deep intervals. By optimizing Fresnel zone radii and structural dip constraints (≤45°), it enhances reflection continuity while preserving the diffraction signatures essential for fault-zone characterization.
  • The method delivers more accurate stacking velocities and preserves critical diffraction energy adjacent to fault planes, providing robust velocity constraints for PSDM model building.
  • Regularized CMP/shot gathers from CRS processing facilitate high-fidelity PSDM and migration velocity analysis (MVA), markedly improving structural resolution and event coherency in migrated profiles.
These results establish CRS stacking as a foundational preprocessing technology for seismic imaging in low-SNR environments, particularly in high-altitude permafrost regions like the Qiangtang Basin. Its dual capacity for noise suppression and complex-structure illumination renders it transferable to analogous tectonically active terrains where conventional methods falter. Future work should develop parameter optimization schemes for ultra-high-fold acquisitions and integrate multi-physical constraints to refine tectonic models of paleo-suture zones.

Author Contributions

Conceptualization, Z.L.; Methodology, R.L.; Software, Z.L.; Validation, X.W. and Z.Z.; Formal analysis, X.W.; Investigation, Z.Z.; Resources, Z.L.; Data curation, Z.L.; Writing—original draft, R.L.; Writing—review & editing, R.L. and Z.L.; Visualization, R.L. and Z.Z.; Supervision, X.W.; Project administration, Z.L.; Funding acquisition, Z.L. and X.W. All authors have read and agreed to the published version of the manuscript.

Funding

This work was supported by the Industrial Cooperative Research Project (Grants SMDZ[KY]-2020-004 and SMDZ-2023ZD-13) and the China Geological Survey Project (Grants DD20211343 and DD20221855).

Data Availability Statement

Data supporting this study are available from the corresponding author upon reasonable request.

Acknowledgments

We thank Researchers Fuwen Tan and Zhongxiong Li (China Geological Survey, Chengdu Center) for providing data support and engaging in technical discussions. We also acknowledge undergraduate and graduate students (School of Geophysics and Information Technology, China University of Geosciences, Beijing) for assisting with first-break picking. The CRS processing was performed using the 2D CRS software from CRSteec GmbH, Germany. Other conventional processing was carried out using the OMEGA software from Schlumberger.

Conflicts of Interest

The authors declare no conflicts of interest.

References

  1. Wu, Z.; Gao, R.; Lu, Z.; Ye, P.; Lu, L.; Yin, C. Structures of the Qiangtang Basin and their significance to oil-gas exploration. Acta Geol. Sin. 2014, 88, 1130–1144. [Google Scholar]
  2. Wu, Z.; Ji, C.; Zhao, Z.; Yang, Y. Main source rock and oil resource potential of the Bandaohu-Donghu area in the northern Qiangtang Basin. Acta Geol. Sin. 2019, 93, 1738–1753. [Google Scholar]
  3. Wang, J.; Wang, Z.; Fu, X.; Song, C.; Tan, F.; Wei, H. New discoveries from the first petroleum scientific drilling (QK-1) in the Qiangtang Basin, Tibetan Plateau. Chin. Sci. Bull. 2022, 67, 321–328. [Google Scholar] [CrossRef]
  4. Anees, A.; Zhong, S.W.; Ashraf, U.; Abbas, A. Development of a Computer Program for Zoeppritz Energy Partition Equations and Their Various Approximations to Affirm Presence of Hydrocarbon in Missakeswal Area. Geosciences 2017, 7, 55–67. [Google Scholar]
  5. Li, Z.; Wei, H.; Ma, L.; Ye, T. Vibroseis acquisition tests in the Qiangtang Basin. Oil Geophys. Prospect. 2017, 52, 199–208. (In Chinese) [Google Scholar]
  6. Liu, Z.; Feng, H.; Lu, Y.; Gao, Y.; Zhou, L. An integrated long-wavelength statics method applied to seismic processing of Tibetan permafrost. Near Surf. Geophys. 2022, 20, 147–159. [Google Scholar] [CrossRef]
  7. Zhang, H.; Liu, Z.; He, R.; Li, Q. Near-surface shear wave velocity structure inversion using multi-order surface wave dispersion curves constructed from deep seismic reflection data: A case study across the Bangong-Nujiang suture zone. Chin. J. Geophys. 2020, 63, 4410–4430. (In Chinese) [Google Scholar]
  8. Qin, T.; Duan, Y.; Zhao, Y. Application of attribute parameters of common reflection surface (CRS) stack wave field. Oil Geophys. Prospect. 2006, 41, 530–533. (In Chinese) [Google Scholar]
  9. Markus, V.S.; Alexander, G. Imaging walkway VSP data using the common-reflection-surface stack. Lead. Edge 2007, 26, 764–768. [Google Scholar]
  10. Mikyung, Y.; Mikhail, B.; Stefen, D.; Brink, H.-J.; Gajewski, D. New insight into the crustal structure of the North German Basin from reprocessing of seismic reflection data using the common reflection surface stack. Int. J. Earth Sci. 2007, 97, 887–898. [Google Scholar] [CrossRef]
  11. Mikyung, Y.; Mikhail, B.; Stefen, D.; Brink, H.-J.; Gajewski, D. Reprocessing of deep seismic reflection data from the North German Basin with the common reflection surface stack. Tectonophysics 2009, 472, 273–283. [Google Scholar] [CrossRef]
  12. Zhang, J.; Chen, B.; Wang, X.; Liu, J.; Yang, X. Application research of common reflection surface stack based on equal traveltime surface. Oil Geophys. Prospect. 2011, 46, 881–889. (In Chinese) [Google Scholar]
  13. German, G.; Paul, L.S.; Liacir, S.L.; João, C.C. Part I—CRS stack: Global optimization of the 2D CRS attributes. J. Appl. Geophys. 2012, 85, 92–101. [Google Scholar]
  14. German, G.; Paul, L.S.; Carlos, A.F.; João, C.C. Part II—CRS-beam PSDM: Kirchhoff-beam prestack depth migration using the 2D CRS stacking operator. J. Appl. Geophys. 2012, 85, 102–110. [Google Scholar]
  15. Li, Z.; Sun, X.; Liu, H. Common reflection surface stack for rugged surface topography. Chin. J. Geophys. 2006, 49, 1794–1801. (In Chinese) [Google Scholar] [CrossRef]
  16. Endrias, G.A.; Leiv, J.G.; Martin, T. Higher-resolution determination of zero-offset common-reflection-surface stack parameters. Int. J. Geophys. 2011, 2011, 1–10. [Google Scholar]
  17. Hubral, P. Computing true amplitude reflections in a laterally inhomogeneous earth. Geophysics 1983, 48, 1052–1062. [Google Scholar] [CrossRef]
  18. Jäger, R.; Mann, J.; Höcht, G.; Hubral, P. Common-reflection-surface stack: Image and attributes. Geophysics 2001, 66, 97–109. [Google Scholar] [CrossRef]
  19. Elive, M.; Dirk, G.; Christian, H. Imaging of complex basin structures with the common reflection surface (CRS) stack method. Geophys. J. Int. 2004, 157, 1206–1216. [Google Scholar] [CrossRef]
  20. Garabito, G.; Oliva, P.C.; Ribeiro, C.C. Numerical analysis of the finite-offset common-reflection-surface traveltime approximations. J. Appl. Geophys. 2011, 74, 89–99. [Google Scholar] [CrossRef]
  21. Ni, Y.; Yang, K. 3D common reflection surface stack algorithm-based GPU with the output imaging scheme (3D-CRS-OIS). Oil Geophys. Prospect. 2013, 48, 49–57. (In Chinese) [Google Scholar]
  22. Wang, Z.; Yang, K.; Dong, S. Dip discrimination reduction with CRS-OIS. Oil Geophys. Prospect. 2015, 50, 839–847. (In Chinese) [Google Scholar]
  23. Sergius, D.; Dirk, G. Common-reflection-surface-based workflow for diffraction imaging. Geophysics 2011, 76, S187–S195. [Google Scholar]
  24. Birgin, E.G.; Biloti, R.; Tygel, M.; Santos, L.T. Restricted optimization: A clue to a fast and accurate implementation of the common reflection surface stack method. J. Appl. Geophys. 1999, 42, 143–155. [Google Scholar] [CrossRef]
  25. Li, Z.; Yao, Y.; Ma, Z.; Wang, H. Common reflection surface stack method based on multi-level optimization of parameters and its application. Oil Geophys. Prospect. 2003, 38, 156–161. (In Chinese) [Google Scholar]
  26. Sun, X.; Jia, Y.; Li, Z. Common reflection surface stack based on parameter searching by PSO. Oil Geophys. Prospect. 2019, 54, 782–786. (In Chinese) [Google Scholar]
  27. Eric, D.B. Normal moveout revisited: Inhomogeneous media and curved interfaces. Geophysics 1988, 53, 143–157. [Google Scholar] [CrossRef]
  28. Bashir, Y.; bin Waheed, U.; Ali, S.H.; Karaman, A.; İmren, C. Enhanced wave modeling & optimal plane-wave destruction (OPWD) method for diffraction separation and imaging. Comput. Geosci. 2024, 187, 105576. [Google Scholar] [CrossRef]
  29. Mikhail, B.; Dirk, G. Prestack seismic data enhancement with partial common-reflection-surface (CRS) stack. Geophysics 2008, 74, V49–V58. [Google Scholar]
  30. Schwarz, B.; Vanelle, C.; Gajewski, D.; Kashtan, B. Curvatures and inhomogeneities: An improved common-reflection-surface approach. Geophysics 2014, 79, S231–S240. [Google Scholar] [CrossRef]
  31. Yang, W.; Wang, R.; Wu, J.; Chen, Y.; Gan, S.; Zhong, W. An efficient and effective common reflection surface stacking approach using local similarity and plane-wave flattening. J. Appl. Geophys. 2015, 117, 67–72. [Google Scholar] [CrossRef]
  32. Marcin, P.; Klaus, B.; Manfred, S.; Wieslaw, B. Improved 3D seismic attribute mapping by CRS stacking instead of NMO stacking: Application to a geothermal reservoir in the Polish Basin. J. Appl. Geophys. 2014, 103, 186–198. [Google Scholar] [CrossRef]
  33. Juergen, P.; Sven, F.; Rodolfo, B.; Alfredo, C.; Gerardo, C. CRS-based depth model building and imaging of 3D seismic data from the Gulf of Mexico coast. Geophysics 2008, 73, VE303–VE311. [Google Scholar] [CrossRef]
  34. Leiv, J.G.; Martin, T. Migration-velocity building in time and depth from 3D(2D) common-reflection-surface (CRS) stacking: Theoretical framework. Stud. Geophys. Geod. 2014, 59, 253–282. [Google Scholar]
  35. Dai, J.; Yang, Y.; Li, Z. 3D seismic data multi-survey merging processing and key techniques with the GRISYS processing system. Oil Geophys. Prospect. 2009, 44, 52–56. (In Chinese) [Google Scholar]
  36. Bergler, S.; Hubral, P.; Marchetti, P.; Cristini, A.; Cardone, G. 3D common-reflection-surface stack and kinematic wavefield attributes. Lead. Edge 2002, 21, 1010–1015. [Google Scholar] [CrossRef]
  37. Gerald, E.K.; Juergen, P.; Guido, G.; Henning, T. Noise reduction in 2D and 3D seismic imaging by the CRS method. Lead. Edge 2008, 27, 258–265. [Google Scholar] [CrossRef]
  38. Ashraf, U.; Zhang, H.; Anees, A.; Zhang, X.; Duan, L. Assessment of lake-level variations to decipher geological controlling factors and depositional architecture of Lake Fuxian, Yunnan Plateau: Preliminary insights from geophysical data. Geomech. Geophys. Geoenerg. Georesour. 2024, 10, 1–26. [Google Scholar] [CrossRef]
  39. Ali, M.; Changxingyue, H.; Wei, N.; Jiang, R.; Zhu, P.; Hao, Z.; Hussain, W.; Ashraf, U. Optimizing seismic-based reservoir property prediction: A synthetic data-driven approach using convolutional neural networks and transfer learning with real data integration. Artif. Intell. Rev. 2025, 58, 1–27. [Google Scholar] [CrossRef]
  40. Mikhail, B.; Stefan, D.; Dirk, G. From time to depth with CRS attributes. Geophysics 2011, 76, S151–S155. [Google Scholar] [CrossRef]
  41. Xiong, S.; Zhou, D.; Cao, B.; Zhao, R.; Wei, Y.; Hu, Y.; Xiao, M.; Duan, H.; Hu, X.; Zheng, Y. Characteristics of the central uplift zone in the Qiangtang Basin and its tectonic implications: Evidence from airborne gravity and magnetic data. Chin. J. Geophys. 2020, 63, 3491–3504. (In Chinese) [Google Scholar]
  42. Rodrigo, B.; Tiago, A.C.; Jorge, H.F.; Tygel, M. Common-reflection-surface method in weakly anisotropic vertical transverse isotropic media. Geophysics 2018, 83, C99–C113. [Google Scholar]
Figure 1. Geologic map and seismic line positions of low-SNR permafrost zone in Qiangtang Basin. Study area is located in eastern Central Qiangtang Uplift, with N-S seismic lines crossing LSSZ. Surface exhibits E-W-trending Mesozoic–Cenozoic strata, “back-stroke” thrust structures controlled by NE-SW strike-slip faults, and complex subsurface features. Denuded depressions show extensive inland lakes/permafrost and near-surface Mesozoic high-velocity layers. Well-defined QZ3 (887.4 m) strata ranging from Quaternary System (0–90.37 m, clay) to Upper Jurassic Suowa Formation (90.37–312.6 m, sandstone; 312.6–887.4 m, marl interbeds).
Geosciences 15 00276 g001
Figure 2. Diagram of stacking theory between CMP and CRS. (a) Stacking ranges from CMP migration to zero-offset (ZO) migration; (b) ZO range of CRS stacking.
Geosciences 15 00276 g002
Figure 3. A diagram of reflection traveltimes on a horizontal oblique interface.
Geosciences 15 00276 g003
Figure 4. Comparison of CMP gathers before and after applying CRS stacking. (a) Raw CMP gather before CRS stacking at CMP 2250; (b) CMP gather after applying CRS stacking at CMP 2250; (c) raw CMP gather before CRS stacking at CMP 1750; (d) CMP gather after applying CRS stacking at CMP 1750.
Geosciences 15 00276 g004
Figure 5. Comparison of shot gathers before and after applying CRS stacking. (a) Raw shot gather before CRS stacking at FFID 384; (b) shot gather after applying CRS stacking at FFID 384; (c) raw shot gather before CRS stacking at FFID 187; (d) shot gather after applying CRS stacking at FFID 187.
Geosciences 15 00276 g005
Figure 6. Comparison of stacking velocity spectra calculated by CMP gathers before and after CRS stacking: (a) velocity spectra derived from raw CMP gathers; (b) velocity spectra after CRS stacking.
Geosciences 15 00276 g006
Figure 8. Comparison of CRS stacking section with other conventional CMP stacking sections. (a) CMP stacking with FlexBinning; (b) CMP stacking with PreRNA; (c) CMP stacking with DMO; (d) CRS stacking.
Geosciences 15 00276 g008
Figure 9. Comparison of CRS stacking section with migration sections after applying CRS stacking. (a) CRS stacking; (b) poststack time migration after CRS stacking; (c) PSTM after CRS stacking; (d) PSDM after CRS stacking.
Geosciences 15 00276 g009
Figure 10. Comparison of Kirchhoff PSDM and RTM sections before and after applying CRS stacking. (a) Kirchhoff PSDM before CRS stacking; (b) Kirchhoff PSDM after CRS stacking; (c) RTM after CRS stacking.
Geosciences 15 00276 g010
Table 1. Conventional seismic processing flow for permafrost-bearing zone in Qiangtang Basin.
Serial No.Seismic Processing MethodsKey ParametersSerial No.Seismic Processing MethodsKey Parameters
1Segy/Segd data inputNone12RMS velocity analysisDMO processing partly eliminating effects of inclined strata
2Definition of observing systems from SPS fileSmoothing radii: 500 m13Poststack time migrationOne-way wave equation migration
3Field + tomographic statics decomposition and applicationExtracting
long/middle/short-wavelength components
14RMS velocity QCChecking for convergence of diffractions
4Abnormal frequency/amplitude removal50 Hz industrial noise, DC voltages15Converting RMS velocity to time-domain interval velocityDix equation, velocity smoothing radii: 51 CRPs and 100 ms
5Ground-roll wave suppressionVelocity: 300–1200 m/s, frequency bandwidth: 2–15 Hz16Curved-ray Kirchhoff PSTMIterative processing, migration aperture: 12,000 m, anti-aliasing factor: 0.6–0.7
6Spherical compensationCompensating factor: 1.517Time-domain interval velocity QC by CRP flattening
7Surface-consistent amplitude compositionBalance amplitude value: 500018Converting interval velocity to depth-domain interval velocityDix equation, velocity smoothing radii: 51 CRPs and 100 ms
8Surface-consistent deconvolutionOperator length: 240 ms, prediction distance: 16/32 ms, white noise: 0.0119Wavefront reconstruction Kirchhoff PSDMIterative processing, migration aperture: 12,000 m, anti-aliasing factor: 0.6–0.7
9NMO velocity analysis and residual statics on reflectionsIterative processing, analysis interval: <400 m, maximum Correlation on reflections, equal-weight stacking20Depth-domain interval velocity QC by CRP flattening
10CMP stacking21CRP stackingEqual-weight stacking
11Prestack RNASelecting SNR-optimal processing based on shot, CMP gathers22Automatic gain control and bandwidth-limited filteringControl window: 750 m, bandpass filtering
Note: CRP, common reflection point.
Table 2. Seismic acquisition observation system of line TS2008_SN##.
Line NumberAcquisition TimeObservation Pattern (m)Shots Interval (m)Shot FactorGeophone
TS2008_SN##In 20087180-40-20-40-718080/160Explosives (12–18 kg)DX-10 Hz
Acquisition InstrumentSampling Rate/LengthStatics Datum Replacing VelocityCMP Interval
Sercel 408X4 ms/8 s5500 m3500 m/s20 m
Disclaimer/Publisher’s Note: The statements, opinions and data contained in all publications are solely those of the individual author(s) and contributor(s) and not of MDPI and/or the editor(s). MDPI and/or the editor(s) disclaim responsibility for any injury to people or property resulting from any ideas, methods, instructions or products referred to in the content.

