1. Introduction
Infrasound waves are defined as acoustic waves with frequencies below 20 Hz. These low-frequency signals are generated by various natural and anthropogenic sources, including nuclear explosions, chemical detonations, earthquakes, landslides, and aircraft launches [
1]. Due to their unique physical properties—particularly strong penetration capability, low attenuation, and long propagation distances—infrasound waves have found widespread applications in multiple research domains. These include nuclear explosion detection [
2], natural disaster monitoring [
3], chemical explosion identification [
4], and geophysical investigations [
5,
6]. However, the extensive propagation range of infrasound signals presents significant challenges for detection and analysis. During atmospheric transmission, these signals are particularly vulnerable to contamination by environmental noise. This interference often obscures characteristic features of infrasound events and substantially reduces the signal-to-noise ratio (SNR). Consequently, conventional classification methods frequently fail to achieve the accuracy required for practical applications.
In recent years, deep learning techniques have demonstrated considerable potential in the classification of infrasound signals. Due to their powerful feature extraction capabilities, Convolutional Neural Networks (CNNs) have achieved notable success in classifying infrasound signals using time–frequency representations (e.g., spectrograms generated by short-time Fourier transform or wavelet transform) [
7,
8,
9]. Despite these advances, significant challenges remain. While time–frequency representations provide useful feature expression for infrasound signals, their performance is fundamentally constrained by the inherent trade-off between time and frequency resolution. More critically, these representations often fail to fully capture the spatiotemporal correlations present in infrasound signals. Compounding these limitations, time–frequency analysis methods exhibit particularly poor robustness in high-noise environments, where they frequently lose critical discriminative information. Given these constraints, the development of more effective feature representation methods, and their integration with advanced deep learning architectures, has emerged as a crucial research direction for improving infrasound classification performance.
To address these limitations, we propose a novel infrasonic signal classification framework combining Gramian Angular Field (GAF) encoding with a Convolutional Long Short-Term Memory Network (ConvLSTM). The GAF technique provides an effective two-dimensional representation of time series data by transforming one-dimensional infrasound signals into Gramian matrices in polar coordinates, preserving crucial temporal dependencies and phase relationships [
10,
11,
12]. Building upon this representation, our ConvLSTM-based architecture synergistically integrates the spatial feature extraction capabilities of Convolutional Neural Networks with the temporal modeling strengths of recurrent networks, enabling comprehensive spatiotemporal feature learning [
13].
This study specifically targets the challenging classification task of distinguishing between chemically explosive and seismic infrasonic events. Our methodology first constructs discriminative two-dimensional representations through GAF transformation, then performs hierarchical spatiotemporal feature extraction using the ConvLSTM network. Experimental validation demonstrates the superior performance of our approach, achieving a classification accuracy of 92.4%, which significantly outperforms existing infrasound signal classification methods.
2. Research Lines and Methodology
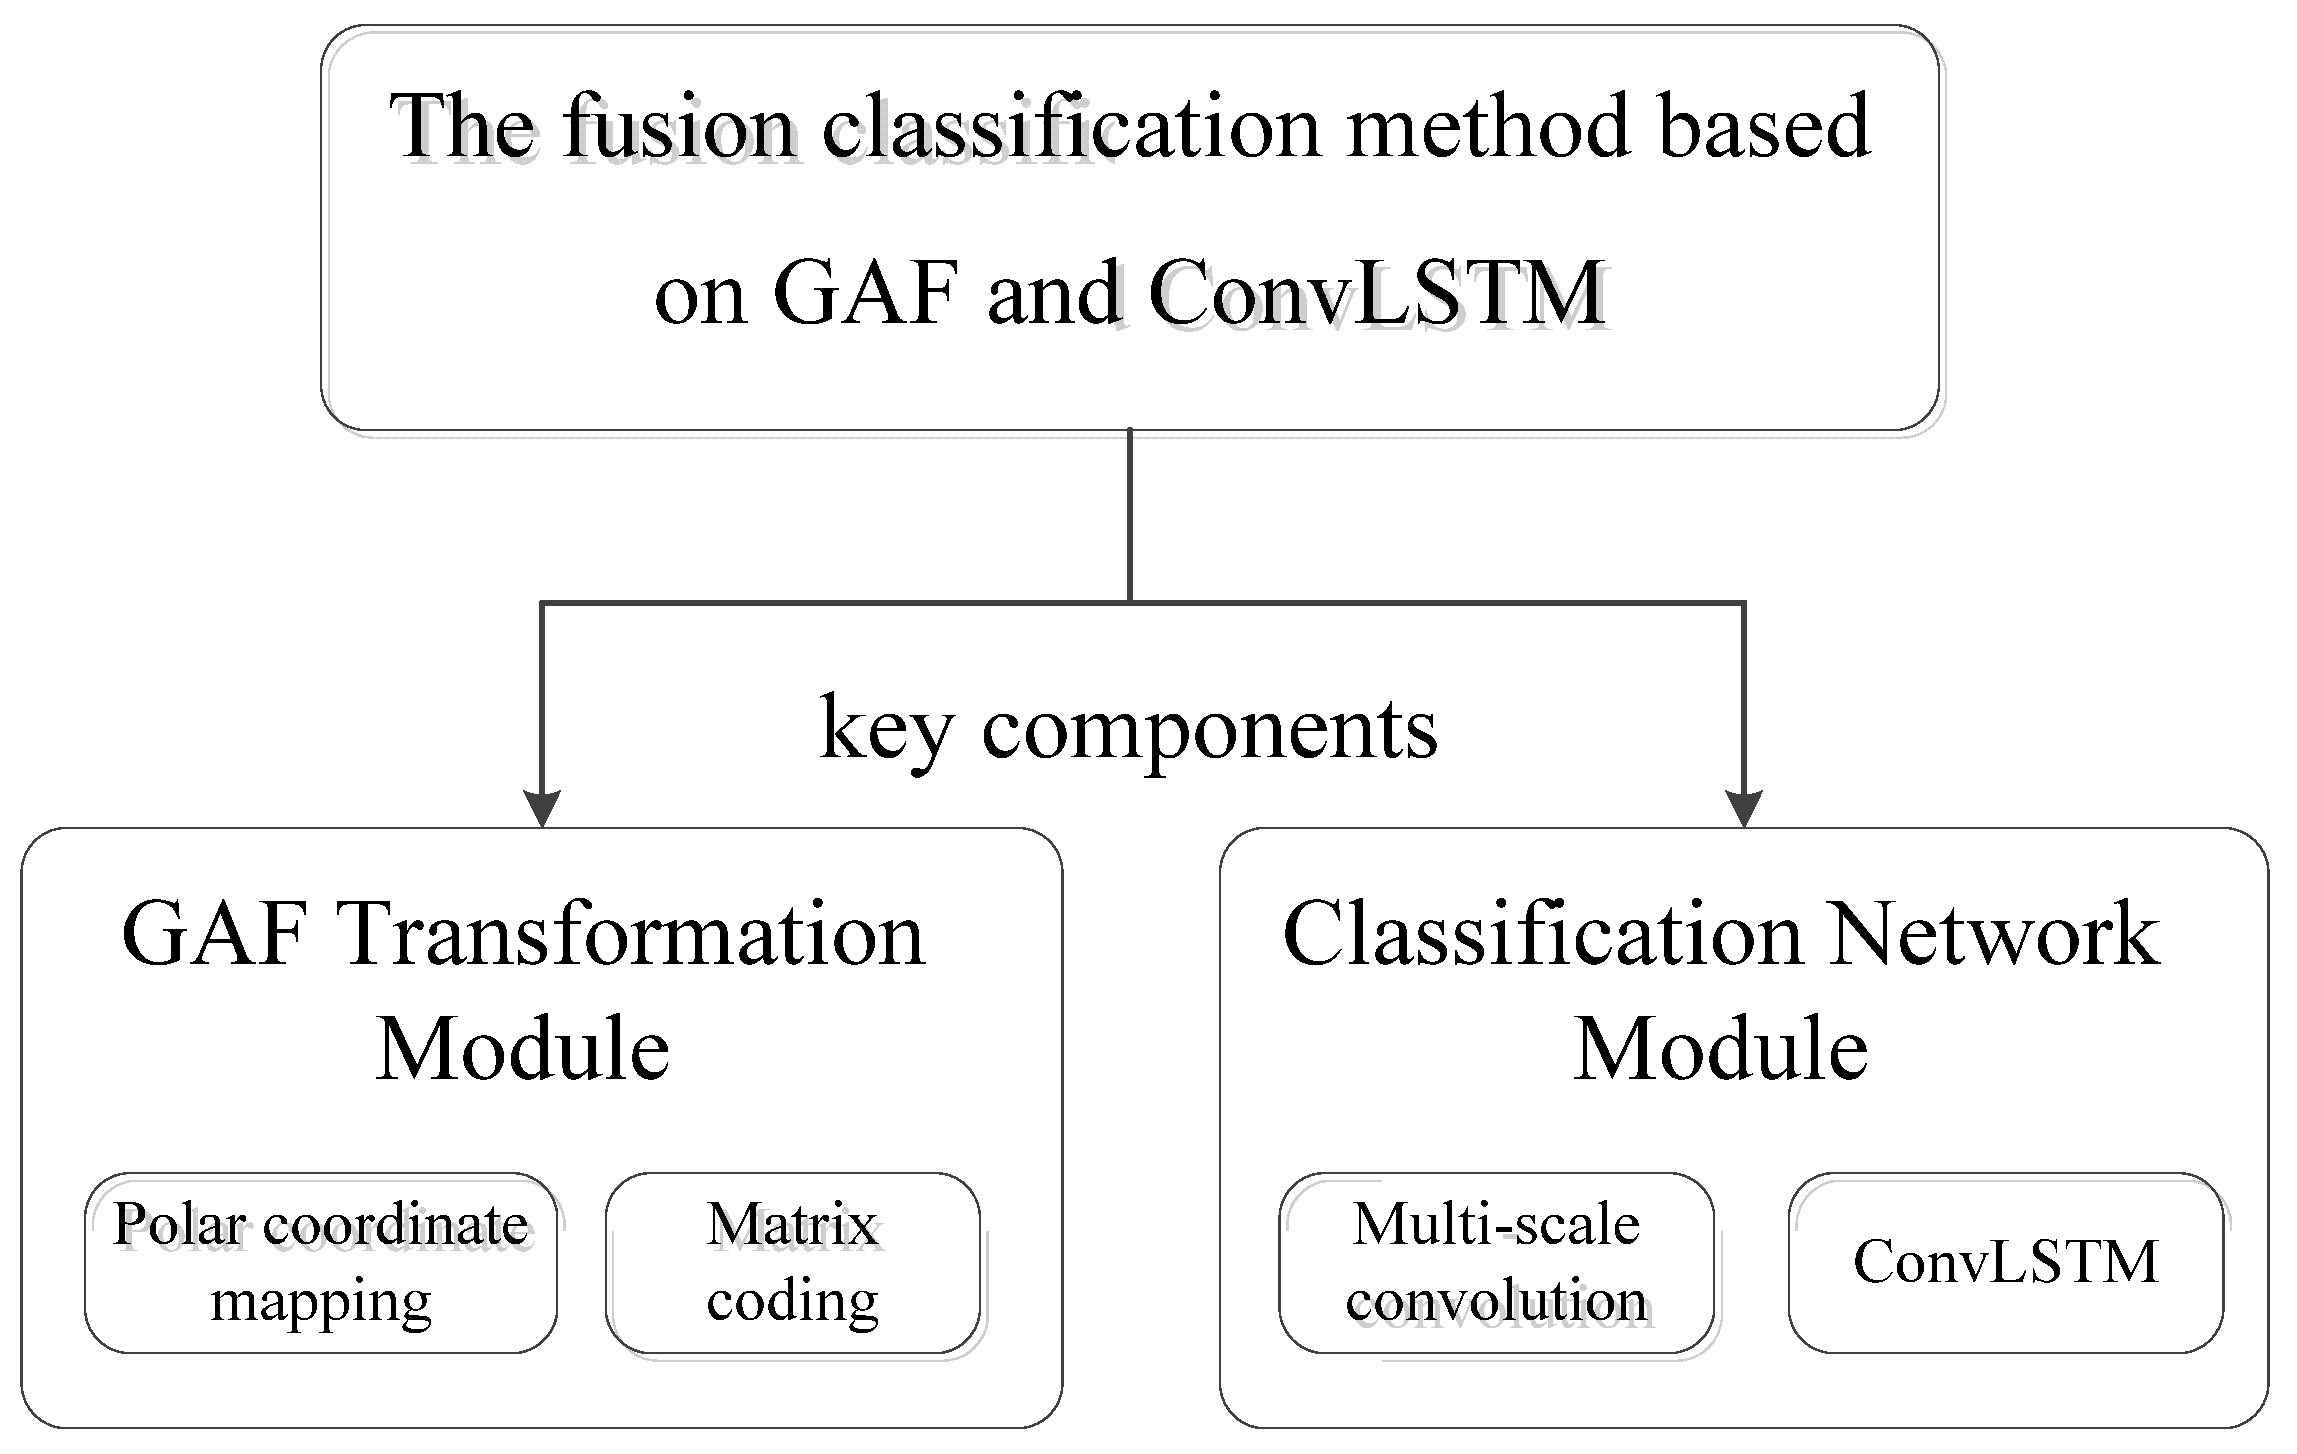
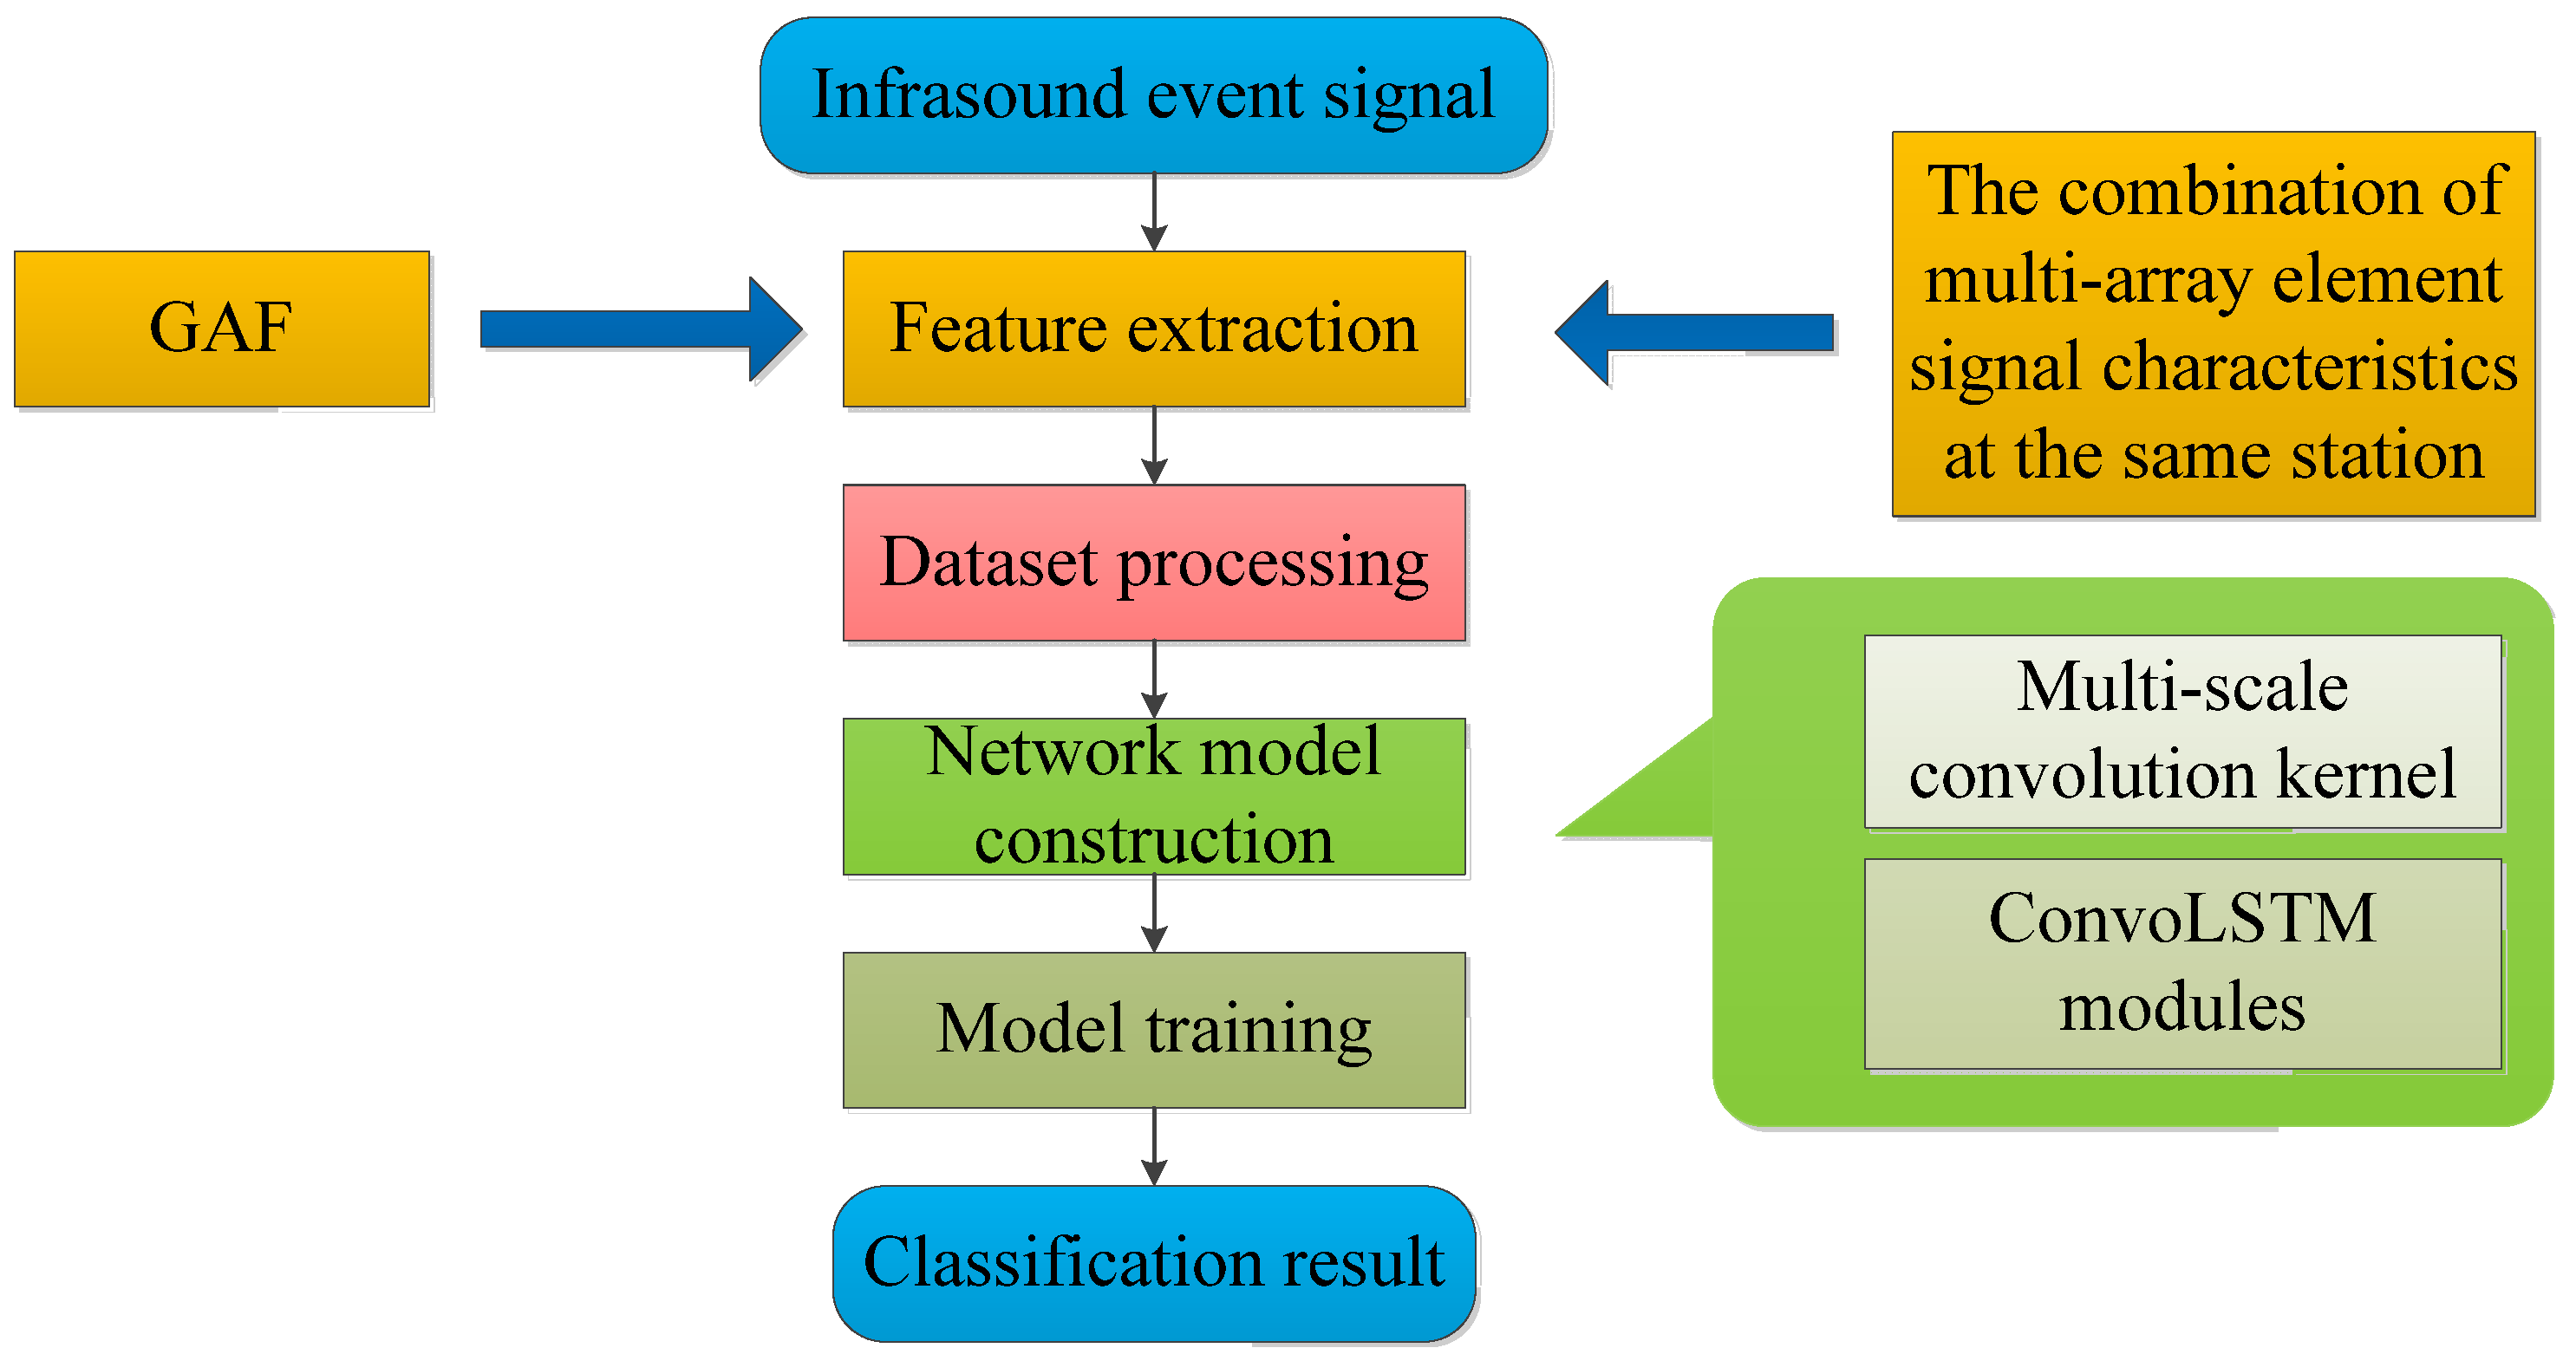
This study presents a novel fusion framework combining Gramian Angular Field (GAF) transformation with a Convolutional LSTM Network (ConvLSTM) for long-distance infrasonic event classification. As illustrated in
Figure 1, the proposed architecture comprises two key components:
- (a)
GAF Transformation Module
The GAF module converts one-dimensional temporal signals into two-dimensional polar coordinate representations through angular field mapping. This transformation preserves the temporal relationships of signals while encoding phase interaction characteristics in the resulting Gramian matrix. Compared to conventional time–frequency representations, GAF demonstrates superior noise robustness and maintains better temporal continuity, particularly beneficial for long-distance infrasound signals.
- (b)
Classification Network Architecture
We developed a multi-scale feature extraction network that hierarchically processes infrasonic patterns through parallel convolutional pathways with varying kernel sizes. The integrated ConvLSTM layers simultaneously capture spatiotemporal dynamics, while a feature fusion mechanism combines multi-scale representations. This design effectively addresses the challenges of signal attenuation and noise interference in long-distance propagation, significantly improving classification accuracy.
2.1. Infrasound Dataset
In this study, data acquisition was performed using the MB3a infrasound sensor, which features a sensitivity of 20 mV/Pa and an effective frequency response range of 0.01–28 Hz. The sampling frequency was set to 20 Hz.
The experimental dataset consists of 789 infrasound waveform records (3000 data points per 150 s recording) collected from 36 monitoring stations, including 386 samples from 28 chemical explosion events and 403 samples from eight earthquake events, with detailed data statistics presented in
Table 1.
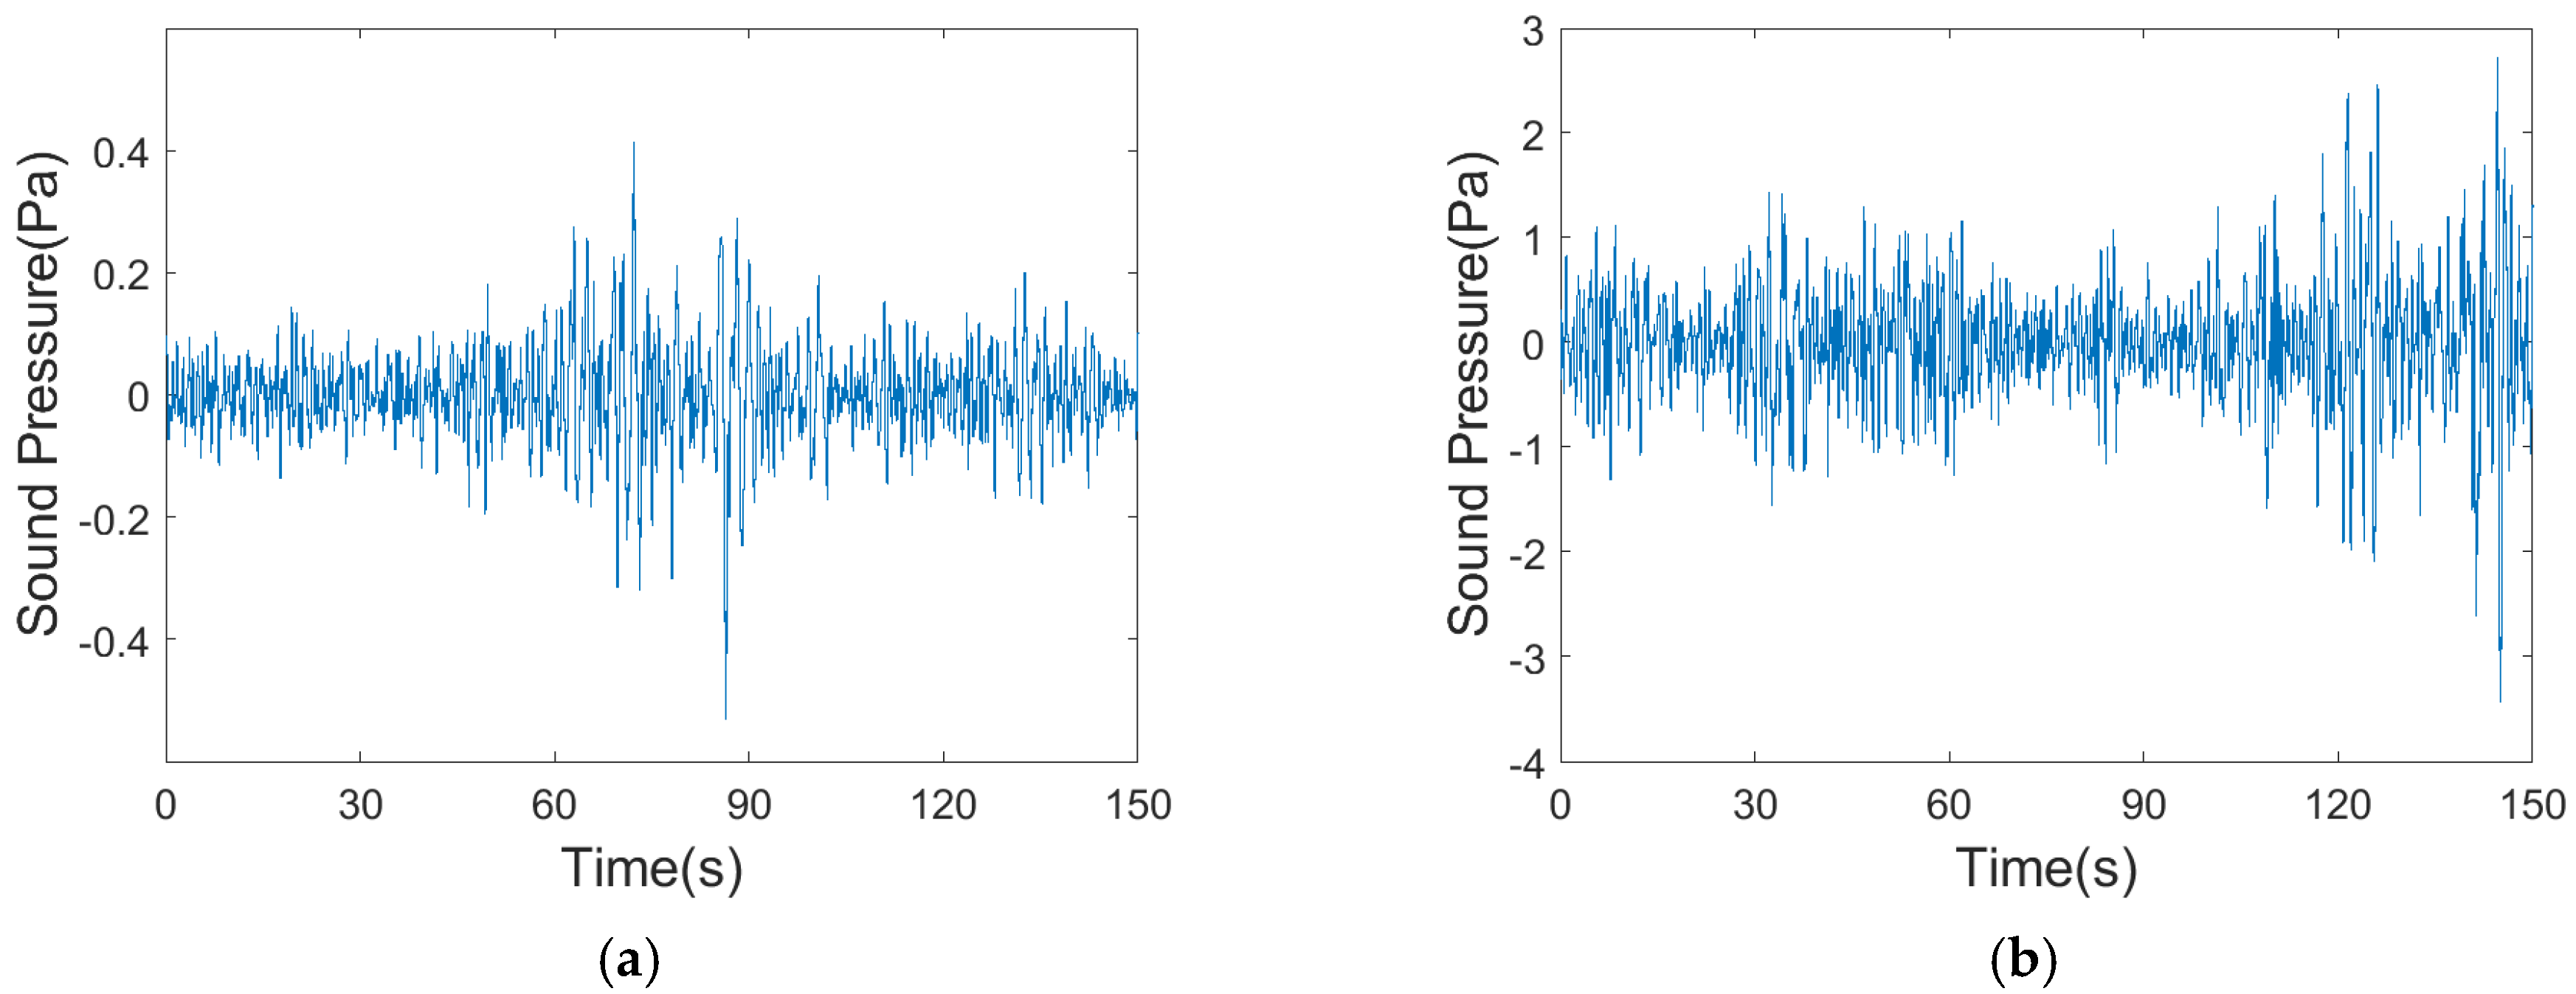
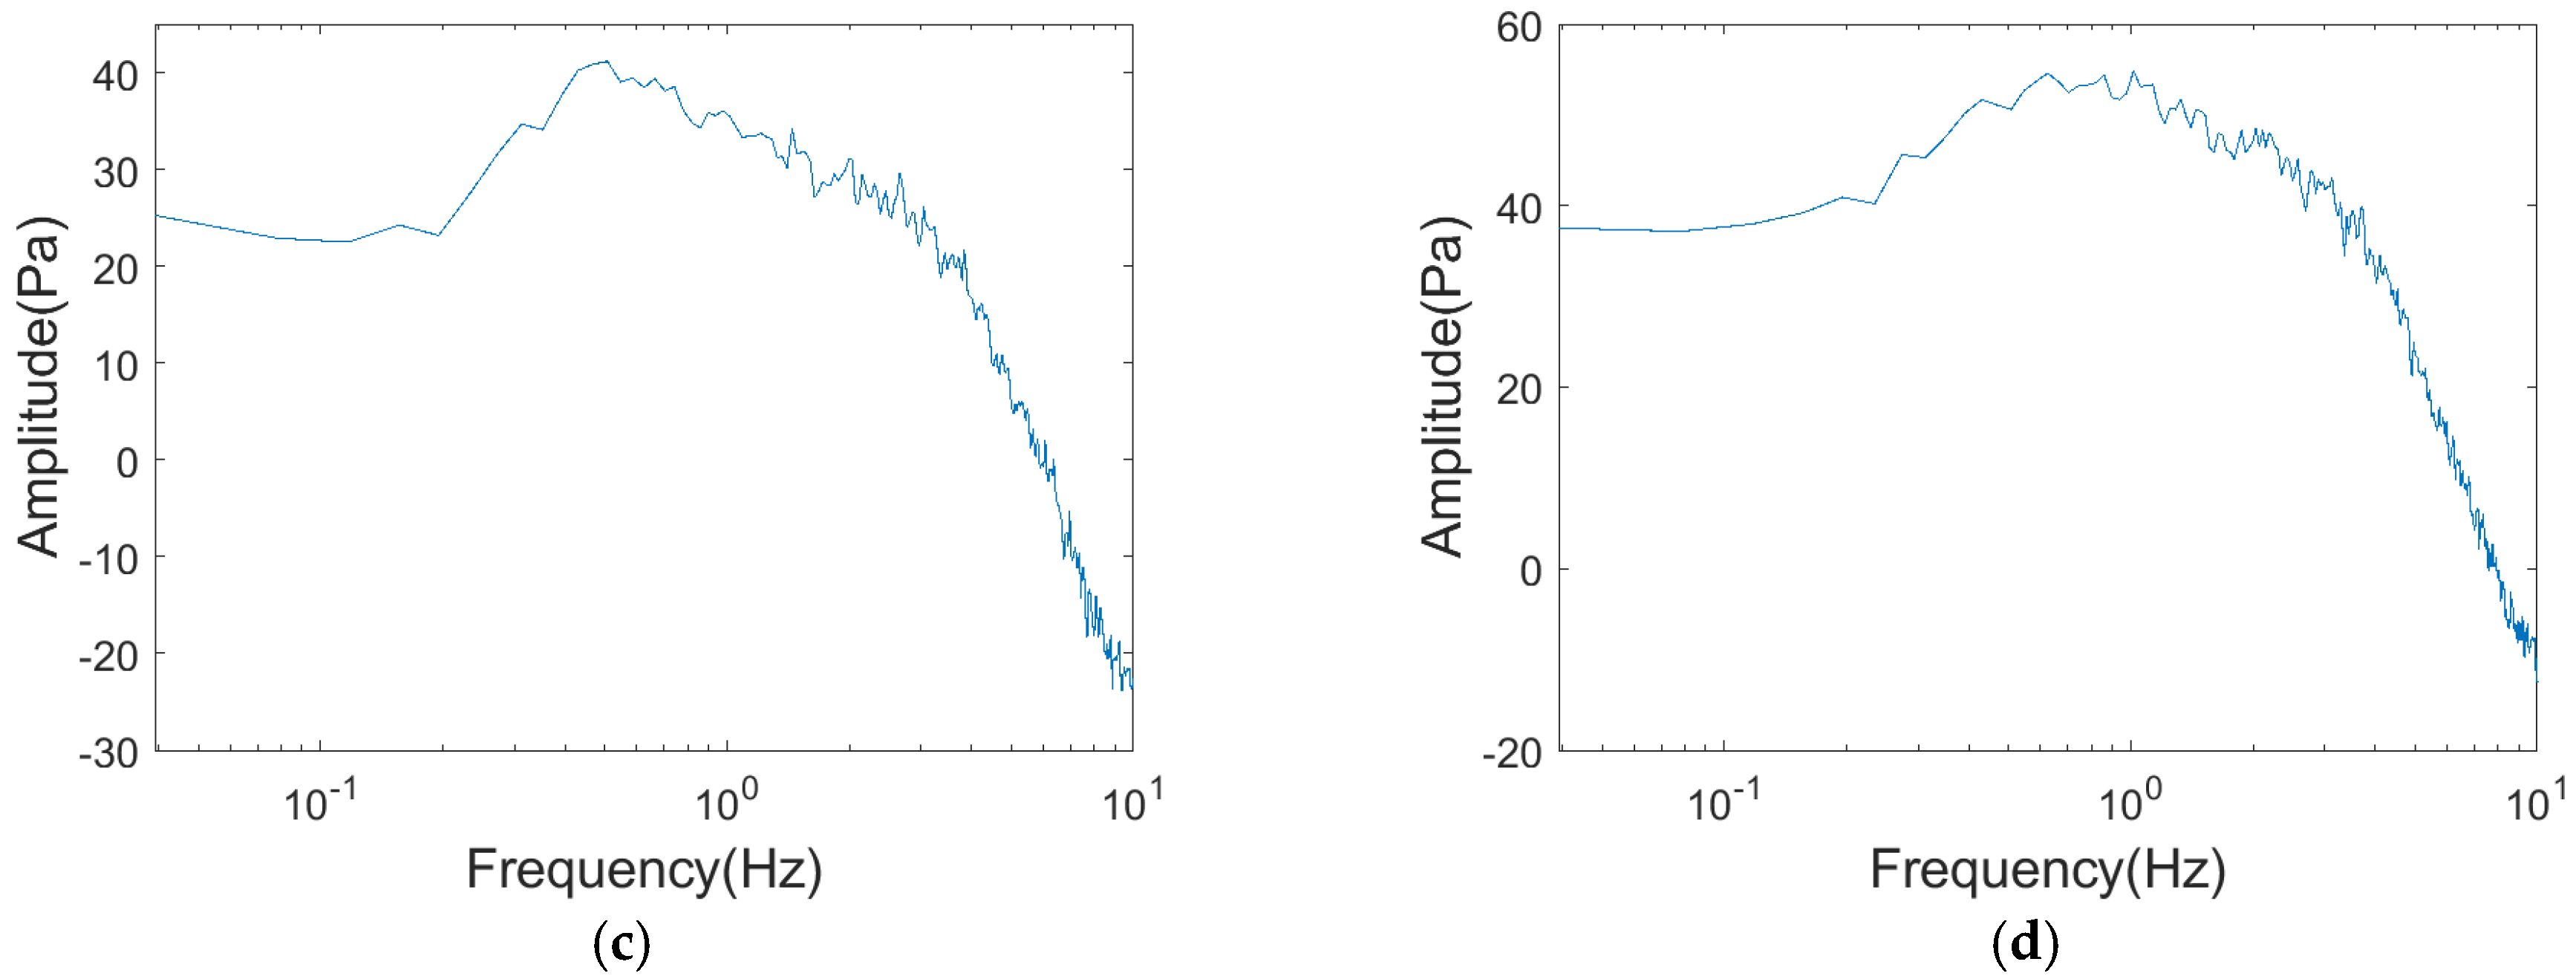
Figure 2 presents the time–domain waveforms and corresponding power spectra of the infrasound signals generated by both a chemical explosion and a natural earthquake, respectively.
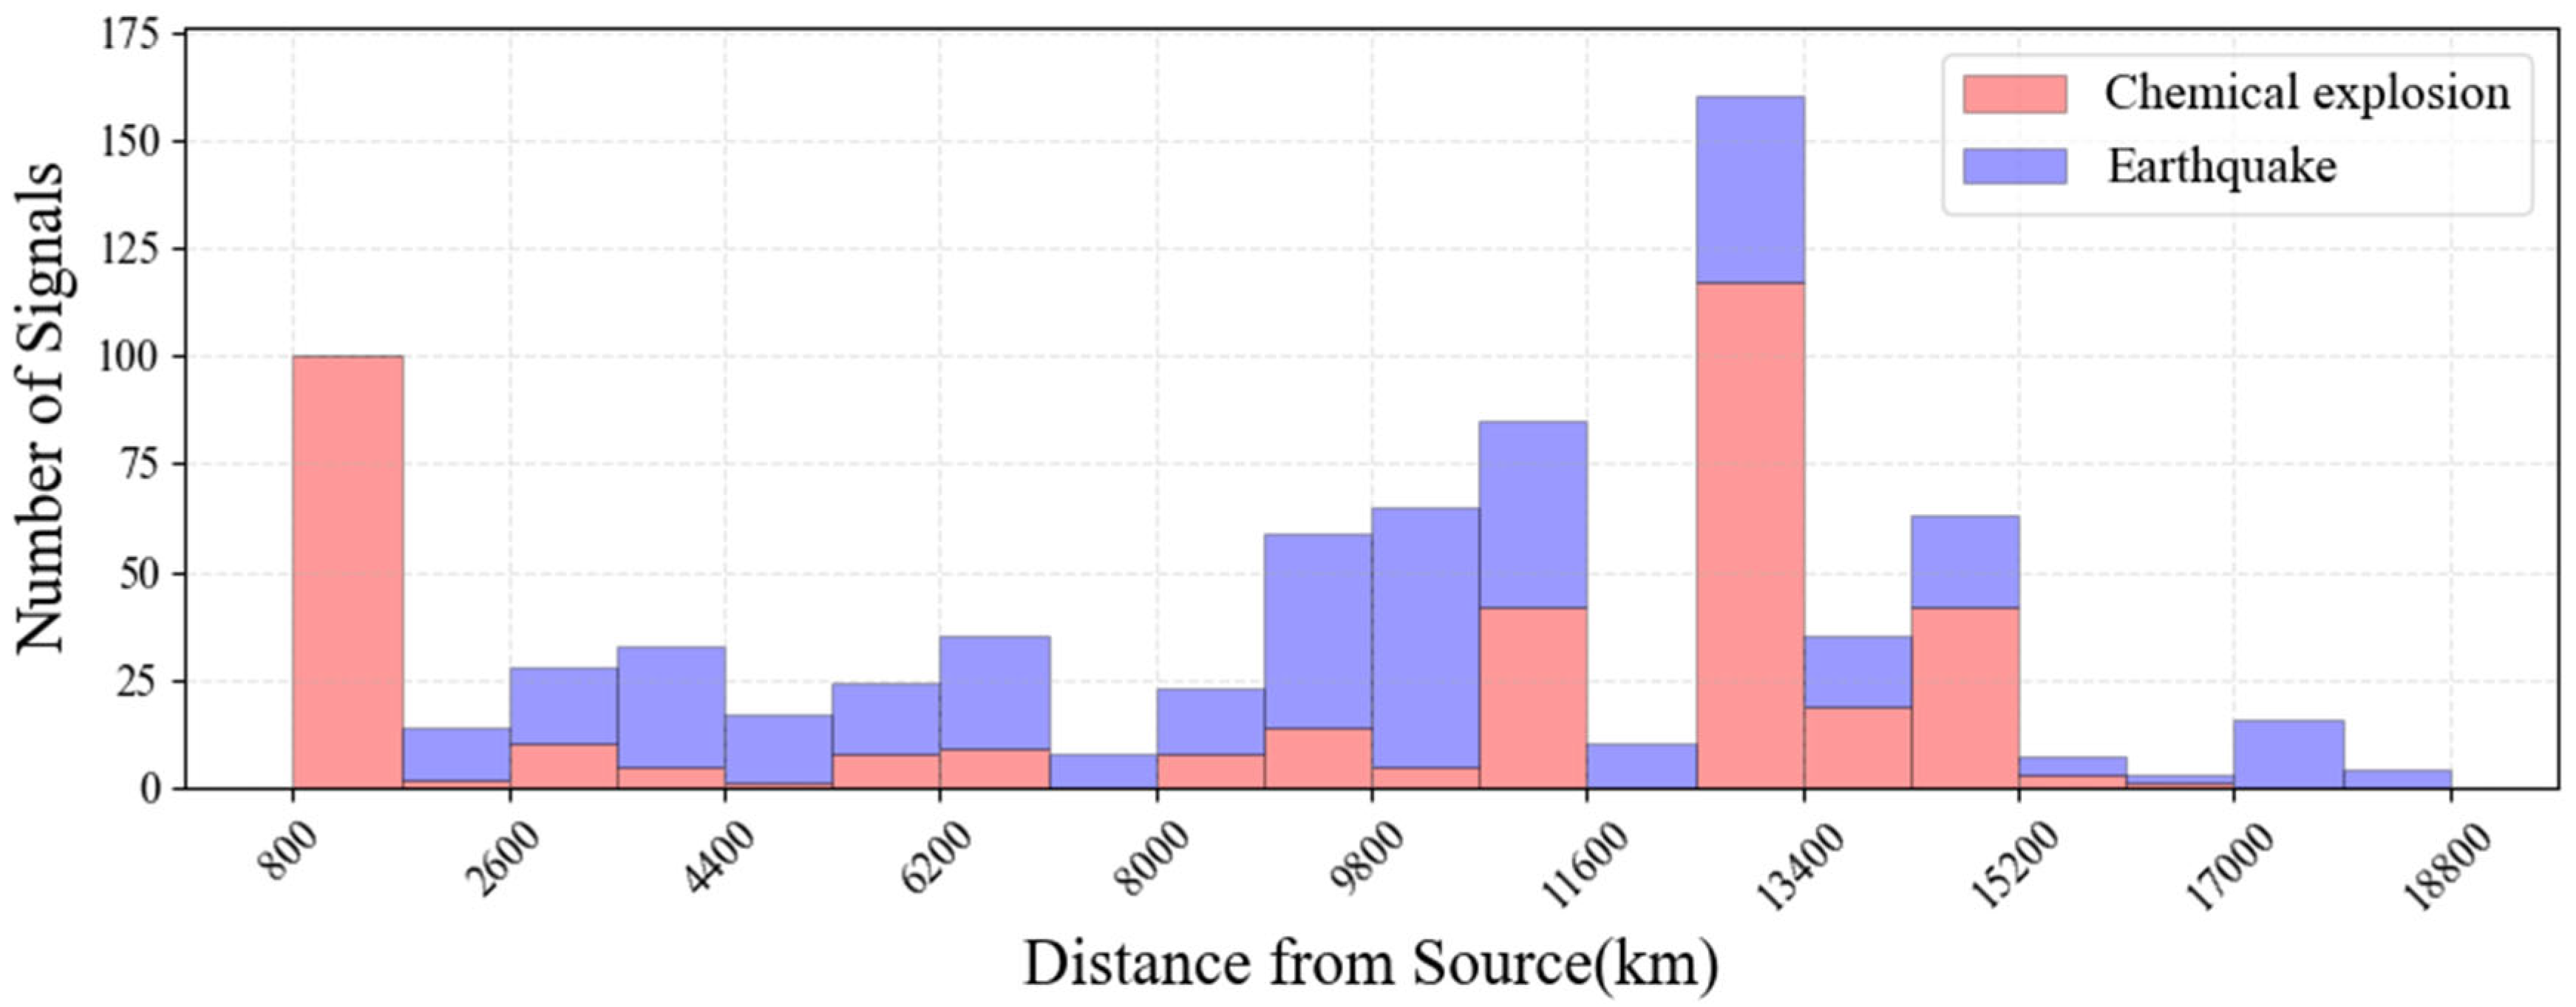
The distance from the source of infrasound events in this dataset ranges widely, with the nearest source distance exceeding 800 km and the farthest reaching 18,800 km. It is a large-scale dataset of infrasound events with long-range distances. The specific distribution of source distances is shown in
Figure 3.
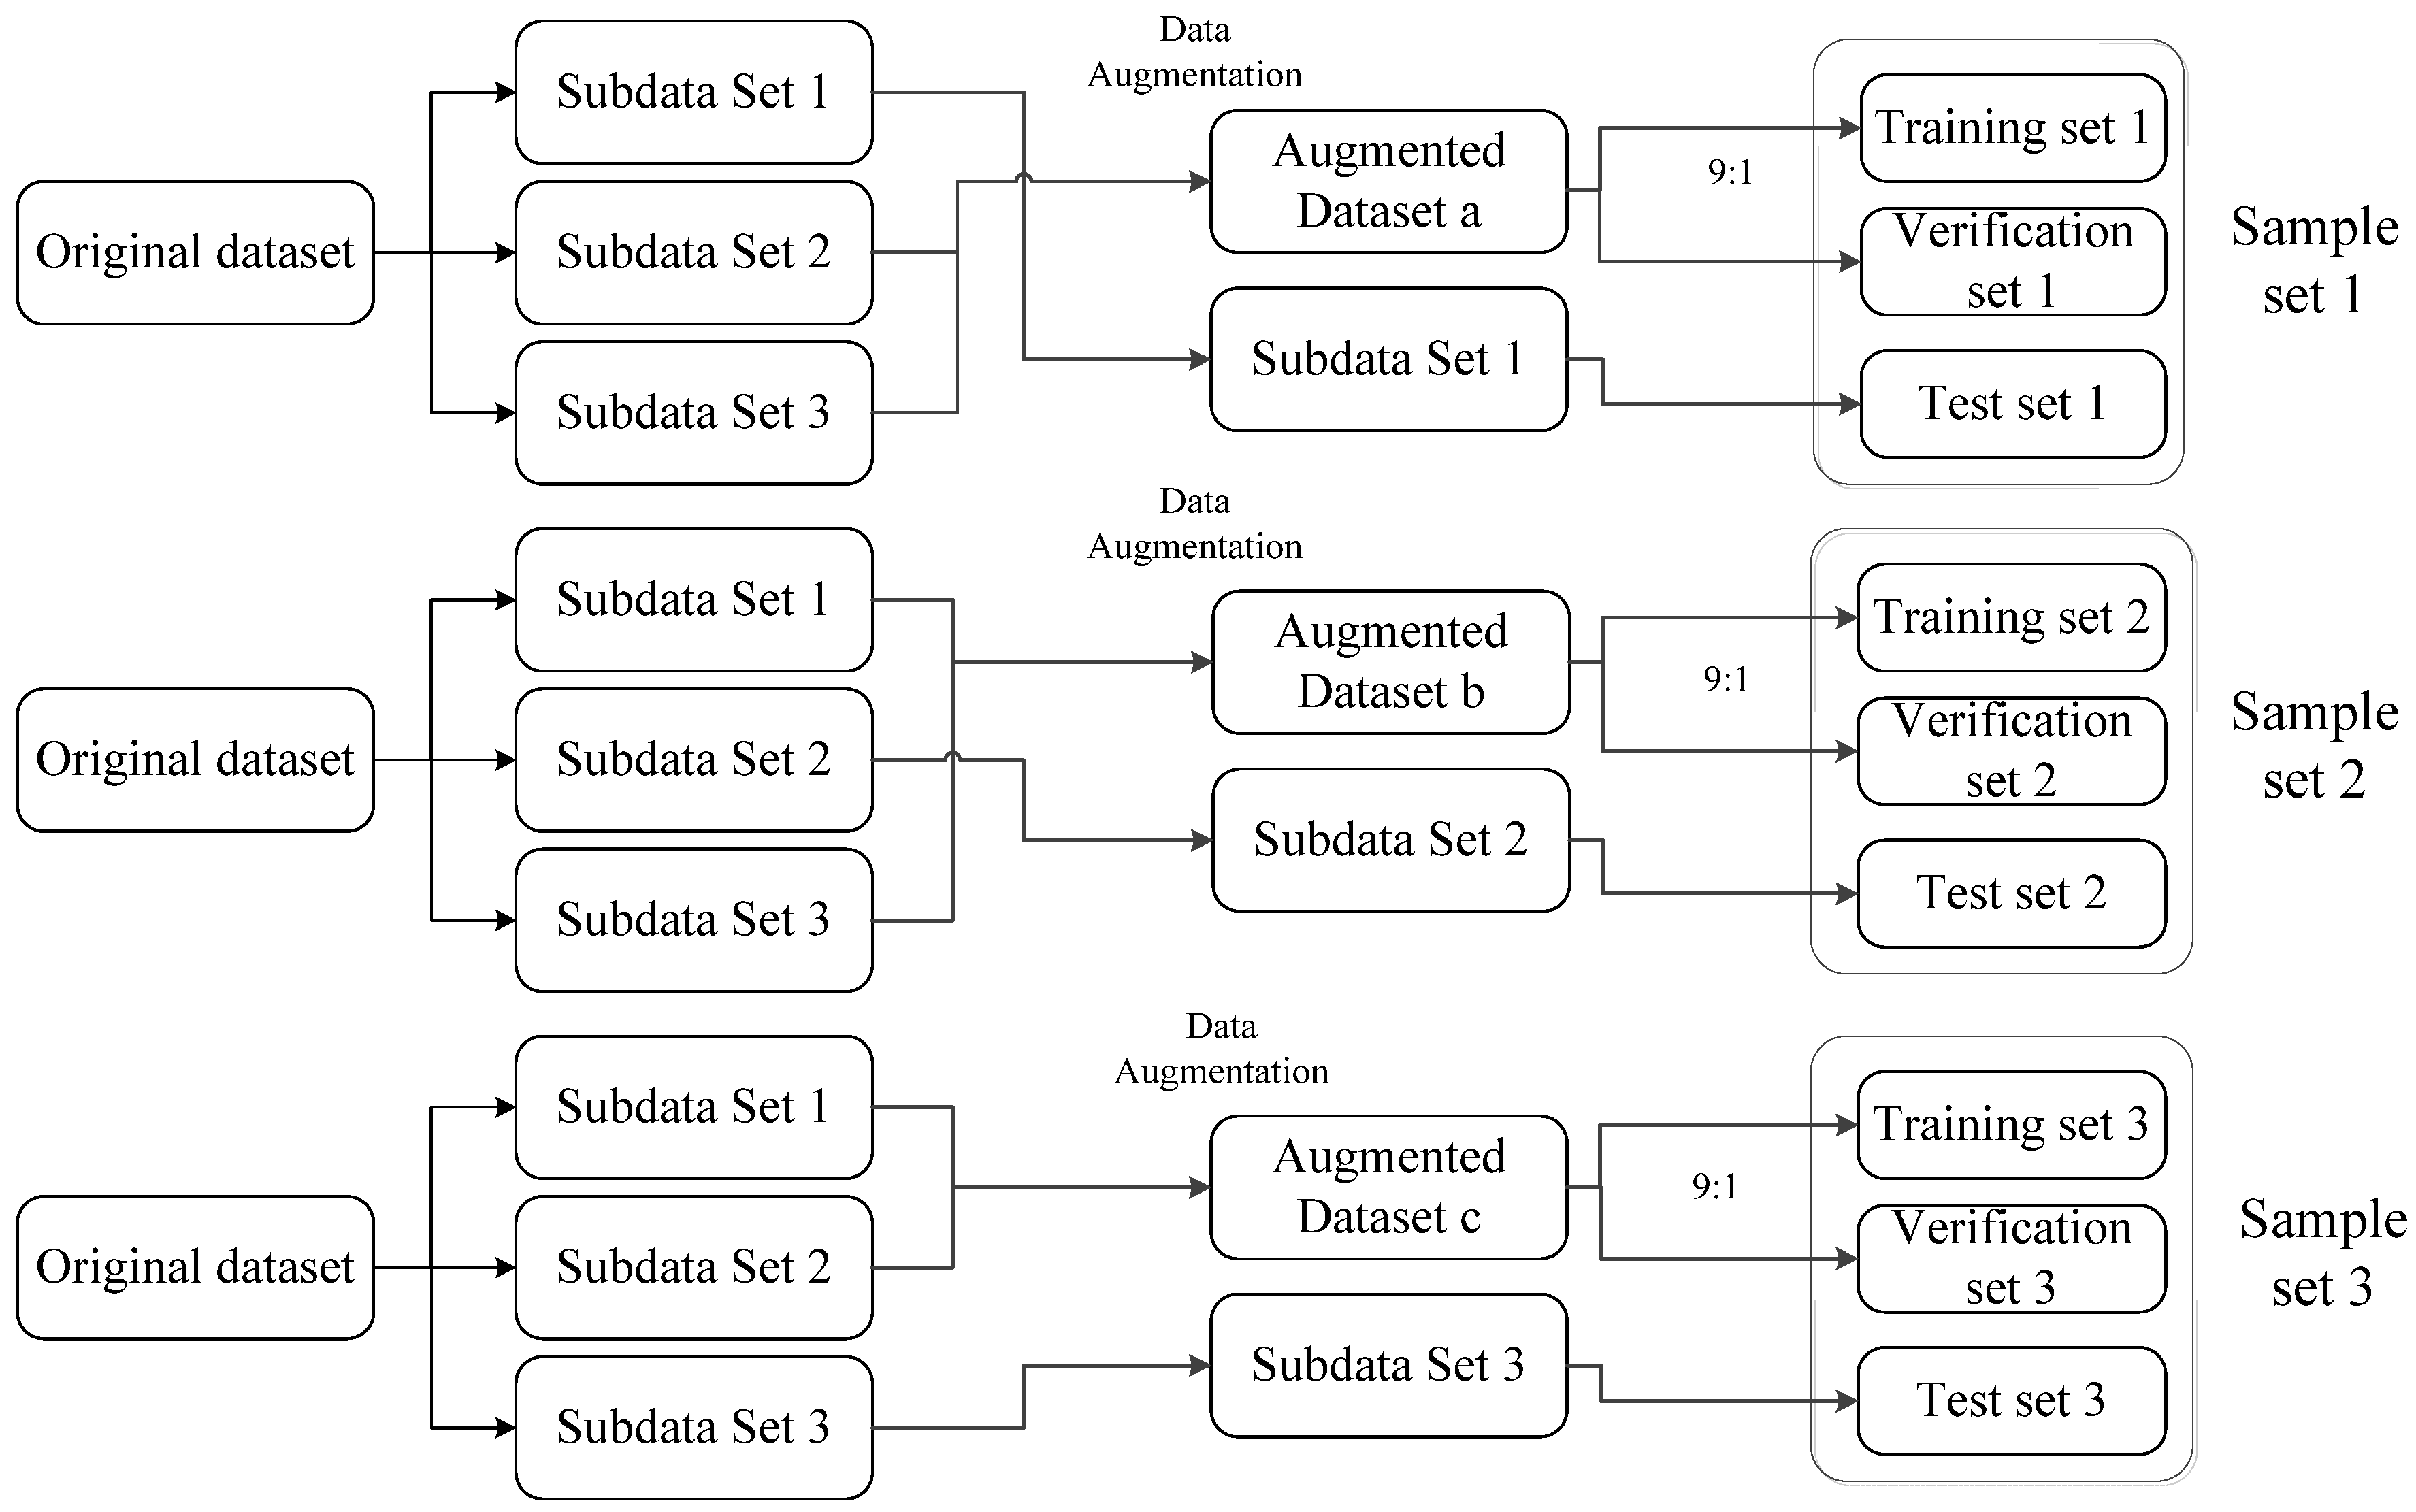
The dataset is divided into three event-based sub-datasets (
Table 2), ensuring that infrasound signals from the same event appear in only one subset. This partitioning minimizes data correlation between the test set and the training/validation sets, enhancing the reliability of network classification. Following this division, data augmentation was applied to facilitate network training (
Figure 4), with specific procedures detailed in Reference [
14]. Since infrasound signals from the same event may share inherent similarities, event-based segregation helps reduce overfitting and ensures robust model generalization.
2.2. Feature Extraction of Infrasound Signals Using Gramian Angular Field
2.2.1. Gramian Angular Field
As a two-dimensional attribute graph, the Gramian Angular Field (GAF) is commonly employed in various tasks involving time series data, such as classification, anomaly detection, and processing. GAF possesses the property of transforming complex time series into image representations. By incorporating additional relevant information while preserving the original signal information, GAF enhances the richness of the image data, thereby improving the classification performance of time series data [
13]. The calculation method of GAF is as follows:
For a given time series
, the first step is to scale all its values to fall within the interval
or
:
Secondly, encode the value as the cosine of the angle and the time stamp as the radius to obtain the representation of the time series in polar coordinates:
In the equation presented above, the term
,
represents a constant factor utilized to regularize the span of the polar coordinate system. Following the conversion of the scaled time series into polar coordinates, it can be further transformed into the GAF using the following formula, where
denotes the unit row vector
.
The GAF not only preserves the temporal dependencies of the original signal but also encompasses both its temporal correlations and its original value/angular information. This makes it an effective method for transforming the signal into a two-dimensional representation. When the length of the original signal is large, Piecewise Aggregation Approximation (PAA) [
15] can be employed to smooth the signal while retaining its overall trend.
In this paper, the scaling interval
is selected, and GAF of the Welch power spectrum of the infrasound signal is computed as the two-dimensional attribute graph. The power spectrum consists of 257 points, resulting in a GAF of size
. The Welch power spectrum is an effective feature and demonstrates certain advantages in infrasound classification [
16]. The rationale for employing the GAF of the Welch power spectrum as a two-dimensional attribute graph is to better preserve its original performance and further enhance classification accuracy.
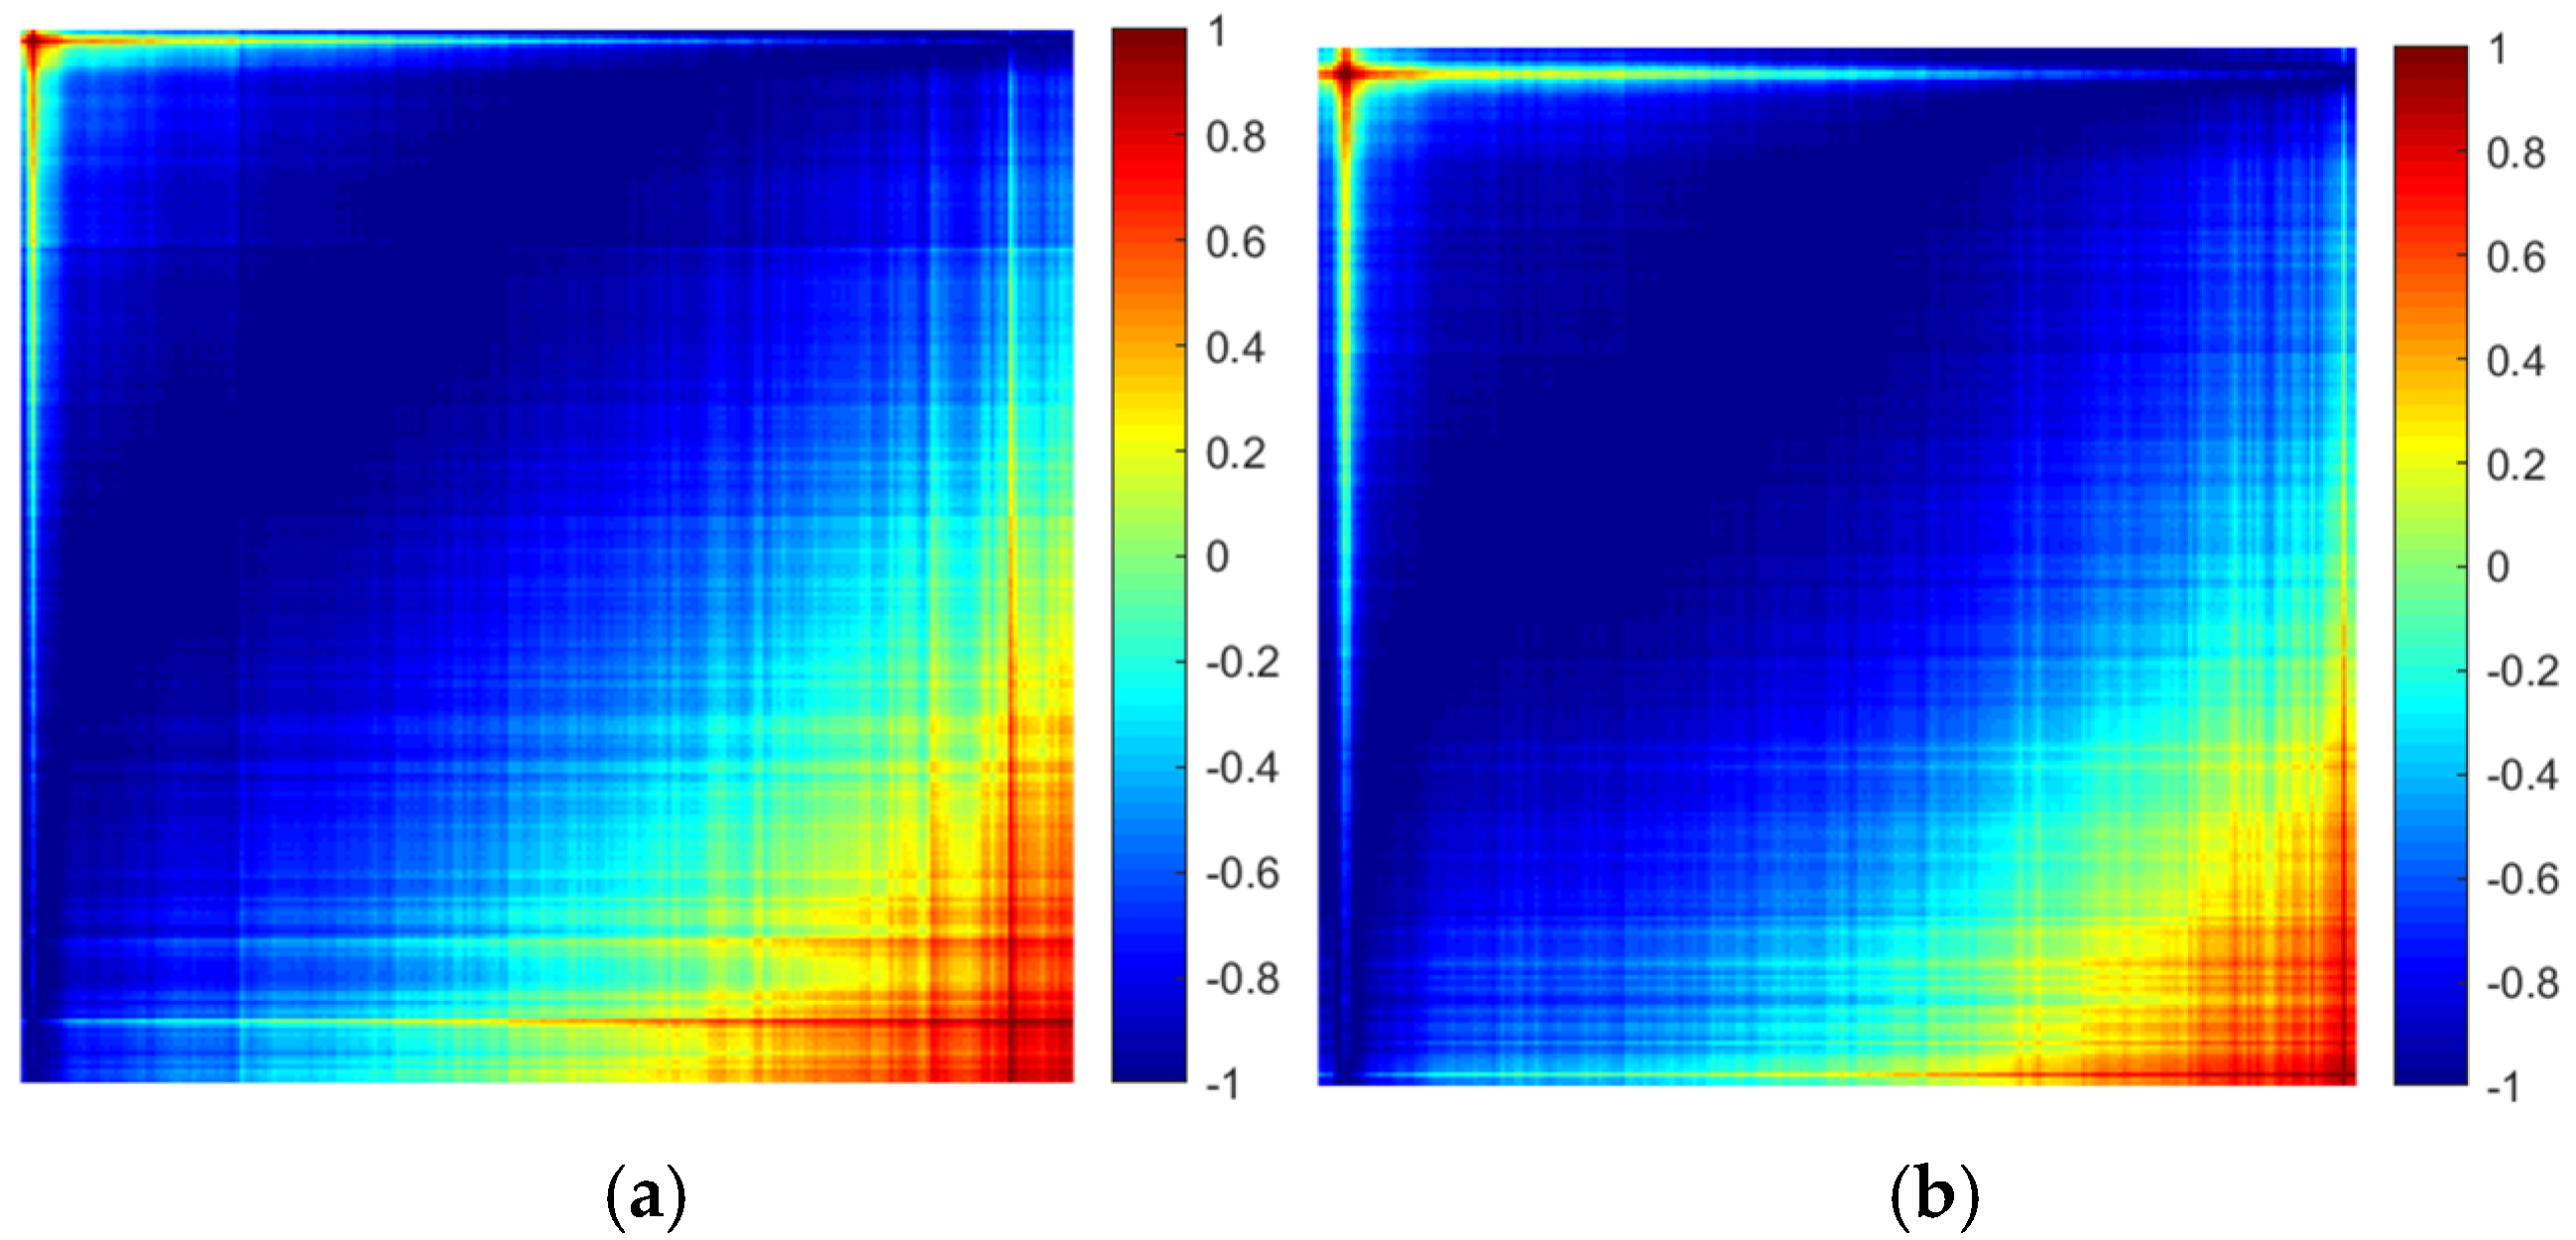
Figure 5 presents the power spectrum wave-forms of the infrasound signals from both a chemical explosion and an earthquake, along with their corresponding GAF. It is evident that the GAF exhibits strong consistency with the trend of the original sequence.
We calculated the Structural Similarity Index Measure (SSIM), Cosine Similarity (CS), and Mean Squared Error (MSE) for both the GAF dataset and the Welch power spectrum dataset. The intra-class mean and inter-class mean ratios of these three indicators were used to evaluate the changes in the similarity of the data, as shown in Equations (5)–(7). Here,
,
, and
represent the intra-class means of SSIM, CS, and MSE, respectively, while
,
, and
represent their corresponding inter-class means. Since MSE represents a distance metric, which is different from SSIM and CS, we took the inverse of the MSE ratio to ensure consistency in interpretation (a higher ratio indicates better data classification performance).
Table 3 summarizes the changes in the similarity of the datasets. The results show that the three indicators of the GAF dataset, after transformation, are significantly improved, with the intra-class mean ratio of SSIM increasing by approximately 19.5%. This demonstrates that the classification performance of datasets based on GAF features is superior to those based on Welch power spectrum features, thus validating the effectiveness of using GAF two-dimensional attribute graphs for classification tasks.
2.2.2. Infrasound Signal Combination
Infrasound event signals are typically acquired by sensor arrays deployed at monitoring stations, with standard configurations consisting of 4 to 10 independent array elements per station [
17]. Under normal operational conditions, a single station can simultaneously detect multiple infrasonic signals generated by the same event.
During long-distance propagation, infrasound signals undergo substantial distortion due to complex atmospheric conditions (including wind field disturbances and temperature gradients), multipath propagation effects, and local station noise. These factors lead to significant variations in observed signals from the same event (high intra-class dispersion), presenting considerable challenges for infrasound signal classification. Nevertheless, signals received by array elements within the same station maintain certain similarities due to their close spatial proximity.
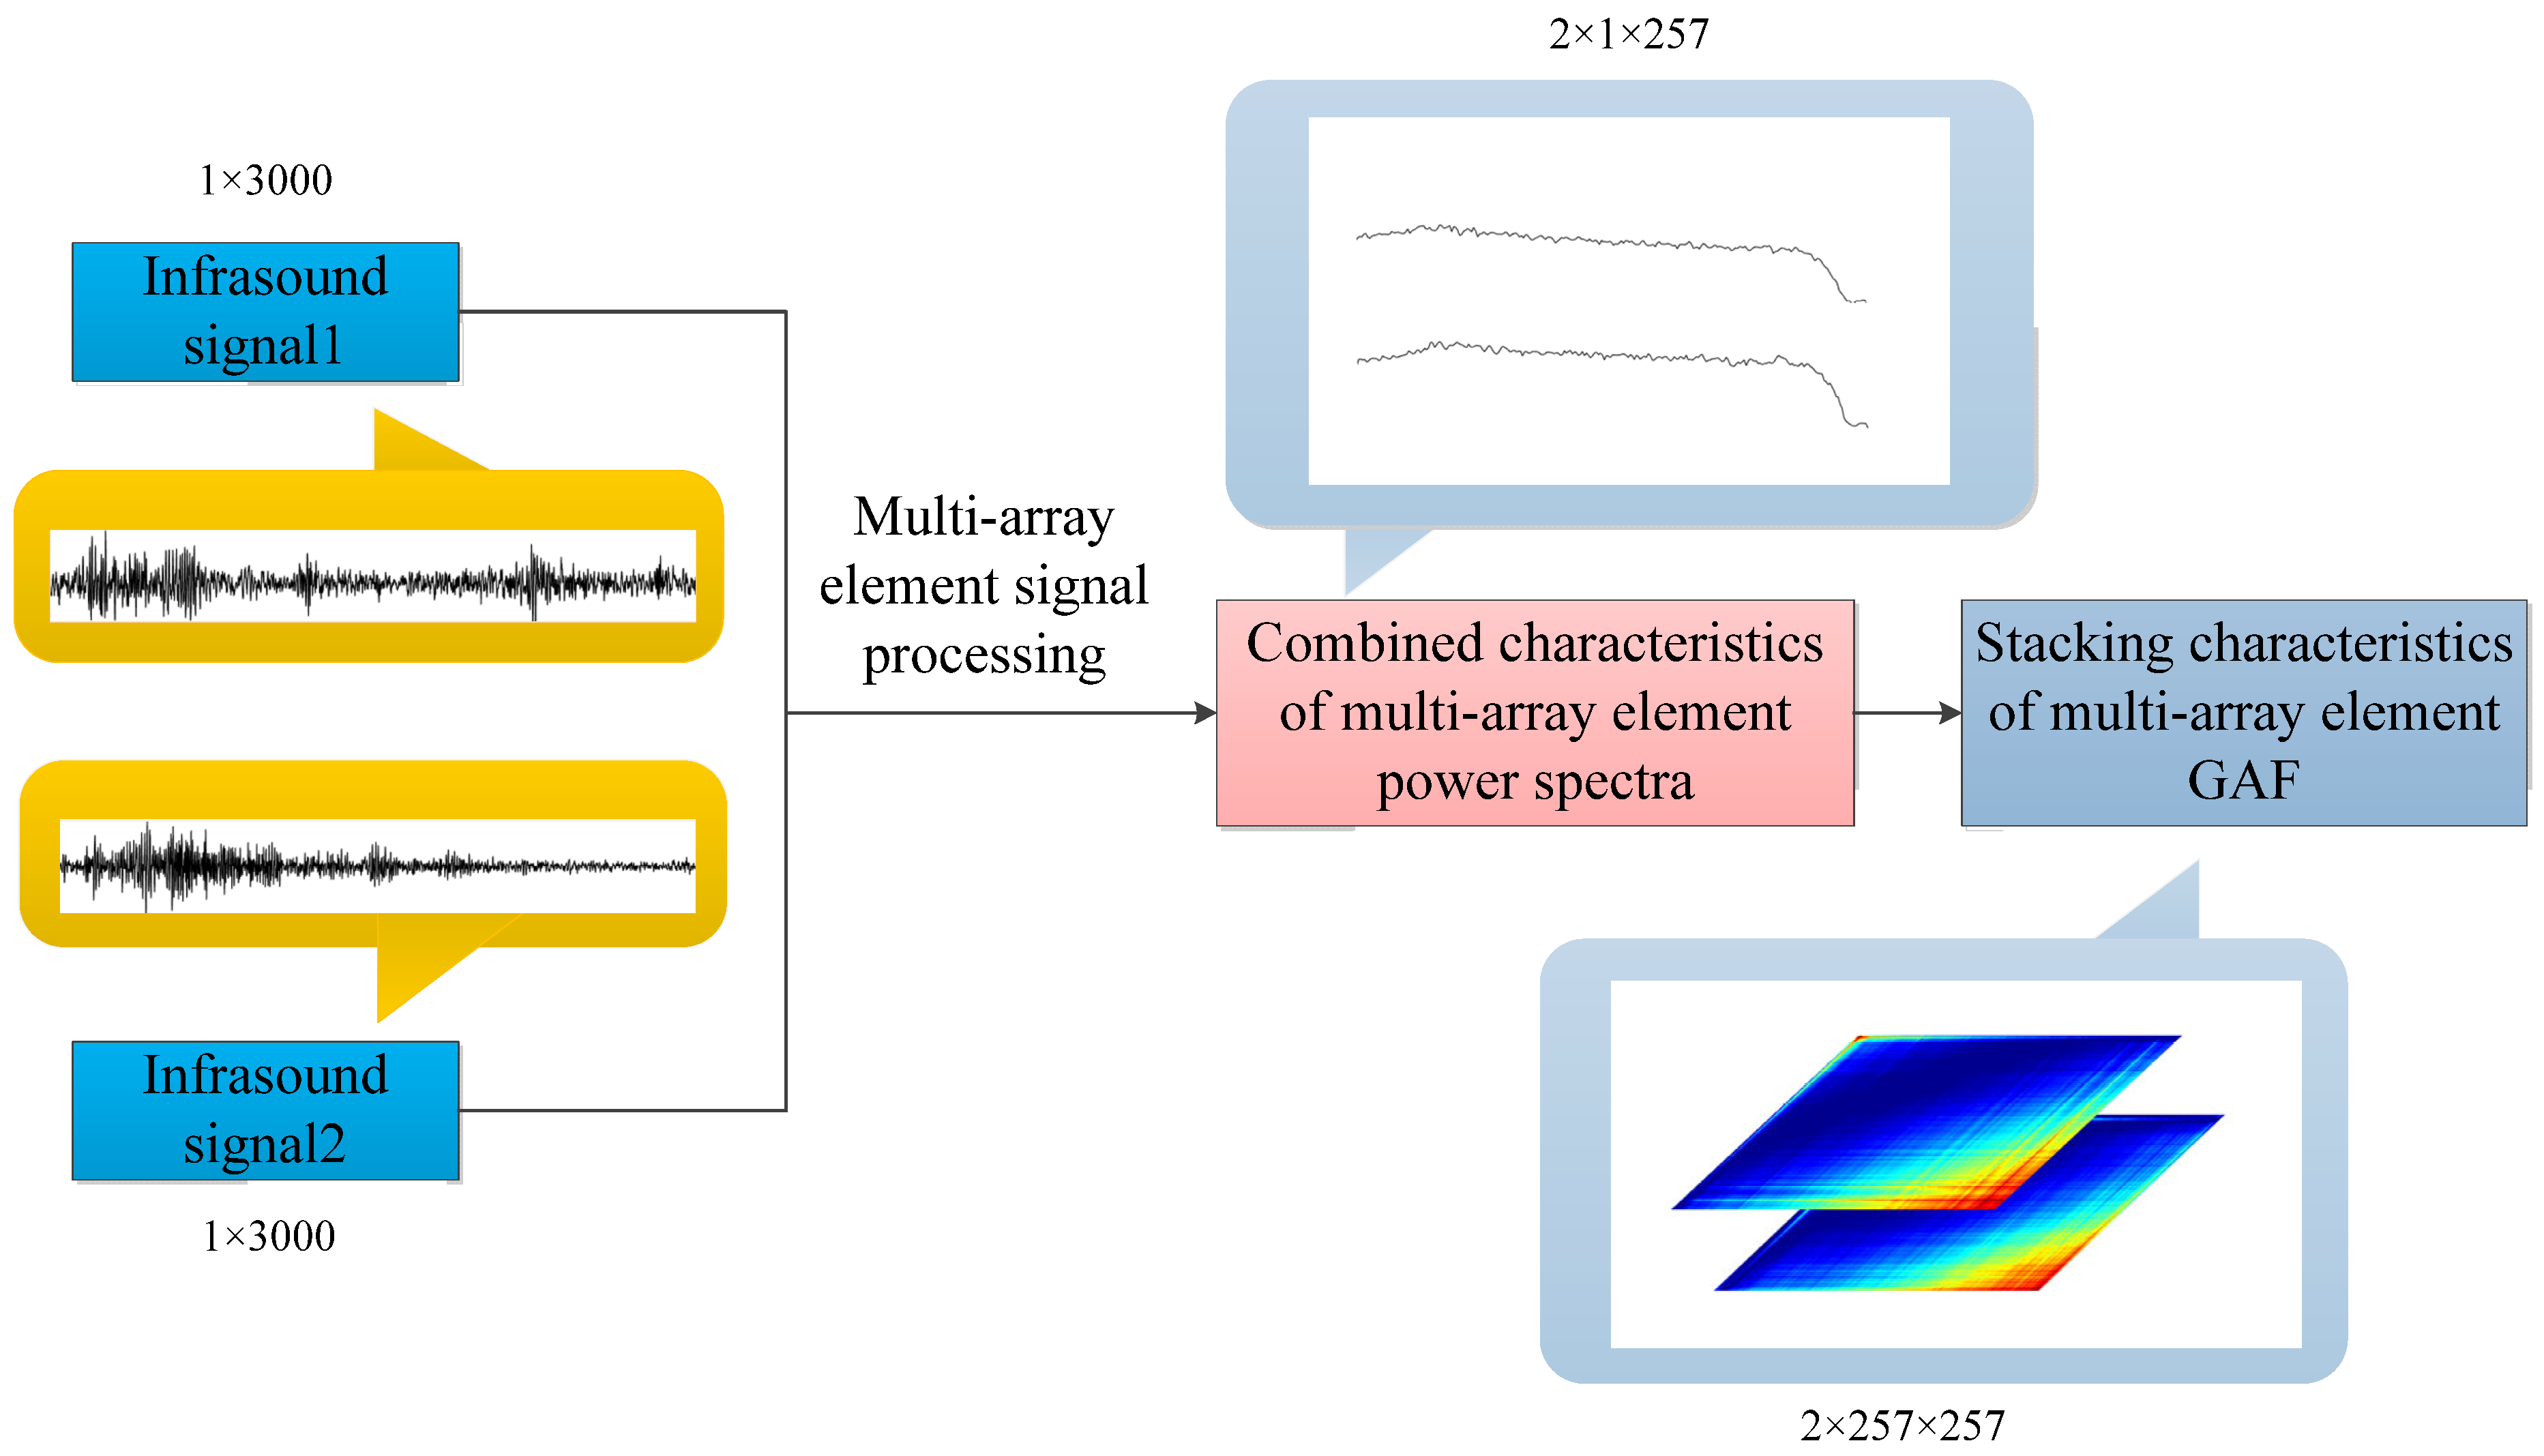
To address these challenges, this study implements a multi-array signal fusion approach. The approach combines synchronous measurements from multiple array elements at each station to generate enhanced composite representations. Specifically, we integrate infrasonic waveforms captured by different array elements within the same station, transforming them into consolidated Gramian Angular Field representations that preserve the spatial coherence of the array configuration. This fusion process simultaneously enhances the discriminative characteristics of individual samples while reducing feature space dispersion among samples of the same class, thereby significantly improving classification robustness. The processing flow is shown in
Figure 6, specifically including the following steps:
- (a)
The Welch power spectra of the two infrasound signals were calculated separately.
- (b)
Tensor concatenation was performed on the power spectrum features of the two signals along the channel dimension to achieve feature space expansion and obtain the combined power spectrum features of the multi-array elements.
- (c)
GAF of the combined power spectrum features was calculated, and the stacked features of the multi-element GAF were obtained.
2.3. Construction of Classification Model Based on Convolutional Long Short-Term Memory Network
2.3.1. Introduction to Convolutional Long Short-Term Memory Network
The ConvLSTM, introduced by Shi [
13] in 2015, is a convolutional LSTM network specifically designed to tackle the prediction problem of spatiotemporal series. This network extends the fully connected LSTM (FC-LSTM) by integrating convolutional structures into both the input-to-state and state-to-state transformations. This enhancement enables the network to capture temporal and spatial correlations more effectively, thereby improving its performance.
Figure 7 provides a depiction of the internal structure of the ConvLSTM.
In ConvLSTM networks, all gates and memory units are processed through convolution operations. Specifically, at each time step
, the input
is convolved with the previous hidden state
and the memory cell state
. The detailed calculation process is described in Equations (9)–(13), where
denotes the convolution kernel parameters,
represents the convolution operation, and
denotes the Hadamard product.
2.3.2. Construction of Classification Model
Infrasound stations typically consist of multiple array elements. The signal received by each array element can be considered as the superposition of the delayed signals from other array elements, along with noise. The power spectrum is a metric that characterizes the distribution of signal power across the frequency domain. It quantifies the energy intensity of the signal at different frequencies while completely disregarding phase information. Since delay affects only the phase of the signal and not its amplitude, the power spectrum exhibits delay invariance, effectively eliminating the impact of delay. Consequently, there is a strong logical relationship among the two-dimensional attribute graphs of GAF derived from the power spectrum within the same station. When stacked, these graphs can be treated as spectral-temporal sequences suitable for processing by ConvLSTM.
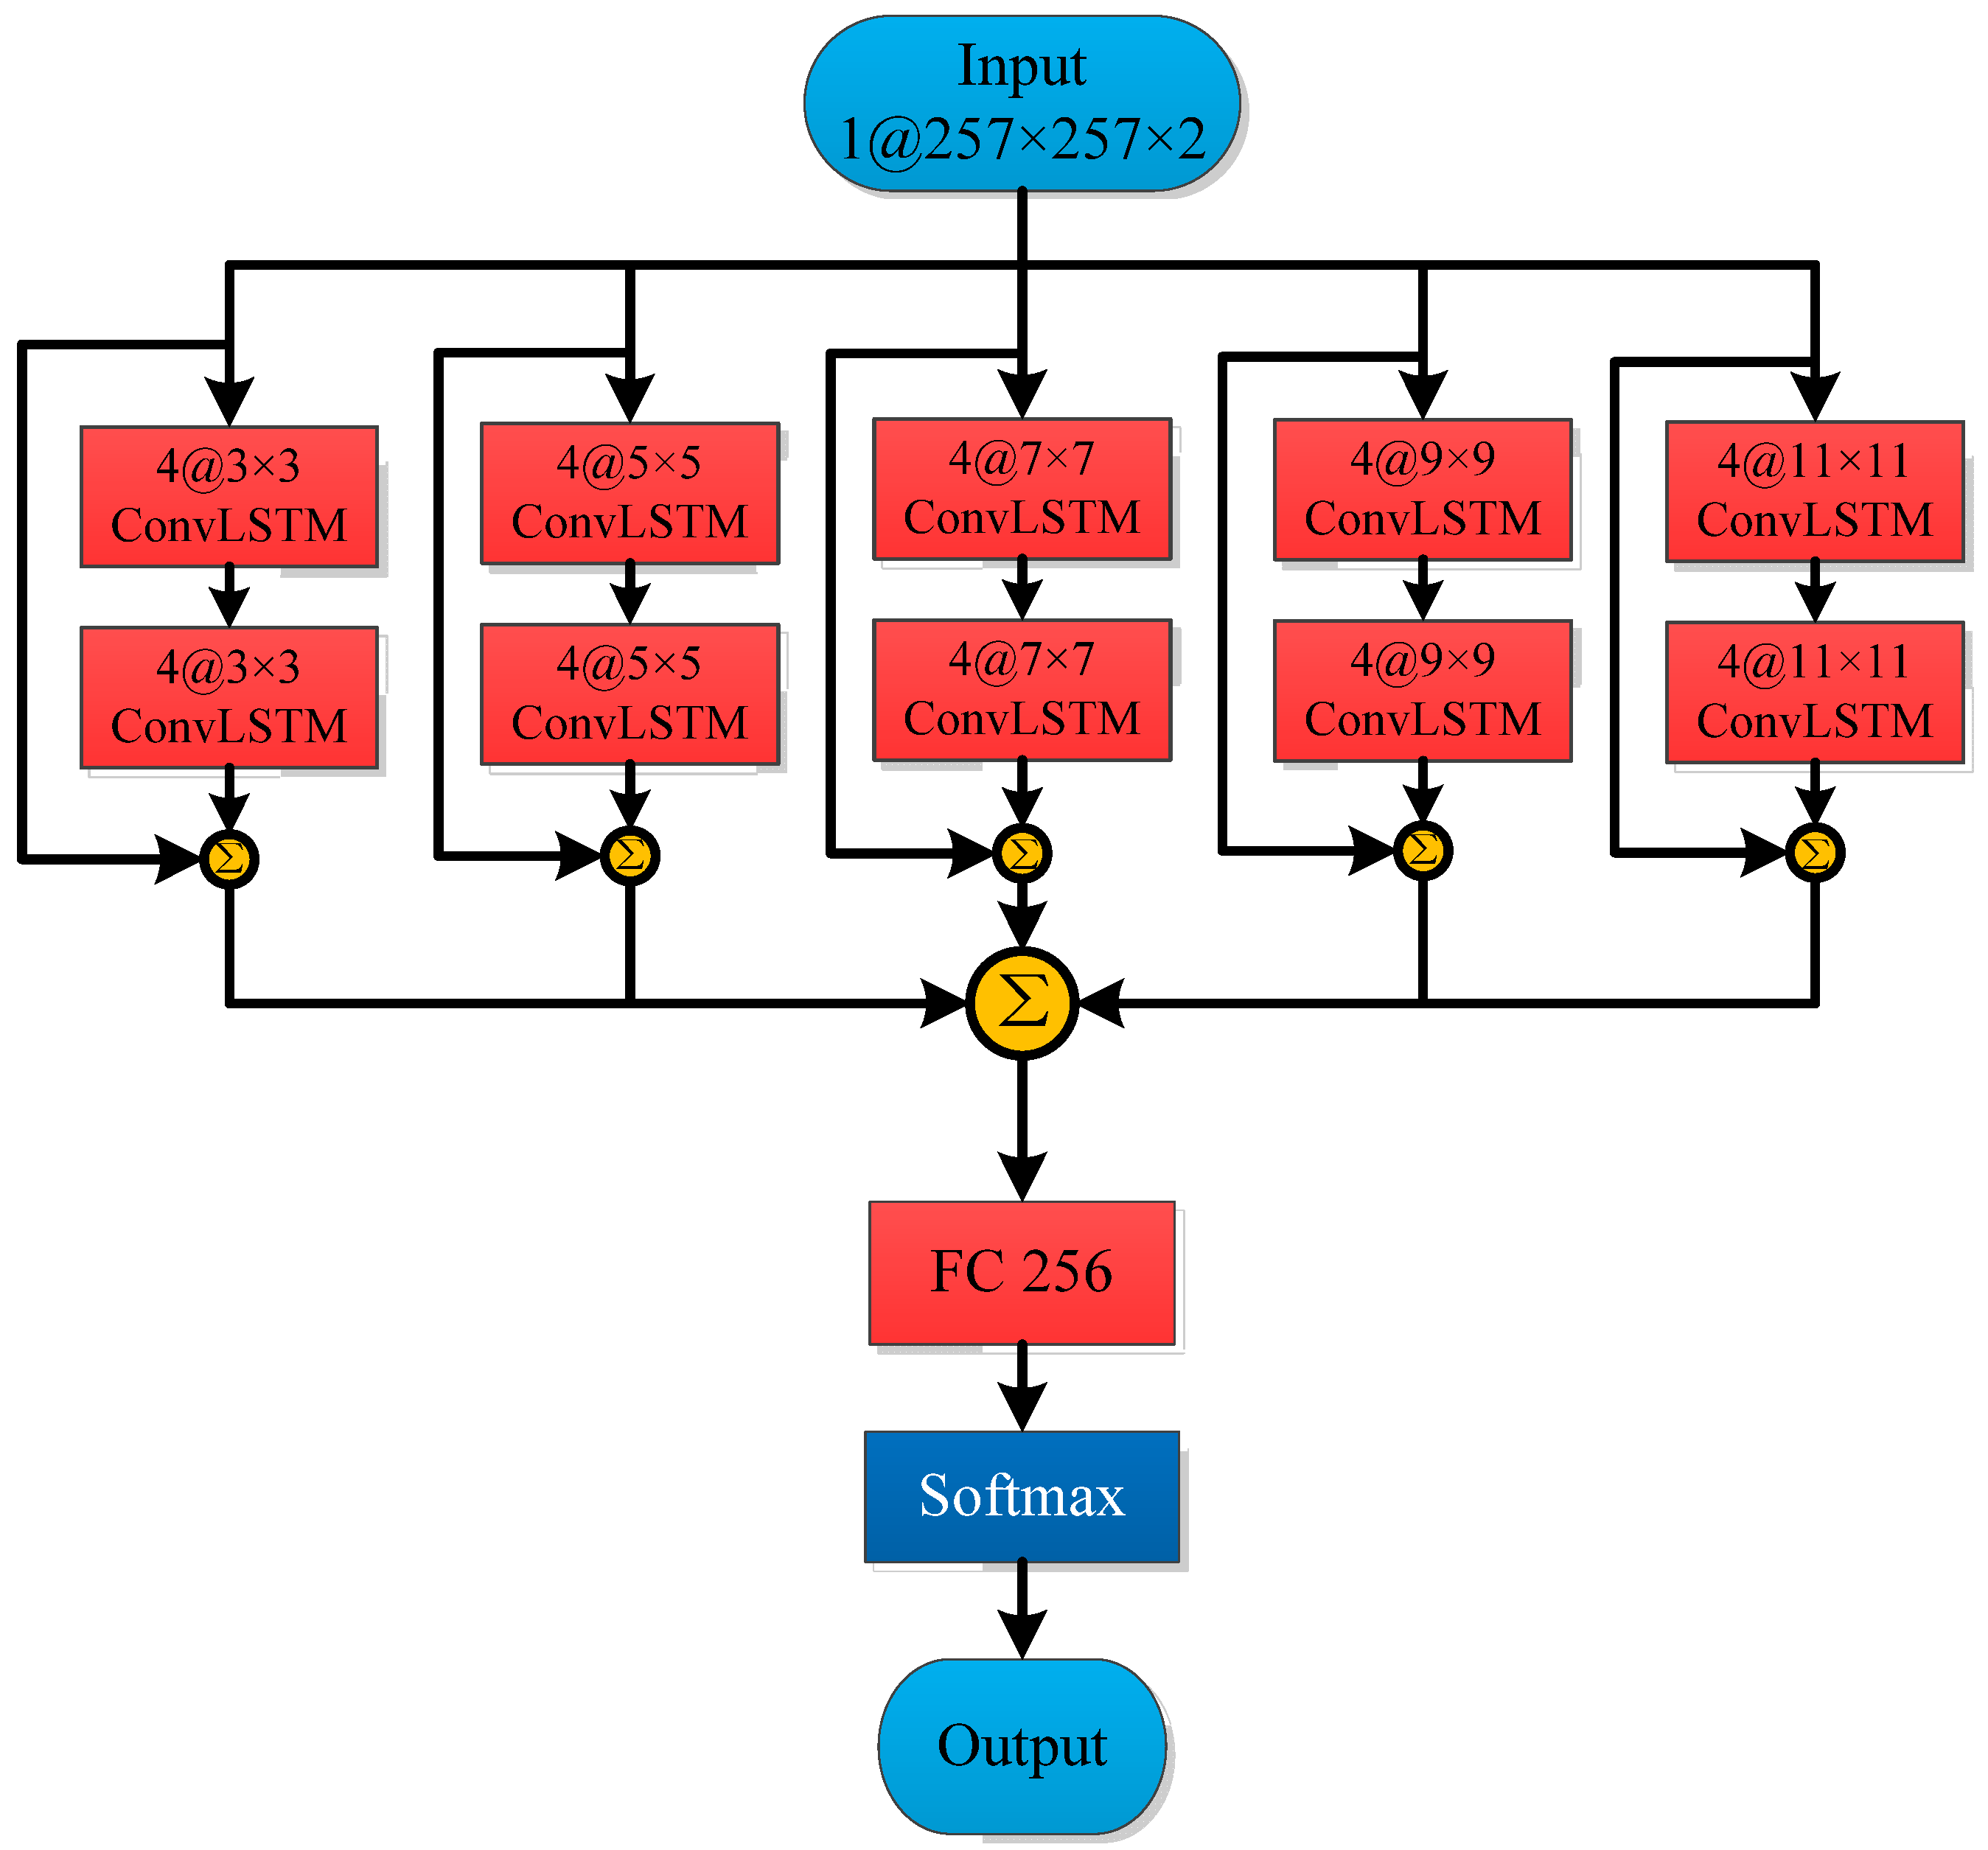
To address the classification problem of two-dimensional attribute maps of infrasound signals, this paper proposes a Multi-Scale Convolutional Kernel and Convolutional Long Short-Term Memory Network (Multi-scale ConvLSTM Network, MCLN). The architecture of this network is depicted in
Figure 8 and detailed in
Table 4. The network comprises a multi-level structure: The first part consists of five parallel convolutional modules with varying kernel sizes, specifically
,
,
,
, and
. Each module incorporates two layers of ConvLSTM with the same kernel size. After multi-scale feature fusion, the second part of the network is a fully connected layer, which performs feature transformation and dimensionality reduction. Finally, the classification task is accomplished via the softmax layer.
The ConvLSTM module employs five parallel convolutional layers for multi-scale feature extraction, with the objective of capturing both long-term correlations and local variations in the features simultaneously. Each convolutional module consists of two layers with identical convolutional kernels, designed to extract features at different hierarchical depths.
Moreover, the ConvLSTM layer introduced in this network integrates CNNs and LSTM networks in a synergistic manner. This integration fully leverages the complementary nature of spatial and temporal features, thereby enhancing classification accuracy. By constructing a more efficient and robust classification model, this method is better suited to handle the complex spatiotemporal characteristics of infrasound signals.
2.4. Procedure for Method Implementation
Based on the aforementioned methods, the process of the infrasound signal classification method proposed in this section, which is based on GAF and ConvLSTM network, is illustrated in
Figure 9. The specific implementation steps are as follows:
- (a)
Extract the power spectrum features of infrasound signals and integrate the features of the same event collected by the same station.
- (b)
Compute GAF of the integrated features and obtain the stacked features of the multi-element Gramian Angular Field.
- (c)
Divide the dataset into training, validation, and test sets. Utilize the MVIDA algorithm [
14] to enhance the samples in the training and validation sets.
- (d)
Develop a network framework based on ConvLSTM, incorporating multi-scale convolutional kernels and ConvLSTM modules to capture both spatial and temporal features effectively.
- (e)
Train the model using the training set and validate the model performance using the validation set to optimize the network parameters.
- (f)
Employ the trained network model to classify the test set and evaluate the classification performance.
3. Classification Experiment and Result Analysis
To evaluate the performance of the proposed MCLN model, this paper designs three sets of experiments: signal processing operation effect verification, ConvLSTM module performance comparison, and MCLN model performance comparison. The signal processing operation effect verification experiment analyzes the contributions of different signal processing strategies to model performance from the perspectives of GAF characteristics and feature combinations. The ConvLSTM module performance comparison experiment examines the contributions of CNN-LSTM and ConvLSTM to model performance from the network module perspective. The MCLN model performance comparison experiment assesses the strengths and weaknesses of the classification framework proposed in this section relative to other existing methods from the overall performance perspective. The experimental results collectively validate the effectiveness of the classification framework proposed in this section across three dimensions: signal processing, network module, and overall performance.
3.1. Validation Experiment on Infrasound Signal Processing
Three sets of comparative experiments were conducted. The first set utilized the unstacked combined one-dimensional power spectrum as the network input, serving as the baseline. The second set employed the two-dimensional GAF without stacking as the network input. The third set used the stacked combined two-dimensional GAF as the network input. For the training and classification models, the classic LeNet-5 network was selected, with the first set using a one-dimensional variant of LeNet-5. The classification results are presented in
Table 5.
The classification accuracy rates for the three groups of experiments were 79.2%, 89.4%, and 90.4%, respectively. These results demonstrate that converting the one-dimensional power spectrum into a two-dimensional GAF attribute map leads to improvements in all four evaluation metrics. Furthermore, stacking and combining the two-dimensional GAF based on the station results in additional enhancements in these metrics. Compared to the one-dimensional power spectrum feature, using the stacked and combined two-dimensional GAF feature as the network input increased the classification accuracy and F1 score by 11.2% and 13.6%, respectively. The above results demonstrate that both the GAF extraction and the stacking combination operations contribute to enhancing the classification accuracy of infrasound signals, further validating the related discussion in
Section 2.2.1 regarding the advantages of GAF for infrasound classification tasks.
3.2. ConvLSTM Module Performance Comparison Experiment
To investigate the impact of the ConvLSTM module, as well as the CNN and LSTM modules, on the performance of the network model, we designed a comparative experiment using the ConvLSTM network model. In this experiment, LeNet-5 was employed as the foundational CNN model, and three experimental model configurations were established: The first group utilized the CNN as the baseline model. The second group incorporated an LSTM layer preceding the Softmax layer in the CNN to construct the CNN-LSTM model. The third group replaced the convolutional layers in the CNN with the ConvLSTM module to form the ConvLSTM model. The GAF was used as the input for all experimental groups. The classification results are presented in
Table 6.
The experimental results demonstrate that, compared to the model incorporating the ConvLSTM module, the classification model using a combination of CNN and LSTM (CNN-LSTM) exhibits a decline in all four evaluation metrics. This suggests that although the integration of CNN and LSTM aims to capture both temporal and spatial features concurrently, this combination approach is relatively isolated. It can only focus on one type of feature at a time before transitioning to the other, thereby limiting the overall performance enhancement of the network model and potentially leading to performance degradation. In contrast, the ConvLSTM module is capable of simultaneously addressing both temporal and spatial features, fully leveraging their complementary nature to enhance classification accuracy. This results in a more effective and robust classification model.
Compared to the baseline model, the CNN-LSTM network exhibited a slight decrease in all four evaluation metrics, with a decline ranging from 0.5% to 0.8%. This suggests that although incorporating the LSTM module enhances the network’s focus on temporal features, simply concatenating LSTM with CNN does not necessarily improve the network’s classification performance. The ConvLSTM network showed a slight improvement in three metrics—ACC, F1 score, and TPR—with increases ranging from 0.3% to 0.7%, while TNR remained consistent with the baseline. These results indicate that increased attention to temporal features can enhance model performance, but the improvement is limited. Further enhancement of classification accuracy may require a redesign of the neural network architecture to more effectively integrate spatial and temporal features.
3.3. MCLN Module Performance Comparison Experiment
To further evaluate the classification performance and reliability of the MCLN model, we selected four CNN-based models commonly applied to infrasound classification for comparison. These models include the improved CNN [
16], the improved LeNet-5 [
7], the improved AlexNet [
8], and DenseNet-BiLSTM-SA [
9]. The classification results are presented in
Table 7.
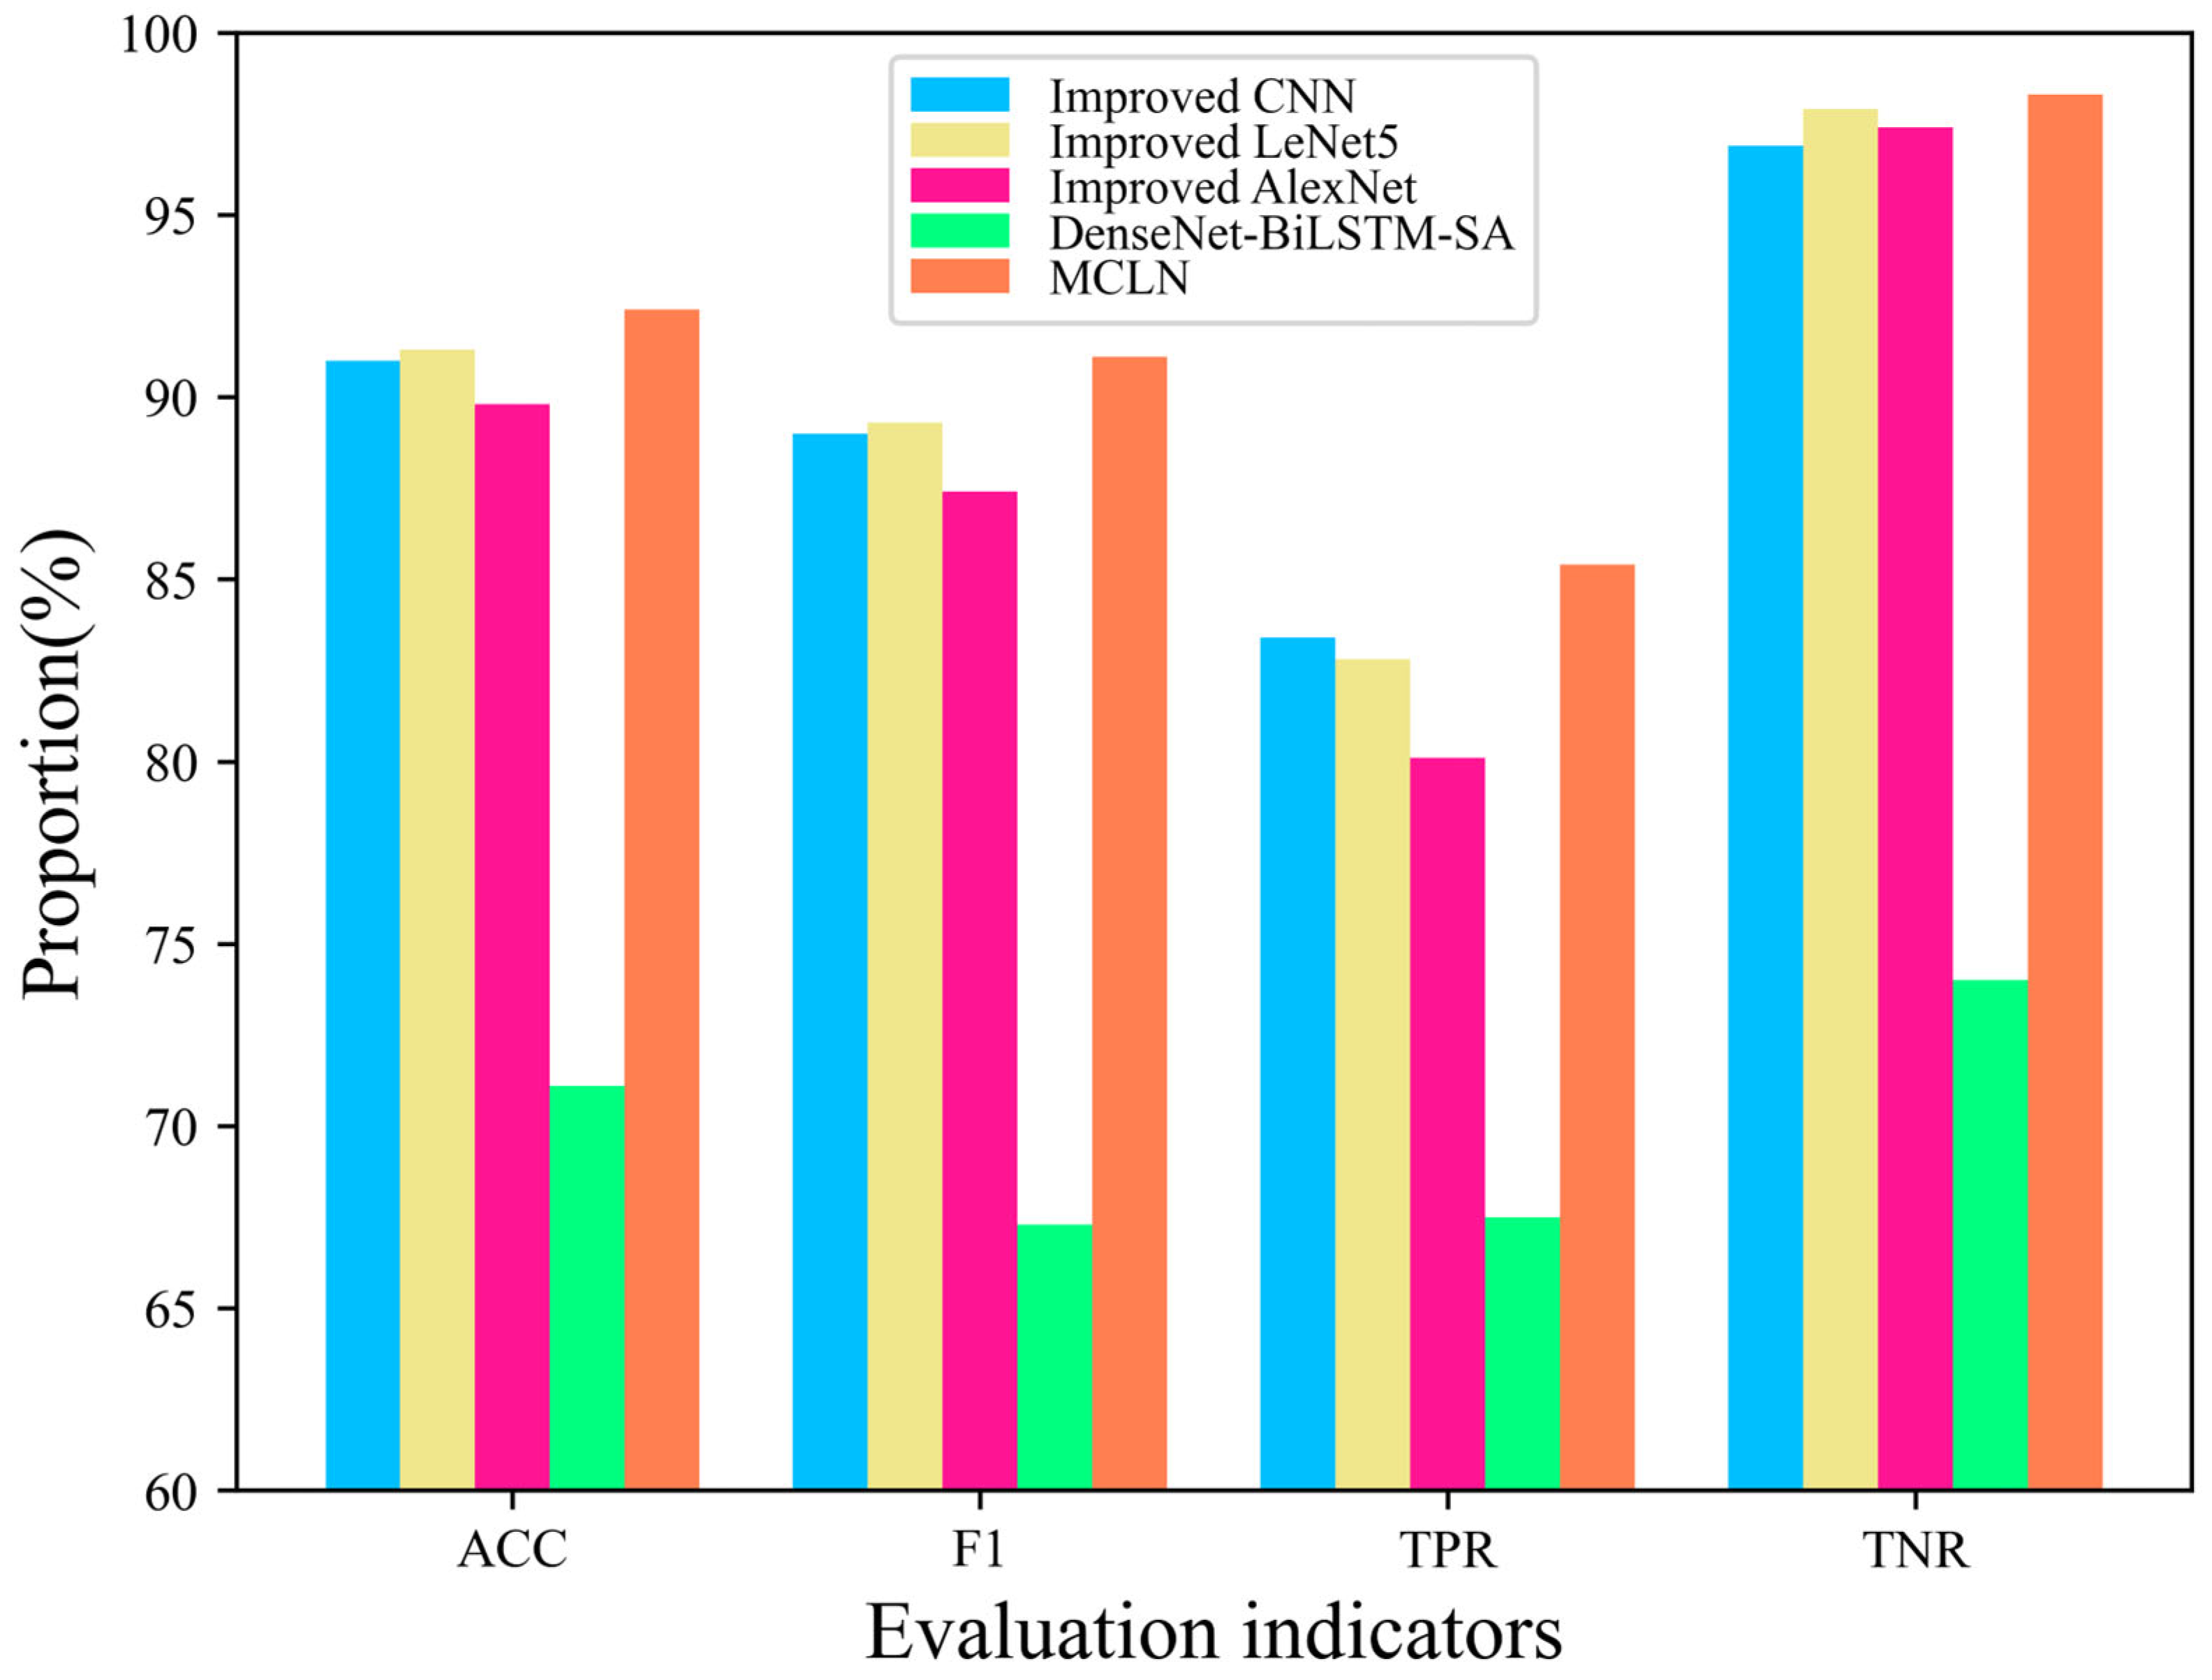
Table 7 and
Figure 10 present the classification results of five different classification models on the test sets of chemical explosion and seismic infrasound signals. The MCLN model achieved a classification accuracy of 92.4% and an F1 score of 91.1%, which are the highest among all models and significantly outperform other models. Meanwhile, the networks primarily based on CNN (from the first to the third group) demonstrated relatively high classification accuracy, with accuracy rates ranging from 89.8% to 91.3%. However, the addition of the BiLSTM module in the fourth group led to a notable decrease in classification accuracy. This result further confirms that directly concatenating LSTM with CNN, as observed in the previous experiment, is not suitable for the classification task involving GAF two-dimensional attribute graph data.
From the perspective of parameter count and FLOPs, MCLN has 6.7×10⁸ parameters, which is the highest among the five compared methods. However, its parameter scale remains at the same order of magnitude as the improved CNN. In terms of computational complexity, MCLN requires 7.2 × 10⁸ FLOPs, placing it at a medium level among the five classification models. Overall, MCLN achieves improved classification accuracy by increasing its parameter count while maintaining good training efficiency, demonstrating an effective balance between performance and computational cost.
4. Conclusions
Leveraging the spatiotemporal characteristics of infrasound signals, this paper proposes a novel classification method for infrasound signals based on the GAF and ConvLSTM networks. This study focuses on addressing infrasound signal classification problems in chemical explosion and seismic events. The proposed method innovatively transforms one-dimensional infrasound signals into two-dimensional GAF image representations that preserve temporal information and constructs a deep learning model capable of simultaneously extracting spatial and spectral features from the signals. Experimental results demonstrate that the proposed method achieves outstanding performance in the target classification task, thereby validating its effectiveness.
In terms of experimental design, this study constructed a dataset comprising 789 infrasound samples, encompassing two types of events: chemical explosions and earthquakes. The model was trained and evaluated using a cross-validation approach. Through the design of three sets of comparative experiments, the contributions of the GAF feature transformation and the ConvLSTM network architecture to classification performance were, respectively, verified. The experimental results demonstrate that the proposed method ultimately achieves a classification accuracy rate of 92.4%, representing a significant improvement in the recognition of infrasound signals.
While the proposed method has demonstrated satisfactory performance in classifying chemical explosions and earthquakes, its generalization capability to other types of infrasound events, such as fireballs, mine explosions, pipeline explosions, and rocket launches, remains to be further validated. Future research will concentrate on developing classification methods for a broader range of infrasound signals, with the aim of enhancing the model’s applicability in more complex scenarios.
Author Contributions
Conceptualization, X.T. and X.L.; methodology, X.T. and X.L.; software, X.T., H.L., T.L. and S.L.; validation, X.T.; formal analysis, X.L. and X.Z.; investigation, X.T. and H.L.; resources, X.T., X.L. and H.L.; data curation, X.T. and H.L.; writing—original draft preparation, X.T.; writing—review and editing, X.L., H.L., X.Z., T.L. and S.L.; visualization, X.T.; supervision, X.L.; project administration, X.L.; funding acquisition, X.L. All authors have read and agreed to the published version of the manuscript.
Funding
This research was supported by the Natural Science Foundation of Shaanxi Province, China (2023-JC-YB-221).
Data Availability Statement
Data related to this study are available and can be obtained by contacting the corresponding author.
Conflicts of Interest
The authors declare no conflicts of interest.
References
- Evers, L.; Haak, H. The Characteristics of Infrasound, its Propagation and Some Early History. In Infrasound Monitoring for Atmospheric Studies; Le Pichon, A., Blanc, E., Hauchecorne, A., Eds.; Springer: Dordrecht, The Netherlands, 2010; pp. 3–27. [Google Scholar]
- Zhang, L.X. Introduction to Test Ban Verification Techniques; National Defense Industry Press: Beijing, China, 2005. [Google Scholar]
- Matoza, R.S.; Vergoz, J.; Le Pichon, A.; Ceranna, L.; Green, D.N.; Evers, L.G.; Ripepe, M.; Campus, P.; Liszka, L.; Kvaerna, T.; et al. Long-range acoustic observations of the Eyjafjallajökull eruption, Iceland, April–May 2010. Geophys. Res. Lett. 2011, 38, L0630. [Google Scholar] [CrossRef]
- Ceranna, L.; Pichon, A.; Green, D.; Mialle, P. The buncefield explosion: A benchmark for infrasound analysis across central europe. Geophys. J. Int. 2009, 177, 491–508. [Google Scholar] [CrossRef]
- Stevens, J.L.; Divnov, I.I.; Adams, D.A.; Murphy, J.R.; Bourchik, V.N. Constraints on Infrasound Scaling and Attenuation Relations from Soviet Explosion Data. Pure Appl. Geophys. 2002, 159, 1045–1062. [Google Scholar] [CrossRef]
- Pilger, C.; Ceranna, L.; Ross, J.O.; Le Pichon, A.; Mialle, P.; Garcés, M.A. CTBT infrasound network performance to detect the 2013 Russian fireball event. Geophys. Res. Lett. 2015, 42, 2523–2531. [Google Scholar] [CrossRef]
- Leng, X.P.; Feng, L.Y.; Ou, O.; Du, X.L.; Liu, D.L.; Tang, X. Debris Flow Infrasound Recognition Method Based on Improved LeNet-5 Network. Sustainability 2022, 14, 15925. [Google Scholar] [CrossRef]
- Yuan, L.; Liu, D.L.; Sang, X.J.; Zhang, S.J.; Chen, Q. Debris Flow Infrasound Signal Recognition Approach Based on Improved AlexNet. Comput. Mod. 2024, 3, 1–6. [Google Scholar]
- Pang, Z.; Feng, G.; Zhu, J.; Kong, J.; Zhen, D.; Teng, P. An Approach for Infrasound Event Classification Based on DenseNet-BiLSTM Fusion and Self-attention Mechanism. In International Conference on the Efficiency and Performance Engineering Network; Liu, T., Zhang, F., Huang, S., Wang, J., Gu, F., Eds.; Springer: Cham, Switzerland, 2024; pp. 385–396. [Google Scholar]
- Wang, Z.G.; Oates, T. Imaging time-series to improve classification and imputation. In International Conference on Artificial Intelligence; AAAI Press: Washington, DC, USA, 2015; pp. 3939–3945. [Google Scholar]
- Vargas, V.; Ayllón-Gavilán, R.; Durán-Rosal, A.; Gutiérrez, P.; Hervás-Martínez, C.; Guijo-Rubio, D. Gramian Angular and Markov Transition Fields Applied to Time Series Ordinal Classification. In Advances in Computational Intelligence; Rojas, I., Joya, G., Catala, A., Eds.; Springer: Cham, Switzerland, 2023; pp. 505–516. [Google Scholar]
- Malhathkar, S.; Thenmozhi, S. Classifying Chaotic Time Series Using Gramian Angular Fields and Convolutional Neural Networks. In Smart Trends in Computing and Communications; Senjyu, T., So-In, C., Joshi, A., Eds.; Springer: Singapore, 2024; pp. 399–408. [Google Scholar]
- Shi, X.; Chen, Z.; Wang, H.; Yeung, D.Y.; Wong, W.K.; Woo, W.C. Convolutional LSTM Network: A Machine Learning Approach for Precipitation Nowcasting; MIT Press: Cambridge, MA, USA, 2015. [Google Scholar]
- Tan, X.F.; Li, X.H.; Niu, C.; Zeng, X.N.; Li, H.R.; Liu, T.Y. Classification method of infrasound events based on the MVIDA algorithm and MS-SE-ResNet. Appl. Geophys. 2024, 21, 667–679. [Google Scholar] [CrossRef]
- Keogh, E.; Pazzani, M. Scaling up dynamic time warping to massive datasets. In Principles of Data Mining and Knowledge Discovery; Żytko, J., Rauch, J., Eds.; Springer: Berlin/Heidelberg, Germany, 1999; pp. 1–11. [Google Scholar]
- Tan, X.F.; Li, X.H.; Liu, J.H.; Li, G.S.; Yu, X.T. Classification of chemical explosion and earthquake infrasound based on 1-D convolutional neural network. J. Appl. Acoust. 2021, 40, 457–467. [Google Scholar]
- Hupe, P.; Ceranna, L.; Le Pichon, A.; Matoza, R.S.; Mialle, P. International Monitoring System infrasound data products for atmospheric studies and civilian applications. Earth Syst. Sci. Data 2022, 14, 4201–4230. [Google Scholar] [CrossRef]
Figure 1.
The structural diagrams of the key components in the classification method proposed in this paper.
Figure 1.
The structural diagrams of the key components in the classification method proposed in this paper.
Figure 2.
Waveforms and power spectra of two types of infrasound events. (a) Time–domain waveform of a chemical explosion infrasound signal; (b) time–domain waveform of a natural earthquake infrasound signal; (c) power spectrum of the chemical explosion signal; (d) power spectrum of the earthquake signal.
Figure 3.
The distribution of source distances for two types of infrasound event signals.
Figure 3.
The distribution of source distances for two types of infrasound event signals.
Figure 4.
Schematic diagram of the dataset partitioning methodology.
Figure 4.
Schematic diagram of the dataset partitioning methodology.
Figure 5.
The GAF diagrams for chemical explosion infrasound signals and earthquake infrasound signals. (a) GAF derived from the infrasound signal from a chemical explosion; (b) GAF derived from the seismic infrasound signal.
Figure 5.
The GAF diagrams for chemical explosion infrasound signals and earthquake infrasound signals. (a) GAF derived from the infrasound signal from a chemical explosion; (b) GAF derived from the seismic infrasound signal.
Figure 6.
Schematic diagram of GAF feature combination processing for multi-array element infrasound signals.
Figure 6.
Schematic diagram of GAF feature combination processing for multi-array element infrasound signals.
Figure 7.
This network extends the FC-LSTM by integrating convolutional structures into both the input-to-state and state-to-state transformations.
Figure 7.
This network extends the FC-LSTM by integrating convolutional structures into both the input-to-state and state-to-state transformations.
Figure 8.
MCLN network structure diagram.
Figure 8.
MCLN network structure diagram.
Figure 9.
Flowchart of the infrasound signal classification method based on GAF and ConvLSTM.
Figure 9.
Flowchart of the infrasound signal classification method based on GAF and ConvLSTM.
Figure 10.
Classification results of different networks.
Figure 10.
Classification results of different networks.
Table 1.
Number of infrasound events and samples.
Table 1.
Number of infrasound events and samples.
| Category | Number of Events | Number of Samples |
|---|
| Chemical Explosions | 28 | 386 |
| Earthquake | 8 | 403 |
| Overall Total | 36 | 789 |
Table 2.
Subdata set partition scheme.
Table 2.
Subdata set partition scheme.
| | Subdata Set 1 | Subdata Set 2 | Subdata Set 3 |
|---|
| Number of Events | Number of Samples | Number of Events | Number of Samples | Number of Events | Number of Samples |
|---|
| Chemical explosion | 10 | 123 | 11 | 144 | 7 | 119 |
| Earthquake | 4 | 121 | 2 | 154 | 2 | 128 |
Table 3.
Comparison of the similarity evaluation results between power spectrum characteristics and GAF characteristics.
Table 3.
Comparison of the similarity evaluation results between power spectrum characteristics and GAF characteristics.
| Characteristics | Ratio_SSIM (10−2) | Ratio_CS (10−2) | Ratio_MSE (10−2) |
|---|
| Power specturm | 99.67 | 99.91 | 95.75 |
| GAF | 103.61 | 103.94 | 115.24 |
Table 4.
MCLN network structure parameters.
Table 4.
MCLN network structure parameters.
| Layer | Type | Convolution Kernel Size | Step Size | Input Size | Output Size |
|---|
| I | Input layer | — | — | | |
| L1 | ConvLSTM | ; ; ; ; | 2 | | |
| L2 | ConvLSTM | ; ; ; ; | 2 | | |
| L3 | FC | — | — | | |
| L4 | Output layer | — | — | | |
Table 5.
Comparison of classification results for different input features networks.
Table 5.
Comparison of classification results for different input features networks.
| Network Input | ACC | F1 | TPR | TNR |
|---|
| Power Spectrum | GAF | Combination (Stacking) |
|---|
| √ | × | × | 79.2% | 74.7% | 69.9% | 86.5% |
| × | √ | × | 89.4% | 87.2% | 82.1% | 95.1% |
| × | √ | √ 1 | 90.4% | 88.3% | 82.1% | 96.9% |
Table 6.
Comparison of classification results for ConvLSTM and CNN-LSTM modules.
Table 6.
Comparison of classification results for ConvLSTM and CNN-LSTM modules.
| Classification Model | ACC | F1 | TPR | TNR |
|---|
| CNN | LSTM | ConvLSTM |
|---|
| √ | × | × | 90.4% | 88.3% | 82.1% | 96.9% |
| √ | √ | × | 89.8% | 87.5% | 81.5% | 96.4% |
| × | × | √ 1 | 90.7% | 88.7% | 82.8% | 96.9% |
Table 7.
Comparison of classification results among different networks.
Table 7.
Comparison of classification results among different networks.
| Classification Model | ACC | F1 | TPR | TNR | Parameters | FLOPs |
|---|
| Improved CNN | 91.0% | 89.0% | 83.4% | 96.9% | 5.4 × 10⁸ | 5.1 × 10⁹ |
| Improved LeNet5 | 91.3% | 89.3% | 82.8% | 97.9% | 1.5 × 10⁷ | 7.5 × 10⁷ |
| Improved AlexNet | 89.8% | 87.4% | 80.1% | 97.4% | 1.5 × 10⁷ | 1.1 × 10⁹ |
| DenseNet-BiLSTM-SA | 71.1% | 67.3% | 67.5% | 74.0% | 2.4 × 10⁶ | 9.8 × 10⁷ |
| MCLN | 92.4% | 91.1% | 85.4% | 98.3% | 6.7 × 10⁸ | 7.2 × 10⁸ |
| Disclaimer/Publisher’s Note: The statements, opinions and data contained in all publications are solely those of the individual author(s) and contributor(s) and not of MDPI and/or the editor(s). MDPI and/or the editor(s) disclaim responsibility for any injury to people or property resulting from any ideas, methods, instructions or products referred to in the content. |
© 2025 by the authors. Licensee MDPI, Basel, Switzerland. This article is an open access article distributed under the terms and conditions of the Creative Commons Attribution (CC BY) license (https://creativecommons.org/licenses/by/4.0/).
