Abstract
Field-based landslide mapping is a crucial task for geo-hydrological risk assessment but is often limited by the lack of integrated tools to capture accurate spatial and temporal data. This research investigates a Direct Numerical Cartography (DNC) system’s ability to capture both spatial and temporal landslide features during fieldwork. DNC enables fully digital surveys, minimizing errors and delivering real-time, spatially accurate data to experts on site. We tested an integrated approach combining the Ground Operative System for GIS Input Remote-data Acquisition (GOGIRA) with the Expert-based Multitemporal AI Detector (ExMAD). GOGIRA is a low-cost system for efficient georeferenced data collection, while ExMAD uses AI and multitemporal Sentinel-2 imagery to detect landslide triggering times. Upgrades to GOGIRA’s hardware and algorithms were carried out to improve its mapping accuracy. Field tests in Western Greece compared data to 64 expert-confirmed landslides, with the Range-R device showing a mean spatial error of 50 m, outperforming the tripod-based UGO device at 82 m. Operational factors like line-of-sight obstructions and terrain complexity affected accuracy. ExMAD applied a pre-trained U-Net convolutional neural network for automated temporal trend detection of landslide events. The combined DNC and AI-assisted remote sensing approach enhances landslide inventory precision and consistency while maintaining expert oversight, offering a scalable solution for landslide monitoring.
1. Introduction
Remote surveys have proven invaluable for large-scale landslide mapping [1,2]. However, field surveys remain crucial for gathering geological details about landslides, despite the time and safety challenges they often entail [3,4,5]. While traditional field surveys depend on expert-based techniques, advances in remote sensing are facilitating automated landslides mapping over broad areas.
Information technology advancements have fostered modern Geographic Information Systems (GIS) founded on multiscale and digital spatial databases [6,7,8]. Numerical Cartography (NC) has progressed more slowly due to its dual structure: the first type, Indirect Numerical Cartography (INC), digitizes traditional paper maps, while Direct Numerical Cartography (DNC) acquires “digital-born” data directly in the field [9]. The INC approach introduces an extra step in processing, requiring field maps to be digitized and attribute tables compiled, which can be time-intensive and lead to error propagation through scanning, georeferencing, and shape redrawing. By contrast, DNC enables recording field data directly in digital format, reducing redundant steps and minimizing cartographic errors, thus expediting the mapping process and enhancing data precision.
As outlined by Guzzetti et al. [9], DNC techniques encompass (i) morphometric analyses with Digital Terrain Models (DTMs), (ii) satellite imagery analysis, and (iii) digital data acquisition tools. DTMs and satellite imagery are widely employed for remote digital mapping, and methodologies associated with these technologies have seen significant advancements in recent years. Digital acquisition tools, on the other hand, are primarily used to gather digital-born data during fieldwork. These tools can be broadly categorized into those designed for direct cartographic data collection, such as Global Navigation Satellite Systems (GNSS), total stations, laser rangefinders, laser scanners, photogrammetry systems, and ground-based interferometric synthetic aperture radar (GB-InSAR), and those involving GIS software and supporting hardware. Examples include platforms like QField and ArcGIS Field Maps, which are often operated on devices such as personal computers, tablets, and smartphones during field mapping activities.
While several commercial solutions exist for Direct Numerical Cartography (DNC) (e.g., GNSS receiver, laser scanner, LIDAR, binocular rangefinder, total station), their widespread adoption is hindered by high costs, limited interoperability, and proprietary patents. Licata and Fubelli [10] proposed a new DNC approach to make direct digital mapping tools more affordable using open-source programmable Arduino boards and economic sensor modules. The GOGIRA system (Ground Operative System for GIS Input Remote-data Acquisition) was developed and tested in the Quincinetto landslide area (northwestern Italy). Two mapping devices, named UGO and Range-R, were developed to collect local polar coordinates of targets during field surveys and store them by an Android app (MARVIN). UGO was designed with a tripod-based concept, while Range-R uses a 9-degrees-of-freedom (DOF) system and both. The GOGIRA system allows users to collect geospatial data directly on-site in a GIS-compatible format, thus eliminating common errors associated with traditional digitization and reducing field mapping time while enhancing data accuracy.
To process spatial data, GOGIRA’s CoordFinder algorithm employs a metric-based system, selecting the WGS84 (World Geodetic System 1984) ellipsoid with UTM (Universal Transverse Mercator) projection. This configuration allows GOGIRA to operate effectively in most regions worldwide, as long as DTM data and GNSS signal coverage are available. Optimal results depend on factors such as DTM resolution, GNSS accuracy, and field conditions.
This new paper presents an enhanced version of the GOGIRA system, which integrates tacheometric measurements, GNSS technology, morphometric analysis, satellite imagery, and machine learning to identify landslide timing directly during on-site surveys. The system was employed to record geospatial coordinates of landslides encountered during a geomorphological field survey.
Accessing multitemporal satellite imagery in real time during field activities remains a challenge; such data are typically reserved for pre-survey planning or remote sensing analysis. No effective systems enabling direct access to time series data in the field were identified in the scientific literature review. However, determining the triggering time and potential reactivation of landslides is useful for accurate characterization of shallow landslides during fieldwork. The Ex-MAD (Expert-based Multitemporal AI Detector) framework was developed by Licata et al. [11]. This method integrates machine learning algorithms with globally accessible Sentinel-2 imagery, adding the temporal dimension to landslide mapping and enabling the estimation of the time range for landslide occurrence. The GOGIRA operated as a DNC tool, facilitating the geolocation of target landslides during field surveys, while the ExMAD framework was employed to estimate the triggering time of the identified landslides.
The study forms part of a multidisciplinary research initiative conducted in Western Greece, north of the Gulf of Patras, aimed at investigating and characterizing landslides triggered by the combined action of intense rainfall and earthquakes. The selected study area, located between the Gulf of Patras and Trichonis Lake graben, is notable for its diverse geomorphological features and frequent slope instabilities. In this context, the research aims to enhance field mapping of shallow landslides by introducing new tools to support field activities while also demonstrating their practical application though a real-world case study.
2. Materials and Methods
This section delves into the recent enhancements of the GOGIRA system and details the methodological workflow used to integrate it with the Ex-MAD framework. Although both GOGIRA and Ex-MAD have undergone independent validation in prior studies, this research focuses on testing their combined functionality under real-world field conditions.
Our experimental design focused on three key research questions:
- Q1: What is the spatial error of the GOGIRA system? Quantification of the geolocation error is critical to assessing data quality and case-specific usage limitations.
- Q2: Were working conditions affecting GOGIRA’s precision and accuracy? Field conditions, such as slope geometry, visibility constraints, and surface irregularities, can significantly affect system performance. Assessing their influences is crucial for assessing environmental working limits.
- Q3: Was Ex-MAD able to accurately identify the timing of landslides using the data points collected by GOGIRA’s devices? Temporal accuracy is critical for linking landslides to triggering events (e.g., precipitation or seismic activity). In addition, areas with a high susceptibility to landslides often have landslides triggered by different events that are difficult to distinguish from field observations.
2.1. GOGIRA Upgrades
Significant upgrades have been implemented in the GOGIRA system, specifically, in the UGO and Range-R devices, which are designated for targeting tasks. These devices presented some issues during initial testing by Licata and Fubelli [10], which we addressed prior to data acquisition (Figure 1). First, the Arduino Nano boards used in the previous version had a low RAM (random access memory) capacity that affected the complexity of the firmware. In addition, the GPS module had not been implemented directly in the devices, and the coordinates of the mapping station were acquired with external devices (e.g., using a portable GNSS receiver). A crucial limitation was the mechanical structure of UGO (which was not very stable and tilting) and the production from external objects and the dust of the electronic components of both the UGO and Range-R field devices. Finally, Range-R had demonstrated unstable performance due to the inefficient calibration of the AHRS (Attitude and Heading Reference System) module installed on the previous version.
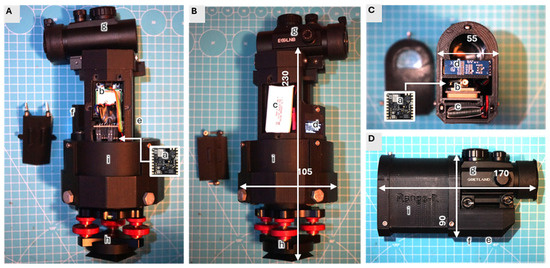
Figure 1.
Photographs of the developed devices (dimensions are in millimeters): UGO (A) right view, (B) left view; and Range-R (C) front view, (D) left view. Key components include (a) Arduino Nicla Sense ME, (b) GY-NEO6MV2 GPS module, (c) 3.7V Li-Po battery, (d) OLED display, (e) data acquisition button, (f) power switch, (g) red-dot sight, (h) triaxial tripod level, and (i) custom PLA casing.
To overcome RAM limitations and calibration challenges associated with the BNO055 sensor, the Nicla Sense ME [12] replaced the Arduino Nano [13] board, introducing AI-based self-calibration, improved azimuth angle precision, and reduced power consumption. Its compact design (22.86 × 22.86 mm) also contributed to making the UGO and Range-R devices significantly smaller. Additionally, this module integrates the AHRS and a Bluetooth low-energy module in a single tiny board powered by data fusion algorithms.
For enhanced geolocation, a GY-NEO6MV2 NEO-6M GPS module [14] with a ceramic antenna was incorporated, adding previously unavailable direct positioning capabilities. This module is a less-than-EUR-10 module, robust and widely employed in open-source projects. The system also now includes a 3.7 V, 1200 mAh rechargeable lithium battery, improving the device’s sustainability for extended field use.
Lastly, the mechanical structure of UGO and Range-R underwent a complete redesign (see Figure 1), enhancing the durability, mechanical stability, and environmental resistance to elements like dust and moisture.
2.2. Integrating GOGIRA and ExMAD
We integrated the GOGIRA system with the ExMAD framework in a synergic workflow (Figure 2) to streamline field data collection and, after mapping landslides, to automatically identify their time of activation. Initially, UGO and/or Range-R devices are used to capture targeting data directly in the field, recording them as relative polar coordinates (azimuth and zenith) and the device’s position (WGS84) (Figure 2A). These data are sent to the MARVIN android app via Bluetooth Low-Energy (BLE) and subsequently exported as a “.txt” file to be processed by the CoordFinder algorithm (Figure 2B). This uses a DTM to detect the intersection between the line of sight and the virtual topographic surface, converting the polar coordinates collected by UGO/Range-R into cartographic coordinates (UTM-WGS84), providing geolocation for each target point (Figure 2C). Python libraries such as pandas v. 2.1.1 [15] (for data management), rasterio v. 1.3.8 [16] (for raster data handling), pyproj v. 3.6.1 [17] (for coordinate transformation), and numpy v. 1.26.3 [18] (for array processing) support this geolocation process.
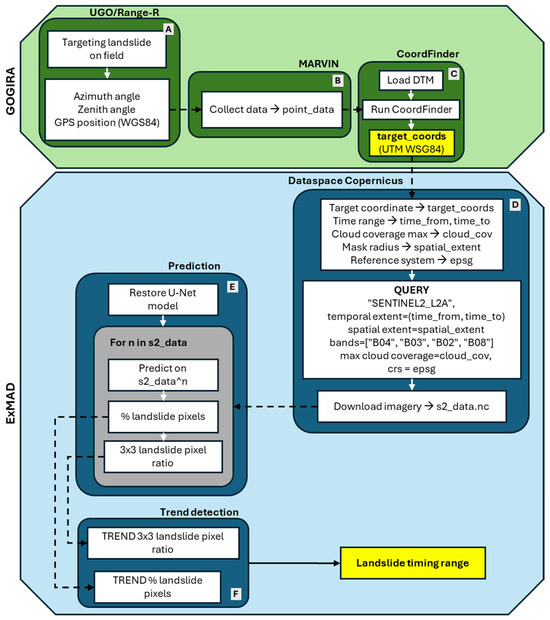
Figure 2.
Workflow diagram integrating the GOGIRA system (green blocks) with the ExMAD framework (blue blocks) for spatial and temporal landslide mapping. (A) field targeting; (B) data collection; (C) target coordinate computing; (D) Copernicus Dataspace API data request and download; (E) U-Net landslide multitemporal prediction; (F) trend change detection.
Once the target location data are ready, ExMAD’s framework is applied. The setup involves specifying parameters like the time range, cloud coverage limits, clip radius, and cartographic reference system (CRS). Then, the Sentinel-2 L2A images are retrieved from the Copernicus Data Space database using an API (Application Programming Interface) query with the openeo v. 0.32.0 library [19]. The Red (R), green (G), blue (B), and near-infrared (NIR) bands are downloaded for the entire temporal sequence and data imported in the Python environment using the xarray v. 2024.9.0 library [20] (Figure 2D). This procedure enables optimizing resources by downloading extensive sequences of temporal S2 images for a spatial section limited to the landslide under investigation. The size of the satellite image dataset is not standardizable, as parameters such as the time interval and cloud cover can significantly affect the time size of the available dataset. The ExMAD API query must be set to download S2 images with the same CRS of CoordFinder outputs. In the current research article, we did not explicitly consider the possible distortion introduced in the spatial analysis by different CRS due to the local scale of the field test (up to a few kilometers max range).
Next, the U-Net model [21], a pre-trained deep learning model [11] with PyTorch v. 2.1.0 [22] and CUDA v. 11.8 [23], is loaded to analyze the images. Although the authors demonstrated that the model proved sufficient landslide detection capabilities, they highlighted that further fine-tuning of hyperparameters and data generalization techniques could enhance its reliability, especially in accurately identifying landslide boundaries. However, as shown in Figure 2E, in the current research, the U-Net model is used primarily to predict landslides’ presence or absence for each image in the timeline. From these predictions, the proportion of landslide pixels is calculated, both for the entire image and within a central pixel and its eight neighbors (Figure 2F). The landslide presence/absence temporal curves are smoothed with a polynomial filter with a windows size of 5, and trends are detected with the Pelt method in the ruptures v.1.1.9 library [24] to automate trend detection. Linear regression is then performed with the linregress method in the scipy v. 1.11.3 library [25] for each trend line. This workflow allows detecting changes over time, identifying specific date ranges when landslide activity is likely to have occurred. Finally, the images associated with a trend change are validated by experts: for each landslide target point, the entire image timeline (RGB, false-color, and U-Net landslide prediction) can be inspected by the mapper to confirm the accuracy of the automated model, providing a robust landslide timing framework.
This integration of GOGIRA and ExMAD thus combines DNC field data collection with multitemporal satellite analysis, offering a refined method for detecting and validating landslide events.
2.3. Accuracy Evaluation and Test
For the accuracy assessment of GOGIRA, data gathered from the UGO and Range-R devices were processed in Python using the CoordFinder algorithm. This step converts the polar coordinates collected on the field into cartographic coordinates based on a 5 m resolution DTM obtained from the Greek National Cadastre, using the WGS-84 datum with the UTM zone 34N projection. The generated coordinates were imported into QGIS software (v. 3.28.10) for spatial analysis.
With QGIS, we verified the coordinates against true target locations derived from field data and satellite imagery mapping, and we calculated the spatial error as the Euclidean distance between the measured () and true () target coordinates (Equation (1)).
To address research questions Q1 and Q2, we conducted a statistical analysis of spatial errors in UGO and Range-R measurements to evaluate their accuracy and reliability. Outlier analysis was performed first to identify and examine data points with unusually high errors, allowing us to exclude these outliers from subsequent error analysis. Examining these cases individually provided insight into whether specific mapping conditions, such as visual obstructions or line-of-sight issues, caused these high errors, helping to address Q2. After filtering the outliers, we applied descriptive statistics (mean, median, standard deviation) to understand typical error values and their variation, essential for investigating Q1. Welch t-tests were performed to determine if the observed measurement deviations were statistically significant or within random variation. Since data could not fully meet normal distribution assumptions, Wilcoxon tests were applied as a non-parametric alternative to the t-test, offering a comparison between error distributions without assuming normality. The Shapiro–Wilk test further validated these insights by statistically evaluating the normality of errors. Finally, we analyzed the correlation between the error magnitude and distance, which allowed us to detect any systematic error patterns, especially if errors increased with the distance from the observation point.
The research question Q3 was focused on assessing ExMAD’s capability for landslide timing detection. For each “true target” location, we downloaded Sentinel-2 Level 2A multispectral images with specific parameters:
- Ten m spatial resolution bands B2 (red), B3 (green), B4 (blue), and B8 (near-infrared), according to the pre-trained U-Net model requirements (see Licata et al. [11] for more details).
- Considering the climatic regime of the area, a maximum cloud coverage of 1% was chosen to select only low-noise imagery. Other percentages can be selected according to mapper experience, the time resolution required, and the local climatic condition.
- The date ranges were chosen from 1 January 2017 (close to the first image available) to 1 July 2024 (date close to the mapping campaign period).
- A clip radius of 160 m was used around each landslide target, according to Licata et al. [11].
The pre-trained U-Net model (metrics from Licata et al. [11]: average precision = 96.77, average recall = 92.51, F1-score = 94.59) was restored to individually predict each target landslide presence/absence across the entire time sequence.
According to Licata et al. [11], we tested two methods proposed in the original article to quantify landslide activity over time. The first method (hereafter referred to as method_1) calculated the percentage of pixels classified as landslide per image, thus providing a broad measure of landslide activity across the entire image. The second approach (method_2) calculated landslide pixel ratios within central pixels and their surrounding 3 × 3 grids, offering localized information around the primary area of interest.
To detect landslide timing, we applied linear regression to different segments of the time series for both landslide pixel percentages and 3 × 3 grid ratios. This segmentation-based approach allowed us to identify trend changes, which served as temporal markers for landslide events. Finally, we identified trend changes and performed linear regression on the temporal predictions to automatically detect the timing of landslide occurrences.
3. Experimental Field Trial
3.1. Study Area
We conducted a field survey in Western Greece to evaluate the upgraded GOGIRA system and ExMAD framework. The study area is located between Trichonis Lake and the Gulf of Patra, within a sparsely populated rural region characterized by an extensive network of secondary and tertiary roads connecting villages and agricultural holdings (Figure 3). GOGIRA field tests were conducted along secondary and tertiary roads, primarily paved or partially unpaved, while highly uneven tracks or routes accessible by off-road vehicles were excluded.
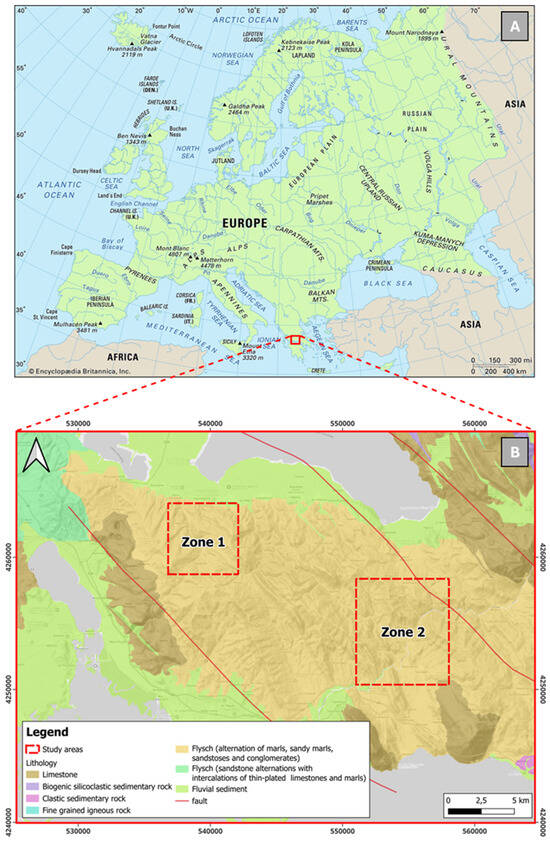
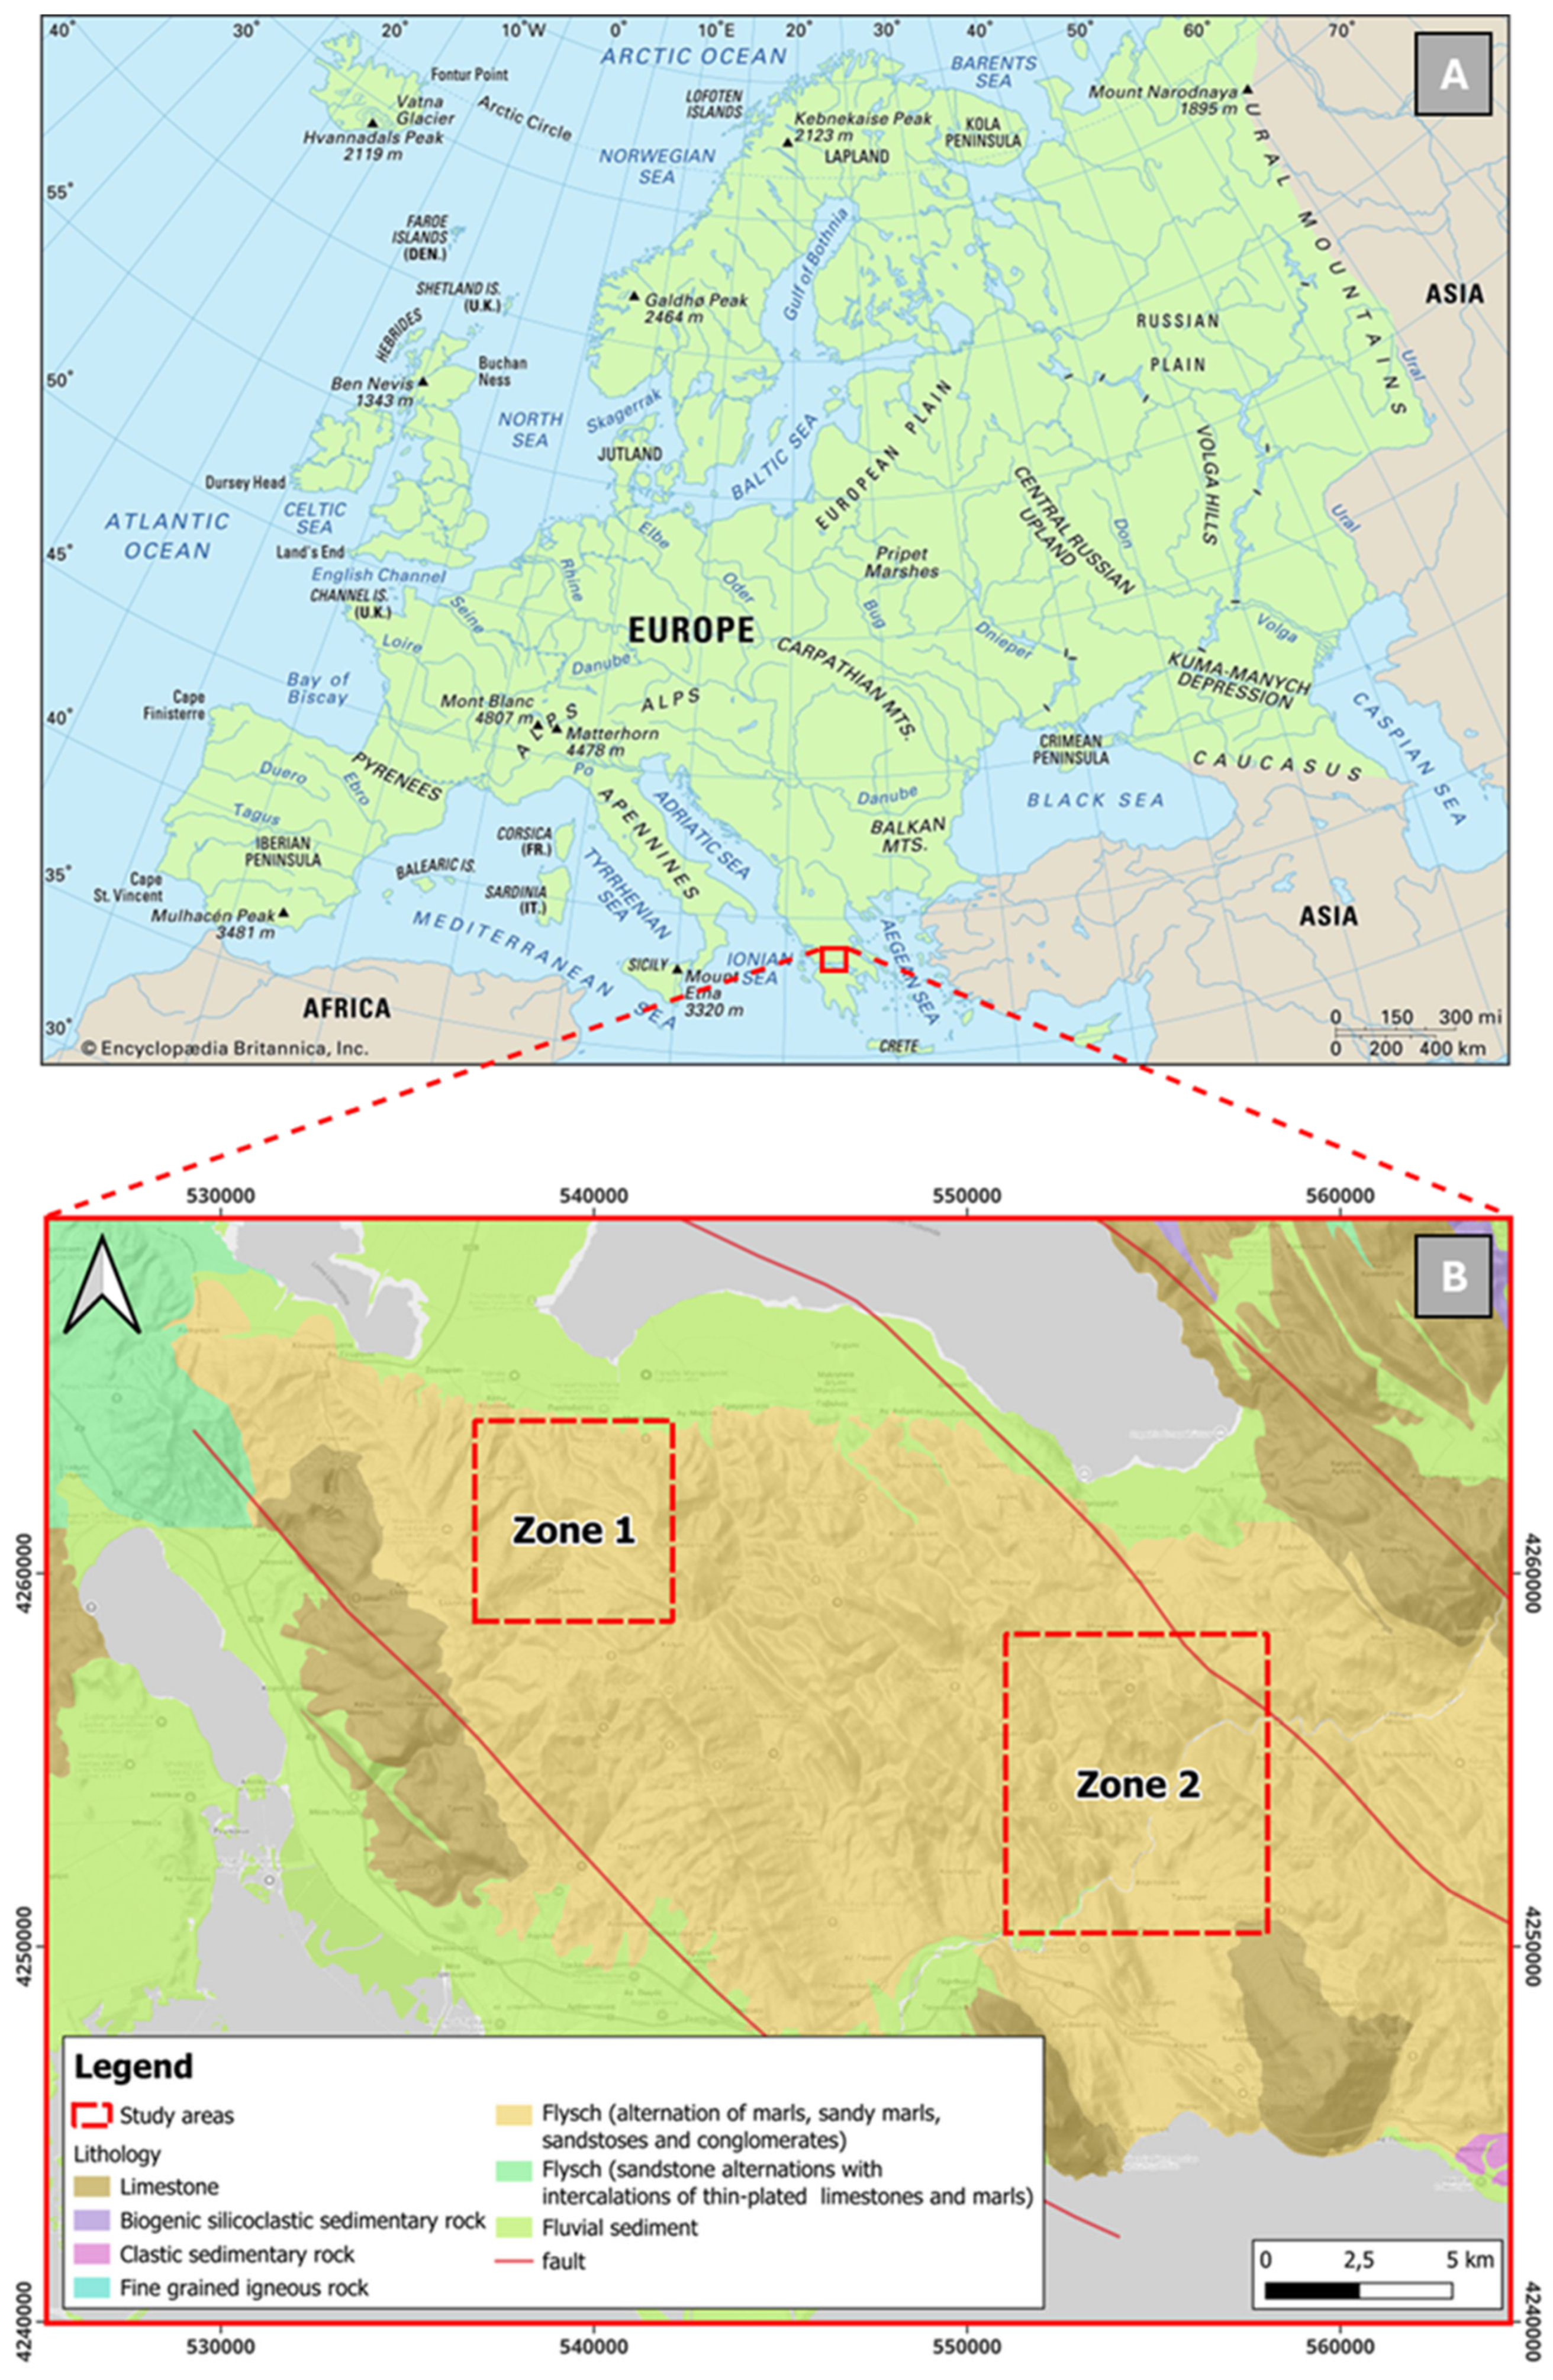
Figure 3.
Geographic and geological framework of the study area. (A) Geographical location map and (B) simplified lithological map (adapted from [26]) highlighting the two areas of interest: Zone 1 and Zone 2.
The study zone is characterized by a hilly landscape, with a maximum elevation of approximately 900 m above mean sea level, crossed by the Evinos River. The area has a Mediterranean temperate climate, with the average annual precipitation ranging from 800 to 1000 mm and mean annual temperatures between 13 and 15 °C. Rainfall is unevenly distributed throughout the year, with around 75% occurring during the period from October to March [27]. From a geological perspective, the area belongs to the Gavrovo-Tripolis geotectonic unit and is characterized by flysch formation of the Upper Eocene to Oligocene age. Flysch is lithologically composed of shales, siltstones, sandy marls, sandstones, and compact conglomerates, as described by British Petroleum Co. Ltd. [28] and Lekkas and Papanikolaou [29]. In Figure 3B, a simplified lithological map of the area is shown, modified from the Hellenic Survey of Geology and Mineral Exploration [26].
Due to its peculiar geological, geomorphological, and climatic characteristics, the area shows moderate frequencies of shallow landslides occurrences, as highlighted by several studies carried out in Central–Western Greece [30,31,32]. Furthermore, Nikolakopoulos et al. [33] present noteworthy field survey results and monitoring campaign data on landslides near our study area, highlighting the role of rainfall events and predisposing geological factors in triggering landslides. Two landslide-prone zones were selected to test the GOGIRA system (Figure 3B).
3.2. Characterization of the Mapped Landslides
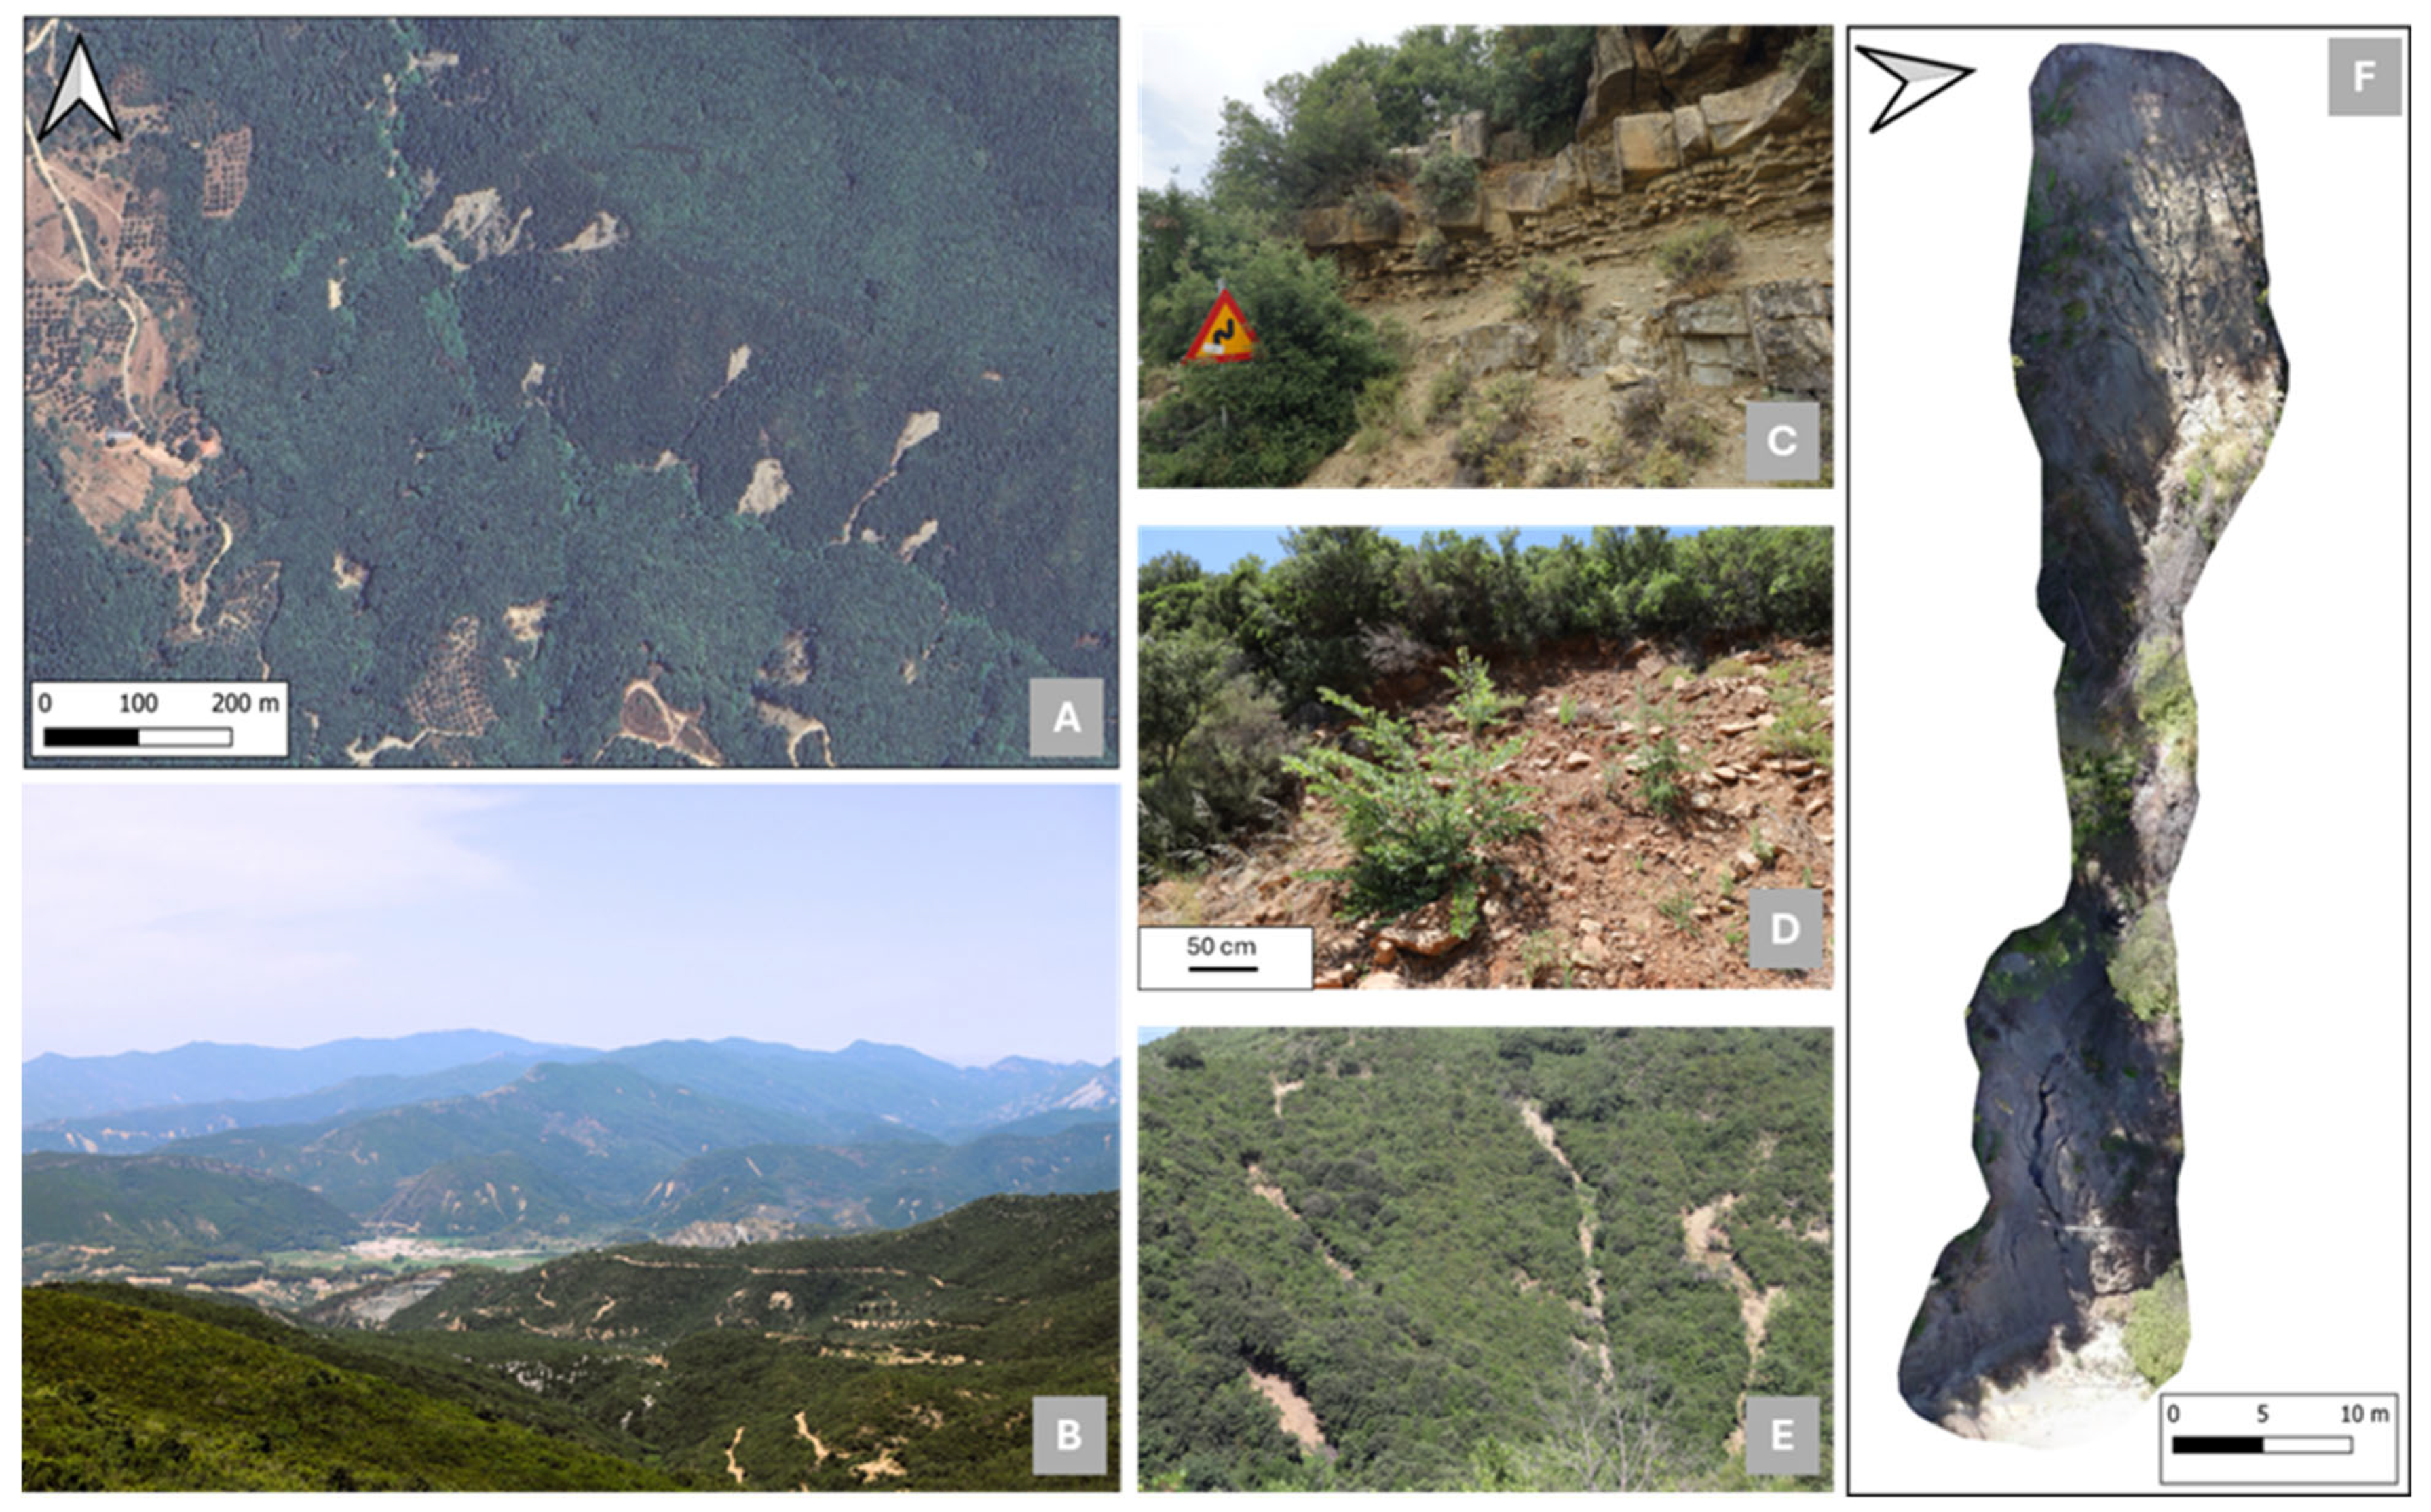
Landslides in the area of interest (AOI) were triggered in recent times, as they are clearly visible in both satellite imagery (Figure 4A) and field observations (Figure 4B). These are shallow landslides that involved the weathered material overlaying the siliciclastic bedrock (Figure 4C). The material is typically composed of debris consisting of centimeter-size sandstone blocks (Figure 4D), a coarse sandy matrix, and rare portions of soil. The gravitational mass movement affects vegetated areas dominated by Mediterranean scrub, including low- to medium-height trees and brambles. In this study, we adopted the general definition of “shallow landslides” proposed by Cruden and Varnes [34], referring to rapid to very rapid mass movements involving soil or earth materials. The U-Net model used for ExMAD was trained to detect generic shallow landslide patterns based on S2 10 m resolution imagery, without distinguishing the landslide type. These landslides are triggered by intense rainfall, which saturates the colluvial mantle and initiates the movement of loose material on the slope. The thickness of the mobilized material varies between approximately 0.5 and 1.5 m. These phenomena typically occur on steep slopes, averaging 35° for those mapped in this study, and according to Varnes [35], exhibit extremely rapid velocities (up to 3 m/s). The failure surface is commonly located along the interface between the in-place substrate and the colluvial cover. The landslide dynamics are generally translational but occasionally exhibit avalanche-like characteristics. In many cases, channelization of material occurs within small gullies (Figure 4E,F), altering the landslide dynamics as the process transitions from a slide to a flow. According to Cruden and Varnes [34], these observations (both remote and field based) allowed classifying the landslide as debris slides that may occasionally evolve into small debris flows or debris avalanches.

Figure 4.
Landslide characterization within the investigated area. (A) Satellite view of shallow landslides; (B) landscape photograph showing widespread landslides; (C) siliciclastic bedrock outcrop; (D) landslide’s debris; (E) channelized shallow landslide; (F) channelized shallow landslide mapped in the area using drone-based photogrammetric survey.
4. Results and Discussions
This section presents the results of the field tests conducted using the updated version of the GOGIRA system [10] for the spatial mapping of shallow landslides, and the integration of Ex-MAD for the detection of their trigger time.
This section first presents the results of the field mapping campaign, focusing on shallow landslides identified within the AOI, and evaluates the spatial accuracy of the GOGIRA system by comparing its mapped points to actual landslide targets. Outliers are then analyzed to determine whether extreme positional errors result from environmental or operational limitations of the system. Finally, the effectiveness of the ExMAD framework in estimating the occurrence date of each landslide mapped with GOGIRA is assessed. In this phase, the mapped landslide points are treated as “true targets”. This approach allows for an independent evaluation of both systems’ performance under real-world conditions, ensuring that any positional errors from GOGIRA do not influence the temporal analysis conducted by ExMAD.
4.1. Landslide Mapped with GOGIRA During Field Campaign
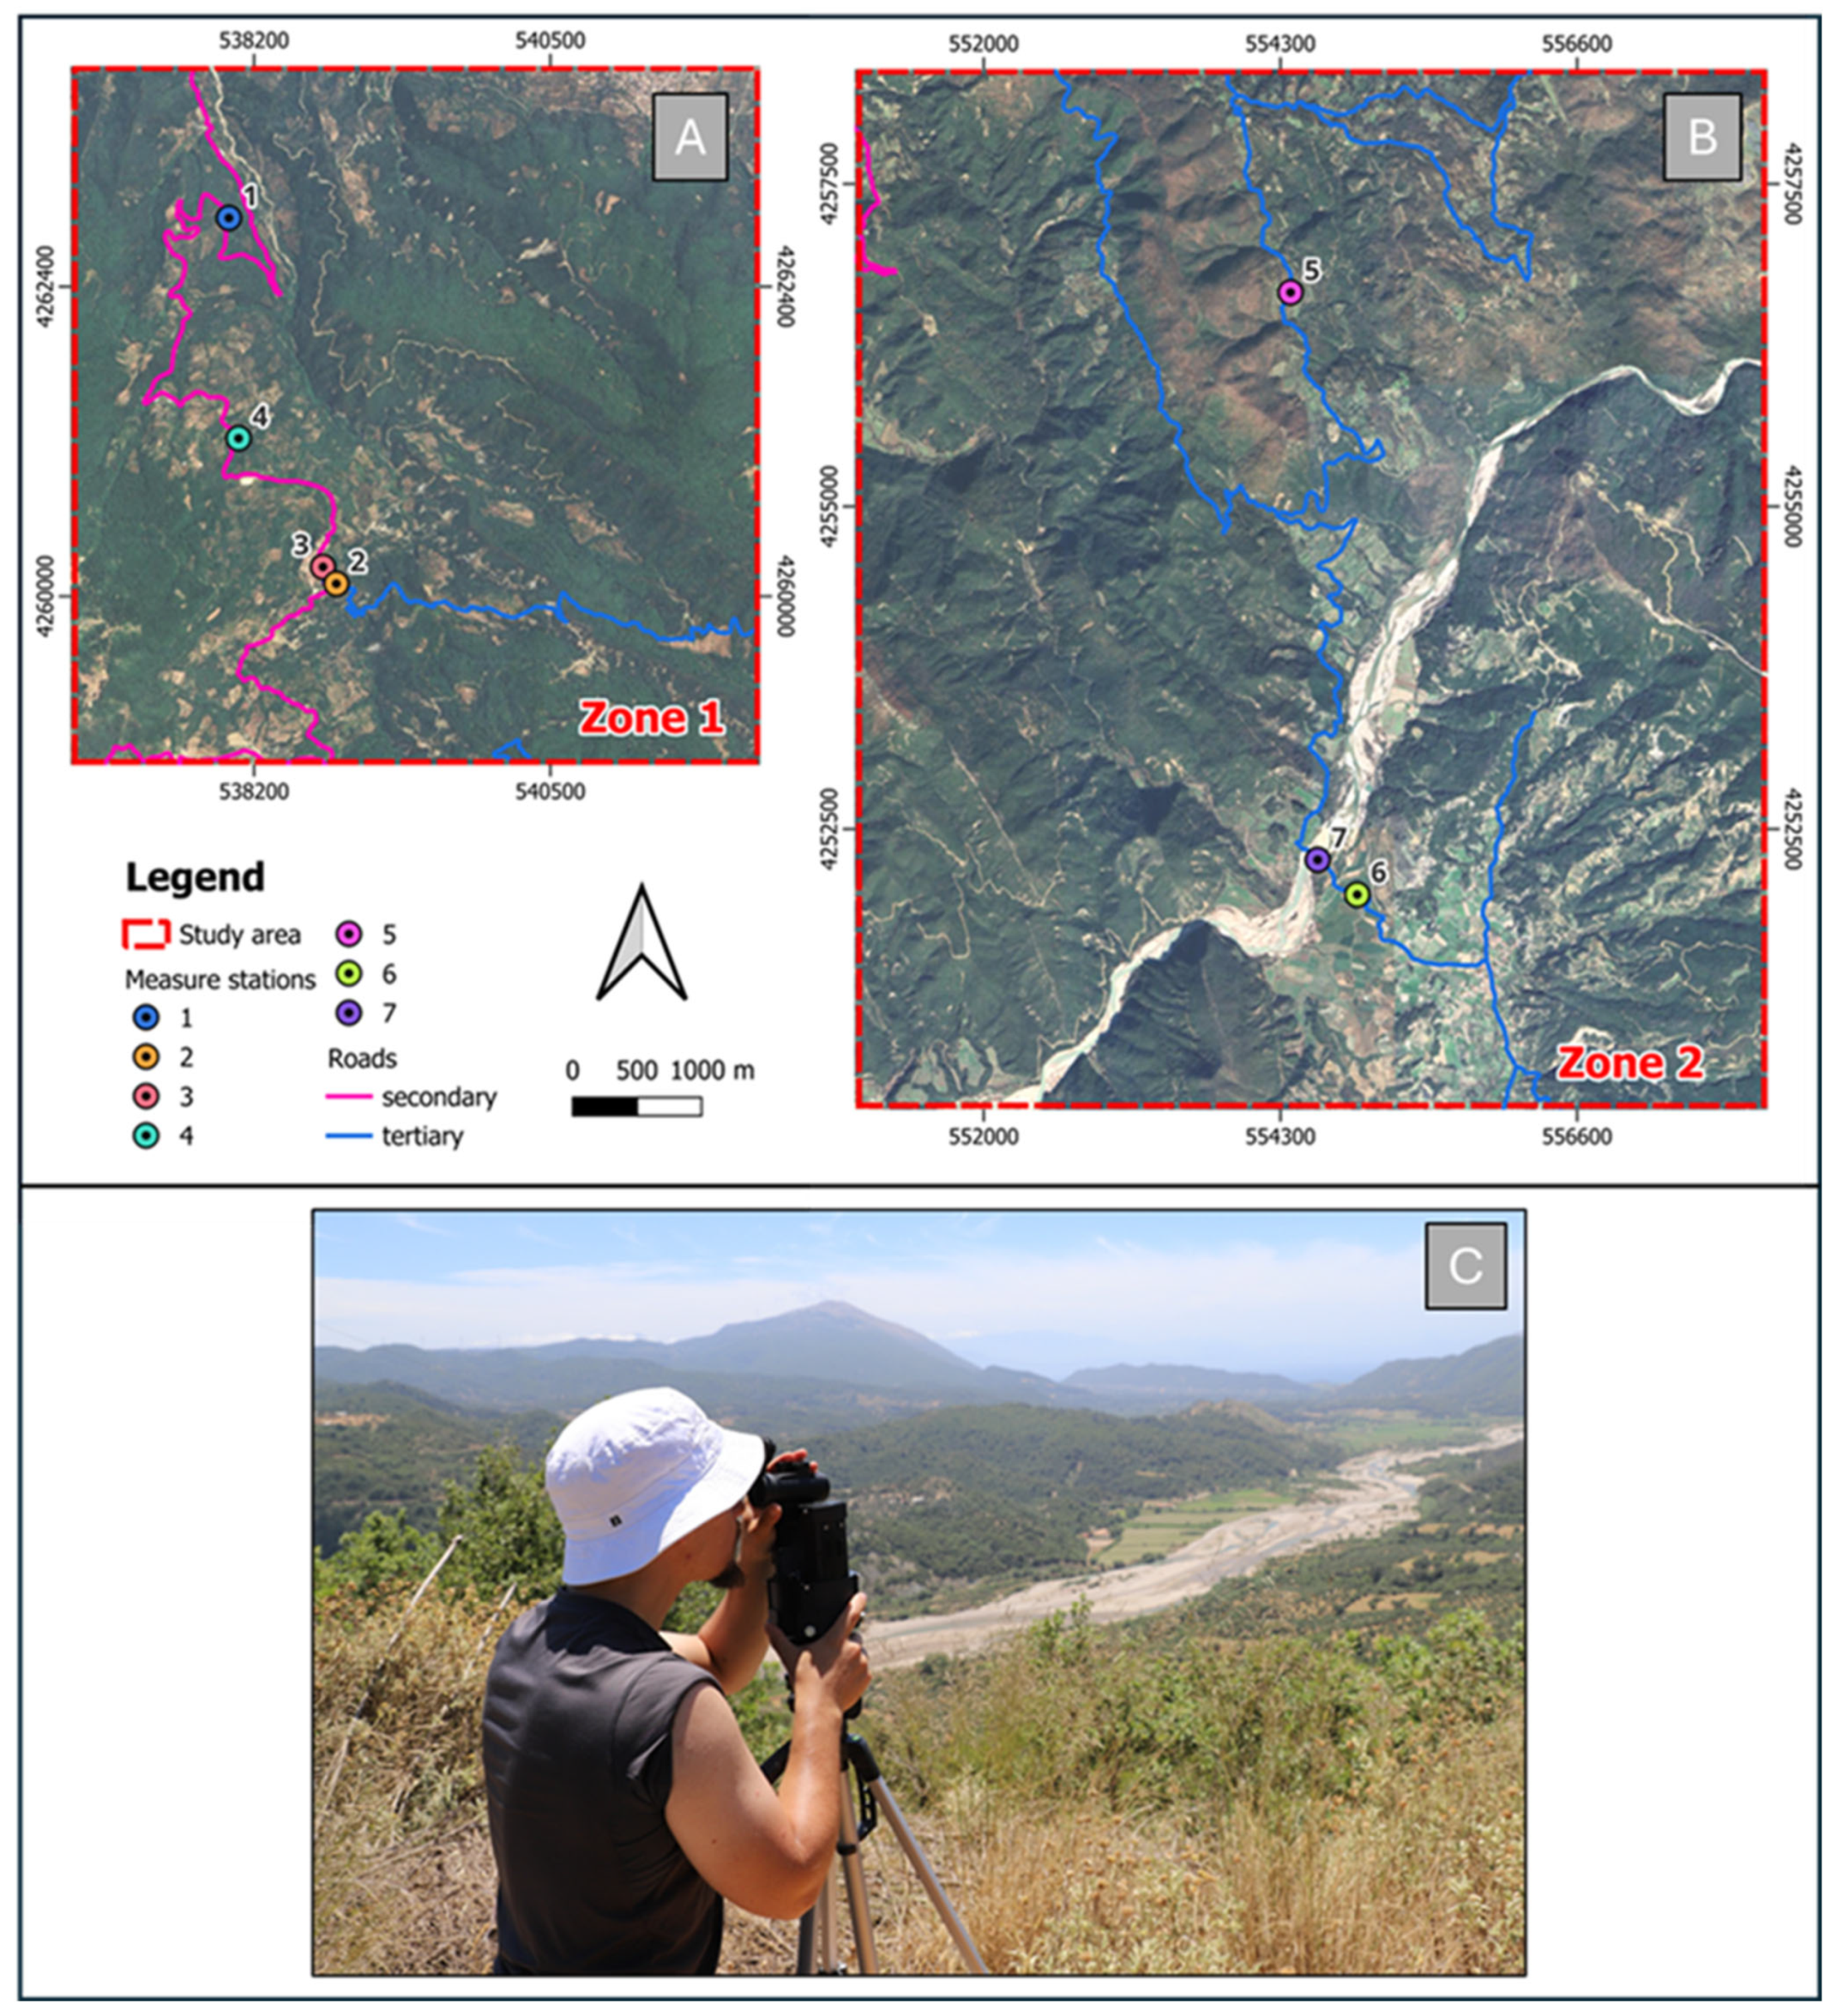
During our landslide mapping campaign, seven measurement stations were selected across the two AOI (Figure 5); using GOGIRA tools, 54 target points were mapped with the Range-R device and 23 with the UGO device. These data were then evaluated for spatial errors against true targets using QGIS, with each point’s positional discrepancy calculated in meters and imported into R for statistical refinement.

Figure 5.
Measurement stations in the study area. (A) Zone 1 and (B) Zone 2, showing the distribution of stations and road networks; (C) Field conditions at a representative mapping station during data collection.
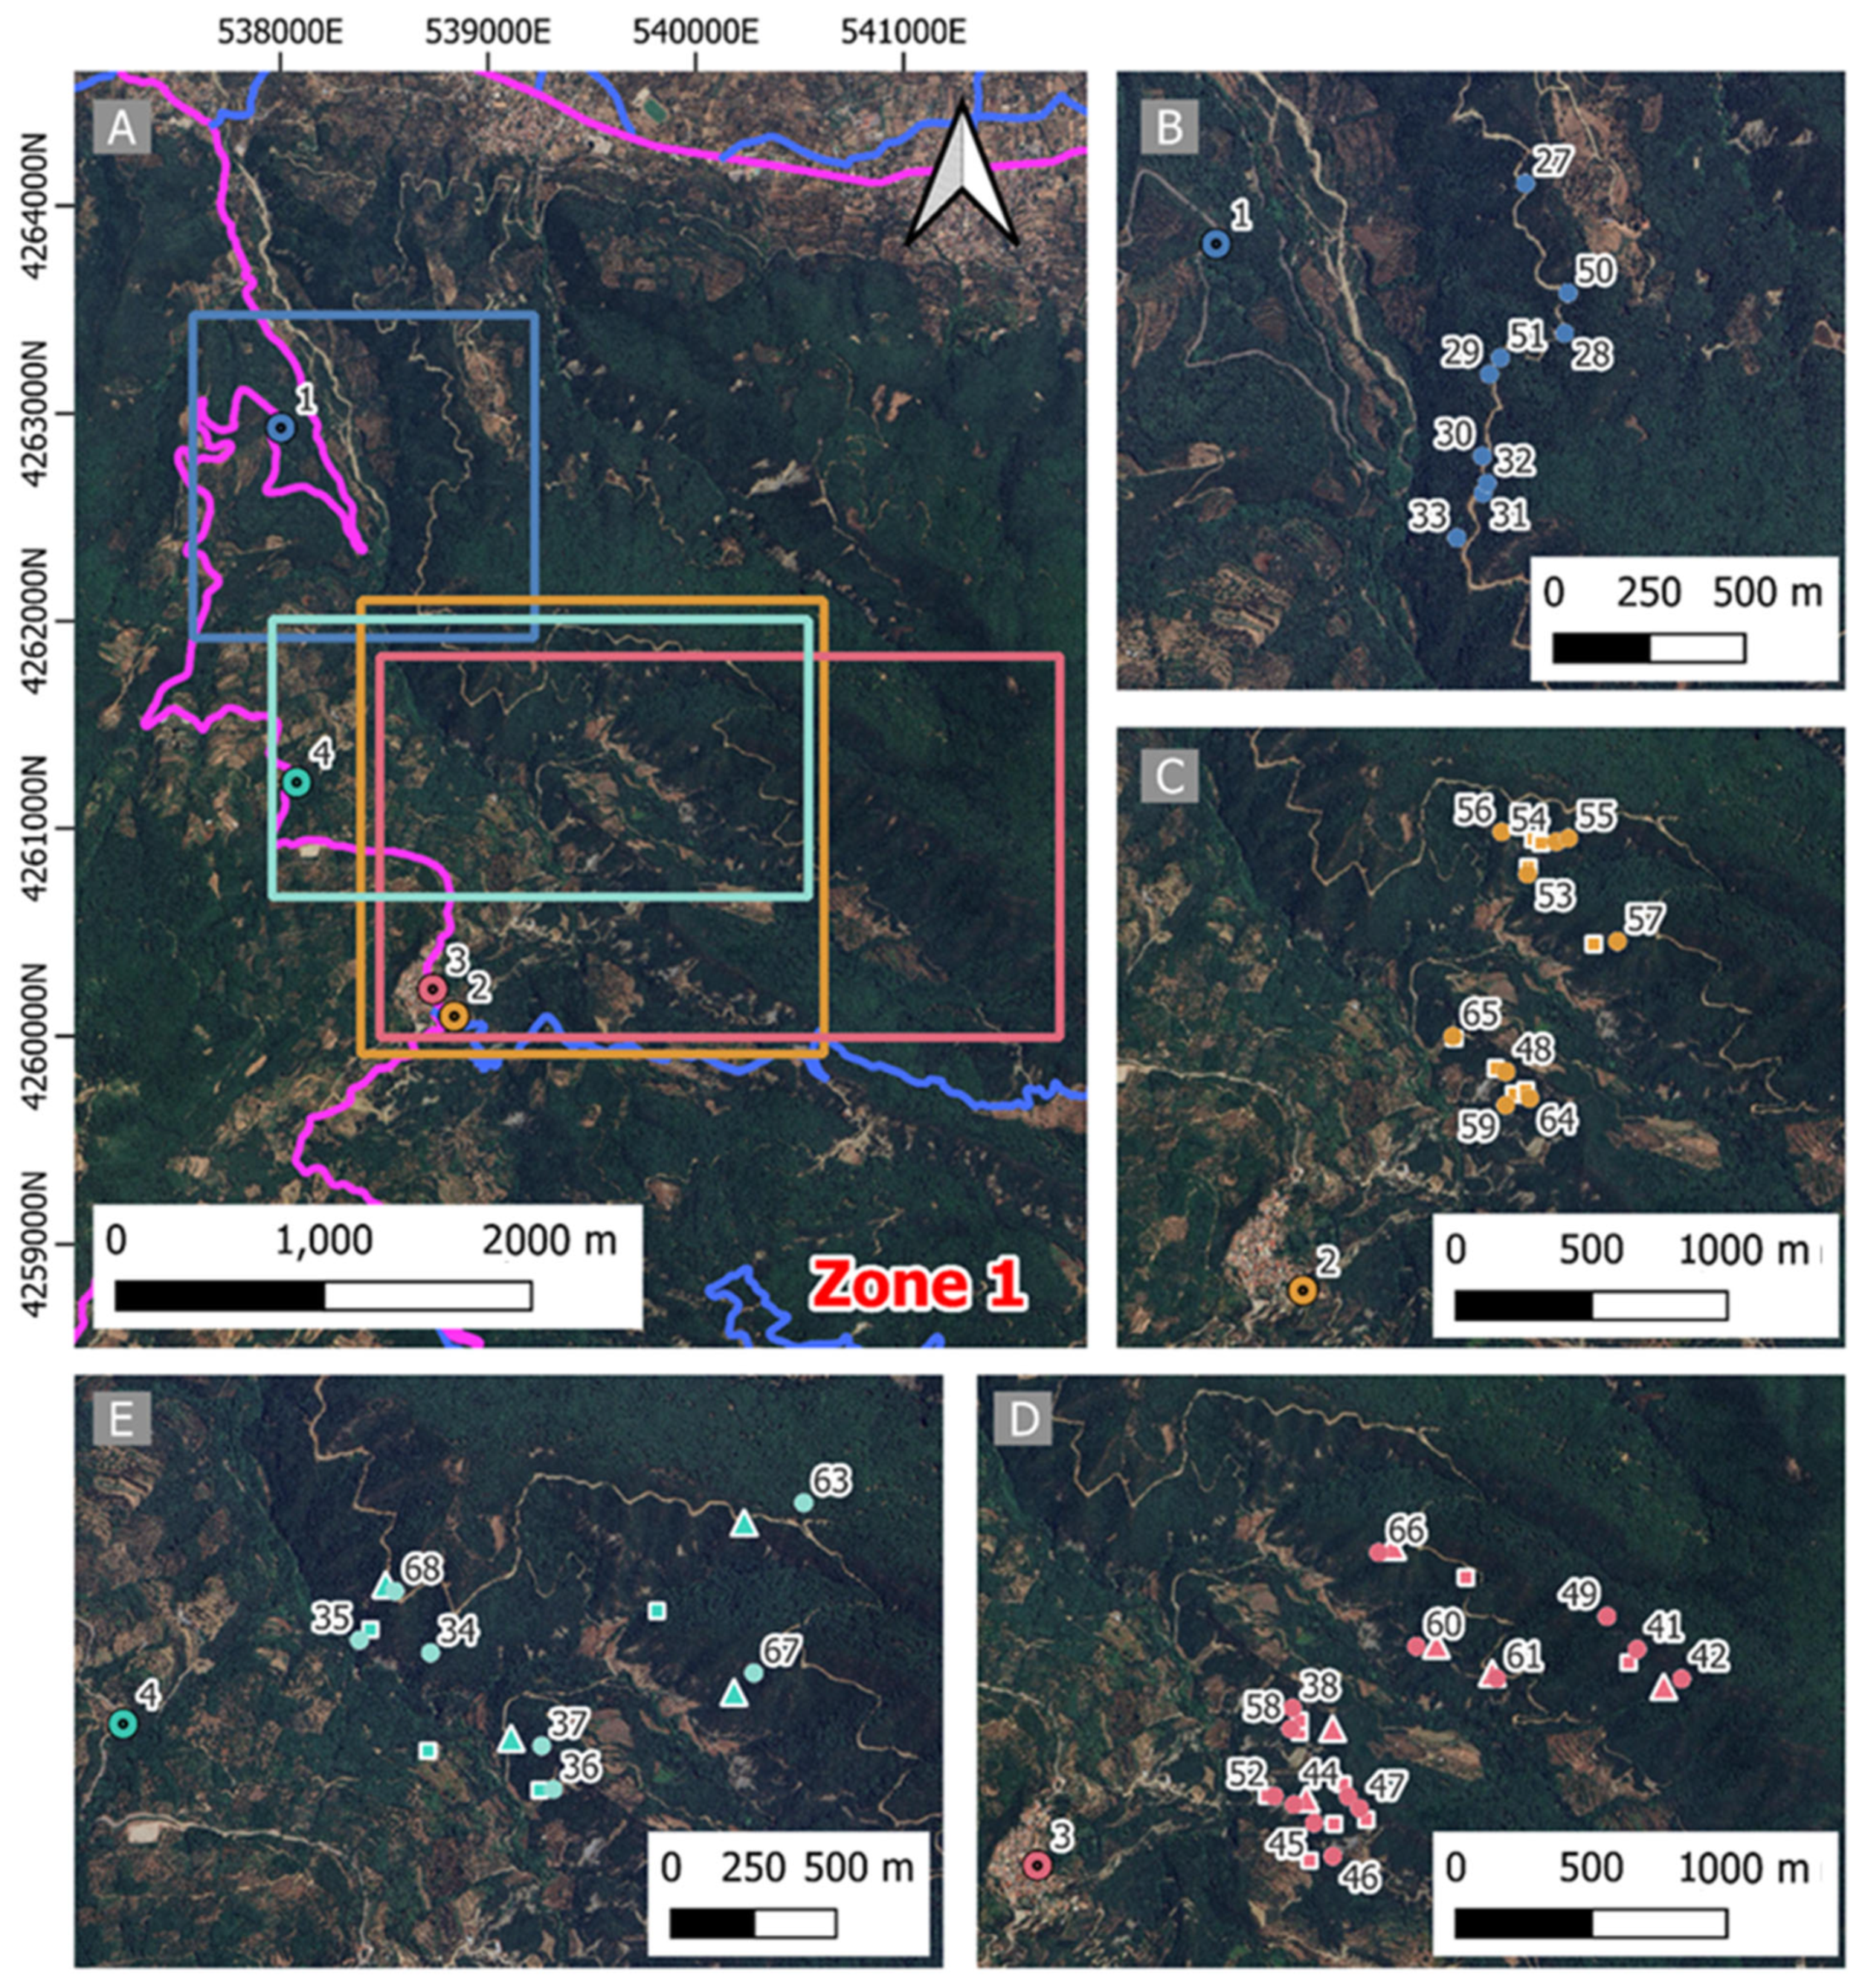
In Figure 6, for measurement stations 1 to 4, the true target points are displayed alongside the target points collected by UGO and Range-R, processed using the CoordFinder algorithm. A total of 31 landslides were mapped using Range-R, compared to 16 mapped with UGO. This discrepancy is due to UGO being a tripod-based device, which requires re-calibration each time it is repositioned, limiting its mobility and resulting in fewer landslides mapped per station.

Figure 6.
Area of Interest 1 (Zone 1) and associated data collection. (A) Overview of the area; data collected from (B) Measurement Station 1 (blue), (C) Measurement Station 2 (orange), (D) Measurement Station 3 (red), and (E) Measurement Station 4 (cyan). Filled dotted circles are measure stations, purple lines are secondary roads, while blue lines are tertiary roads. Small filled circles represent landslide centroids validated by experts through remote sensing and field surveys, considered as “true targets”. Square markers indicate points acquired by the Range-R device and processed with the CoordFinder algorithm. Triangle markers represent points collected by the UGO device and similarly processed.
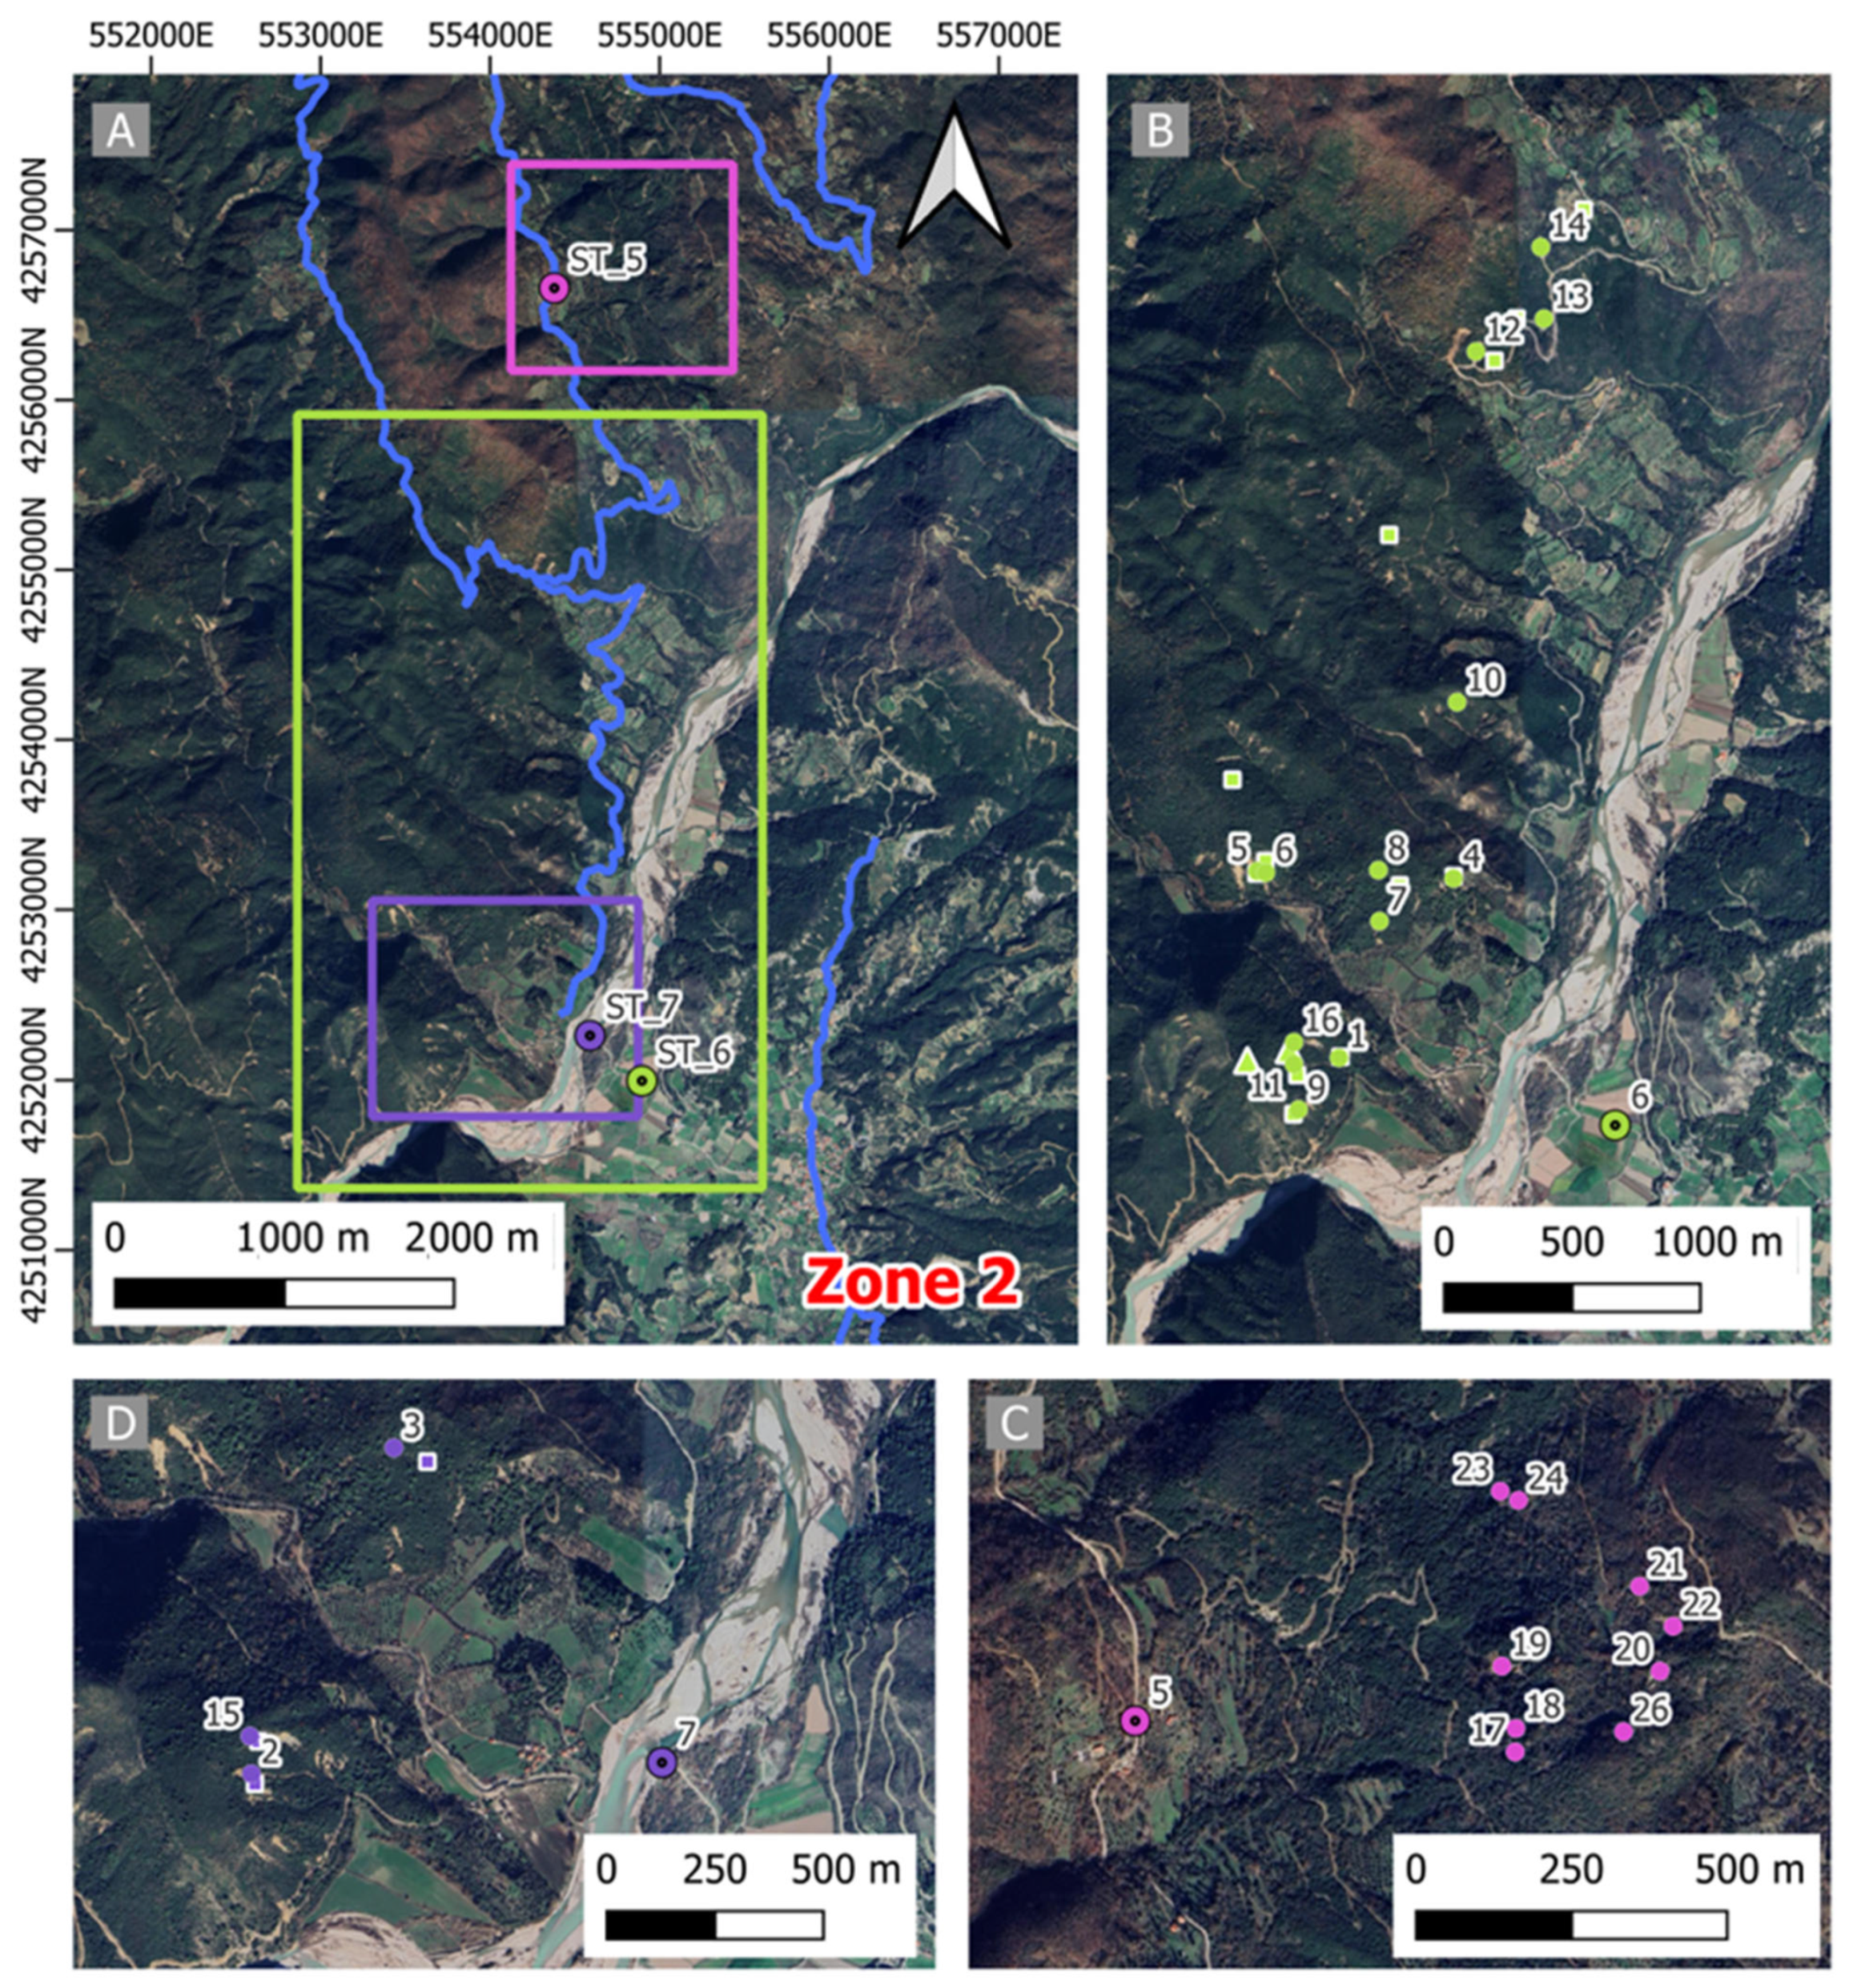
Figure 7 presents the mapping results from measurement stations 5 to 7. A total of 23 landslides were mapped using Range-R, whereas only 7 were identified with UGO, reflecting the same limitations previously observed. A first insight from these results is that tripod-based mapping solutions, like UGO, may lead to under sampling due to the time-consuming calibration required each time the device is repositioned. In contrast, 9-DOF systems, like Range-R, are better suited to overcome local visibility constraints, enabling the detection of a greater number of landslides in complex terrain, where line-of-sight can vary significantly.
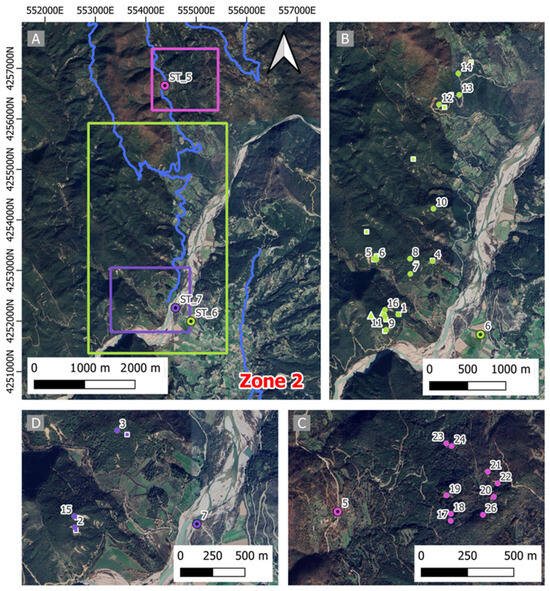
Figure 7.
Area of Interest 2 (Zone 2) and associated data collection. (A) Overview of the area; data collected from (B) Measurement Station 6 (green), (C) Measurement Station 5 (violet), and (D) Measurement Station 7 (purple). Filled dotted circles are measure stations, purple lines are secondary roads, while blue lines are tertiary roads. Small filled circles represent landslide centroids validated by experts through remote sensing and field surveys, considered as “true targets”. Square markers indicate points acquired by the Range-R device and processed with the CoordFinder algorithm. Triangle markers represent points collected by the UGO device and similarly processed.
4.2. Q1—What Is the Spatial Error of GOGIRA System?
To address the first research question (Q1), coordinates collected by UGO and Range-R were compared to the related 64 expert-based confirmed landslide sites (considerable as “true targets”) identified during our filed survey. Descriptive statistics were applied to spatial errors for both the UGO and Range-R devices. In this first step, the outliers were removed and will be analyzed in Section 4.3 to address research question Q2.
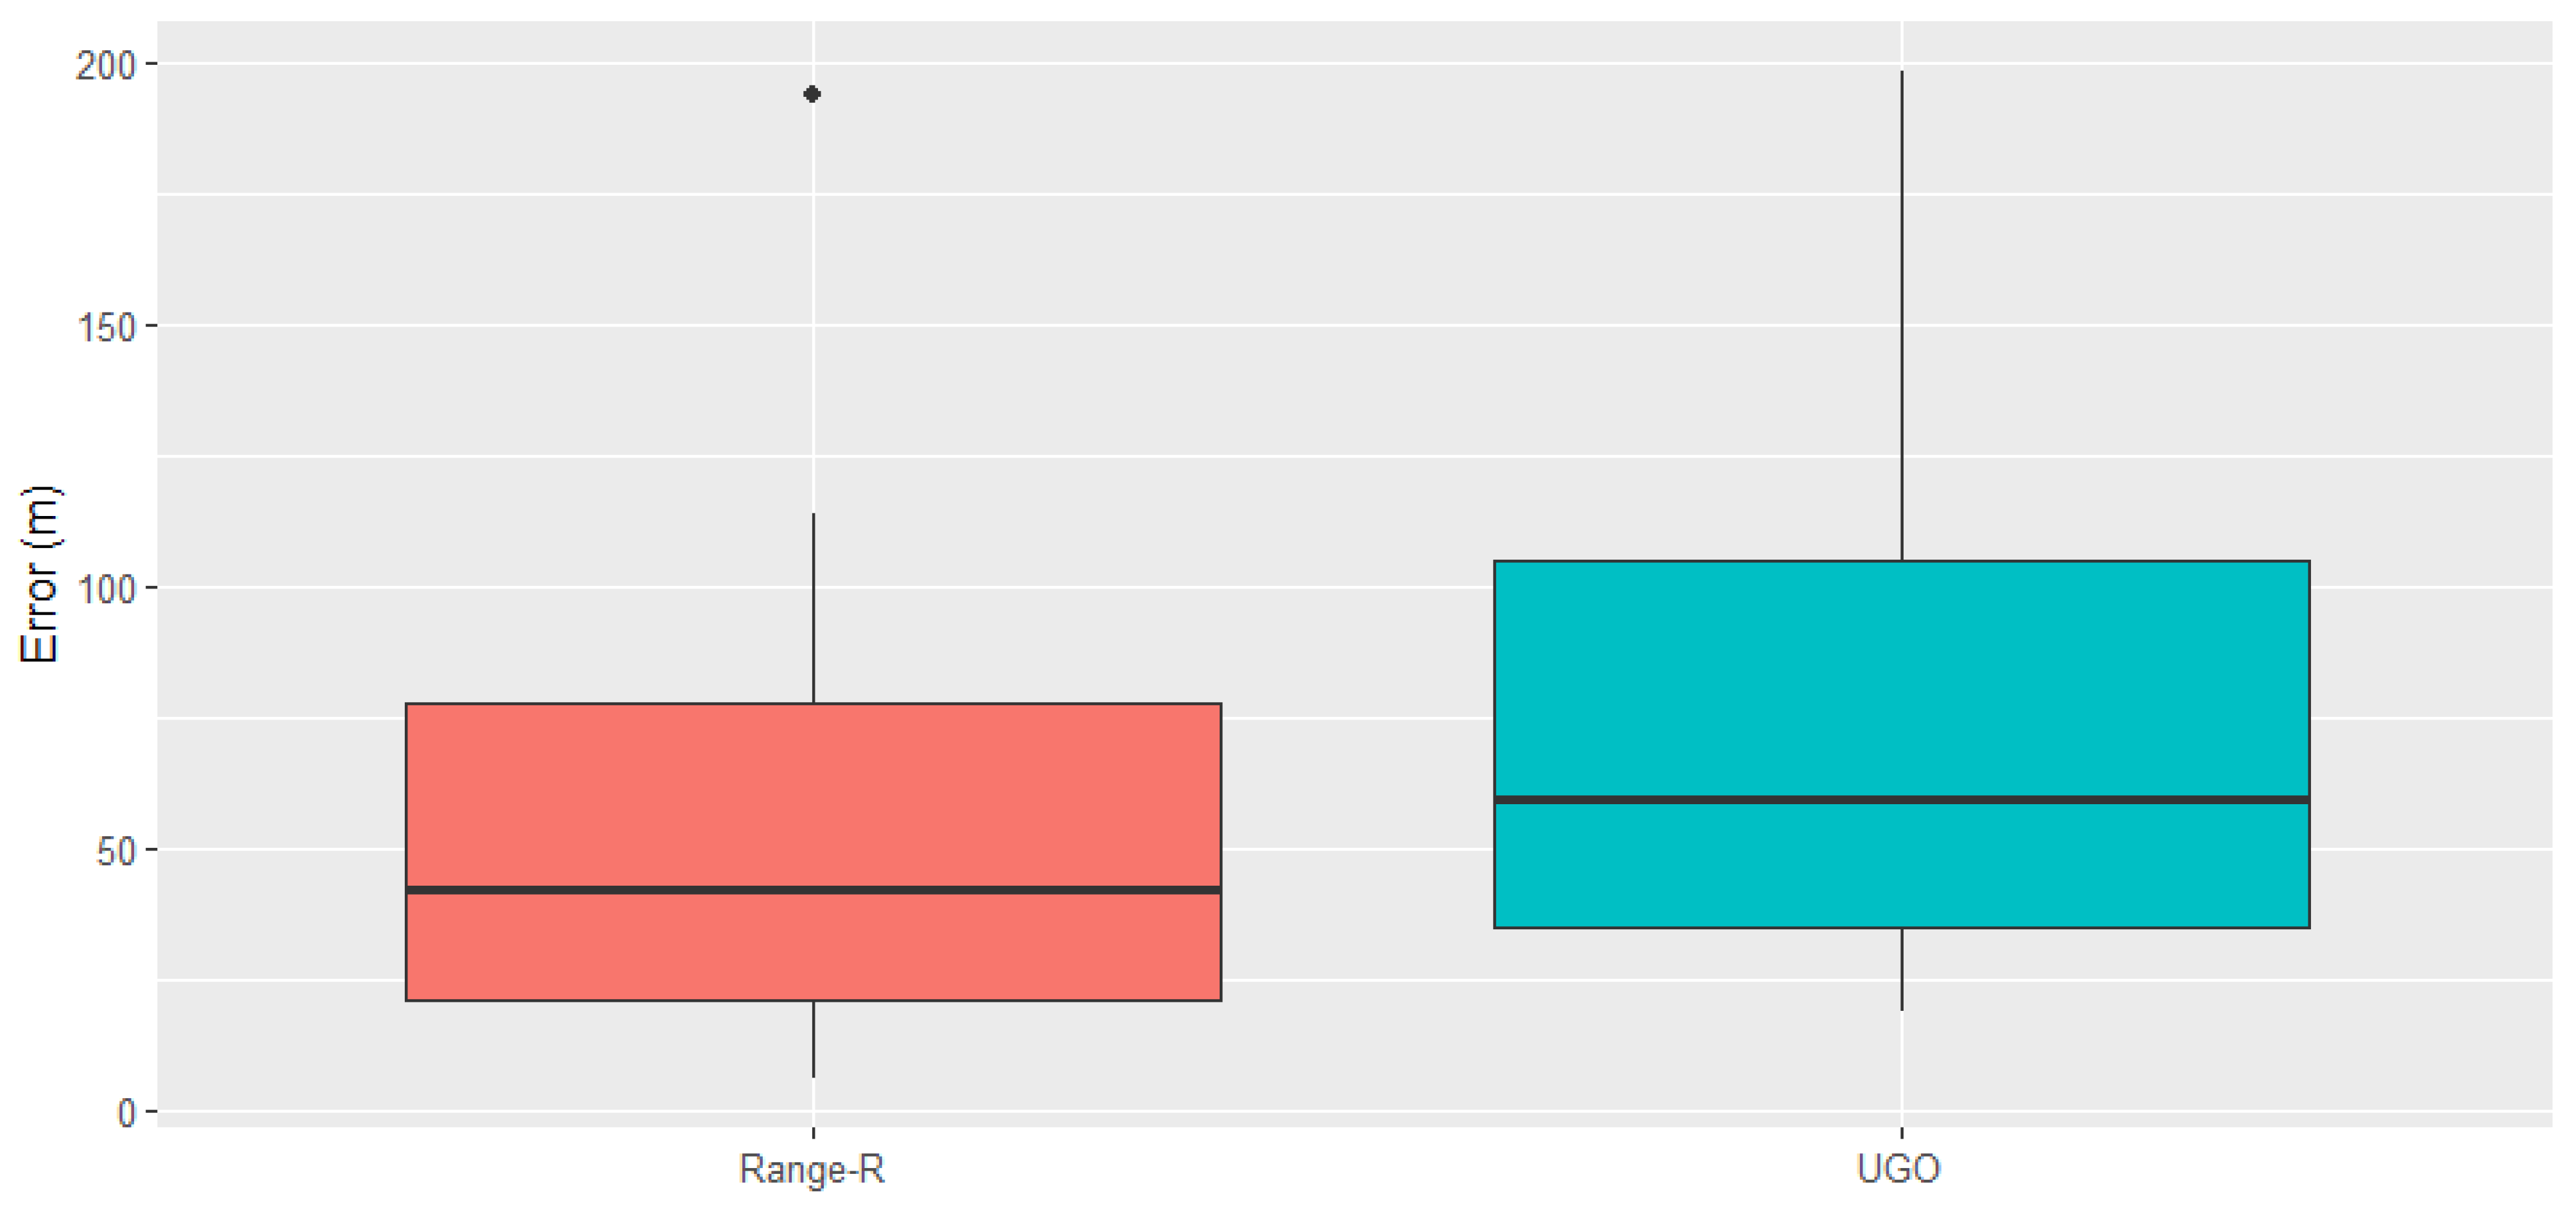
The average error values are 50 m for Range-R and 82 m for UGO, while from the boxplot in Figure 8, it can be observed that the median error was lower for the Range-R device, and its error distribution showed fewer extreme values compared to UGO. Range-R’s measurements displayed a tighter interquartile range, suggesting a more consistent performance with lower variability. In contrast, UGO’s measurements showed a higher median error and a broader distribution, indicating larger and more variable errors, likely due to differences in calibration or sensitivity under field conditions. While a median error of approximately 50 m may be acceptable for certain large-scale geomorphological mapping applications, an error approaching 80 m presents a significant limitation. In the context of surface landslide mapping, such spatial uncertainty may result in the misidentification of adjacent landslides or unrelated portions of the slope, thereby compromising the reliability of the resulting inventory.

Figure 8.
Positional errors distribution for target points collected by the UGO (cyan) and Range-R (red) devices and processed with the CoordFinder algorithm.
The higher positional error observed in UGO compared to Range-R is likely attributable to differences in their calibration procedures. While Range-R incorporates a dynamic self-calibration algorithm embedded in the Arduino Nicla Sense ME board, UGO employs this system only during the initial calibration phase and subsequently relies on internal positioning sensors. UGO’s design—intended to minimize errors caused by electromagnetic interference and structural drift—can be particularly sensitive to leveling inaccuracies. Improper leveling may introduce significant errors, especially in the measurement of the zenith angle.
To address this limitation, it is recommended that the inertial measurement unit (IMU) integrated into the Arduino Nicla Sense ME board be used continuously to correct the polar coordinates recorded by UGO’s resistive sensors. This hybrid approach could leverage the mechanical stability of UGO’s fixed, 2-degrees-of-freedom configuration while compensating for angular deviations in real time. Such integration would enhance system efficiency and reduce the overall spatial error.
Further analysis using a Welch t-test, which adjusts for unequal variances, returned a t-statistic of −2.274 (degrees of freedom = 29.6, p-value = 0.0304), demonstrating a significant difference in the mean error between the two devices and confirming that Range-R generally exhibits greater accuracy. This conclusion is further supported by the 95% confidence interval for the difference in means, ranging from −60.79 to −3.25, thereby substantiating a meaningful difference in performance.
To ensure robustness against potential violations of normality, we also performed a Wilcoxon rank-sum test, a non-parametric alternative that does not assume a normal distribution of errors. The Wilcoxon test yielded a W statistic of 342 (p-value = 0.0246), corroborating the results of the t-test by rejecting the null hypothesis of no difference in central tendency between the two devices.
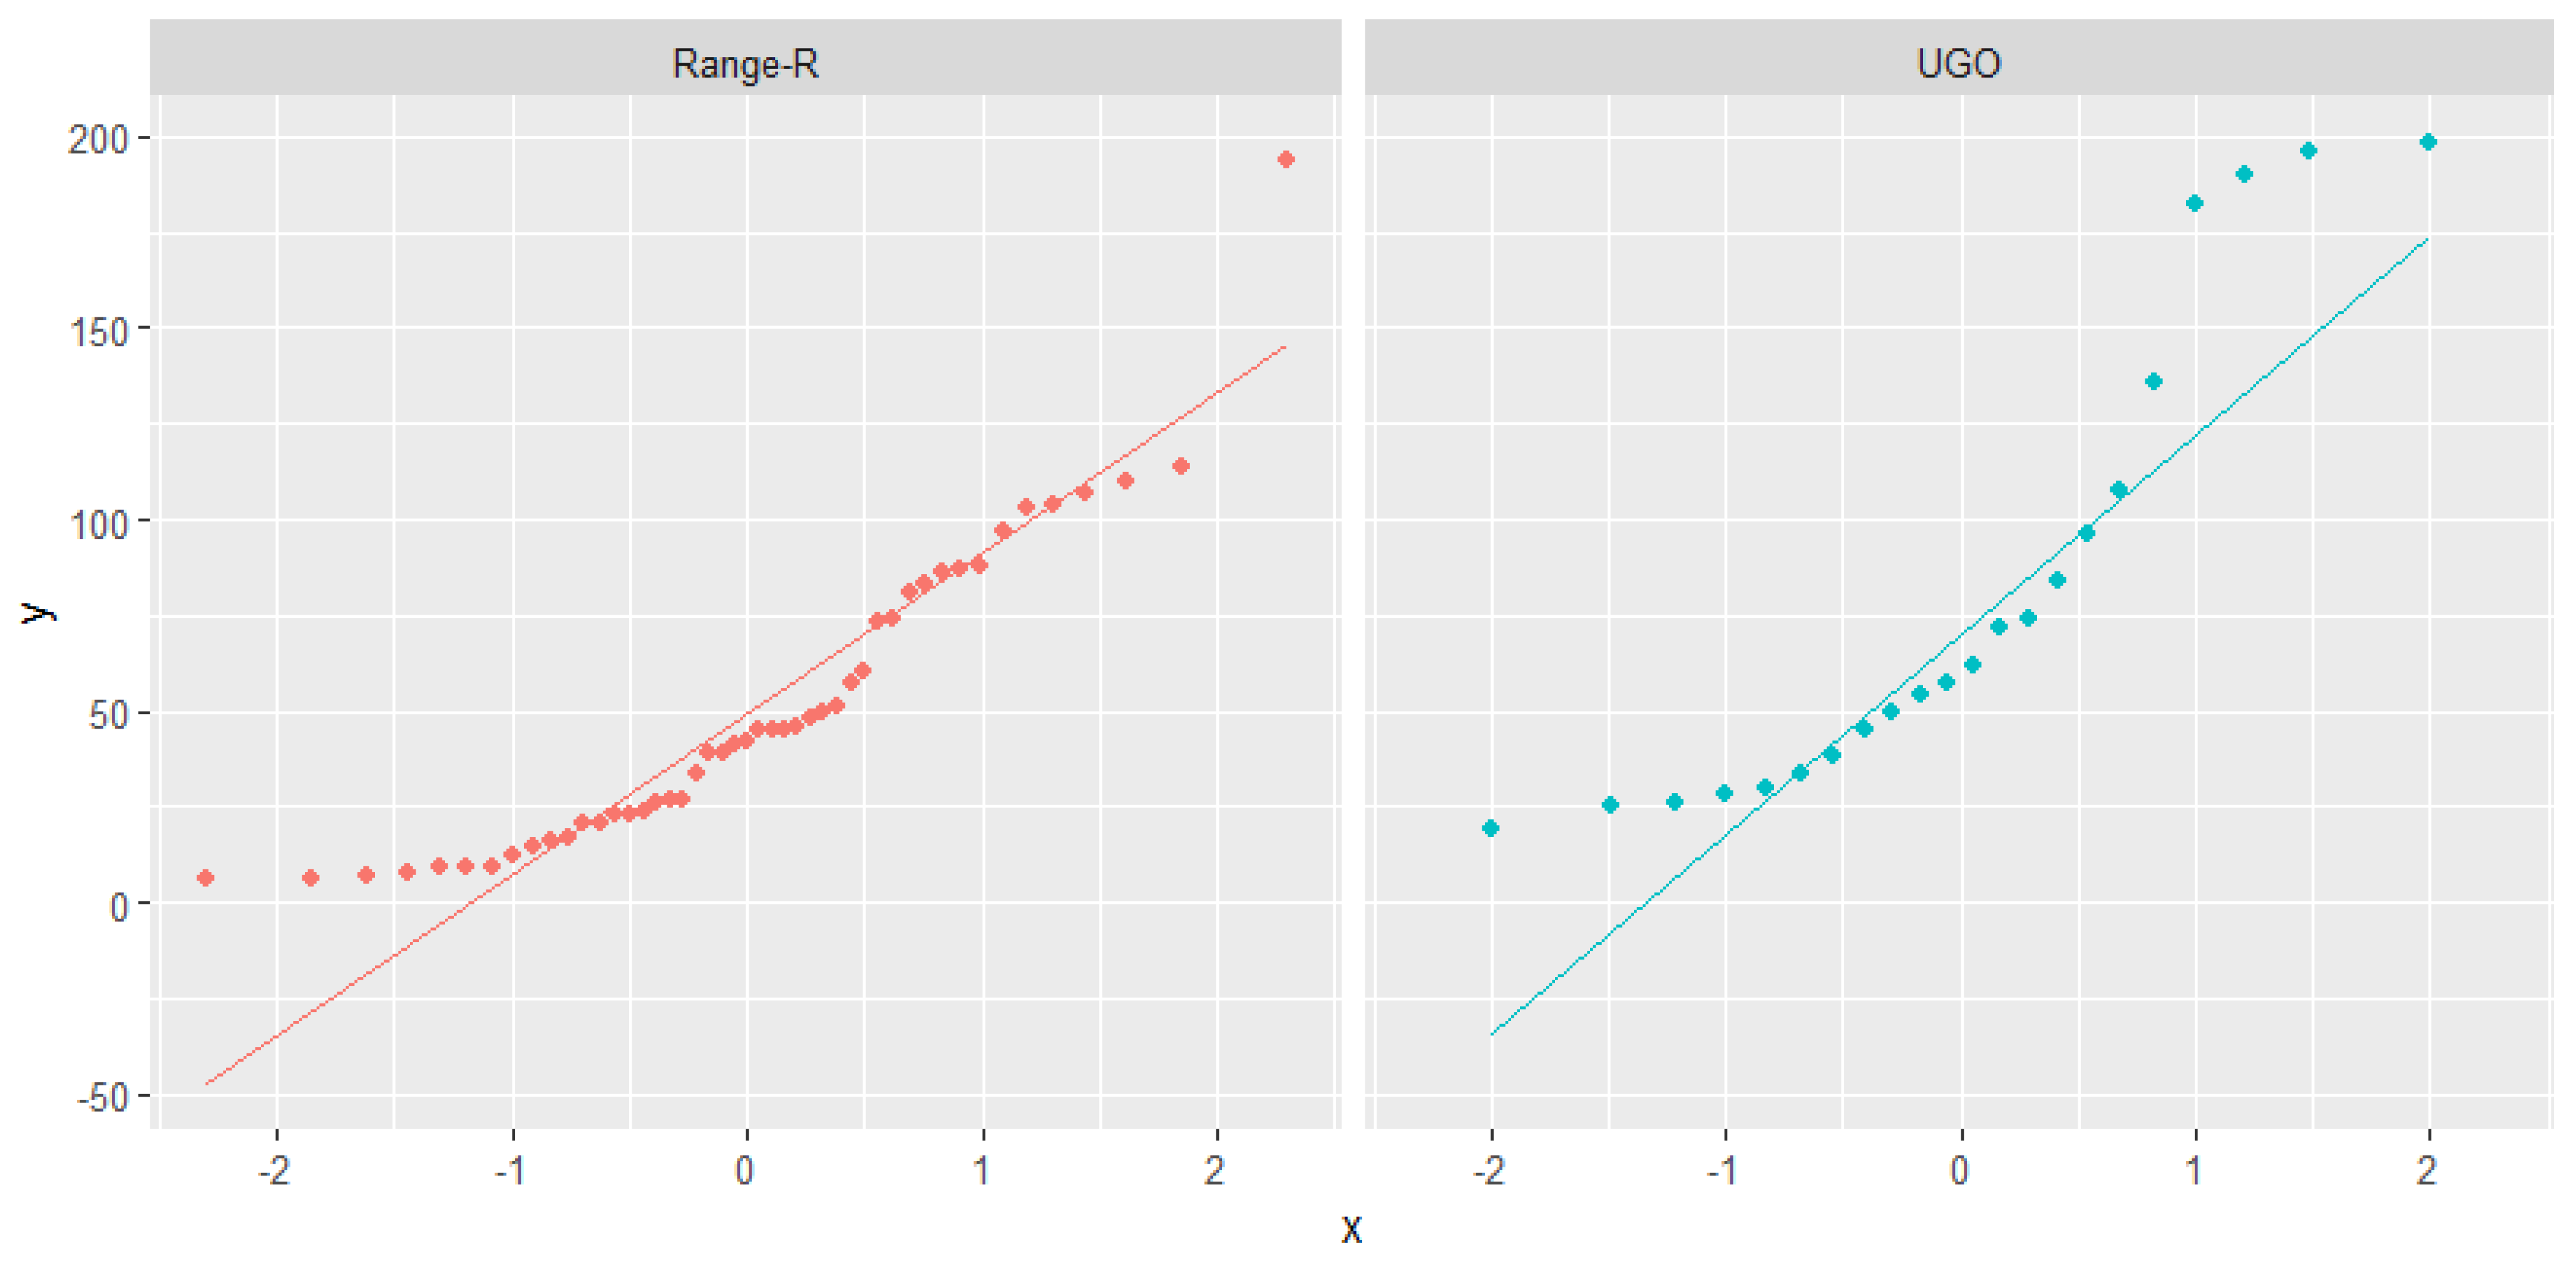
Additionally, QQ plots (Figure 9) indicated a good fit for the Range-R error distribution, whereas UGO data showed more dispersion, possibly due to sample size limitations. The Shapiro–Wilk test confirmed this observation, with a W statistic of 0.853 and a p-value of 9.64 × 10⁻⁷, indicating a non-normal distribution for the UGO error values.
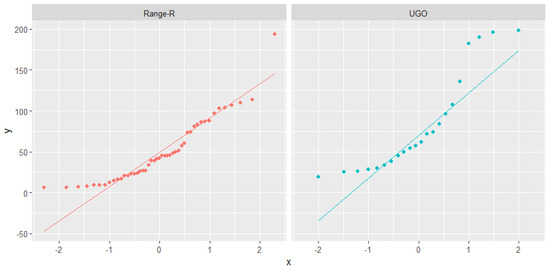
Figure 9.
Q–Q plot comparing the distribution of positional errors for target points collected by the UGO and Range-R devices, processed using the CoordFinder algorithm.
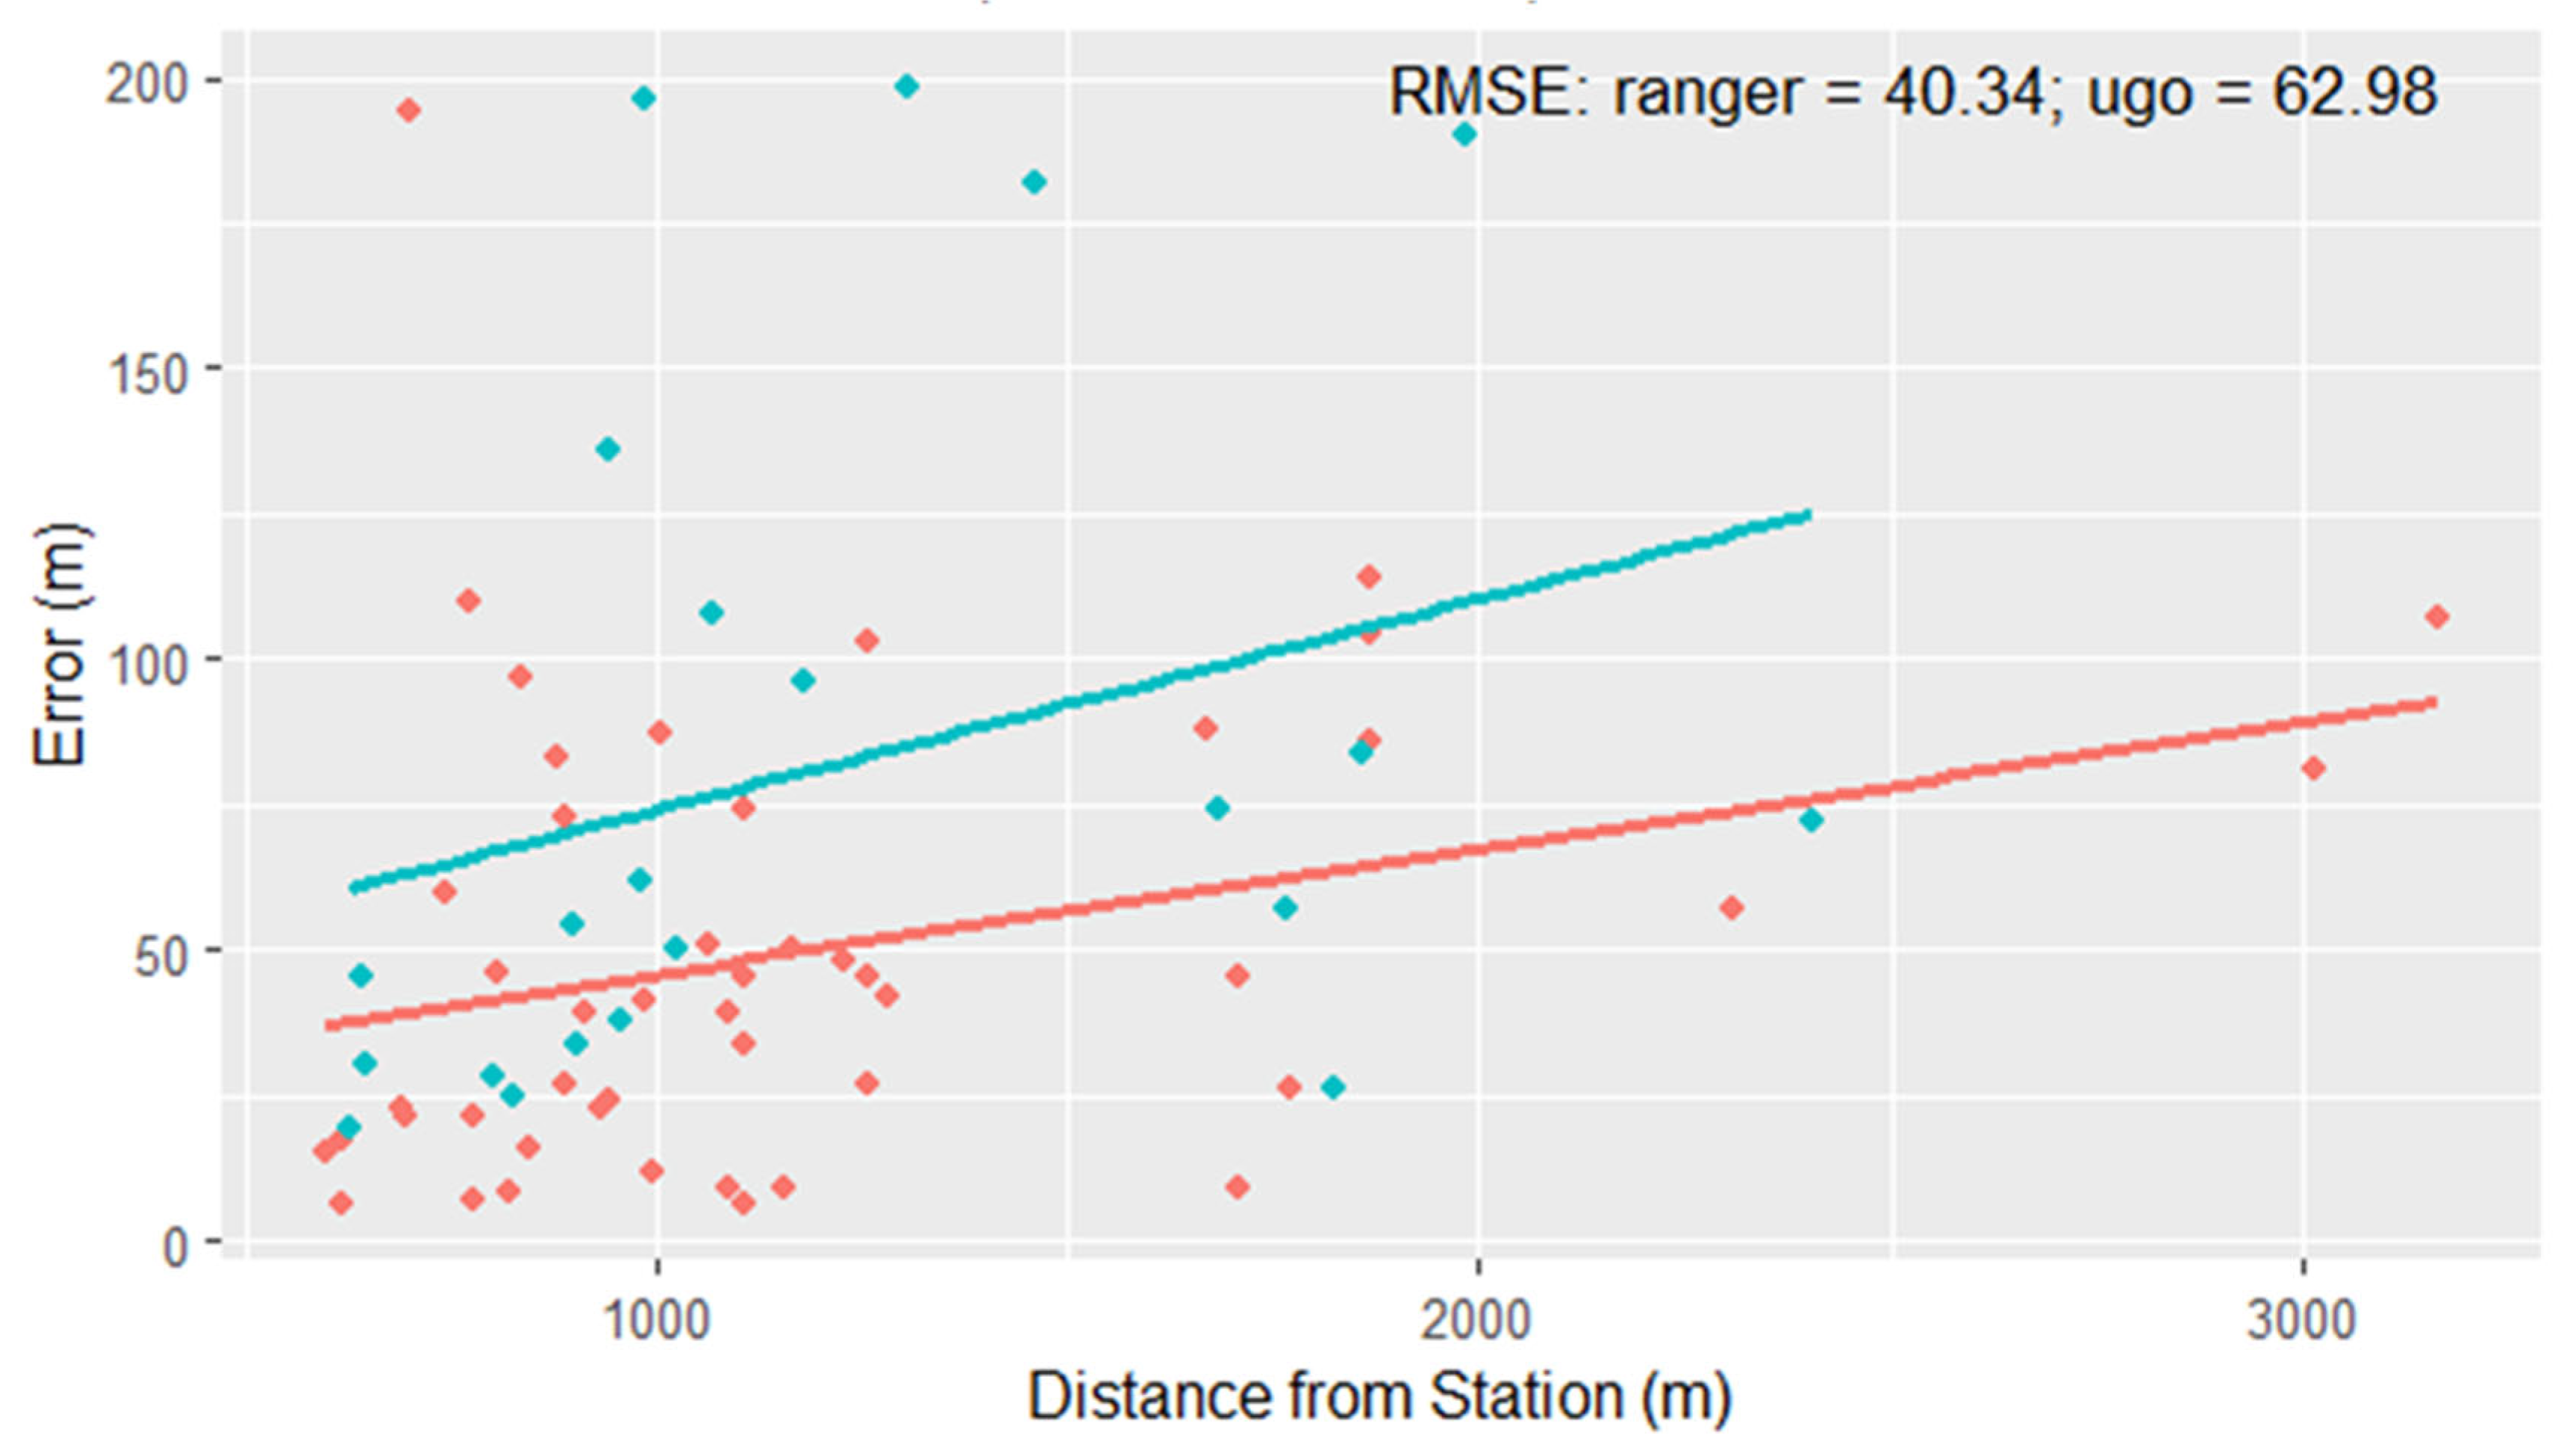
Finally, our correlation analysis explored the relationship between error values and station–target distances (Figure 10). The regression lines for UGO exhibited higher intercepts and steeper slopes compared to Range-R, suggesting that the error mismatch between the devices increases with distance. However, the limited number of target points in this analysis, along with their considerable dispersion, may have influenced the results (RMSE UGO = 62.98, RMSE Range-R = 40.34). These findings underscore the need for additional data points to improve the reliability of the conclusions.
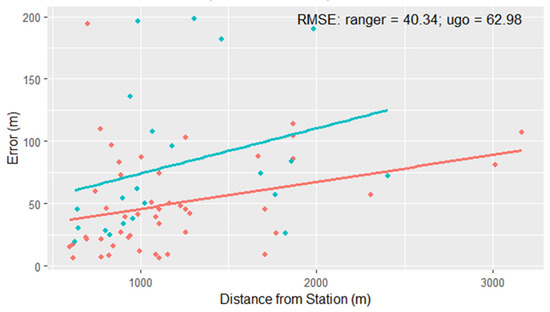
Figure 10.
Error versus distance comparison between target points collected by the UGO and Range-R devices, processed using the CoordFinder algorithm. Linear regression lines are fitted separately for each device subset.
4.3. Q2—Were Working Conditions Affecting GOGIRA’s Precision and Accuracy?
The outliers were examined to assess possible limiting operational conditions such as topographic obstacles, line-of-sight (LOS) tangential to the topographic surface, or high irregular or low-slope surfaces near the measuring station (see Licata and Fubelli [10]) that may have contributed to these errors. In Table 1, all the outliers are listed, with information referring to the GPS data, the distance between the target and the measure station, errors, and GOGIRA’s device.

Table 1.
CoordFinder target outliers. The position of each measurement station is reported using X and Y coordinates in UTM WGS84 Zone 34N. “HDOP” refers to the Horizontal Dilution of Precision, “Sat. num.” to the visible satellites. The “Distance” attribute indicates the computed distance between the mapping station and the target coordinates as determined by the CoordFinder algorithm. The “Error” column represents the metric distance between the algorithm-estimated target location and the true landslide centroid.
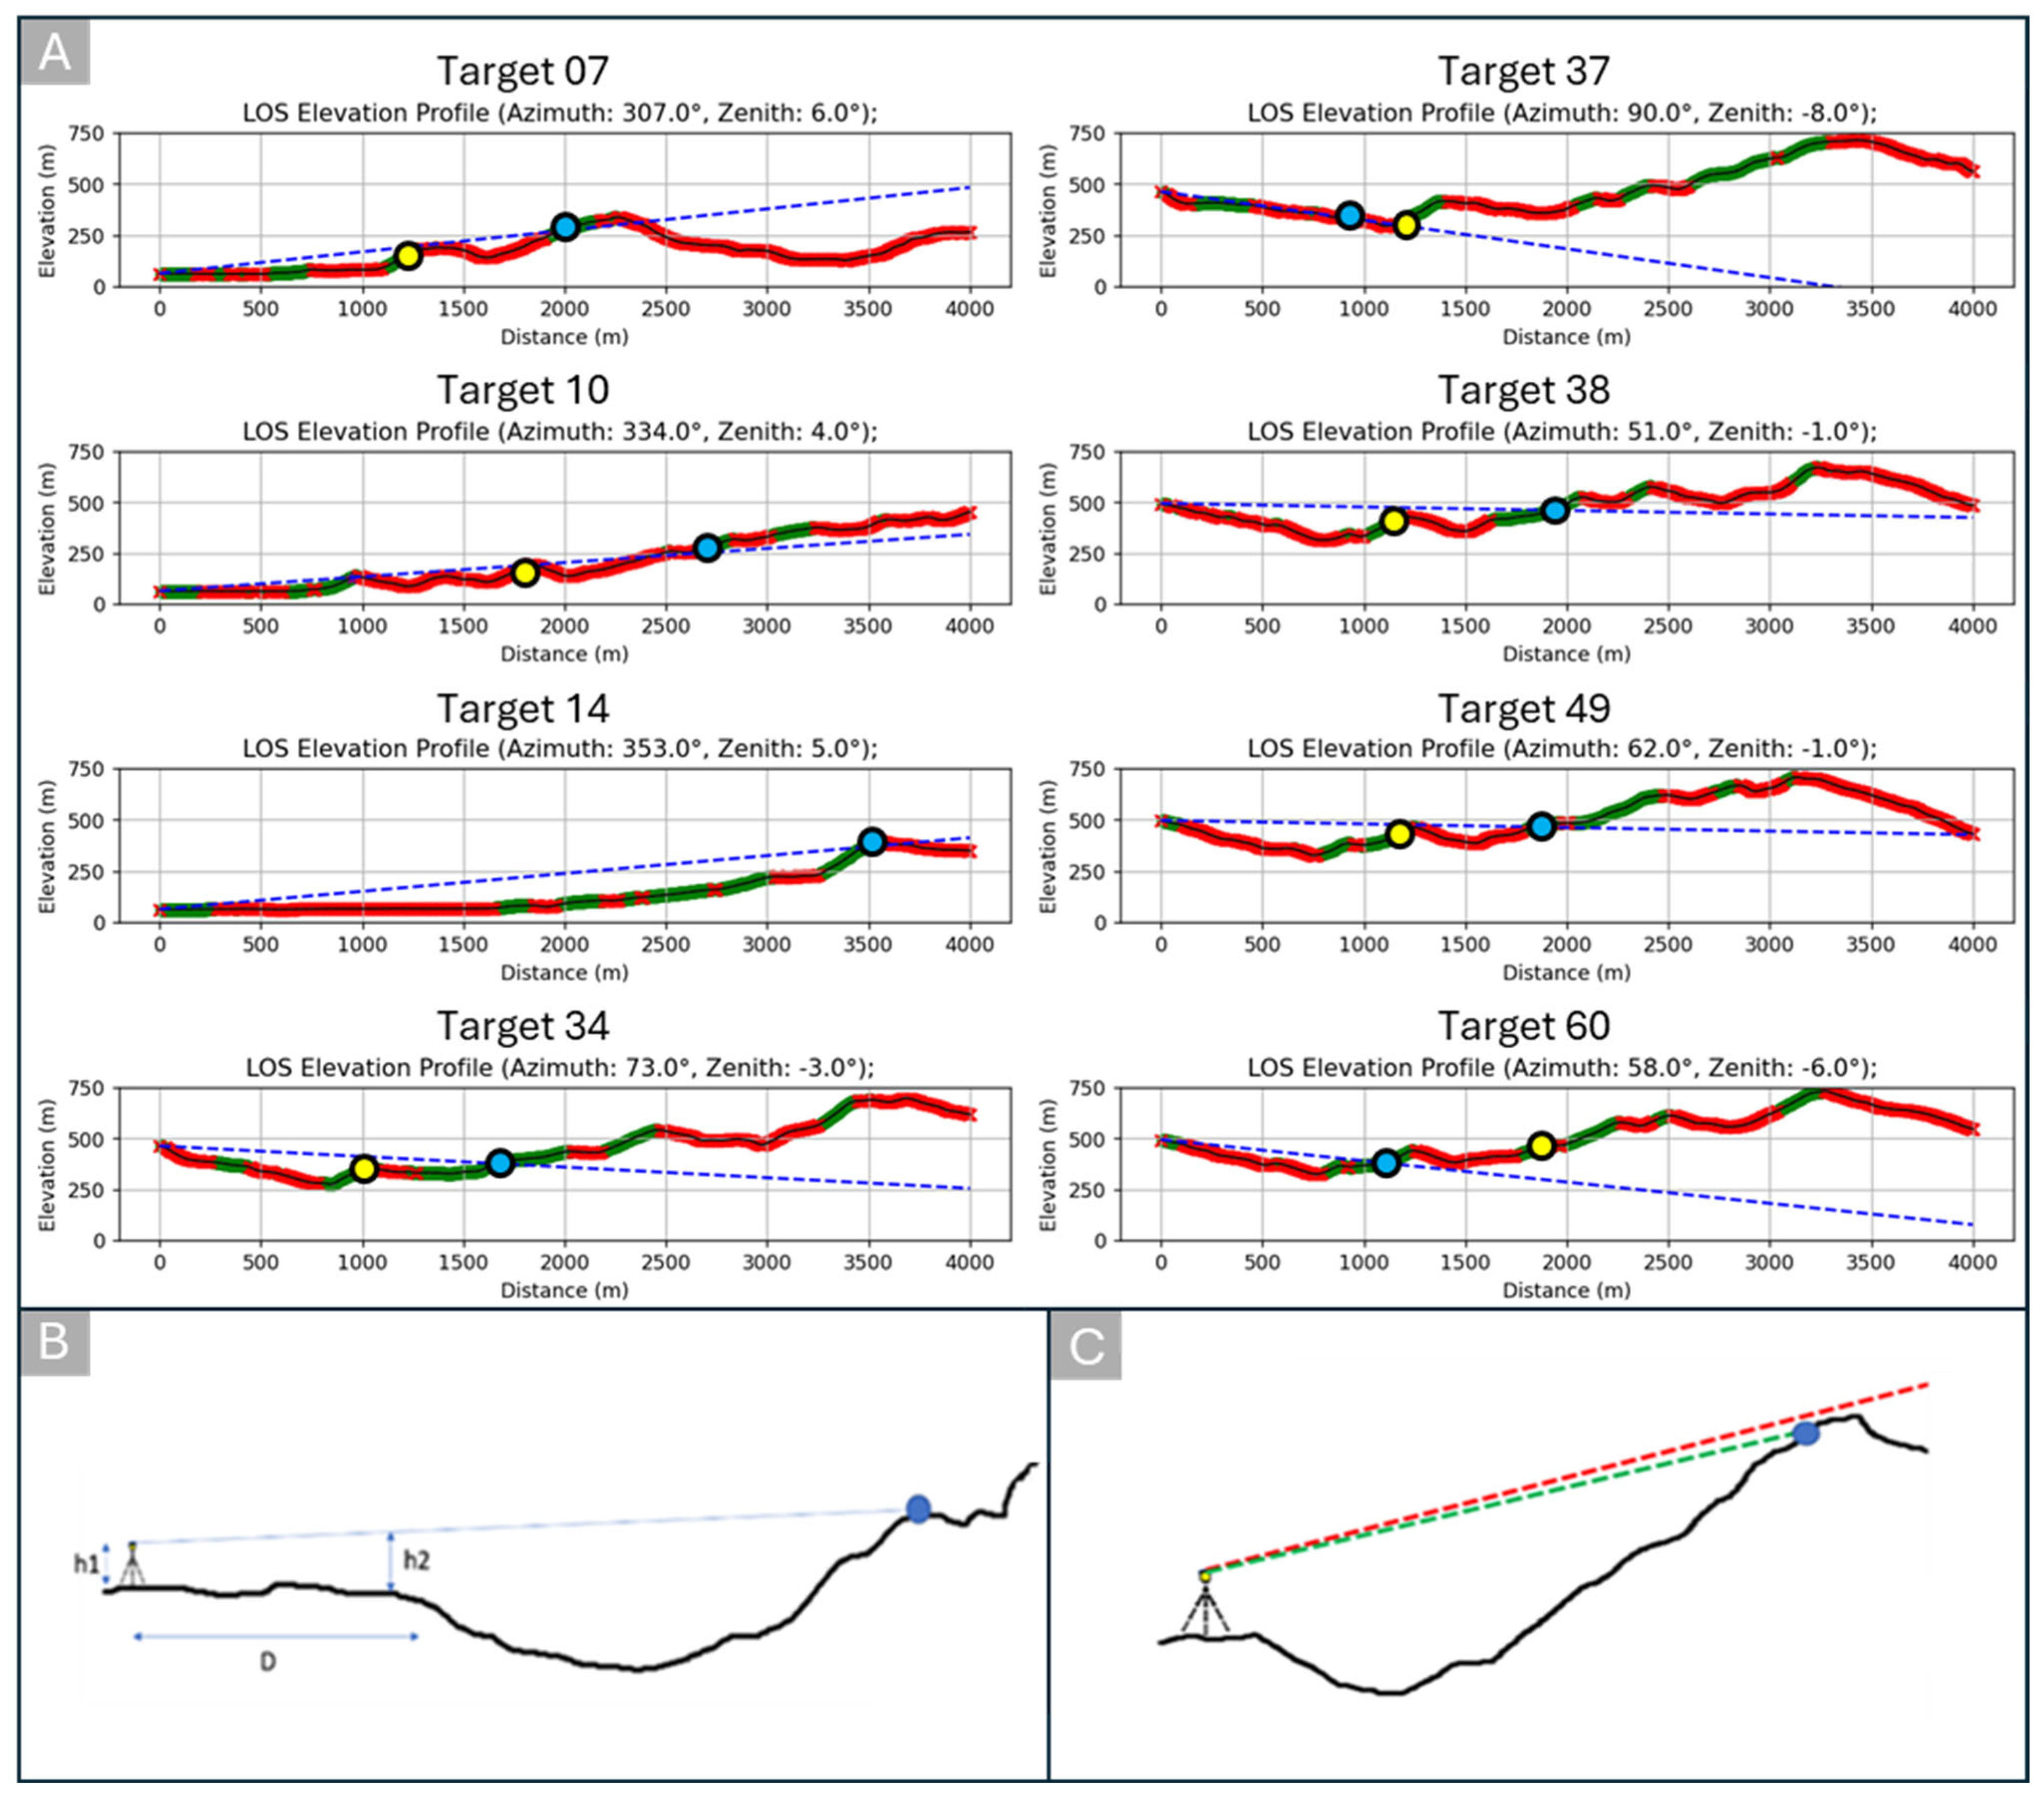
Figure 11A displays detailed topographic profiles generated by the CoordFinder algorithm for each identified outlier, highlighting the dynamics of LOS and topography. The dashed blue line represents the LOS from each measurement station, with green sections indicating visible terrain and red sections marking obstructed views. The blue dot shows the CoordFinder’s predicted intersection point, while the yellow dots represent the actual landslide targets.
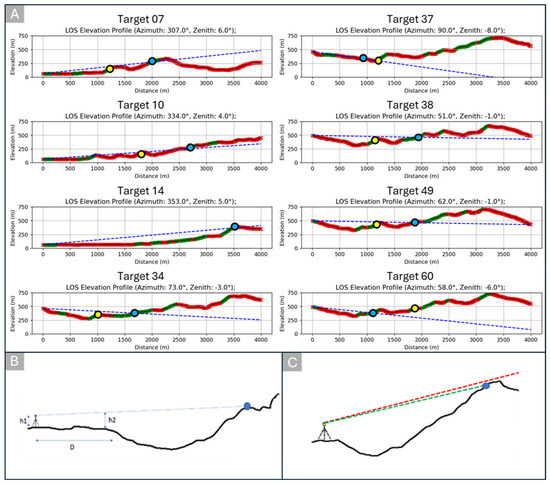
Figure 11.
Target point outliers identified using the CoordFinder algorithm with UGO and Range-R data. (A) Topographic profiles extracted from the DTM along the line of sight (dashed blue line). The green and red sections indicate the visible and non-visible portions of the surface, respectively. The blue dot represents the target identified by CoordFinder, while the yellow dot indicates the “true target” as validated by expert landslide interpretation. (B,C) illustrate two critical mapping conditions highlighted by Licata and Fubelli [10]: (B) surroundings with a low-slope angle and (C) a line of sight that grazes the topographic surface without intersecting it (red dashed line) compared to the correct line of sight (green dashed line).
For Targets 7 and 10, the LOS aligns just past the tangent to the crest of the slope, causing the CoordFinder to inaccurately register the intersection point (see example illustrated in Figure 11C). This issue also occurs with Targets 34 and 38, though here with a larger zenith angle error. This type of error typically arises when landslides are located near the top ridge of a slope. In such situations, it is recommended to avoid targeting the landslide crown and instead aim for the middle-to-lower portions of the landslide body, where LOS is less likely to be tangential and thus more reliable. Additionally, as shown in Figure 10, the positional error increases with distance between the measurement station and the target. Therefore, distance should be considered a critical operational constraint: maintaining shorter distances can help reduce spatial inaccuracies and improve targeting precision.
For Target 37, the LOS is nearly tangential to the surface (see the example illustrated in Figure 11B), resulting in a false intersection; this suggests the need for a larger no-intersection buffer zone around the measurement station. Targets 49 and 60 exhibit significant zenith angle errors due to the improper initial calibration of the accelerometer, where measured angles were smaller than actual ones. Finally, Target 14’s error stems from a horizontal angle shift, compounded by the distance to the true target (3.5 km), which contributed to a substantial spatial error of 221 m.
4.4. Q3—Was Ex-MAD Able to Accurately Identify the Timing of Landslides Using the Data Points Collected by GOGIRA’s Devices?
To evaluate the ExMAD framework’s effectiveness in detecting landslide timing, we analyzed each “true target” landslide point using a sequence of temporal images. For each point, 85 multispectral images (Red Green Blue and NIR) were automatically downloaded from Copernicus Dataspace, spanning the period from 1 January 2017 to 1 July 2024, with a maximum cloud coverage of 1%. Each image was processed using U-Net model predictions to classify landslide pixels.
To detect timing accuracy, we applied linear regression on different segments of the time series (extracted with the Pelt method; see [24]) for both the landslide pixel percentages (Method 1) and the 3 × 3 grid ratio (Method 2) (see Section 2.2). This segmentation-based approach allowed us to identify trend changes, which served as temporal markers for landslide events. Together, these two methods provided a comprehensive view of landslide timing by capturing both the overall shifts in landslide-classified pixels across the image and more localized changes within the grid ratios. A comparative analysis of these methods revealed only seven discrepancies in estimated landslide timing (see Table 2).
Table 2.
Landside targets points in which there are time discrepancies in ExMAD processing between Method 1 (percentage of landslide pixels on overall image) and Method 2 (ratio of landslide presence within a 3 × 3 grid centered on the image center). Each target was expert-checked (Expert-check) by analyzing the entire time series of images to identify the actual trigger time.
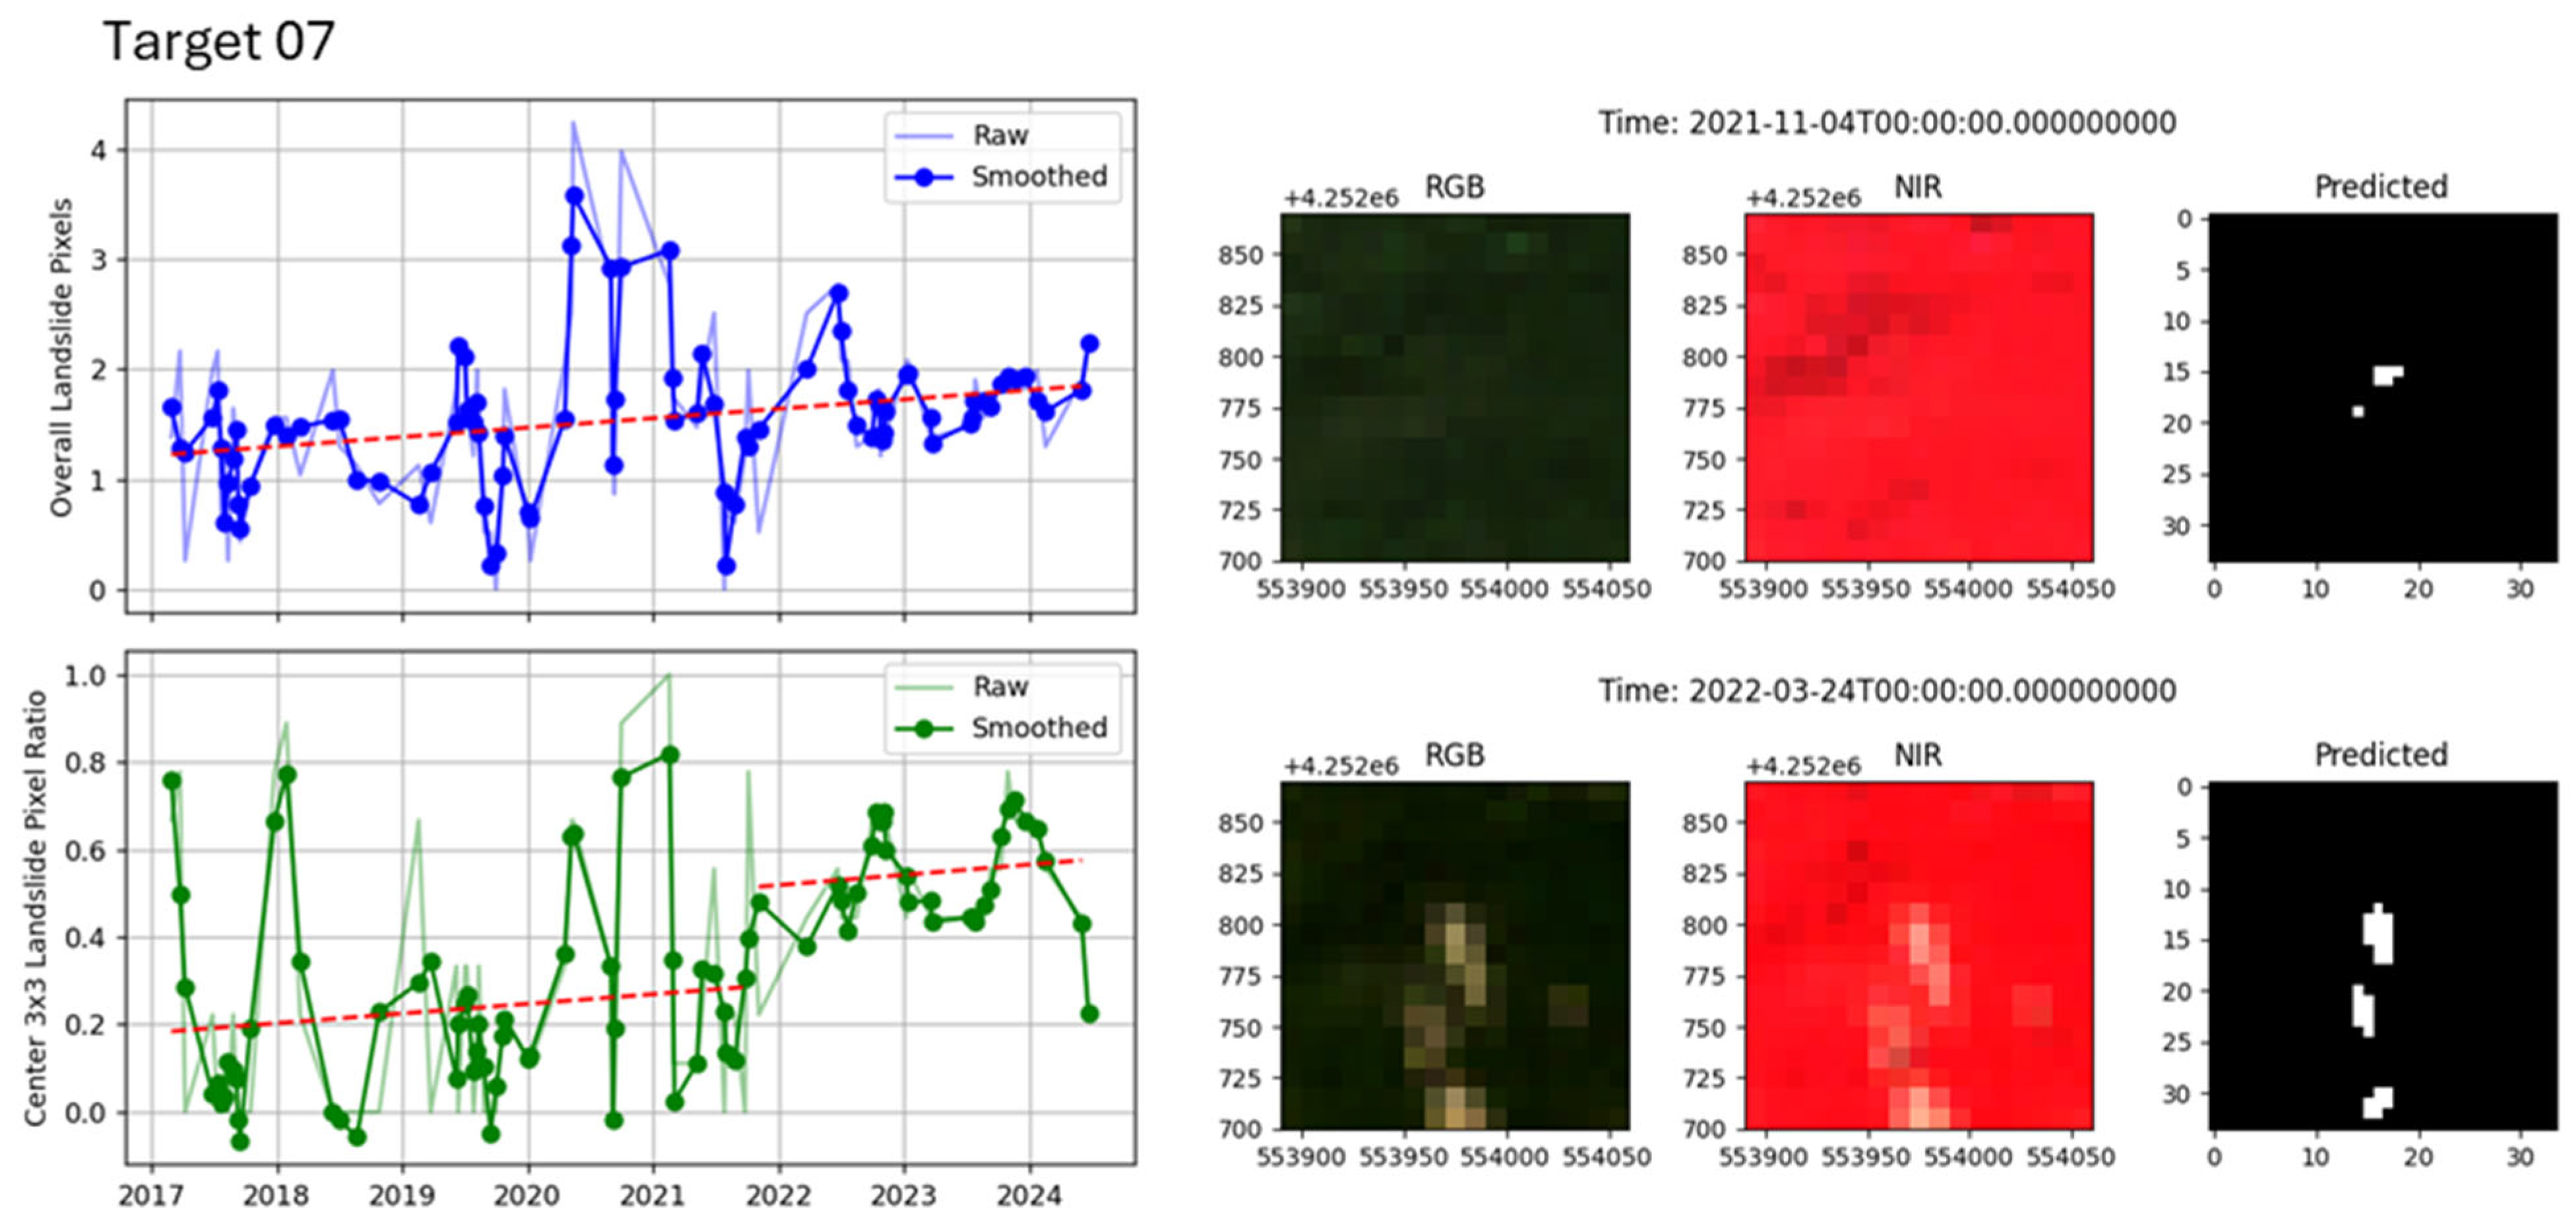
A case-by-case examination of the mismatches revealed that, in one instance (Target 07), only one method successfully detected the temporal trend change. This discrepancy was attributed to significant noise within the time series signal (Figure 12).

Figure 12.
Time sequence for Target 07 automatically analyzed using ExMAD with both Method 1 (left side, top) and Method 2 (left side, bottom). The red dashed line represents the lines identified with the Pelt method of the rupture library [24]. On the right, RGB and NIR false-color images for pre (top) and post (bottom) events dates are shown. These S2 images were selected by the expert-based validation.
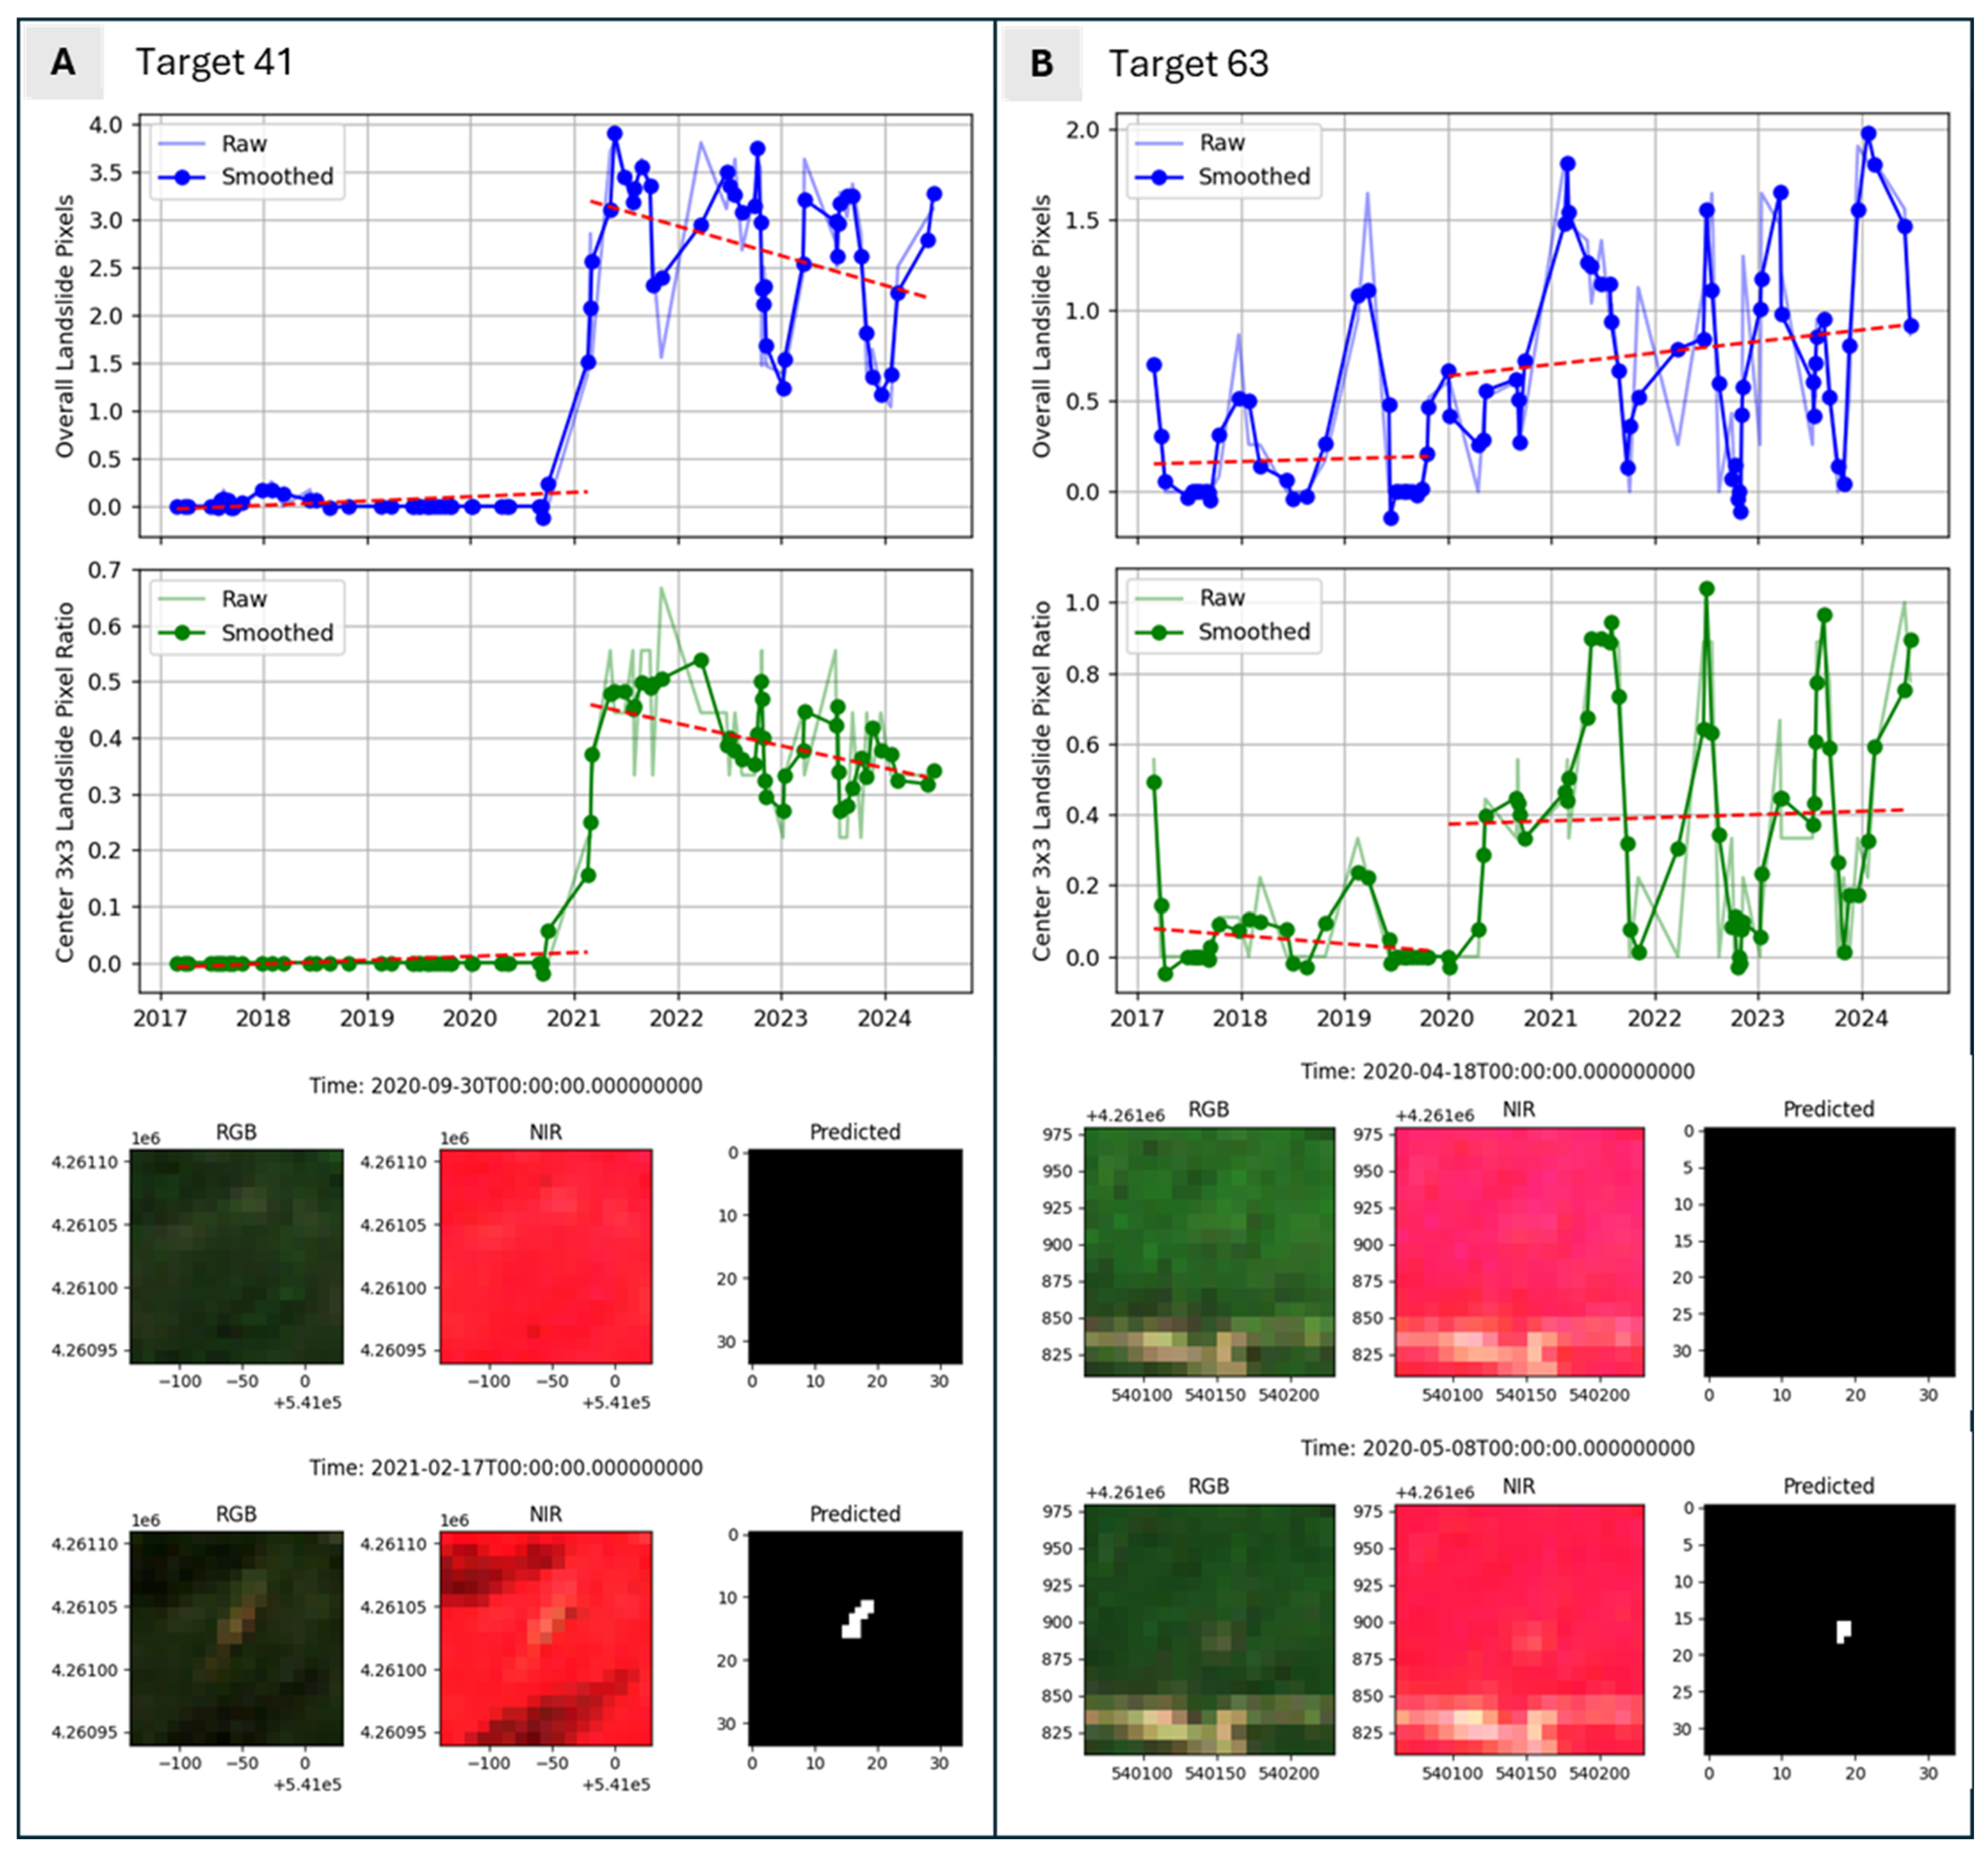
In two cases (Target 41 and Target 63), a slight temporal offset was observed relative to the known landslide intervals (Figure 13). In fact, Target 41 was dated by both methods between 27 February and 4 March 2021, whereas the actual landslide occurred between 30 September 2020 and 17 February 2021 (Figure 13A). Similarly, Target 63 was dated between 4 January and 9 January 2020, while the true event occurred between 18 April and 9 May 2020 (Figure 13B). These mismatches were likely caused by limitations of the change-detection algorithm, which exhibited unstable performance in the presence of high-noisy time series signals.

Figure 13.
Time sequences for (A) Target 41 and (B) Target 63, automatically analyzed using ExMAD with Method 1 (blue lines) and Method 2 (green lines) (top in sub-panels). The red dashed line represents the lines identified with the Pelt method of the rupture library [24]. In the bottom of the A and B sub-panels, the RGB and NIR false-color images from pre (top) and post (bottom) event dates are shown. These images were selected by the expert-based validation.
In practical applications, particularly those involving risk assessment or rainfall–landslide correlation analysis, even a few weeks’ difference can alter conclusions about triggering mechanisms. While short delays may be tolerable for broad inventory mapping, offsets of several months can lead to the misattribution of events and reduced effectiveness of early warning or response systems [36,37].
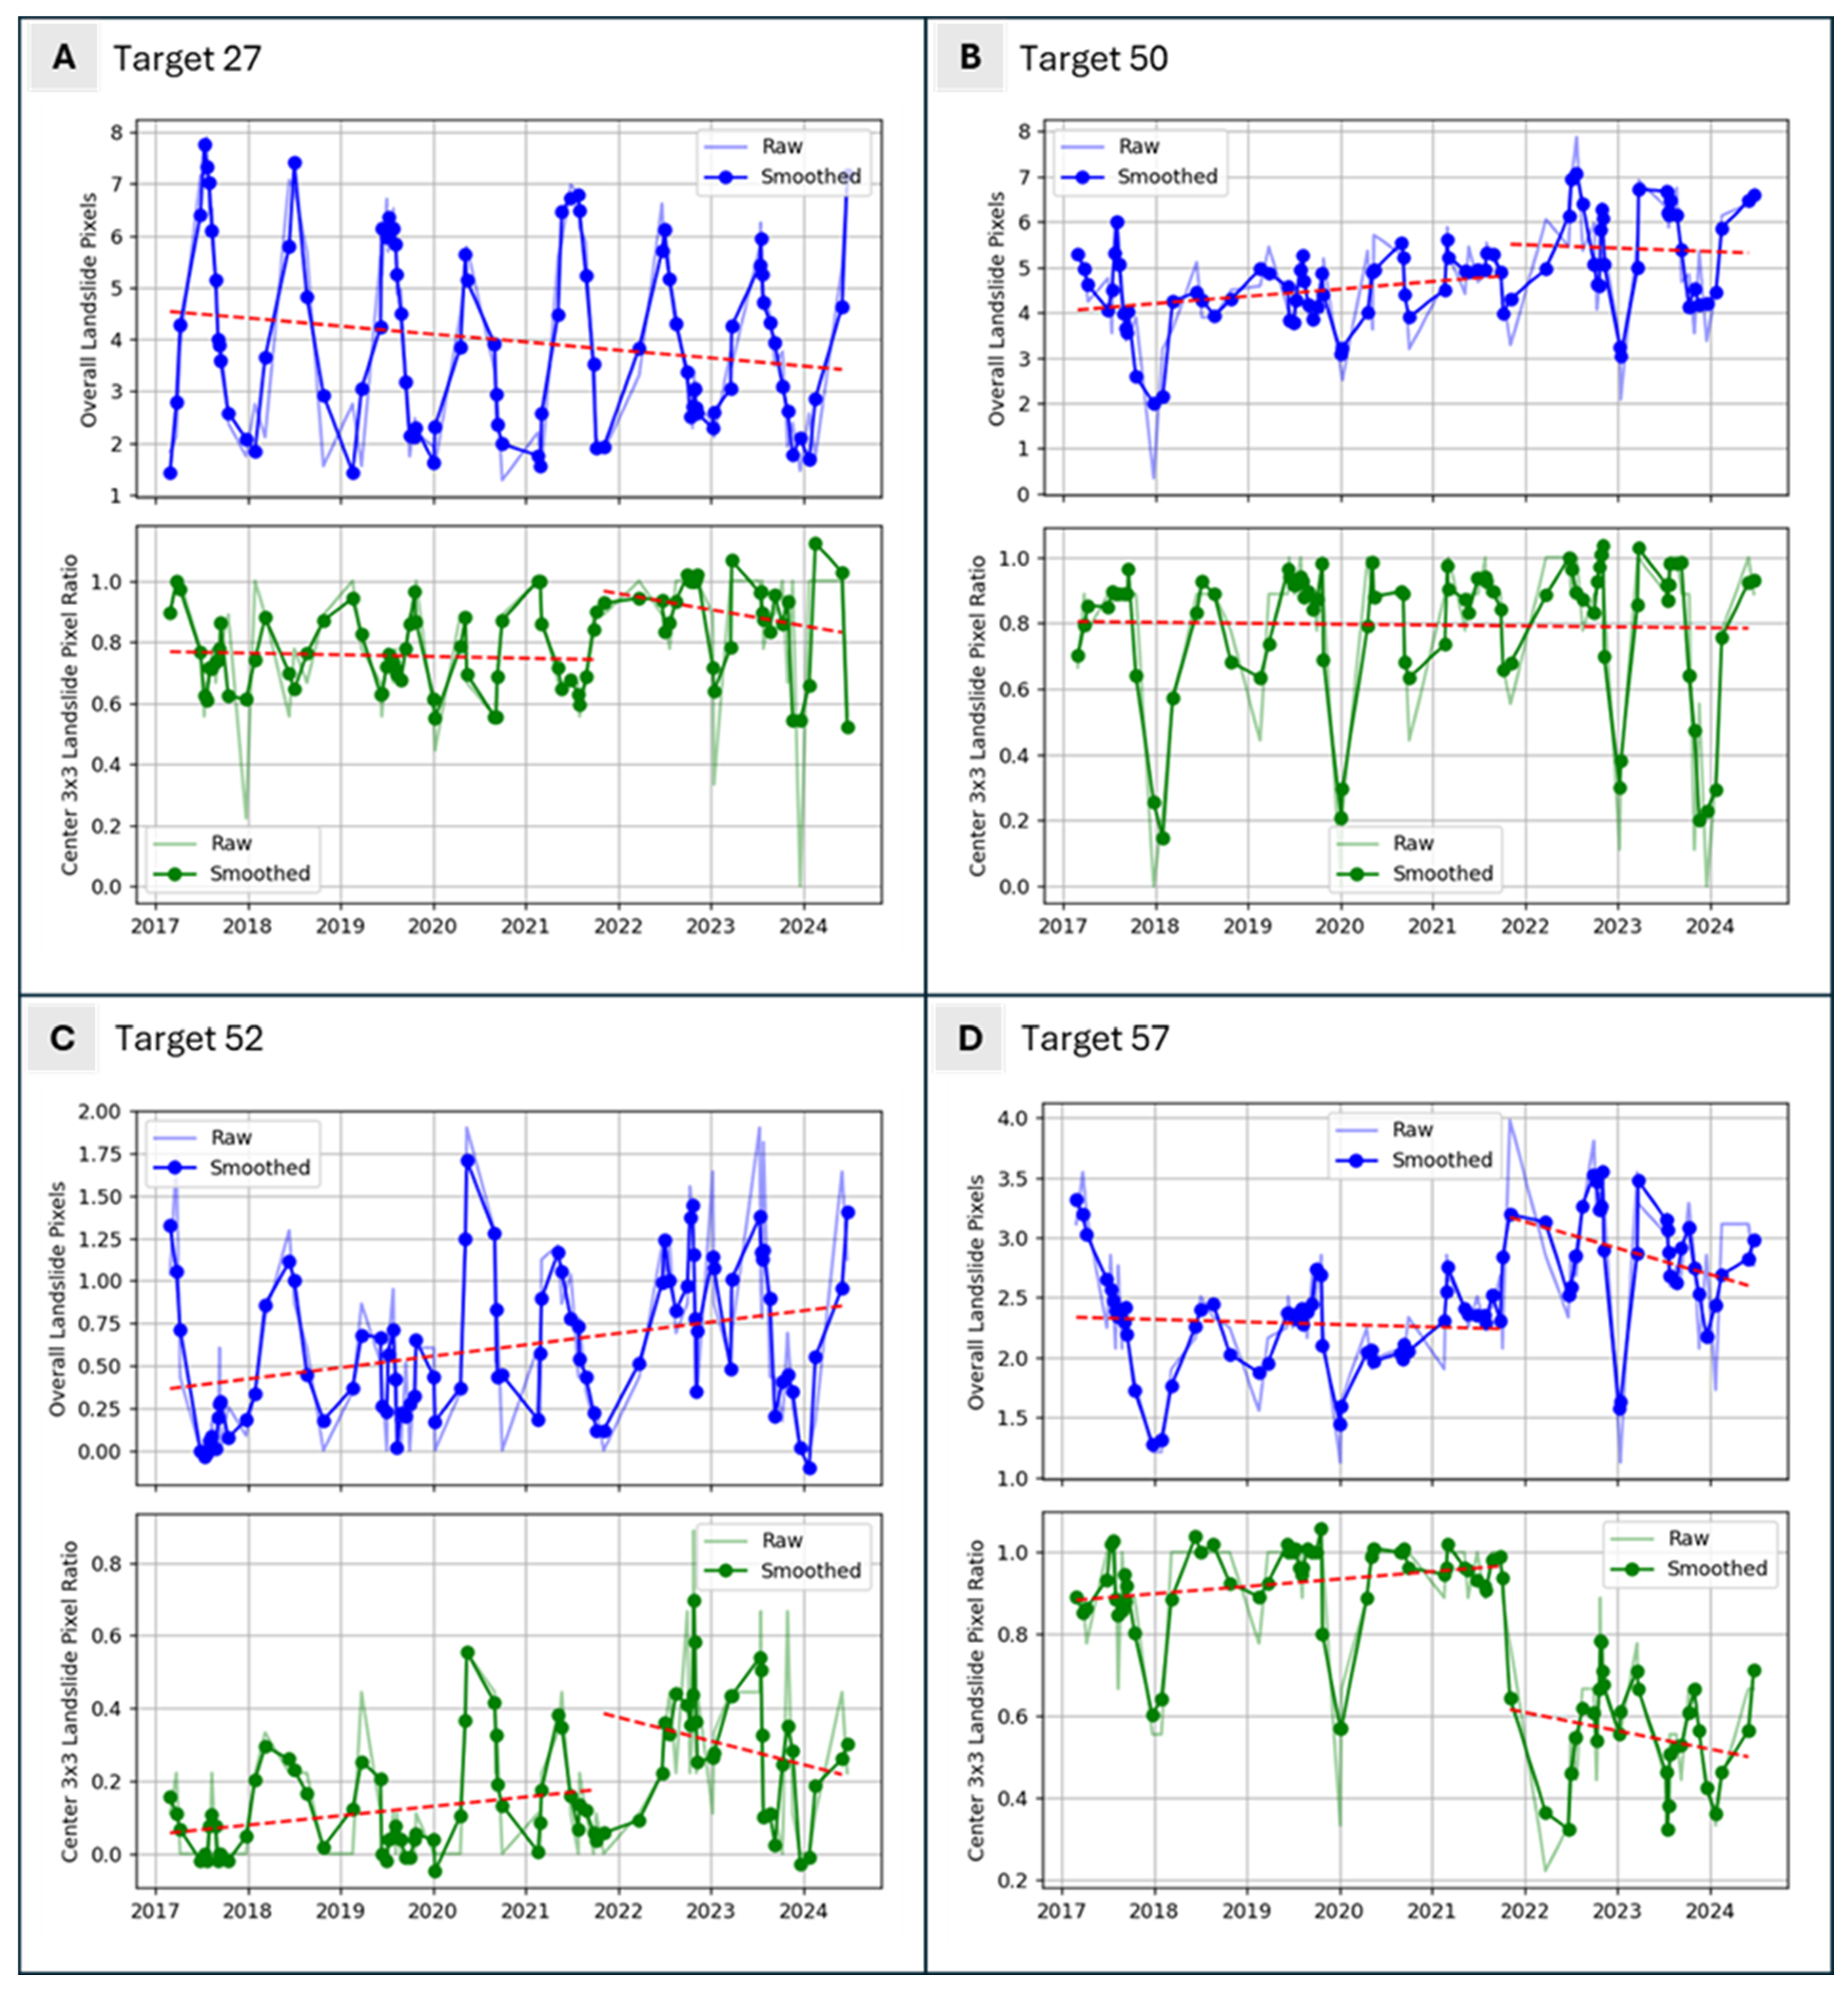
In the remaining four cases (Targets 27, 50, 52, and 57), one of the two methods produced a false positive in landslide timing detection (Table 2). An analysis of the corresponding time series (Figure 14) and satellite imagery (see Supplementary Material S1) revealed that none of these sequences exhibited significant trend changes. Target 57 corresponds to a landslide event that occurred before the first available S2 image, while the other three targets (27, 50, and 52) displayed high signal noise, caused by the presence of tracks/roads interfering with the detection process.
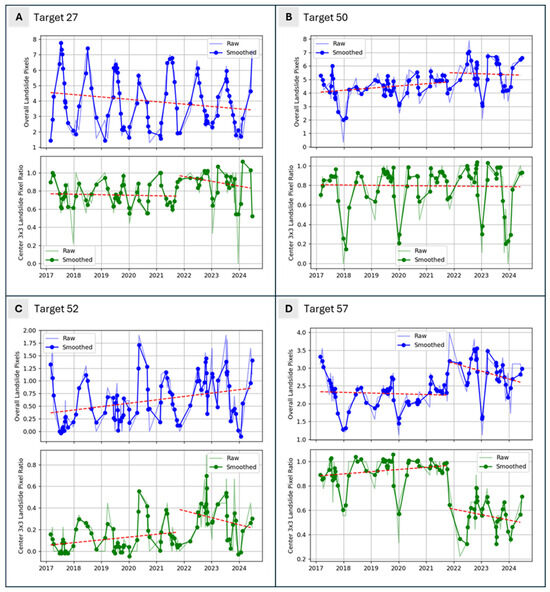
Figure 14.
Time sequences analyzed automatically using ExMAD with Method 1 and Method 2 for (A) Target 27, (B) Target 50, (C) Target 52, and (D) Target 57. The red dashed line represents the lines identified with the Pelt method of the rupture library [24].
From a practical perspective, such false positives could result in the misidentification of stable areas as recently active, potentially leading to unnecessary alarm or incorrect prioritization of mitigation resources. In operational contexts, these inaccuracies could compromise decision-making. This highlights the importance of including expert visual validation to confirm automatic detections [4,5].
To address these limitations, future studies should explore the integration of SAR-based systems, such as those proposed by Nava et al. [38] and Burrow et al. [39], to overcome cloud cover issues and enhance temporal resolution. Additionally, the use of more advanced machine learning models, combined with the implementation of noise reduction techniques, could significantly improve the accuracy of landslide detection and, consequently, the reliability of trend-change identification in time series analysis.
The landslide timing classification across all target points showed that, in 34 cases, both methods detected no-landslide events (Figure 15). In fact, 19 landslide targets occurred before the first available S2 image, and the other 15 time series were strongly affected by noise due to the high noise (landslides close to the track and/or very small). The majority of the dated landslides (24 events) occurred between 4 November 2021 and 24 March 2022, a peak activity period. However, two landslides were mapped outside this timeframe: one between 18 April and 8 May 2020 and one between 30 September 2020 and 17 February 2021.
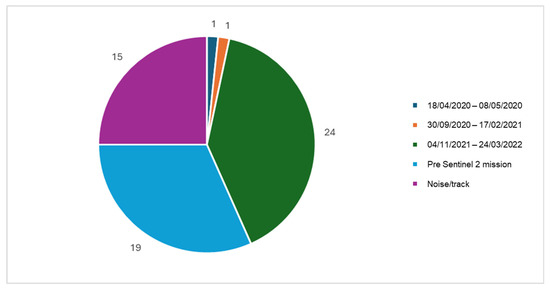
Figure 15.
Pie chart showing the number of landslides mapped for the triggering time range predicted by ExMAD.
4.5. Operational Integration of GOGIRA and ExMAD: Practical Applications, Limitations, and Future Directions
The GOGIRA system is specifically designed for geological and geomorphological field mapping using DNC principles. In contrast to more expensive solutions based on laser technologies [12], GOGIRA provides a more accessible and field-deployable alternative. It is particularly effective in complex terrain and heterogeneous land cover due to its reliance on Digital Terrain Models (DTMs) as a foundational data source. Sensor quality plays a critical role in system performance; in this study, the Arduino Nicla Sense ME board [15] demonstrated robust accuracy and reliability during field testing. Nevertheless, further investigations are needed to quantify the intrinsic instrumental error associated with the UGO and Range-R devices, thereby better delineating their operational thresholds.
Field tests highlighted practical limitations of GOGIRA, primarily related to spatial accuracy degradation caused by line-of-sight (LOS) obstructions, surface irregularities, and increasing distance between the measuring station and the target. Positional errors become particularly pronounced at distances exceeding 2–3 km or when targeting areas near ridge crests, where tangential LOS can produce false intersection points. Consequently, the optimal application in the field requires unobstructed LOS and minimization of the target distance were possible. In addition, the implementation of the MARVIN App, with the capability to process data collected by UGO and Range-R devices using the CoordFinder algorithm in real time, could enable immediate in-field assessment of target point accuracy. This would enable operators to discard and re-acquire inaccurate measurements on-site, significantly reducing reliance on post-processing corrections and enhancing overall data quality.
The ExMAD framework proved effective for multitemporal analysis of landslide initiation by processing long-term time series of multispectral satellite imagery. This functionality is especially valuable in operational contexts, where determining landslide triggering times directly in the field supports timely decision-making. By design, ExMAD supports an expert-centered approach: while AI performs automated classification and change detection, the ExMAD algorithm also outputs both raw and processed data, enabling experts to validate or override AI-derived results. However, the performance of ExMAD is constrained by several factors. The 10 m spatial resolution of Sentinel-2 imagery limits the system’s ability to detect small-scale events. Additionally, high signal noise can lead to false positives or inaccurate temporal assessments. Cloud cover and temporal gaps in image acquisition further affect the reliability of the derived timing information in certain cases.
Despite these limitations, the integration of GOGIRA and ExMAD offers a cost-effective, scalable, and field-adaptable solution for landslide documentation, especially in scenarios where high-end equipment such as terrestrial laser scanners, drone photogrammetry, or binocular rangefinders are not available or are not practical. The modular design of both systems enables future enhancements, including improved AI-based segmentation algorithms, noise-reduction techniques, and hardware upgrades.
Importantly, the study highlights the need for systems that can capture and process data in real time [7,8] with a DNC approach [12]. Providing users with immediate feedback on data quality in the field allows for prompt remeasurement if needed, significantly enhancing the efficiency and reliability of landslide inventory creation in operational and research settings.
5. Conclusions
Assessing spatial errors in geometries collected during fieldwork is critical for advancing Direct Numerical Cartography (DNC). Integrating error confidence estimation into digital-born field data enhances its value but requires in-depth knowledge of the devices used to ensure expert users can match them appropriately to compatible tasks. This study evaluated the precision and performance of the GOGIRA system alongside the Ex-MAD framework for detecting spatial and temporal landslide occurrences.
A comparative analysis of the two GOGIRA devices, UGO and Range-R, revealed significant differences in accuracy. Range-R exhibited a substantially lower average spatial error (50 m) than UGO (82 m), with descriptive statistics confirming its superior consistency and reliability in landslide mapping. The primary distinction lies in UGO’s tripod-based design, which demands frequent recalibration. Outlier analysis highlighted those operational conditions (e.g., line-of-sight obstructions or slope tangency) significantly influence spatial accuracy. Therefore, selecting optimal measurement station conditions in relation to targets is essential for precision.
The Ex-MAD framework, employing a U-Net model to analyze temporal Sentinel-2 multispectral imagery, effectively identified landslide timing, with minimal discrepancies. While some landslides occurred before the Sentinel-2 mission and were therefore undetectable, the majority were accurately linked to the most intense rainfall events during the study period. Furthermore, landslides associated with minor rainfall events further demonstrated the value of a single-landslide-oriented mapping approach, where each landslide is individually assessed through expert validation. Discrepancies in timing were primarily attributed to methodological differences and to noise affecting small landslide detection.
From this preliminary field test, it became clear that further research was needed to evaluate the GOGIRA system under a broader range of operational conditions, increase sample sizes, and strengthen statistical robustness. To strengthen the robustness of our integrated system, further steps could include:
- Increasing the sample size to reduce the impact of data dispersion and conducting additional tests to verify the stability of the regression models.
- Refining calibration procedures and examining spatial error variability with respect to target distance will also enhance system reliability.
- Integrating SAR multitemporal data analysis systems to improve temporal resolution.
- Improving model stability through enhanced segmentation and noise-reduction techniques.
- Real-time processing in the field to drive data acquisition and minimize post-processing errors.
For field professionals and decision-makers, this integrated system offers a cost-effective and modular solution for landslide spatial–temporal mapping directly during field campaigns. The ability of the GOGIRA-Ex-MAD approach to combine spatial targeting with temporal classification has proven to be a promising tool for real-world applications. Real-time data processing, enabled by future integration with platforms such as the MARVIN android app, could further enhance usability by allowing in-field verification and correction of spatial data.
In conclusion, this research demonstrates that the GOGIRA system and Ex-MAD framework are effective tools for real-time spatial and temporal landslide mapping in the field. Expert supervision remains essential for accurate landslide identification during field campaigns and for validating the outputs of automated systems. At the same time, DNC proves to be a fundamental approach for collecting georeferenced digital data with error metrics and quality assessments.
Supplementary Materials
Supplementary Material S1 can be retrieved at the link https://doi.org/10.5281/zenodo.15322290, accessed on 26 June 2025.
Author Contributions
Conceptualization, M.L.; methodology, M.L.; software, M.L.; validation, M.L. and F.S.; formal analysis, M.L.; investigation, M.L. and F.S.; resources, M.L. and F.S.; data curation, M.L. and F.S.; writing—original draft, M.L. and F.S.; preparation, M.L. and F.S.; writing—review and editing, M.L., F.S., E.K., K.T. and G.F.; visualization, M.L. and F.S.; supervision, E.K., K.T. and G.F.; project administration, M.L.; funding acquisition, G.F. All authors have read and agreed to the published version of the manuscript.
Funding
This research received no external funding.
Data Availability Statement
Data will be made available on request.
Conflicts of Interest
The authors declare no conflicts of interest.
Abbreviations
The following abbreviations are used in this manuscript:
| AOI | area of interest |
| DCN | Direct Numerical Cartography |
| DOF | Degree of Freedom |
| DTM | Digital Terrain Model |
| ExMAD | Expert-based Multitemporal AI Detector |
| GB-InSAR | Ground-Based Interferometric Synthetic Aperture Radar |
| GIS | Geographic Information Systems |
| GNSS | Global Navigation Satellite Systems |
| GOGIRA | Ground Operative System for GIS Input Remote-data Acquisition |
| IMU | Inertial Motion Unit |
| INC | Indirect Numerical Cartography |
| LOS | line of sight |
| NC | Numerical Cartography |
| UTM | Universal Transverse Mercator |
| WGS84 | World Geodetic System 1984 |
References
- Sreelakshmi, S.; Vinod Chandra, S.S.; Shaji, E. Landslide identification using machine learning techniques: Review, motivation, and future prospects. Earth Sci. Inform. 2022, 15, 2063–2090. [Google Scholar] [CrossRef]
- Peters, S.; Liu, J.; Keppel, G.; Wendleder, A.; Xu, P. Detecting Coseismic Landslides in GEE Using Machine Learning Algorithms on Combined Optical and Radar Imagery. Remote Sens. 2024, 16, 1722. [Google Scholar] [CrossRef]
- Licata, M.; Buleo Tebar, V.; Seitone, F.; Fubelli, G. The Open Landslide Project (OLP), a New Inventory of Shallow Landslides for Susceptibility Models: The Autumn 2019 Extreme Rainfall Event in the Langhe-Monferrato Region (North-western Italy). Geosciences 2023, 13, 289. [Google Scholar] [CrossRef]
- Manconi, A.; Casu, F.; Ardizzone, F.; Bonano, M.; Cardinali, M.; De Luca, C.; Gueguen, E.; Marchesini, I.; Parise, M.; Vennari, C.; et al. Brief communication: Rapid mapping of landslide events: The 3 December 2013 Montescaglioso landslide, Italy. Nat. Hazards Earth Syst. Sci. 2014, 14, 1835–1841. [Google Scholar] [CrossRef]
- Ajmar, A.; Boccardo, P.; Tonolo, F.G. Satellite based rapid mapping to assess damages in support of emergency management. ATTI E Rass. Tec. 2019, 32, 32–40. [Google Scholar]
- Van Zuidam, R.A.; van Zuidam-Cancelado, F.I. Terrain Analysis and Classification Using Aerial Photographs; International Institute for Aerial Survey and Earth Sciences: Enschede, The Netherlands, 1979; Volume 7, ISBN 978-90-6164-038-7. [Google Scholar]
- Ali, E. Geographic Information System (GIS): Definition, Development, Applications & Components; Department of Geography, Ananda Chandra College: Jalpaiguri, India, 2020; p. 158. [Google Scholar]
- Gandhi, V.; Kang, J.M.; Shekhar, S. Spatial Databases. In Wiley Encyclopedia of Computer Science and Engineering; Wah, B.W., Ed.; John Wiley & Sons, Inc.: Hoboken, NJ, USA, 2008; ISBN 978-0-470-05011-8. [Google Scholar]
- Guzzetti, F.; Mondini, A.C.; Cardinali, M.; Fiorucci, F.; Santangelo, M.; Chang, K.-T. Landslide Inventory Maps: New Tools for an Old Problem. Earth-Sci. Rev. 2012, 112, 42–66. [Google Scholar] [CrossRef]
- Licata, M.; Fubelli, G. The GOGIRA system: An innovative method for landslides digital mapping. Geosciences 2022, 12, 336. [Google Scholar] [CrossRef]
- Licata, M.; Faga, S.; Fubelli, G. ExMAD (Expert-based Multitemporal AI Detector): An Open-Source methodological framework for remote and field landslide inventory. Environ. Model. Softw. 2025, 186, 106363. [Google Scholar] [CrossRef]
- Arduino Nicla Sense ME. Available online: https://docs.arduino.cc/resources/datasheets/ABX00050-datasheet.pdf (accessed on 30 April 2025).
- Arduino Nano V2.3. Available online: https://www.arduino.cc/en/uploads/Main/ArduinoNanoManual23.pdf (accessed on 30 April 2025).
- GY-NEO6MV2 GPS Module. Available online: https://content.u-blox.com/sites/default/files/products/documents/NEO-6_DataSheet_%28GPS.G6-HW-09005%29.pdf (accessed on 30 April 2025).
- The Pandas Development Team. Pandas-Dev/Pandas: Pandas, version 2.1.1, Zenodo: Geneva, Switzerland, 2020. [CrossRef]
- Gillies, S. Rasterio: Geospatial Raster I/O for Python Programmers. Mapbox. 2013. Available online: https://github.com/rasterio/rasterio (accessed on 30 April 2025).
- PyProj Library. Available online: https://github.com/pyproj4/pyproj (accessed on 30 April 2025).
- Harris, C.R.; Millman, K.J.; Van Der Walt, S.J.; Gommers, R.; Virtanen, P.; Cournapeau, D.; Wieser, E.; Taylor, J.; Berg, S.; Smith, N.J.; et al. Array programming with NumPy. Nature 2020, 585, 357–362. [Google Scholar] [CrossRef]
- openEO. Available online: https://openeo.org (accessed on 30 April 2025).
- Kaandorp, V.P.; Doornenbal, P.J.; Kooi, H.; Broers, H.P.; de Louw, P.G.B. Temperature buffering by groundwater in ecologically valuable lowland streams under current and future climate conditions. J. Hydrol. X 2019, 3, 100031. [Google Scholar] [CrossRef]
- Ronneberger, O.; Fischer, P.; Brox, T. U-net: Convolutional networks for biomedical image segmentation. In Medical Image Computing and Computer-Assisted Intervention, Proceedings of the MICCAI 2015–18th International Conference, Munich, Germany, 5–9 October 2015; Part III; Springer: Cham, Switzerland, 2015; Volume 9351, pp. 234–241. [Google Scholar] [CrossRef]
- Paszke, A.; Gross, S.; Massa, F.; Lerer, A.; Bradbury, J.; Chanan, G.; Killeen, T.; Lin, Z.; Gimelshein, N.; Antiga, L.; et al. PyTorch: An imperative style, high-performance deep learning library. In Advances in Neural Information Processing Systems; Curran Associates, Inc.: Red Hook, NY, USA, 2019; Volume 32, pp. 8024–8035. [Google Scholar]
- NVIDIA; Vingelmann, P.; Fitzek, F.H.P. CUDA, Release: 10.2.89. Available online: https://developer.nvidia.com/cuda-toolkit (accessed on 30 April 2025).
- Truong, C.; Oudre, L.; Vayatis, N. Selective review of offline change point detection methods. Signal Process. 2020, 167, 107299. [Google Scholar] [CrossRef]
- Virtanen, P.; Gommers, R.; Oliphant, T.E.; Haberland, M.; Reddy, T.; Cournapeau, D.; Burovski, E.; Peterson, P.; Weckesser, W.; Bright, J.; et al. SciPy 1.0: Fundamental algorithms for scientific computing in Python. Nat. Methods 2020, 17, 261–272. [Google Scholar] [CrossRef] [PubMed]
- Hellenic Survey of Geology and Mineral Exploration. Geological Sheets of Greece, Scale 1:50,000.
- Karymbalis, E.; Ferentinou, M.; Fubelli, G.; Giles, P.; Tsanakas, K.; Valkanou, K.; Batzakis, D.V.; Karalis, S. Classification of Trichonis Lake Graben (Western Greece) Alluvial Fans and Catchments Using Geomorphometry and Artificial Intelligence. Z. Geomorphol. 2022, 63, 295–312. [Google Scholar] [CrossRef]
- British Petroleum Co. Ltd. The Geological Results of Petroleum Exploration in Western Greece; Institute of Geology Subsurface Research: Athens, Greece, 1971; Volume 10. [Google Scholar]
- Lekkas, E.; Papanikolaou, D. Neotectonic Map of Greece, Aitolia-Akarnania sheet (scale 1:100,000). Univ. Athens Dept. Dyn. Tecton. Appl. Geol. 1997. (In Greek) [Google Scholar]
- Kontoes, C.; Loupasakis, C.; Papoutsis, I.; Alatza, S.; Poyiadji, E.; Ganas, A.; Psychogyiou, C.; Kaskara, M.; Antoniadi, S.; Spanou, N. Landslide susceptibility mapping of central and western Greece, combining NGI and WoE methods, with remote sensing and ground truth data. Land 2021, 10, 402. [Google Scholar] [CrossRef]
- Sakkas, G.; Misailidis, I.; Sakellariou, N.; Kouskouna, V.; Kaviris, G. Modeling landslide susceptibility in Greece: A weighted linear combination approach using analytic hierarchical process, validated with spatial and statistical analysis. Nat. Hazards 2016, 84, 1873–1904. [Google Scholar] [CrossRef]
- Sabatakakis, N.; Koukis, G.; Vassiliades, E.; Lainas, S. Landslide susceptibility zonation in Greece. Nat. Hazards 2013, 65, 523–543. [Google Scholar] [CrossRef]
- Nikolakopoulos, K.G.; Kyriou, A.; Koukouvelas, I.K.; Tomaras, N.; Lyros, E. UAV, GNSS, and InSAR Data Analyses for Landslide Monitoring in a Mountainous Village in Western Greece. Remote Sens. 2023, 15, 2870. [Google Scholar] [CrossRef]
- Cruden, D.M.; Varnes, D.J. Landslide types and processes. Transp. Res. Board Spec. Rep. 1996, 247, 36–75. [Google Scholar]
- Varnes, D.J. Slope movement types and processes. Spec. Rep. Transp. Res. Board Natl. Acad. Sci. 1978, 176, 11–33. [Google Scholar]
- Peres, D.J.; Cancelliere, A.; Greco, R.; Bogaard, T.A. Influence of uncertain identification of triggering rainfall on the assessment of landslide early warning thresholds. Nat. Hazards Earth Syst. Sci. 2018, 18, 633–646. [Google Scholar] [CrossRef]
- Robbins, J.C. A probabilistic approach for assessing landslide-triggering event rainfall in Papua New Guinea using TRMM satellite precipitation estimates. J. Hydrol. 2016, 541, 296–309. [Google Scholar] [CrossRef]
- Nava, L.; Bhuyan, K.; Meena, S.R.; Monserrat, O.; Catani, F. Rapid Mapping of Landslides on SAR Data by Attention U-Net. Remote Sens. 2022, 14, 1449. [Google Scholar] [CrossRef]
- Burrows, K.; Marc, O.; Remy, D. Using Sentinel 1 radar amplitude time series to constrain the timings of individual landslides: A step towards understanding the controls on monsoon triggered landsliding. Nat. Hazards Earth Syst. Sci. 2022, 22, 2637–2653. [Google Scholar] [CrossRef]


Disclaimer/Publisher’s Note: The statements, opinions and data contained in all publications are solely those of the individual author(s) and contributor(s) and not of MDPI and/or the editor(s). MDPI and/or the editor(s) disclaim responsibility for any injury to people or property resulting from any ideas, methods, instructions or products referred to in the content. |
© 2025 by the authors. Licensee MDPI, Basel, Switzerland. This article is an open access article distributed under the terms and conditions of the Creative Commons Attribution (CC BY) license (https://creativecommons.org/licenses/by/4.0/).