Article

Examples of Rupture Patterns of the 2023, Mw 7.8 Kahramanmaraş Surface-Faulting Earthquake, Türkiye

1
Emergeo Working Group, Istituto Nazionale di Geofisica e Vulcanologia (INGV), 00143 Roma, Italy
2
Istituto Superiore per la Protezione e la Ricerca Ambientale (ISPRA), 00144 Roma, Italy
3
Istituto Nazionale di Oceanografia e di Geofisica Sperimentale (INOGS), 34010 Sgonico, Trieste, Italy
4
Disaster and Emergency Management Authority (AFAD), 27110 Gaziantep, Turkey
5
Disaster and Emergency Management Authority (AFAD), Earthquake and Risk Reduction, 06800 Ankara, Turkey
*
Author to whom correspondence should be addressed.
Geosciences 2025, 15(7), 252; https://doi.org/10.3390/geosciences15070252
Submission received: 7 May 2025 / Revised: 12 June 2025 / Accepted: 24 June 2025 / Published: 2 July 2025

Abstract

Field surveys focused on detailed mapping and measurements of coseismic surface ruptures along the causative fault of the 6 February 2023, Mw 7.8 Kahramanmaraş earthquake. The aim was filling gaps in the previously available surface-faulting trace, validating the accuracy of data obtained from remote sensing, refining fault offset estimates, and gaining a deeper understanding of both the local and overall patterns of the main rupture strands. Measurements and observations confirm dominating sinistral strike-slip movement. An integrated and comprehensive slip distribution curve shows peaks reaching over 700 cm, highlighting the near-fault expressing up to 70% of the deep net offset. In general, the slip distribution curve shows a strong correlation with the larger north-eastern deformation of the geodetic far field dislocation field and major deep slip patches. The overall rupture trace is generally straight and narrow with significant geometric complexities at a local scale. This results in transtensional and transpressional secondary structures, as multi-strand positive and negative tectonic flowers, hosting different patterns of the mole-tracks at the outcrop scale. The comprehensive and detailed field survey allowed characterizing the structural framework and geometric complexity of the surface faulting, ensuring accurate offset measurements and the reliable interpretation of both morphological and geometric features.

1. Introduction

Continental surface-faulting earthquakes are relatively rare on a global scale [1]. Documenting perishable surface rupture features through prompt, detailed, systematic, homogeneous, and comprehensive field data collection is essential for an accurate characterization of the whole earthquake process. Surface rupture data are crucial in the following: (1) strengthening scaling relations [2,3,4,5]; (2) imaging shallow-crust brittle deformation complexities; (3) providing useful information on seismic sources and contributing to their modeling (e.g., [6]); (4) concurring in estimates of environmental damage [7]; (5) supporting in the emergency response activities.
Post-earthquake field observations provide high-resolution rupture data that complement remote-based models by refining rupture detection in areas of masked or low-resolution data, minimizing the uncertainties in the offset measurements, and clarifying the primary-to-distributed ratio of the coseismic faulting arrangement (see [8]).
Following the 6 February 2023, Mw 7.8 Kahramanmaraş earthquake, very few and limited studies have been published about fieldwork mapping; we planned to fill the gaps of the remote-sensed epicentral region, in order to document in detail the rupture pattern arrangement at the surface and provide completion and ground-truthing of the shallow slip distribution [8,9,10,11,12]. After the devastating seismic sequence, the field survey was aimed at collecting data on the coseismic surface geological effects, particularly the primary effects (i.e., surface faulting), in order to contribute to the reconstruction of the near-fault slip distribution (compiled by AFAD—Turkish Disaster and Emergency Management Authority—coordinating different national and international cooperating teams) and to document in detail the style of its structural arrangement. Moreover, not only did the survey have an exploratory and preliminary aim focused on technical and scientific data collection, but also it provided logistical and operational information, useful to enhance the preparedness of future scientific international missions. The latter is among the targets of the new European Earthquake Geology Task Force (EuQuaGe), a volunteer organization of Earth scientists from European governmental institutions and academia for rapid, effective, and coordinated scientific assistance to national institutions in countries struck by large surface-faulting earthquakes.

2. Background

A devastating doublet of earthquakes afflicted SE Türkiye near the NW border of Syria. On 6 February 2023, a violent Mw 7.8 earthquake (hereafter referred to as the Kahramanmaraş earthquake) occurred along the southern section of the ~SW-trending East Anatolian Fault Zone (EAFZ). Just nine hours later, another devastating Mw 7.6 earthquake took place, just ~90 km away, on the ~E-W-striking northern strand of the EAFZ (i.e., Sürgü–Misis Fault system; [13]), striking the Elbistan area (hereafter referred to as the Elbistan earthquake) [14,15]. The violent shaking due to these two large events, along with the strong aftershocks, caused widespread destruction to buildings, resulting in a tragic death toll exceeding 50,000 people in both Türkiye and Syria.
The source region of the earthquakes is a tectonically complex junction where four tectonic plates (Eurasian, Arabian, African, and Anatolian; inset in Figure 1) interact. In this area the African and Arabian plates exhibit an average northward motion relative to Eurasia, with rates of approximately 5 mm/a and 15 mm/a, respectively [16]. As a result of such Late Miocene continent–continent collision between Eurasian and Arabian/African plates [17], the Anatolian block started to escape westward via the conjugate dextral and sinistral strike-slip fault zones, which accommodate most of the interplate deformation, namely the North (NAFZ) and East (EAFZ) Anatolian Fault Zones [18,19,20] (inset in Figure 1).
Based on geodetic data, the EAFZ shows a horizontal component of slip rate of up to 10 mm/a, decreasing southward, which can be partitioned (up to 3 mm/a) between the secondary sub-parallel strands of the fault system (e.g., the Northern Strand of the EAFZ) [16,21,22] (inset in Figure 1). The EAFZ is composed of many contiguous fault segments bounded by geometrical discontinuities (stepovers, bendings, etc.) defining a less mature tectonic structure, compared to the NAFZ, which accounts for up to 15–25 km of cumulative offset [13,23]. It is highlighted by remarkable tectonic landforms, and its present-day activity is made evident by background seismicity (other than the Pütürge segment, Mw 6.8 2020 earthquake [24]) and by large and frequent earthquakes that occurred in the past centuries along its segments [25,26,27,28]. In short, historical and paleoseismological studies indicate the occurrence of large earthquakes (M ≥ 7.0) with recurrence time intervals between 250 and 400 years, reducing northward to 100–350 years, some of which produced significant surface ruptures (e.g., the 1795 C.E. event in Kahramanmaraş; the 1874 C.E. along the Palu-Hazar Lake, 1893 C.E. at the Erkenek, 1114 C.E. and 1513 C.E. at the Pazarcik segments [29]). These studies also suggest a potential seismic gap at the Pazarcik fault segment [25,28,30,31,32,33] (Figure 1).
The February 2023 earthquakes in Kahramanmaraş and Elbistan captured the attention of the scientific community, prompting a wide range of investigation using various methodological approaches, which led to more than 60 publications in peer-reviewed journals.
Seismological data placed the nucleation of the Mw 7.8 Kahramanmaraş mainshock on the Narlı Fault (Figure 1), a secondary branch of the EAFZ, with aftershocks defining a <15 km seismogenic thickness, near-vertical fault plane, and N-S-oriented maximum horizontal stress axis, consistent with a dominant left-lateral strike-slip kinematics [34,35,36,37,38]. Coulomb stress analyzes evidence that the Kahramanmaraş mainshock promoted the Elbistan earthquake through large unclamping stress (dynamic pulse) [39,40,41].
The Mw 7.8 Kahramanmaraş earthquake produced a coseismic rupture reaching the surface, involving multiple fault segments of the EAFZ linked together, for a total length of ~340 km: the Erkenek, Pazarcık, and Amanos segments (Figure 1) (as defined in the Turkish seismic hazard model source characterization [42]), with near-fault peak ground accelerations (PGAs) exceeding 1.0 g [43].
Most of its trace was remotely sensed since the early hours: ~30 km of surface rupture mapped within 24 h from the mainshock by means of WorldView-3 and GeoEye-1 (2023 MAXAR Technologies ©) optical images; this acquisition allowed high-resolution (<1 m) mapping of the surface rupture [44], although coverage remained incomplete even one month after the event; ALOS-2 provided the first, although partial, radar observations for ~160 km of rupture after three days; European Space Agency Sentinel-1 acquisitions imaged the full extent after ~5 days.
Then, various high-resolution satellite data (ALOS-2, MAXAR Technologies ©, GF-2, Sentinel-1 and -2 synthetic aperture radar-SAR-pairs) and a few aerial orthophotos (General Directorate of Mapping in Türkiye—MTA [45]) were used to evidence the observed displacement discontinuities and/or to infer the approximate locations and extent of coseismic rupture traces [46,47,48,49,50,51]. The results present some dispersion: ruptures extend over lengths of 300–350 km, with waxing and waning of slip distribution that follows the EAFZ segmentation and maximum horizontal slip ranging from 6.0 to 7.8 m (2.0–3.0 m near the epicenter), in agreement with GNSS data [52].
Furthermore, satellite data were used for joint inversion with GNSS and seismological data to produce finite-element kinematic rupture models and deep fault plane solutions [53,54,55,56,57,58,59,60]). The Mw 7.8 rupture started on the Narlı Fault splay (a breached structural barrier characterized by more velocity-strengthening rheology), then (1) branched bilaterally onto the nearby EAFZ segments, with the northern ones accommodating more slip than the southern ones (<6 m), with high sinistral slip (up to 7 m) and reverse slip (up to 3 m) at the north-easternmost tip; (2) produced deep patches (between 3 and 7 km at depth) of maximum coseismic slip of 8–12 m, occurring on a steep, westwards dipping plane; (3) reached the surface with shallow slip deficit.
3D dynamic rupture simulations [43,61,62] observe delayed rupture initiation to the southwest, with a slow-down in rupture speed [43,63,64,65], and decelerating rupture propagation coinciding with the geometric barriers between the activated segments [58]. Due to the complexity of fault geometry, the rupture speed along the south-eastern segment of the EAF varied repeatedly between supershear and subshear, which contributed to the unexpectedly strong ground motion [64], with few super-shear patches spatially co-located with the high-slip fault segment and high inter-event micro-earthquake production [66]. The fault slip at the surface likely emerged very slowly, possibly as a very early afterslip, not as radiating seismic waves [63,67].
On-site investigations [68,69,70,71] mostly aimed at analyzing the geotechnical performance of the building environments and functionality of Turkish industrial facilities, or to collect data on secondary environmental effects (e.g., liquefactions and large-scale earthquake-induced gravitational phenomena) [72,73]. Partial results from coseismic surface ruptures surveyed indicate a total surface rupture length (Lmax) for the Mw 7.8 Kahramanmaraş earthquake between 270 and 400 km on the Karasu, Pazarcık, and Erkenek segments, with left-lateral offset of 4.0–4.5 m documented in the Islahiye area (dip-slip displacements ~0.5 m), and maximum horizontal displacement (Dmax) of 7.3 m apart from an average displacement (Davg) of 3.0 m. Moreover, little information was collected about the coseismic deformational pattern organization at the surface: narrow deformation zone width, generally of 2.0–5.0 m (locally 50 m), composed of major continuous en-echelon shear sections, several meters to tens of meters long, with a mole-track consisting of a population of dominant Riedel, and extensional shear with 15°-20° of angular difference.
Figure 1. Simplified tectonic map of the 2023 seismic sequence area. Active faults from [73]. Purple and blue lines refer to the Mw 7.8 and 7.6 causative faults, respectively. Fault segment names are in red. Focal mechanisms and instrumental seismicity from Koeri. Historical earthquake from [28]. Shaded relief from the 30 m DEM ASTER V003 (NASA/METI/AIST/Japan Spacesystems and U.S./Japan ASTER Science Team, 2019).
Geosciences 15 00252 g001

3. Materials and Methods

The field survey activities (May 2023) were prepared by a detailed review of the literature on the surface effects of the seismic sequence, integrated with new remote analyses of the evidence of faulting. Starting from [44], we analyzed newly available remote-sensing images to provide an updated and detailed line drawing of the surface faulting, integrating new findings and covering previously unobserved areas (Figure 2). Along the fault trace, we remotely measured the horizontal component of the coseismic slip where clear piercing points were observed due to the cut-off of natural, agricultural, and manufactured lineaments. These measurements helped reconstruct a comprehensive slip distribution curve by combining field data (this work and [8,14,51]) with additional remote-sensing data [44,51].
The results of this preliminary remote analysis were also crucial in planning field activities by identifying the areas where the field surveys were promising in terms of clear surface rupture expression and a relationship with the long-term landforms. Field mapping was concentrated in six key areas, distributed along the northern Karasu, Pazarcik, and southern Erkenek fault segments, in order to document the structural arrangement of the surface ruptures mole-track, to precisely measure the net offset of the near-fault Principal Displacement Zone at a very high resolution, and to validate the remotely-sensed offset estimates.

3.1. Remote Rupture Line Drawing

Over time, numerous satellite and uncrewed aerial vehicle (UAV) images of earthquake-affected areas have been published in open access. The most common platforms such as Google Earth® (GE) or OpenAerialMap (OAM; https://map.openaerialmap.org/ accessed on 20 September 2024) share images under a CC BY-NC 4.0 open license (Figure 2). Multiple images of the area are available before and after the earthquake, with different weather conditions, whose comparison enabled us to identify rupture features.
From the available satellite images provided by OAM, we used 14 satellite images (MAXAR Technologies ©, Palo Alto, CA, USA, sensors WV02/WV03; 0.3 m/pixel resolution—OAM; Appendix A). Between Hassa and Kırıkhan, within a radius of about 4 km around the Inekli Gölū Lake (between Gölbaşı and Pazarcık) and for ~44 km in the north-eastern sector (southwest of Çelikhan), no satellite images are available. Instead, for the Hassa district and only partially for the other areas, it is possible to consult the images available through Google Earth (Figure 3). We have accurately traced coseismic ruptures, including those potentially associated with shaking (such as those along the shores of Lake Gölbaşı), leaving out evidence of liquefaction and/or landslides (Supplementary Material S1).
Figure 3. (a) Location map of the optical satellite images (yellow boxes from [44]; brown and red boxes from this study). The different coseismic surface rupture traces are reported (green from [14]; brown from [44]; red from this work). Active faults in black from [74]. The inset shows a detail of the integrated data; (b) Location map of the field offset measurements from literature (yellow from [12]; green from [51]; blue from [8]) and from this work (in red). The investigated key areas (dashed red boxes) are evidenced. The inset shows a detail of the Kartal area (contour lines each 25 m; Microsoft Corporate® Bing™ Maps in the background). Shaded relief from the 30 m DEM ASTER V003 and ESRI© (Redlands, CA, USA) Topographic Map (VV.AA.) as basemap.
Geosciences 15 00252 g003

3.2. Fieldwork

The data collection aimed to document in detail (submeter-scale, with dense observation points, nearly 10 m spaced) the arrangement of the surface ruptures mole-track (i.e., deformed and upheaved ground; see [75] and references therein) through the classical morphotectonic and structural geology approaches.
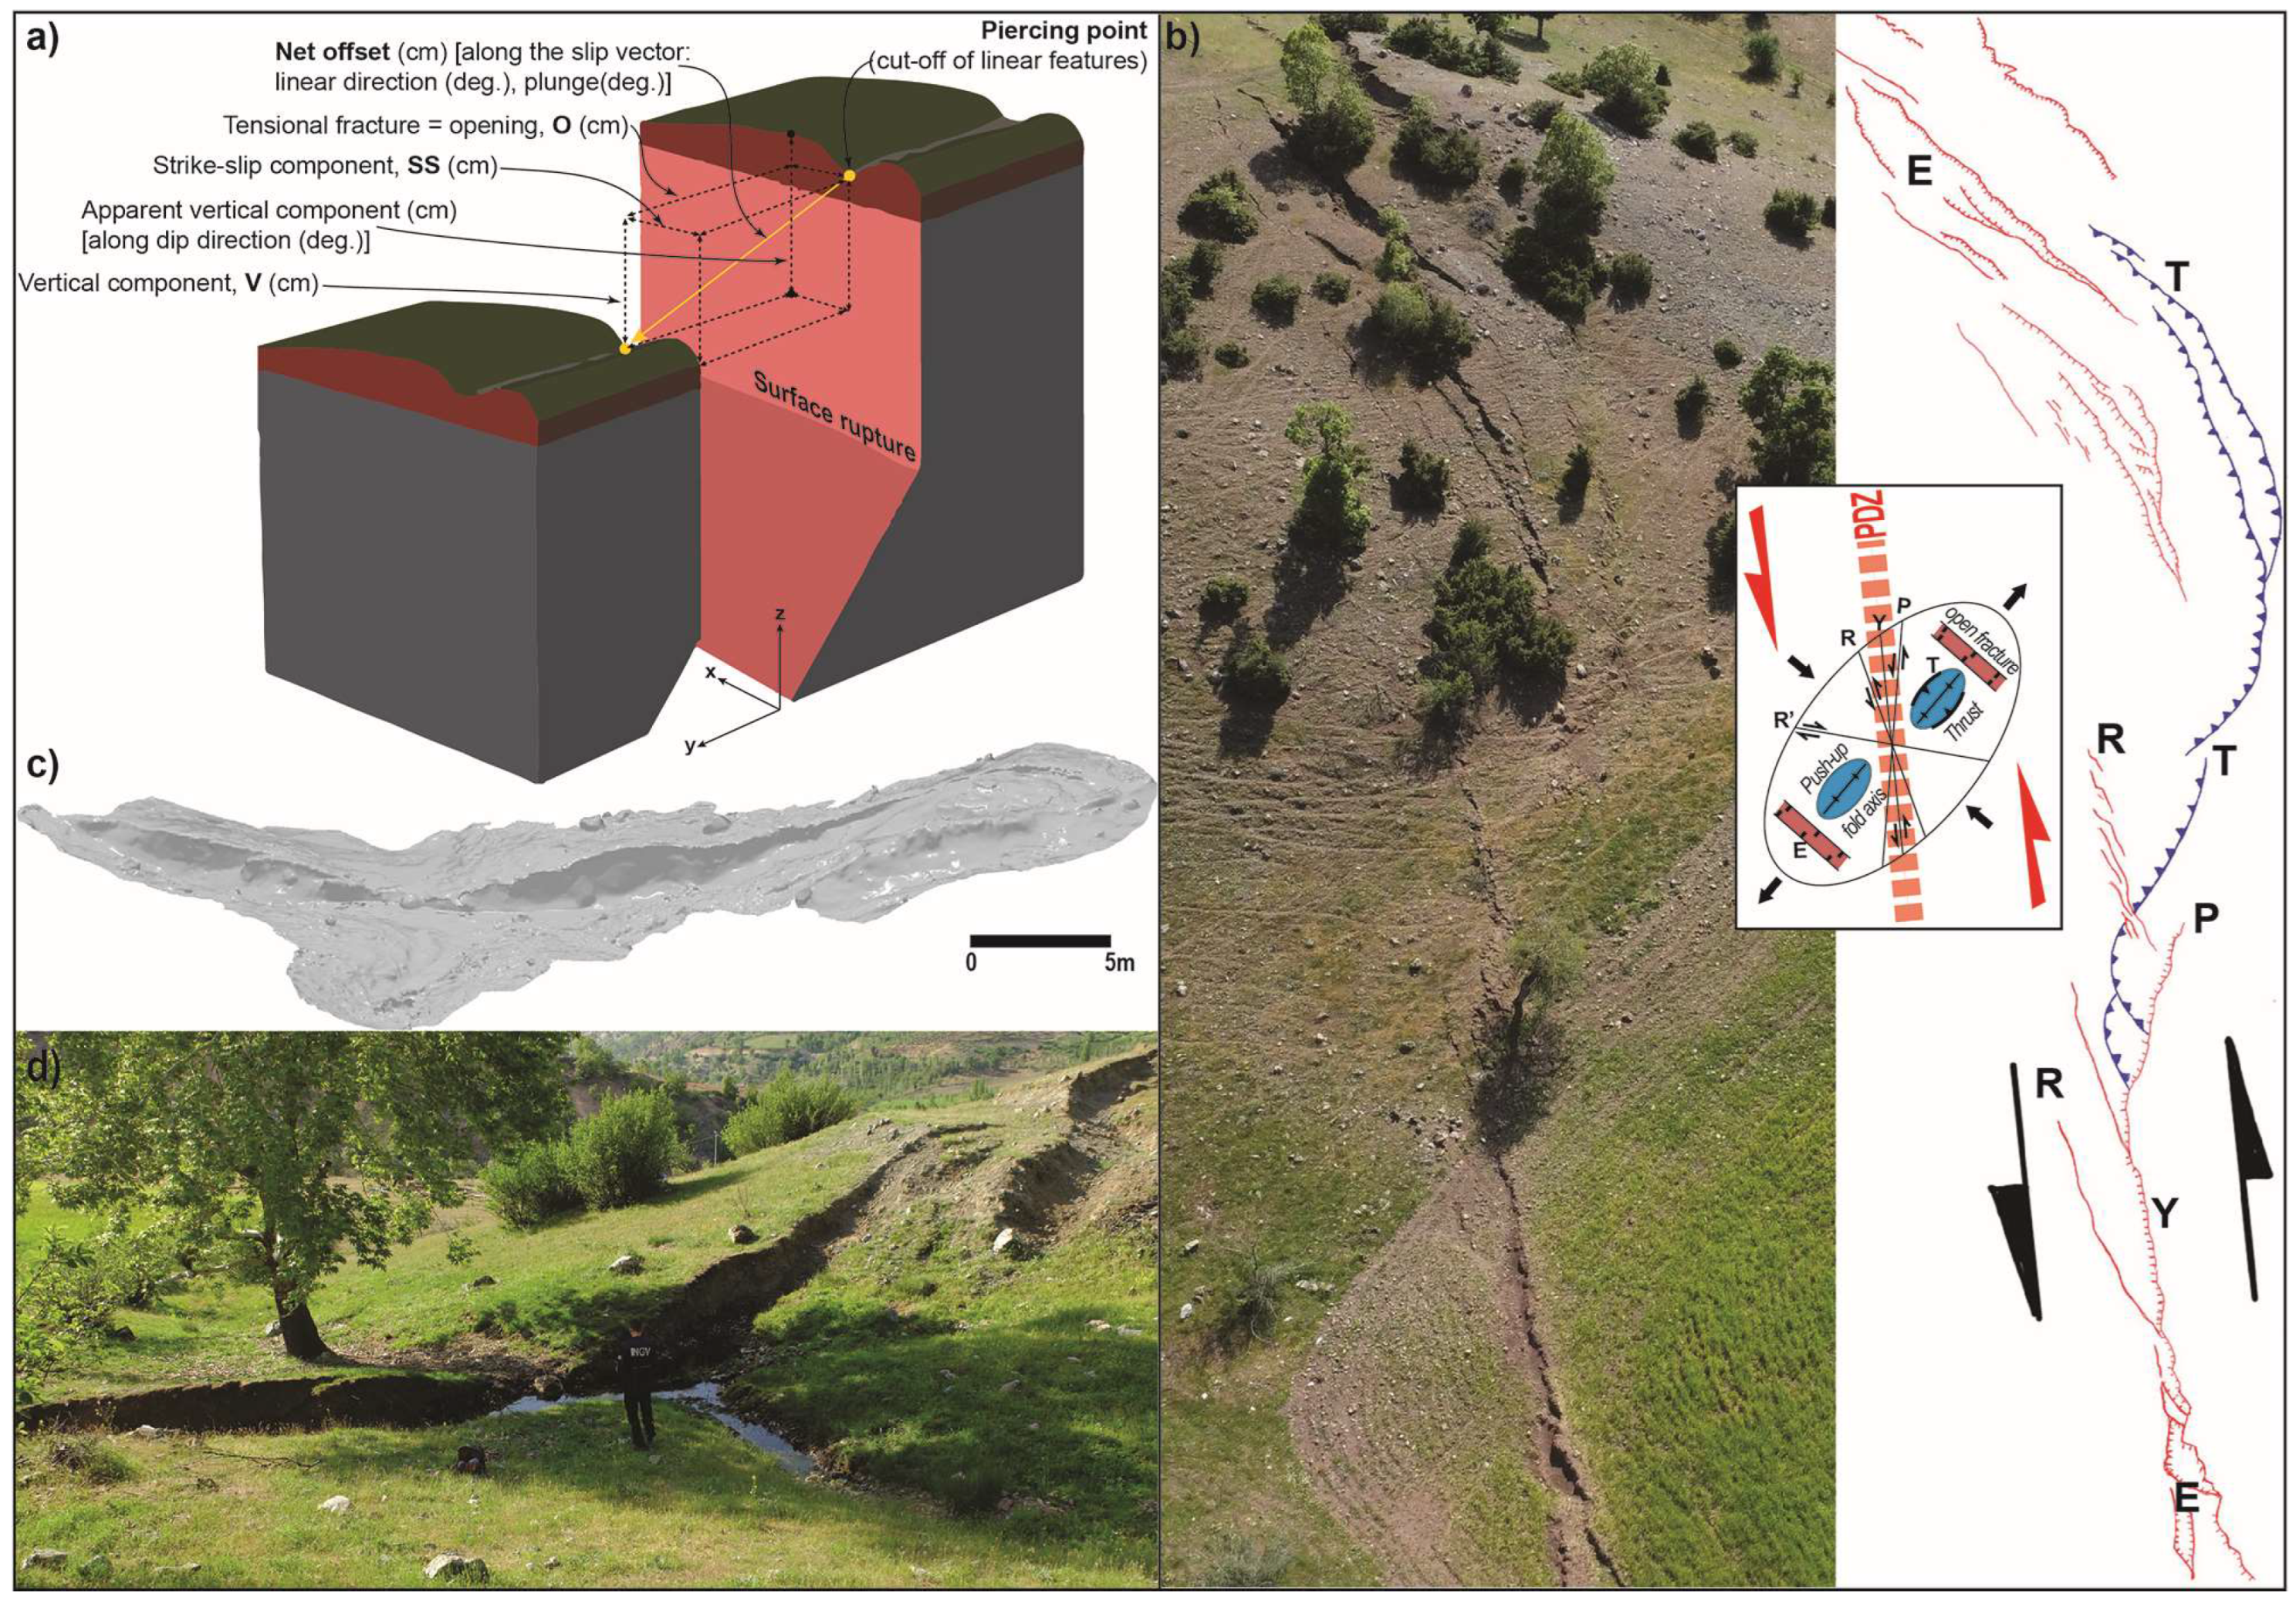
The structural data were mapped following the classification scheme proposed by the Emergeo Working Group [76,77], gathering the orientation (e.g., dip direction, dip angle—if measurable in loose deposits) and measuring the different components of the offset (i.e., opening, throw, and horizontal slip) (Figure 4a). These structural data are useful for the kinematics attribution (tensional and dip-slip, reverse and strike-slip fractures, or their combination—hybrid, transtensional, transpressive), in particular, when the direct measurement of the slip vector is not available due to the lack of unequivocal cut-off of piercing elements on the matching fault blocks (i.e., formerly adjacent points on the opposite sides of a rupture). In case of well-preserved and reliable piercing points, the coseismic slip vectors’ orientation (trend and plunge) was used for the kinematics reconstruction and to measure the net displacement of the fractures. When possible, instead of a general “coseismic rupture” attribute, a theoretical typology (from infinitesimal plain strain) was assigned to the surveyed structure composing the mole-track (e.g., coseismic conjugate Riedel (R and R’), extensional fracture (T-shear), Y-shear and P-shears; folded mound—push-up—axis and flexural opening, turf rolls—push-up—thrust, etc.) (Figure 4b). We did this being aware that the finite coseismic deformation tends to rotate the early structures (from the theoretical angle with the general fault trend) and also forms mixed-mode “Griffith” fractures (hybrid fractures), which displace according to both shear and extensional components due to near-surface failure (for details see [75]). In addition, the general trend of the rupture (Principal Displacement Zone—PDZ) was measured in the field, as well as some sub-parallel rupture spacing, local stepover, and deformation zone width.
Apart from the net offset obtained by means of recognizable piercing points as cut-offs of natural linear features (e.g., streams, terrace riser edges, morphological axis, etc.), several linear cultural features were used to measure coseismic dislocations (e.g., fences, roads, tree lines, walls, pavements, etc.). Displacements were measured and validated through the comparison of the same piercing points on pre-earthquake Google Earth® images. In order to get the offset (d) representative of the shallow fault motion, in the absence of a clearly preserved cut-off, we projected the linear features on the PDZ, by measuring their trend (LFtrend and PDZ) and the orthogonal separation (x), and by applying Formula (1):
d = x/[sin (PDZ (deg) − LFtrend (deg)].
Tapes, rulers, rods, and Leica Geosystems AG© (Heerbrugg, Switzerland) DISTO™ laser distance meters were used for measuring length and offset components of the ground ruptures. For all data, individual uncertainties are on average < 20% of the preferred value.
The field data collection was supported by digital mobile devices (rugged tablet and smartphones with Android-based OS) equipped with a specific software employing built-in GPS, and a calibrated compass (Rocklogger©, https://rockgecko.com/, accessed on 20 May 2024), which enable an accurate sampling of georeferenced structural data along with correlated information (e.g., type of structure, affected lithology, offset, length, notes, etc.; following the spreadsheet proposed by the Emergeo Working Group [78,79]) and also allow real-time sharing.
In addition to full-frame digital single-lens reflex camera (DSLR) documentation (~4000 shot; [80]) supplied by a GNSS module, we produced some exemplar expeditious LIDAR-derived models of the meter -scale expression of the surface faulting, obtained by a handheld device (Apple™ iPad Pro®) and dedicated software (Polycam® 2025) (Figure 4c,d).
A user-friendly, <250 g in weight DJI™ Mini2® drone was employed for a total of >3 h of flight in manual mode with a flight altitude ranging between 30 and 80 m above ground level. In this way, we obtained an aerial perspective for wide land surveying (i.e., efficient search of coseismic ruptures location) and for high-resolution digital surface model (DSM) reconstruction. The drone was equipped with a 12-megapixel camera (CMOS Sony™ 1/2.3″ sensor; 24 mm lens) and a non-RTK (Real-Time Kinematic) GNSS unit (GPS, GLONASS and Galileo constellations), allowing it to take more than 200 aerial photographs per area.
The post-processing elaboration by Structure-from-Motion (SfM) techniques [81], by means of Agisoft ™ Metashape® 2.1.1 software, allowed us to create ~0.2 m/px-resolution Digital Surface Models (DSMs), covering each of the six key areas (~1.2 km along-strike length * ~0.3 km width). Along with additional derivative products (i.e., shaded relief and ortho-photomosaic), DSMs were supplied: on one hand, with no precisely surveyed (e.g., RTK-enabled GNSS receiver) ground control points, holding a horizontal uncertainty of ~3.0 m; on the other hand, testing the positioning reliability of the renderings (provided by the drone on-board GNSS/IMU (Inertial Measurement Unit) by checking the reference field measure of distance between recognizable objects (±<5% horizontal).
In all the investigated key areas, Esri© ArcGIS Pro® 3.4.3 GIS platform, plotted field data, DSMs, and derivatives allowed a detailed remote mapping of the rupture pattern, by conducting coseismic features line drawing, morphological interpretation, structural analysis, and remote measurements of the horizontal slip component.
Figure 4. (a) Block diagram of the measured offset components; (b) example of differences between the theoretical typology of the structure composing the mole-track (see text for details) and the coseismic ruptures observed on the field in the Kisik area. Note that the large coseismic deformation tends to rotate the fracture pattern, diverting from the theoretical angle with the fault trend (inset); (c) example of quick terrestrial acquisition by a tablet equipped with a LIDAR sensor (Lat. 7.618485°, Long. 37.387209°; location in Figure 3b). Here the stream is dammed by a left-lateral offset of 3.0 m with a vertical offset of 50 cm; (d) Picture from SW of the same site.
Geosciences 15 00252 g004

4. Results

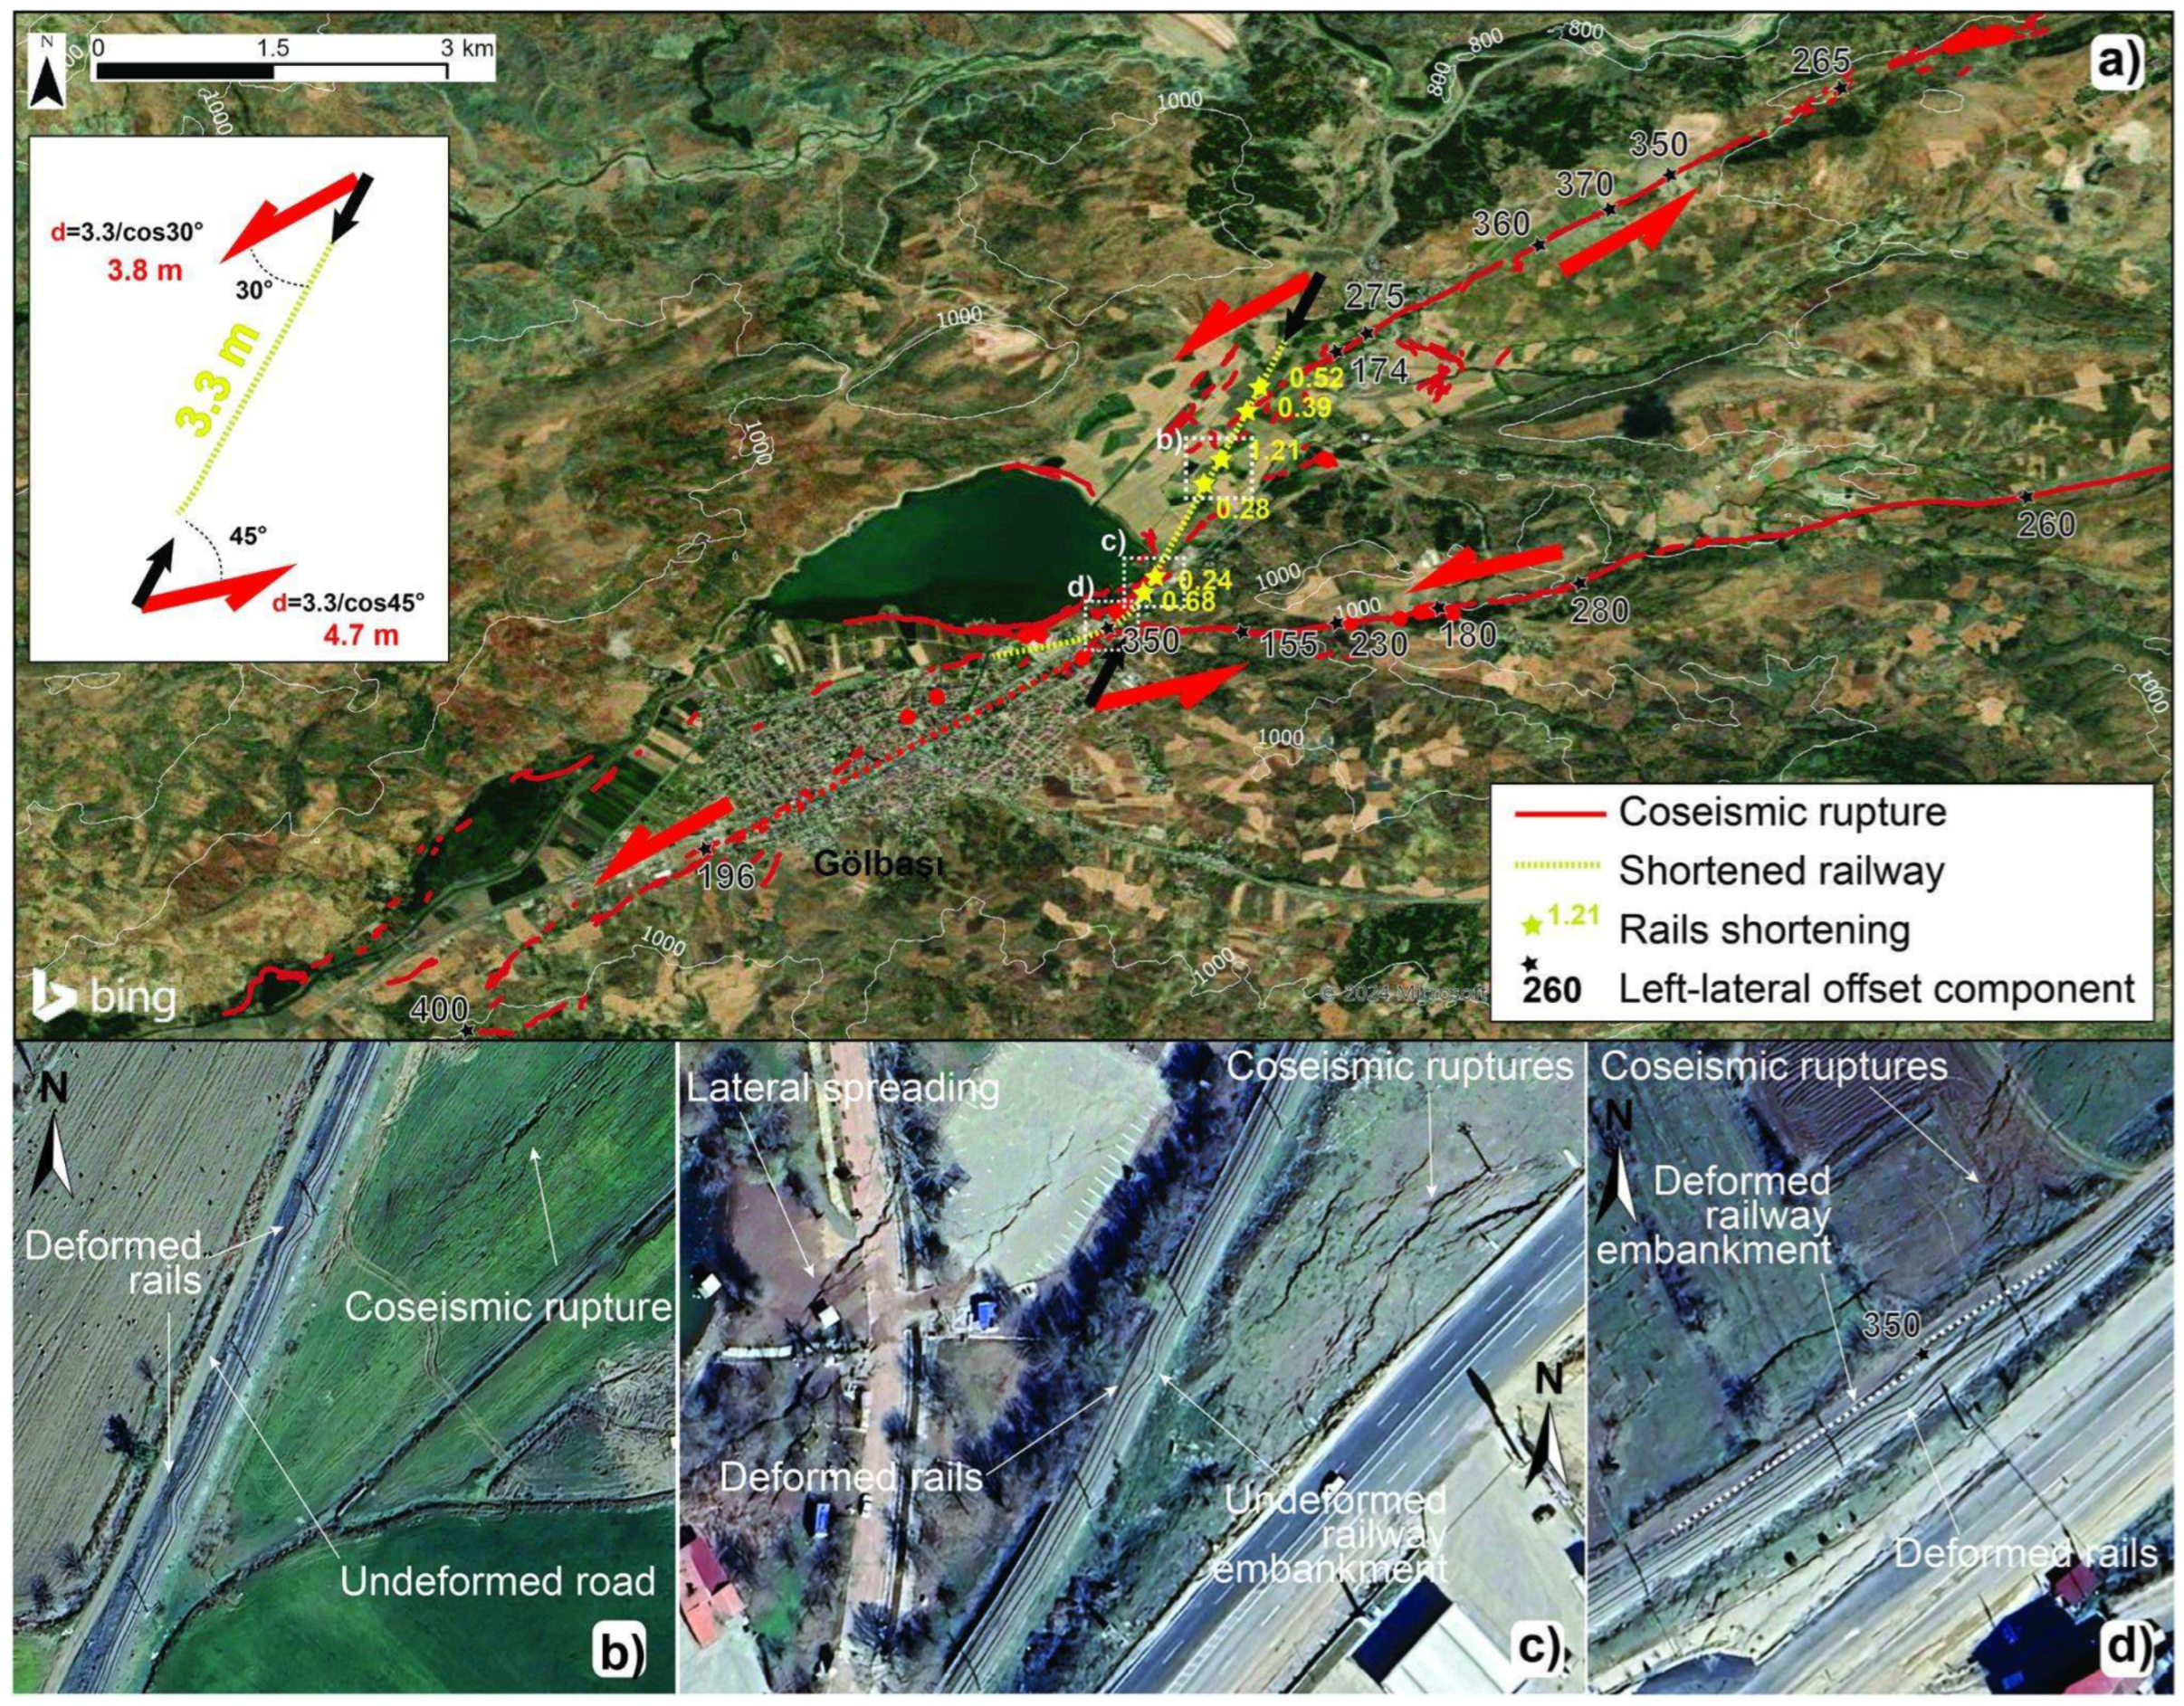
The remotely sensed images allowed us to do the following: (1) fill the gaps of the discontinuous surface rupture traces, in particular along the 40 km long stretch near Hassa and northeast of Harmanlı; (2) enhance the detail of the rupture’s arrangement, by revealing the large-scale (hundreds-of-meters) multi-stranded pattern and the main geometrical complexities; (3) increase and extend the identification and characterization of distributed ground cracking and lateral spreading affecting the fluvial/lacustrine deposits at the southernmost tip of the fault and in the Gölbaşı lake area; (4) observe and interpret the railway warping in the Gölbaşı plain.
The fieldwork, focused on six key areas, highlighted distinct characteristics of surface faulting. Their high-resolution rupture arrangement, representing an episode of the ongoing development of long-term morphological features, was documented and interpreted as a product of the interaction between the shallow-depth structural style and local stress field. Their in-depth reconstruction allowed a comprehensive contextualization and a reliable estimate of the fault offset.

4.1. Coseismic Rupture Reconstruction: Small-Scale Characteristics

The 2023 coseismic rupture follows ~290 km of the pre-existing surface expression of the EAF System, from north of the city of Antioch (Antakya) in the south-west, to Çelikhan in the north-east (Figure 3a). On a smaller scale, it appears as a quasi-continuous, single-stranded surface rupture with three major secondary branches, which diverge up to ~10 km from the main trace. These branches include a ~10 km long, ~N-S-trending section south of Kırıkhan (Hatay province); a ~35 km long, ~NNE-SSW-trending Narlı section (Pazarcık district/Kahramanmaraş province); and a ~20 km long, ~WSW-ENE-trending Gölbaşı-Meryemuşağı (Tut district/Adıyaman province) section (hereinafter referred to as Cakmak section) (Figure 3).
South of Çiğli (Dulkadiroğlu district/Kahramanmaraş province), the coseismic rupture bounds the western side of the <20 km wide alluvial valley (Karasu Basin; Figure 3b). North of Çiğli, at the Narlı Fault branch, it starts to run over hilly/mountainous morphologies, mostly followed by the thalweg of linear drainages. Reaching the Gölbaşı area, it flanks the <3.5 km wide plain for ~25 km, then, at the Cakmak section branch, it starts to run again over rugged terrains, up to Çelikhan.
A closer view of the surface rupture zone reveals geometrical complexities coinciding with major stepovers or bends between kilometric sections (Figure 5 and Figure 6) and associated long-term tectonic landforms. From south to north, the most evident complexities are highlighted. The extensional underlapping left step between Antakya and Kırıkhan (Figure 5a) produced distributed deformation, as part of a trailing horsetail splay possibly related to the extensional quadrant at the rupture tip. The restraining bend at Yuvalı (Figure 5b) forms a transpressional duplex with splays defining a morphological flake whose southwestern steep flank is strongly affected by coseismic rockfalls. The single strand is frequently associated with forebergs (i.e., tectonic landforms characterized by low, elongated ridges or hills rising above the surrounding alluvial fans or floodplains), close to Hacılar (Figure 5c), where the long-term cumulative slip is evidenced by the deflected stream (250–300 m, left-lateral) and by the vertical separation of the alluvial depositional surface (60–80 m). At the Altınüzüm village, another transpressional duplex is associated with a long-term river valley deflection (Figure 5d). Conversely, at Islahiye, an extensional, 1.5 km wide left stepover coincides with a left bend and defines a releasing junction (sensu [82]) characterized by seasonal ponding (Figure 5e). South of Türkoğlu, the coseismic rupture runs for a few kilometers in the middle of the plain, locally showing distributed deformation (including a 4 km long parallel strand, 3.5 km apart) and diffuse liquefactions (Figure 5f).
Moreover, it is also possible to observe that at the major right bend (southern Pazarcık segment boundary), the rupture trace runs at the pediment with local forebergs and moving to the north, the trace shows a marked linear trajectory with some gentle bend and a narrow displacement zone, locally extending to few hundreds of meters with parallel strands. At the Kisik area, a restraining bend of ~20° results in the widening (up to 1.5 km) of the dislocation zone, with parallel multi-strand, and branching of a 2.5 km long contiguous section (Figure 6a). At the Gölbaşı area (Figure 6b), after a left step, the contractional right bend of the main strand (15°–20°) coincides with the major Cakmak section branching, occurring at a similar angle (~25°), with ~4.5 km of spacing. Eastward, the main strand presents a discontinuous ~10 km long section with distributed deformation (up to 1.5 km wide) and after Çelikhan, the northern rupture tail also bends to the right (15°–20°) through a transpressional duplex (Figure 6c).
Figure 5. Examples of geometrical complexities of the coseismic ruptures trace (Figure 3b for location): (a) extensional underlapping left step producing distributed deformation; (b) restraining bend at Yuvalı; (c) single strand associated with forebergs; (d) transpressional right-hand bend; (e) extensional left bend forming a releasing junction; (f) distributed deformation at Türkoğlu.
Geosciences 15 00252 g005
Figure 6. Examples of geometrical complexities of the coseismic ruptures trace (Figure 3b for location): (a) gentle right bend (restraining) at Kisik; (b) restraining junction at Gölbaşı; (c) the northern rupture tail at Çelikhan.
Geosciences 15 00252 g006

4.2. The Gölbaşı Railway Deflections

In the Gölbaşı area, peculiar severe deflections of the rail track are concentrated (Figure 7). The geometry of the transverse warping is variable, with the horizontal sinusoidal shape showing different trends in bending. The wavelength ranges from 15 to 35 m and the amplitude does not exceed 1.5 m. Aside from one case (Figure 7d), the observed warp (e.g., Figure 7b,c) (1) does not coincide with the intersection of an outcropping rupture strand; and (2) does not show a lateral dislocation of the railway path of its embankment or of parallel linear features (such as roads or fences). Each anomalous warping appears to accommodate a shortening in the order of a few decimeters. With respect to the coseismic principal deformation zone (PDZ), some of these warpings are located in the area of a releasing step, at the left side of the right bend (Figure 7a). Here, the rectilinear path of the affected railway is aligned with the compressional component of the shear couple (Figure 7a). By summing up each of the six main warpings, the calculated left-lateral shearing required to obtain the net shortening is estimated at 4 m, in agreement with the punctual measurements collected in the area. The substratum of the affected railway mainly consists of soft, fine-grained, unconsolidated lacustrine and alluvium deposits filling the tectonic basin, with the coseismic rupture spreading across multiple, distributed strands. The rheology of the substratum and the extensional environment distribute the coseismic slip, while the rigid steel rail, decoupled from the base, transmits pressure over long distances, locally producing plastic deformation. Considering the clustered distribution and the amount of net shortening, which is comparable to the coseismic dislocation, we exclude the possibility that such railway deformations are produced by dynamic stresses associated with seismic waves.

4.3. Coseismic Rupture: Outcrop Scale Documentation

Overall, more than 600 structural and geomorphic data points (see Data Availability Statement) along with ca. 4000 photos were acquired in the field.
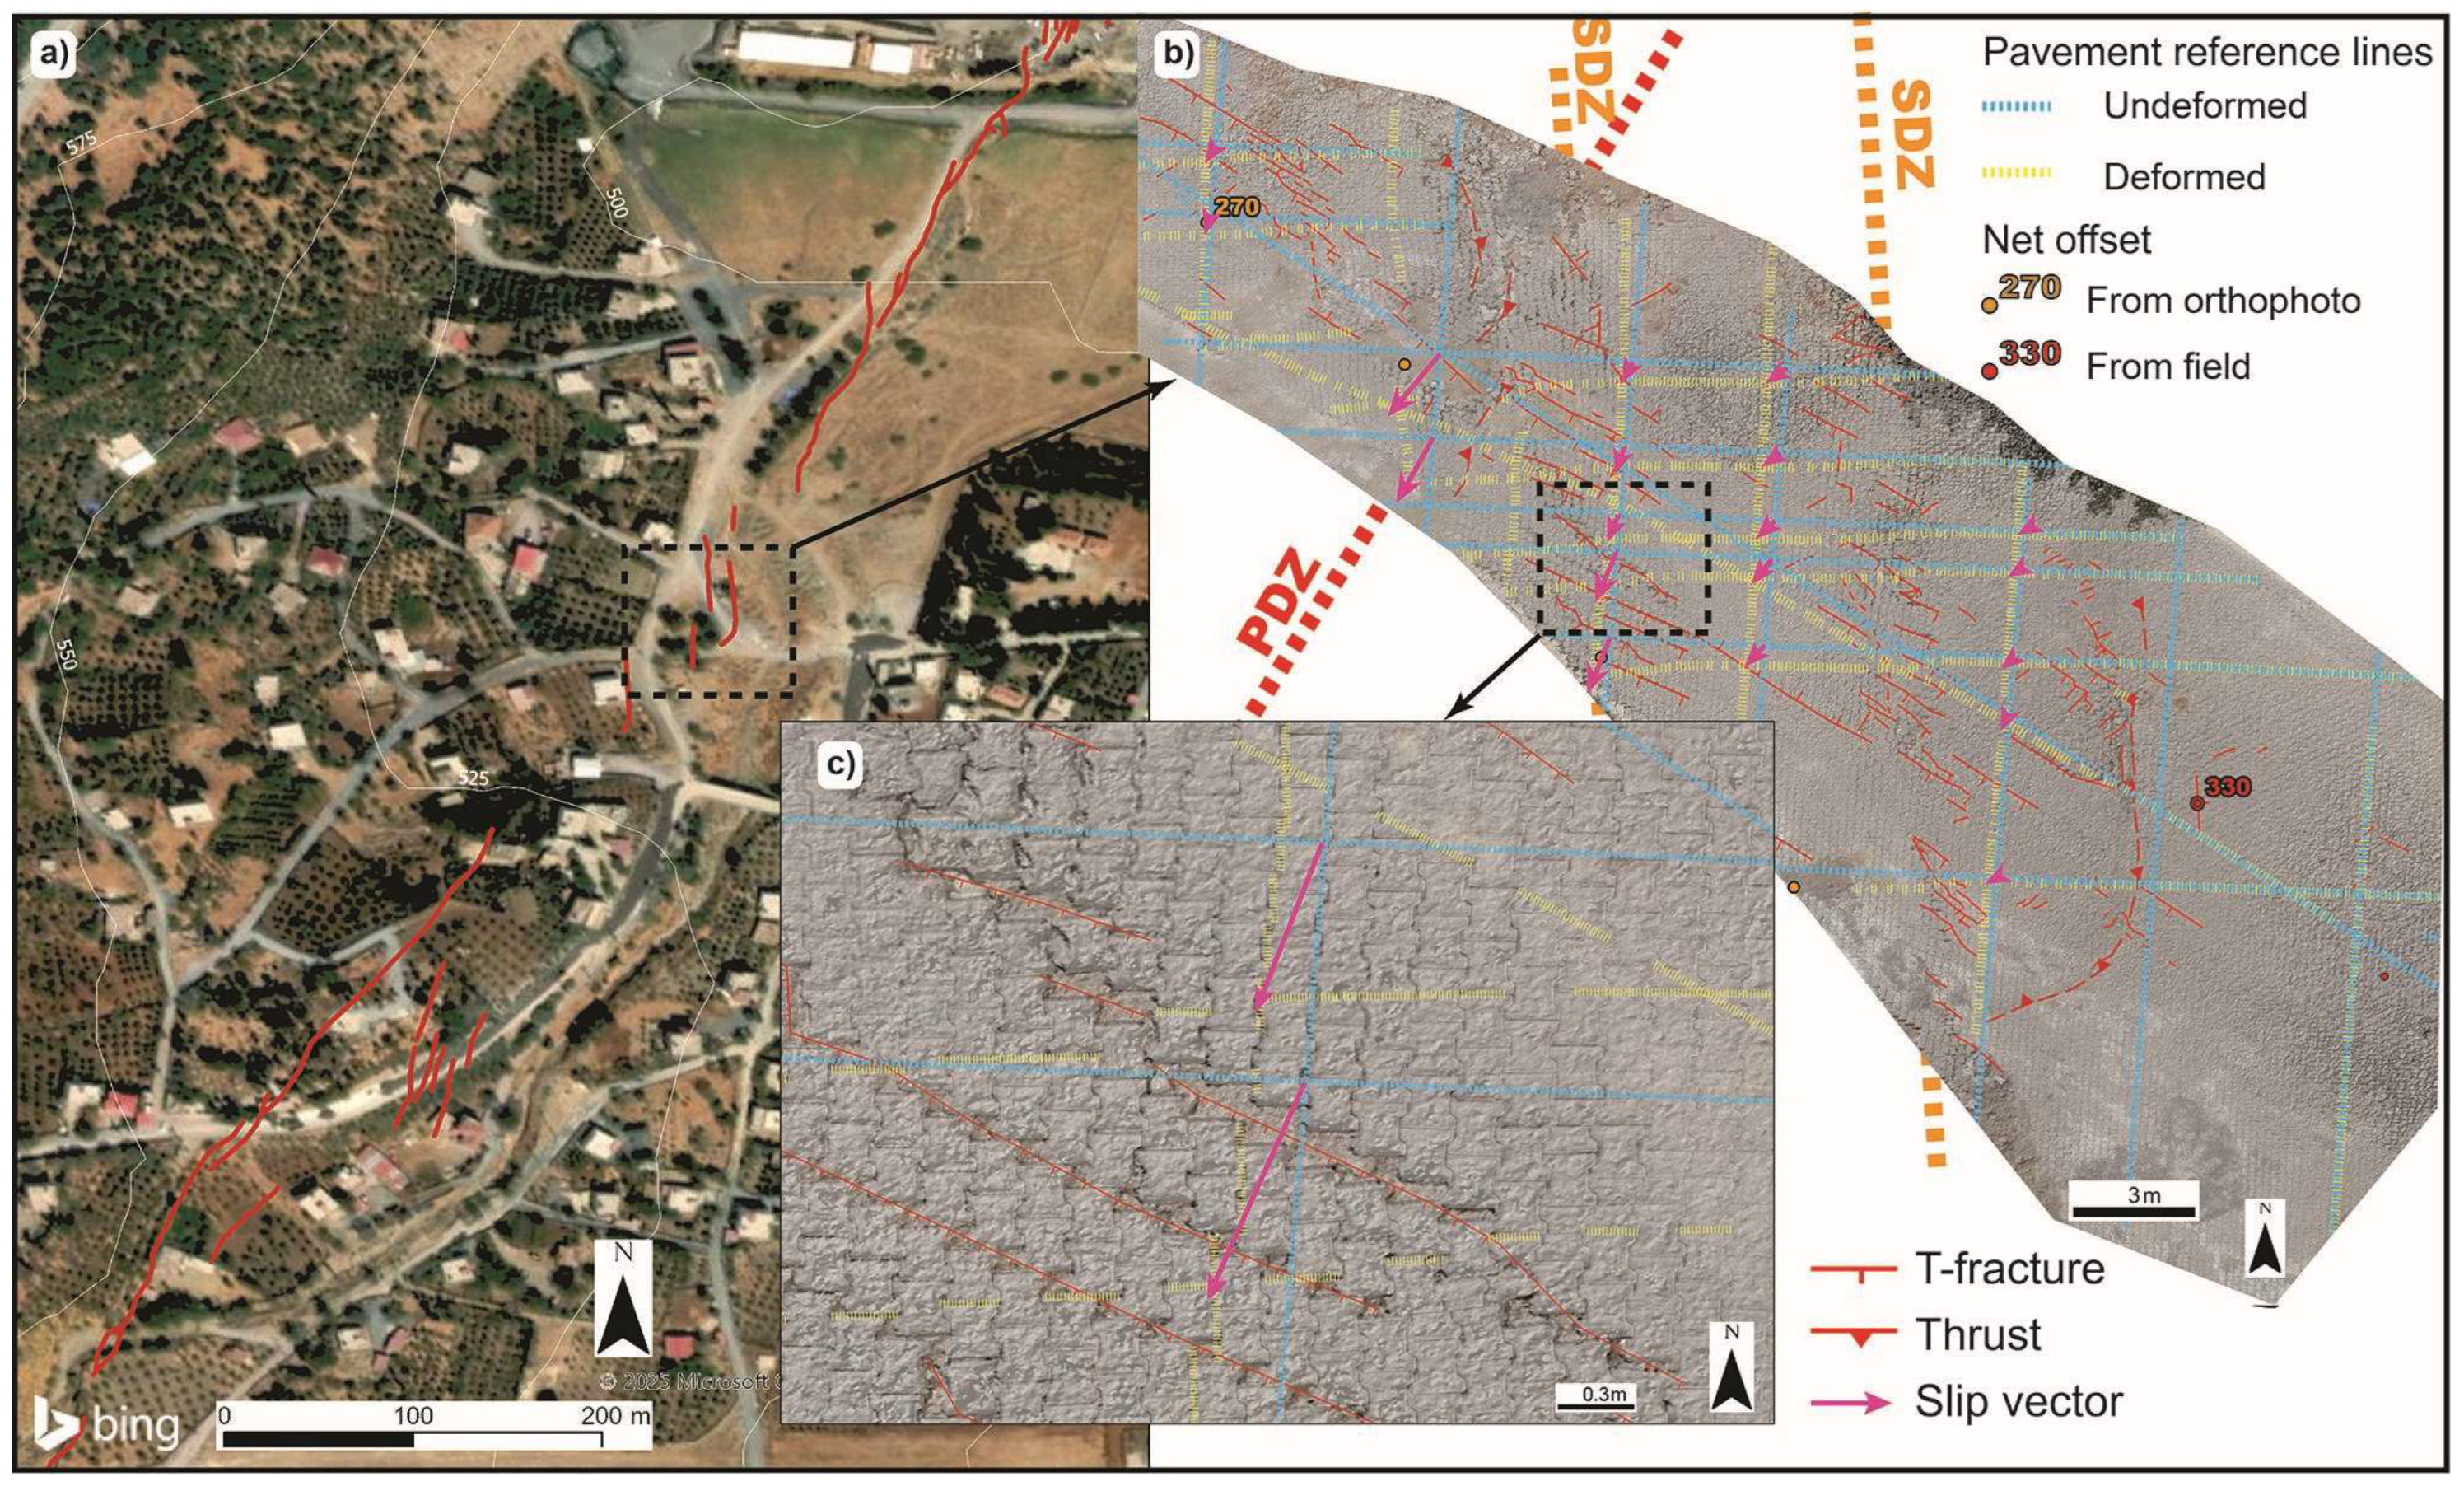
At the outcrop-scale, the coseismic surface rupture was easily detectable because of its distinctive fresh appearance, without natural surface processes reworking the original geometry. The surface faulting can be followed quasi-continuously: it is frequently composed by a single strand and occasionally by multiple, parallel splays. It is composed of major continuous right-stepping en-echelon shear sections, several meters to tens of meters long (Single Displacement Zones -SDZ), whose envelope is aligned with the Principal Displacement Zone (PDZ; i.e., trend of the main rupture plane). The mole-track of the SDZ is composed of a population of (1) dominant Riedel and extensional shear with low horizontal shear component accompanied by vertical and opening components, which reflect the amount of general transpressional or transtensional kinematics of the SDZ by forming up to 10 m in scale prevalent pull-aparts or push-ups; (2) frequent Y-shears, connecting rotated Riedel shears and thrusts, where the rupture localizes and accommodates larger slip; and (3) recurrent turf rolls of rotated push-ups affected by flexural hinge fractures. Figure 8 shows a paved road deformed by multiple parallel SDZs (Figure 8a) disclosed by the alignment of dominant en-echelon Riedel shears (Figure 8b). The displaced tiles allowed reconstructing the undeformed reference frame useful for dislocation field imaging and slip vector setting. The slip vectors are mostly orthogonal to the Riedel shears, as expected for T-shears, and parallel the shearing along the PDZ (Figure 8c). The net left-lateral slip of 270 cm is unevenly accommodated by the two parallel SDZs, across more than 20 m of rupture core width.

4.3.1. Key Area: Bademli, Nurdağı District
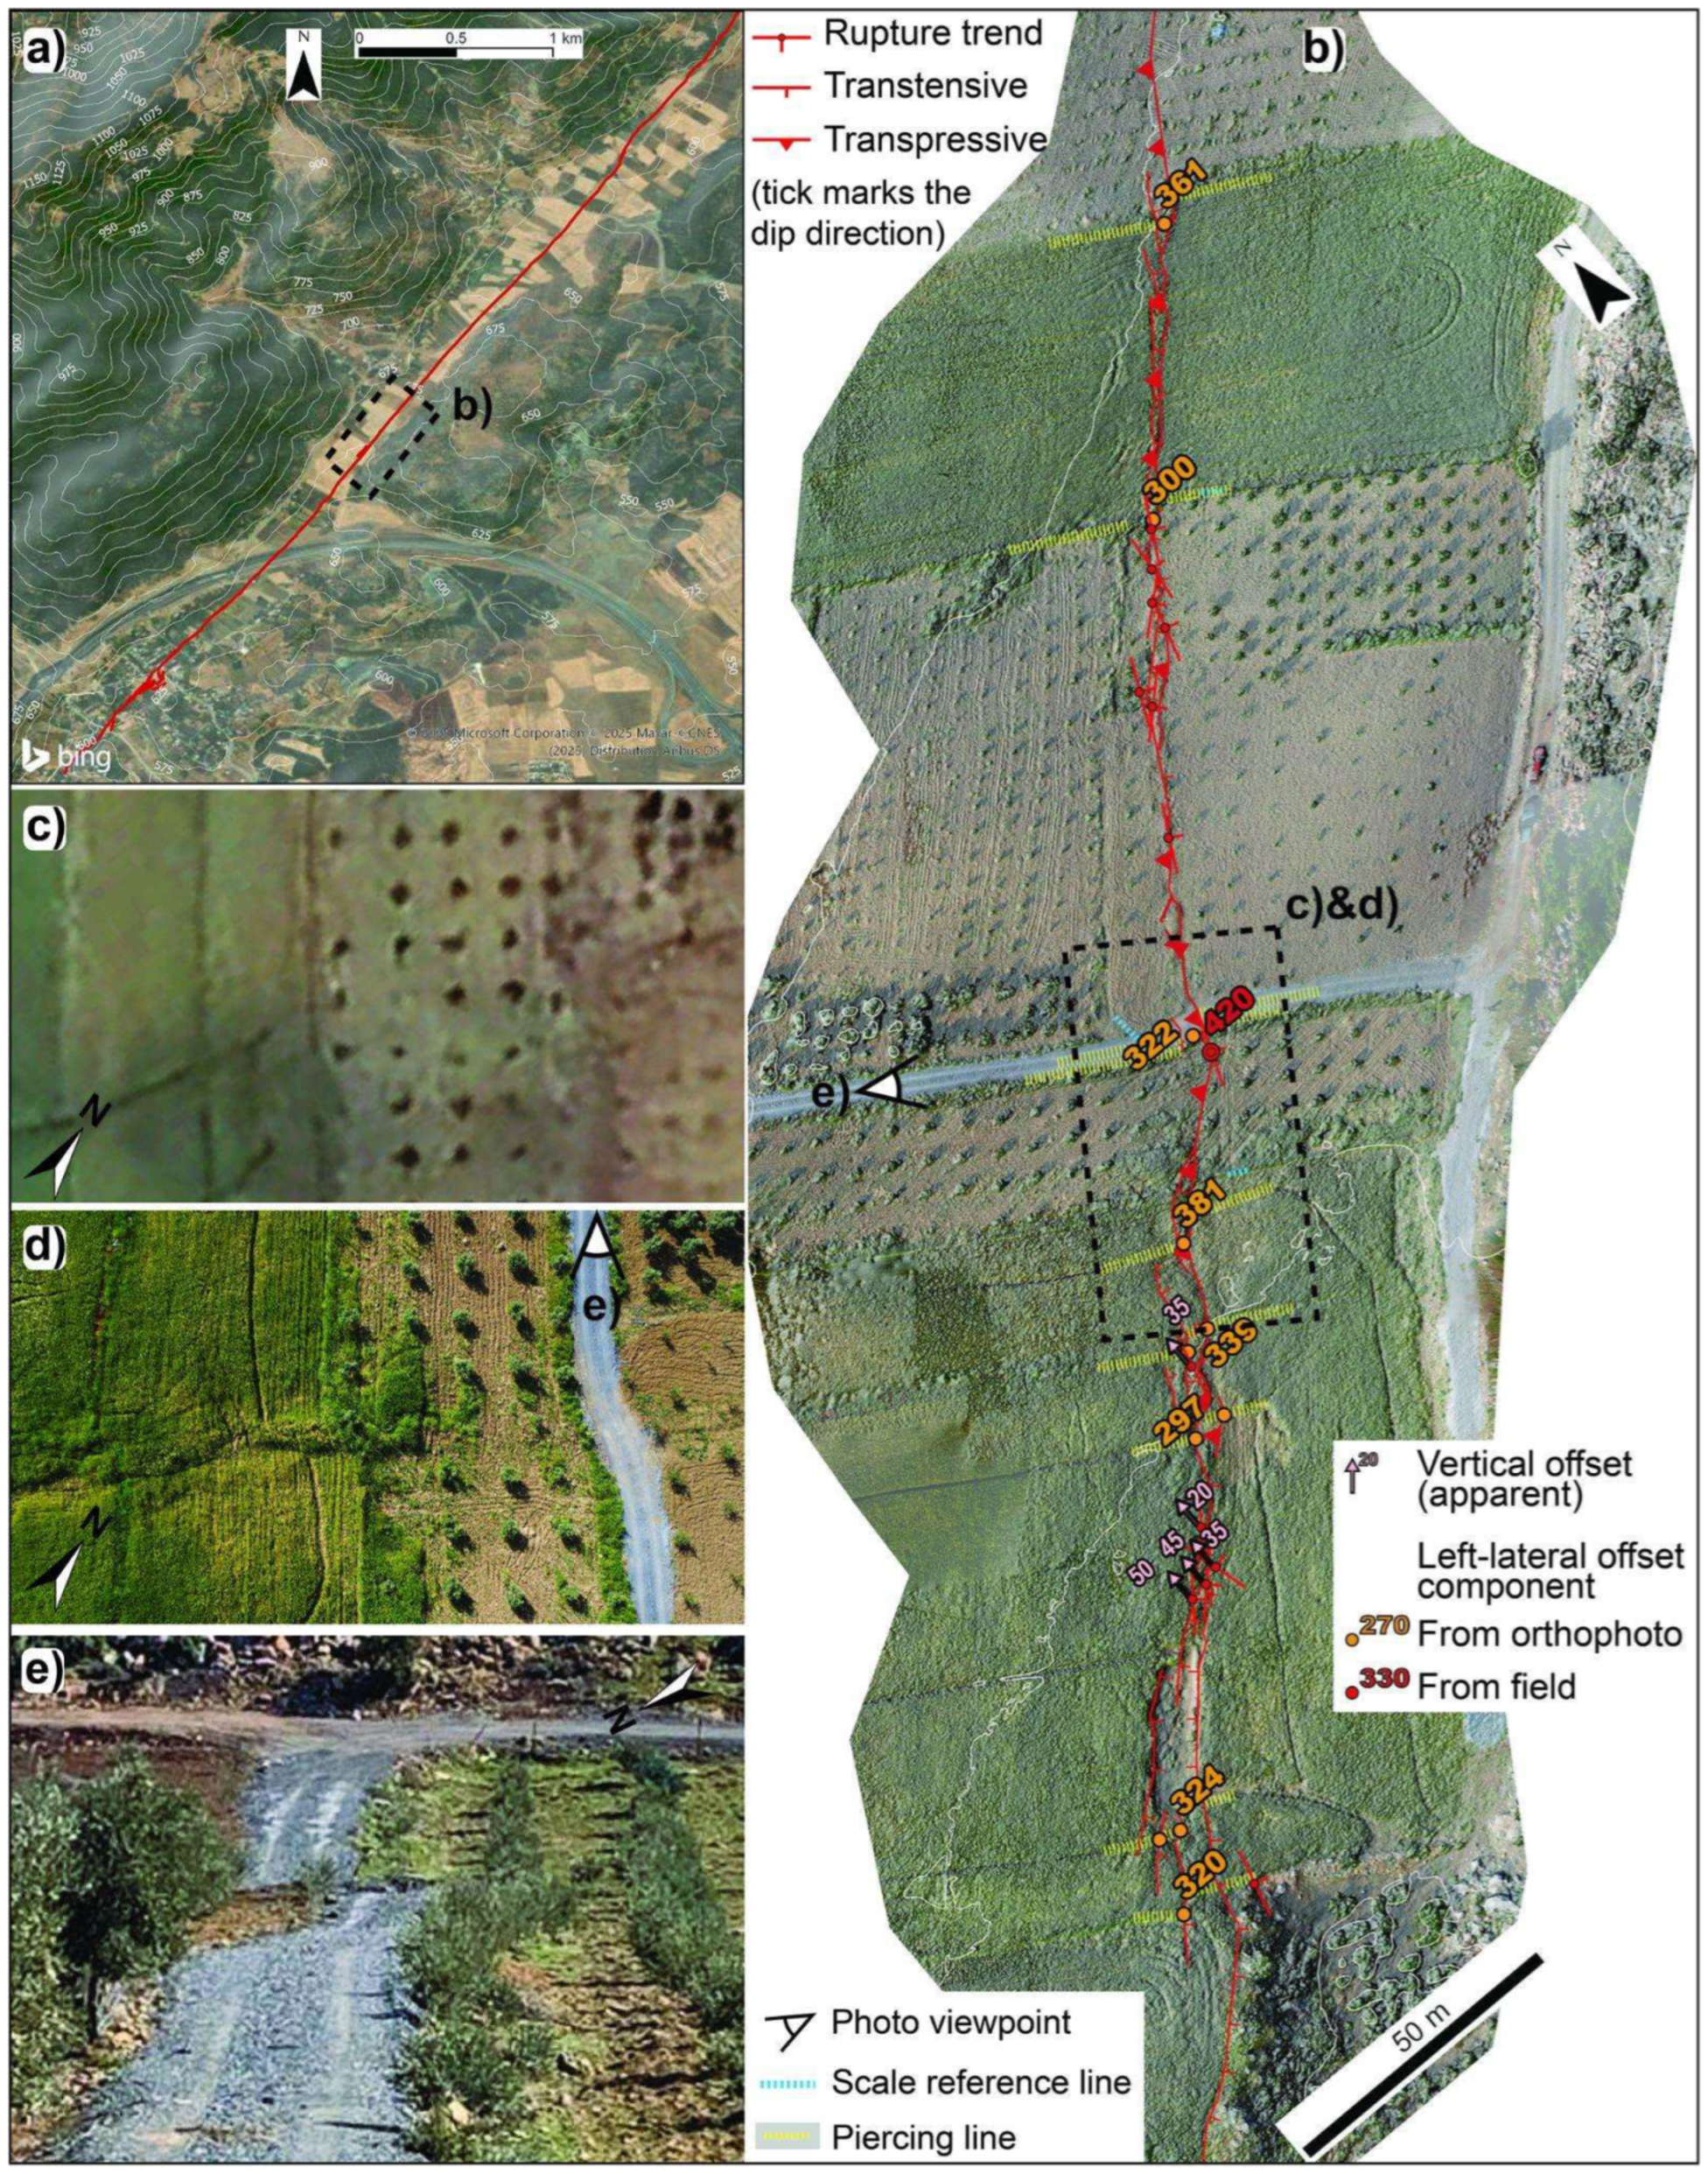
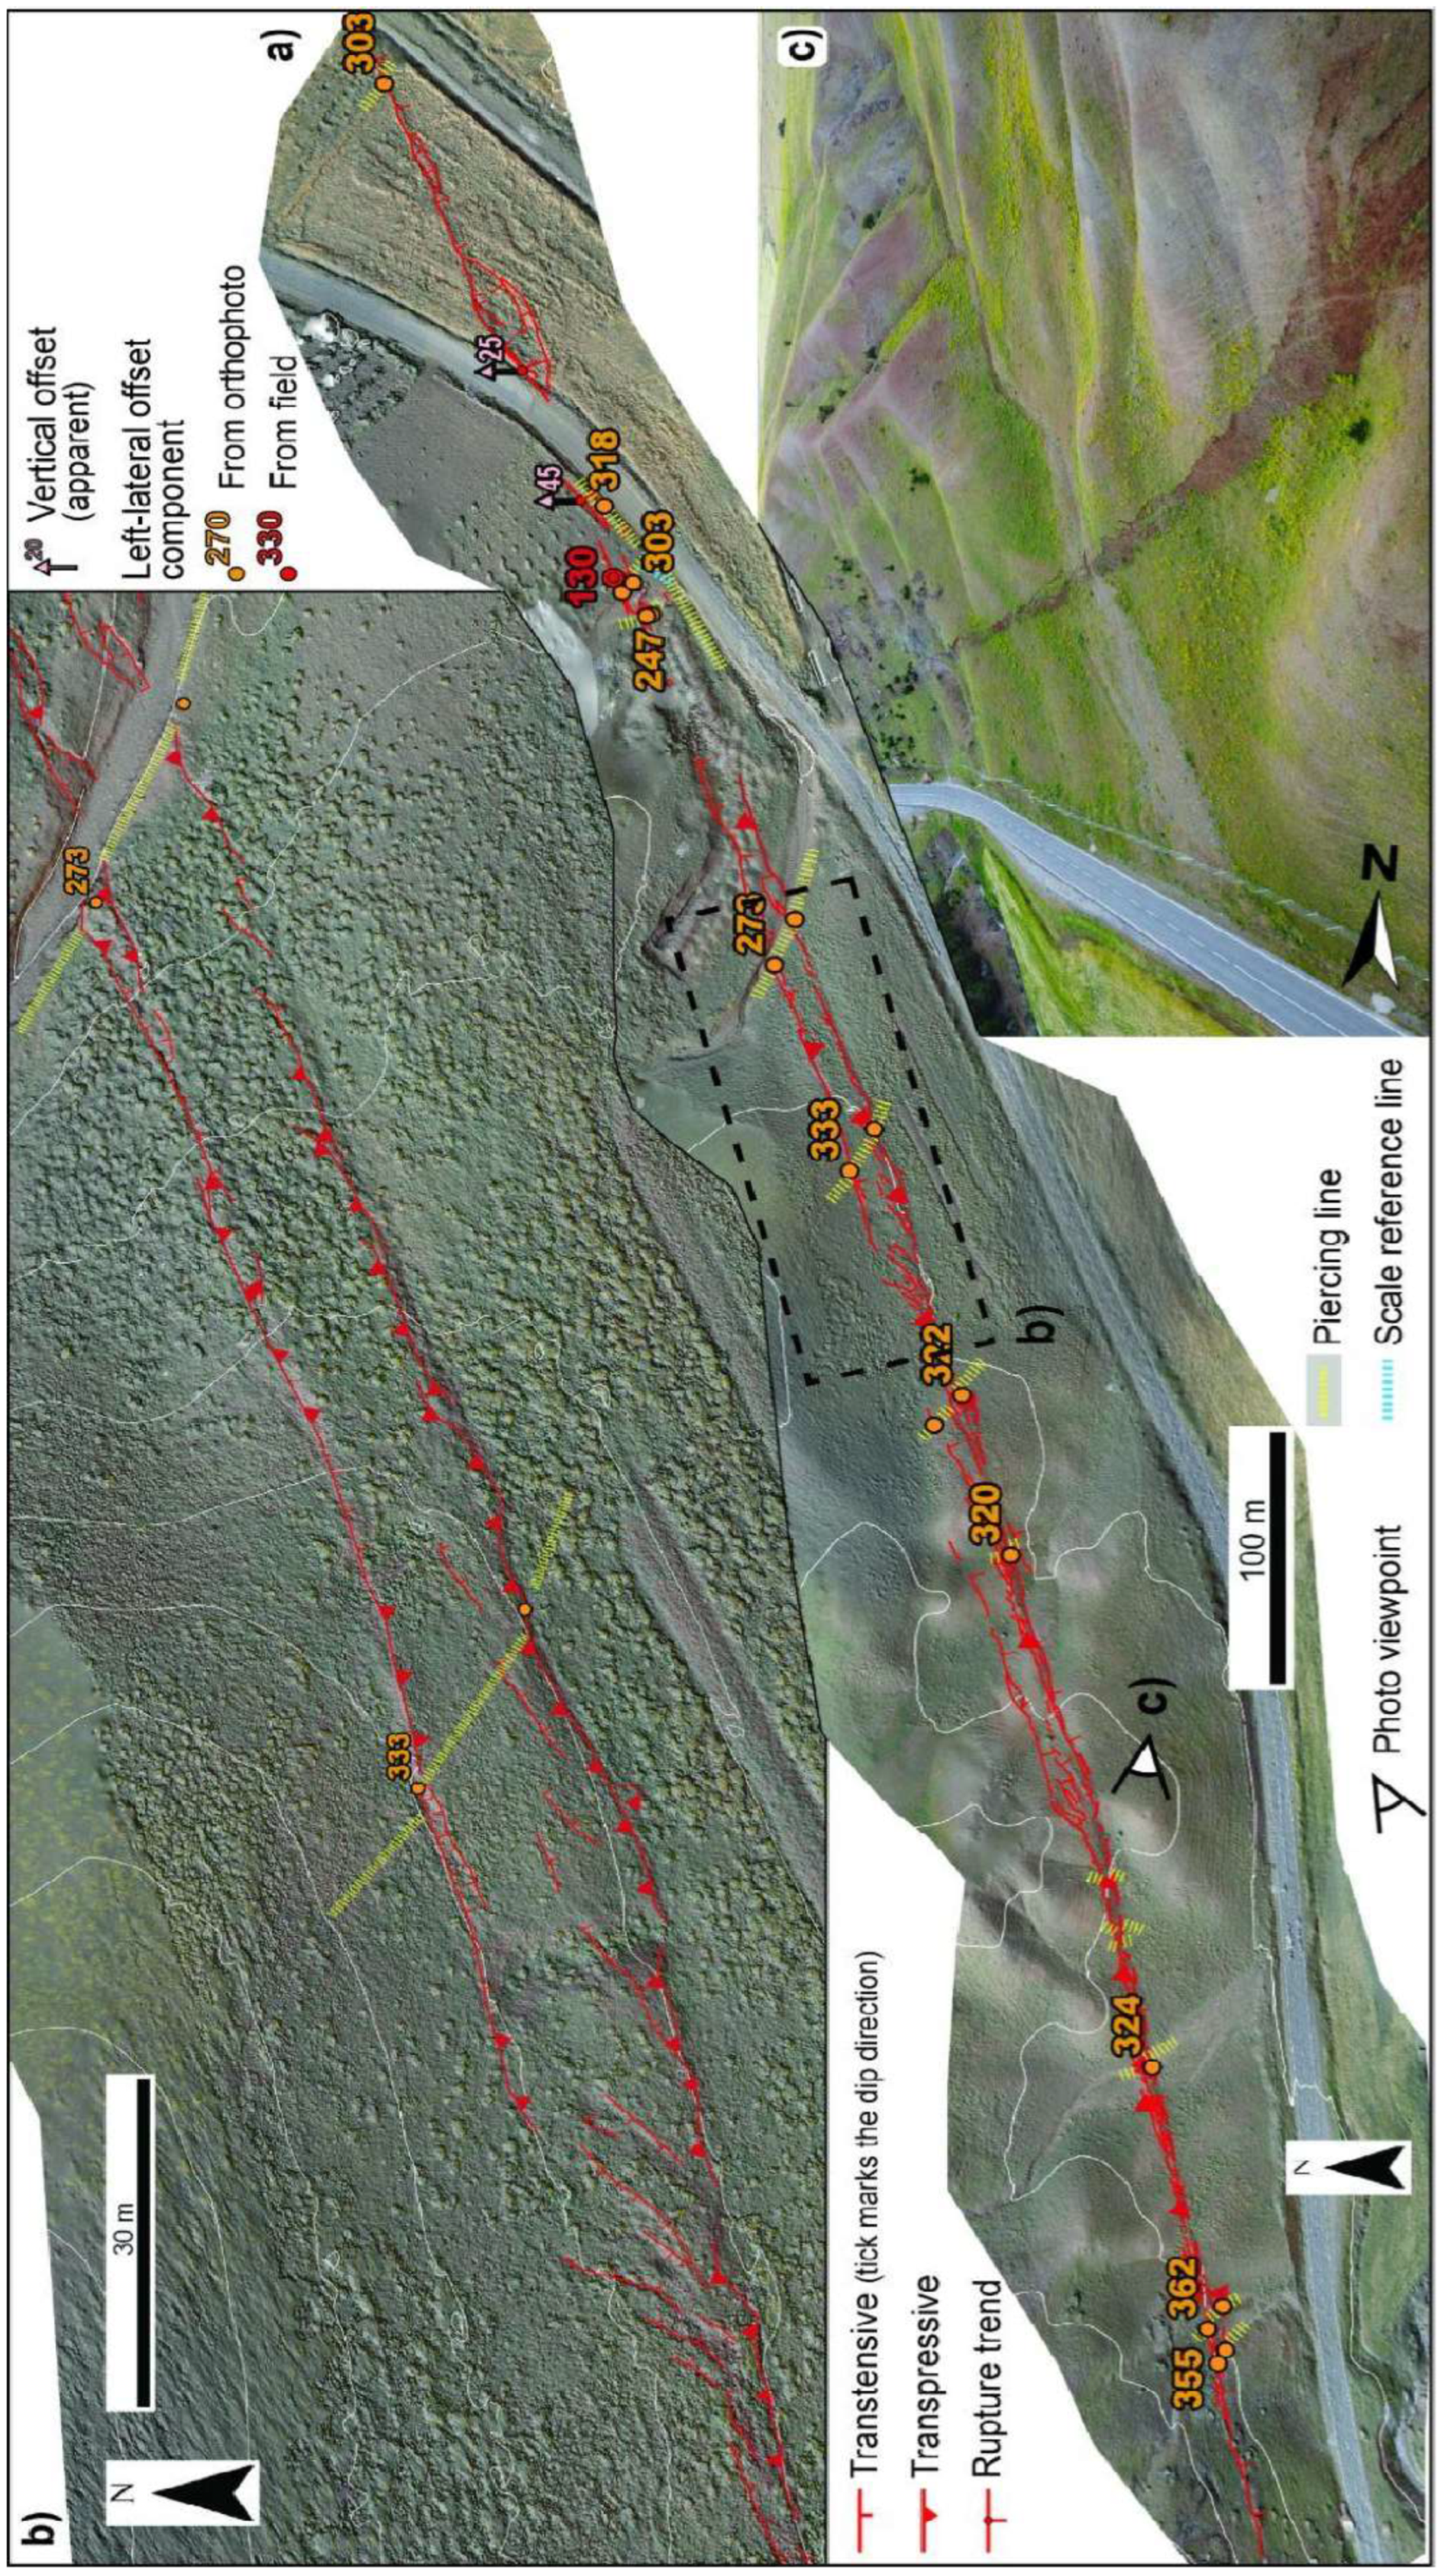
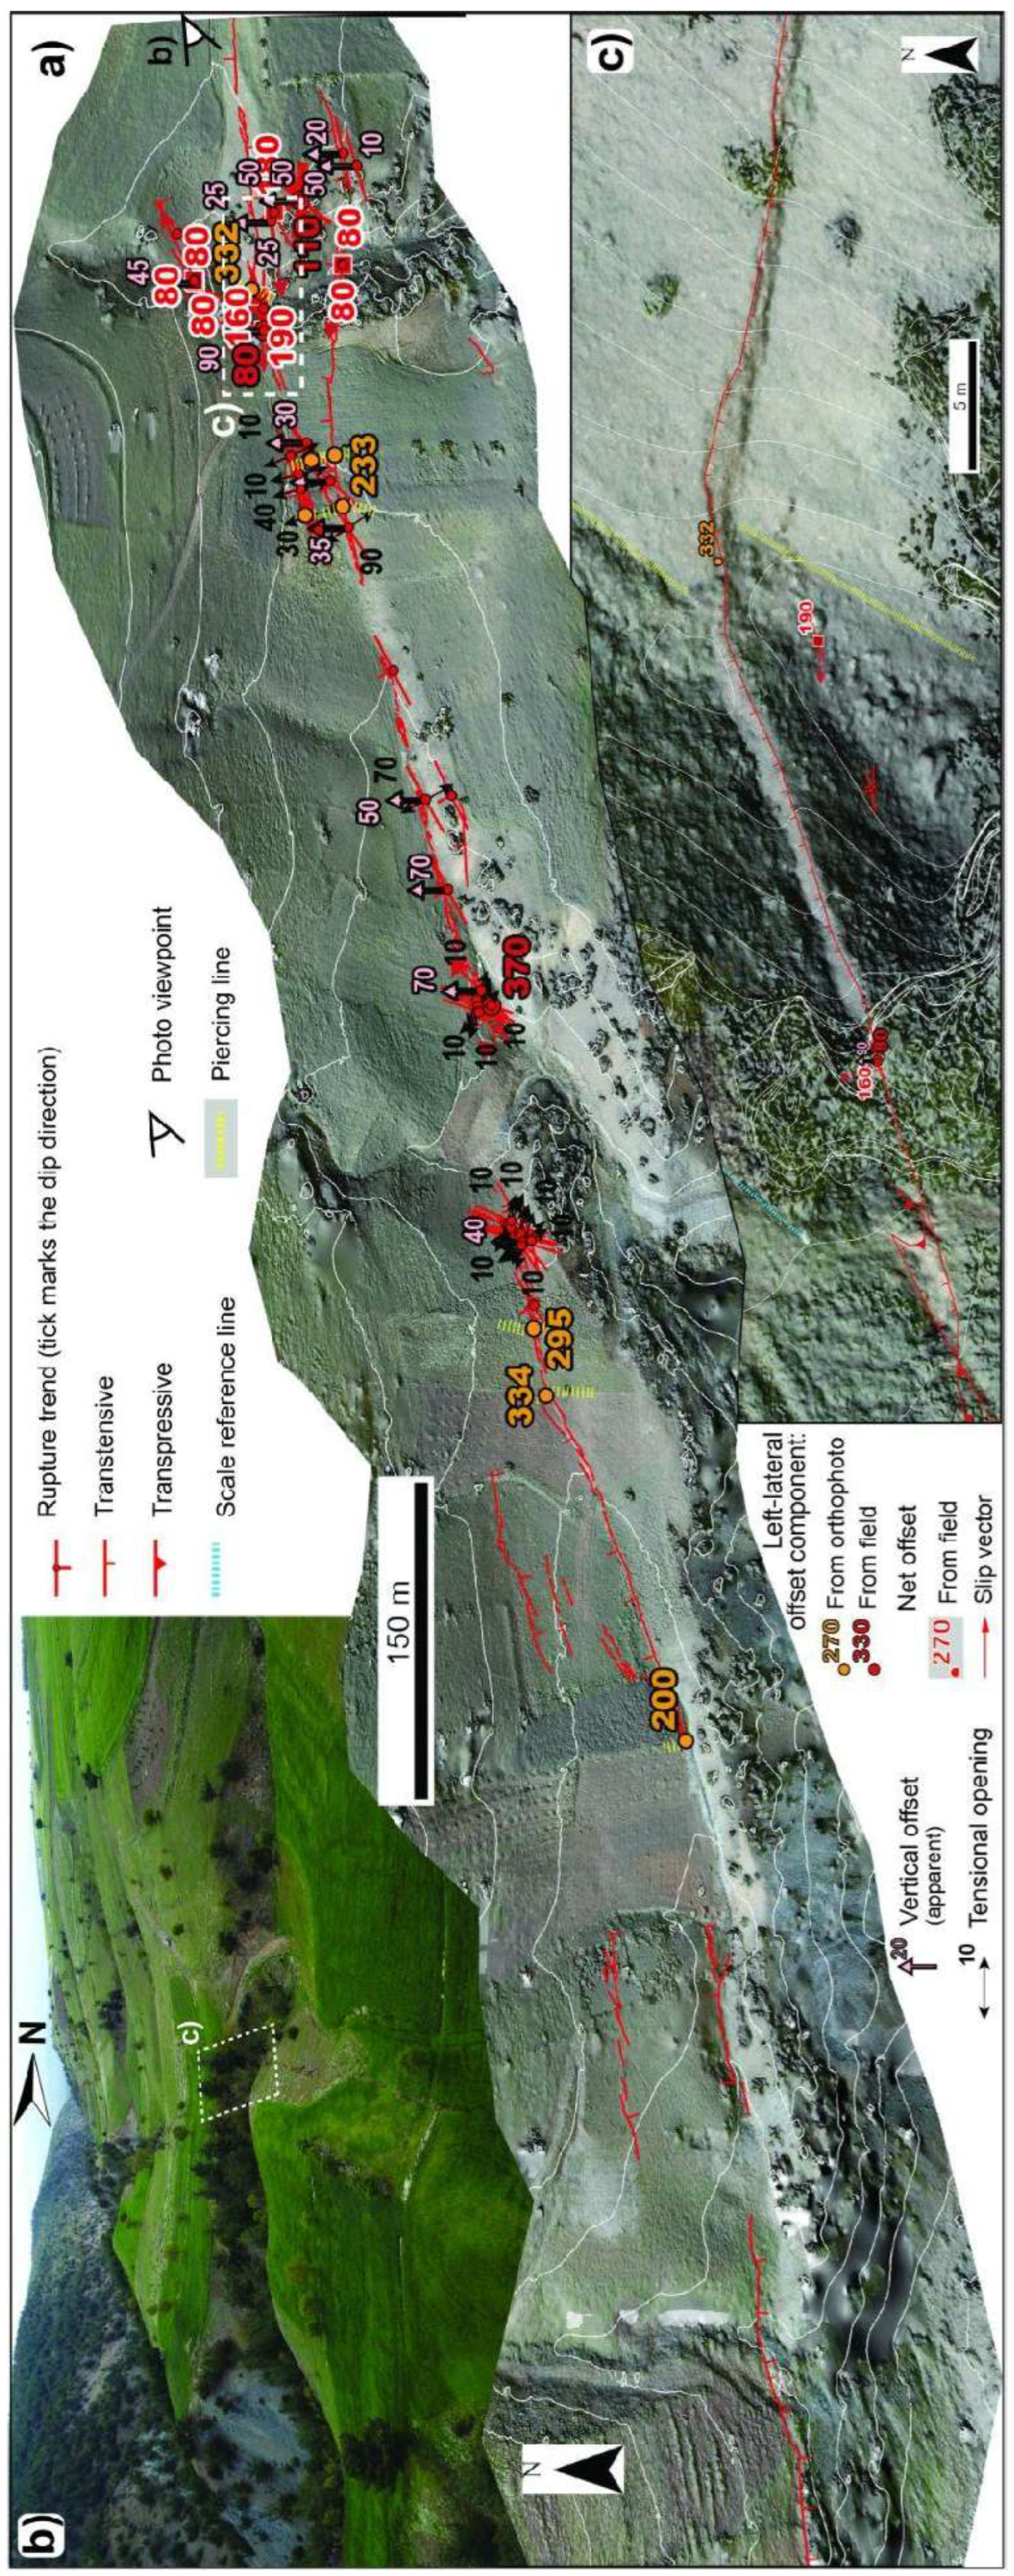
North of Nurdağı (see Figure 3b for location), the rupture trace is continuous, narrow, and almost rectilinear. It runs along the axis of a hanging, ~250 m wide, linear valley infilled by colluvial/alluvial deposits, whose floor gently slopes southwest (Figure 9a). The entire offset is accommodated in a deformational core of less than 2.0 m in width, with a single mole-track showing poorly defined meter-scale Riedel shears and push-ups, and dominant Y-shears, with an increasing number of parallel strands at the southern tip, where an extensional left step (20 m wide) occurs. The vertical component (NW-side up; max 50 cm) appears to be related to a real dip-slip component of the motion, since the affected valley floor has an even morphology (i.e., excluding an out-of-plane, transversal, left-lateral slopes juxtaposition) (Figure 9b).
The remote measurements on the HR-model range between 300 and 380 cm, by means of various piercing line cut-offs (fences, tree lines, ditches). The pre-event aerial photo (Figure 9c) testifies to the original geometry of the used piercing lines. The 420 cm of left-lateral offset component is considered an unreliable outlier since it was measured in the field using as piercing lines the projection of unclear and reworked recent roadside features (Figure 9d,e).
Figure 9. Bademli area, district of Nurdağı (Figure 3b for location). (a) Location of the key area, north of the E90 highway. Bing® image in the background (contour lines each 25 m); (b) high-resolution DEM draped with the orthophoto. The line drawing of the structural pattern composing the mole-track is reported. The horizontal left-lateral offset component measured in both field and orthophoto/DEM is shown. Yellow dashed lines highlight piercing lines (road side, fence, tree lines, etc.) and cut-off used to estimate the horizontal offset; (c) pre-event (03/2022) Google Earth ® image of the area used to check the original piercing line shape; (d) aerial photo of the dislocated area of (c)); (e) prompt post-event picture of the coseismic road cut, later fixed as a road bend (courtesy of local people).
Geosciences 15 00252 g009

4.3.2. Key Area: Tevekkelli, Kahramanmaraş District

South of Tevekkelli village (see Figure 3b for location), the single-strand rupture shows a continuous trace interrupted by a small (~50 m wide) extensional stepover (with ~200 m of overlap) and general southern-side downthrowing (up to ~200 cm). The rupture presents a slight restraining bend at the northern end of the stepover, where it runs along the axis of a short (<~250 m wide) linear valley separating the pediment from a small ridge (Figure 10a–c). Here, the mole-track is strongly dominated by a continuous Y-shear with subsidiary Riedel shears, characterized by very limited extensional features or openings (Figure 10b,c). In several places, a splay with opposite vertical dislocation (N-block down) parallels the Y-shear, defining a composite, 15–20 wide and hundreds-of-meters long, uplifted (aggregate maximum of 100 cm) rupture zone (Figure 10c). At the tips of the composite rupture section, joining the single strand, the Riedel shears increase, forming to the north a ~40 m long and ~20 m wide pull-apart (Figure 10b).

4.3.3. Key Area: South Kartal, Kahramanmaraş District

South of Kartal (see Figure 3b for location), the rupture trace is quite continuous, often compound, and almost rectilinear. It follows the axis of a narrow valley and, reaching the head of the valley, it crosses a drainage divide saddle before entering another collinear valley to the east (Figure 11a). Reaching the ~50 m wide saddle, the PDZ (mainly composed of Y-shears) shows a very gentle left step that yields a branching into multiple (two major) parallel strands (for ~20 m wide rupture zone). Ascending the saddle, the northern main strand presents a dominant southward downthrowing. At the saddle, a flip occurs and the dominant vertical separation (aggregate maximum of 250 cm) characterizes the southern strand, with a fracture opening reaching 100 cm and a complex network of Riedel shears and Y-shears (Figure 11c. The northern dip direction of the fracture persists to the coalescent, single strand that plunges into the eastern valley, where it starts to present a mole-track composed by alternating 5 m long push-ups and Riedel-bounded pull-aparts (Figure 11c). Beside the saddle, the vertical component appears to be related to an apparent dip-slip component of the motion, since the ascended and descended valley floors have a steep morphology (i.e., likely left-lateral out-of-plane juxtaposition, producing a flip of the dip direction) (Figure 11b).
Remote and field measurements of the net left-lateral offset component (320–450 cm, with partitioning to strands reaching 185 cm) were obtained using piercing lines crosscutting small thalweg, fences, tree lines, and the road centerline.
Figure 11. Kartal area, district of Dulkadiroğlu (Figure 3b and Figure A1b for location). (a) High-resolution DEM draped with the orthophoto. The line drawing of the structural pattern composing the mole-track is reported. The horizontal left-lateral offset component measured in both field and modeling is shown. Yellow dashed lines highlight piercing lines (roadside, fence, tree lines, etc.) and cut-off used to estimate the horizontal offset; (b) close-up of the narrow and straight mole-track section, dislocating tree lines, and the erosional terrace riser; (c) photo of the compound rupture with evident vertical offset component and tree lines dislocation.
Geosciences 15 00252 g011

4.3.4. Key Area: East Kartal, Kahramanmaraş District

East of Kartal village (see Figure 3b for location), the rupture trace is very continuous, mostly narrow, and rectilinear. It continues to follow the axis of the narrow valley (<100 m wide) for ~2.5 km, before extending eastward in a sequence of collinear narrow valleys for a total length of ~25 km (Figure 12a). The first section of the rupture runs close to the thalweg, then the trace climbs the channel wall and parallels the valley axis along the northern side, coinciding with a ~50 high inset erosional terrace, ~150 m wide at maximum. Here, the rupture is marked by a couple of parallel strands dissecting the terrace, with the leading and continuous southern strand accommodating most of the dislocation (Figure 12b). The main mole-track, with a northern slightly downthrown block (~70 cm at maximum), is mostly composed of meters-scale alternating Riedel shears (often with open components) and push-ups. Deeply incised orthogonal drainages offer valuable morphological settings to disclose the net offset and almost pure strike-slip kinematics (Figure 12c). The offset thalweg shows more than 330 cm of horizontal motion, while the affected facing channel walls show a similar amount of vertical component but with opposite dip directions.

4.3.5. Key Area: Kısık, Pazarcık District
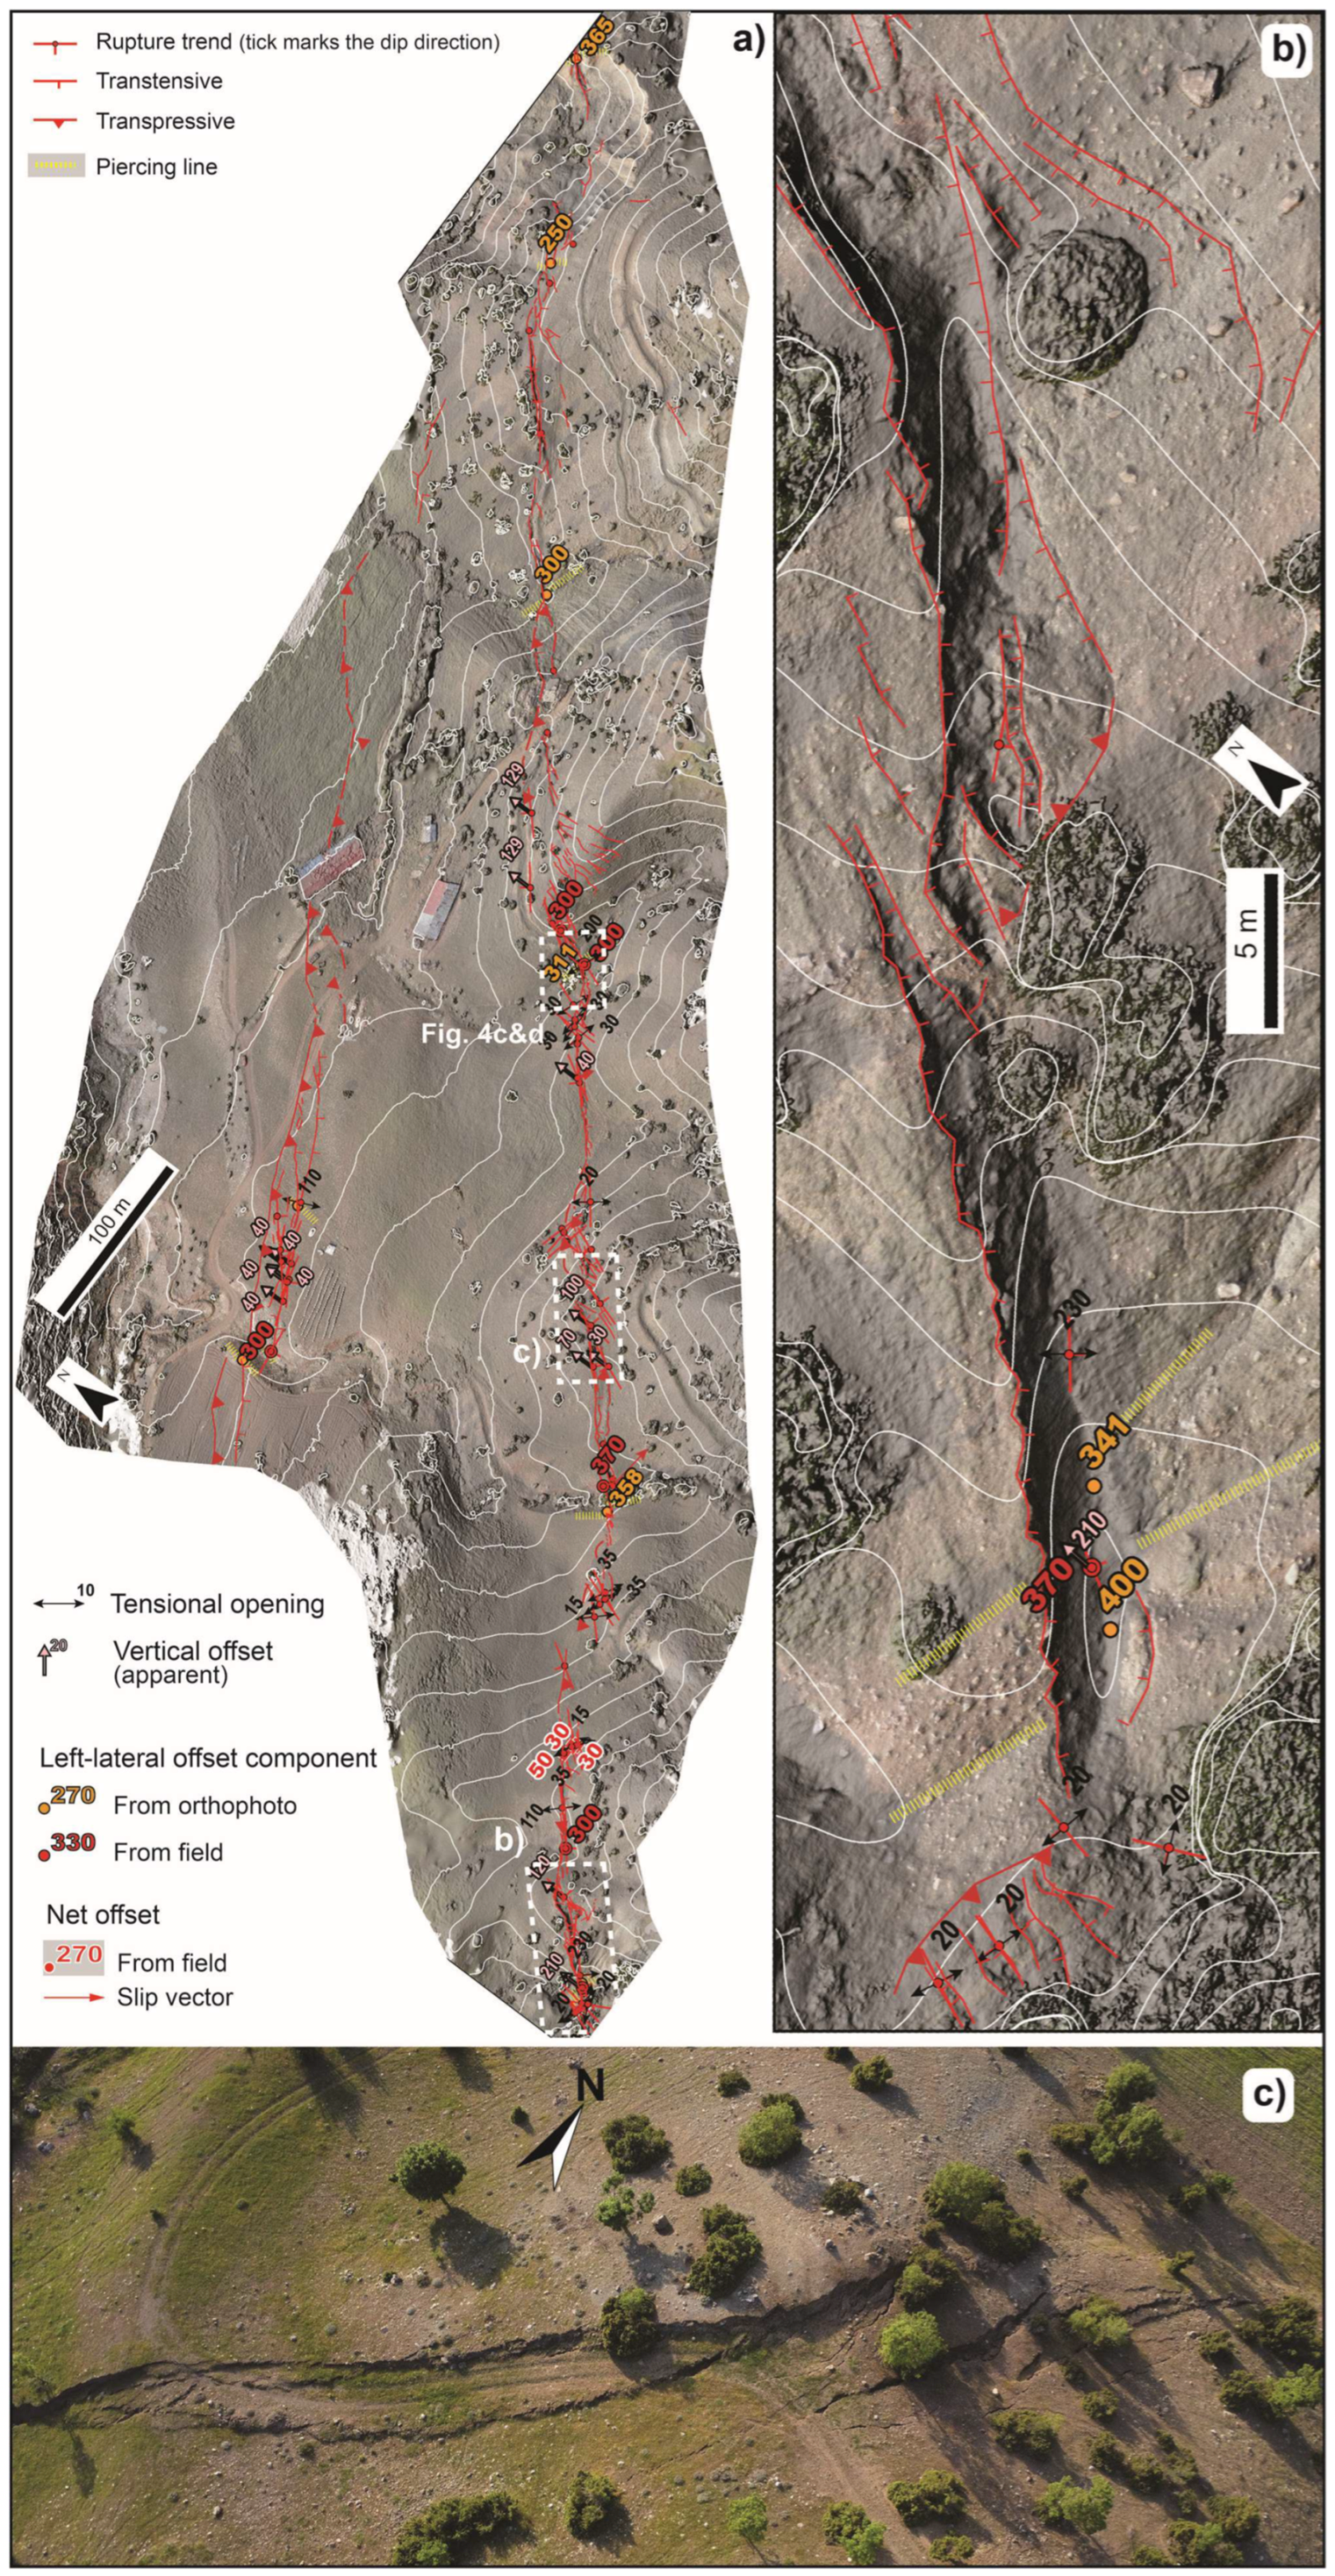
South of Kısık (see Figure 3b for location), at the restraining bend of ~20°, the dislocation zone widens and branches in multiple strands (Figure 6a and Figure A1d). Before the restraining bend, two strands gently converge, with a spacing < 150 m, each of them showing a quasi-continuous, articulated rupture zone up to 20 m wide (Figure 13a).
The northern strand presents open Riedel shears confined between two parallel Y-shears, mostly having transpressional character that limits a slightly uplifted zone (~50 cm at maximum). Here, the ~300 cm of coseismic left-lateral offset was measured along a deflected crossing thalweg and channel walls.
The southern strand presents small contractional right and extensional left steps (5–10 m wide), the major ones set out at hundreds-of-meters (Figure 13a). This strand shows a general, southern counterslope downthrowing with spectacular coseismic features: ~20–30 m long single Y-shears separated at right steps by ~5 m wide push-ups that are affected by en-echelon Riedel shears with tensional opening, occasionally caused by hinge flexure; frequently, the interposed Riedel shears and push-ups are crosscut by a Y-shear that tends to join (Figure 13b,c); the affected bulging interfluves between the orthogonal drainages show their left side characterized by the largest pull-apart and apparent vertical separations (up to 200 cm) (Figure 13b); the shutter ridges derived by deflection of the orthogonal drainages and interfluves caused coseismic ponding due to coseismic damming of the waterflows (Figure 4d). Along this strand, offset thalweg and channel walls offer the piercing points to measure the dislocation along the slip vector, denoting a general dominance of transpression, with values reaching 400 cm.
Hence, the two quasi-parallel rupture strands, summed with a further strand (~500 m to the north; Figure A1d), account for an aggregate left-lateral motion of ~750 cm.
Figure 13. Kisik area, Pazarcık district (Figure 3b and Figure A1d for location). (a) High-resolution DEM draped with the orthophoto. The compound line drawing of the structural pattern composing the mole-track is reported. The horizontal left-lateral offset component measured in both field and modeling is shown. Yellow dashed lines highlight piercing lines (stream thalweg and channel wall) cut-off used to estimate the horizontal offset; (b) close-up of the rupture showing decametric alternation of pull-apart and push-up elements composing the mole-track; (c) detail of the mole-track showing Riedel shears, Y-shears, and thrusting.
Geosciences 15 00252 g013

4.3.6. Key Area: Harmanlı, Gölbaşı District

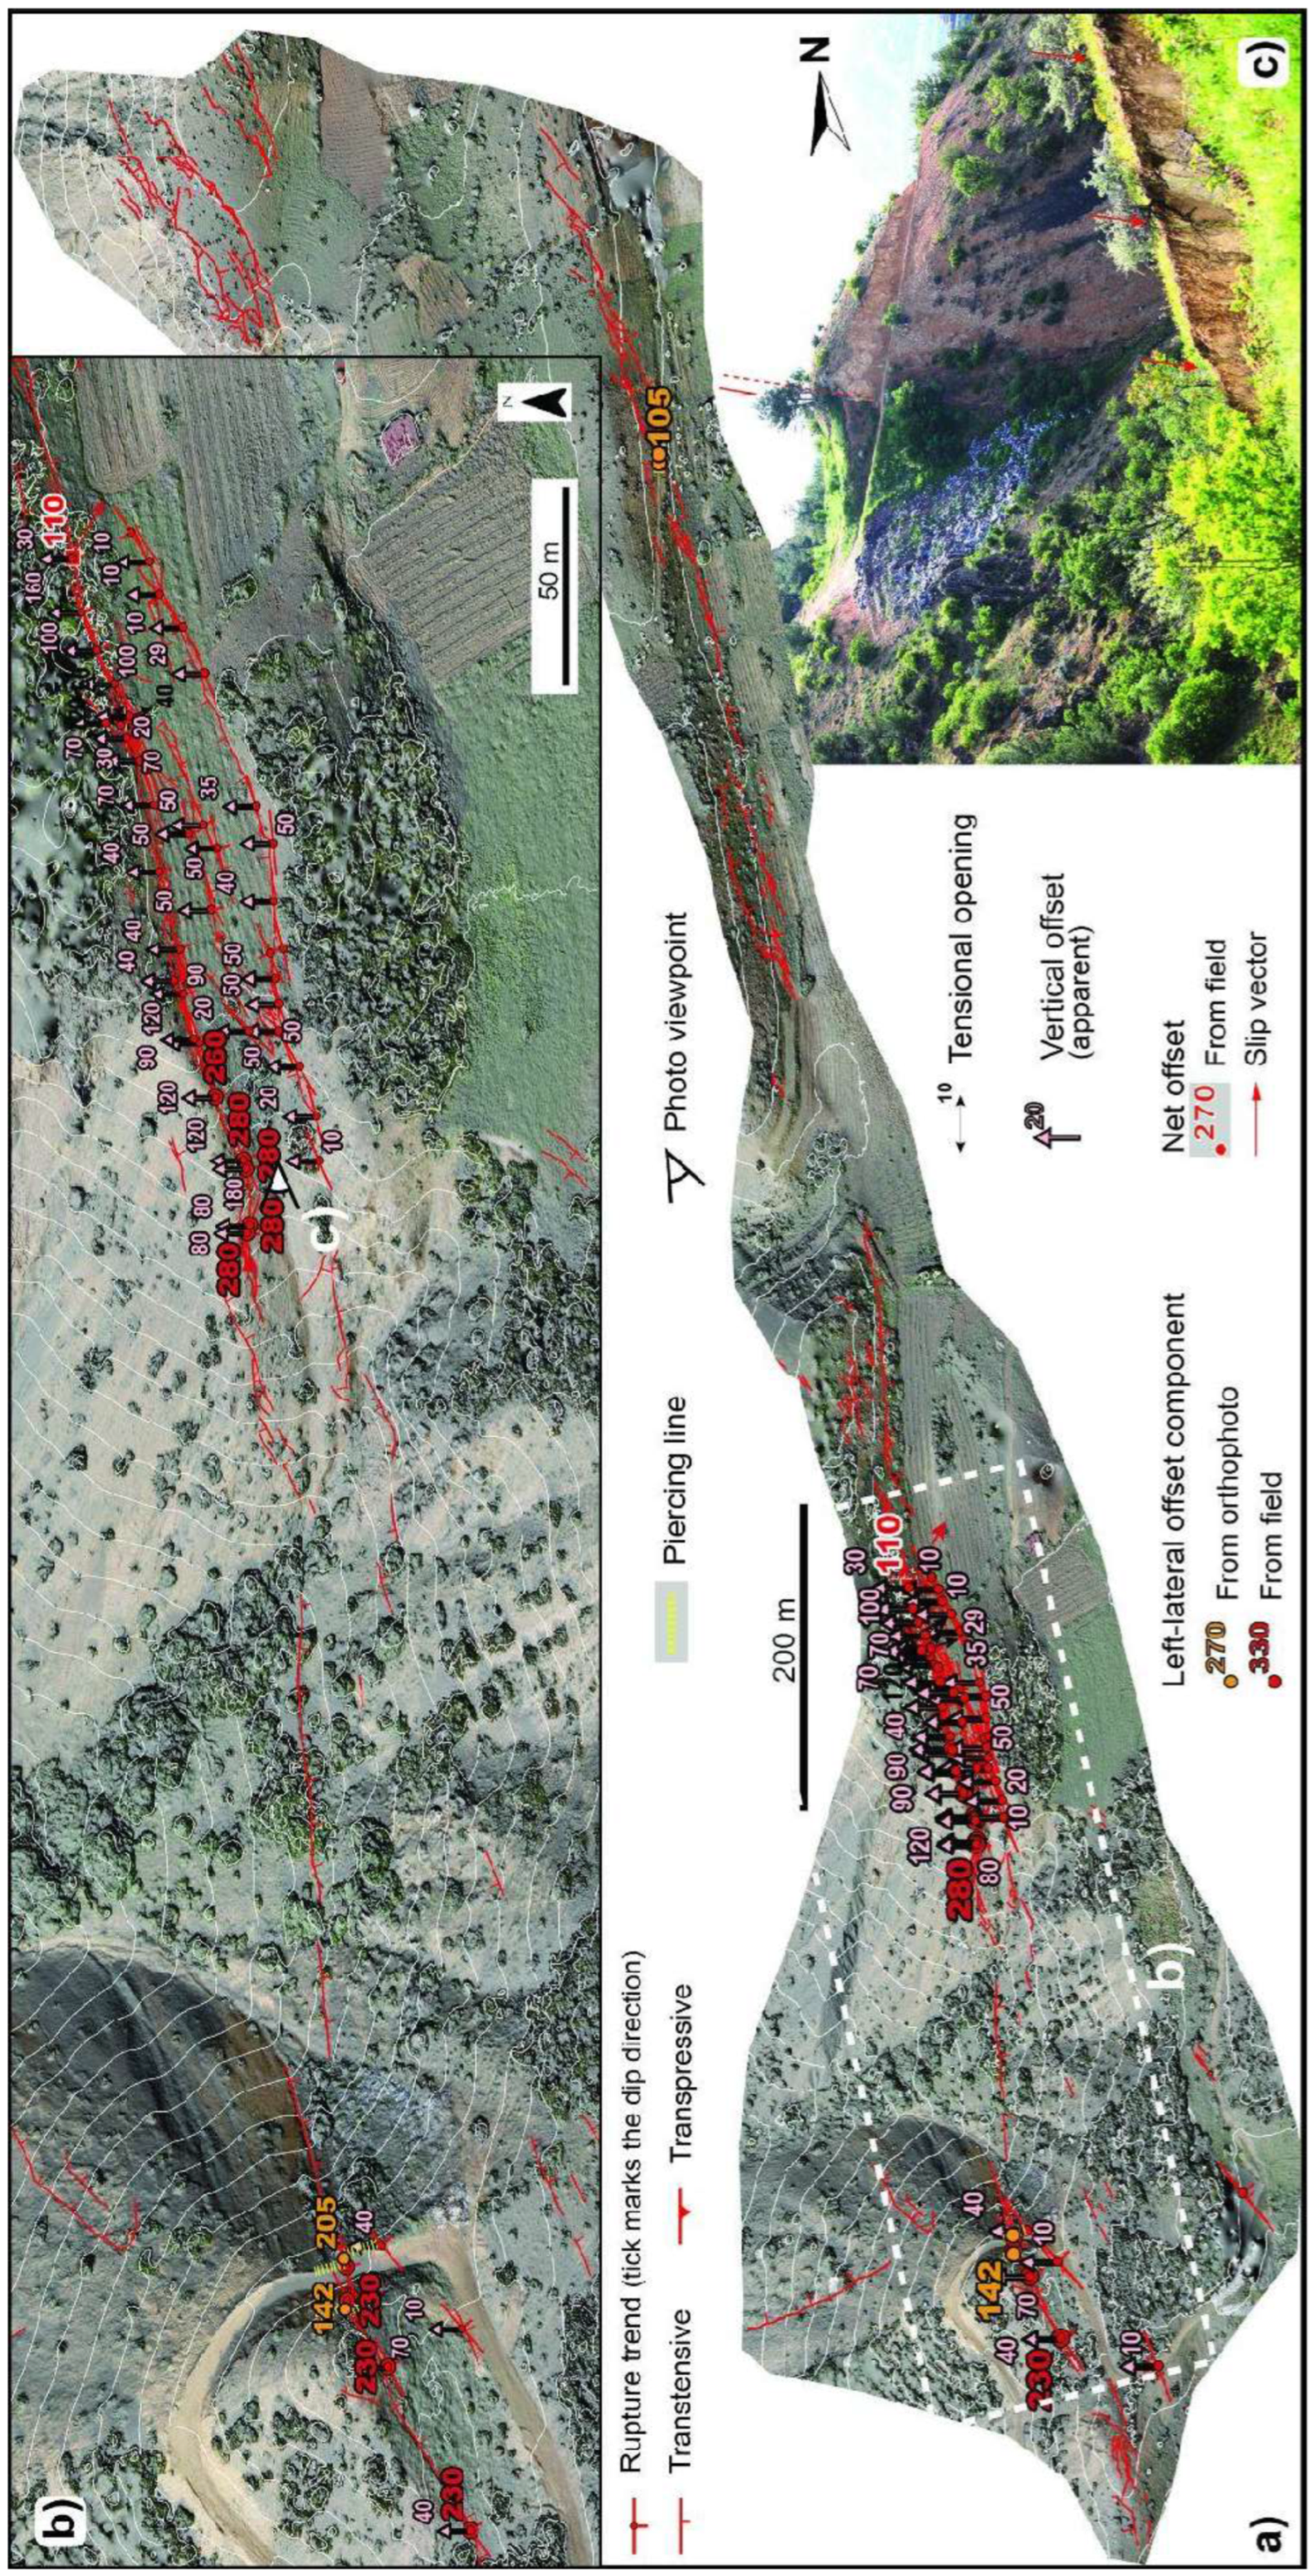
In the Harmanlı area (see Figure 3 for location), the rupture trace (PDZ) characterized by some left step is quite discontinuous and complex, since it is formed by multiple parallel strands and isolated small ruptures. The rupture parallels the deeply incised and straight Karanlık River valley, running at the top of the southern valley flank, ~200 m above the thalweg, at the edge of a hanging and smoothed paleolandscape (Figure A1e). Elongated and narrow ridges and valleys, with a trend similar to the coseismic rupture, characterize the paleolandscape.
The western side shows a discontinuous (up to 200 m long gaps) and distributed (up to 60–70 m wide) rupture pattern (Figure 14a). The pattern is formed by dominant right stepping en-echelon Riedel shears, up to ~50 m long, that diagonally cut the long-term ridge flank (Figure 14b,c). While the vertical dislocation (generally not exceeding 50 cm) of each Riedel is easily detectable, providing an aggregate value below 100 cm, the lateral component of ~165 cm measured on a single element is not representative of the net offset and has to be considered as a minimum, since measurements on the parallel strands are missing.
Moving to the eastern side of the area, the rupture shows smaller gaps and a distributed (up to 50 m wide) rupture pattern, with isolated fractures > 200 m north of the main strand (Figure A1e). The latter occupies one of the hanging elongated valleys, with a pattern formed by right stepping en-echelon Riedel shears (up to ~20–30 m long) confined between continuous Y-shears (Figure 15a). The vertical component, mostly accommodated by the Y-shears in a graben-like configuration, exceeds 100 cm (Figure 15b,c), while the lateral component is predominantly observed along the northern side of the graben, with a maximum of 280 cm (Figure 15a). Most of the northern isolated fractures affect the steep slope of the valley flank and express a dip-slip component, probably related to superimposed landsliding.

5. Discussion

5.1. Integrating the Coseismic Slip Distribution Curve

New data of left-lateral displacement, measured on 45 cultural and 23 natural features, were used to integrate the data available so far in the literature [8,12,51], for a total of 563 measurements along the 290 km of surface rupture related to the Mw 7.8, 2023 Kahramanmaraş earthquake. These measurements include distinct data for the quasi-parallel branches of Narlı Fault and the Cakmak section (Figure 16). Notably, the two branches appear to accommodate an amount of deformation comparable to that observed along the main strand.
Considering the general kinematics of the coseismic rupture, dominated by large strike-slip movements, we reconstructed a slip distribution curve of the sole left-lateral component. We did this being aware that most of the vertical offset, although locally useful to characterize the structural style of the mole-track pattern, is caused by out-of-plane left-lateral slopes juxtaposition. We also prefer to express the slip distribution curve through the envelope of the peaks of the measured slips (Figure 16b), because we consider it improbable for strike-slip faulting to have amplification of the offset due to external effects (e.g., gravitational phenomena) and we believe that the maxima are more representative of the real fault rupture dislocation near the surface.
In addition, since the Narlı Fault and Cakmak section somehow parallel the main strand and represent splays of a multi-segment fault system that releases strain as a single structural entity, we summed their contribution to the slip distribution curve (Figure 16b).
By interpolating the slip distribution curve to approximate complex shapes, we envisage its main characteristics (Figure 17a). The spline function (smoothing piecewise function of polynomials) shows significant oscillations with higher peaks (>700 cm) in the central part of the rupture; the 6th degree polynomial function draws a northeastern-skewed slip distribution and highlights a trimodal distribution of the slip, suggesting the presence of bypassed segment boundaries.

5.2. Comparing the Surface and Deep Rupture

A positive correspondence between the interpolated distribution curves of the near-fault coseismic surface rupture and the remotely sensed far field dislocation is evident at least on the qualitative scale (e.g., [49]; Figure 17b): the larger deformation is located to the north-eastern area, with both maxima coinciding with the Pazarcık and Erkenek segments. Here, the far-field dislocation widens up to ~25 km from the near-fault and indicates a maximum close to that of the average near-fault slip distribution (~400 cm). Moreover, we should notice that the far-field dislocation appears not to resolve quantitatively the near-fault maxima, which, instead, is at least 50% larger (Figure 17b).
Furthermore, a quite good correlation can be observed between the distribution of the near-fault coseismic surface rupture and the slip patches at depth (Figure 17c). In fact, the locus and values of the shallow slip peaks imaged by the joint inversion model of [53] match the field data. Also, at 8–10 km depth, the maximum coseismic slip seems to have reached ~10 m, indicating that it was partially transmitted to the surface: the near-fault expresses up to 70% of the deep net offset (considering the peaks of spline function; Figure 17a). Such a value is at the lower limit of structurally mature fault systems (having accumulated > 25 km of total displacement, as observed in other large strike-slip earthquakes by [83]), in agreement with the 19–33 km total displacement of the Pazarcık segment [21].
Regarding the rupture speed distribution, reconstructed at depth from dynamic rupture modeling [62] (Figure 17d), it should be noted that the coseismic near-fault surface slip maxima, as those at depth, occurred north of the Narlı Fault. Here, the rupture, starting from a very localized faster propagation, anticipated the asynchronous bilateral propagation, but showed no appreciable speed difference and no clear influence on the slip propagation at the surface. Conversely, kinematic models [37,56] describe more episodes of supershear along the Amanos segment, which are not accompanied by patches of large slip, and that are generally favored by rigid lithologies (e.g., ophiolites in Figure 18a) and geometrically simple fault segments, and hampered by transtension (see Section 5.3) [84,85].

5.3. Structural Style Distribution Along the Rupture Trace

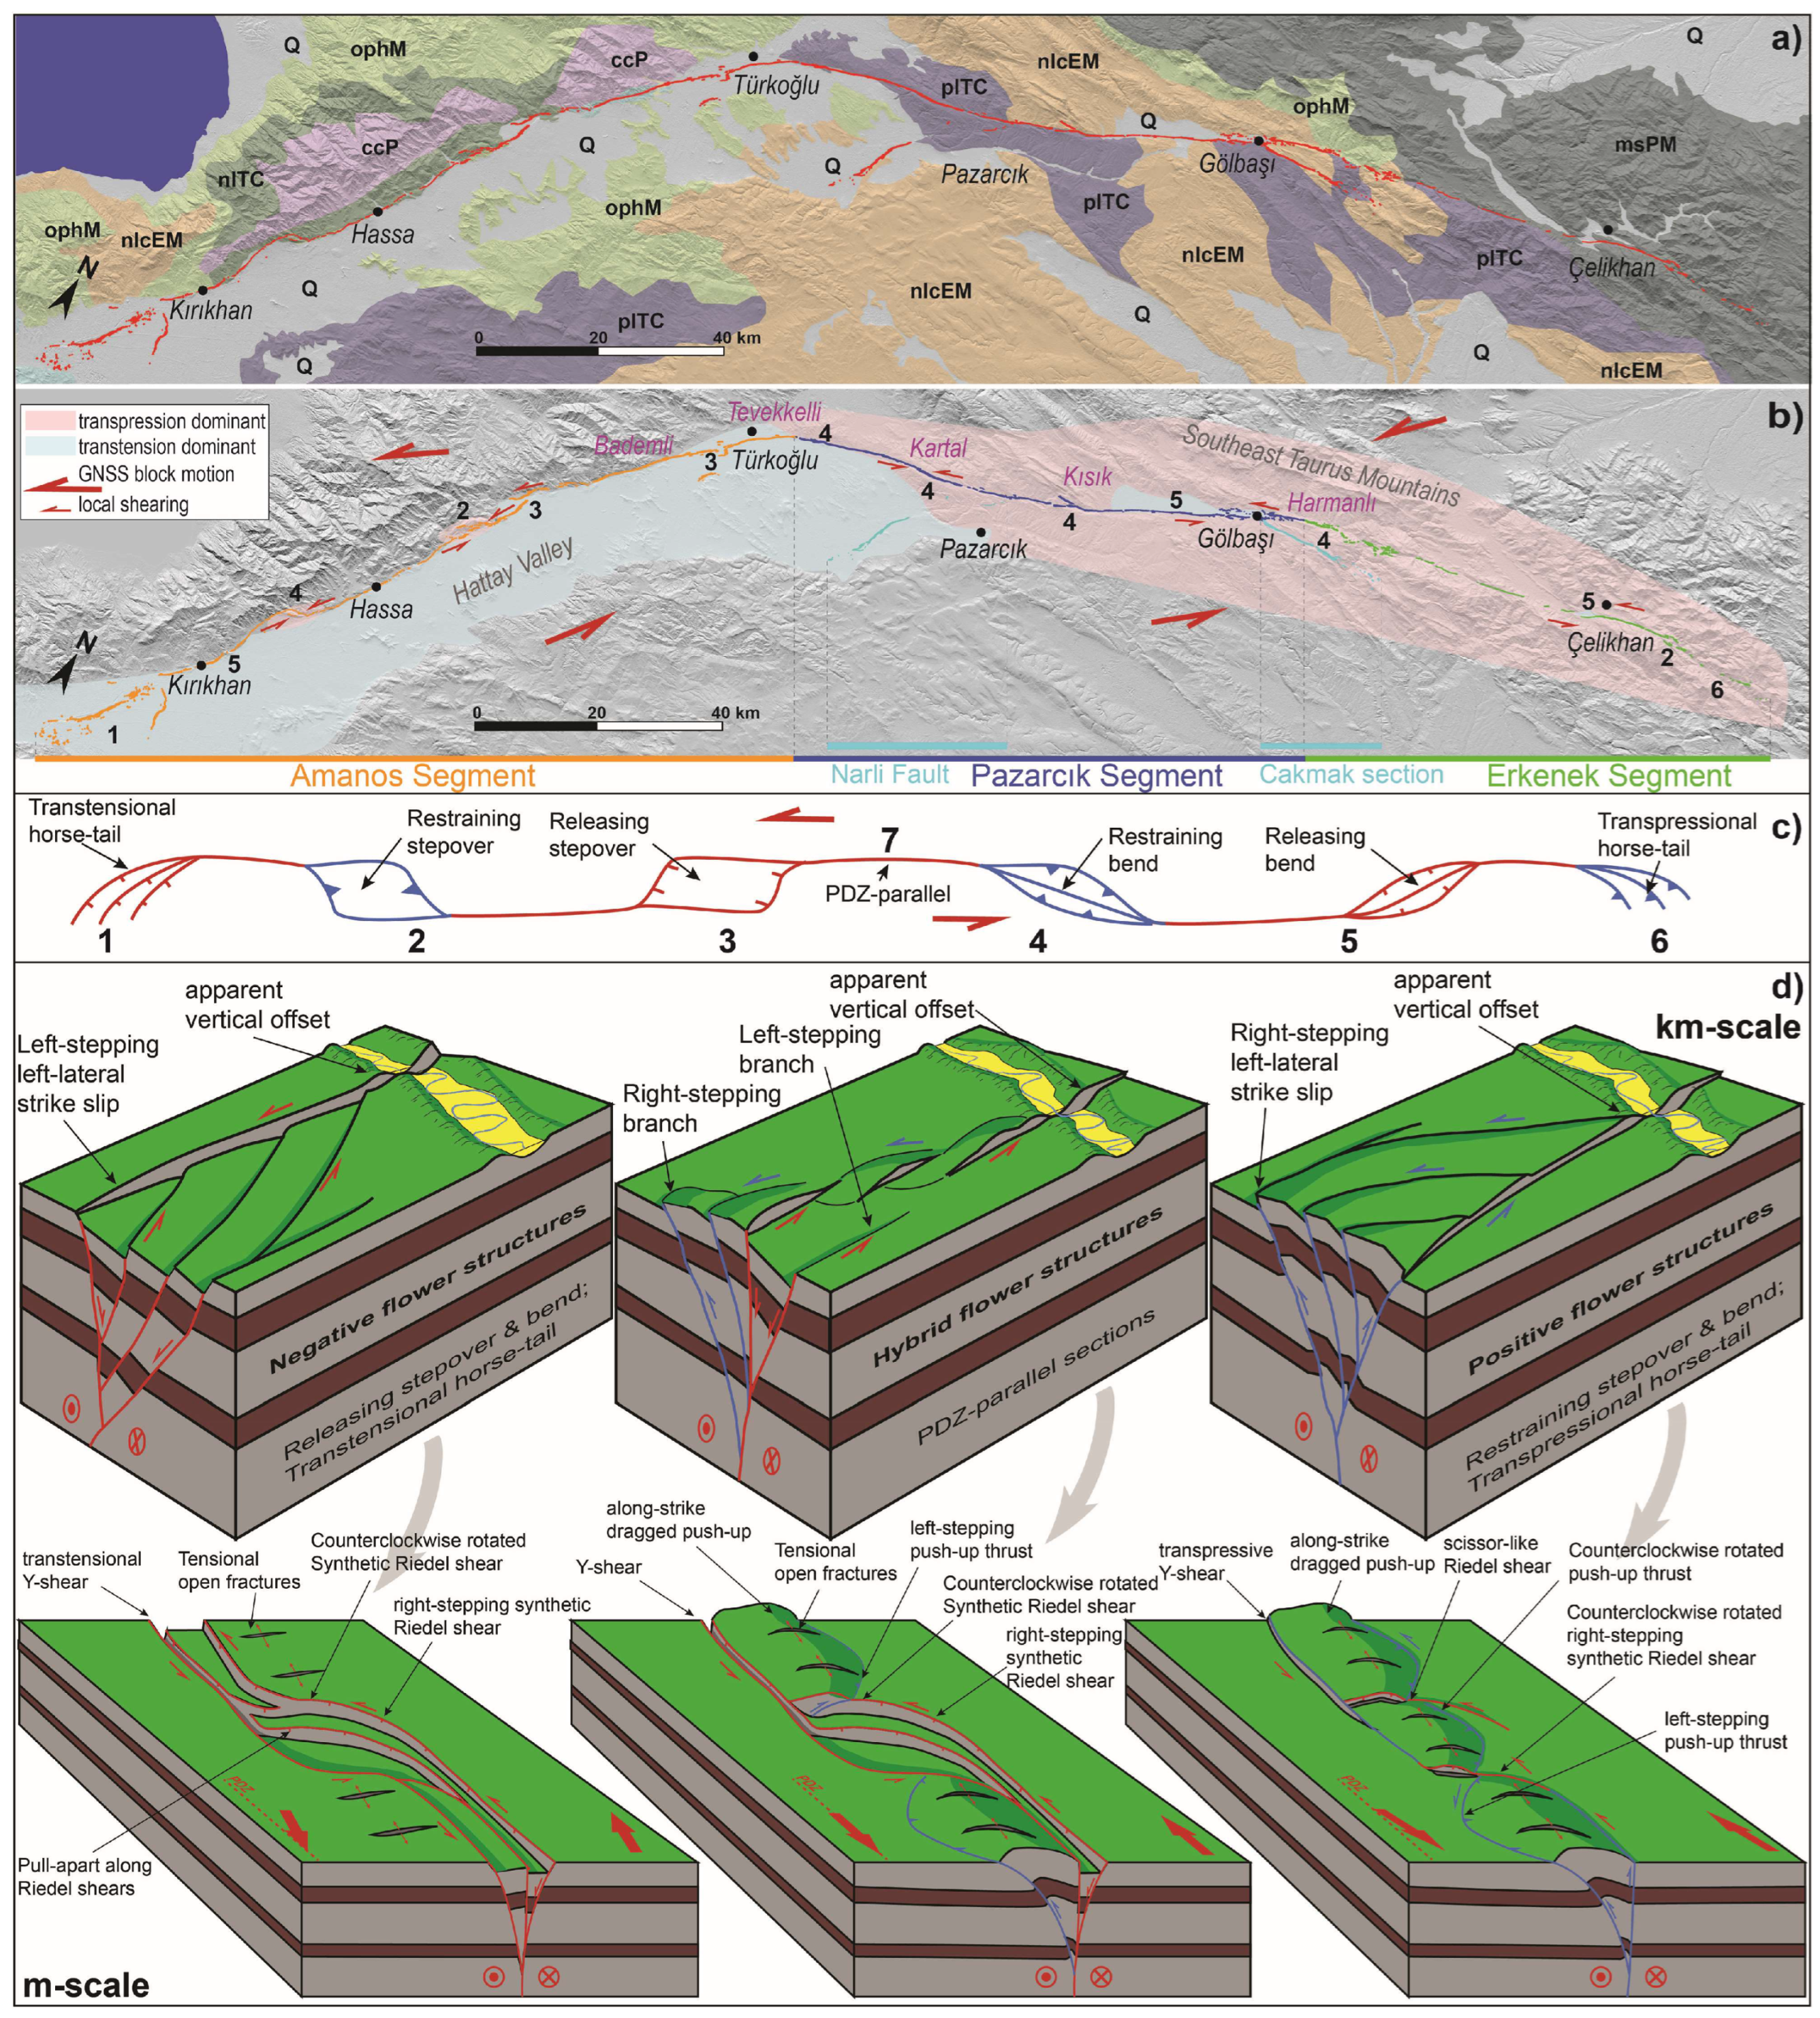
The major bend (~30°) at Türkoğlu separates two different, first-order kinematic sections of the 2023 rupture trace, characterized by a different juxtaposition of lithologies (limestones/limestones and limestones/ophiolites; Figure 18a). With respect to the divergence angle between the displacements, as evidenced by the coseismic GNSS dislocations [55,57], and the boundary fault (PDZ), the southern Amanos segment appears to be dominated by transtension and the Pazarcık and Erkenek segments by transpression (Figure 18b). As a whole, the long-term landscape appears to have recorded such change in kinematics, with faulting controlling the major elongated continental basin (Hattay Valley), to the south, and the elevated ridge of the Southeast Taurus Mountains to the northeast.
However, in this context, along the articulated trace of the surface rupture, we observed an assortment of local-scale geometrical complexities (e.g., stepovers and bends), distributed at a wavelength of ~20 km (Figure 18b). Small changes in fault trajectory (≤20°) and stepover width (≤2 km) can produce larger and multi-stranded flower structures [88] that interrupt a general PDZ-parallel straight and narrow rupture trace (Figure 18c,d). Despite their limited magnitude (few kilometers and degrees), small changes drive the dominant kinematics and strain (i.e., near-fault structural style at shallow depth) by responding to the local stress organization (Figure 18b).
Negative flower structures (i.e., shallow synforms bounded by upward spreading strands with mostly normal separations) appear more frequently along the Amanos segment (Figure 18b–d). In contrast, major positive flower structures (i.e., shallow antiform displaced by upward diverging strands of a wrench fault with mostly reverse separations) are at the two restraining bends (Figure 5b,d). The straight forebergs alignment of Figure 5c, considering its near-fault limited width and southward basin downthrowing of the affected alluvium, could represent a compressional feature along a wrench-dominated transtension (slightly divergent—<10°—wrench fault; sensu [89]).
Conversely, positive flower structures mainly occur along the Pazarcık and Erkenek segments, possibly related to pure strike-slip kinematics or due to a component of convergence in a wrench-dominated transpression of the PDZ (apart from the regions of small, hectometer scale, releasing bends and stepovers) (Figure 18b–d).
Hybrid flower structures (i.e., coexistence of the shortening and extension; sensu [90]) are found along the PDZ-parallel sections and at the transition between different geometrical complexities (Figure 18b–d).

5.4. Coseismic Rupture Patterns: General Considerations

Variations in the rheology and thickness of the continental surface cover along the rupture (Figure 18a) may also amplify the effects of local rotations in the stress/strain fields, directly influencing the characteristics and scaling of the mole-tracks. A thorough understanding of this relationship would require a more detailed analysis of the nature of the very shallow Quaternary deposits, which is beyond the scope of this study.
However, it is important to note that the coseismic rupture expression, likely due to the large finite shear, deviates from the theoretic classification of fractures (e.g., [91,92]). This is due to the internal distortion that leads, in a left-lateral motion, to counter clockwise rotation of the structural elements composing the mole-track that produce thrust flaps and axes of the turf raft parallel to the Y-shear, and high-angle Riedel shears changing to T-fractures (e.g., Figure 4b).
Of note, along the rupture trace, the outcrop-scale mole-track pattern is differently arranged (meter-scale in Figure 18d). Locally, the fraction of transpressional and transtensional elements composing the pattern appears to respond to the kinematic environment where they are hosted. Usually, in straight and pure strike-slip sections (either PDZ or SDZ), a balance between Riedel shears and thrusts is present, showing pull-aparts and push-ups alternate with wavelengths directly proportional to the amount of net slip. In transpressive sections, push-ups dominate and tend to join; the Y-shear itself presents closed fractures, with a frequent bulged overthrusting surface; the Riedel shears between push-ups show a scissor-like motion (juxtaposition of en-echelon contiguous axes of the turf rafts). In transtensive sections, the push-ups leave space to the pull-apart and open fracturing Y-shears (meter-scale in Figure 18d).

5.5. Recurrence Time Speculations

At the Kisik area, a long-term slip rate of 5.1 ± 0.07 mm/a for the Pazarcık segment was estimated on the basis of the deflection of entrenched rivers, which started at late Early Pleistocene (MIS 22 at 870 ka) in response to the regional surface uplift [21]. Assuming this value is representative of the present-day loading rate of the fault, the coseismic slip occurrence with an average of 400 cm suggests a time interval since the previous event of around 750–800 years. If this is true, the 1114 C.E. historical earthquake [28] could be the M ≥ 7.0 penultimate event that occurred on the Pazarcik segment. However, further investigation including a review and discussion of previous paleoseismological and historical data is required.

6. Conclusions

The collection and analysis of newly available remote-sensing imagery enabled the planning and execution of field surveys in six key areas along the causative fault of the 6 February 2023, Mw 7.8 Kahramanmaraş earthquake, where detailed mapping and measurements of coseismic surface ruptures were carried out in May 2023. These efforts were crucial for filling gaps in the previously available surface-faulting trace, validating the accuracy of data obtained from remote sensing, refining fault offset estimates, and gaining a deeper understanding of both the local and overall patterns of the main rupture strands.
Carried out at a time when Turkish governmental and academic institutions were overwhelmed by the aftermath of a devastating earthquake sequence, we underscore the crucial need for field surveys to identify, characterize, and map coseismic geological surface effects, even in the case of large-scale surface faulting such as that observed following the Turkey earthquakes. Although satellite images offer detailed observations of faulting, field surveys are still indispensable for capturing critical details that may otherwise be missed.
Measurements and observations confirm that the coseismic rupture is primarily dominated by large sinistral strike-slip movements, with variable offset rates along the fault, reaching over 600 cm in the central and northern parts of the rupture (i.e., Pazarcık fault segment). In general, the near-fault coseismic surface rupture distribution shows a strong correlation with the greater deformation of the north-eastern region as expressed by the geodetic far field dislocation field and the major slip patches at depth. While the overall rupture trace is generally straight and narrow, it exhibits significant geometric complexities at a local scale (i.e., a few kilometers), with alternating sectors of stepover and bends. This results in transtensional and transpressional secondary structures, primarily in the form of multi-strand positive and negative flower structures.
Only comprehensive and detailed field surveys allow us to precisely characterize and document the structural framework and geometric complexity of the coseismic surface-faulting behavior at a local scale. Such surveys are crucial for ensuring the detection of the near-fault offset peaks, the accuracy of structural measurements, and the reliable interpretation of both morphological and geometric features.
This experience highlighted the importance of a rapid, coordinated response to provide external support and acquire detailed field observations, helping mitigate the loss of short-lived features in the post-earthquake environment. Furthermore, the integration of traditional ground-based surveying techniques with drone surveys or LIDAR models—when calibrated with field control points—proved to be a highly effective tool for optimizing time and resources during post-earthquake interventions, highlighting how innovative survey techniques can significantly enhance the efficiency and effectiveness of earthquake response efforts.
Our work greatly profited from the experience gained within the Emergeo Working Group (https://emergeo.ingv.it/; accessed on 20 June 2025), whose organization, tools, and data collection methodology were closely followed throughout the process. This emphasized the crucial value of a shared and standardized approach, both in the measurement and classification of data and observations.
Based on that, there is a strong need to create a global, open-access collaboration system for collecting and sharing coseismic surface-faulting data within the scientific community, as the European Earthquake Geology Task Force (EuQuaGe) initiative is trying to do at European/Mediterranean level (https://www.preventionweb.net/news/first-field-exercise-european-earthquake-geology-task-force-euquage-performed-turkiye-surface; accessed on 20 June 2025). This system would allow for the consolidation and integration of data in an accessible and standardized format, enhancing the accurate characterization of coseismic scenarios. The merging and harmonization of data collected through a standardized methodology, combining classical morpho-tectonic techniques with structural geology methods, will ensure consistency and reliability across datasets, including when incorporating data from diverse sources and fieldwork teams.
Furthermore, centralizing the data in an accessible and standardized format within a common harmonized database would facilitate collaboration among international researchers and enhance our understanding of fault dynamics and seismic hazards. It would also enable more informed decision-making during emergency response efforts, guiding timely interventions and helping prioritize resources based on reliable data. Ultimately, this initiative could promote a more coordinated and participatory global response to future seismic events, boosting the resilience and preparedness of exposed communities.

Supplementary Materials

The following supporting information can be downloaded at https://www.mdpi.com/article/10.3390/geosciences15070252/s1, S1: georeferenced vector file of remotely sensed 2023, Mw 7.8 Kahramanmaraş surface rupture trace (compiled), EAFS_Rupture_Merge.shp (ArcGIS Pro 3.4.3 software, Environmental Systems Research Institute, Inc.—Esri).

Author Contributions

S.P.: conceptualization, investigation, data curation, writing—original draft preparation, visualization, project administration; M.C.: investigation, data curation, writing—original draft preparation, visualization, project administration; R.A.: investigation, writing—review and editing; project administration; P.D.M.: investigation, writing—review and editing; A.M.B.: investigation, writing—review and editing; V.P.: investigation; P.M.D.M.: writing—review and editing, project administration; R.C.: writing—review and editing, project administration; R.N.: writing—review and editing, project administration; E.Ü.: supervision; O.T.: supervision. All authors have read and agreed to the published version of the manuscript.

Funding

The field activities during the 2023 emergency were partially funded by the Italian Civil Protection Department (2024-2026 INGV-DPC Agreement).

Data Availability Statement

The original fieldwork data presented in the study are openly available in the Zenodo repository: Pucci, S., Caciagli, M., Azzaro, R., Di Manna, P., Blumetti, A. M., Poggi, V., De Martini, P. M., Civico, R., Nappi, R., Ünsal, E., & Tatar, O. (2025). Surface ruptures related to the 2023, Mw 7.8 Kahramanmaraş surface faulting earthquake, Türkiye [Data set] at https://doi.org/10.5281/zenodo.15480234. The HR-DTM and key area surface rupture patterns drawing data presented in this study are available on request from the corresponding author.

Acknowledgments

We are very grateful to the AFAD-Earthquake Clearinghouse (AFAD-DEBIDES) in supporting the activities, in particular Filiz Tuba Kadirioğlu (Earthquake Department) and Arif Mencik (Gaziantep Provincial Directorate of Disaster and Emergency). Heartfelt thanks to Emre Ünsal for being our guide during the first days. We wish to express special gratitude to the district governments of Islahiye, Nurdağı, Gaziantep, Türkoğlu, Kahramanmaraş, Pazarcık, and Dulkadiroğlu for their hospitality. The authors have reviewed and edited the output and take full responsibility for the content of this publication.

Conflicts of Interest

The authors declare no conflicts of interest. The funders had no role in the design of the study; in the collection, analyses, or interpretation of data; in the writing of the manuscript; or in the decision to publish the results.

Abbreviations

The following abbreviations are used in this manuscript:
AFADDisaster and Emergency Management Authority of Türkiye
USGSUnited States Geological Surveys
OAMOpenAerialMap
ALOSAdvanced Land Observing Satellite
GNSSGlobal Navigation Satellite System (USA)
GPSGlobal Positioning System
GLONASSGLObal NAvigation Satellite System (Russia)
MTAGeneral Directorate of Mineral Research and Exploration
InSARInterferometric Synthetic Aperture Radar
EAFZEast Anatolian Fault Zone
EuQuaGeEuropean Earthquake Geology Task Force
PDZPrincipal Displacement Zone
SDZSingle Displacement Zone
DEMDigital Elevation Model
DSMDigital Surface Model
RTKReal-Time Kinematic
DSLRDigital Single-Lens Reflex
CMOSComplementary Metal-Oxide-Semiconductor
OSOperative System
IMUInertial Measurement Unit
LIDARLight Detection and Ranging
GISGeographic Information System
SfMStructure-from-Motion

Appendix A

Table A1. OAM satellite images (MAXAR Technologies ©, Palo Alto, CA, USA, 0.3 m/pixel resolution) covering the 2023, Mw 7.8 Kahramanmaraş surface-faulting earthquake area (License CC BY-NC 4.0).
CodeDateRes. (cm)SensorSize (Gb)Link
10300500D9F8D5008 February 202338WV021.84https://map.openaerialmap.org/#/36.298828125,36.38591277287651,9/square/12211201112/63ecac68ca43600005f4d96c?_k=5zirq8
10300100E2B305009 February 202331WV020.621https://map.openaerialmap.org/#/36.165618896484375,36.18776699893771,10/square/12211201121/63eba7a8ca43600005f4d93e?_k=v1q30r
10300100E32E3D0028 February 202331WV021.54https://map.openaerialmap.org/#/36.1669921875,36.27970720524017,10/square/122112011211/6436fdb78cae390005a14519?_k=nts6ej
10400100826987007 February 202331WV031.87https://map.openaerialmap.org/#/36.826171875,37.23032838760387,9/square/12211032023/63e3e57def4ece000785aa2a?_k=wypq12
10300500D9F8D3008 February 202331WV022.37https://map.openaerialmap.org/#/36.826171875,37.23032838760387,9/square/12211032023/63ed1792525f0700077ed433?_k=ip64fs
1040010083278E0013 February 202331WV030.621https://map.openaerialmap.org/#/36.474609375,37.09023980307208,9/square/12211023311/6436eef58cae390005a1450b?_k=b7yjjv
10300100E2C66F0028 February 202331WV024.73https://map.openaerialmap.org/#/36.826171875,37.23032838760387,9/square/12211032023/643718f88cae390005a1451f?_k=ticlye
10300100E19A440012 February 202331WV025.23https://map.openaerialmap.org/#/36.826171875,37.23032838760387,9/square/12211032023/63fbe33c4a608b000517b89b?_k=gnrmye
10300500D9F8D0008 February 202331WV022.02https://map.openaerialmap.org/#/37.529296875,37.50972584293751,9/square/12211032103/63ee16af525f0700077ed46c?_k=f1l770
10300500D9F8D2008 February 202331WV022.35https://map.openaerialmap.org/#/37.177734375,37.37015718405753,9/square/12211032031/63ecc493ca43600005f4d973?_k=uuif9o
1040010082B6D6008 February 202331WV032.57https://map.openaerialmap.org/#/37.529296875,37.50972584293751,9/square/12211032103/6436fe5b8cae390005a1451a?_k=mkdy0u
1040010082661F008 February 202331WV032.17https://map.openaerialmap.org/#/37.529296875,37.50972584293751,9/square/12211032103/643700df8cae390005a1451c?_k=3yyhlz
104001008089550013 February 202331WV031.18https://map.openaerialmap.org/#/37.6611328125,37.75334401310656,9/square/122110303322/6436f4ad8cae390005a14514?_k=ymzto3
10300100E25142008 February 202331WV020.546https://map.openaerialmap.org/#/38.2763671875,38.03078569382294,10/square/122110312033/6436edee8cae390005a1450a?_k=yqv5au

Appendix B

Figure A1. Location of the key areas. Microsoft Corporate® Bing™ Maps in the background (contour lines each 25 m). (a) Tevekkelli area, Kahramanmaraş district; (b) South Kartal area, Kahramanmaraş district; (c) East Kartal area, Kahramanmaraş district; (d) Kisik area, Pazarcık district; (e) Harmanı area, Gölbaşı district.
Geosciences 15 00252 g0a1

References

  1. Nurminen, F.; Baize, S.; Boncio, P.; Blumetti, A.M.; Cinti, F.R.; Civico, R.; Guerrieri, L. SURE 2.0—New release of the worldwide database of surface ruptures for fault displacement hazard analyses. Sci. Data 2022, 9, 729. [Google Scholar] [CrossRef] [PubMed]
  2. Wells, D.L.; Coppersmith, K.J. New empirical relationships among magnitude, rupture length, rupture width, rupture area, and surface displacement. Bull. Seismol. Soc. Am. 1994, 84, 974–1002. [Google Scholar] [CrossRef]
  3. Wesnousky, S.G. Displacement and geometrical characteristics of earthquake surface ruptures: Issues and implications for seismic-hazard analysis and the process of earthquake rupture. Bull. Seismol. Soc. Am. 2008, 98, 1609–1632. [Google Scholar] [CrossRef]
  4. Thingbaijam, K.K.S.; Mai, P.M.; Goda, K. New empirical earthquake source-scaling laws. Bull. Seismol. Soc. Am. 2017, 107, 2225–2246. [Google Scholar] [CrossRef]
  5. Shaw, B.E. Magnitude and slip scaling relations for fault-based seismic hazard. Bull. Seismol. Soc. Am. 2023, 113, 924–947. [Google Scholar] [CrossRef]
  6. Mai, P.M.; Thingbaijam, K.K.S. SRCMOD: An online database of finite-fault rupture models. Seismol. Res. Lett. 2014, 85, 1348–1357. [Google Scholar] [CrossRef]
  7. Guerrieri, L.; Michetti, A.M.; Silva, P.G. EEE Catalogue: A Global Database of Earthquake Environmental Effects. In Encyclopedia of Earthquake Engineering; Beer, M., Kougioumtzoglou, I.A., Patelli, E., Au, S.K., Eds.; Springer: Berlin/Heidelberg, Germany, 2015. [Google Scholar] [CrossRef]
  8. DuRoss, C.B.; Reitman, N.G.; Hatem, A.E.; Mason, H.B.; Lavrentiadis, G.; Asimaki, D.; Milliner, C.; Karakaş, M.; Seçen, B. Are Field Observations of Surface Rupture Useful? An Example from the 2023 Mw 7.8 Pazarcık, Turkey (Türkiye). Earthq. Seismol. Res. Lett. 2024, 96, 848–867. [Google Scholar] [CrossRef]
  9. Caglayan, A.; Isik, V.; Saber, R.; Unal, H.; Chitea, F. Analysis of surface rupture patterns and fault offset variability associated with the 06 February 2023 Pazarcik (Kahramanmaras) earthquake (mw 7.7) in Islahiye area, Turkiye. In Proceedings of the Eurasia Geoscience Congress and Exhibition, Antalya, Turkey, 10–13 November 2023; pp. 19–24. [Google Scholar]
  10. Gokceoglu, C. 6 February 2023 Kahramanmaraş–Türkiye earthquakes: A general overview. Int. Arch. Photogramm. Remote Sens. Spat. Inf. Sci. 2023, 48, 417–424. [Google Scholar] [CrossRef]
  11. Karabacak, V.; Özkaymak, Ç.; Sözbilir, H.; Tatar, O.; Aktuğ, B.; Özdağ, Ö.C.; Çakir, R.; Aksoy, E.; Koçbulut, F.; Softa, M.; et al. The 2023 Pazarcık (Kahramanmaraş, Türkiye) earthquake (Mw 7.7): Implications for surface rupture dynamics along the East Anatolian fault zone. J. Geol. Soc. 2023, 180, jgs2023-020. [Google Scholar] [CrossRef]
  12. Kürçer, A.; Elmacı, H.; Özdemir, E.; Güven, C.; Güler, T.; Avcu, İ.; Olgun, Ş.; Avcı, H.O.; Aydoğan, H.; Yüce, A.A.; et al. 06 Şubat 2023 Pazarcık (Kahramanmaraş) Depremi (Mw 7.7) Saha Gözlemleri ve Değerlendirmeler. MTA Genel Müdürlüğü, Rapor No: 14138, 2023, 187 s., Ankara. Available online: https://www.mta.gov.tr/v3.0/sayfalar/bilgi-merkezi/deprem/pdf/14138.pdf (accessed on 20 June 2025).
  13. Duman, T.Y.; Emre, Ö. The East Anatolian Fault: Geometry, segmentation and jog characteristics. Geol. Soc. Spec. Publ. 2013, 372, 495–529. [Google Scholar] [CrossRef]
  14. AFAD. 06 Şubat 2023 Pazarcik (Kahramanmaraş) Mw 7.7 Elbistan (Kahramanmaraş) Mw 7.6 Depremlerine İlişkin Ön Değerlendirme Raporu. Earthquake Department, ed. Report (In Turkish). 2023. Available online: https://deprem.afad.gov.tr/assets/pdf/Kahramanmara%C5%9F%20Depremi%20%20Raporu_02.06.2023.pdf (accessed on 20 June 2025).
  15. United States Geological Survey (USGS). M 7.8—Pazarcik Earthquake, Kahramanmaras Earthquake Sequence. National Earthquake Information Center (6 February 2023). 2023. Available online: https://earthquake.usgs.gov/earthquakes/eventpage/us6000jllz/executive (accessed on 20 June 2025).
  16. Reilinger, R.; McClusky, S.; Vernant, P.; Lawrence, S.; Ergintav, S.; Cakmak, R.; Ozener, H.; Kadirov, F.; Guliev, I.; Stepanyan, R.; et al. GPS constraints on continental deformation in the Africa–Arabia–Eurasia continental collision zone and implications for the dynamics of plate interactions. J. Geophys. Res. Solid Earth 2006, 111, B05411. [Google Scholar] [CrossRef]
  17. Dewey, J.F.; Hempton, M.R.; Kidd, W.S.F.; Saroglu, F.A.M.C.; Şengör, A.M.C. Shortening of continental lithosphere: The neotectonics of Eastern Anatolia—A young collision zone. Geol. Soc. Spec. Publ. 1986, 19, 1–36. [Google Scholar] [CrossRef]
  18. McKenzie, D.P. Active tectonics of the Mediterranean region. Geophys. J. R. Astron. Soc. 1972, 30, 109–185. [Google Scholar] [CrossRef]
  19. Şengör, A.C.; Yilmaz, Y. Tethyan evolution of Turkey: A plate tectonic approach. Tectonophysics 1981, 75, 181–241. [Google Scholar] [CrossRef]
  20. Westaway, R. Kinematics of the Middle East and Eastern Mediterranean Updated. Turk. J. Earth Sci. 2003, 12, 5–46. [Google Scholar]
  21. Westaway, R.; Demir, T.; Seyrek, A.; Beck, A. Kinematics of Active Left lateral Faulting in SE Turkey from Offset Pleistocene River Gorges: Improved Constraint on the Rate and History of Relative Motion between the Turkish and Arabian Plates. J. Geol. Soc. 2006, 163, 149–164. [Google Scholar] [CrossRef]
  22. Weiss, J.R.; Walters, R.J.; Morishita, Y.; Wright, T.J.; Lazecky, M.; Wang, H.; Hussain, E.; Hooper, A.J.; Elliott, J.R.; Rollins, C.; et al. High-resolution surface velocities and strain for Anatolia from sentinel-1 InSAR and GNSS data. Geophys. Res. Lett. 2020, 47, e2020GL087376. [Google Scholar] [CrossRef]
  23. Barka, A.A.; Kadinsky-Cade, K. Strike-slip fault geometry in Turkey and influence on earthquake activity. Tectonics 1988, 7, 663–684. [Google Scholar] [CrossRef]
  24. Tatar, O.; Sözbilir, H.; Koçbulut, F.; Bozkurt, E.; Aksoy, E.; Eski, S.; Özmen, B.; Alan, H.; Metin, Y. Surface deformations of 24 January 2020 Sivrice (Elazığ)–Doğanyol (Malatya) earthquake (Mw = 6.8) along the Pütürge segment of the East Anatolian Fault Zone and its comparison with Turkey’s 100-year-surface ruptures. Mediterr. Geosci. Rev. 2020, 2, 385–410. [Google Scholar] [CrossRef]
  25. Ambraseys, N.N.; Jackson, J.A. Faulting associated with historical and recent earthquakes in the Eastern Mediterranean region. Geophys. J. Int. 1998, 133, 390–406. [Google Scholar] [CrossRef]
  26. Tan, O.; Tapırdamaz, M.C.; Yörük, A. The earthquake catalogues for Turkey. Turk. J. Earth Sci. 2008, 17, 405–418. [Google Scholar]
  27. Bulut, F.; Bohnhoff, M.; Eken, T.; Janssen, C.; Kılıç, T.; Dresen, G. The East Anatolian Fault Zone: Seismotectonic setting and spatiotemporal characteristics of seismicity based on precise earthquake locations. J. Geophys. Res. Solid Earth 2012, 117, B07304. [Google Scholar] [CrossRef]
  28. Stucchi, M.; Şeşetyan, K.; Castelli, V.; Capera, A.A.G.; Meletti, C.; Sbeinati, M.R. About the “predecessors” of the 2023 February earthquakes, Turkey. Seismica 2024, 2. [Google Scholar] [CrossRef]
  29. Castelli, V.; Stucchi, M. The hypothesis of the 1513/1514 very large earthquake in the East Anatolian Fault Zone: Rise and weakness. J. Seismol. 2025. [Google Scholar] [CrossRef]
  30. Çetin, H.; Güneyli, H.; Mayer, L. Paleoseismology of the Palu-Lake Hazar segment of the East Anatolian Fault Zone, Turkey. Tectonophysics 2003, 374, 163–197. [Google Scholar] [CrossRef]
  31. Yüksel, Ö. Gölbaşı (Adıyaman) Dolayında Doğu Anadolu Fay Sistemi’nin Paleosismisitesi ve Zeminlerin Değerlendirilmesi. Master’s Thesis, Çukurova University, Institute of Applied Science, Adana, Turkey, 2009. [Google Scholar]
  32. Palutoğlu, M.; Şaşmaz, A. 29 November 1795 Kahramanmaraş Earthquake, Southern Turkey. Bull. Miner. Res. Explor. 2017, 155, 187–202. [Google Scholar] [CrossRef]
  33. Carena, S.; Friedrich, A.M.; Verdecchia, A.; Kahle, B.; Rieger, S.; Kübler, S. Identification of source faults of large earthquakes in the Turkey-Syria Border Region between 1000 CE and the present, and their relevance for the 2023 Mw 7.8 Pazarcık earthquake. Tectonics 2023, 42, e2023TC007890. [Google Scholar] [CrossRef]
  34. Ding, H.; Zhou, Y.; Ge, Z.; Taymaz, T.; Ghosh, A.; Xu, H.; Irmak, T.S.; Song, X. High-resolution seismicity imaging and early aftershock migration of the 2023 Kahramanmaraş (SE Türkiye) MW 7. 9 & 7.8 earthquake doublet. Earthq. Sci. 2023, 36, 417–432. [Google Scholar] [CrossRef]
  35. Harzali, M.; Medhioub, E.; Abdelmalak, M.M.; Hamdouni, A.; Troudi, H. Insights from the 06 February 2023 Mw 7.8 Kahramanmaras earthquake: Evidence into an active strike-slip faulting along the East Anatolian Fault Zone. Acta Geod. Geophys. 2023, 58, 465–497. [Google Scholar] [CrossRef]
  36. Kwiatek, G.; Martínez-Garzón, P.; Becker, D.; Dresen, G.; Cotton, F.; Beroza, G.C.; Bohnhoff, M. Months-long seismicity transients preceding the 2023 MW 7.8 Kahramanmaraş earthquake, Türkiye. Nat. Commun. 2023, 14, 7534. [Google Scholar] [CrossRef]
  37. Okuwaki, R.; Yagi, Y.; Taymaz, T.; Hicks, S.P. Multi-scale rupture growth with alternating directions in a complex fault network during the 2023 south-eastern Türkiye and Syria earthquake doublet. Geophys. Res. Lett. 2023, 50, e2023GL103480. [Google Scholar] [CrossRef]
  38. Tikhotsky, S.A.; Tatevosyan, R.E.; Rebetsky, Y.L.; Ovsyuchenko, A.N.; Larkov, A.S. The 2023 Kahramanmaraş earthquakes in Turkey: Seismic movements along conjugated faults. Dokl. Earth Sci. 2023, 511, 703–709. [Google Scholar] [CrossRef]
  39. Alkan, H.; Büyüksaraç, A.; Bektaş, Ö. Investigation of earthquake sequence and stress transfer in the Eastern Anatolia Fault Zone by Coulomb stress analysis. Turk. J. Earth Sci. 2024, 33, 56–68. [Google Scholar] [CrossRef]
  40. Dai, X.; Liu, X.; Liu, R.; Song, M.; Zhu, G.; Chang, X.; Guo, J. Coseismic Slip Distribution and Coulomb Stress Change of the 2023 MW 7.8 Pazarcik and MW 7.5 Elbistan Earthquakes in Turkey. Remote Sens. 2024, 16, 240. [Google Scholar] [CrossRef]
  41. Toda, S.; Stein, R.S. The role of stress transfer in rupture nucleation and inhibition in the 2023 Kahramanmaraş, Türkiye, sequence, and a one-year earthquake forecast. Seismol. Res. Lett. 2024, 95, 596–606. [Google Scholar] [CrossRef]
  42. Demircioğlu, M.B.; Şeşetyan, K.; Duman, T.Y.; Can, T.; Tekin, S.; Ergintav, S. A probabilistic seismic hazard assessment for the Turkish territory: Part II—Fault source and background seismicity model. Bull. Earthq. Eng. 2018, 16, 3399–3438. [Google Scholar] [CrossRef]
  43. Jia, Z.; Jin, Z.; Marchandon, M.; Ulrich, T.; Gabriel, A.A.; Fan, W.; Fialko, Y. The complex dynamics of the 2023 Kahramanmaraş, Turkey, M w 7.8-7.7 earthquake doublet. Science 2023, 381, 985–990. [Google Scholar] [CrossRef] [PubMed]
  44. Reitman, N.G.; Briggs, R.W.; Barnhart, W.D.; Hatem, A.E.; Thompson Jobe, J.A.; DuRoss Gold, R.D.; Mejstrik, J.D.; Collett, C.; Koehler, R.D.; Akçiz, S. Rapid Surface Rupture Mapping from Satellite Data: The 2023 Kahramanmaraş, Turkey (Türkiye), Earthquake Sequence. Seism. Rec. 2023, 3, 289–298. [Google Scholar] [CrossRef]
  45. Gürboğa, Ş.; Kayadibi, Ö.; Akilli, H.; Arikan, S.; Tan, S. Preliminary results of the great Kahramanmaraş 6 February 2023 Earthquakes (MW 7.7 and 7.6) and 20 February 2023 Antakya Earthquake (MW 6.4), Eastern Türkiye. Turk. J. Earth Sci. 2024, 33, 22–39. [Google Scholar] [CrossRef]
  46. Goldberg, D.E.; Taymaz, T.; Reitman, N.G.; Hatem, A.E.; Yolsal-Çevikbilen, S.; Barnhart, W.D.; Altuntaş, C. Rapid characterization of the February 2023 Kahramanmaraş, Türkiye, earthquake sequence. Seism. Rec. 2023, 3, 156–167. [Google Scholar] [CrossRef]
  47. Gkougkoustamos, I.; Krassakis, P.; Kalogeropoulou, G.; Parcharidis, I. Correlation of Ground Deformation Induced by the 6 February 2023 M7. 8 and M7. 5 Earthquakes in Turkey Inferred by Sentinel-2 and Critical Exposure in Gaziantep and Kahramanmaraş Cities. GeoHazards 2023, 4, 267–285. [Google Scholar] [CrossRef]
  48. Guo, Y.; Li, H.; Liang, P.; Xiong, R.; Hu, C.; Xu, Y. Preliminary report of coseismic surface rupture (part) of Türkiye’s MW 7.8 earthquake by remote sensing interpretation. Earthq. Res. Adv. 2024, 4, 100219. [Google Scholar] [CrossRef]
  49. Kobayashi, T.; Munekane, H.; Kuwahara, M.; Furui, H. Insights on the 2023 Kahramanmaraş Earthquake, Turkey, from InSAR: Fault locations, rupture styles and induced deformation. Geophys. J. Int. 2024, 236, 1068–1088. [Google Scholar] [CrossRef]
  50. Ou, Q.; Lazecky, M.; Watson, C.S.; Maghsoudi, Y.; Wright, T. 3D Displacements and Strain from the 2023 February Turkey Earthquakes Version 1 [Dataset]. NERC EDS Centre for Environmental Data Analysis. Available online: https://catalogue.ceda.ac.uk/uuid/df93e92a3adc46b9a5c4bd3a547cd242/ (accessed on 20 June 2025).
  51. Provost, F.; Karabacak, V.; Malet, J.P.; Van der Woerd, J.; Meghraoui, M.; Masson, F.; Pointal, E. High-resolution co-seismic fault offsets of the 2023 Türkiye earthquake ruptures using satellite imagery. Sci. Rep. 2024, 14, 6834. [Google Scholar] [CrossRef] [PubMed]
  52. Özkan, A.; Solak, H.İ.; Tiryakioğlu, İ.; Şentürk, M.D.; Aktuğ, B.; Gezgin, C.; Yavaşoğlu, H.H. Characterization of the co-seismic pattern and slip distribution of the February 06, 2023, Kahramanmaraş (Turkey) earthquakes (Mw 7.7 and Mw 7.6) with a dense GNSS network. Tectonophysics 2023, 866, 230041. [Google Scholar] [CrossRef]
  53. Barbot, S.; Luo, H.; Wang, T.; Hamiel, Y.; Piatibratova, O.; Javed, M.T.; Gurbuz, G. Slip distribution of the February 6, 2023 Mw 7.8 and Mw 7.6, Kahramanmaraş, Turkey earthquake sequence in the East Anatolian fault zone. Seismica 2023, 2. [Google Scholar] [CrossRef]
  54. He, L.; Feng, G.; Xu, W.; Wang, Y.; Xiong, Z.; Gao, H.; Liu, X. Coseismic kinematics of the 2023 Kahramanmaras, Turkey earthquake sequence from InSAR and optical data. Geophys. Res. Lett. 2023, 50, e2023GL104693. [Google Scholar] [CrossRef]
  55. Magen, Y.; Baer, A.G.; Ziv, A.; Inbal, R.N.; Nof, Y.; Hamiel, O. Piatibratova, and G. Gürbüz. Fault Coalescence, Slip Distribution, and Stress Drop of the February 2023 Southeast Türkiye Earthquakes from Joint Inversion of SAR, GNSS, and Burst Overlap Interferometry. Seismol. Res. Lett. 2024, 95, 680–696. [Google Scholar] [CrossRef]
  56. Melgar, D.; Taymaz, T.; Ganas, A.; Crowell, B.; Öcalan, T.; Kahraman, M.; Tsironi, V.; Yolsal-Çevikbilen, S.; Valkaniotis, S.; Irmak, T.S.; et al. Sub- and super-shear ruptures during the 2023 Mw 7.8 and Mw 7.6 earthquake doublet in SE Türkiye. Seismica 2023, 2. [Google Scholar] [CrossRef]
  57. Tung, S.; Sippl, C.; Shirzaei, M.; Taymaz, T.; Masterlark, T.; Medved, I. Structural controls on fault slip models of the 6 February 2023 Kahramanmaraş, Türkiye earthquake doublet with finite element analyses. Geophys. Res. Lett. 2024, 51, e2023GL107472. [Google Scholar] [CrossRef]
  58. Zhang, Y.; Tang, X.; Liu, D.; Taymaz, T.; Eken, T.; Guo, R.; Sun, H. Geometric controls on cascading rupture of the 2023 Kahramanmaraş earthquake doublet. Nat. Geosci. 2023, 16, 1054–1060. [Google Scholar] [CrossRef]
  59. Xu, L.; Mohanna, S.; Meng, L.; Ji, C.; Ampuero, J.P.; Yunjun, Z.; Hasnain, M.; Chu, R.; Liang, C. The overall-subshear and multi-segment rupture of the 2023 Mw 7.8 Kahramanmaraş, Turkey earthquake in millennia supercycle. Commun. Earth Environ. 2023, 4, 379. [Google Scholar] [CrossRef]
  60. Liu, J.; Huang, C.; Zhang, G.; Shan, X.; Korzhenkov, A.; Taymaz, T. Immature characteristics of the East Anatolian Fault Zone from SAR, GNSS and strong motion data of the 2023 Türkiye–Syria earthquake doublet. Sci. Rep. 2024, 14, 10625. [Google Scholar] [CrossRef]
  61. Ding, X.; Xu, S.; Xie, Y.; Ende, M.V.D.; Premus, J.; Ampuero, J.P. The sharp turn: Backward rupture branching during the 2023 Mw 7.8 Turkey earthquake. arXiv 2023, arXiv:2307.06051. [Google Scholar]
  62. Gabriel, A.A.; Ulrich, T.; Marchandon, M.; Biemiller, J.; Rekoske, J. 3D Dynamic Rupture Modeling of the 6 February 2023, Kahramanmaraş, Turkey M w 7.8 and 7.7 Earthquake Doublet Using Early Observations. Seism. Rec. 2023, 3, 342–356. [Google Scholar] [CrossRef]
  63. Čejka, F.; Zahradník, J.; Turhan, F.; Sokos, E.; Gallovič, F. Long-period directivity pulses of strong ground motion during the 2023 Mw 7. 8 Kahramanmaraş earthquake. Commun. Earth Environ. 2023, 4, 413. [Google Scholar] [CrossRef]
  64. Wang, Z.; Zhang, W.; Taymaz, T.; He, Z.; Xu, T.; Zhang, Z. Dynamic rupture process of the 2023 Mw 7.8 Kahramanmaraş earthquake (SE Türkiye): Variable rupture speed and implications for seismic hazard. Geophys. Res. Lett. 2023, 50, e2023GL104787. [Google Scholar] [CrossRef]
  65. Liu, C.; Lay, T.; Wang, R.; Taymaz, T.; Xie, Z.; Xiong, X.; Erman, C. Complex multi-fault rupture and triggering during the 2023 earthquake doublet in southeastern Türkiye. Nat. Commun. 2023, 14, 5564. [Google Scholar] [CrossRef]
  66. Palo, M.; Zollo, A. Small-scale segmented fault rupture along the East Anatolian fault during the 2023 Kahramanmaraş earthquake. Commun. Earth Environ. 2024, 5, 431. [Google Scholar] [CrossRef]
  67. Hu, J.; Liu, M.; Taymaz, T.; Ding, L.; Irmak, T.S. Characteristics of strong ground motion from the 2023 Mw 7.8 and Mw 7.6 Kahramanmaraş earthquake sequence. Bull. Earthq. Eng. 2024, 23, 1225–1254. [Google Scholar] [CrossRef]
  68. Çetin, K.Ö.; Ilgaç, M.; Can, G.; Çakır, E. (Eds.) Preliminary Reconnaissance Report on February 6 2023, Pazarcık Mw = 7.7 and Elbistan Mw = 7.6. Kahramanmaraş-Türkiye Earthquakes; Report N° METU/EERC 2023-01; Earthquake Engineering Research Center; Middle East Technical University: Ankara, Turkey, 2023. [Google Scholar]
  69. Aydan, Ö.; Ulusay, R.; Kumsar, H. Faulting by the 2023 great earthquakes of Türkiye and associated stress field and its effects on built environment. Geoenviron. Disasters 2024, 11, 38. [Google Scholar] [CrossRef]
  70. Demir, A.; Celebi, E.; Ozturk, H.; Ozcan, Z.; Ozocak, A.; Bol, E.; Sert, S.; Sahin, F.Z.; Arslan, E.; Dere Yaman, Z.; et al. Destructive impact of successive high magnitude earthquakes occurred in Türkiye’s Kahramanmaraş on February 6, 2023. Bull. Earthq. Eng. 2024, 23, 893–919. [Google Scholar] [CrossRef]
  71. Sagbas, G.; Sheikhi Garjan, R.; Sarikaya, K.; Deniz, D. Field reconnaissance on seismic performance and functionality of Turkish industrial facilities affected by the 2023 Kahramanmaras earthquake sequence. Bull. Earthq. Eng. 2024, 22, 227–254. [Google Scholar] [CrossRef]
  72. Öztürk, H.; Davis, C.A.; Kuşku, İ.; Dalğiç, S.; Kasapçi, C.; Şengül, M.A. Soil liquefaction and subsidence disaster in İskenderun related to the 6 February 2023 Pazarcık (Mw: 7.7) and 20 February Defne (Mw: 6.4) earthquakes, Türkiye. Turk. J. Earth Sci. 2024, 33, 85–98. [Google Scholar] [CrossRef]
  73. Sümer, Ö. Tepehan Rockslide: A large-scale earthquake-induced geological structure formed by Mw: 7.8 Kahramanmaraş (Pazarcık) earthquake, Türkiye. Turk. J. Earth Sci. 2024, 33, 40–55. [Google Scholar] [CrossRef]
  74. Emre, Ö.; Duman, T.Y.; Özalp, S.; Şaroğlu, F.; Olgun, Ş.; Elmacı, H.; Çan, T. Active fault database of Turkey. Bull. Earthq. Eng. 2018, 16, 3229–3275. [Google Scholar] [CrossRef]
  75. Little, T.A.; Morris, P.; Hill, M.P.; Kearse, J.; Van Dissen, R.J.; Manousakis, J.; Zekkos, D.; Howell, A. Coseismic deformation of the ground during large-slip strike-slip ruptures: Finite evolution of “mole tracks”. Geosphere 2021, 17, 1170–1192. [Google Scholar] [CrossRef]
  76. Civico, R.; Pucci, S.; Nappi, R.; Azzaro, R.; Villani, F.; Pantosti, D.; Cinti, F.R.; Pizzimenti, L.; Branca, S.; Brunori, C.A.; et al. Surface ruptures following the 26 December 2018, Mw 4.9, Mt. Etna earthquake, Sicily (Italy) EMERGEO Working Group (Etna 2018). J. Maps 2019, 15, 831–837. [Google Scholar] [CrossRef]
  77. Villani, F.; Pucci, S.; Civico, R.; De Martini, P.M.; Cinti, F.R.; Pantosti, D. Surface faulting of the 30 October 2016 Mw 6.5 central Italy earthquake: Detailed analysis of a complex coseismic rupture. Tectonics 2018, 37, 3378–3410. [Google Scholar] [CrossRef]
  78. Villani, F.; Pucci, S.; Azzaro, R.; Civico, R.; Cinti, F.R.; Pizzimenti, L.; Tarabusi, G.; Branca, S.; Brunori, C.A.; Caciagli, M.; et al. Surface ruptures database related to the 26 December 2018, MW 4.9 Mt. Etna earthquake, southern Italy. Sci. Data 2020, 7, 42. [Google Scholar] [CrossRef]
  79. Villani, F.; Civico, R.; Pucci, S.; Pizzimenti, L.; Nappi, R.; De Martini, P.M. A database of the coseismic effects following the 30 October 2016 Norcia earthquake in Central Italy. Sci. Data 2018, 5, 180049. [Google Scholar] [CrossRef]
  80. Emergeo Working Group [Caciagli, M.; Pucci, S.; Azzaro, R.; Di Manna, P.; Blumetti, A.M.; Poggi, V.; De Martini, P.M.; Civico, R.; Nappi, R.]. Rupture Patterns of the 2023, Mw 7.8 Kahramanmaraş Surface Faulting Earthquake, Türkiye: A Photographic Dataset. Misc. INGV, 2025; submitted. Available online: https://istituto.ingv.it/it/attivita-di-ricerca/prodotti-per-la-ricerca/le-collane-editoriali-ingv/miscellanea-ingv.html (accessed on 20 June 2025).
  81. Westoby, M.J.; Brasington, J.; Glasser, N.F.; Hambrey, M.J.; Reynolds, J.M. ‘Structure-from-Motion’ photogrammetry: A low-cost, effective tool for geoscience applications. Geomorphology 2012, 179, 300–314. [Google Scholar] [CrossRef]
  82. Christie-Blick, N.; Biddle, K.T. Deformation and Basin Formation along Strike-Slip Faults. In Strike-Slip Deformation, Basin Formation, and Sedimentation; Biddle, K.T., Christie-Blick, N., Eds.; Society of Economic Paleontologists and Mineralogists: Tulsa, OK, USA, 1985; Volume 37, pp. 1–34. [Google Scholar] [CrossRef]
  83. Dolan, J.F.; Haravitch, B.D. How well do surface slip measurements track slip at depth in large strike-slip earthquakes? The importance of fault structural maturity in controlling on-fault slip versus off-fault surface deformation. Earth Planet. Sci. Lett. 2014, 388, 38–47. [Google Scholar] [CrossRef]
  84. Bouchon, M.; Karabulut, H.; Bouin, M.P.; Schmittbuhl, J.; Vallée, M.; Archuleta, R.; Das, S.; Renard, F.; Marsan, D. Faulting characteristics of supershear earthquakes. Tectonophysics 2010, 493, 244–253. [Google Scholar] [CrossRef]
  85. Bruhat, L.; Fang, Z.; Dunham, E.M. Rupture complexity and the supershear transition on rough faults. J. Geophys. Res. Solid Earth 2016, 121, 210–224. [Google Scholar] [CrossRef]
  86. Harding, T.P. Seismic characteristics and identification of negative flower structures, positive flower structures, and positive structural inversion. AAPG Bull. 1985, 69, 585–600. [Google Scholar]
  87. De Paola, N.; Holdsworth, R.E.; McCaffrey, K.J.; Barchi, M.R. Partitioned transtension: An alternative to basin inversion models. J. Struct. Geol. 2005, 27, 607–625. [Google Scholar] [CrossRef]
  88. Huang, L.; Liu, C.Y. Three types of flower structures in a divergent-wrench fault zone. J. Geophys. Res. Solid Earth 2017, 122, 10–478. [Google Scholar] [CrossRef]
  89. Jackson, M.P.A.; Hudec, M.R. Basic Structural Geology of Strike Slip. In Salt Tectonics Principles and Practice; Cambridge University Press: Cambridge, UK, 2017; pp. 336–362. [Google Scholar] [CrossRef]
  90. MTA. 1/500.000 Scaled Geology Map of Turkey; General Directorate of Mineral Research and Exploration: Ankara, Turkey, 2002. [Google Scholar]
  91. Tchalenko, J.S.; Ambraseys, N.N. Structural Analysis of the Dasht-e Bayaz (Iran) Earthquake Fractures. Geol. Soc. Am. Bull. 1970, 81, 41–60. [Google Scholar] [CrossRef]
  92. Naylor, M.A.; Mandl, G.; Supesteijn, C.H.K. Fault geometries in basement-induced wrench faulting under different initial stress states. J. Struct. Geol. 1986, 8, 737–752. [Google Scholar] [CrossRef]
Figure 2. Example of Google Earth® images from the Şekeroba area (Figure 3 for location). (a) Pre-event image; (b) post-event image (March 2023). Arrows (oriented toward the downthrown side) point to the coseismic fault trace forming a graben. Note the road side and tree lines cut-off used as piercing points for remote-sensed, coseismic horizontal slip measurements (yellow circle); (c) post-event image (August 2023). The slightly degraded coseismic mole-track is still well visible and marked by offset tree lines and field borders, while infrastructure fixing has started.
Geosciences 15 00252 g002
Figure 7. Railway coseismic bends in the Gölbaşı area. (a) Coseismic rupture junction and location of the railway (see Figure 3a for location). The amount of shortening of the rails is reported along with the field left-lateral offset components. Bing® image in the background (contour lines each 25 m). The sketch simplifies the angular relationship between the shortened railway and the coseismic rupture strands and represents the estimated slip necessary to yield the net shortening; (b,c) aerial view (March 2023 Google Earth® images) of rail bends showing the absence of simple shear affecting the nearby features, while (d) shows a case of actual railway embankment dislocation.
Geosciences 15 00252 g007
Figure 8. Example of photogrammetric reconstruction of the coseismic deformation (Figure 3b for location). (a) Location map of the Gökçedere site (Nurdağı district). Bing ® image in the background (contour lines each 25 m); (b) Interpreted orthophotomosaic of a deformed paved road. The tile edges are used to check the correct scaling of the model and to draw reference lines (dashed cyan and yellow lines) helpful for cross-fault distribution of the dislocation. The trend of the Principal Displacement Zone (PDZ) is reported along with that of the Riedel/T-fractures alignment (SDZ); (c) detail of the interpreted orthophotomosaic.
Geosciences 15 00252 g008
Figure 10. Tevekkelli area, district of Dulkadiroğlu (Figure 3b and Figure A1a for location). (a) High-resolution DEM draped with the orthophoto. The line drawing of the structural pattern composing the mole-track is reported. The horizontal left-lateral offset component measured in both field and modeling is shown. Yellow dashed lines highlight piercing lines (road side, fence, tree lines, etc.) and cut-off used to estimate the horizontal offset; (b) close-up of the compound mole-track showing the surface expression of a positive (transpressional) flower structure; (c) aerial photo of the dislocated area.
Geosciences 15 00252 g010
Figure 12. Kartal area, district of Dulkadiroğlu (Figure 3b and Figure A1c for location). (a) High-resolution DEM draped with the orthophoto. The line drawing of the structural pattern composing the mole-track is reported. The horizontal left-lateral offset component measured in both field and modeling is shown. Yellow dashed lines highlight piercing lines (stream thalweg) cut-off used to estimate the horizontal offset; (b) aerial photo of the compound rupture paralleling the linear valley (to the left) and producing the morphological bench due to a flower structure style; (c) close-up of the narrow, clear-cut mole-track section, dislocating the stream thalweg and the channel walls.
Geosciences 15 00252 g012
Figure 14. Harmanı area, Gölbaşı district (Figure 3b and Figure A1e for location). (a) High-resolution DEM draped with the orthophoto. The compound line drawing of the structural pattern composing the mole-track is reported. The horizontal left-lateral offset component measured in both field and modeling is shown. Yellow dashed lines highlight piercing lines (fence and road) cut-off used to estimate the horizontal offset; (b) close-up of the rupture showing decametric en-echelon arrangement of the main elements running along a pressure ridge; (c) aerial photo showing en-echelon ruptures diagonally cutting the pressure ridge.
Geosciences 15 00252 g014
Figure 15. Harmanı area, Gölbaşı district (Figure 3b and Figure A1e for location). (a) High-resolution DEM draped with the orthophoto. The compound line drawing of the structural pattern composing the mole-track is reported. The horizontal left-lateral offset component measured in both field and modeling is shown. Yellow dashed lines highlight piercing lines (roads) cut-off used to estimate the horizontal offset; (b) close-up of the rupture showing a decametric-wide graben formed by the negative side of the flower structure; (c) oblique view of the natural cross-section showing the tectonic contact between bedrock and Quaternary deposits infilling the graben.
Geosciences 15 00252 g015
Figure 16. (a) Along-strike distribution of the left lateral offset component measured in the field on the main EAF trace (Amanos, Pazarcık and Ekenek segments) and on the Narlı Fault and Cakmak section, compiled from this work and literature (from [8,12,51]; (b) Distribution curve from the envelope of the maximum values, showing the contributions of the Narlı Fault and Cakmak section to the net left-lateral deformation.
Geosciences 15 00252 g016
Figure 17. (a) Interpolated along-strike distribution curves (see text for explanation) showing the segment boundaries; comparison with the distribution of (b) horizontal surface dislocation field (contour interval 20 cm) from InSAR (ALOS-2; [49]). Blue vectors represent orientation of ground movements. The white star locates the mainshock; (c) coseismic slip distribution at depth from joint GNSS and InSAR (Sentinel-1 and -2) modeling [53]. Black dots indicate aftershocks; (d) rupture speed distribution at depth from dynamic rupture modeling [62].
Geosciences 15 00252 g017
Figure 18. (a) Simplified geological map of the coseismic area [86]. Q: Quaternary continental deposits; nlcEM: Eocene–Miocene neritic limestones and clastic/carbonate rocks; plTC: Triassic–Cretaceous pelagic limestones; nlTC: Triassic–Cretaceous neritic limestones; ophM: Mesozoic ophiolites; msPM: Paleozoic–Mesozoic marbles and schists; ccP: Paleozoic clastic and carbonate rocks; (b) Location of the main geometrical complexities and related different structural styles of the 2023 earthquake surface faulting. Coseismic GNSS block motions (large red arrows) sketch the [55,57] data. Shaded relief from the 30 m DEM ASTER V003 (NASA/METI/AIST/Japan Spacesystems and U.S./Japan ASTER Science Team, 2019) as basemap; (c) conceptual model of the left-lateral strike-slip geometrical complexities. Numbering refers to panel (b) (modified from [87]); (d) block diagrams of the principal flower structures observed at the kilometer-scale complexities (modified from [87]) with simplified sketch of the associated, meter-scale mole-track expressions.
Geosciences 15 00252 g018
Disclaimer/Publisher’s Note: The statements, opinions and data contained in all publications are solely those of the individual author(s) and contributor(s) and not of MDPI and/or the editor(s). MDPI and/or the editor(s) disclaim responsibility for any injury to people or property resulting from any ideas, methods, instructions or products referred to in the content.