Article

Which Offers Greater Techno-Economic Potential: Oil or Hydrogen Production from Light Oil Reservoirs?

by
Chinedu J. Okere
1,*,
James J. Sheng
1,* and
Princewill M. Ikpeka
2
1
Bob L. Herd Department of Petroleum Engineering, Texas Tech University, Lubbock, TX 79409, USA
2
Global Challenges and Transdisciplinary Change, Brunel University, Uxbridge UB8 3PH, UK
*
Authors to whom correspondence should be addressed.
Geosciences 2025, 15(6), 214; https://doi.org/10.3390/geosciences15060214
Submission received: 16 May 2025 / Revised: 1 June 2025 / Accepted: 5 June 2025 / Published: 9 June 2025

Abstract

The global emphasis on clean energy has increased interest in producing hydrogen from petroleum reservoirs through in situ combustion-based processes. While field practices have demonstrated the feasibility of co-producing hydrogen and oil, the question of which offers greater economic potential, oil, or hydrogen, remains central to ongoing discussions, especially as researchers explore ways to produce hydrogen exclusively from petroleum reservoirs. This study presents the first integrated techno-economic model comparing oil and hydrogen production under varying injection strategies, using CMG STARS for reservoir simulations and GoldSim for economic modeling. Key technical factors, including injection compositions, well configurations, reservoir heterogeneity, and formation damage (issues not addressed in previous studies), were analyzed for their impact on hydrogen yield and profitability. The results indicate that CO2-enriched injection strategies enhance hydrogen production but are economically constrained by the high costs of CO2 procurement and recycling. In contrast, air injection, although less efficient in hydrogen yield, provides a more cost-effective alternative. Despite the technological promise of hydrogen, oil revenue remains the dominant economic driver, with hydrogen co-production facing significant economic challenges unless supported by policy incentives or advancements in gas lifting, separation, and storage technologies. This study highlights the economic trade-offs and strategic considerations crucial for integrating hydrogen production into conventional petroleum extraction, offering valuable insights for optimizing hydrogen co-production in the context of a sustainable energy transition. Additionally, while the present work focuses on oil reservoirs, future research should extend the approach to natural gas and gas condensate reservoirs, which may offer more favorable conditions for hydrogen generation.

1. Introduction

The global transition to clean energy and the drive toward decarbonization has heightened the interest in hydrogen as a sustainable energy carrier, capable of supporting a wide range of applications, including industrial processes, transportation, and energy storage [1,2,3,4]. Hydrogen is recognized for its versatility and zero-emission potential when utilized as a fuel or in various chemical processes. However, conventional hydrogen production methods, such as steam methane reforming (SMR) and water electrolysis, face significant barriers in terms of cost and scalability, which impede their widespread adoption [5,6]. With the growing demand for hydrogen, there is an urgent need to explore alternative production methods that can overcome these challenges and align global sustainability objectives.
In recent years, in situ hydrogen production has emerged as a potentially transformative solution, enabling hydrogen generation directly from hydrocarbon reservoirs [7,8,9,10]. This method takes advantage of the subsurface environment as a reactor for thermochemical hydrogen production, utilizing existing petroleum infrastructure to reduce capital expenditure and facilitating the transition to clean energy [8,11]. One promising approach within in situ hydrogen production is in situ combustion gasification (ISCG), wherein oxygen-rich gases are injected into light oil reservoirs to react with hydrocarbons, producing hydrogen alongside oil recovery [12,13]. Field reports from past enhanced oil recovery (EOR) projects have shown the potential for co-producing hydrogen and oil [14,15], providing a unique opportunity to meet both energy demands and decarbonization goals simultaneously.
Among the strategies for optimizing ISCG, air injection and CO2-enriched injection have emerged as key methods for enhancing combustion efficiency and maximizing hydrogen yield [8,16,17]. Although these injection strategies show significant promise in enhancing hydrogen production, they are accompanied by uncertainties regarding their economic viability and performance under varying operational conditions. While substantial progress has been made in understanding the technical aspects of in situ hydrogen production, there remains a notable gap in the comprehensive assessment of the economic trade-offs involved, particularly in scenarios where oil revenue continues to dominate the economic framework.
This study aims to address this gap by conducting an integrated techno-economic evaluation of hydrogen and oil production strategies in light oil reservoirs. Using 2024 CMG STARS for detailed reservoir simulations and 2024 GoldSim for economic modeling, we systematically explore the impact of various injection strategies, well configurations, reservoir quality, and formation damage on both hydrogen yield and project economics. Unlike prior studies, this work evaluates the impact of CO2 recycling costs and reservoir heterogeneity on economic viability. Furthermore, this study compares the economic implications of air injection and CO2 + O2 injection strategies, focusing on their effect on hydrogen recovery, cost efficiency, and profitability. By examining the role of CO2 management in optimizing hydrogen production alongside oil recovery, this study offers critical insights into the economic feasibility of in situ hydrogen production from petroleum reservoirs. The results presented here aim to guide future research and policy development, offering a clearer understanding of the key factors that will influence the economic viability of in situ hydrogen recovery in the context of the ongoing energy transition.

2. Method

2.1. Reservoir Modeling

This study employs reservoir simulation to evaluate in situ hydrogen generation via combustion-driven gasification in light oil reservoirs, using CMG-STARS 2024. The modeling framework is systematically structured to define key parameters, including reservoir properties, fluid composition, reaction kinetics, injection strategies, and grid resolution. The objective is to establish a predictive approach for assessing hydrogen production potential and optimizing operational conditions in light oil reservoirs.

2.1.1. Reservoir Model

The reservoir model utilized in this study is an adapted version of a previously established framework by [16,18]. A three-dimensional Cartesian grid was constructed, consisting of 9 grid blocks along the x-axis, 9 along the y-axis, and 4 layers in the z-direction, with each grid block measuring 804.6 m × 804.6 m × 48.8 m (Figure 1). The model assumes homogeneous layering with a uniform porosity of 0.13, while permeability and thickness vary across layers, as specified in Table S1. This assumption of homogeneous layering and uniform porosity was adopted to isolate and better analyze the effects of gas injection and reaction kinetics on hydrogen generation without the added complexity of heterogeneous rock properties. Such simplification is commonly used in preliminary or comparative modeling studies [e.g., [16,18]], where the focus is on evaluating conceptual process performance rather than detailed reservoir heterogeneity.

2.1.2. Fluid Model

The simulation model includes a total of ten light hydrocarbons and two non-hydrocarbon components. The properties of these components are calculated using the Peng–Robinson equation of state (EOS), as implemented in the CMG-WinProp package. This method provides a precise representation of the petroleum fluid under study. The hydrocarbons considered in the model are methane, ethane, propane, butane, pentane, hexane, heptane, octane, decane, and undecane, while the non-hydrocarbon components are carbon dioxide and nitrogen. A comprehensive summary of the properties for all twelve fluid components is presented in Table S2.
Hydrogen is not included in the fluid model as an initial or equilibrium component. Instead, it is treated as a gaseous reaction product generated from in situ combustion and gasification reactions. Consequently, the model does not explicitly simulate hydrogen solubility in oil or aqueous phases. This assumption is consistent with prior studies [e.g., [10,16]], where the focus is on gas-phase transport and generation rates rather than detailed partitioning behavior across phases.

2.1.3. Reaction Kinetics Model

Hydrogen production from light crude oil is driven by a series of intricate chemical reactions that take place across varying temperature ranges. Achieving an optimal balance between the number of reactions and components is crucial to ensuring the feasibility and reproducibility of the process while maintaining energy and mass balance. In this context, the reservoir conditions during the in situ combustion process, along with the characterization of fluid components (as outlined in the previous section), guided the selection of 21 reactions incorporated into the kinetic model. A summary of the kinetic parameters for each reaction is provided in Table S3.

2.1.4. Injection Strategy

This study investigates the feasibility of hydrogen generation from light oil reservoirs using a simultaneous gas-mixing injection technique. To assess this approach, three distinct gas mixtures were tested: air (comprising N2 and O2), a combination of CO2 and O2, and a mixture of CH4 and air. The inclusion of CH4 + air was motivated by its potential to enhance hydrogen production through methane reforming and water–gas shift reactions at elevated temperatures, as later analyzed in Section 3.1.1. These gas mixtures were selected due to their demonstrated effectiveness in previous field applications and their alignment with global CO2 reduction initiatives. The gases are injected at the simulated wellhead to analyze their behavior and effectiveness in promoting hydrogen production within the reservoir.

2.1.5. Grid Size Selection Justification

To ensure the accuracy of modeling in situ hydrogen generation from light oil reservoirs through air injection, a grid sensitivity analysis was conducted across different grid configurations to determine the optimal resolution that balances computational efficiency and model accuracy (Table 1). The analysis involved five grid configurations: 7 × 7 × 3, 9 × 9 × 4, 10 × 10 × 5, 12 × 12 × 6, and 15 × 15 × 7, each evaluated over a five-year simulation period. The key metrics assessed included cumulative hydrogen and carbon dioxide production, along with temperature profiles near the combustion front.
Table 1 demonstrates that the 7 × 7 × 3 grid configuration yielded a cumulative hydrogen production of 42,300.45 kg and a CO2 production of 1850.22 m3. The average temperature at the combustion front was 695.5 °C. The 9 × 9 × 4 grid configuration yielded a cumulative hydrogen production of 45,682.43 kg and a cumulative CO2 production of 1925.75 m3. When the grid resolution was increased to 10 × 10 × 5, cumulative hydrogen production rose slightly to 46,000.00 kg (a 0.69% increase), and CO2 production increased to 1930.50 m3 (a 0.25% increase). Further refinement to the 12 × 12 × 6 and 15 × 15 × 7 grids showed only marginal improvements, with hydrogen production reaching 46,120.70 kg and 46,200.90 kg, respectively, reflecting increases of 0.26% and 0.17%. CO2 production increased to 1935.00 m3 and 1936.25 m3, with percentage changes of 0.23% and 0.06%, respectively.
The average temperature at the combustion front remained relatively consistent, stabilizing around 698.2 °C for the 9 × 9 × 4 grid. Minimal temperature variations were observed in the finer grids, with values of 700.1 °C for the 10 × 10 × 5 grid, 701.4 °C for the 12 × 12 × 6 grid, and 702.5 °C for the 15 × 15 × 7 grid. These results suggest that the 9 × 9 × 4 grid is sufficiently accurate to capture the essential thermal dynamics, and further refinement of the grid is unnecessary.
Based on these findings, the 9 × 9 × 4 grid configuration is selected as the optimal grid for subsequent simulations. It provides reliable predictions of key parameters while maintaining computational efficiency. The marginal improvements in hydrogen and CO2 production observed at higher resolutions confirm that the 9 × 9 × 4 grid is accurate enough for modeling in situ hydrogen generation in light oil reservoirs, making it the preferred grid size for this study.

2.1.6. Reservoir Model Validation

To assess the accuracy of the reaction schemes, we conducted an integrated validation by comparing hydrogen yield data across a range of feedstocks reported in previous studies [19,20,21,22,23,24,25,26,27,28,29]. Specifically, data on hydrogen production from the uncatalyzed gasification of various fossil fuels with different hydrogen-to-carbon (H/C) ratios were compiled, including information from experimental, pilot, and commercial operations. These data served as a reference to evaluate the reliability of our model’s predictions against established hydrogen yields from comparable feedstocks (Figure 2).
The validation process involved interpolating the hydrogen yield values from these studies and comparing them with the expected yield ranges for light oil, as depicted in Figure 2. Light oils, with H/C ratios typically ranging from 1.8 to 2.1 [30], tend to produce hydrogen yields between approximately 1.25 and 1.75 Sm3/kg of fuel burned. In comparison, heavy oils, with H/C ratios ranging from 1.3 to 1.7 [27], generally yield between 1.0 and 1.5 S m3/kg. The produced hydrogen energy is less than the consumed oil energy.
The new light oil model predicted a hydrogen yield of 1.268 Sm3/kg of fuel burned. This value aligns closely with the expected range reported in the literature, suggesting that the reaction schemes in our model accurately reflect the key mechanisms of hydrogen production during in situ combustion gasification in light oil reservoirs.

2.2. Economic Modeling

In this study, an economic model is developed using GoldSim software (2024 version), which has been widely utilized for evaluating oilfield projects [31,32]. The model simulates hydrogen production through field-based processes. As depicted in Figure 3, the process begins with the injection of CO2 and oxygen into the reservoir through an injection well, initiating in situ combustion gasification of residual hydrocarbons. This reaction generates a synthesis gas containing more than 16% hydrogen [7].
At the surface, a hydrogen-selective membrane is used to extract hydrogen, while the remaining synthesis gas is recovered through production wells [7,33]. The liquid phase undergoes separation, directing oil for sale and treating water for reuse. Meanwhile, the gas phase is processed using a hydrogen-permeable membrane and a dedicated gas processing unit, where hydrocarbons are separated from CO2 and hydrogen. To enhance efficiency, the separated CO2 is compressed, mixed with fresh CO2 as required, and reinjected into the reservoir.
Figure 3. Process diagram of in situ hydrogen production from light oil reservoirs (modified from [34]).
Geosciences 15 00214 g003
The economic model consists of three primary components: injection, production, and CO2 recycling. Each of these components is further divided into submodules that account for distinct cost constraints (Table 2).

2.2.1. Injection Cost Components

This section outlines the various cost elements associated with the injection process and the corresponding well infrastructure.
Lease Equipment Costs for Injection Wells
The cost of injection-related equipment and well infrastructure significantly influences the project’s overall expenses. According to the U.S. Energy Information Administration, additional expenditures for injection wells and equipment in West Texas specifically for secondary oil recovery operations have been documented, encompassing 10 producing wells and 11 injection wells at varying depths (Table S11). The Consumer Price Index (CPI) data utilized for cost adjustments in this study is summarized in Table S5, while the cost per well is presented in Table S7.
For the purposes of this economic model, it is assumed that all required investments are made before the injection phase begins, with the entire capital expenditure allocated to the initial time step. Additionally, costs associated with exploration, drilling, and well completion are excluded, as it is assumed that the necessary infrastructure is already in place.
Annual Operating and Maintenance Costs
Throughout the project’s operational lifespan, periodic well workovers will be necessary. These include replacing tubing with corrosion-resistant alternatives to mitigate the effects of CO2 exposure. The U.S. Energy Information Administration provides an overview of direct annual operating expenses for secondary oil recovery projects in West Texas, covering 10 producing wells and 11 injection wells at various depths (Table S8).
CO2 Supply and Distribution Costs
This model incorporates cost estimates based on data from the Energy Information Administration (EIA) in 2014 [35], considering two primary constraints for CO2 distribution. A fixed expense of USD 200,000 accounts for all on-site manifolds and distribution pipelines that connect production wells to the recycling facility and subsequently to injection wells. Additionally, variable costs depend on transportation distance and flow rates, encompassing CO2 supply from pipelines.
Air Supply and Associated Costs
Air injection plays a crucial role in facilitating hydrogen generation within light oil reservoirs. Compressors are required to deliver the necessary airflow to sustain in situ combustion and gasification. The cost model accounts for both air supply and the associated equipment, including compressors and related components.
For large-scale reservoir operations, industrial-grade air compressors are used to draw in atmospheric air, filter impurities, and compress it to the required pressure before injection. These compressors, priced at approximately USD 50,000 per unit, incur annual operational expenses of around USD 5000 (Industrial Air Compressors) [31]. Maintaining appropriate injection pressures and flow rates is critical to optimizing hydrogen production efficiency.

2.2.2. Carbon Dioxide (CO2) Cost Components

This section details the costs associated with CO2 acquisition and injection.
CO2 Sourcing and Cost Considerations
The economic viability of hydrogen production from light oil reservoirs is significantly influenced by CO2 procurement and transportation expenses. CO2 can be sourced from either natural reservoirs or industrial facilities, with each option presenting unique cost implications. Naturally occurring CO2 sources generally require minimal processing, resulting in lower costs. In contrast, CO2 from industrial sources, such as ammonia plants or catalytic cracking units, tends to have higher purity but may involve additional expenses due to regulatory requirements and purification processes.
Contaminants in CO2 sources, including nitrogen (N2), hydrogen sulfide (H2S), and methane (CH4), can affect project costs by altering minimum miscibility pressure requirements or necessitating specialized infrastructure. Industrially sourced CO2 may also contain impurities such as nitrogen and carbon monoxide (CO), which require additional treatment to meet operational standards [31].
For this study, CO2 procurement costs include delivery to the project site, excluding transportation and pipeline expenses. Historically, CO2 purchase prices have shown a correlation with oil prices, averaging approximately 2.5% of the prevailing oil price, as noted in previous studies [31].
Optimizing pipeline diameter based on CO2 flow rates and transport distances is a key strategy for minimizing capital expenditures and transportation costs. As outlined in [31], pipeline optimization methods are employed to determine the most cost-effective diameters, with Tables S11 and S12 providing details on recommended sizes for different flow rates over a 100-mile (160.9 km) span, along with associated pipeline capital costs.
The estimated annual operation and maintenance costs for a 100-mile CO2 pipeline are approximately USD 900,000, irrespective of its diameter [31]. Table S13 presents transportation costs, demonstrating that higher CO2 flow rates reduce per-tonne transportation costs due to economies of scale.
A well-structured CO2 transport infrastructure is essential for sustaining project profitability over its projected 20-year duration, considering a 6% discount rate. Therefore, optimizing CO2 sourcing and transportation strategies is crucial for enhancing the economic feasibility of hydrogen production from petroleum reservoirs. This study integrates these cost components with industry’s best practices to ensure a comprehensive financial assessment and informed decision-making.
Calculation of Injection Pressure and CO2 Pressurizing Expenses
The power required for CO2 compression and injection is estimated using an iterative method outlined in [31], with inputs derived from CMG simulation results. Key CO2 properties, including viscosity, density, and compressibility factor, are determined based on temperature and pressure conditions, as referenced in [36]. If the wellhead pressure exceeds the CO2 outlet pressure (1200 psi), additional pressurization is not required, and the injection pressure is set equal to the wellhead pressure.

2.2.3. Production Cost Components

This section includes costs associated with production equipment, fluid lifting, syngas and water separation, as well as revenue and tax considerations.
Production Equipment Costs
The cost of production equipment and wells significantly influences project economics. The U.S. EIA provides cost estimates for water flooding processes in West Texas, detailing expenses for producing wells at varying depths (Table S14).
Fluid Lifting Cost
Artificial lift systems may be required to transport produced gases to the surface, particularly when reservoir pressure is insufficient. This situation is similar to CO2-EOR operations, where artificial lift is necessary in approximately 80% of projects [35]. For hydrogen production, lifting costs are determined based on well depth and fluid properties. EIA suggests energy requirements of 2–4 kWh per barrel for shallow wells and up to 25 kWh per barrel for deep wells [35]. A lifting cost of USD 0.25 per barrel of total fluid produced is used in this study based on [31].
The cost of gas–liquid separation is considered negligible in comparison to overall lifting expenses, simplifying the economic model while maintaining a focus on primary cost drivers.
Synthesis Gas and Liquid Separation Costs
The cost of synthesis gas and liquid separation via membrane technology is an important economic consideration in hydrogen production from light oil reservoirs. Membrane module costs typically range from USD 500 to USD 1500 per square meter [33], with maintenance expenses averaging 10–15% of the initial investment annually [37]. Additional equipment can increase upfront costs by 50–100% [38], and membrane replacement is required every 3–5 years [39]. These factors collectively influence the overall financial feasibility of membrane-based synthesis gas separation. Advancements in membrane technology continue to drive cost reductions and improve process efficiency.
Different types of membranes including polymeric, metallic (particularly palladium-based), and composite membranes exhibit distinct trade-offs in terms of cost and performance. Polymeric membranes are typically the most cost-effective and widely used, but they offer limited hydrogen purity (typically below 90%) and lower thermal stability [40]. Metallic membranes, especially palladium-based ones, provide high selectivity and hydrogen purities exceeding 99.9% [41], but their high capital cost and sensitivity to sulfur compounds limit their scalability. Composite membranes combine polymeric and inorganic components to offer a balance between cost and selectivity, achieving intermediate performance with promising economic potential for industrial use [7,33].
From an economic standpoint, polymeric membranes dominate current deployment due to their affordability. However, in scenarios where high hydrogen purity is required, such as for fuel cell applications or pipeline injections, metallic and composite membranes are increasingly considered. The choice of membrane directly affects final hydrogen quality, separation efficiency, and purification costs, making it a critical factor in assessing the feasibility of hydrogen recovery from petroleum reservoirs.
Oil–Water Separation Cost
The cost of separating oil and water is another critical factor in evaluating the economic feasibility of hydrogen production from petroleum reservoirs. Schlumberger [42] provides cost projections for fluid production rates between 20,000 and 200,000 barrels per day, with costs reported in 2000 US dollars (Table S17).
Production Revenue, Taxes, and Royalties
For this analysis, hydrogen is priced at 3 USD/kg, consistent with current market estimates [43,44]. This value aligns with recent U.S. Department of Energy reports and industry analyses, which indicate that clean hydrogen production costs typically range between 2 and 6 USD/kg, depending on production pathway and scale. A royalty rate of 10% is applied, reflecting standard energy sector agreements [45,46]. Additionally, a severance tax of 2% is considered, aligning with incentives for innovative energy projects [47,48]. It is important to mention that these values are based on American fiscal regimes and may not be applicable elsewhere.
Residual income (R) is determined using Equation (1):
R = ( P H × Q H ) × ( 1 τ R τ S )    
where PH is the hydrogen price (USD/kg), QH is the hydrogen production rate (kg/day), τR is the royalty rate, and τS is the severance tax rate.

2.2.4. Carbon Dioxide Recycling Cost Components

This section covers costs associated with production equipment, fluid lifting, syngas and water separation, and revenue considerations.
Gas Treatment: Separation and Compression
Recycling CO2 plays a vital role in optimizing hydrogen production from light oil reservoirs by improving process efficiency and sustainability. During hydrogen extraction, a portion of the injected CO2 is produced alongside hydrogen and other gases. To sustain reservoir pressure and maximize hydrogen recovery, this CO2 must be separated and reinjected. The proportion of CO2 recycled typically falls within the range of 15–50% of the total injected volume [16,29].
Once produced, the gas mixture enters the processing unit, where CO2 is separated from other components, including methane and other hydrocarbons. If present in significant quantities, these hydrocarbons can be separated and sold as valuable by-products. Their concentration varies throughout the injection period, often peaking during the early phases [49]. Various gas separation techniques are summarized in Table S19, with refrigeration and compression being primary energy-consuming processes.
In this study, the refrigeration method is considered for CO2 separation, given its cost-effectiveness and widespread industrial use [49,50,51]. The capital investment for refrigeration-based separation is approximately USD 500 per Mscf/day of processed gas [51], with hydrocarbon recovery rates between 20% and 50%. Alternative separation techniques, such as membrane-based systems, can achieve effective separation but are associated with higher costs due to the need for CO2 recompression. The Ryan Holmes process, another viable option, remains expensive. For simplification, the cost model assumes a fixed capital expenditure of USD 500 per Mscf/day for CO2 separation from hydrocarbon gases.
Following separation, the CO2 undergoes compression to reach critical pressure before being further pressurized to 1200 psi (8.27 MPa) via a pumping system [51]. The cost of compression is estimated by evaluating compression power requirements, capital investment for compressors, and associated operational and maintenance expenses. This assessment aligns with the cost estimation framework outlined in [51], ensuring a comprehensive economic evaluation of the CO2 recycling process.
CO2 compression is a significant cost factor. The separated CO2, initially at atmospheric pressure (0.1 MPa), must be compressed to its critical pressure of 7.39 MPa before being pumped to a final pressure of 8.27 MPa (1200 psi). A five-stage compression system is recommended for achieving this pressure increase efficiently [52]. Compression power requirements at each stage are calculated using Equations (S6)–(S8).
Once compression is complete, the CO2 is pressurized using a pump. The capital expenditure for the pump is estimated at 20% of the compressor cost, inclusive of operational and maintenance expenses. Compressor capital costs are typically determined based on power requirements, with estimates varying across different sources. The EIA suggests a cost of USD 2000 per horsepower (hp), while [53] reports values ranging from USD 1060 to USD 3000 per hp. For this study, a median value of USD 2500 per hp is adopted for capital cost estimation. Energy consumption constitutes the primary operational expense, with electricity costs based on the Texas state average retail price of 13 cents per kilowatt-hour [54].

2.2.5. Economic Modeling Parameters

Table 3 summarizes the key input parameters and constraints applied in the economic model. Where necessary, all cost values have been adjusted to 2024 US dollars.

2.2.6. Reservoir Classification for Techno-Economic Simulations

Reservoir classification in this study is based on productivity, as it directly influences both fluid flow efficiency and economic performance. Key parameters such as porosity and permeability determine fluid storage and mobility, which in turn impact production rates and recovery efficiency critical factors in assessing project economics.
Table 4 presents the classification criteria used in this study, aligning with the established literature [55,56,57]. The classification enables a systematic evaluation of how different reservoir qualities affect hydrogen yield, oil production, and overall project viability. By incorporating this classification into techno-economic simulations, the present study assesses variations in capital and operational expenditures, well performance, and gas processing costs across different reservoir types. This approach ensures that economic projections accurately reflect the production potential and associated financial implications of hydrogen and oil recovery.
As supported by sources such as [55,56,57], low-permeability reservoirs typically exhibit values below 1 md, while moderate-permeability formations range between 1 and 10 md. High-permeability reservoirs exceed 10 md. Additionally, [58] defines low-porosity formations as those with less than 10% porosity, while moderate-porosity formations range from 10% to 20%, and high-porosity formations exceed 20%. This classification provides a structured framework for evaluating how reservoir properties influence production rates, operating costs, and overall economic feasibility of hydrogen and oil recovery.

3. Results and Discussion

3.1. Technical Considerations for Hydrogen Production from Light Oil Reservoirs

This section examines the key factors influencing hydrogen production under in situ conditions. The assessment focuses on critical aspects such as hydrogen and synthesis gas generation across different injection strategies, the influence of reservoir characteristics and well configuration, and the impact of formation damage on hydrogen yield.

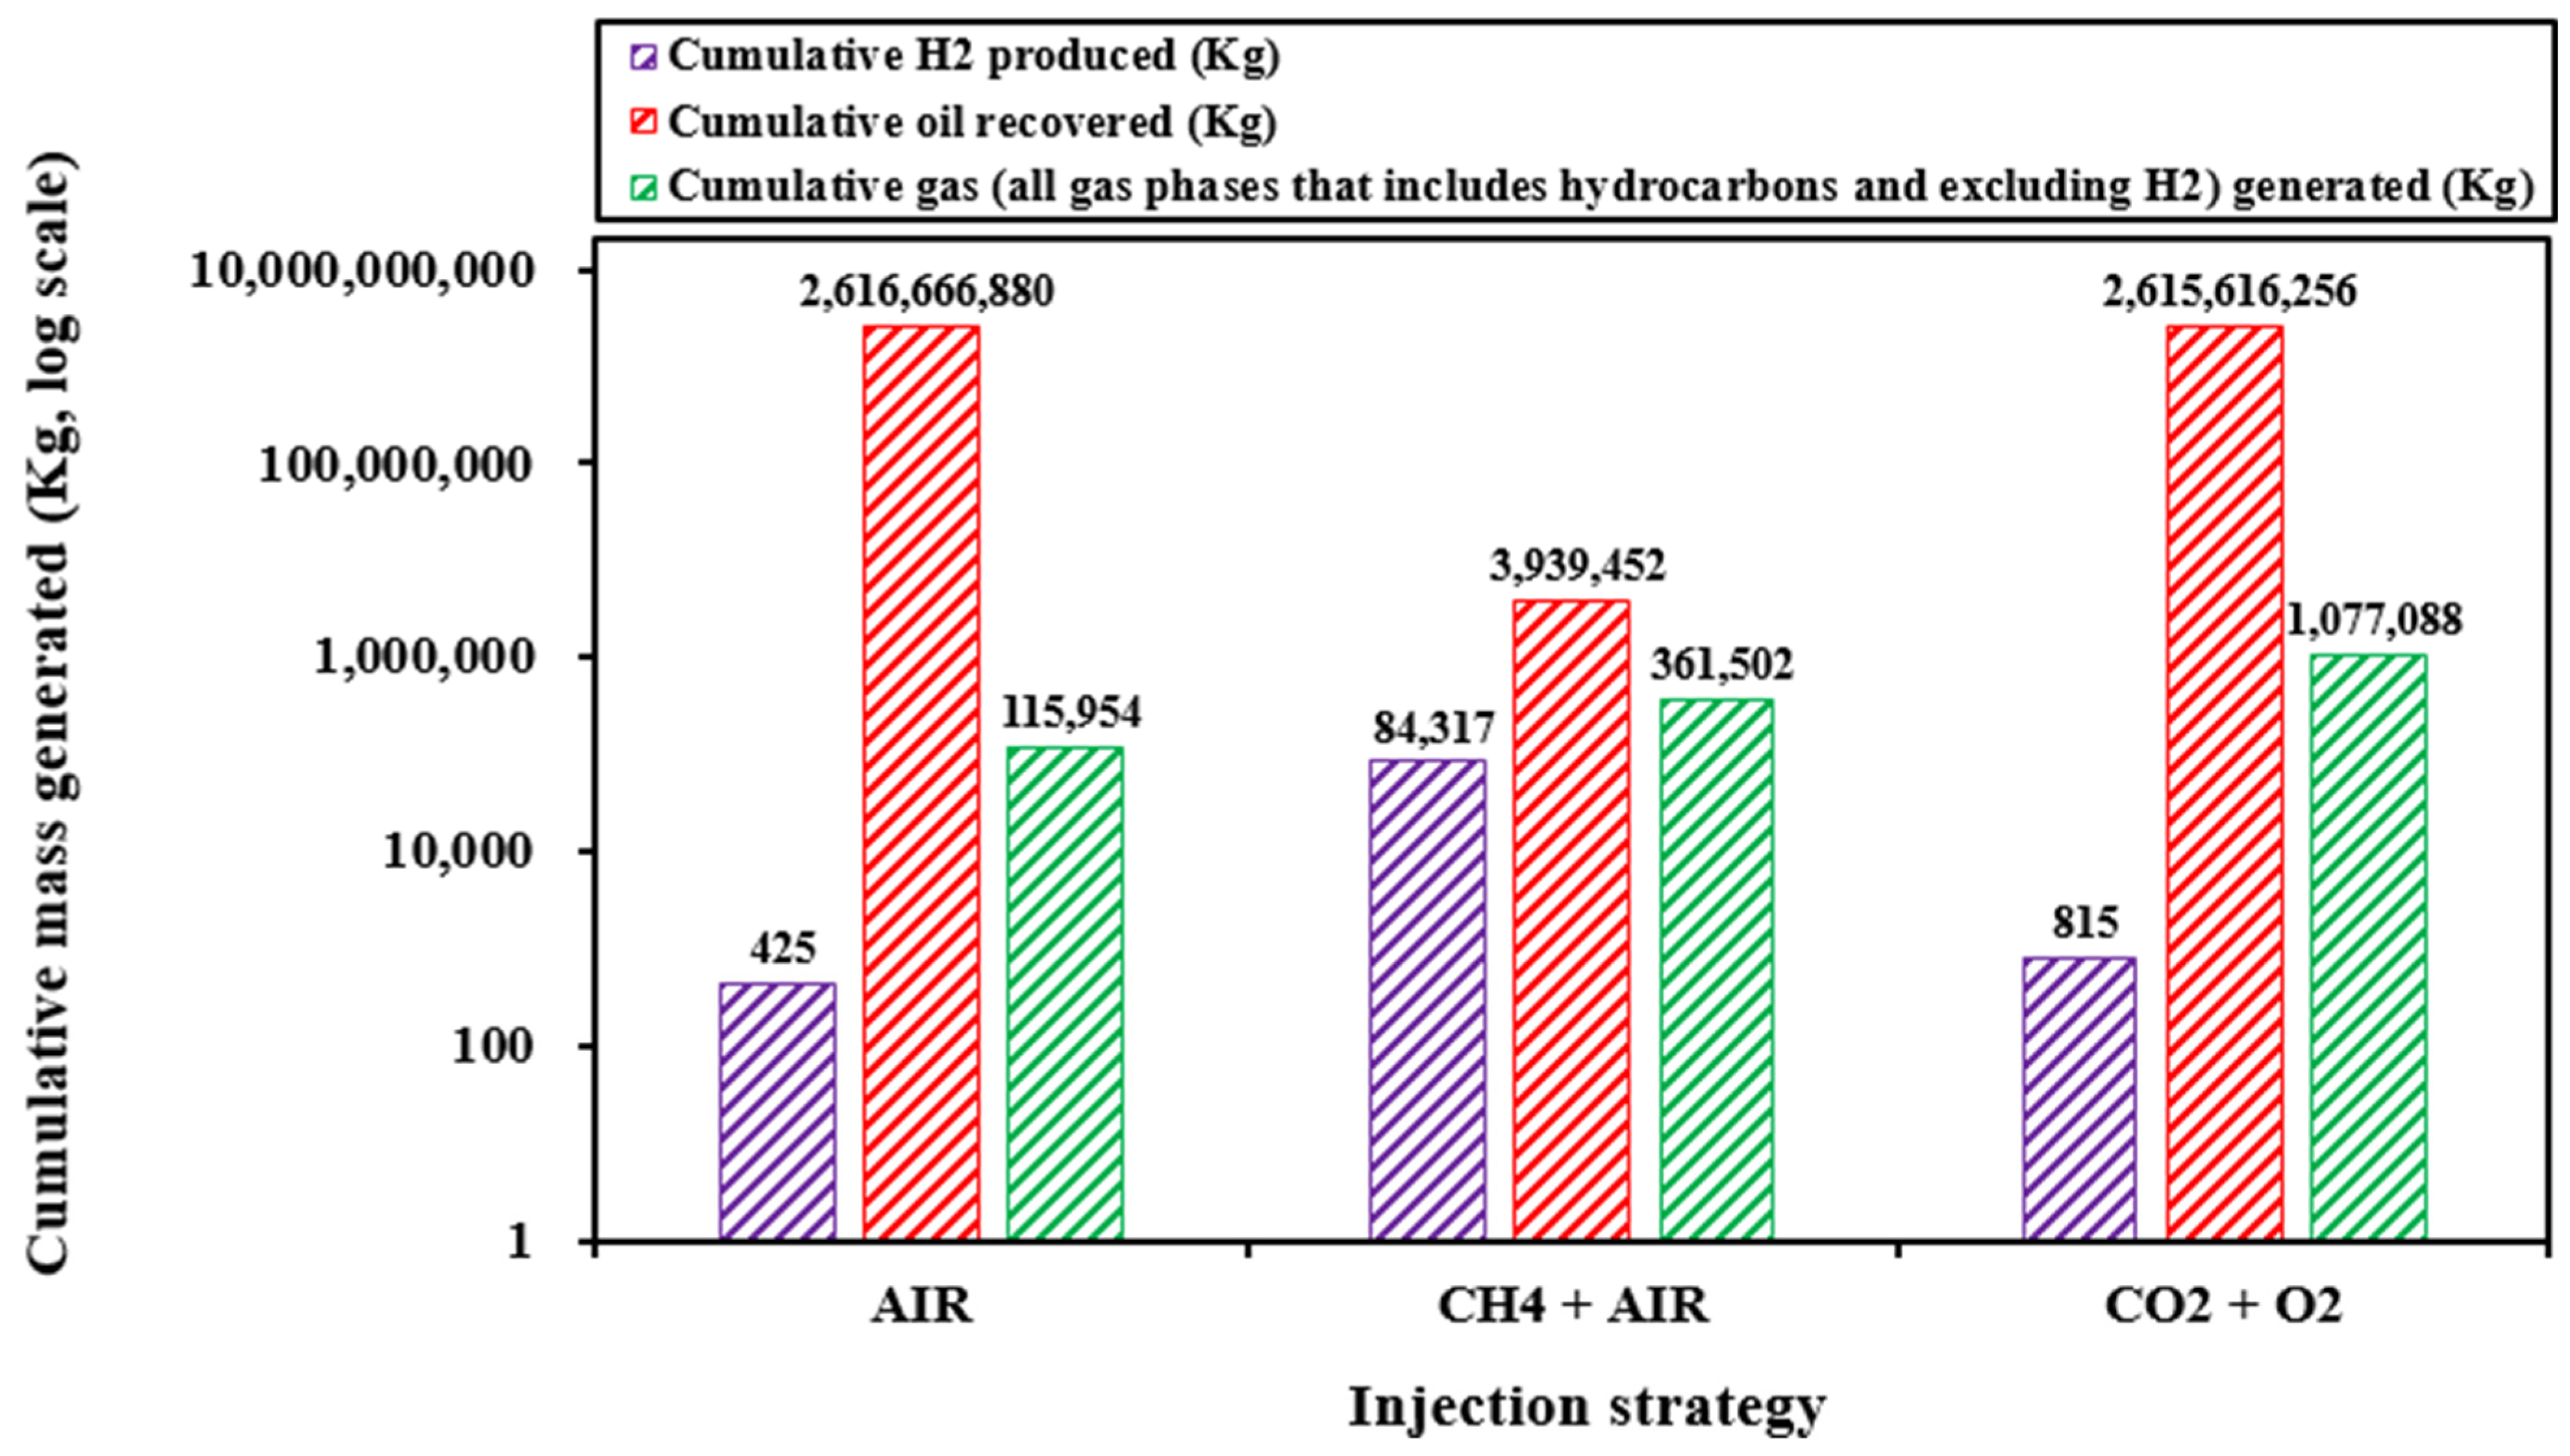
3.1.1. Influence of Injection Strategy on Hydrogen Production

Utilizing the base model outlined in Section 2.1, the results presented in Figure 4 illustrate how hydrogen production varies under different injection strategies. Among the evaluated methods, the CH4 + air injection strategy demonstrates the highest cumulative hydrogen production, significantly exceeding the yields achieved by CO2 + O2 and air-only injection methods. As indicated in Figure 4, this enhanced performance is likely due to the favorable chemical reactions occurring at elevated temperatures, particularly methane reforming and water–gas shift reactions, which facilitate greater hydrogen release under subsurface conditions [16,17,18].
Alongside hydrogen, each injection strategy also produces substantial volumes of non-hydrogen gases, with the CH4 + air method generating the largest amount. This suggests that while methane-enriched injection enhances hydrogen yield, it also leads to significant synthesis gas production, necessitating efficient gas separation techniques. The presence of high gas volumes can complicate separation processes, increasing both operational expenses and energy demands [29,59,60].
The effectiveness of each injection strategy also extends to oil recovery. Notably, the air-only injection approach results in substantial crude oil production. While increased oil recovery may be beneficial for continued fossil fuel extraction, it presents challenges for hydrogen-focused operations. Excessive oil extraction could disrupt hydrogen migration within the reservoir, potentially leading to hydrogen retention in the formation and reduced recovery at the surface. Additionally, microbial activity, hydrogen-consuming reactions, and losses through porous rock structures may further reduce the volume of hydrogen reaching production wells [7,61,62].
These variations in hydrogen generation, synthesis gas output, and oil recovery highlight the importance of selecting an injection strategy aligned with specific operational goals. For projects prioritizing hydrogen production, the CH4 + air method offers a promising approach, despite its challenges related to gas separation. However, for dual-purpose operations targeting both hydrogen generation and crude oil recovery, the air-only or CO2 + O2 strategies may be preferable, even though they yield lower hydrogen volumes. Achieving a balance between maximizing hydrogen output and addressing technical challenges such as synthesis gas separation and hydrogen migration control is essential for ensuring the economic and operational viability of repurposing light oil reservoirs for hydrogen production.

3.1.2. Influence of Reservoir Characteristics and Well Configuration on Hydrogen Production

This section investigates how reservoir characteristics, well configuration, and spacing influence hydrogen production, using the base simulation parameters from Section 2.1. The primary focus is to assess how variations in reservoir heterogeneity, injector–producer distance, and well placement strategies affect hydrogen yield and the spatial distribution of hydrogen concentration within the reservoir. By modifying the base case model, insights are derived on how these factors affect hydrogen production efficiency.
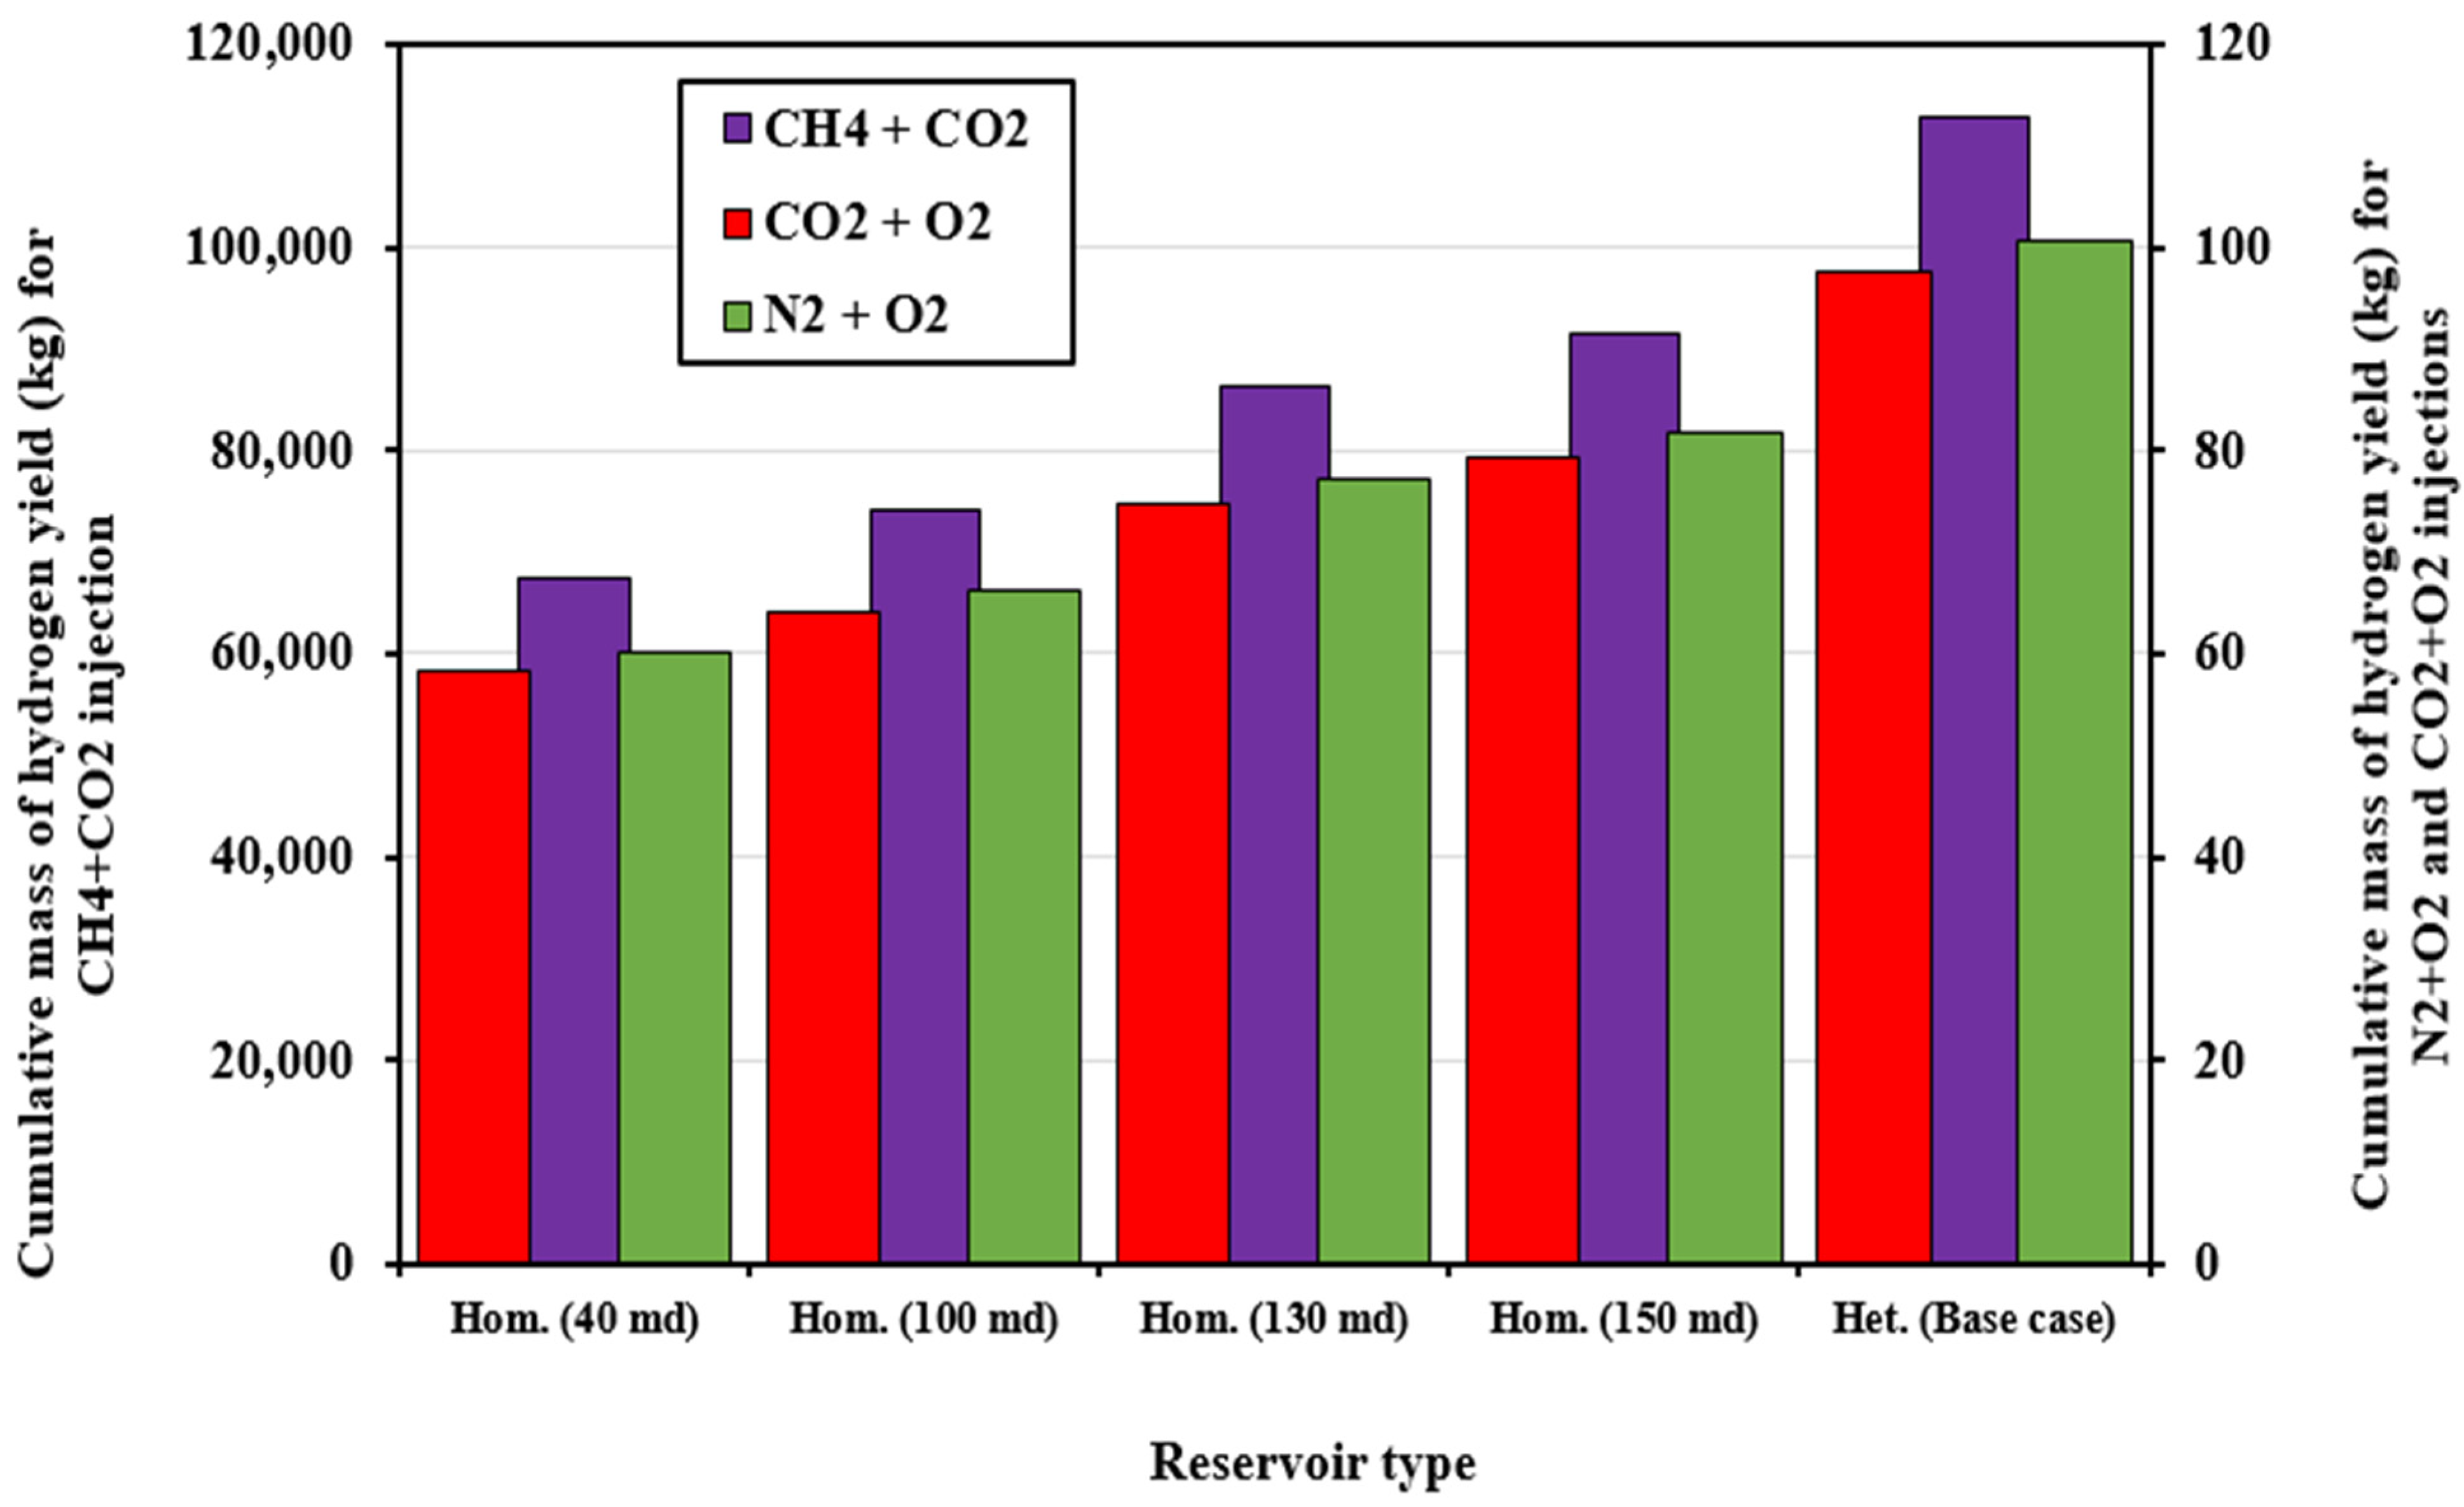
Impact of Reservoir Heterogeneity
Figure 5 illustrates how reservoir heterogeneity impacts cumulative hydrogen production across different injection scenarios. In homogeneous formations, increased permeability enhances hydrogen generation due to improved fluid flow, better mixing of reactants, and more effective in situ reactions. For example, in the CH4 + CO2 injection case, hydrogen yield increases from 67,538.219 kg at 40 md to 91,520.227 kg at 150 md, highlighting the strong influence of permeability on combustion and gasification processes. Similarly, for the CO2 + O2 and N2 + O2 injection strategies, hydrogen yields improve with increasing permeability, rising from 58.436 kg to 79.186 kg and from 60.280 kg to 81.685 kg, respectively.
However, the results in Figure 5 indicate that a heterogeneous reservoir generates higher hydrogen volumes than any of the homogeneous cases. This suggests that permeability variations and geological complexity in heterogeneous formations facilitate more efficient gas transport and enhance combustion front stability, leading to greater hydrogen output. The superior performance of the heterogeneous model underscores the significance of natural high-permeability pathways, which promote improved air injection efficiency and reaction propagation compared to uniform homogeneous systems.
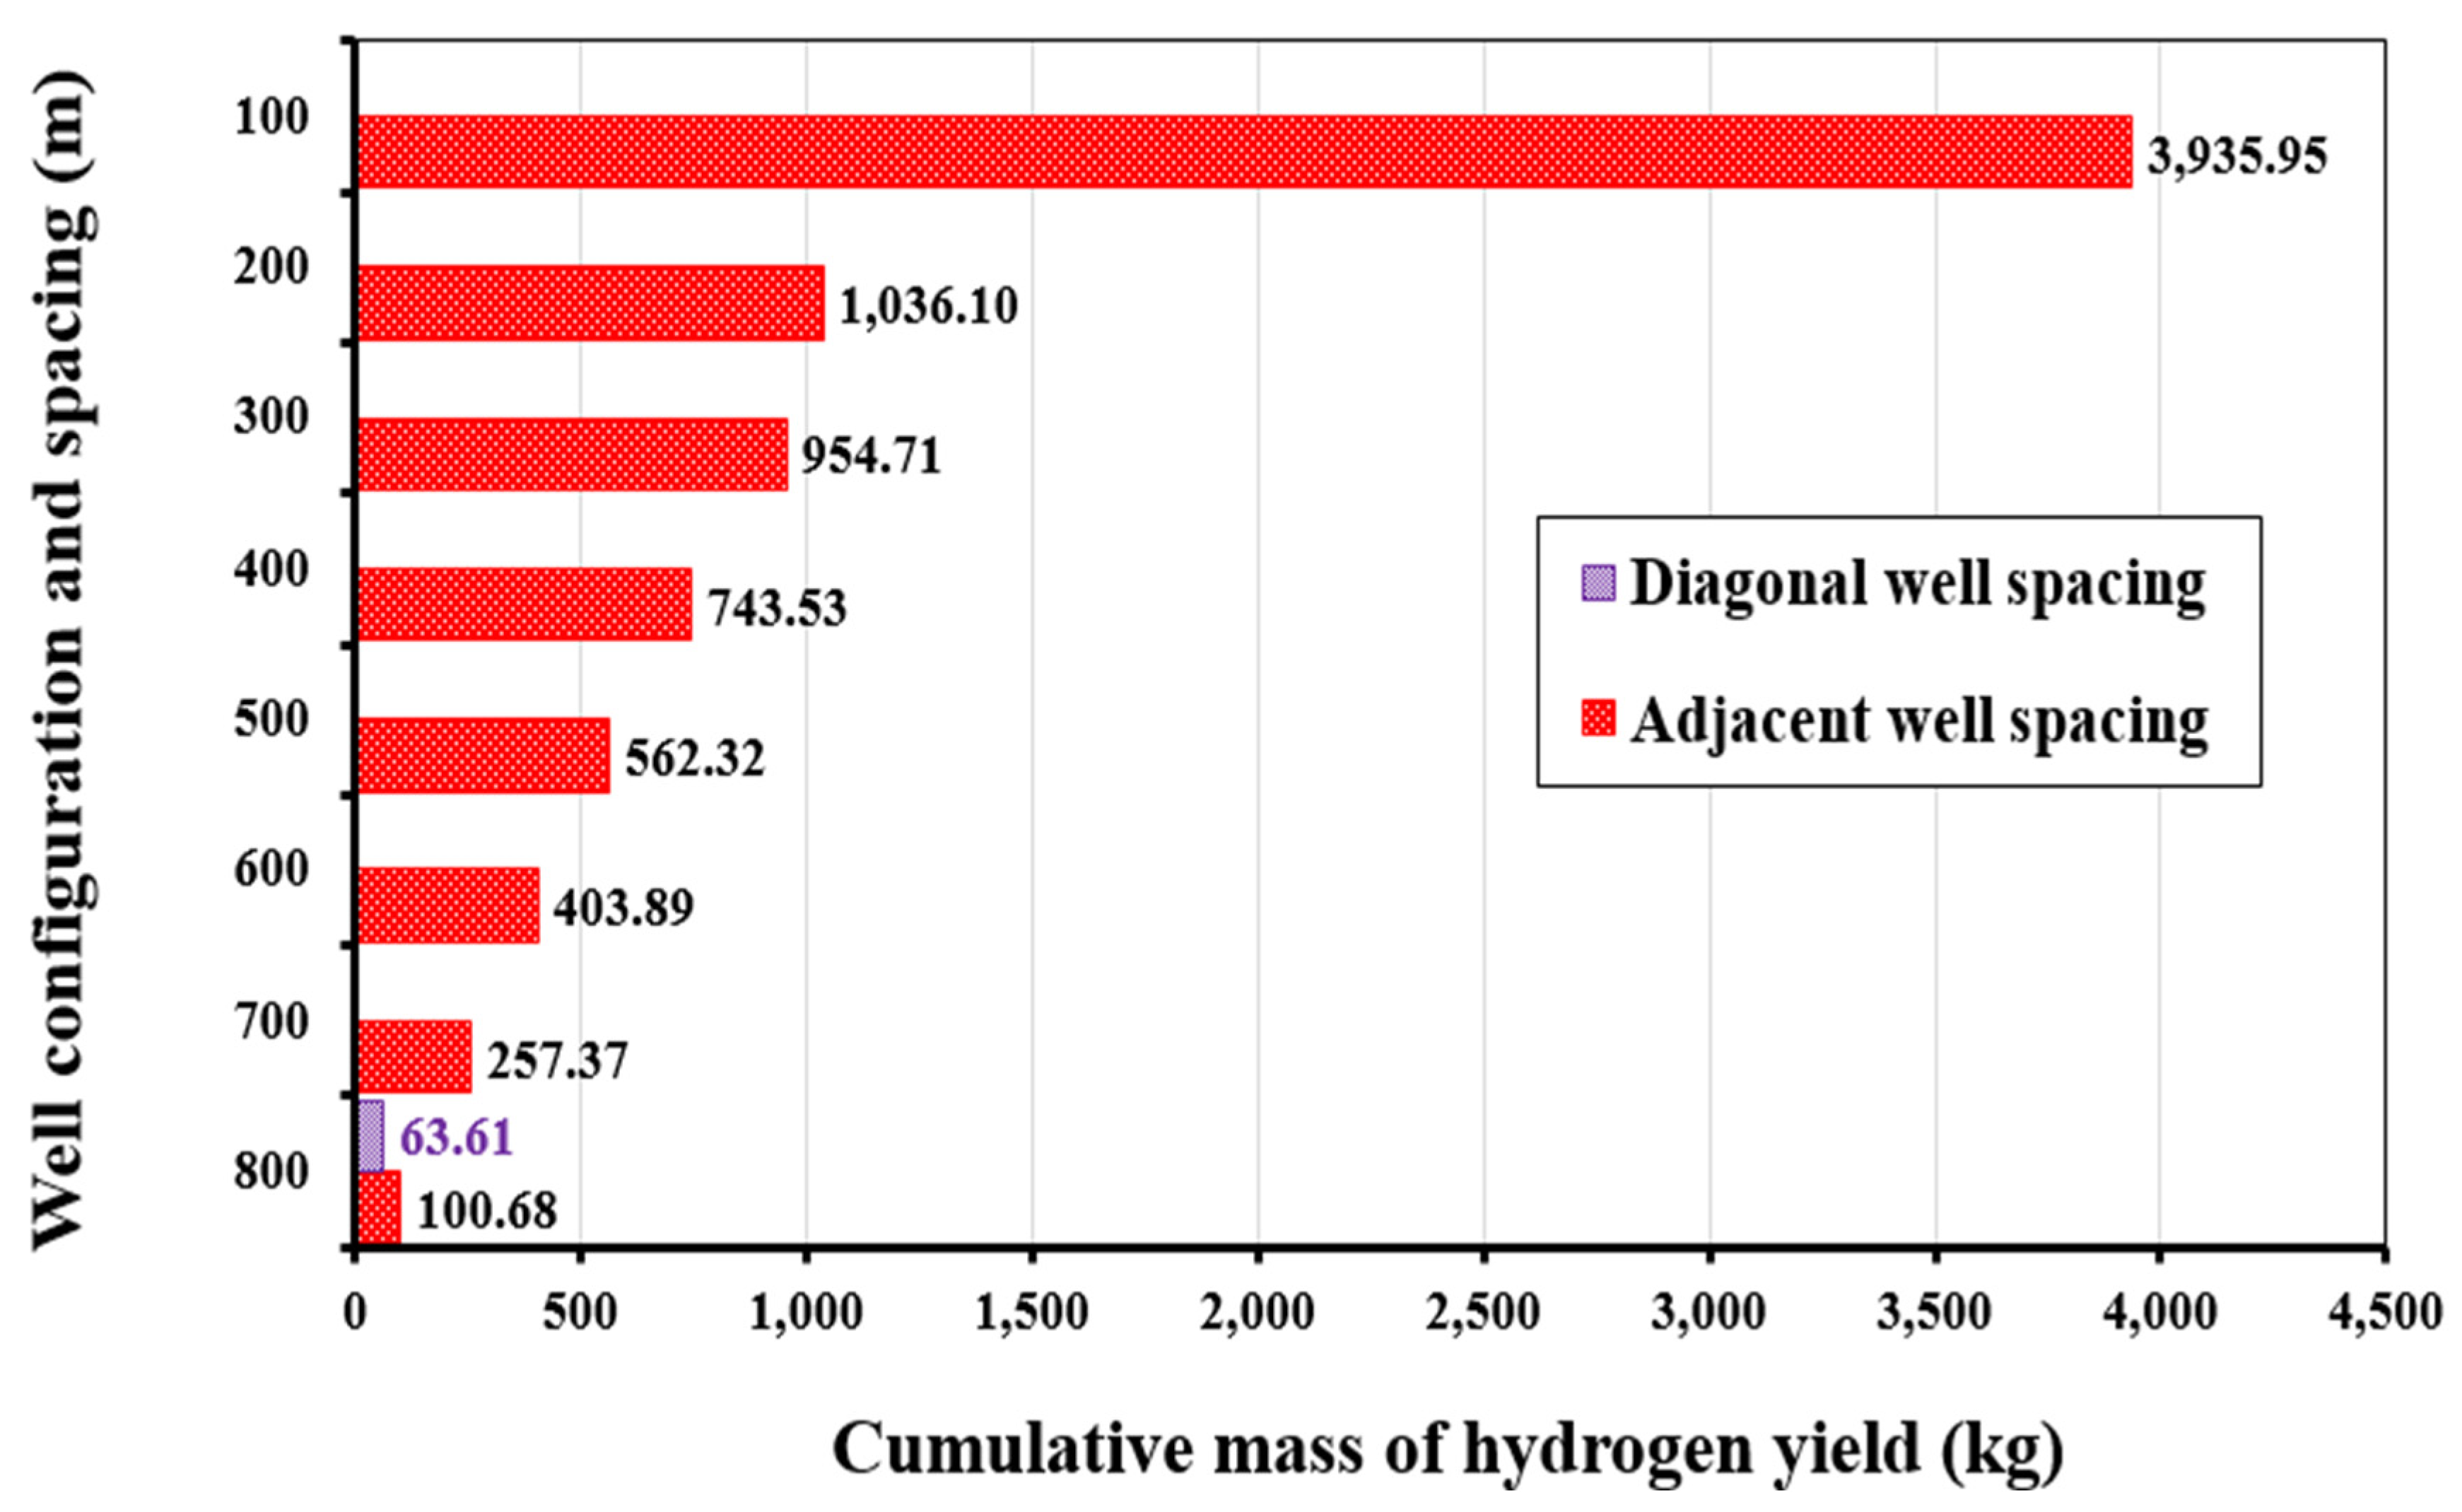
Impact of Well Configuration and Spacing
The influence of well placement strategies on hydrogen generation is depicted in Figure 6. The diagonal injector–producer arrangement, serving as the base case, results in a cumulative hydrogen yield of 63.614 kg. In contrast, placing wells adjacent to each other significantly increases hydrogen recovery, particularly as injector–producer spacing is reduced. This trend suggests that decreasing well spacing improves combustion front propagation, enhances gas displacement efficiency, and minimizes hydrogen loss. At shorter distances, more effective oxygen utilization and reaction kinetics drive in situ hydrogen production, making adjacent well placement more efficient than diagonal configurations in maximizing yield.
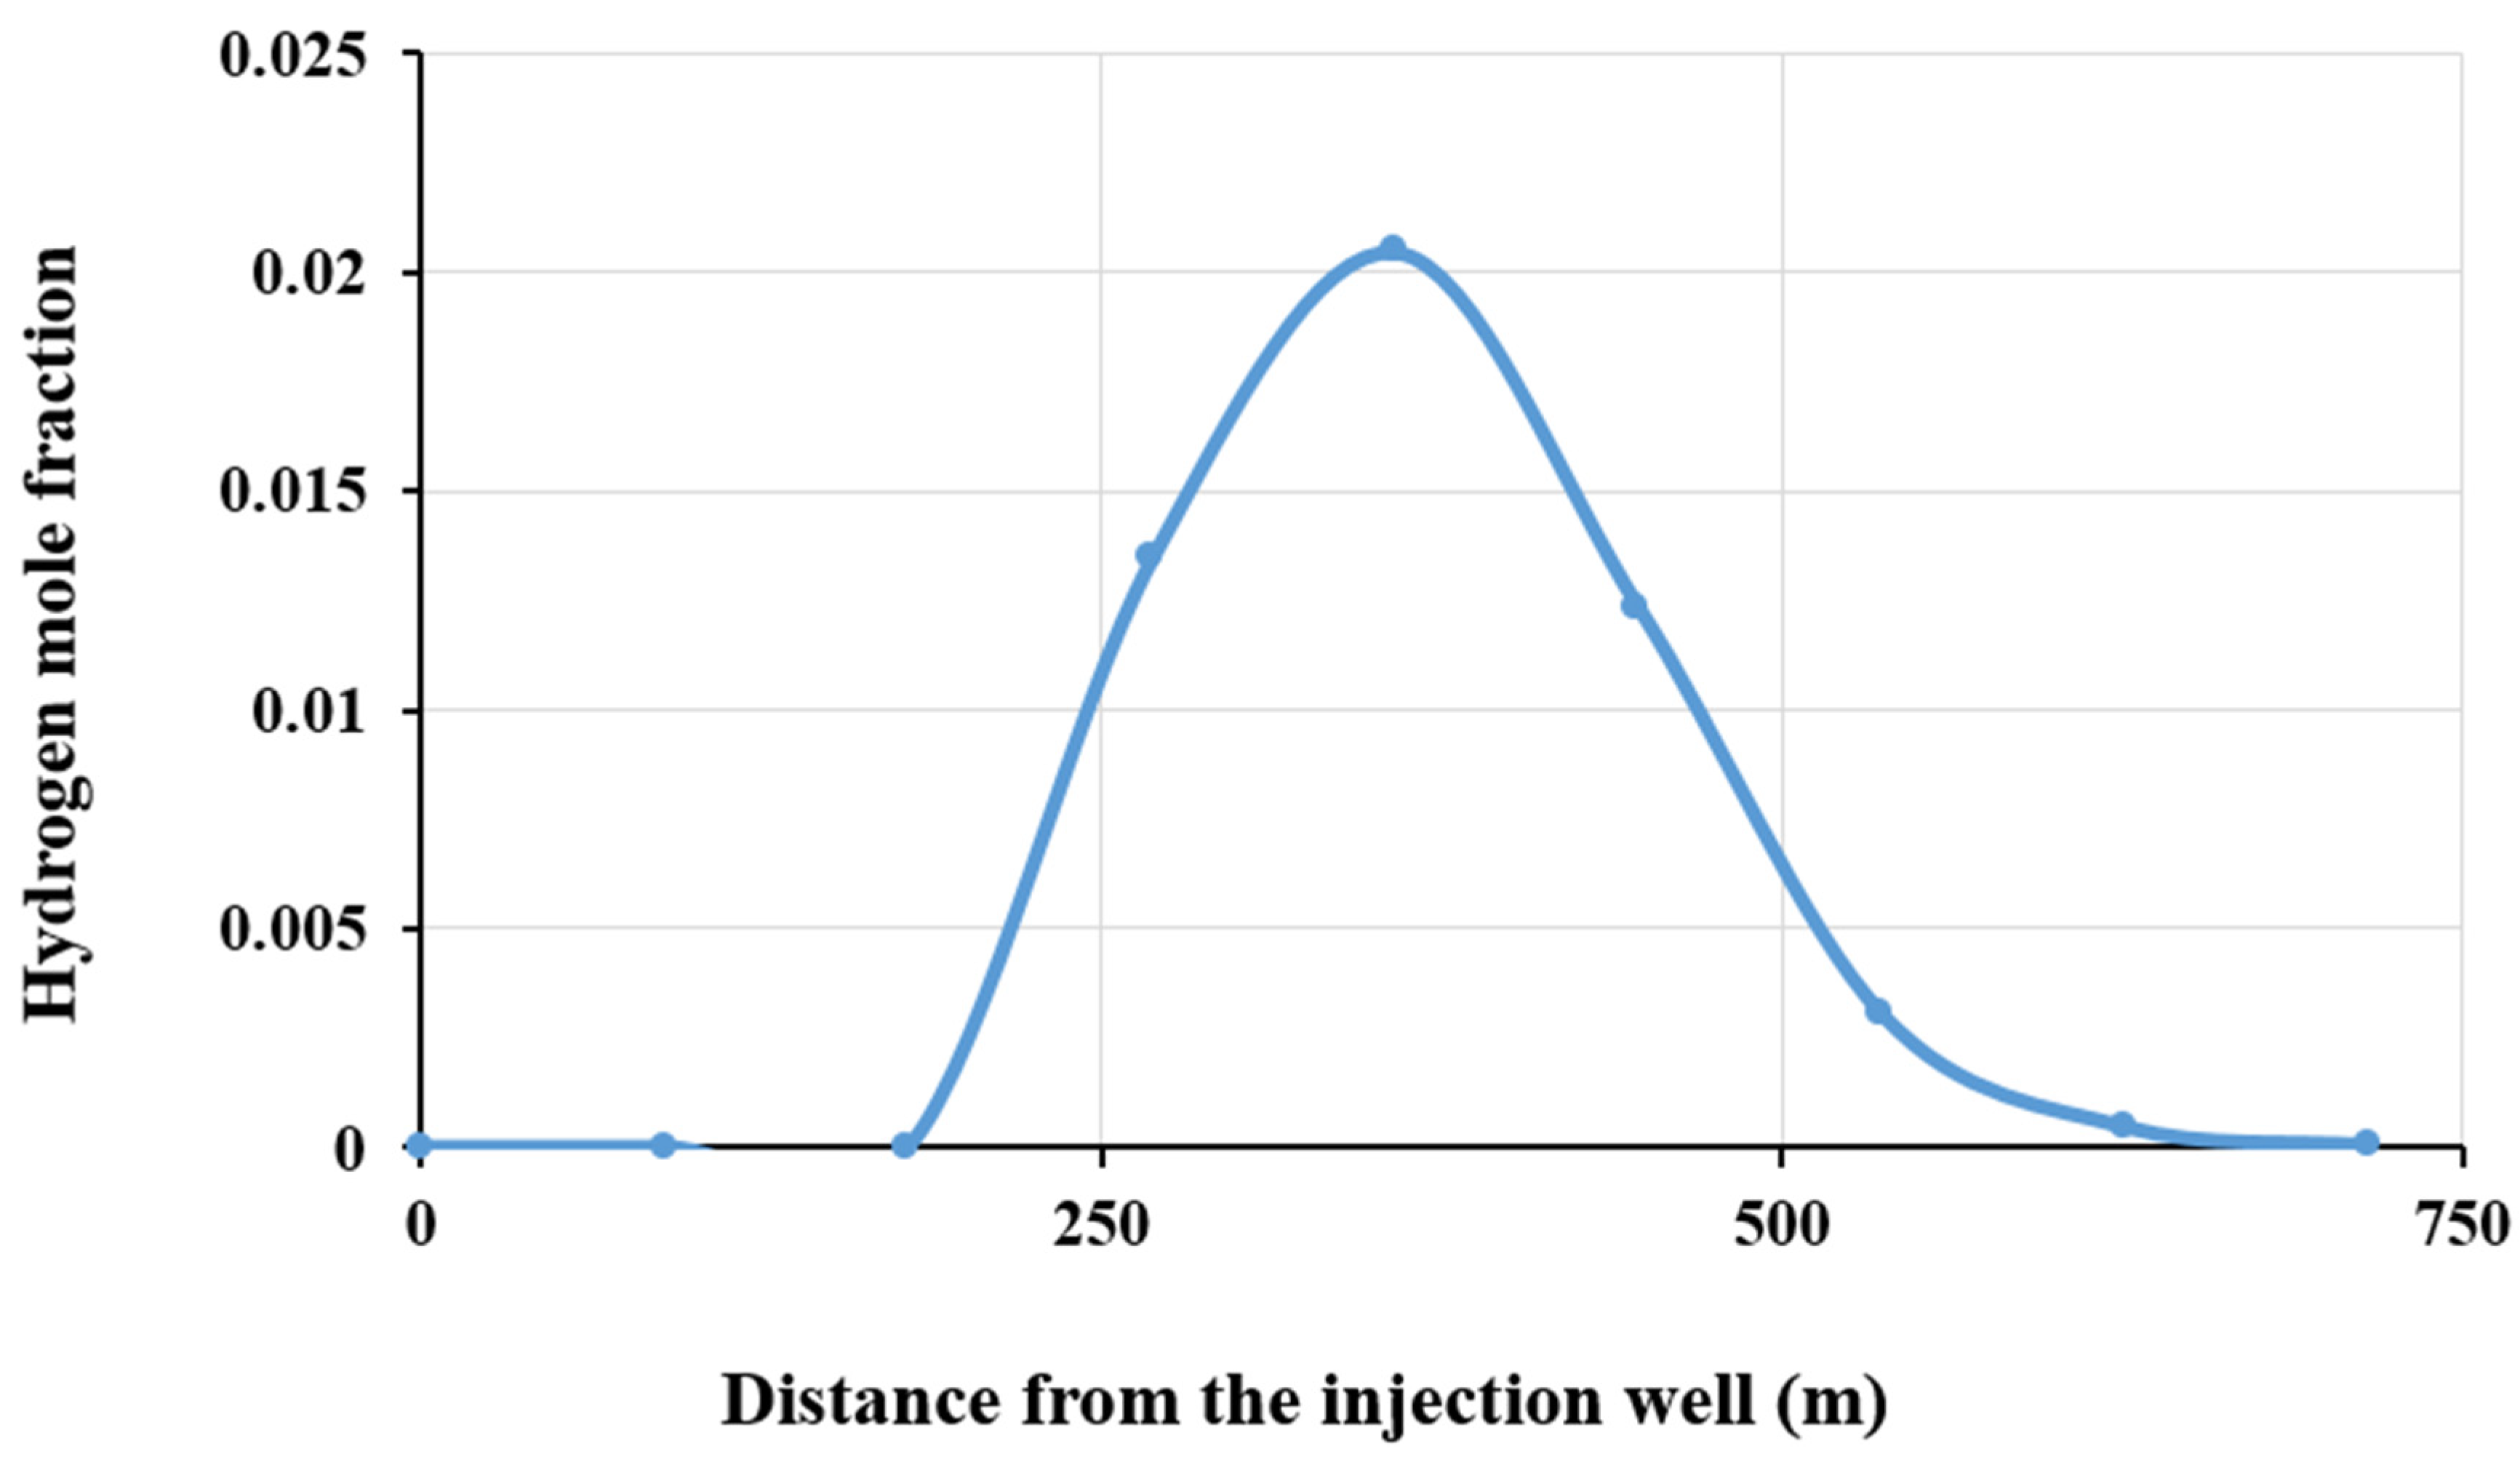
Hydrogen Distribution and Well Placement Optimization
Figure 7 illustrates the variation in hydrogen mole fraction relative to distance from the injector, offering insights into hydrogen transport and production efficiency. As expected, hydrogen concentration at the injector (0 m) is negligible since production occurs downstream through in situ reactions. Hydrogen levels gradually increase with distance, reaching a peak concentration zone before declining. The drop in hydrogen mole fraction beyond this peak suggests potential secondary reactions, such as methanation and oxidation, which consume hydrogen [7].
The positioning of the producer relative to the injector plays a crucial role in optimizing hydrogen recovery. If the producer is located too far away, hydrogen transport efficiency declines due to dispersion, diffusion losses, and potential interactions with residual hydrocarbons or rock minerals. Conversely, placing the producer too close by may reduce hydrogen generation time and disrupt combustion front progression. The observed peak hydrogen concentration suggests that the optimal producer location should fall within the reservoir boundaries to maximize recovery before significant losses occur [63]. These findings highlight the importance of strategic well placement and spacing optimization to balance hydrogen generation, transport, and production efficiency in light oil reservoirs.

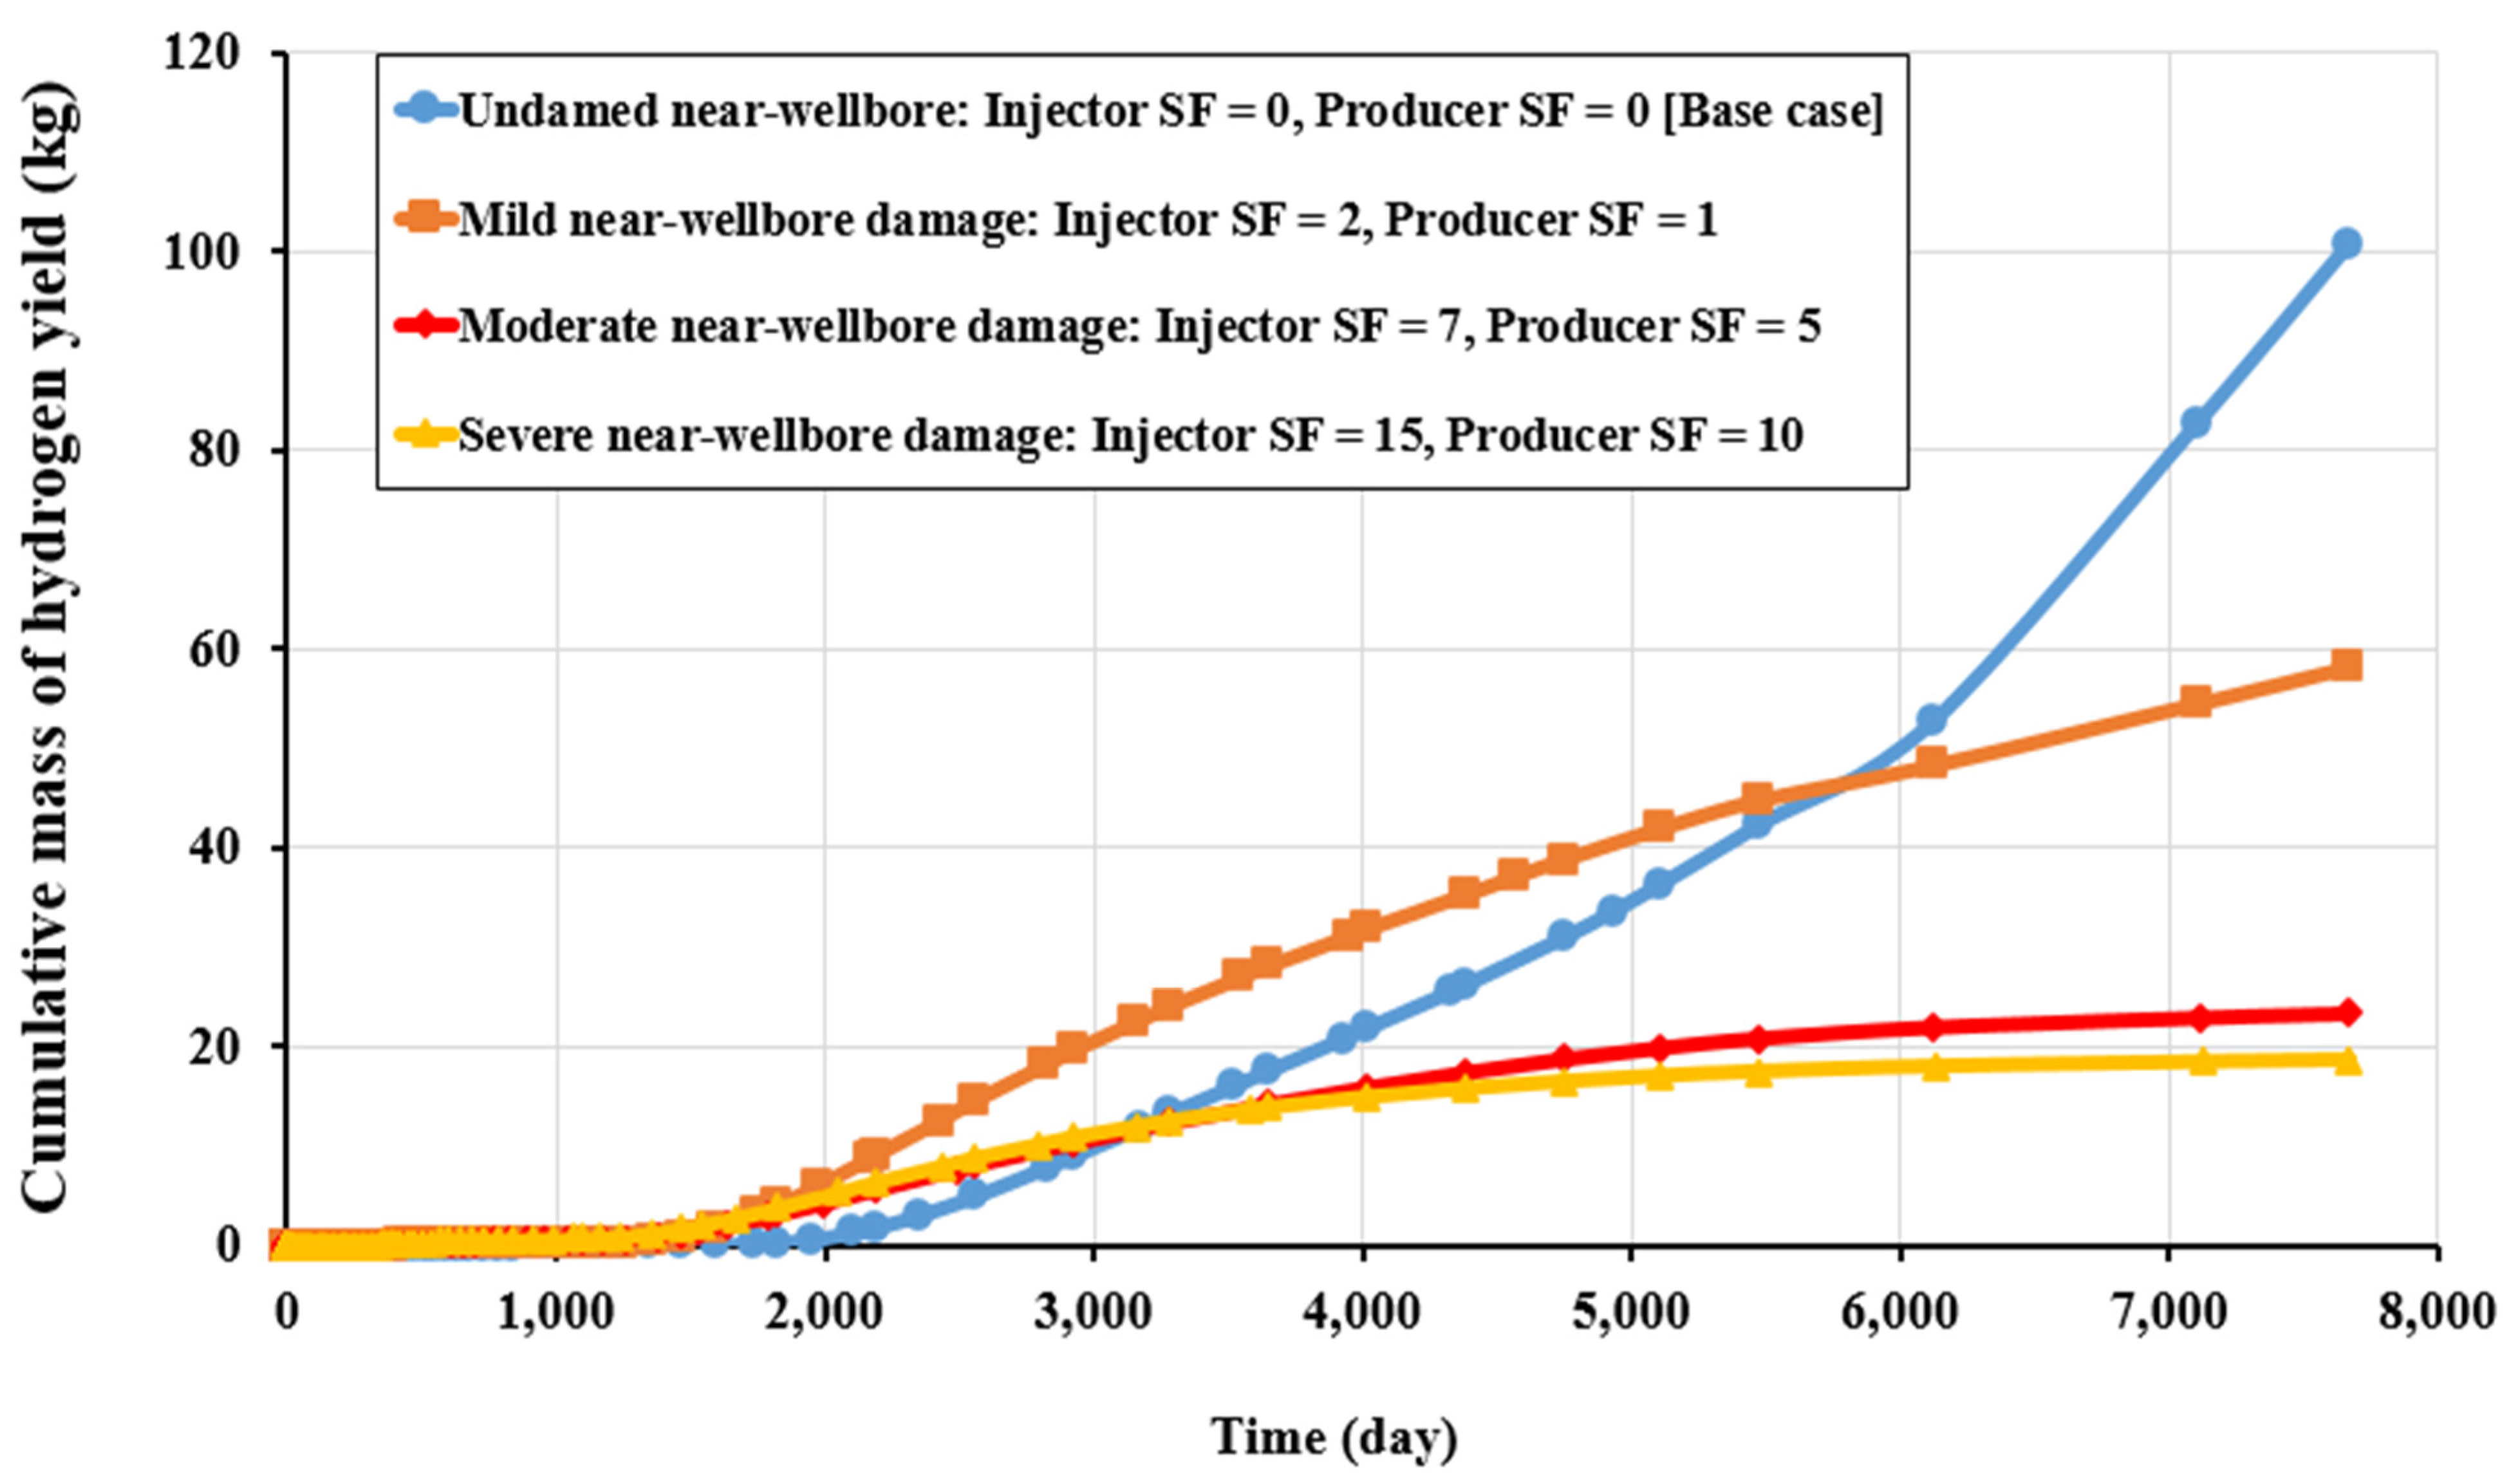
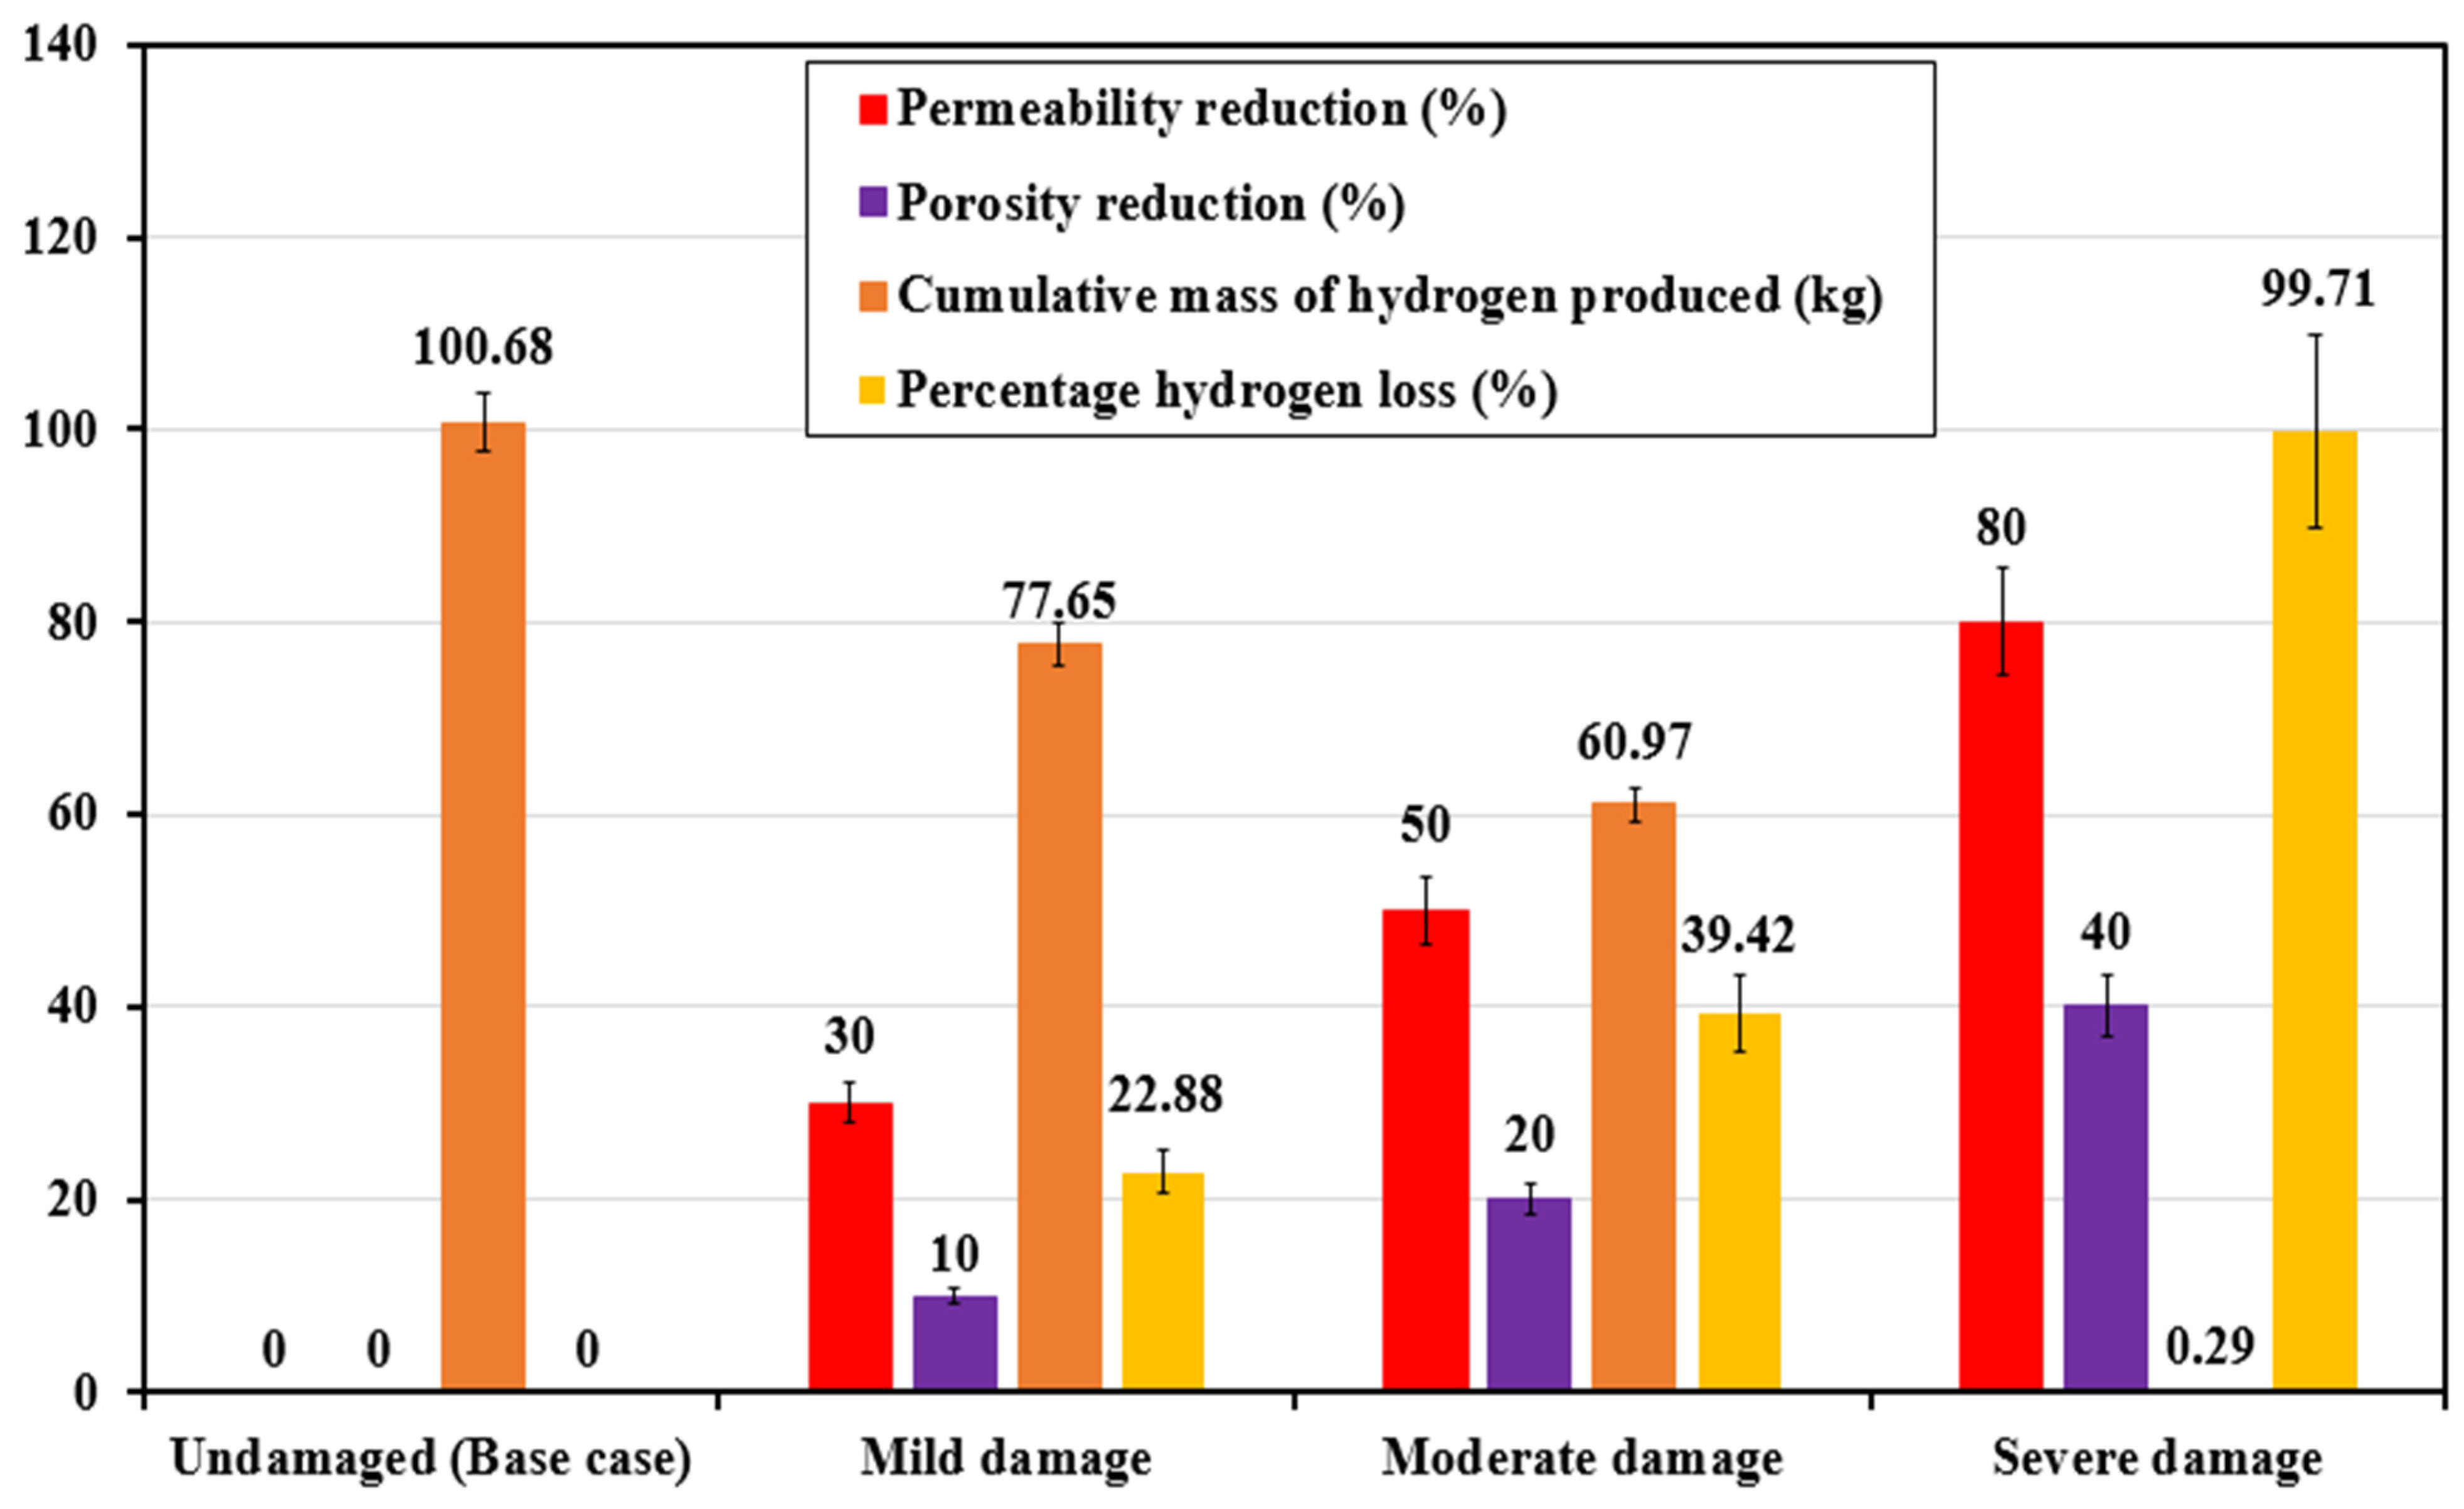
3.1.3. Influence of Formation Damage on Hydrogen Production

This section explores how variations in solid-phase concentration, near-wellbore impairment, and reductions in permeability and porosity impact hydrogen generation using the simulation parameters detailed in Section 2.1. The primary objective is to assess the extent to which formation damage resulting from solid deposition, near-wellbore restrictions, and coupled permeability–porosity decline affects hydrogen production.
Impact of Solid-Phase Deposition
Figure 8 provides insights into how coke deposition influences hydrogen yield during air injection in light oil reservoirs. At the onset of air injection, the solid-phase concentration rises significantly, peaking at approximately 68.77 gmole/m3. This accumulation occurs due to incomplete oxidation reactions [64,65,66], which hinder hydrocarbon conversion and obstruct reactive pathways. During this period, hydrogen output remains minimal, with both cumulative hydrogen mass and mole fraction at low values, indicating reduced gasification efficiency due to pore–throat blockage and permeability constraints.
As the solid volume diminishes, likely driven by ongoing gasification reactions, pore volume expands, facilitating improved reactant transport and enhancing hydrogen production. The stabilization of both solid-phase and pore volumes (Figure 8) suggests the establishment of a quasi-steady-state system, where incomplete combustion forms coke, while subsequent gasification processes progressively consume it. As a result, hydrogen generation stabilizes, reflecting an equilibrium between reactant availability and reaction kinetics.
Between days 730 and 1460, a sharp decline in solid-phase concentration is observed, approaching near-zero levels. This reduction is likely attributed to intensified oxidation and thermal cracking mechanisms, which re-mobilize deposited carbon. Correspondingly, cumulative hydrogen yield experiences a slight increase, although the hydrogen mole fraction declines to zero, implying that while oxidation reactions improve, residual coke deposits may still impede hydrogen release.
A significant transition occurs after day 1460, where coke concentration stabilizes at minimal levels, and hydrogen generation improves. By day 2920, cumulative hydrogen production reaches 9.11 kg, with an associated rise in hydrogen mole fraction. As coke deposits continue to decrease, hydrogen generation improves, indicating that solid-phase material is actively participating in gasification reactions. This aligns with reaction mechanisms reported in [67], where coke oxidation and gasification processes sustain hydrogen production.
Beyond day 3285, coke concentration continues to decline gradually, while hydrogen generation trends upward. The steady rise in hydrogen mole fraction indicates an increasingly efficient gasification process. These findings suggest that prolonged air injection mitigates formation damage by continuously oxidizing residual coke deposits, improving pore connectivity, and enhancing the exposure of reactive surfaces. Although solid-phase coke disappears, the sharp rise in hydrogen yield beginning around day 5478 is attributed to cumulative thermal recovery and pore reactivation. After the initial removal of coke, oxygen transport gradually improves, and residual hydrocarbons begin reacting more efficiently, leading to enhanced gasification. This delayed yet rapid increase in hydrogen production reflects a nonlinear shift in reservoir reactivity and reactant access, marking a transition from a diffusion-limited to a reaction-dominated regime.
Impact of Near-Wellbore Damage
The impact of near-wellbore impairment on hydrogen generation in light oil reservoirs under air injection was assessed by analyzing cumulative hydrogen output over time for different skin factors at injection and production wells, using a modified base case model (Section 2.1). As illustrated in Figure 9, the base scenario representing an undamaged reservoir exhibited continuous hydrogen production. However, as near-wellbore damage intensified, reflected by increasing skin factors, hydrogen generation declined due to restricted fluid flow in the wellbore zone. This limitation reduced the penetration efficiency of injected air, thereby lowering combustion reaction intensity.
For mild near-wellbore damage, hydrogen production exhibited only a slight reduction compared to the undamaged case. This suggests that despite localized restrictions, air injection and combustion reactions remained sufficiently active. Under moderate damage conditions, hydrogen generation declined further, indicating that increased formation resistance restricted fluid movement, accelerating reactant depletion and potentially leading to incomplete oxidation. Severe near-wellbore impairment resulted in even lower hydrogen production. The similarity in hydrogen output under moderate and severe damage conditions implies that once a certain level of near-wellbore obstruction is reached, combustion reactions become significantly constrained, limiting further oxidation and gasification potential. These findings emphasize the necessity of maintaining wellbore integrity in in situ hydrogen production, as excessive formation damage can restrict oxidant availability, suppress combustion efficiency, and negatively impact hydrogen yield.
Impact of Combined Permeability and Porosity Reductions
The effect of simultaneous permeability and porosity declines on hydrogen production was analyzed by evaluating cumulative hydrogen output over time for different degrees of permeability–porosity impairment (Figure 10). These reductions are representative of common formation damage scenarios encountered in reservoir operations. Since permeability defines fluid mobility and porosity determines storage capacity, declines in these properties can severely hinder process efficiency in in situ combustion for hydrogen generation.
In the base case (Section 2.1), which is assumed as the undamaged reservoir, hydrogen production reached 100.68 kg, reflecting optimal conditions with full permeability and porosity enabling effective air injection and combustion. As permeability and porosity decreased, hydrogen yield declined substantially.
For mild damage (30% permeability reduction, 10% porosity reduction), hydrogen output dropped to 77.65 kg, a 22.88% decrease attributable to diminished fluid flow and reduced reactive space. With moderate damage (50% permeability reduction, 20% porosity reduction), hydrogen yield declined further to 60.97 kg, representing a 39.42% loss. This reduction suggests that impaired permeability restricted combustion front propagation and reduced the efficiency of injected air sweeping through the reservoir.
Severe damage, characterized by an 80% permeability reduction and a 40% porosity reduction, resulted in an extreme decline in hydrogen output to just 0.29 kg, reflecting a 99.71% loss. This near-total reduction underscores the critical role of permeability–porosity integrity in sustaining efficient gasification reactions. Overall, the findings demonstrate that as permeability and porosity deteriorate, hydrogen generation diminishes significantly, underscoring the necessity of preserving these reservoir properties to optimize in situ hydrogen production.

3.2. Techno-Economic Analysis of Hydrogen and Oil Recovery Strategies

A techno-economic model was developed using the GoldSim platform, structured based on the cost components outlined in Section 2.2. This model integrates economic evaluations by incorporating output data from CMG STARS simulations under various operational scenarios.
The cost and revenue dynamics vary between injection strategies. Air injection primarily incurs operational expenses associated with compression and oxygen enrichment while avoiding capital costs for CO2 procurement and recycling. Conversely, the CO2 + O2 injection method involves additional expenses for CO2 management but enhances hydrogen production compared to air injection. A comparative analysis of these injection strategies, considering revenue generation, operational expenses, and CO2 management implications, is summarized in Table 5.
Table 5 indicates that, while both injection methods support hydrogen and oil co-production, oil remains the main revenue source due to its significantly higher market value (99% in some cases). This suggests that hydrogen production alone is not yet a viable economic alternative in newly developed reservoirs. For air injection, hydrogen production in the HQR case yields an estimated revenue of USD 11,147.52, whereas oil revenue reaches approximately USD 27.09 million. Similarly, for MQRs, hydrogen revenue amounts to USD 1285.96, compared to over USD 621,000 from oil. These results emphasize oil’s continued economic advantage despite air injection’s relatively lower operating costs.
The CO2 + O2 injection method enhances hydrogen production relative to air injection while maintaining approximately similar cumulative oil production. However, the additional cost of CO2 procurement and recycling presents economic challenges. In the HQR scenario, hydrogen revenue reaches USD 20,773.52, while oil revenue remains above USD 21.42 million. The CO2 procurement cost for HQRs is approximately USD 8.65 million, further constraining the economic feasibility of hydrogen recovery. In reservoirs with lower quality, such as ULQRs, hydrogen revenue is just USD 118.86, while oil revenue stands at USD 2569.57, highlighting the economic limitations of hydrogen production in less favorable reservoirs.
Reservoir characteristics significantly influence the economic viability of hydrogen production. Lower-quality reservoirs (ULQRs and LQRs) yield minimal hydrogen revenue, making them less attractive for investment. In contrast, higher-quality reservoirs (MQRs and HQRs) outperform in both hydrogen and oil production, with hydrogen earnings exceeding those from ULQRs and oil revenues surpassing those from lower-quality reservoirs. These findings suggest that the economic feasibility of hydrogen production is highly dependent on reservoir conditions.
Overall, Table 5 illustrates that oil remains the primary revenue driver, making hydrogen production alone financially challenging, particularly in newly developed light oil reservoirs. While hydrogen aligns with global clean energy initiatives, its current economic competitiveness against oil is limited. However, its co-production potential in high-quality reservoirs warrants further exploration, particularly in scenarios where policy incentives, carbon pricing mechanisms, or technological advancements could enhance the economic outlook for hydrogen generation.
Several factors contribute to the economic disparity between hydrogen and oil production. These include lower hydrogen yields due to technical constraints (as discussed in Section 3.1), higher infrastructure and operational costs for hydrogen production, lower market valuation of hydrogen compared to oil, and significant capital investment for CO2 management in the CO2 + O2 strategy. Additionally, factors such as reservoir characteristics, infrastructure availability, and prevailing market conditions play a crucial role in determining overall economic viability.

3.3. Discussion

The economic potential of oil production versus hydrogen generation from light oil reservoirs is increasingly relevant amid the global energy transition. Conventional oil extraction remains a dominant economic force due to well-established production, refining, and distribution infrastructure. However, the emerging potential of in situ hydrogen production presents a transformative opportunity, leveraging existing oilfield assets for clean energy generation.
The technical analyses in Section 3.1.1, Section 3.1.2 and Section 3.1.3 underscore critical factors influencing the feasibility and scalability of hydrogen production. The results from Figure 4 demonstrate that the CH4 + air injection strategy yields the highest cumulative hydrogen production due to favorable thermochemical reactions. However, this approach also produces significant amounts of synthesis gas, increasing operational costs associated with gas separation and purification. The challenge of handling non-hydrogen gases remains a key economic consideration, as efficient gas separation technologies will directly impact the commercial viability of hydrogen recovery.
Additionally, reservoir characteristics play a crucial role in determining hydrogen output. As seen in Figure 5, heterogeneous reservoirs outperform homogeneous formations due to their enhanced permeability pathways, which facilitate better gas transport and more stable combustion fronts. The ability to harness these natural permeability variations may provide a cost advantage by optimizing reservoir utilization without extensive modifications. However, in formations where permeability is low, artificial stimulation techniques could introduce additional costs, potentially offsetting the economic benefits of hydrogen production.
Well configuration and spacing further influence hydrogen recovery, as illustrated in Figure 6. Reducing injector–producer spacing enhances combustion front propagation and minimizes hydrogen loss, leading to higher recovery efficiencies. However, closer well spacing increases drilling and operational costs, necessitating a balance between maximizing yield and minimizing expenses. Strategic well placement is critical, as suboptimal producer positioning, as observed in Figure 7, can lead to hydrogen losses. The optimal producer location should be within peak hydrogen concentration zones to maximize economic returns.
Formation damage poses another economic challenge, particularly considering the findings in Figure 8, where solid-phase deposition significantly impairs hydrogen yield. Near-wellbore damage and permeability decline due to coke accumulation can restrict gas flow, leading to lower hydrogen recovery and increased remediation costs. The economic impact of formation damage will depend on the severity of permeability impairment and the feasibility of mitigation strategies such as chemical treatments or wellbore cleanouts.
From a cost perspective, in situ hydrogen production holds promise if technological advancements can address key limitations. While the need for new infrastructure is minimized, the high upfront costs associated with research, pilot testing, and regulatory compliance remain substantial barriers. The long-term economic competitiveness of hydrogen will depend on factors such as oil price volatility, hydrogen market expansion, and advancements in separation and storage technologies. Furthermore, environmental policies promoting clean energy adoption could enhance the economic incentives for hydrogen production, particularly in hard-to-abate sectors like transportation and industrial heating.
In the short term, oil production retains a strong economic advantage due to its entrenched market position and revenue-generating capabilities. However, as hydrogen production technologies mature and scalability improves, its economic potential may become competitive, particularly if cost reductions in gas separation, well optimization, and formation damage mitigation can be achieved. Ultimately, the economic feasibility of hydrogen production from light oil reservoirs relies on continued technological innovation and supportive policy frameworks that accelerate the transition toward cleaner energy alternatives.
In addition to economic considerations, operational risks must be carefully evaluated to ensure the feasibility of field deployment. In situ combustion, particularly when coupled with oxygen-enriched or CO2 injection, poses fire and explosion risks that require stringent safety protocols and real-time monitoring systems. Furthermore, the handling and injection of large volumes of CO2 and O2 gases raise environmental concerns, such as unintended emissions, leakage risks, and long-term storage integrity—especially in poorly characterized reservoirs. Regulatory uncertainties also influence project viability, as future policy changes related to CO2 pricing, flaring restrictions, and hydrogen purity standards may impact both cost structure and compliance requirements. Therefore, any field implementation of these strategies should include comprehensive risk mitigation plans, robust environmental impact assessments, and alignment with evolving regulatory frameworks.

4. Conclusions

This study presents an in-depth techno-economic assessment of hydrogen production from light oil reservoirs through in situ combustion-based processes. The findings demonstrate that while hydrogen can be co-produced with oil, its economic viability is heavily influenced by reservoir quality, operational strategies, and cost-management considerations.
From a technical perspective, the choice of injection strategy has a significant impact on hydrogen yield. CO2 + O2 injection improves hydrogen production compared to air injection, benefiting from enhanced thermochemical conversion and stable combustion front dynamics. However, economic evaluations reveal that the additional costs associated with CO2 procurement and recycling limit its feasibility. In contrast, air injection, although resulting in lower hydrogen yields, proves to be a more economically viable option due to its cost-effectiveness and operational simplicity.
The results also underscore the dominance of oil revenue in driving project profitability. Even in high-quality reservoirs, hydrogen revenue remains a small fraction of oil earnings, suggesting that standalone hydrogen production is currently uncompetitive in newly developed reservoirs. Reservoir heterogeneity significantly influences hydrogen recovery, with higher permeability formations yielding more favorable results. However, near-wellbore formation damage and solid-phase deposition present substantial challenges, reducing permeability and limiting hydrogen extraction efficiency. Strategies such as optimized well spacing and targeted stimulation treatments are essential to mitigating these effects.
Despite the current economic limitations, in situ hydrogen production shows promise as a transitional clean energy strategy, particularly in scenarios where carbon pricing mechanisms, technological advancements in gas separation, and policy incentives support hydrogen adoption. The modeling framework developed in this study is scalable and can be extended to larger field developments; however, additional calibration and validation using field-scale data will be required to confirm performance at the commercial scale. Future research should explore the sensitivity of techno-economic outcomes to global oil price fluctuations (e.g., 50–100 USD/bbl scenarios), as changes in oil revenue could substantially influence the profitability threshold for hydrogen co-production. Future studies should also investigate hybrid renewable-hydrogen systems to reduce CO2 procurement costs and enhance environmental sustainability.
Furthermore, although this study focuses on oil reservoirs, hydrogen production from natural gas or gas condensate reservoirs represents a promising future direction. Such reservoirs may offer more favorable thermochemical conditions for hydrogen generation, including higher gas availability and thermal conductivity. Recent experimental and simulation studies (some using CMG STARS) have explored these systems, providing early insights into their potential [68]. Comparative modeling of these alternative reservoir types could broaden the strategic applicability of in situ hydrogen production.
Future research should focus on improving hydrogen separation and storage efficiency, reducing CO2 handling costs, exploring hybrid production frameworks that integrate renewable energy sources, and extending the modeling to natural gas reservoirs. The insights from this study provide a solid foundation for optimizing hydrogen recovery within petroleum reservoirs, contributing to the broader goal of achieving a sustainable energy transition.

Supplementary Materials

The following supporting information can be downloaded at https://www.mdpi.com/article/10.3390/geosciences15060214/s1. References [18,31,32,52,54,69,70,71,72,73,74] are cited in the supplementary materials.

Author Contributions

Conceptualization, C.J.O.; methodology, C.J.O.; software, J.J.S.; validation, P.M.I., J.J.S., and C.J.O.; formal analysis, J.J.S.; investigation, P.M.I.; resources, C.J.O.; data curation, C.J.O.; writing—original draft preparation, C.J.O., J.J.S., and P.M.I.; writing—review and editing, C.J.O.; visualization, J.J.S.; supervision, J.J.S.; project administration, C.J.O.; funding acquisition, J.J.S. All authors have read and agreed to the published version of the manuscript.

Funding

This research received no external funding.

Data Availability Statement

The data are available on request.

Acknowledgments

Chinedu J. Okere sincerely appreciates the support received through the Distinguished Graduate Student Fellowship and the Graduate Student Research Support Grant from Texas Tech University, USA. The authors thank the Computer Modelling Group for their technical assistance and the GoldSim Technology Group for providing the economic software and licensing. Special thanks are due to Farid Tayari for supplying the template economic model and for his invaluable technical guidance.

Conflicts of Interest

The authors declare no conflicts of interest.

References

  1. Jin, L.; Okere, C.J.; Guo, Q.; Zheng, L. Fuzzy-Ball Fluids: Fundamentals, Mechanisms, and Prospects for Clean Energy and Oilfield Applications. Energies 2025, 18, 1592. [Google Scholar] [CrossRef]
  2. Islam, A.; Islam, T.; Mahmud, H.; Raihan, O.; Islam, S.; Marwani, H.M.; Rahman, M.M.; Asiri, A.M.; Hasan, M.; Hasan, N.; et al. Accelerating the green hydrogen revolution: A comprehensive analysis of technological advancements and policy interventions. Int. J. Hydrogen Energy 2024, 67, 458–486. [Google Scholar] [CrossRef]
  3. Chipangamate, N.S.; Nwaila, G.T. Assessment of challenges and strategies for driving energy transitions in emerging markets: A socio-technological systems perspective. Energy Geosci. 2024, 5, 100257. [Google Scholar] [CrossRef]
  4. Opara, S.U.; Okere, C.J. A review of methane leakage from abandoned oil and gas wells: A case study in Lubbock, Texas, within the Permian Basin. Energy Geosci. 2024, 5, 100288. [Google Scholar] [CrossRef]
  5. Lu, H.; Xi, D.; Cheng, Y.F. Hydrogen production in integration with CCUS: A realistic strategy towards net zero. Energy 2025, 315, 134398. [Google Scholar] [CrossRef]
  6. Kannaiyan, K.; Lekshmi, G.S.; Ramakrishna, S.; Kang, M.; Kumaravel, V. Perspectives for the green hydrogen energy-based economy. Energy 2023, 284, 129358. [Google Scholar] [CrossRef]
  7. Okere, C.J.; Sheng, J.J. Review on clean hydrogen generation from petroleum reservoirs: Fundamentals, mechanisms, and field applications. Int. J. Hydrogen Energy 2023, 48, 38188–38222. [Google Scholar] [CrossRef]
  8. Yuan, C.; Afanasev, P.; Askarova, A.; Popov, E.; Cheremisin, A. In situ hydrogen generation in subsurface reservoirs of fossil fuels by thermal methods: Reaction mechanisms, kinetics, and catalysis. Appl. Energy 2025, 381, 125219. [Google Scholar] [CrossRef]
  9. Hassanpouryouzband, A.; Veshareh, M.J.; Wilkinson, M.; Nick, H.M.; Ngwenya, B.T.; Haszeldine, R.S. In situ hydrogen generation from underground fossil hydrocarbons. Joule 2025, 9, 101809. [Google Scholar] [CrossRef]
  10. Hu, Q.; Yan, L.; Cheng, Y.F. In-situ hydrogen production from petroleum reservoirs and the associated high temperature hydrogen attack: A review. Int. J. Hydrogen Energy 2024, 95, 1038–1051. [Google Scholar] [CrossRef]
  11. Smith, E.K.; Barakat, S.M.; Akande, O.; Ogbaga, C.C.; Okoye, P.U.; Okolie, J.A. Subsurface combustion and gasification for hydrogen production: Reaction mechanism, techno-economic and lifecycle assessment. Chem. Eng. J. 2023, 480, 148095. [Google Scholar] [CrossRef]
  12. Greaves, M.; Xia, T.X. Producing Hydrogen and Incremental Oil From Light Oil Reservoirs Using Downhole Gasification. In Proceedings of the Canadian International Petroleum Conference, Calgary, Alberta, 17–19 June 2008. [Google Scholar] [CrossRef]
  13. Greaves, M.; Xia, T.X. Laboratory Studies of Producing Hydrogen and Incremental Oil From Light Oil Reservoirs Using Downhole Gasification. J. Can. Pet. Technol. 2010, 49, 65–70. [Google Scholar] [CrossRef]
  14. Hanfi, M.A.; Alade, O.S.; Tanimu, A.; Mahmoud, M.; Alarifi, S.A. Catalytic and Noncatalytic in Situ Hydrogen Production from Heavy Oil: A Review of Experimental Studies. ACS Omega 2024, 9, 50118–50133. [Google Scholar] [CrossRef] [PubMed]
  15. Yang, M.; Chai, M.; Yuan, S.; Feng, T.; Wang, S.; Zhang, J.; Feng, Q.; Chen, Z.; Wei, T.; Wu, G.; et al. In-Situ Combustion for Heavy Oil and Oil Sands Recovery: Recent Progress, Field Applications, and Future Perspectives. Energy Fuels 2024, 38, 10395–10420. [Google Scholar] [CrossRef]
  16. Okere, C.J.; Sheng, J.J.; Ikpeka, P.M. Comparative Numerical Study on the Optimization of Double-Simultaneous Gas Injection Techniques for Enhanced Hydrogen Production from Depleted Light Oil Reservoirs. Energy Fuels 2024, 38, 16358–16370. [Google Scholar] [CrossRef]
  17. Okere, C.J.; Sheng, J.J.; Ikpeka, P.M. Maximizing Hydrogen Yield: Pioneering Gas Injection for Enhanced Light Oil Reservoir Utilization. In Proceedings of the SPE Western Regional Meeting Proceedings, Palo Alto, CA, USA, 16–18 April 2024. [Google Scholar] [CrossRef]
  18. Ikpeka, P.M.; Ugwu, J.O. In situ hydrogen production from hydrocarbon reservoirs—Modelling study. RSC Adv. 2023, 13, 12100–12113. [Google Scholar] [CrossRef]
  19. Newman, L.L. Oxygen in Production of Hydrogen or Synthesis Gas. Ind. Eng. Chem. 2002, 40, 559–582. [Google Scholar] [CrossRef]
  20. Parry, V.F.; Wagner, E.; Koth, A.; Goodman, J. Gasification of Subbituminous Coal and Lignite in Externally Heated Retorts. Ind. Eng. Chem. 2002, 40, 627–641. [Google Scholar] [CrossRef]
  21. Wright, C.C.; Barclay, K.M.; Mitchell, R.F. Production of Hydrogen and Synthesis Gas by Oxygen Gasification of Solid Fuel. Ind. Eng. Chem. 2002, 40, 592–600. [Google Scholar] [CrossRef]
  22. Eastman, D. Synthesis Gas by Partial Oxidation. Ind. Eng. Chem. 2002, 48, 1118–1122. [Google Scholar] [CrossRef]
  23. Eastman, D. The production of synthesis gas by partial oxidation. In Proceedings of the 5th World Petroleum Congress, New York, NY, USA, 50 May–5 June 1959; Volume 4, pp. 153–161. Available online: https://onepetro.org/WPCONGRESS/proceedings-abstract/WPC05/All-WPC05/WPC-8313/203365 (accessed on 4 June 2025).
  24. Pichler, H. The Oil Gasification by Internal Heating in Continuous Process. In Proceedings of the 7th World Petroleum Congress, Mexico City, Mexico, 2–9 April 1967; Available online: https://onepetro.org/WPCONGRESS/proceedings-abstract/WPC07/All-WPC07/WPC-12422/198479 (accessed on 4 June 2025).
  25. Jones, J.M. Hydrogen Production by Partial Oxidation. In Proceedings of the 8th World Petroleum Congress, Moscow, USSR, 13–18 June 1971; Available online: https://onepetro.org/WPCONGRESS/proceedings-abstract/WPC08/All-WPC08/WPC-14311/199174 (accessed on 4 June 2025).
  26. Strelzoff, S. Partial oxidation for syngas and fuel. Hydrocarb. Process 1974, 53, 79–87. [Google Scholar]
  27. Reed, C.L.; Kuhre, C.J. Hydrogen production from partial oxidation of residual fuel oil. ACS Symp. Ser. 1980, 116, 95–121. [Google Scholar] [CrossRef]
  28. Punitkumar, R.K.; Michael, S.K.; Ian, D.G. Potential for hydrogen generation from in situ combustion of Athabasca bitumen. Fuel 2011, 90, 2254–2265. [Google Scholar] [CrossRef]
  29. Okere, C.J.; Sheng, J.J. Optimizing hydrogen generation from petroleum reservoirs: A dual-perspective approach for enhancing efficiency and cleaner production. Gas Sci. Eng. 2025, 136, 205576. [Google Scholar] [CrossRef]
  30. Sadeghbeigi, R. Fluid Catalytic Cracking Handbook: An Expert Guide to the Practical Operation, Design, and Optimization of FCC Units, 3rd ed.; Elsevier: Hoboken, NJ, USA, 2012; pp. 1–361. [Google Scholar] [CrossRef]
  31. Tayari, F.; Blumsack, S.; Dilmore, R.; Mohaghegh, S.D. Techno-economic assessment of industrial CO2 storage in depleted shale gas reservoirs. J. Unconv. Oil Gas Resour. 2015, 11, 82–94. [Google Scholar] [CrossRef]
  32. Tayari, F.; Blumsack, S.; Johns, R.T.; Tham, S.; Ghosh, S. Techno-economic assessment of reservoir heterogeneity and permeability variation on economic value of enhanced oil recovery by gas and foam flooding. J. Pet. Sci. Eng. 2018, 166, 913–923. [Google Scholar] [CrossRef]
  33. Sigurdardottir, S.B.; DuChanois, R.M.; Epsztein, R.; Pinelo, M.; Elimelech, M. Energy barriers to anion transport in polyelectrolyte multilayer nanofiltration membranes: Role of intra-pore diffusion. J. Memb. Sci. 2020, 603, 117921. [Google Scholar] [CrossRef]
  34. ProtonH2’s Patented ISHGTM Process—ProtonH2. n.d. Available online: https://protonh2.com/our-process/ (accessed on 10 June 2024).
  35. U.S. Energy Information Administration (EIA). AEO2014 Early Release Overview 2014; U.S. Energy Information Administration (EIA): Washington, DC, USA, 2014.
  36. Thermophysical Properties of Fluid Systems. n.d. Available online: https://webbook.nist.gov/chemistry/fluid/ (accessed on 15 June 2024).
  37. Lee, J.E.; Kim, M.K.; Lee, J.Y.; Lee, Y.M.; Zoh, K.D. Degradation kinetics and pathway of 1H-benzotriazole during UV/chlorination process. Chem. Eng. J. 2019, 359, 1502–1508. [Google Scholar] [CrossRef]
  38. Ling, H.; Liu, S.; Gao, H.; Liang, Z. Effect of heat-stable salts on absorption/desorption performance of aqueous monoethanolamine (MEA) solution during carbon dioxide capture process. Sep. Purif. Technol. 2019, 212, 822–833. [Google Scholar] [CrossRef]
  39. Wang, Y.; Wang, S.; Fang, J.; Ding, L.X.; Wang, H. A nano-silica modified polyimide nanofiber separator with enhanced thermal and wetting properties for high safety lithium-ion batteries. J. Memb. Sci. 2017, 537, 248–254. [Google Scholar] [CrossRef]
  40. Chen, Y.-R.; Chen, L.-H.; Chen, C.-H.; Ko, C.-C.; Huang, A.; Li, C.-L.; Chuang, C.-J.; Tung, K.-L. Hydrophobic alumina hollow fiber membranes for sucrose concentration by vacuum membrane distillation. J. Membr. Sci. 2018, 555, 250–257. [Google Scholar] [CrossRef]
  41. Weijian, W.; Gianni, O.; Dachamir, H.; Majid, A.S.; Weng, F.; Yuan, G.; Guozhao, J. Inorganic membranes for in-situ separation of hydrogen and enhancement of hydrogen production from thermochemical reactions. Renew. Sustain. Energy Rev. 2022, 160, 112124. [Google Scholar] [CrossRef]
  42. Oil & Gas Market Analysis and Trends|S&P Global. n.d. Available online: https://www.spglobal.com/commodityinsights/en/ci/industry/oil-gas.html (accessed on 16 June 2024).
  43. Department of Energy. DOE National Clean Hydrogen Strategy and Roadmap. n.d. Available online: https://www.hydrogen.energy.gov/library/roadmaps-vision/clean-hydrogen-strategy-roadmap#:~:text=The%20Strategy%20and%20Roadmap%20also,Infrastructure%20Investment%20and%20Jobs%20Act (accessed on 8 February 2024).
  44. Vickers, J.; Peterson, D.; Randolph, K.; Irwin, L.; Desantis, D.; Hamdan, M.; Stetson, N.; Miller, E.; Satyapal, S. DOE Hydrogen and Fuel Cells Program Record Title: Cost of Electrolytic Hydrogen Production with Existing Technology. 2000. Available online: https://www.hydrogen.energy.gov/docs/hydrogenprogramlibraries/pdfs/20004-cost-electrolytic-hydrogen-production.pdf?Status=Master (accessed on 7 February 2025).
  45. Mulder, M. Economic Analysis of Energy Markets: An Introduction. Lect. Notes Energy 2021, 80, 1–11. [Google Scholar] [CrossRef]
  46. Marbán, G.; Valdés-Solís, T. Towards the hydrogen economy? Int. J. Hydrogen Energy 2007, 32, 1625–1637. [Google Scholar] [CrossRef]
  47. Bölük, G.; Kaplan, R. Effectiveness of renewable energy incentives on sustainability: Evidence from dynamic panel data analysis for the EU countries and Turkey. Environ. Sci. Pollut. Res. 2022, 29, 26613–26630. [Google Scholar] [CrossRef]
  48. Qadir, S.A.; Al-Motairi, H.; Tahir, F.; Al-Fagih, L. Incentives and strategies for financing the renewable energy transition: A review. Energy Rep. 2021, 7, 3590–3606. [Google Scholar] [CrossRef]
  49. Dilmore, R.M. An Assessment of Gate-to-Gate Environmental Life Cycle Performance of Water-Alternating-Gas CO2-Enhanced Oil Recovery in the Permian Basin; National Energy Technology Laboratory: Pittsburgh, PA, USA, 2010. [CrossRef]
  50. Ferguson, R.C.; Nichols, C.; Leeuwen TVan Kuuskraa, V.A. Storing CO2 with enhanced oil recovery. Energy Procedia 2009, 1, 1989–1996. [Google Scholar] [CrossRef]
  51. Robertson, E.P. Review of Ongoing CO2 Enhanced Oil Recovery Operations in Wyoming, USA. In Proceedings of the SPE Improved Oil Recovery Conference, Tulsa, OK, USA, 22–25 April 2024. [Google Scholar]
  52. McCollum, D.L.; Ogden, J.M. UC Davis Research Reports Title Techno-Economic Models for Carbon Dioxide Compression, Transport, and Storage & Correlations for Estimating Carbon Dioxide Density and Viscosity Permalink. Available online: https://escholarship.org/uc/item/1zg00532 (accessed on 7 February 2025).
  53. Chen, F.; Morosuk, T. Exergetic and Economic Evaluation of CO2 Liquefaction Processes. Energies 2021, 14, 7174. [Google Scholar] [CrossRef]
  54. Electricity Cost in Texas: 2024 Electric Rates|EnergySage. n.d. Available online: https://www.energysage.com/local-data/electricity-cost/tx/ (accessed on 15 June 2024).
  55. Dake, L.P. Fundamentals of Reservoir Engineering, 1st ed.; Elsevier: Amsterdam, The Netherlands, 1983; Volume 8, p. 464. [Google Scholar]
  56. Ahmed, T. Reservoir Engineering Handbook, 4th ed.; Elsevier: Amsterdam, The Netherlands, 2010. [Google Scholar]
  57. Green, D.W.; Willhite, G.P. Introduction to Eor Processes. In Enhanced Oil Recovery; Society of Petroleum Engineers: Calgary, AB, Canada, 2022; pp. 1–14. [Google Scholar] [CrossRef]
  58. Gluyas, J.G. Swarbrick REdward. In Petroleum Geoscience; Blackwell Pub.: Malden, MA, USA, 2004; p. 359. [Google Scholar]
  59. Toledo, M.; Arriagada, A.; Ripoll, N.; Salgansky, E.A.; Mujeebu, M.A. Hydrogen and syngas production by hybrid filtration combustion: Progress and challenges. Renew. Sustain. Energy Rev. 2023, 177, 113213. [Google Scholar] [CrossRef]
  60. Amin, M.; Butt, A.S.; Ahmad, J.; Lee, C.; Azam, S.U.; Mannan, H.A.; Naveed, A.B.; Farooqi, Z.U.R.; Chung, E.; Iqbal, A. Issues and challenges in hydrogen separation technologies. Energy Rep. 2023, 9, 894–911. [Google Scholar] [CrossRef]
  61. Xia, A.; Cheng, J.; Ding, L.; Lin, R.; Song, W.; Zhou, J.; Cen, K. Effects of changes in microbial community on the fermentative production of hydrogen and soluble metabolites from Chlorella pyrenoidosa biomass in semi-continuous operation. Energy 2014, 68, 982–988. [Google Scholar] [CrossRef]
  62. Song, R.; Wu, M.; Liu, J.; Yang, C. Pore scale modeling on microbial hydrogen consumption and mass transfer of multicomponent gas flow in underground hydrogen storage of depleted reservoir. Energy 2024, 306, 132534. [Google Scholar] [CrossRef]
  63. Ikpeka, P.; Alozieuwa, E.; Duru, U.I.; Ugwu, J. A parametric study on in-situ hydrogen production from hydrocarbon reservoirs—Effect of reservoir and well properties. Int. J. Hydrogen Energy 2024, 80, 733–742. [Google Scholar] [CrossRef]
  64. Wang, Y.; Zhou, Y.; Fan, S.; Lang, X.; Li, G. Influence of low temperature oxidation on heavy oil coking by thermal pyrolysis during in situ combustion process. Fuel 2022, 316, 123314. [Google Scholar] [CrossRef]
  65. Xu, Q.; Liu, Z.; Jiang, H.; Zhang, Q.; Zan, C.; Ma, D.; Shi, L. Chemical-structural properties of the coke produced by low temperature oxidation reactions during crude oil in-situ combustion. Fuel 2017, 207, 179–188. [Google Scholar] [CrossRef]
  66. Okere, C.J.; Sheng, J.J. Probing the Mechanism and Impact of Light Oil Oxidation on In Situ Hydrogen Production from Petroleum Reservoirs: A Combined SARA-Based Experimental and Numerical Investigation. Energy Fuels 2024, 38, 17649–17661. [Google Scholar] [CrossRef]
  67. Trommer, D.; Noembrini, F.; Fasciana, M.; Rodriguez, D.; Morales, A.; Romero, M.; Steinfeld, A. Hydrogen production by steam-gasification of petroleum coke using concentrated solar power—I. Thermodynamic and kinetic analyses. Int. J. Hydrogen Energy 2005, 30, 605–618. [Google Scholar] [CrossRef]
  68. Askarova, A.; Alekhina, T.; Popov, E.; Afanasev, P.; Mukhametdinova, A.; Smirnov, A.; Cheremisin, A.; Mukhina, E. Innovative technology for underground clean in situ hydrogen generation: Experimental and numerical insights for sustainable energy transition. Renew. Energy 2025, 240, 122259. [Google Scholar] [CrossRef]
  69. Adegbesan, K.O.; Donnelly, J.K.; Moore, R.G.; Bennion, D.W. Low-Temperature-Oxidation Kinetic Parameters for In-Situ Combustion: Numerical Simulation. SPE Reserv. Eng. 1987, 2, 573–582. [Google Scholar] [CrossRef]
  70. Yang, X.; Gates, I.D. Combustion kinetics of Athabasca bitumen from 1D combustion tube experiments. Natural Resources Research 2009, 18, 193–211. [Google Scholar] [CrossRef]
  71. Maifan, D.; Lele, F.; Qigeng, Z.; Sibo, Z.; Xiangcen, X.; Botao, Q. Spatial and temporal evolution of tar during ex-situ underground coal gasification. Fuel 2022, 317, 123423. [Google Scholar] [CrossRef]
  72. Hajdo, L.E.; Hallam, R.J.; Vorndran, L.D.L. Hydrogen Generation During In-Situ Combustion. In Proceedings of the SPE California Regional Meeting, Bakersfield, CA, USA, 27–29 March 1985; pp. 675–689. [Google Scholar] [CrossRef]
  73. Babushok, V.I.; Dakdancha, A.N. Global kinetic parameters for high-temperature gas-phase reactions. Combust Explos Shock Waves 1993, 29, 464–489. [Google Scholar] [CrossRef]
  74. Bureau of Labor Statistics Data. n.d. Available online: https://data.bls.gov/pdq/SurveyOutputServlet# (accessed on 12 June 2024).
Figure 1. Three-dimensional view of the reservoir simulation model with colors indicating the grid pay depth (m).
Geosciences 15 00214 g001
Figure 2. Hydrogen yield as a function of H/C ratio for various feedstocks, including predictions from the light oil model [19,20,21,22,23,24,25,26,27,28,29].
Geosciences 15 00214 g002
Figure 4. Cumulative mass of hydrogen, oil, and other gases generated from light oil reservoirs.
Geosciences 15 00214 g004
Figure 5. Impact of reservoir heterogeneity on hydrogen generated.
Geosciences 15 00214 g005
Figure 6. Impact of well placement and spacing strategies on cumulative mass of hydrogen generated.
Geosciences 15 00214 g006
Figure 7. Variation in hydrogen mole fraction with distance from injector.
Geosciences 15 00214 g007
Figure 8. Effect of solid-phase accumulation on cumulative hydrogen yield and hydrogen mole fraction.
Geosciences 15 00214 g008
Figure 9. Impact of near-wellbore damage on cumulative mass of hydrogen production (SF denotes skin factor).
Geosciences 15 00214 g009
Figure 10. Impact of combined permeability and porosity reductions on cumulative hydrogen produced.
Geosciences 15 00214 g010
Table 1. Summary of grid sensitivity analysis results.
Grid ConfigurationNumber of Active BlocksCumulative Hydrogen Produced (kg)Cumulative Carbon Dioxide Produced (m3)Average Temperature at Combustion Front (°C)
7 × 7 × 314742,300.451850.22695.5
9 × 9 × 432445,682.431925.75698.2
10 × 10 × 550046,0001930.5700.1
12 × 12 × 686446,120.71935701.4
15 × 15 × 7157546,200.91936.25702.5
Table 2. Cost model structure.
Injection ComponentProduction ComponentCO2 Recycling Component
Equipment leasing costsProduction costs
Production equipment expenses
Hydrogen separation costs
Oil–water separation costs
Gas compression and processing costs
Pumping costs
Compression expenses
Gas separation expenses
Annual operation and maintenance expenses
CO2 distribution costs
Air supply and associated costsTaxation, royalties, social obligations, and revenue
CO2 sourcing and associated expenses
Table 3. Overview of inputs and cost constraints adopted in the economic model.
ComponentComputation Technique
Injection
Equipment cost (USD)127,259.01 *
Annual operating and maintenance costs
Normal daily (USD/year)
34,183.79 *
Surface repair (USD/year)
44,578.04 *
Subsurface repair (USD/year)
61,474.96 *
CO2 supply and distribution costsUSD 200,000
Air source and costUSD 50,000 with USD 5000 per year operating cost
CO2 purchase cost (USD/Mscf)2.5 percent of oil price
CO2 pressurizing costs
Pump capital cost (USD)
258,524,838.4, where Wp = 133,127.6 kW (for CO2 flowrate of 1000 tonnes/day)
Pump operating and maintenance cost (USD/year)
13 cents per kWh
Production
Production equipment cost1,619,000 *
Fluid lifting costUSD 0.25 per barrel of produced fluids
Synthesis gas and liquid separation costUSD 1000 per square meter with 10% annual maintenance cost
Oil–water separation costUSD 1.917 per barrel
Production revenue, taxes, and royalties
Severance tax
2% of produced hydrogen value
Royalty rate
10% of produced hydrogen value
CO2 recycling costs
Gas treatment: separation and compression (USD)USD 500 of gas production rate
Compression costs
Compressor capital cost (USD)
USD 2500 per horsepower
Compressor operating and maintenance cost (USD/year)
13 cents per kWh
Note that values marked with an asterisk (*) are estimated values from the analyses presented in the Supplementary Materials.
Table 4. Reservoir classification.
Reservoir PropertyUltra-Low-Quality Reservoirs (ULQRs)Low-Quality Reservoirs (LQRs)Moderate-Quality Reservoirs (MQRs)High-Quality Reservoirs (HQRs)
Permeability<0.10.1–1 md1–10 md>10 md
Porosity<5%5–10%10–20%>20%
Table 5. Economic evaluation of hydrogen and oil recovery strategies with CO2 management in light oil reservoirs.
Injection StrategyReservoir Cum. Mass of H2 Prod. (kg)Cum. Mass of Oil Prod. (kg)Cum. Mass of CO2 Prod. (kg)Cum. Mass of CO2 Inj. (kg)Total Revenue from H2 (USD)Total Revenue from Oil (USD)Total Cost for New CO2 Procurement (USD)
AirULQRs24.375106.848.92073.112574.360
LQRs51.427098.5312.580154.263569.370
MQRs428.651,236,547.212365.7801285.96621,785.230
HQRs3715.842,613,645,287.4519,547.62011,147.5227,086,492.170
CO2 + O2ULQRs39.625094.2336.74321.57118.862569.577.89
LQRs83.797085.9251.361524.63251.373564.9229.53
MQRs813.271,234,982.644521.9624,987.362439.81620,943.25732.85
HQRs6924.512,615,616,895.3818,362.79362,517,298.9220,773.5221,416,532.848,648,371.23
Disclaimer/Publisher’s Note: The statements, opinions and data contained in all publications are solely those of the individual author(s) and contributor(s) and not of MDPI and/or the editor(s). MDPI and/or the editor(s) disclaim responsibility for any injury to people or property resulting from any ideas, methods, instructions or products referred to in the content.

