Abstract
This paper uses an orthogonal resistor network model instead of traditional finite-difference or finite-element methods to explore an alternative approach to forward modeling in Electrical Resistivity Tomography (ERT). A resistor network is advantageous for modeling high-contrast resistivity environments, particularly in crystalline rock scenarios with thin conductive fractures. The key idea is to represent the resistivity problem as a network of resistors, where each resistor corresponds to a unit cell edge with assigned resistance values. The study compares this approach with existing numerical methods and analytical solutions for 2D conductive dipping faults, showing that the resistor network method produces comparable results for shallow depths while offering better resolution for thin conductive fractures. This study demonstrates that a resistor network can serve as an auxiliary tool for qualitatively assessing the effects of thin conductive fractures in crystalline rock environments or masonry.
1. Introduction
Electrical Resistivity Tomography (ERT) is one of the most frequently used methods of applied geophysics, especially for the near-surface environment. The advantage of this method is that it provides relatively detailed information about the geological environment with reasonably low labor and implementation costs. The measuring equipment and processing software are readily available.
The processing of the ERT apparent resistivity measurements consists of finding a distribution of resistivities that best corresponds to the values of the measured apparent resistivities. Various simplifying models are used; for example, in the case of an in-line ERT measurement, a so-called two-dimensional model is used, in which the resistivities change only in the vertical section but are constant in the direction perpendicular to the section plane. Despite such limitations, the inverse problem of determining resistivity distribution from the measured apparent resistivities is generally ambiguous. Another limitation is that the number of measured apparent resistivity values must exceed the number of determined parameters of the model distribution of resistivities.
Numerical calculations of apparent resistivity values from the model resistivity distribution are often performed using finite differences or finite elements, as in the case of the Res2Dmod 3.01 program [1,2,3]. In this case, for example, the minimum size of the element of the resistivity section must be chosen because as the size of the spatial elements of the model decreases, the number of elements increases. The resulting resistivity distribution thus often represents, to a certain extent, a smoothed image of the actual resistivity distribution.
When the near-surface environment is formed by soil on a layer of weathered rock that gradually transitions into unweathered rock, the changes in resistivity can be considered significant but continuous. On the other hand, the fractured rock outcrop appears very non-conductive unless electrodes are placed directly in the open and water-saturated rock fractures. Such a fractured rock massif is characterized by suddenly changing apparent resistivities, depending on the mutual interconnection of conductive fractures [4].
For a model with continuous resistivity changes, using a model that divides the medium into a small number of volume elements is adequate. The size of the cells leads to a certain degree of smoothing of the resistivity contrasts at the interfaces, but the overall character of the resistivity distribution remains preserved. However, choosing very small elements near the fractures would be necessary in a medium with thin, highly conductive fractures. In such a case, it may be more appropriate to use a model based on a resistor network to calculate apparent resistivities.
The resistor network model works with the resistance values between nodes; it does not work with the distribution of conductivity in space. When an electrode (current or potential) is placed in a fracture, we can be more interested in the interconnection with other fractures or fracture systems than in calculating average resistivities in blocks whose size exceeds the dimensions of the cracks by an order of magnitude.
Similarly, Ref. [5] used the resistor network to compare the hydraulic and electric processes occurring in the porous media. Ref. [6] used the resistor network approach to describe the bulk conductivity of the mixture of a low-conductivity rock matrix and a highly conductive phase. It was shown that bulk conductivity does not depend on the conductivity of the rock matrix but rather on the amount of high-conductive material and, in particular, on its geometry. Ref. [7] developed the original concept of [6] further by taking the resistance of each resistor to be related to the local fracture aperture and, in the case of resistivity, the conductivity of the fill material. Such models can describe a strong resistivity anisotropy, as seen in nature. Similarly to previous authors, this was proved by [8], who used a model made of non-conductive cubes with a highly conductive surface. Ref. [9] proposed a 3D orthogonal resistor network model, representing a complete tool for simulating the direct problem of apparent resistivity in a conducting medium. This approach is especially useful for metallic infrastructure and other conductive objects in narrow and thin shapes.
This paper analyzes the possible use of 2D orthogonal resistor networks for modeling apparent resistivity in geoelectrical surveys. Using a 2D network is a simplification compared to the [9] approach. However, even a 2D model could allow the modeling of conductive fractures in crystalline rocks. The resistor network model can simulate an irregular system of conductive fractures through electrical connections between different nodes of the resistor network. Such a problem is complex, and one can hardly expect a unique result of the inverse problem. Thus, even very simplified direct problem solutions can be used to verify or deny the hypothesis about fractures in the medium.
We compared the 2D resistor network model with the analytical solution of a 2D conductive dipping fault. Although there is a fundamental difference between a 2D resistivity model and a planar resistor network, the difference in apparent resistivities calculated is minor for shallow depths. The resistivity network model can thus be an auxiliary tool to verify the existence and properties of conductive fractures in an otherwise non-conductive environment.
The proposed calculation of the resistor network might also be used to model, detect, and quantify cracks in so-called conductive smart concrete structures [8,10]. According to [11], a resistor network is suggested to find out the minimum necessary number of conductive connections in the smart concrete matrix to reach the total conductivity and the minimal number of connection break-offs that may detect and possibly localize the breaking of a smart concrete structure. Ref. [12] considers damage detection in carbon fiber polymer-matrix composites. In this case, a strongly anisotropic material is used. In such a case, the resistor network model might be used to model the resistivity anisotropy to search for the exact damage position. The resistor network is proposed by [13] to detect newly opened fractures in large underground storages; namely, planned deep geological repositories. These geological repositories are mostly planned to be built in high-resistivity crystalline rocks. This method might be advantageous compared to a commonly used finite-differences method, as the resistor network model works better with high contrasts in resistivity (high resistivity country rock vs. highly conductive body of the fracture).
The resistor network model is generally dimensionless. However, if we assume that the resistor network lies in a plane and, at the same time, assign a certain length and resistance value to the resistors, then it could be used as a model of a thin conducting slab body. The ERT method is also used in practice for masonry moisture analyses [14,15]. In such a case, a resistance network could be a suitable model for a confined environment. As Ref. [14] points out, water-filled joints often exhibit extremely low resistivities below 50 Ωm, and in such cases, the resistivity to moisture conversion can be problematic. The resistance network model allows us to estimate the possible presence of a crack and exclude it from the usual moisture calculation.
The present paper aims to show that the resistor network model has properties different from those of models based on a continuous conductive medium. For some simple models in civil engineering, the 2D resistor network could represent an interesting alternative, allowing a qualitative analysis of the possible conductive fractures’ effect on apparent resistivities.
2. The Resistor Network Model
A planar rectangular mesh model was chosen for the resistor network model. The edges of square cells are single resistors mutually connected in the mesh nodes. The model is proposed for surface measurement; therefore, the algorithm was designed with the current source and potential electrodes moving along the upper side of the resistor mesh. The algorithm was implemented in the MATLAB R2024a code [16,17].
Under certain circumstances, the electrical resistor network problem can be solved analytically. An example of such analytically solvable problems is an infinite homogeneous resistor network or infinite resistor “ladder” [18,19,20,21]. For infinite square networks composed of identical resistors, one can analytically derive formulae for resistances between certain network nodes. Interestingly, such resistances can be expressed with the product of an integer fraction and the number 1/π or π. However, the analytical approach is inappropriate for finite and heterogeneous resistor networks.
The Kirchhoff laws are used to solve direct current electrical circuits with resistors. The second Kirchhoff law states that the sum of all voltage drops on resistors around any closed loop in a circuit must equal zero. This law can be applied via so-called loop currents introduced as unknowns for every closed loop. Each elementary square cell, made of four resistors, can be considered one closed electrical loop in a rectangular planar mesh geometry resistor network. Each loop matches the second Kirchhoff law equation. The equation consists of voltage drops at all four resistors in a loop. Such voltage drops are caused by this loop’s flowing current and the adjacent loops’ currents. For each unknown loop current, we attain just one equation containing at most five loop currents (one loop current in a cell and four loop currents in adjacent cells). The boundary cells of the resistor mesh have only three loop currents from the adjacent cells, and the loops in the mesh corners have only two currents from adjacent cells.
In the case of a surface geoelectrical measurement model, we assume the external current source is connected to the upper edge of the resistor mesh. Thus, the equations for the loops in the area of the current source also include the known external source current. It results in a linear equation system in which the number of equations equals the number of unknown loop currents in all resistor network cells. If such an equation system is solvable, this solution is unique.
According to Figure 1, the horizontal resistors are marked as RA, and the vertical resistors are marked as RX. An example in Figure 1 presents a resistor network composed of nine current loops to illustrate how to build up the network’s linear equations. For simplicity, the network is without any current sources.
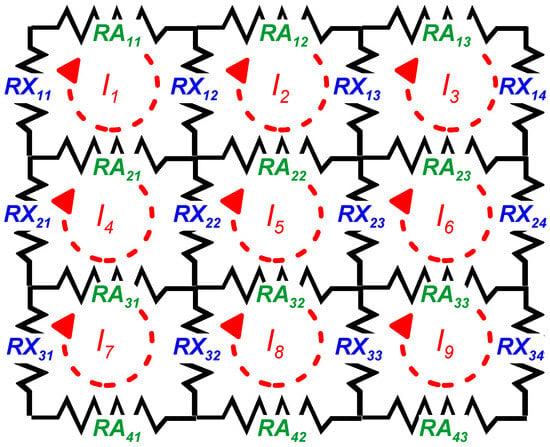
Figure 1.
An example of a resistor network. Designation of resistors and loop currents in elementary loops.
For the first cell (loop) of the network, Equation (1), according to the second Kirchhoff law, can be written:
For the second loop, the equation has a form (2):
The other Equations for the remaining loops can be written similarly. For simplicity, the notation is introduced: , , , , , , and so on.
The above Kirchhoff linear equations can be easily expressed as matrix multiplication (3):
Only the first and second equations corresponding to (3) will be changed if we apply the surface current source according to Figure 2. In the first and second loop current Equations, the current source will appear:
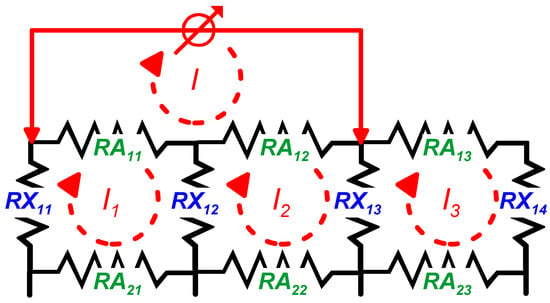
Figure 2.
Resistor network from Figure 1, with the surface current source.
The value of current source is known; therefore, the equation system (3) in the matrix form will, in the case of this particular current electrode’s position, change:
The resistor network’s solution is based on finding the loop currents to in (6). Calculated loop currents in the first layer are further used to evaluate the voltage drops on each resistor along the network’s upper edge. This way, the voltage U between any two surface electrodes M and N can be evaluated and used for apparent resistivity calculation using the formula , where I is the value of the source’s current injected into the resistor network using a pair of current electrodes A and B, and k is the geometrical factor (see Figure 3).
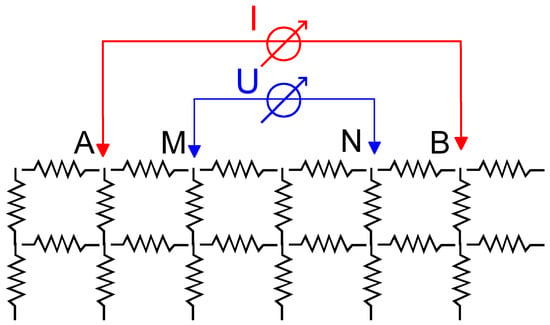
Figure 3.
A scheme of a resistor network with an electrode array: current—A, B, and measuring—M, N electrodes.
The meaning of the geometrical factor k is easy to understand in the case of an unlimited homogeneous conductive medium. For a particular electrode array geometry and considering a homogeneous, unlimited medium with constant resistivity, the value of apparent resistivity should equal the medium true resistivity ρ, i.e., . The geometrical factor k depends on an electrode array’s type and dimensions. Usually, a simple formula for evaluating k can be obtained based on mutual distances between all electrodes in the electrode array of a given type: . However, the geometrical factor k will depend on model dimensions in the finite medium model case. In such a case, according to [2], the Res2Dmod software, uses the numerical calculation of a homogeneous space-limited model. The value of the k factor is determined from the assumption of equality of apparent and real resistivity in a homogeneous, unlimited medium.
The same idea is used in the case of a resistor network. The geometrical factors are determined for a homogeneous model consisting of identical resistors (e.g., a model formed by 1 Ω resistors only) and with the same dimensions as the inhomogeneous model for which we are looking for the constants. The procedure involves calculating the geometrical factors of particular electrode arrays’ dimensions for the position in the model’s center. Such geometrical factors will be used for any position of an electrode array with these dimensions in the solved resistor network model. In the case of the resistor network model, the geometrical factor k also includes the formal transition from resistance value to resistivity. The calculated U/I ratio (resistance, Ω) is transformed to the apparent resistivity (Ωm) by multiplying it by the M and N electrodes distance (m).
The similarity between a real conductive medium and a resistor network’s model requires matching single resistors with their geometrical length. Let us say that we choose the size of a square mesh 1 × 1 m as an example. In that case, the numerical values of the single resistors’ resistance equal the resistivity of a medium in a particular cell and direction. For finer spatial division of the mesh, the resistance values of the mesh’s resistors must be adequately decreased (to keep the resistivity of the medium) and vice versa.
A numerical model of the resistor network always has finite dimensions, and the calculated mesh’s boundaries influence apparent resistivities. The actual resistor network model is extended to suppress this influence by adding the edge resistor columns to the right and left of the model’s area. Similarly, the model is expanded below the bottom to reduce the influence of the limited depth of the model. Based on test calculations, it was found that good results can be obtained by adding 20 columns to the right and left sides and 10 rows under the model. The resistivity values of the resistors in the buffer zones are chosen to correspond to the last column of the model on the left or right side and at the bottom of the model’s row.
The algorithm for calculating the loop current’s distribution in a resistor network and corresponding apparent resistivities was transformed into computer code in MATLAB. The input data are the resistor network’s resistance values and several other parameters, such as the type of electrode array and geometrical dimensions. The computer code allows the generation of a graphical scheme of an input resistor network. This scheme may be dimensionless and use only the sequence numbers of columns and rows of resistors, or the mesh may be displayed in length units according to the matching geometrical length of resistors. Either way, a color-scaled resistor mesh expresses the resistance or resistivity value. Both schemes are identical when the resistor network mesh is 1 m in size—see examples in Figure 4.
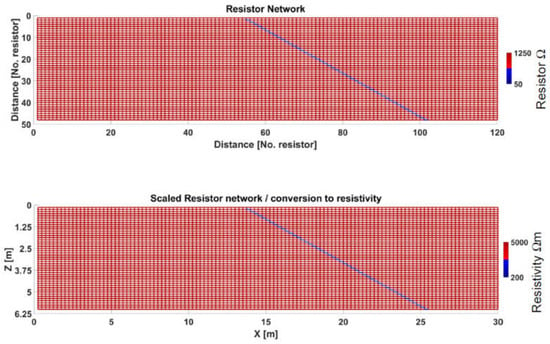
Figure 4.
An example of a resistor network—a thin conductor in a high-resistivity medium. Upper: a resistor network made by single discrete resistors (colour scale equals single resistors’ resistance values). The length scale expresses the serial number of the resistors. Bottom: recalculated scheme according to geometrical scale factor—the size of mesh’s square is 0.25 m. The resistance values of resistors are recalculated to resistivities, and the axes x and z are expressed in length units.
An electrode array chosen can be either Wenner alpha or Wenner–Schlumberger. For the Wenner–Schlumberger array, only one value of MN spacing is used for the model calculation. In the case of the Wenner alpha, the MN = AB/3 spacing is always chosen.
The model calculation corresponds to the ERT measurement idea. The calculation starts with the shortest electrode array placed on the far left of the resistor network’s surface. The electrode array moves across the model’s surface with a step of one resistor. The array’s dimension increases after reaching the far-right position, and the electrode array starts moving from left to right again. Such a procedure is repeated until the maximum electrode array’s dimension for the used resistor network is reached. The loop currents’ distribution can be displayed as current distribution isolines for each position of the electrode’s array. Finally, the apparent resistivities are calculated for all chosen electrode array positions.
3. The Results of the Model Calculation and Their Imaging
The calculated apparent resistivities are first plotted as a scatter plot along the profile (see Figure 5). For clarity, the points of individual profile curves corresponding to the movement of the electrode array are not mutually connected. That does not allow the identification of particular curves, but the purpose of this graph is to assess the apparent resistivities’ range and asymptotical behavior near the model boundaries.

Figure 5.
An example of profile curves of apparent resistivities. Apparent resistivities correspond to the model in Figure 4. Wenner alpha electrode array used.
In Figure 6, the apparent resistivities are further displayed as a cross-section. The cross-section can be made either dimensionless, i.e., using horizontal and vertical axes in units of the sequence number of resistors, or scaled, where horizontal and vertical axes are expressed in length units.
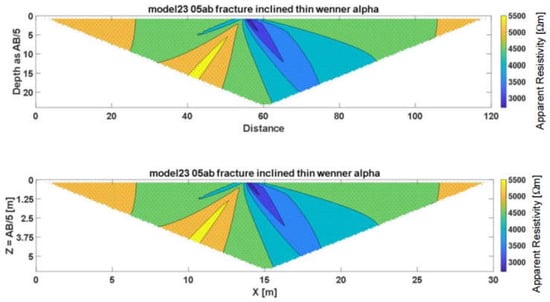
Figure 6.
An example of calculated apparent resistivity cross-section. Upper: dimensionless section—length and depth scale substituted by the number of resistors. Bottom: scaled cross-section in length units. Apparent resistivities correspond to the model in Figure 4.
At the same time, the algorithm generates a data file that allows the creation of an apparent resistivity cross-section in the Surfer (ver. 28.3.296) software (Golden Software)—see Figure 7. The Surfer graphical output allows interactive editing of the final resistivity isoline cross-section.
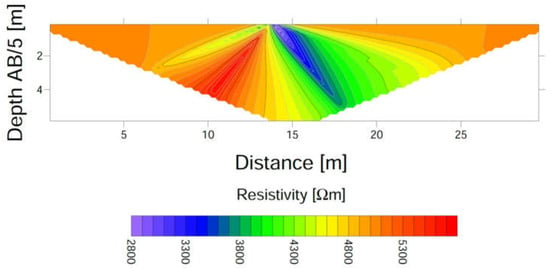
Figure 7.
An example of possible outputs of the model cross-section in Surfer software (the same data as in Figure 6).
Another useful output may be an animation showing the deformation of the current density field while moving the electrode array across the surface of the resistor network model. Video S1 shows such an animation example.
4. Comparison of Possibilities of Model Calculations by Finite Differences and the Resistor Network’s Model—An Example of Inclined Conductive Fracture
A comparison of the resistor network and the Res2Dmod 3.01 software approach by finite differences is prepared based on an example of inclined conductive fracture. The difference between the two modeling approaches should be mainly in the possibilities of modeling a thin conductive crack. From a geological point of view, the thin, highly conductive fracture is an open joint with a thickness in mm filled with fine-grained material and water. Therefore, a series of models with different thicknesses of the conductive zone was designed.
In the Res2Dmod, the geometrical shape of any inhomogeneity is created using rectangular cells with a specified anomalous resistivity value. The size of these cells is often chosen so that their vertical dimension increases with depth. This increase is supported by the decreasing effect of deeper uni-sized cells on the resulting apparent resistivity. However, such a depth-dependent geometry limits the possibility of modeling an inclined plate-shaped fracture. Therefore, a regular square mesh was used in the Res2Dmod program and for the resistor network mesh. The mesh cells’ size and resistors’ length were set to 0.25 m. The model was designed to be 60 m long and 5 m deep. Both model calculation algorithms automatically add damping zones behind the end of the model, on the sides, and below the model.
In the Res2Dmod model, the conductive fracture was modeled via cells with an anomalous resistivity value of 20 Ωm in the surrounding environment of 10,000 Ωm. The calculation via the resistor network model uses resistors of 5 Ω inside the fracture and 2500 Ω for the surrounding medium.
For the Res2Dmod calculation, three variants of the fracture’s thickness were chosen: fracture made of four cells in the horizontal direction (horizontal fracture’s width of 1 m), two cells (fracture width 0.5 m), and one cell (fracture width 0.25 m). The inclination of the fracture was chosen so that the side shift between cell layers was one cell. The first two models, therefore, create a continuous conductive strip (where adjacent cells share an edge). The third fracture model is built by cells mutually touching only their diagonal corners.
A similar group of three models was modeled using the resistor network model. It was reached by inserting the resistors corresponding to the fracture into all edges of the fracture’s cells used in the Res2Dmod calculation. In addition, the resistor network’s model enables fracture modeling in the form of a single resistor line. Such a model was created by regularly alternating and shifting the vertical and horizontal resistors. We call this model the ultra-thin fracture. The fracture steepness is the same as the three other models.
The different models with the resulting apparent resistivity cross-sections are displayed in Figure 8, Figure 9, Figure 10 and Figure 11. A pair of apparent resistivity cross-sections is presented for each model, first calculated by Res2Dmod and second by a resistor network model. The ultra-thin fracture model (the fourth resistor network model) is being compared with the third model calculated by Res2Dmod—Figure 11. All cross-sections were displayed with the same length/depth scale, identical settings of the isolines grid’s generation, and the same resistivity colour scale.
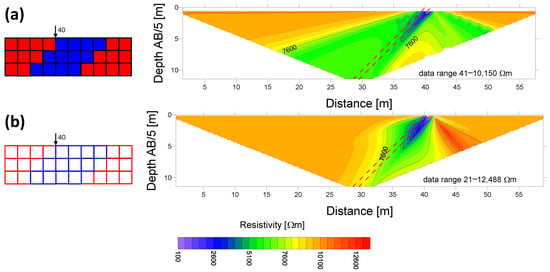
Figure 8.
Comparison of Res2Dmod (a) and resistor network (b) apparent resistivity sections. A 1 m thick conductive fracture. Left part: the detailed view of cells (a) with selected resistivities and (b) formed by resistors. The size of squared cells is 0.25 m. The vertical arrow is used to identify the position of the fracture zone in the apparent resistivity section.
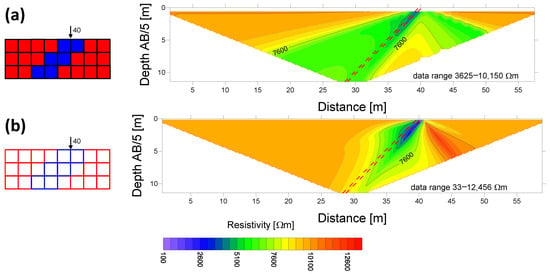
Figure 9.
Comparison of Res2Dmod (a) and resistor network (b) apparent resistivity sections. A 0.5 m thin conductive fracture.
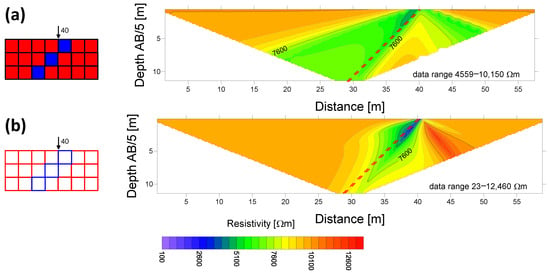
Figure 10.
Comparison of Res2Dmod (a) and resistor network (b) apparent resistivity sections. A 0.25 m thin conductive fracture.

Figure 11.
Ultra-thin conductive fracture (resistor network only). It can be compared with Res2Dmod in Figure 10a.
Each section is also accompanied by information about the overall range of the apparent resistivities. Based on this information, we can state that the sections from finite difference-based models are smoother than the sections from resistor networks. Except for the 1 m thick fracture model, the apparent resistivity contrast between the conductive fracture and the surrounding medium decreases by several orders in the case of the finite difference model. The Res2Dmod apparent resistivity section also depends on the mutual position of the fracture zone and the position of the electrode’s array. In the first model (the 1 m thick fracture), the apparent resistivity corresponding to the fracture is approaching its true resistivity at shallow depths—see Figure 8—where the fracture zone falls exactly between the MN electrodes for one electrode array position. If the fracture does not lie precisely between MN electrodes, its apparent resistivity is strongly smoothed (similar to thinner fracture models). This smoothing is based on the four-cell electrode array shift during the model calculation. The Res2Dmod algorithm can be set so that two or four cells can be between a pair of electrodes at a unit distance. According to [2], finer spacing is more suitable for modeling more complex geological settings; therefore, it was used here. Similar smoothing effects can be observed during the resistor network’s calculation in the case of an ultra-thin fracture in the fourth model—the apparent resistivity section is significantly smoothed.
Generally speaking, the Res2Dmod and the resistor network model algorithms generate fairly stable apparent resistivity cross-sections calculated for the inclined conductive fracture zone while changing its thickness. The Res2Dmod sections tend to gradually smooth the fracture’s manifestation while decreasing the fracture zone thickness. A considerable difference between the apparent resistivity sections made by both model algorithms is a “mirrored” side-effect of a fracture. In this case, it is the zone on the right from the fracture outcrop to the surface. Res2Dmod generates the zone of anomalously decreased apparent resistivities, while the resistor network creates a zone of higher apparent resistivities. This zone of higher apparent resistivities is an effect of the electrical shielding influence of the conductive fracture.
5. Discussion of the Results and the Properties of the Resistor Network Model
Numerical models are always influenced by limited model size. The edges of the resistor network result in changes in the calculated apparent resistivities compared to an unlimited model. This issue was solved by a series of test calculations using buffer zones. The buffer zones are proposed by adding several mesh columns outside the model’s sides and several more resistor layers below the bottom model’s edge. The buffer zone was built with the same resistors that form the model edges. The model calculations proved that adding 20 columns to each mesh side and 10 resistivity rows underneath the model is enough from the point of view of accuracy and computing demand. For the homogeneous model of a conductive medium with the buffer zone, the distortion of apparent resistivity due to the model’s edges was below one-tenth of a percent. Such an error manifested as slightly increased apparent resistivity near the model’s edges. It was found that this distortion might be compensated during the geometrical factors’ calculations. Usually, the geometrical factors are calculated only at the points in the model’s center. It is possible, however, to calculate the geometrical factors for all model points and subsequently use these factors in their corresponding position in the model. This type of calculation allows for further compensation of distortion in model calculations.
The resistor network model is not a true 3D or 2D model of a conductive medium; from a physical point of view, it could be used as a model of a thin conducting plate. However, the differences between the model’s and analytical apparent resistivities are not large for small-scale models. The resistor network model could be useful for qualitatively verifying or disproving the possibility of a conductive fracture in the medium.
The resistor network model’s functionality and accuracy for a thin conductor model were tested by comparing it with an analytical solution. According to Ref. [22], the analytical calculation of the apparent resistivity in a medium with an anomalous, perfectly conductive body is extremely complex for most bodies with regular shapes and almost impossible for irregular ones. We can use the theory of electrical images for geometrically simple models. For direct-current problems, the theory of images applies to horizontally bedded formations, vertical faults or dikes, and dipping faults when the formation is perfectly conducting or insulating. It is valid for certain angles of dip only.
We have calculated two models of a perfectly conductive dipping fault in the surrounding medium with given resistivity. The calculation is based on Formulae (7) and (8) for the electrical potential of the point electrode in the vicinity of the fault. The solution is, however, limited to the position of both the current source and the point of electrical potential calculation placed on the downdip side of the fault trace. Moreover, the fault dip angle is restricted to some specific values.
The potential in the vicinity of fault dipping at an angle of 45° can be evaluated using Formula (7):
where I is the current, ρ is the resistivity of the medium, r0 is the distance of the current source from the fault outcrop, and r is the distance of the point of potential calculation from the fault outcrop. The theory of images is also applicable for perfectly conductive fault dip angles , where n is any integer. In this case, the potential can be calculated as a sum of a series (8):
where the same notation is used as in Equation (7).
Based on Equations (7) and (8), we calculated vertical apparent resistivity pseudo sections for four electrode Wenner–Schlumberger type arrays. We used MN = 1 m, and AB increased from 3 to 95 m. The electrode arrays moved along the profile with a step of 1 m. The resistivity ρ of the medium was selected with a value of 1000 Ωm. The fault is, in this case, perfectly conductive. The calculated apparent resistivity values were assigned to the depth of AB/5 for apparent resistivity section imaging. The compared resistor grid was designed with 1 m long resistors of resistance of 1000 Ω for the medium, and the conductive fault was made of resistors of 0.001 Ω. The comparison of the analytical model with the appropriate resistor network model is in Figure 12 and Figure 13 for dip angles 45° and 18°.
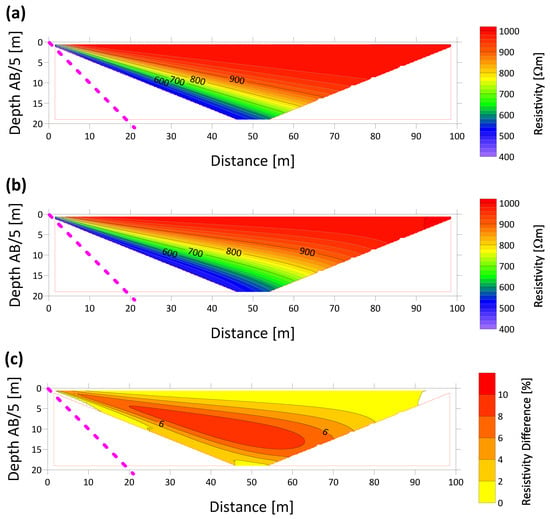
Figure 12.
The comparison of analytical (a) and resistor network (b) apparent resistivity pseudo-sections. The dip of inclined conductive fault is 45°. The evaluation of resistor network model accuracy is shown in (c) as the difference between analytical and resistor network model resistivities—i.e., (a) minus (b) in percent of surrounding medium resistivity.
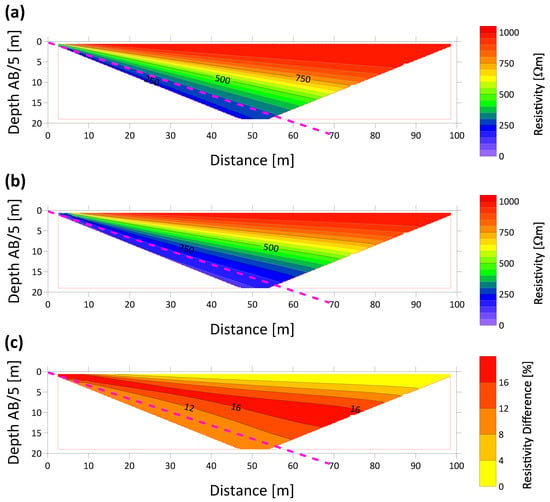
Figure 13.
The comparison of analytical (a) and resistor network (b) apparent resistivity pseudo-sections. The dip of inclined conductive fault is 18°. The evaluation of resistor network model accuracy is shown in (c) as the difference between analytical and resistor network model resistivities in percent of the surrounding medium resistivity.
The differences in apparent resistivities between the analytical model and numerical calculation using the resistor network model up to 20 m depth are less than 10 percent in the first case and 16 percent in the second. It was found that there is generally a good agreement between the resistor’s network and analytical resistivities, at least for a qualitative estimate of the possible presence of a thin conductor. An example of the practical use of the resistive network model in a hardrock medium up to a depth of 5 m is given in Ref. [17].
The resistor network model allows the anisotropy of the electrical resistivity to be modeled. The different resistivities in the horizontal and vertical directions result in a simple anisotropy model corresponding to the horizontal layering effect. The relation between horizontal and vertical resistivities enables testing of the anisotropy ratio effect on apparent resistivity cross-section depth sensitivity.
The resistor network model’s ability to display loop currents for different electrode array positions during measurement provides an intuitive idea of the effect of a conductive fracture zone on shielding or current propagation in the model. Thus, additional qualitative information can be obtained about the possible influence of certain model parts on the apparent resistivity values.
The computational algorithm for calculating the apparent resistivity using a resistor network was presented in a variant with the placement of current and measuring electrodes on the upper edge of the network. However, it can be easily modified to work with a current source between any pair of network nodes, and the measuring electrodes can be considered in any network position. Therefore, there is no problem in using the model for calculating the resistor network for an irregular surface, or even with restrictions on its other edges, as is shown to be appropriate, for example, when using ERT to analyze the condition of a stone bridge [23].
6. Conclusions
A resistor network model may work as an alternative for solving forward ERT problems. The resistor network model approximates a thin conducting slab rather than a true 2D or 3D conductive medium; however, it is useful for qualitatively assessing the thin conductive fracture zone effect. Its accuracy was validated through comparison with an analytical solution for a shallow-depth fracture model.
It was proven that the dimensionless resistor network can be associated with geometrical dimensions and can be used for calculating 2D subsurface resistivity models. This process gains apparent resistivity cross-sections similar to forward problem calculations by finite-difference or finite-element methods. However, the dimensionless nature of the resistor network model allows the modeling of irregularly connected fractures by specifying their extremely low resistances, which is more intuitive than using the conventional approach based on a block-divided medium.
The display of loop currents can provide additional information about the possible conductive fracture shielding or interconnecting effect. Thanks to its simplicity, the resistor network’s apparent resistivity calculation can be useful in geophysical applications (subsurface fracture detection), civil engineering (crack detection in smart concrete), and underground storage monitoring.
Supplementary Materials
The following supporting information can be downloaded at https://www.mdpi.com/article/10.3390/geosciences15060195/s1, Video S1: The current density field deforms while the electrode array is moved along the surface of the resistor network model.
Author Contributions
Conceptualization, J.J. and J.V.; methodology, J.V.; software, J.J. and J.V.; validation, J.J. and J.V.; formal analysis, J.V.; investigation, J.V.; resources, J.V.; writing—original draft preparation, J.J.; writing—review and editing, J.J. and J.V.; visualization, J.V.; supervision, J.V. All authors have read and agreed to the published version of the manuscript.
Funding
This manuscript received partial support from the project SYNERGYS -systems for energy synergies No CZ.10.02.01/00/22_002/0000172, cofounded by the EU Operational programme Just Transition.
Data Availability Statement
Data and software can be requested from the authors.
Conflicts of Interest
The authors declare no conflicts of interest.
Abbreviations
The following abbreviations are used in this manuscript:
| ERT | Electrical Resistivity Tomography |
References
- Loke, M.H. The Inversion of Two-Dimensional Apparent Resistivity Data. Unpublished. Ph.D. Thesis, University of Birmingham, Birmingham, UK, 1994. [Google Scholar]
- Loke, M.H. Tutorial: 2-D and 3-D Electrical Imaging Surveys; Geotomo Software: Penang, Malaysia, 2004; Available online: http://scholar.google.com/scholar_lookup?title=Tutorial:+2-D+and+3-D+Electrical+Imaging+Surveys&author=Loke,+M.H.&publication_year=2004 (accessed on 22 March 2025).
- Dey, A.; Morrison, H.F. Resistivity modelling for arbitrary shaped two-dimensional structures. Geophys. Prospect. 1979, 27, 1020–1036. [Google Scholar] [CrossRef]
- Li, S.; Liu, B.; Nie, L.; Liu, Z.; Tian, M.; Wang, S.; Su, M.; Guo, Q. Detecting and monitoring of water inrush in tunnels and coal mines using direct current resistivity method: A review. J. Rock Mech. Geotech. Eng. 2015, 7, 469–478. [Google Scholar] [CrossRef]
- Kirkby, A.; Heinson, G. Three-dimensional resistor network modeling of the resistivity and permeability of fractured rocks. J. Geophys. Res. Solid Earth 2017, 122, 2653–2669. [Google Scholar] [CrossRef]
- Bahr, K. Electrical anisotropy and conductivity distribution functions of fractal random networks and of the crust: The scale effect of connectivity. Geophys. J. Int. 1997, 130, 649–660. [Google Scholar] [CrossRef]
- Kirkby, A.; Heinson, G.; Krieger, L. Relating permeability and electrical resistivity in fractures using random resistor network models. J. Geophys. Res. Solid Earth 2016, 121, 1546–1564. [Google Scholar] [CrossRef]
- Semeriyanov, F.; Saphiannikova, M.; Heinrich, G. Anisotropic generalization of Stinchcombe’s solution for the conductivity of random resistor networks on a Bethe lattice. J. Physical A Math. Theor. 2009, 42, 17. [Google Scholar] [CrossRef]
- Young, D. RESnet: 3D direct-current resistivity simulation using the equivalent resistor network circuit. Geophysics 2024, 2, F41–F51. [Google Scholar] [CrossRef]
- Downey, A.; D’Alessandro, A.; Baquera, M.; García-Macías, E.; Rolfes, D.; Ubertini, F.; Laflamme, S.; Castro-Triguero, R. Damage detection, localization and quantification in conductive smart concrete structures using a resistor mesh model. Eng. Struct. 2017, 148, 924–935. [Google Scholar] [CrossRef]
- Tsang, C.F.; Neretnieks, I. Flow channeling in heterogeneous fractured rocks. Rev. Geophys. 1998, 36, 275–298. [Google Scholar] [CrossRef]
- Chung, D.D.L. Damage detection using self-sensing concepts. Proc. Inst. Mech. Eng. Part G J. Aerosp. Eng. 2007, 221, 509–520. [Google Scholar] [CrossRef]
- Spillmann, T.; Blüming, P.; Manukyan, E.; Marelli, S.; Maurer, H.R.; Green, A.G. Geophysics applied to nuclear waste disposal investigations in Switzerland. First Break 2010, 28, 39–50. [Google Scholar] [CrossRef]
- Sass, O.; Viles, H.A. Wetting and drying of masonry walls: 2D-resistivity monitoring of driving rain experiments on historic stonework in Oxford, UK. J. Appl. Geophys. 2010, 70, 72–83. [Google Scholar] [CrossRef]
- De Donno, G.; Di Giambattista, L.; Orlando, L. High-resolution investigation of masonry samples through GPR and electrical resistivity tomography. Constr. Build. Mater. 2017, 154, 1234–1249. [Google Scholar] [CrossRef]
- Jirků, J. 4D Characteristics of Electric Resistivities and Elastic Parameters of Crystalline Rock Massif. Ph.D Thesis, Charles University, Prauge, The Czech Republic, 2021. Available online: https://hdl.handle.net/20.500.11956/170200 (accessed on 22 March 2025).
- Jirků, J.; Vilhelm, J. Resistor network as modeling tool for fracture detection in crystalline rocks. Acta Geodyn. Geomater. 2019, 16, 465–471. [Google Scholar] [CrossRef]
- Denardo, B.; Earwood, J.; Sazonova, V. Experiments with electrical resistive networks. Am. J. Phys. 1999, 67, 981–998. [Google Scholar] [CrossRef]
- Atkinson, D.; Van Steenwijk, F.J. Infinite resistive lattices. Am. J. Phys. 1999, 67, 486–492. [Google Scholar] [CrossRef]
- Wu, F.Y. Theory of resistor networks: The two-point resistance. J. Physical A Math. Gen. 2004, 37, 6653–6673. [Google Scholar] [CrossRef]
- Tan, Z.Z.; Zhang, Q.H. Formulae of resistance between two corner nodes on a common edge of the m × n rectangular network. Int. J. Circuit Theory Appl. 2015, 43, 944–958. [Google Scholar] [CrossRef]
- Nostrand, R.G.V.; Cook, K.L. Interpretation of Resistivity Data; Geological Survey Professional Paper 499; United States Government Printing Office: Washington, DC, USA, 1966; 310p. [Google Scholar]
- Jones, L.; Jenkins, J.; Foltier, L.; Nielsen, S. Electrical resistivity tomography of a masonry bridge: Assessing water infiltration on Prebends Bridge, Durham, UK. J. Archit. Conserv. 2024, 30, 149–168. [Google Scholar] [CrossRef]
Disclaimer/Publisher’s Note: The statements, opinions and data contained in all publications are solely those of the individual author(s) and contributor(s) and not of MDPI and/or the editor(s). MDPI and/or the editor(s) disclaim responsibility for any injury to people or property resulting from any ideas, methods, instructions or products referred to in the content. |
© 2025 by the authors. Licensee MDPI, Basel, Switzerland. This article is an open access article distributed under the terms and conditions of the Creative Commons Attribution (CC BY) license (https://creativecommons.org/licenses/by/4.0/).