Abstract
Lowland landslides are very common in temperate climates but are less studied than in mountainous regions. Although they are often less spectacular, they can cause considerable damage to the land they affect. In Champagne (France), this is particularly the case in vineyards where land prices are very high. Often, they are the result of the reactivation or resumption of older, often larger and deeper landslides. The recurrence of landslides throughout the Holocene is accepted in the region but not proven. The aim of this contribution was to characterize the temporal evolution of instabilities using two LiDAR images and to understand the impact of the climate on the temporal distribution and activity of landslides. In the upper part of the landslide, displacements affect a surface area of 5500 m2 during a period of strong climatic variations. Moreover, the entire slide, 30 m deep, still appears to be moving. A comparison of two LiDAR images, therefore, enabled us to analyze the displacements with precision and to assess the associated risk management.
1. Introduction
Low plateau regions, characterized by low absolute altitudes and relative reliefs under than 200 m, can be regularly affected by gravity instabilities of the landslide type [1]. These slope instabilities have been the subject of numerous publications as there is no shortage of subjects to study, such as regions like Bosnia and Herzegovina [2] or Croatia [3], where the geological structure is the main triggering parameter. Since the 2000s, links between instabilities and climatic conditions have been clearly established [4,5,6,7]. However, other triggering factors are regularly put forward [8,9], notably anthropogenic activities [10,11]. Studies carried out in the region reveal very old and often coalescing landslides (Figure 1). These landslides have often been partially regularized and are now dormant or stabilized. Their spatial extent and depth (sometimes over 40 m) tend to demonstrate that these large landslides are ancient and formed under more favorable morphogenetic conditions than those of today. This is particularly true of the Tardiglacial period, which is when melting permafrost destabilized the partly clayey slopes. In actual temperate climates, these large landslides are not numerous due to the lack of water resources. As a result, no events of this scale are recorded in the historical archives. Nevertheless, partial reactivations occur regularly. These are usually superficial but can sometimes reach considerable depths, as has been the case in Rilly. These landslides are part of the Champagne vineyards, where more than 300 old and recent landslides have been recorded [12], including 175 in the Montagne de Reims [13]. The slopes are, therefore, regularly affected by landslides, which cause extensive damage and have already been the subject of numerous studies [12,14,15,16,17].
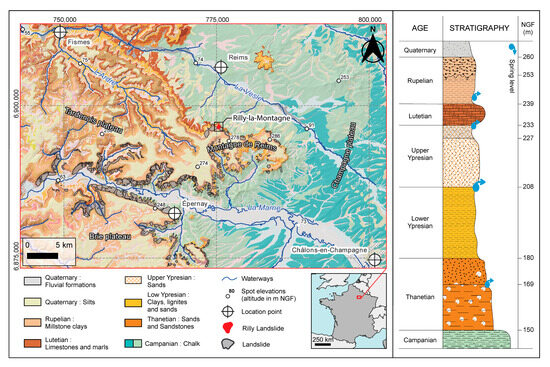
Figure 1.
Geological map of the Marne valley and the Montagne de Reims.
The observation and characterization of landslides using imagery [18,19] is common, and the use of LiDAR is also becoming increasingly frequent. This methodology makes it possible to precisely define the patterns associated with instabilities [17,20,21]. The Rilly landslide, typical of large rotational landslides on low plateaus, serves as a workshop terrain. This article aimed to understand its evolution in relation to climatic events. Therefore, we compared two LiDAR images (one from 2018 and one from 2023) with the climatic data for the region. This allowed us to define the close link between the climate and landslide behavior. Based on open-access data for the entire region, the correlation between the number of land movement events and the state of water resources was examined. This enabled us to understand the hydroclimatic forcing factors involved in lowland landslides, and it also helped to consider how they might evolve in the context of climate change.
2. Study Area
The Champagne vineyards region is characterized by a succession of clay–marl layers. The base of the slope is cut in Campanian chalk (Upper Cretaceous), which crops out up to 30 m above the bottom of the valley floor. The chalk is overlain by various layers of aclinal cenozoïc rocks: Thanetian sands, Lower Ypresian clays and marls, Upper Ypresian sands, Lutetian limestones and marls, and Bartonian and Priabonian clays [22]. The top of the plateau is covered with siliceous limestone and clay derived from Oligocene silicification and post-exhumation Quaternary argillization (Figure 1). The superimposition of all these geological layers results in numerous landslides.
The slopes of the Montagne de Reims and the Marne valley, in the heart of the Champagne vineyards region (northeast France), are regularly affected by landslides and sometimes coaslescents, which cause significant damage (Figure 1). This makes the site an excellent workshop site to study landslide behavior. The Rilly landslide is located on the northern slope of the Montagne de Reims and is a concrete example of these instabilities.
The geological structure is, therefore, conducive to instability. Geotechnical data from the Montagne de Reims [23] prove this (Table 1).

Table 1.
Analysis of the Montagne de Reims terrain [23].
The Rilly landslide was triggered in 1986 [24]. The extent of this instability cast doubt on the idea that the region’s plateaus were generally stable. The main scarp is 500 m wide and around 20 m high. A large reverse slope lies just below. It is marked by a detached block of Upper Ypresian sands. The latter is tilting under the pressure of the terrain above [24]. Further down the slope, the flow extends up to the road and displays an uneven surface. The peak phase of the landslide was very rapid, with measurements showing displacements of the order of 3 cm per hour. In the end, 5 ha were affected, and they were mostly forested areas. Two houses were damaged (one completely destroyed), and vineyards were also affected. At present, the landslide is 87% under forest cover, the toe is on the vineyard (4%), and one house on private property is still (9%). Since then, the landslide has evolved more slowly. However, some features remain visible, indicating the slow but continuous evolution of a landslide that was only partially stable (Figure 2).
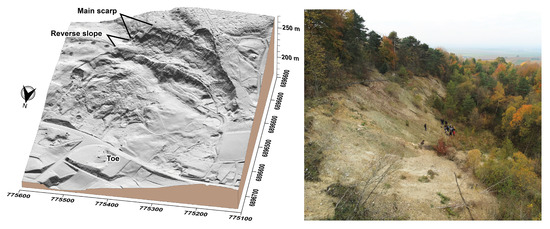
Figure 2.
Diagram of the block, and the main scarp of the Rilly landslide.
The climate at the Rilly landslide is a degraded oceanic climate. The Mailly weather station, which is the closest to the landslide and the most representative (same exposure, no shelter effect, etc.), has shown average annual precipitation of 744 mm since 1993. Precipitation is regular throughout the year, although it is generally lower in summer (Pearson standard deviation of 37.8).
The investigations that were carried out since the landslide was triggered have shown the importance of the state of water reserves in triggering landslides in the region [12]. Indeed, instabilities have occurred during periods of aquifer recharge, which followed a drier period. This statistical demonstration is borne out by the piezometric monitoring of the Saint-Maur landslide located around 1.7 km to the west, which has a similar morphology [25]. Monitoring of the piezometers on the stable slope and within the landslide mass has shown radically different behaviors. In the sliding mass, water levels do not follow climatic patterns but depend on the interstitial pressure caused by drainage from the slope’s water table. During periods of heavy recharge, the sliding mass becomes saturated and reactivations take place.
3. Materials and Methods
The first step is to determine the internal structure of the Rilly landslide in order to complement the surface observations. In particular, the aim is to determine its depth in order to understand and explain its behavior in relation to climatic parameters. The resistivity profile was produced using the electrical tomography technique [17,26,27,28,29,30], which is based on the gradient acquisition method [31]. The positioning of the profile makes it possible to characterize, taking into account all the elements of the main scarp at the toe, the entire slide from bottom to top. It is positioned in the middle of the landslide mass along private property boundaries. The electrodes were laid out in the field at 5 m intervals over a length of 460 m, and electrode topography was carried out at the DPS (Figure 3). The raw data were inverted to obtain 2D tomograms [32,33] on RES2DINV (3.71.118 version) software using first break travel times and then apparent electrical resistivity inversion codes. To invert the travel times, we used the approach proposed by [34], where Fresnel volumes are used to regularize wavepath in the model.
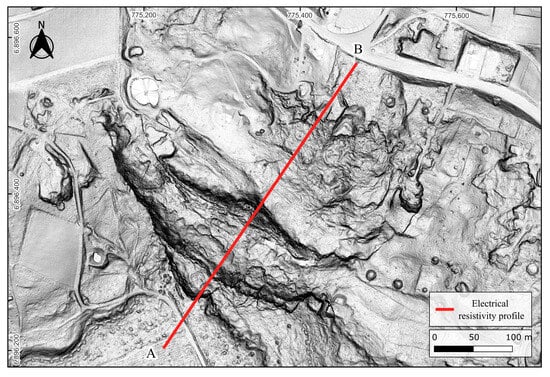
Figure 3.
Location of the electrical resistivity profile.
To quantify the evolution of the Rilly landslide, two LiDAR databases were used and then correlated with the climatic and piezometric data (Figure 4). LiDAR is a good tool for detecting landslide patterns [25,26]. The first LiDAR image was captured in 2018 by ONF (Office Nationale des Forêts). The second LiDAR image was captured in 2023 by IGN (Institut Nationale de l’Information Géographique et Forestière). The acquisition flights were conducted in winter, which is when the deciduous canopy is sparse, thus allowing for higher-quality data capture. These conditions are optimal for the quality of the data obtained. This is demonstrated by the density of points per m2. Indeed, the percentages of NoData per m2 of our two LiDAR images are extremely low, i.e., below 2% (Table 2). Overall, the 2018 ONF LiDAR image has a number of points per m2 greater than 10. The 2023 IGN LiDAR image contains over 15 points per m2. The quality of our two clouds was, therefore, very satisfactory. The density of points per m2 of the LiDAR 2018 ONF image was good enough to produce a DTM with a resolution of 50 cm, while, for the LiDAR 2023 IGN image, a DTM with a resolution of 25 cm was conceivable. However, in order to limit the bias as much as possible and to optimally compare the two LiDAR DTMs, the chosen resolution was 50 cm. The altimetric and planimetric accuracy of our LiDAR data was correct, with an altimetric accuracy of ±10 cm for our two LiDAR images, a planimetric accuracy of ±25 cm for the 2018 ONF LiDAR image, and ±50 cm for the 2023 IGN LiDAR image.
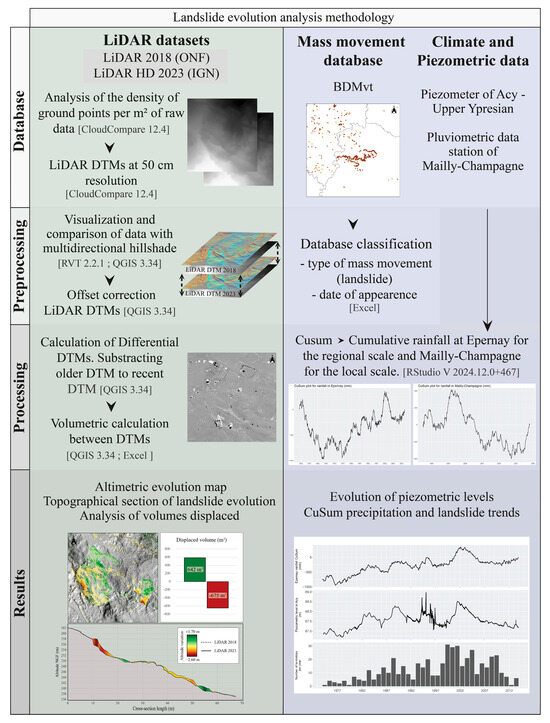
Figure 4.
Landslide evolution analysis methodology.
Table 2.
LiDAR data quality 2018–2023.
Once the DTMs were created, a number of pre-processing steps were required to obtain our results. First, data visualization was required to compare the data quality and to visualize the potential offset between the two LiDAR DTMs. A multidirectional shader was generated using RVT software. This allowed for precise data visualization while reducing traditional shading biases. Thanks to this, it was possible to adjust the DTM setting on QGIS, using points if necessary. Next, the elevation difference between the two digital terrain models was calculated. Considering the general accuracy of point clouds, planimetric accuracy is not a concern for DTM comparison as the maximum 50 cm margin of error is corrected through DTM registration. However, the altimetric accuracy could be variable across our two LiDAR images (of the order of ±10 cm maximum), and it could have a significant impact when comparing our two DTMs. After calculating the DTM differences, only significant values were retained. Values between ±20 cm were excluded as they fell within the combined margin of error of both LiDAR datasets. To validate and limit interpretation the bias as much as possible, field campaigns were carried out to validate the interpretations within the limits of accessibility on the ground (private property). The 2018 DTM was subtracted from the 2023 DTM, giving the elevation differences for each pixel between our 2 digital terrain models. In short, this reflected the movement of the materials in our study area. The evolution DTM enabled us to detect and quantify the affected surfaces, as well as to calculate the volumes of the slide masses. The results are presented in both plan and cross-section views. This allowed for analysis of the altimetric changes from the top of the main scarp to the toe of the reactivation area. These results were then compared with the climatic data from the Mailly-Champagne station (Table 2). This station, which belongs to the Comité Champagne (CIVC), is located around 6 km east of the Rilly landslide. It is located in a similar context to the Rilly landslide (exposure, altitude, wind, etc.). These homogeneous overall conditions on the northern slopes of the Montagne de Reims (notably between Rilly and Mailly) have already been demonstrated by previous scientific studies [13,35,36,37]. The climatic data allowed us to contextualize the landslide displacements and to understand their impact on instability activity.
At a regional scale, a heuristic statistical study is being carried out to correlate the number of landslides with the climatic data from the Epernay station and the piezometric levels of the region’s main Tertiary aquifer: the Upper Ypresian sands. The data on ground movements come from an open-access database managed by the Bureau de Recherches Géologiques et Minières (BRGM). Only landslide-type movements with precise and verifiable information (date, testimony, etc.) are considered. As a result, most of the instabilities taken into account date back to the 1970s at the latest. Unfortunately, this database has not been updated since 2013, which forced us to adapt our thinking accordingly. This lack of post-2013 data is a significant limitation for assessing climate-related landslide activity in a global change context. The data obtained afterward (requests from winegrowers, field observations, etc.) were too incomplete to be used statistically, and it would be difficult to update all the data in a highly anthropized environment such as the Champagne vineyards. Nevertheless, this selection provided a chronicle of around 40 years, and it can be statistically cross-referenced with climatic data obtained from Epernay station (Table 3), which represents a temperate climate typical of the region, without the intrinsic specificities (exposure, altitude, etc.) of Mailly-Champagne (or Mailly) and Rilly. At the same time, chronicles of changes in the piezometric level of the region’s main water tables were analyzed: the Upper Ypresian sand layer. By cross-referencing all these data, it was possible to understand the interactions between the climate, water resources, and instabilities (Figure 4). This approach helps to anticipate future landslide activity in a changing climate.
Table 3.
Characteristics of the Mailly and Epernay weather stations.
4. Results
The electrical resistivity tomogram validated the LiDAR data and shows that the Rilly-la-Montagne landslide reaches a depth of 30 m (±5 m). The sliding surface, marked by the lowest resistivity values meandering along the profile, reaches and even exceeds this depth in its deepest section, where its curvature indicates the rotational nature of the landslide (Figure 5). The mobilizable Tertiary formations can reach a thickness of up to 100 m. Previous investigations of the Saint Maur landslide, less than 2 km away, showed a landslide depth of between 20 and 25 m [25], making it the reference on the northern slopes of the Montagne de Reims. However, to the south-east of Rilly-la-Montagne, in the Marne valley where Tertiary soils outcrop on all slopes, depths can be greater, reaching a 40 m depth [17]. The tomogram showed a zone of high electrical resistivity outcropping at the surface and was found to be approximately 25 m deep at 240 m on the x-axis. These values were also found at depth between 180 and 200 m above sea level, where Upper Ypresian sands normally outcrop. This subsurface zone was interpreted as an area where the Upper Ypresian sands were displaced to the surface under the pressure of overlying masses, as interpreted by A. Marre in his geomorphological mapping [24]. The main reverse slope was still very wet, which explains the low electrical resistivity values in the subsurface. Similarly, the numerous reactivations of the main scarp complicated the data interpretation at this location.
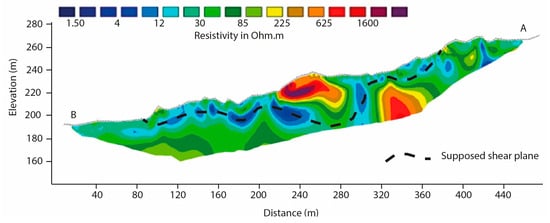
Figure 5.
Electrical resistivity profile of the Rilly landslide.
The main areas of the reactivation are in the upper part of the landslide, where numerous mass movements regulate the main scarp by regressive erosion. This evolution of the landslide had already been noted by Alain Marre in 1987 (Figure 6).
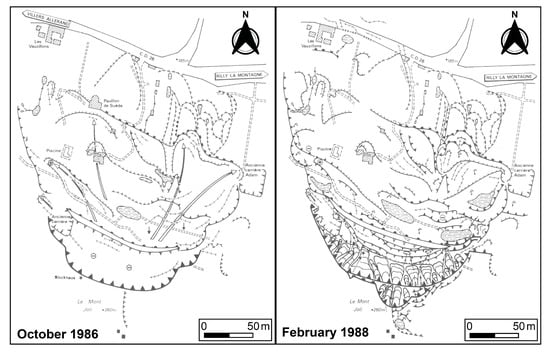
Figure 6.
Evolution of the Rilly landslide between 1986 and 1988 [24].
A comparison of the LiDAR images from 2018 and 2023 provides information on the displacements during this period. Once again, the most significant changes were observed in the upper part of the main scarp (Figure 7). This sector is marked by two major reactivations, with elevation changes exceeding 3 m in the erosion or departure zones and approaching 2 m in the accumulation zones.
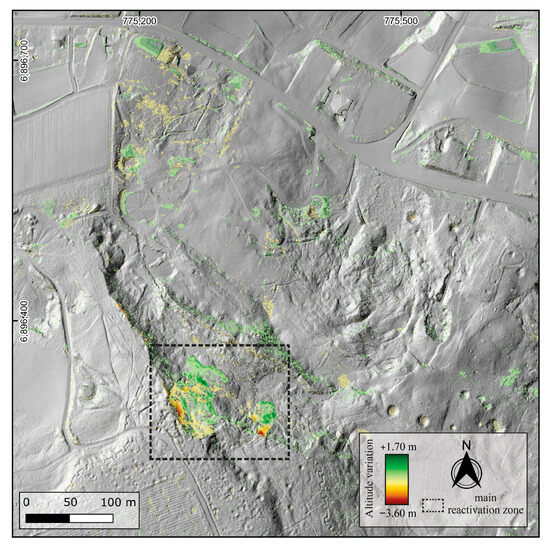
Figure 7.
Evolution of the Rilly landslide between 2018 and 2023.
The reverse slope is marked by lower, but homogeneous, displacements (Figure 7). The upper part of the landslide, close to the main scarp, shows elevation losses across the entire width of the Rilly landslide. Conversely, the part exposed to the northeast shows an increase in elevation. This systematic distribution of the elevation changes reflects a global displacement of the Rilly landslide. Under the stress of the overall displacement, this uncoupled block [24] tilts slightly down the slope. This is caused by the upper part of the landslide, where the main reactivations take place. Other changes appeared between the two LiDAR images. These were generally sporadic and less significant displacements, as shown in the flow. These movements can show that the landslide is still active. In shell holes or ponds [38,39,40], the water level, inherent to the filling of the shape, constitutes an artifact for our results. Similarly, changes along the roads or other linear structures result from anthropogenic modifications (roadside maintenance, hedge trimming, etc.) and should not be considered in the analysis of landslide evolution.
Particular interest is, therefore, focused on the main reactivations of the main scarp (Figure 8). The first, which is the furthest west, is the largest, with a surface area of 4525 m2 and an estimated displaced volume of around 650 m3. The second is smaller, representing just over 200 m3 of displaced material (Table 4).
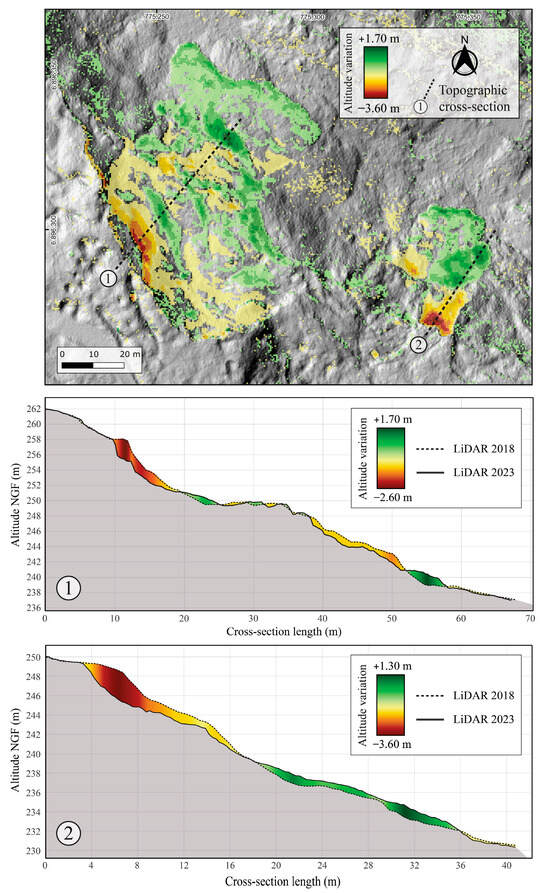
Figure 8.
Reactivations of the main scarp.
Table 4.
Main characteristics of the main scarp reactivations.
For Reactivation 1, 675 m3 of material were eroded and 642 m3 accumulated below. For Reactivation 2, 228 m3 of material was moved and 201 m3 accumulated below. Therefore, 95% (Reactivation 1) and 88% (Reactivation 2) of the eroded volumes accumulated downslope. The difference between the two corresponds to post-runoff erosion, compaction, or margin of error. These two main reactivations, therefore, have similar volumetric characteristics to the many landslides that occur in the region [25]. These landslides are often reactivations of larger and older landslides, which is not the case at Rilly. Reactivation 1 had a more complex structure than Reactivation 2, which was globally marked by a significant zone of erosion in the upper part, and this was followed by a zone of accumulation in the lower part. This pattern reflects the typical downslope displacement of the material caused by gravitational imbalance. Reactivation 1 is more complex due to a flat area that both limits the displaced volume and accounts for the presence of a secondary erosion zone in the lower part of the profile. The displacements are thus widespread but occur at limited depth. The volumes displaced in Reactivation 1 are greater, yet the elevation differences are less pronounced than in Reactivation 2. This can be clearly seen in the cross-sections, where the differences in elevation between the two LiDAR images are smaller (Figure 8).
5. Discussion
These displacements of the Rilly landslide show that the slide is still active. On the one hand, the landslide has experienced repeated reactivations at the main scarp since 1986. This is the most visible development but not the most significant. On the other hand, the displacements on the reverse slope reflect a slow but generalized movement of the landslide. These displacements, even if small, show that the Rilly landslide is still active and cannot be considered dormant. The entire slide mass is still evolving, even though the paroxysm phase occurred nearly 40 years old. This may be due to the geological structure, which is conducive to movement, as is the case at Loess Plateau in China [41] or in the Czech Carpathians [42]. However, the long period of activity seems unprecedented in a low plateau context, where landslides generally stabilize more rapidly [43] than in a mountainous context [44,45].
The standardized piezometric levels of the Upper Ypresian sands at Acy (the region’s main aquifer; ADES database) correlate well with the CuSum deviation (cumulative sum from the mean) of the monthly rainfall at Mailly-Champagne (CIVC data; Figure 9). The wettest periods cause a rise in groundwater levels, while rainfall deficits quickly lead to their decrease. This data comparison also shows that the 2018–2023 evolution phase of the Rilly landslide (in red) did not occur during a particularly wet period, where piezometric levels are high (Figure 9).
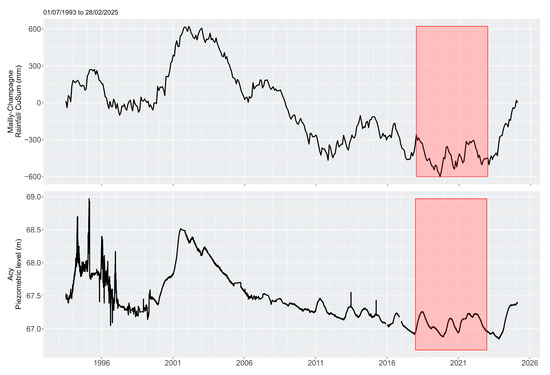
Figure 9.
The rainfall and piezometric levels and period between the 2 LiDAR (in red).
On the other hand, the 2018–2022 period was marked by strong climatic fluctuations, with successive dry and wet seasons leading to significant groundwater fluctuations. The landslide is, therefore, still active, even though water resources are not in surplus. The trends analyzed during this period are, thus, not the result of a specific period but define an overall trend. This method of investigation helps us to understand that landslides in temperate regions in a low plateau context remain in motion and stabilize slowly. Moreover, the regularization of shapes—the only evolution immediately visible on the field—is confirmed and still underway almost 40 years after the triggering of the Rilly landslide. This raises questions about the need to monitor the Rilly landslide and manage the associated risk. The landslide remains unstable, posing a significant risk to infrastructures installed on it such as houses, roads, vineyards, and power lines. No mitigation measures have been implemented, despite the damage caused by the paroxysm phase in 1986. Regular monitoring of displacements with LiDAR images acquired by drone could detect changes over time. These data could then be correlated with in situ piezometric monitoring (which is currently absent) and climatic data.
On a global scale, the importance of water resources on landslide triggering and activity has already been demonstrated in the region [12]. The example of Rilly tends to confirm this trend. Cross-observation of several indicators shows a significant correlation: standardized piezometric levels in the Upper Ypresian sands at Acy, the deviation of the cumulative sum from the mean (CuSum) of monthly precipitation at Epernay (a station representative of the region; Météo France data), and the number of landslides in the region (BRGM database) (Figure 10). The data stop in 2013 as the landslide database has not been updated since that date.
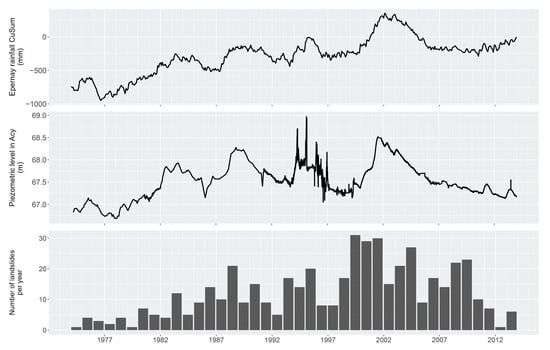
Figure 10.
The relationship between the landslides and water resources.
The succession of a series of dry years (1971–1976) and a series of wetter years (1977–1983) is not very morphogenic. In this case, recharge starts from a very low level and results in insufficient aquifer yields, which are not sufficient to supply water to the landslide masses or trigger new events. In addition, surface desiccation plays little role in dry years, even though it increases the permeability of materials (often clayey in nature) and infiltration in wet years. On an annual scale, high piezometric levels, particularly during wet years, do not systematically lead to ground movement. For example, 1995, when groundwater levels were at their highest, was not the most morphogenic year. Conversely, a series of dry years logically generates very few ground movements.
Ground movements are more frequent at the end of a succession of wet years, which ensures prolonged aquifer recharge. This was observed in 1986–1988 and 2000–2001, which is when record-high piezometric levels and groundwater flooding were recorded. The phenomenon intensifies when wet periods follow drier, water-deficient years. Instability also increases when a series of wet years occurs during a period of already high piezometric levels, as observed between 1995 and 1997.
Consequently, the water status of sliding masses, which may or may not lead to displacement, does not derive exclusively from the climatic balance (P-ETR), as may be the case in other regions (such as, for example, in Japan [46]). Instead, it is due to the state of the aquifer reserves, which continuously supply the sliding masses from the underground and are not affected by evapotranspiration. Nevertheless, climatic fluctuations throughout the Holocene have set the pace for slope dynamics, with, for example, a large number of instabilities at the end of the Atlantic [4,47,48,49], which is a period in which the anthropogenic and climatic parameters begin to combine [50,51,52].
In the context of climate change, these data are extremely important for landslide risk management. In the temperate regions of Western Europe—particularly northeastern France, which is where the Rilly landslide is located—a rise in global temperature is expected according to IPCC data. This warming will be accompanied by more frequent extremes—i.e., very dry and very wet periods—resulting in increased contrasts and variability in water resources. According to this model, the number of landslides in the coming decades is likely to increase, confirming conclusions reached elsewhere [53]. Furthermore, existing landslides, such as the one at Rilly, are likely to stabilize more slowly in the coming years. With climatic fluctuations expected to intensify, instability may persist or even worsen. The Rilly landslide is, thus, likely to remain active and could even reach a new phase of paroxysm if this model is confirmed.
6. Conclusions
Landslides in low plateau regions in temperate environments are not the most studied. However, they can be large in scale, as was the case with the Rilly landslide, and they can evolve in significant and complex ways. LiDAR technology allows for a detailed characterization of landslide features and the associated kinematics. Comparing two LiDAR datasets from the same area provides a precise understanding of the evolution of displaced masses and their response to climatic conditions. In Rilly, a rapid evolution of the main scarp is observed before stabilizing, particularly during periods of contrasting climatic conditions. Although less visible, the entire displaced mass remains active, despite the initial landslide dating back to 1986. Analyzing its evolution and the number of landslides in relation to water resources provides valuable insight into the mechanisms driving instability activities. Movements, particularly the reactivation of older and deeper landslides, are mainly driven by the water content of the displaced masses, which depend more on aquifer drainage than on precipitation. Therefore, precipitation alone cannot be used as the sole trigger for landslides. Given that climate change is expected to intensify the alternation of dry and wet periods, landslide activity in temperate lowland areas is likely to increase in the coming decades.
Monitoring the displacement of landslides in the coming years will help confirm these findings. Thanks to drones, LiDAR imagery is now more accessible, enabling more regular and long-term monitoring. The methodology presented here can also be applied to other landslides to confirm links with climatic conditions. In addition, hydrometric and geochemical monitoring of springs [14] at the margins of the landslides could improve our understanding of water flow constraints and the subsurface circulation condition between aquifers and displaced masses.
Author Contributions
Conceptualization, N.B.; methodology, N.B., A.B., J.B., T.K. and P.-Y.A.; software, A.B., J.B., D.C. and T.K.; validation, N.B., A.D., J.B. and O.L.; formal analysis, N.B. and D.C.; investigation, N.B. and A.B.; resources, N.B, A.D. and J.B.; data curation, N.B., A.B., J.B., D.C. and T.K.; writing—original draft preparation, N.B., A.B., J.B. and P.-Y.A.; writing—review and editing, P.-Y.A., N.B., A.D., J.B., T.K. and O.L.; supervision, N.B.; Project administration, N.B. All authors have read and agreed to the published version of the manuscript.
Funding
This research received no external funding.
Data Availability Statement
The raw data supporting the conclusions of this article will be made available by the authors on request.
Conflicts of Interest
The authors declare no conflicts of interest.
Abbreviations
The following abbreviations are used in this manuscript:
| BRGM | Bureau de Recherches Géologiques et Minières |
| ONF | Office Nationale des Forêts |
| CIVC | Comité Interprofessionnel des Vins de Champagne |
References
- Dikau, R.; Cavallin, A.; Jäger, S. Databases and GIS for landslide research in Europe. Geomorphology 1996, 15, 227–239. [Google Scholar] [CrossRef]
- Djuric, N.; Besevic, M.; Djuric, D.; Prokic, A.; Kukaras, D. Causes and Consequances of Certain Landslides in Republic of Srpska, Bosnia and Herzegovina. Procedia Earth Planet. Sci. 2015, 15, 159–164. [Google Scholar] [CrossRef][Green Version]
- Prodan, M.V.; Peranic, J.; Jagodnik, V.; Setiawan, H.; Arbans, Z. Influence of precipitation and soil conditions on the Krbavcici landslide reactivation (Istria Peninsula, Croatia). In Proceedings of the 6th Regional Symposium on Landslides, Belgrade, Serbia, 15–18 May 2024. [Google Scholar] [CrossRef]
- Demoulin, A.; Pissart, A.; Schroeder, C. On the origin of late Quaternary palaeolandslides in the Liège (E Belgium) area. Int. J. Earth Sci. 2003, 92, 795–805. [Google Scholar] [CrossRef]
- Hadji, R.; Boumazbeur, A.; Limani, Y.; Baghem, M.; Chouabi, A.-M.; Demdoum, A. Geologic, topographic and climatic controls in landslide hazard assessment usgin GIS modeling: A case study of Souk Ahras region, NE Algeria. Quat. Int. 2013, 302, 224–237. [Google Scholar] [CrossRef]
- Fang, Z.; Barasal Morales, A.; Wang, Y.; Lombardo, L. Climate change has increased rainfall-induced landslide damages in central China. Int. J. Disaster Risk Reduct. 2025, 119, 105320. [Google Scholar] [CrossRef]
- Ramzan, M.; Cui, P.; Ualiyeva, D.; Mukhtar, H.; Bazai, N.A.; Baig, M.A. Impact of climate change on landslides along N-15 Highway, northern Pakistan. Adv. Clim. Change Res. 2025, in press. [Google Scholar] [CrossRef]
- Panek, T.; Hradecky, J.; Smolkova, V.; Silhan, K. Giant ancient landslide in the Alma water gap (Crimean Mountains, Ukraine): Notes to the predisposition structure, and chronology. Landslides 2008, 5, 367–378. [Google Scholar] [CrossRef]
- Panek, T.; Hradecky, J.; Smolkova, V.; Silhan, K. Gigantic low-gradient landslides in the northern periphery of the Crimean Mountains (Ukraine). Geomorphology 2008, 95, 449–473. [Google Scholar] [CrossRef]
- Preuth, T.; Glade, T.; Demoulin, A. Stability analysis of a human-influenced landslide in eastern Belgium. Geomorphology 2010, 120, 38–47. [Google Scholar] [CrossRef]
- Vranken, L.; Van Turnhout, P.; Van Den Eeckhaut, M.; Vanderkerckhove, L.; Poesen, J. Economic valuation of landslide damage in hilly regions: A case study from Flanders, Belgium. Sci. Total Environ. 2013, 447, 323–336. [Google Scholar] [CrossRef]
- Bollot, N.; Devos, A.; Pierre, G. Ressources en eau et glissements de terrain: Exemple du bassin versant de la Semoigne (bassin de Paris, France). Géomorphologie: Relief, Processus. Environnement 2015, 2, 121–132. [Google Scholar] [CrossRef]
- Berthe, J. Apport du LiDAR Aéroporté à la Comprehension des Hydrosystèmes—Exemple de la Montagne de Reims. Ph.D. Thesis, Université de Reims Champagne-Ardenne, Reims, France, 2024; 412p. [Google Scholar]
- Ortonovi, S.; Bollot, N. Modélisation des glissements de terrain du vignoble champenois. Vign. Champen. 2019, 9, 37–42. [Google Scholar]
- Ortonovi, S.; Bollot, N.; Pierre, G.; Devos, A.; Perarnau, R. Dynamique et modelé des versants cambrés de la vallée de l’Ardre (plateau éocène du Soissonnais, bassin de Paris, France). Géomorphol. Relief Process. Environ. 2020, 26, 117–126. [Google Scholar] [CrossRef]
- Ortonovi, S.; Bollot, N.; Pierre, G.; Deroin, J.-P. Cartographie de la susceptibilité aux glissements de terrain dans le vignoble champenois entre Epernay et Dormans (France): Apport de la télédétection multispectrale. Géomorphol. Relief Process. Environ. 2021, 27, 147–158. [Google Scholar] [CrossRef]
- Bollot, N.; Pierre, G.; Grandjean, G.; Fronteau, G.; Devos, A.; Lejeune, O. Internal structure and reactivations of a mass movement: The case study of the Jacotines landslide (Champagne vineyards, France). GeoHazards 2023, 4, 183–196. [Google Scholar] [CrossRef]
- Li, X.; Zhao, C.; Hölter, R.; Datcheva, M.; Lavasan, A. Modelling of a large landslide problem under water level fluctuation—Model calibration and verification. Geosciences 2019, 9, 89. [Google Scholar] [CrossRef]
- Zhang, X.; Xu, C.; Li, L.; Feng, L.; Yang, W. Inventory of Landslides in the Northern Half of the Taihang Mountain Range, China. Geosciences 2024, 14, 74. [Google Scholar] [CrossRef]
- Xiong, L.; Wang, G.; Bao, Y.; Zhou, X.; Sun, X.; Zhao, R. Detectability of repeated airborne laser scanning for mountain landslide monitoring. Geosciences 2018, 8, 469. [Google Scholar] [CrossRef]
- Cai, J.; Zhang, L.; Dong, J.; Dong, X.; Li, M.; Xu, Q.; Liao, M. Detection and characterization of slow-moving landslides in the 2017 Jiuzhaigou earthquake area by combining satellite SAR observations and airborne Lidar DSM. Eng. Geol. 2022, 305, 106730. [Google Scholar] [CrossRef]
- Laurain, M.; Guérin, H.; Durand, R.; Chertier, B.; Louis, P.; Marfaux, P.; Neiss, R. Note explicative de la feuille de Reims au 1/50,000. In Carte Géologique de France; BRGM: Orléans, France, 1981; p. 132. [Google Scholar]
- Cozeret, O. Les mouvements de terrain dans le secteur de Champillon-Dizy-Hautvillers (Marne). Trav. L’institut Géogr. Reims 1987, 69–72, 129–150. [Google Scholar] [CrossRef]
- Marre, A. Le mouvement de terrain de Rilly-la-Montagne du 23 août 1986, naissance et évolution. Trav. L’institut Géogr. Reims 1987, 69–72, 95–111. [Google Scholar] [CrossRef]
- Bollot, N.; Pierre, G.; Devos, A.; Lutz, P.; Ortonovi, S. Hydrogeology of a landslide: A case study in the Montagne de Reims (Paris basin, France). Quaterly J. Eng. Geol. Hydrogeol. 2022, 56, 2021–2041. [Google Scholar] [CrossRef]
- Jomard, H.; Lebourg, T.; Binet, S.; Tric, E.; Hernandez, M. Characterization of an internal slope movement structure by hydrogeophysical surveying. Terra Nova 2007, 19, 48–57. [Google Scholar] [CrossRef]
- De Bari, C.; Lapenna, V.; Perrone, A.; Puglisi, C.; Sdao, F. Digital photogrammetric analysis and electrical resistivity tomography for investigating the Picerno landslide (Basilicata region, southern Italy). Geomorphology 2011, 133, 34–46. [Google Scholar] [CrossRef]
- Grandjean, G.; Gourry, J.C.; Sanchez, O.; Bitri, A.; Garambois, S. Structural study of the Ballandaz landslide (French Alps) using geophysical imagery. J. Appl. Geophys. 2011, 75, 531–542. [Google Scholar] [CrossRef]
- Uhlemann, S.; Chambers, J.; Wilkinson, P.; Maurer, H.; Merritt, A.; Meldrum, P.; Kuras, O.; Gunn, D.; Smith, A.; Dijkstra, T. Four-dimensional imaging of moisture dynamics during landslide reactivation. J. Geophys. Res. Earth Surf. 2017, 122, 398–418. [Google Scholar] [CrossRef]
- Hu, S.; Wang, X.; Wang, N.; Yang, D.; Wang, D.; Ma, S.; Song, Z.; Cao, M. Dynamic process, influence, and triggering mechanism of slope remodelling by landslide clusters in the South Jingyang Tableland, China. Catena 2022, 217, 106518. [Google Scholar] [CrossRef]
- Jongmans, D.; Bièvre, G.; Renalier, F.; Schwartz, S.; Beaurez, N.; Orengo, Y. Geophysical investigation of a large landslide in glaciolacustrine clays in the Trièves area (French Alps). Eng. Geol. 2009, 109, 45–56. [Google Scholar] [CrossRef]
- Colangelo, G.; Lapenna, V.; Perrone, A.; Piscitelli, S.; Telesca, L. 2D Self-Potential tomographies for studying groundwater flows in the Varco d’Izzo landslide (Basilicata, southern Italy). Eng. Geol. 2006, 88, 274–286. [Google Scholar] [CrossRef]
- Göktürkler, G.; Balkaya, C.; Erhan, Z. Geophysical investigation of a landslide: The Altindag landslide site, Izmir (western Turkey). J. Appl. Geophys. 2008, 65, 84–96. [Google Scholar] [CrossRef]
- Gance, J.; Grandjean, G.; Samyn, K.; Malet, J.-P. Quasi-Newton inversion of seismic first arrivals using source finite bandwidth assumption: Application to subsurface characterization of landslides. J. Appl. Geophys. 2012, 87, 94–106. [Google Scholar] [CrossRef]
- Beltrando, G.; Bridier, S.; Madelin, M.-H.; Queno, H. Evaluation de l’impact d’un futur remblai de la ligne à grande vtesse Est Européenne sur le risque de gel dans le vignoble de Champagne. Hommes Terres Nord 2002, 1, 40–52. [Google Scholar] [CrossRef]
- Madelin, M.-H.; Beltrando, G.; Langellier, F.; Camblan, M. Amélioration de la prévision des gelées printanières dans le vignoble de la Marne en Champagne. Hommes Terres Nord 2002, 1, 53–62. [Google Scholar] [CrossRef]
- Briche, E.; Quenol, H.; Beltrando, G. Changement climatique dans le vignoble champenois. L’année 2003, préfigure t-elle les prévisions des modèles numériques pour le XXIème siècle? L’espace Géogr. 2011, 2, 164–175. [Google Scholar] [CrossRef]
- Mora, O.; Lenzano, M.-G.; Toth, C.-K.; Grejner-Brzezinska, A.; Fayne, J.-V. Landslide change detection based on multu-temporal airborne LiDAR-Derived DEMs. Geosciences 2018, 8, 23. [Google Scholar] [CrossRef]
- Azmoon, B.; Biniyaz, A.; Liu, Z. Use of High-Resolution Multi Temporel DEM Data for landslide detection. Geosciences 2022, 12, 378. [Google Scholar] [CrossRef]
- Berthe, J.; Devos, A.; Lejeune, O.; Bollot, N.; Fronteau, G.; Perarnau, R.; Ortonovi, S. Apport du LiDAR aéroporté sur la compréhension des facteurs d’exokarstification en contexte de bas plateau, exemple de la Montagne de Reims (France). Géomorphologie Relief Process. Environ. 2022, 28, 207–221. [Google Scholar] [CrossRef]
- Hu, S.; Qiu, H.; Wang, X.; Gao, Y.; Wang, N.; Wu, J.; Yang, D.; Cao, M. Acquiring high-resolution topography and performing spatial analysis of loess landslides by using low-cost UAVs. Landslides 2018, 15, 593–612. [Google Scholar] [CrossRef]
- Brezny, M.; Panek, T. Deep-seated landslides affecting monoclinal flysch morphostructure: Evaluation of LiDAR-derived topography of the highest range of the Czech Carpathians. Geomorphology 2017, 285, 44–57. [Google Scholar] [CrossRef]
- Chalupa, V.; Panek, T.; Silhan, K.; Brezny, M.; Tichavsky, R.; Grygar, R. Low-topography deep-seated gravitational slope deformation: Slope instability of flysch thrust fronts (Outer Western Carpathians). Geomorphology 2021, 389, 107833. [Google Scholar] [CrossRef]
- Panek, T.; Klimes, J. Temporal behavior of deep-seated gravitational slope deformations: A review. Earth-Sci. Rev. 2016, 156, 14–38. [Google Scholar] [CrossRef]
- Fernandez, T.; Perez, J.-L.; Colomo, C.; Cardenal, J.; Delgado, J.; Palenzuela, J.-A.; Irigaray, C.; Chacon, J. Assessment of the evolution of a landslide using digital photogrammetry and LiDAR techniques in the Alpujarras region (Granada, Southeastern Spain). Geosciences 2017, 7, 32. [Google Scholar] [CrossRef]
- Koshimizu, K.; Uchida, T. Time-Series Variation of Landslide Expansion in Areas with a Low Frequency of Heavy Rainfall. Geosciences 2023, 13, 314. [Google Scholar] [CrossRef]
- Gonzalez Diez, A.; Salas, L.; Diaz de Teran, J.R.; Cendrero, A. Late Quaternary climate changes and mass movement frequency and magnitude in the Cantabrian region, Spain. Geomorphology 1996, 15, 290–309. [Google Scholar] [CrossRef]
- Soldati, M.; Corsini, A.; Pasuto, A. Landslides and climate change change in the Italian Dolomites since the Late Glacial. Catena 2004, 55, 141–161. [Google Scholar] [CrossRef]
- Panek, T.; Margielewski, W.; Taborik, P.; Urban, J.; Hradecky, J.; Szura, C. Gravitationally induced caves and other discontinuities detected by 2D electrical resistivity tomography: Case studies from the Polish Flysch Carpathians. Geomorphology 2010, 123, 165–180. [Google Scholar] [CrossRef]
- Dapples, F.; Lotter, A.F.; van Leeuwen, J.F.N.; van der Knaap, W.O.; Dimitriadis, S.; Oswald, D. Peleolimnological evidence for increased landslide activity due to forest clearing and land-use since 3600 cal BP in the western Swiss Alps. J. Paleolimnol. 2002, 27, 239–248. [Google Scholar] [CrossRef]
- Remondo, J.; Soto, J.; Gonzalez Diez, A.; Diaz de Teran, J.R.; Cendrero, A. Human impact on geomorphic processes and hazards in mountain areas in northern Spain. Geomorphology 2005, 66, 69–84. [Google Scholar] [CrossRef]
- Van Den Eeckhaut, M.; Marre, A.; Poesen, J. Comparison of two landslide susceptibility assessments in the Champagne-Ardenne region (France). Geomorphology 2010, 11, 141–155. [Google Scholar] [CrossRef]
- Wu, S.-J.; Chen, S.-R.; Wang, C.-D. Modeling ANN-Based Estimations of Probabilistic-Based Failure Soil Depths for Rainfall-Induced Shallow Landslides Due to Uncertainties in Rainfall Factors. Geosciences 2025, 15, 88. [Google Scholar] [CrossRef]


Disclaimer/Publisher’s Note: The statements, opinions and data contained in all publications are solely those of the individual author(s) and contributor(s) and not of MDPI and/or the editor(s). MDPI and/or the editor(s) disclaim responsibility for any injury to people or property resulting from any ideas, methods, instructions or products referred to in the content. |
© 2025 by the authors. Licensee MDPI, Basel, Switzerland. This article is an open access article distributed under the terms and conditions of the Creative Commons Attribution (CC BY) license (https://creativecommons.org/licenses/by/4.0/).