1. Introduction
In mountainous regions, people must deal with the snow and its consequences. Snow avalanches are the main and most disruptive example of natural hazards carried by the presence of snow, causing several fatalities and intense damage and or malfunction to structures and infrastructures [
1].
In the last decades, several examples have shown their catastrophic impact. For instance, in 1995, in Iceland, two devastating avalanches caused the death of several inhabitants. On 16 January, in North West Iceland’s town of Súðavík, an avalanche caused 14 casualties, damaging 22 out of 70 houses. Some months later, on 26 October in the city of Flateyri, another avalanche hit the settlement, causing 20 victims [
2,
3]. In February 1999, a huge avalanche hit the small tourist village of Galtür (Austria), destroying seven buildings and burying 57 people, 31 of whom were killed [
4]. In Italy, the last catastrophic event is dated to 18 January 2017, when an avalanche destroyed the Rigopiano Gran Sasso Resort & Wellness in Farindola (PE), Abruzzo. The avalanche struck the building, trapping the 40 occupants and leading to the deaths of 29 individuals. This tragedy was the highlight of a series of emergencies in the region (such as the interruption of electricity for days, dwellings and villages being isolated and issues during the road cleaning operations), which had a profound impact on public opinion [
5,
6].
Moreover, in populated mountain areas, subject to alterations due to climate change, the avalanche risk is continuously modifying, as shown by Mayer et al. in the Swiss Alps. The avalanche activity could be reduced by 10% to 60%, depending on the scenario considered, and the period of wet snow avalanches is also shifted during early winter months [
7].
The definition of the avalanche risk acting on the target passes through a proper risk analysis. The results of this analysis should guide the local territory government to implement the best strategy for avalanche risk management, in terms of which elements protect and which countermeasures should be put in place.
The protection of the target at risk requires the implementation of defence measures, defined as any measure implemented in an avalanche catchment area aiming to protect the at-risk target. The defence measures can be grouped as active or passive. The active measures are designed to prevent release, mitigate the avalanche’s destructive force, and lower the event’s frequency and/or intensity. Snow bridges, snow nets, snowdrifts, and artificial release are some examples of active measures. Differently, the passive measures aim to alleviate the consequences of a potential avalanche hazard. Avalanche monitoring, avalanche warning service, and administrative/legal measures (building permission, regulations, prohibitions) compose this category [
1].
Risk can be defined, according to the 1997 IUGS Committee on Risk Assessment for Landslides of the International Union of Geological Sciences, as a function of hazard, exposed elements, and their associated vulnerability [
8]. Technical literature presents several methods to assess the risk posed to a territory, buildings, or infrastructure. The following are some examples of different methods and approaches to evaluate avalanche risk. For instance, Keylock et al. [
2] developed a simulation method to map the avalanche risk in residential areas in Iceland. In this case, the risk is considered a quantitative value obtained from the product of avalanche event frequency, exposure, and vulnerability of the target point. The event frequency is determined by (1) the mean avalanche frequency on the path, defined from past observation; (2) the frequency of specific avalanche sizes; (3) the probability of the event reaching the target point obtained from a runout probability density function for the given size. The authors determine exposure based on the building characteristics and its occupancy time. Vulnerability (in terms of fatalities and specific loss) is established by putting in relation probable damage to avalanche dimension, with specific tables, mainly taking into account avalanche magnitude and the materials used in buildings. Once the spatial and dynamic evolution of the avalanche is defined, exploiting a correlation between the fatalities and the avalanche velocity retrieved from past Icelandic events, the risk in terms of the annual probability of being killed is obtained [
3,
9,
10].
Similarly, Barbolini et al. [
11] defined a method for risk analysis, considering the probability of being killed while living or working permanently in an area subjected to avalanche hazard. In this case, the risk is defined by combining the estimated hazard based on dynamic models and the vulnerability as a function of the avalanche speed. The method is applied to an avalanche site in Val Nigolaia in the Trento Province, Italy.
Recently, Ortner et al. [
12] introduced a risk assessment framework to aid decision-makers in territory management. In this approach, by combining hazard, exposure, and vulnerability, risk maps are obtained. Employing the results of simulations in different scenarios, the hazard is defined and subsequently mapped through the territory by means of large-scale hazard indication methods. Respectively, exposure and vulnerability are taken into consideration with building layers depicting the territorial distribution of monetary assets and damage functions.
Up to this point, the methods introduced have assessed risk for buildings or settlements without incorporating infrastructure into the analysis, such as traffic routes. To estimate the risk in this kind of application, some tailored methods have been developed, such as the Avalanche Hazard Index (AHI) and Wilhelm’s method. In the following, a brief overview of the two methods is presented.
AHI cannot be properly defined as a risk computation method, but is widely used—especially in English-speaking countries—to quantify the dangerousness of traffic routes. Indeed, AHI [
13] is based on the interaction between vehicles, considering both moving and waiting traffic, and snow avalanches, enabling a comparison of hazard levels across different road sections. To determine AHI, the weighted expected frequency of vehicle encounters with avalanches is summed. The calculation is based on estimating avalanche types (i.e., different magnitudes and different consequences), their width when crossing the road, the occurrence frequency, and their temporal correlation with avalanches in adjacent tracks. As can be shown by this brief description, AHI takes into consideration several parameters, most of them coming from the hazard domain, but others related to vulnerability and exposure (particularly traffic-related factors). The method has been used in Canada [
13,
14,
15], in the USA [
16,
17], and in New Zealand [
18]. The method, properly adjusted, has been employed to compute the avalanche risk for walking tracks [
19].
Wilhelm [
20] published a method to compute the quantitative risk, considering it as the outcome of the avalanche probability of occurrence and the event effects, focusing on the damage probability being reached or exceeded. Its significance lies in its application to avalanche risk assessment on routes. Due to its relatively simple implementation and computation, it is one of the most widely used approaches in this type of application. The method will be detailed in the next chapter. For instance, it has been used to compute the risk of Swiss passes [
21]. The method, subsequently, has been modified to take into account other situations that have been neglected initially, such as considering different types of avalanches with their different destructive power [
18] and the waiting traffic [
22]. However, Wilhelm’s method defines the risk without explicitly considering the parameters of vulnerability and exposition. These values are taken into consideration indirectly, considering the amount and composition of traffic (exposure) and statistical data on past avalanche tragedies on roads (vulnerability).
To conclude this discussion, the multi-criteria risk assessment (McRA) published in the Italian avalanche risk guidelines [
23] is presented. This is contained in a simple framework for local administrators, which aims to give tools to define the avalanche risk and guide the risk management process. The framework is a multilevel approach, in which the McRA method allows quantifying the avalanche risk through the so-called Risk Class (RC). This approach takes into consideration the avalanche hazard of the area studied, as well as the vulnerability and the exposure of the target element. Unlike the previous methods, the McRA method can deal with buildings and infrastructure systems, showing high flexibility. The methods will be detailed in the following section of this work.
The objective of this study is to compare Wilhelm’s method and the McRA method for evaluating avalanche risk on a road stretch, highlighting their respective strengths and weaknesses. Specifically, by analysing a well-established methodology against a more adaptable alternative, the authors seek to evaluate their efficiency, ease of application and interpretation of results. The selected study area is a segment of the Val Ferret Road near Planpincieux hamlet (Courmayeur, Aosta Valley, IT). Moreover, an additional risk analysis, to exhibit the McRA versatility, of a hotel located in Planpincieux is performed.
The paper is organised as follows.
Section 2 briefly describes the principles and the operation of the two methods.
Section 3 portrays the Val Ferret, the case study analysed.
Section 4 presents the analysis outcomes and the subsequent discussion about the results. The Conclusions (
Section 5) follow and complete the paper.
2. Materials and Methods
Wilhelm’s method is a key reference for avalanche risk assessment in the road sector, valued for its straightforward calculations and limited data needed. Indeed, essential avalanche data (i.e., return period and road–avalanche intersection length) and traffic data are necessary. This well-established procedure is compared with the McRA described in Italian avalanche risk guidelines. This approach computes the risk through a RC that is obtained by combining the hazard, vulnerability, and exposure parameters computed for the target under analysis. This new approach is compared to the well-established Wilhelm’s method to showcase the respective strengths and limits. In this chapter, the methods used are briefly described, and their mathematical formulation and the parameters involved in the computation are defined.
2.1. Wilhelm’s Method (1998)
The method belongs to the family of Probability of Death for Individuals (PDI) methods. This family is employed to quantify the risk, generally used for hazard assessment in different kinds of applications [
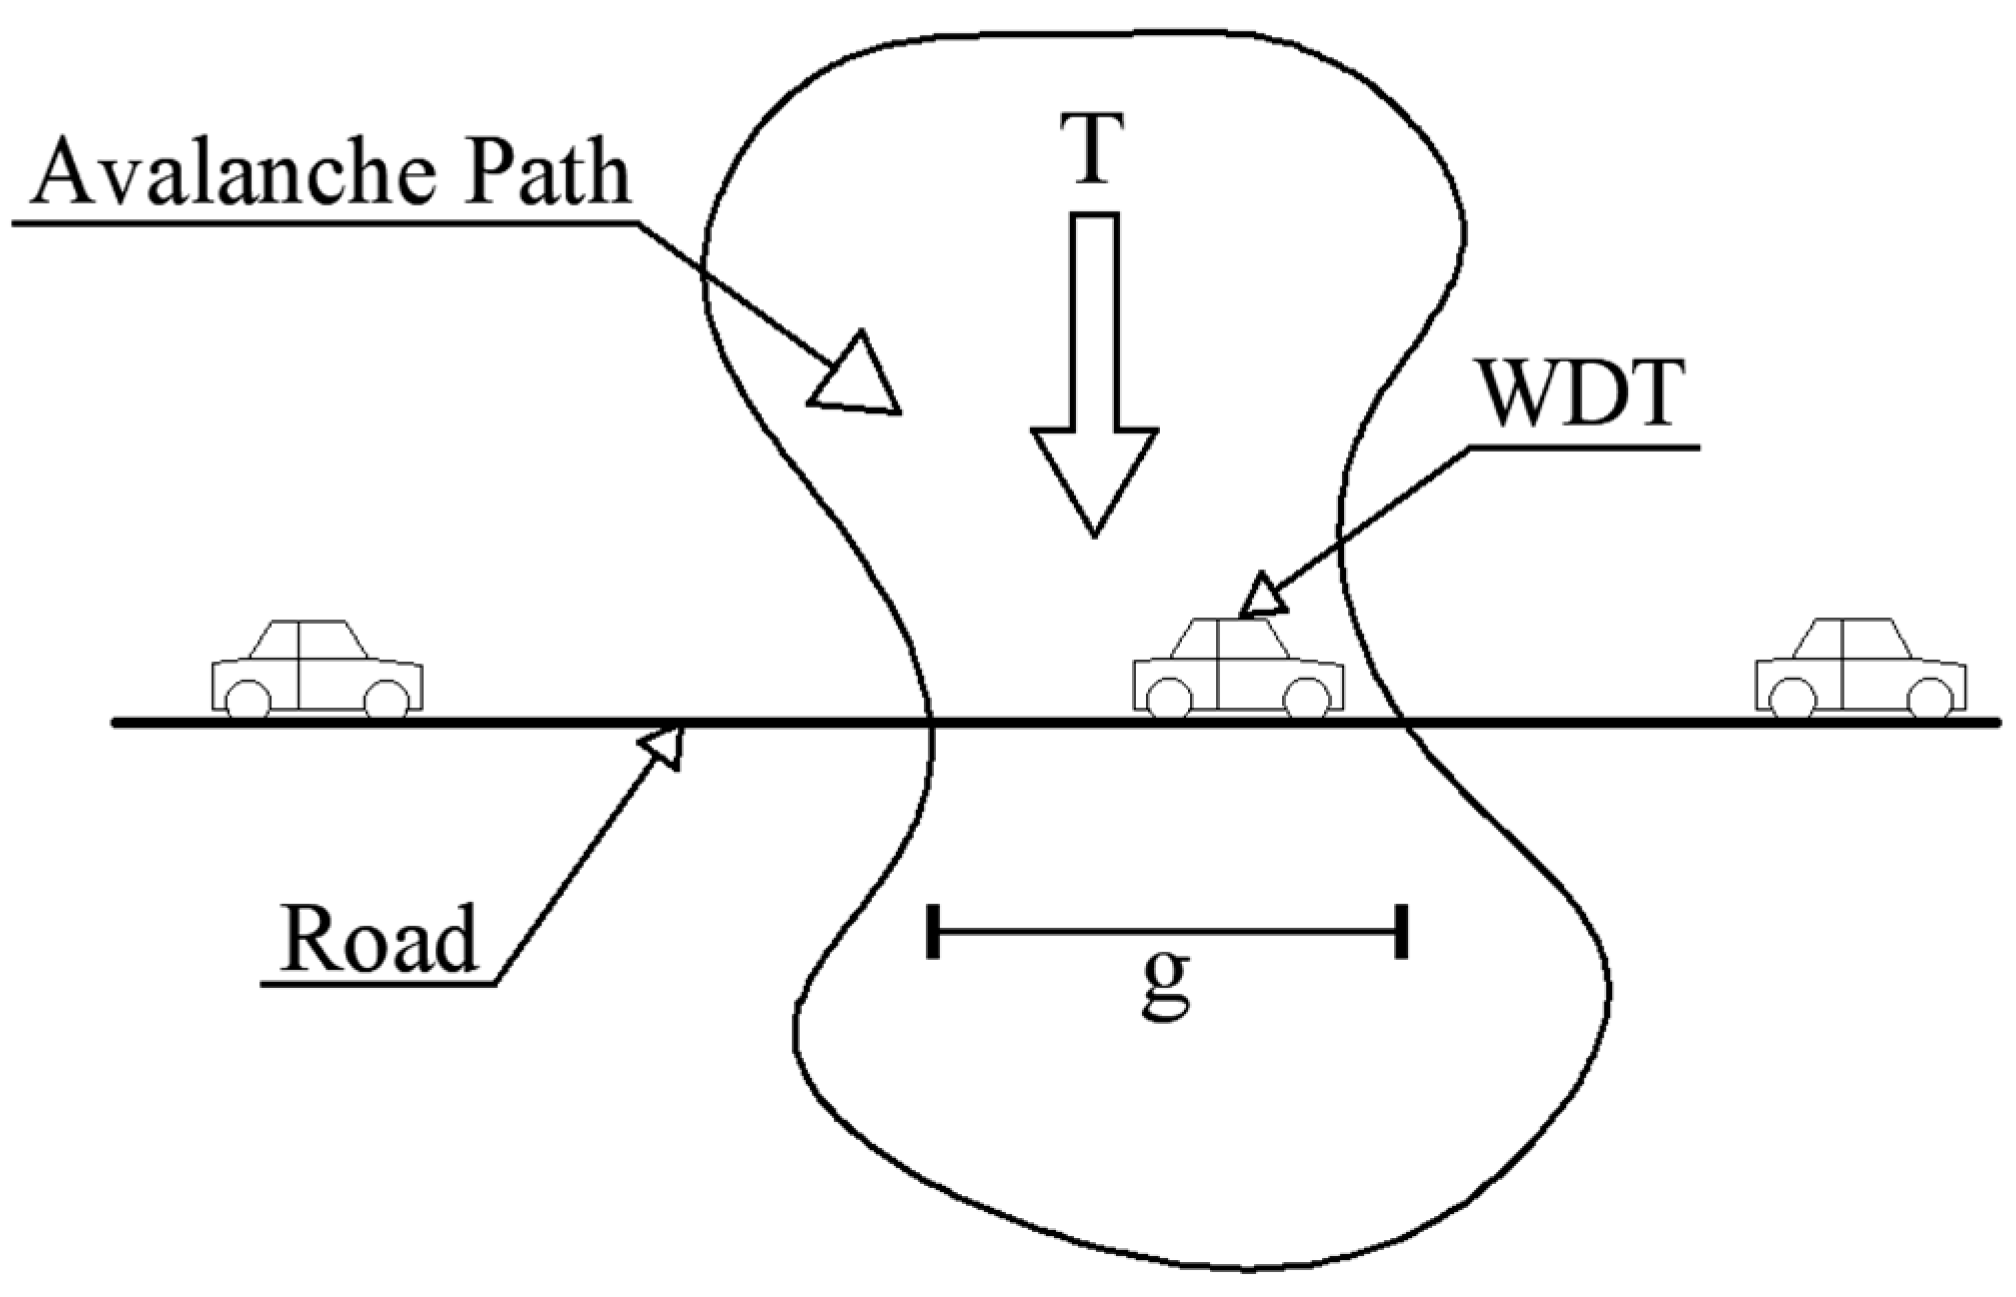
22]. In Wilhelm’s method, avalanche risk is viewed as the temporal and spatial overlap of two independent processes: the avalanche hazard and the territory’s land use. From this perspective, the avalanche hazard is expressed by the avalanche probability, determined as the reciprocal of the mean Return Period (T). Land use is considered the probability of the presence of objects; in this case, it is intended as a probability of the presence of vehicles. This probability is influenced by the winter traffic volume, the intersection length between the avalanche and the road, and the vehicles’ speed. The risk is expressed in terms of the expected number of fatalities per year due to avalanches. The formula to compute the quantitative avalanche risk, in terms of collective Risk (R) [death/year], is illustrated in Equation (1) [
20,
21]. This equation allows the computation of the risk acting on a traffic route or a stretch of it, adding the contribution of each avalanche track that intersects the road:
where
is the average Winter Daily Traffic expressed in vehicles per day;
is the mean number of passengers per vehicle, in passengers per vehicle;
is the length of the road that is intersected by the
-th avalanche path, in m;
is the
-th avalanche return period, merely considered as the return period of interference obtained by dividing the surveillance period by the number of events that reached the route expressed in years;
is the mean speed of vehicles on the road section intersected by the
-th avalanche path, in m/s;
, in percentage, is the probability of death in a vehicle hit by an avalanche;
avalanche paths.
Figure 1 illustrates some of the previously described parameters.
Additionally, the Individual Risk (IR), that is to say, the risk of death to the individual, can be computed as shown in Equation (2).
where
stands for the number of passes of a person.
The output of the method is a numerical value that expresses the collective risk and the individual risk due to avalanches. These numerical values can be interpreted if compared with other case studies or with well-established levels of acceptable risk provided by studies on avalanche or landslide risk. As can be seen in the following chapters, the authors will refer to the collective risk in their analysis.
2.2. Multi-Criteria Risk Assessment (Italian Avalanche Risk Guidelines, 2024 [23])
This methodology mirrors the framework of risk analysis assessment for existing bridges [
24], applied in Italy after the 2018 collapse of the Polcevera viaduct, and tunnels [
25].
As the basis of the Italian avalanche risk guidelines [
23], the McRA method is a multilevel approach composed of a four-step process, which can be applied in the built environment. The first step, Level 0, consists of the realisation of a catalogue containing the technical and administrative material related to the constructions (buildings and infrastructures), located in a potentially avalanche-prone area. In Level 1, based on the structures included in the Level 0 catalogue, an in situ inspection is required to assess the information collected in the first stage. These two stages are intended as state-of-the-art review of the avalanche at-risk vulnerable constructions.
In Level 2, the actual risk analysis of a given construction (building or infrastructure system) is performed based on the combination of Hazard (H), Vulnerability (V), and Exposure (E) classes considered as independent criteria. In the analysis framework, each class is defined qualitatively through a five-level scale, defined by primary parameters (capable of addressing a preliminary class evaluation) and secondary parameters (able to adapt the preliminary classification). The outcome of the analysis is a five-tier risk classification (high, medium-high, medium, medium-low, low), obtained by a weighted combination of H, V, and E (Equation (3)).
where
represents the Risk Class;
,
, and
are, respectively, Hazard Class, Vulnerability Class, and Exposure Class, in a scale from one (low class) to five (high class);
and
stand for weight parameters of hazard, vulnerability and exposure, respectively. The classes are dimensionless since they represent categorical results.
To conclude, Level 3 is intended as risk management, employing a hierarchical evaluation of the analysed territory. The risk management could be performed in the form of dynamic numerical analyses of selected avalanche tracks, along with planning and implementation of appropriate risk-mitigation measures. The application of the four steps leads to updating the risk classification of various buildings and infrastructures, fostering a dynamic risk-assessment framework for the studied area. This framework’s dynamicity allows continuous RC updating, RC result of Level 2, with the outcome of the strategy implemented into Level 3.
Figure 2 illustrates the multilevel approach described above.
A thorough understanding of the method requires a deeper examination of Level 2, including a clear definition of each Class (Hazard Class, H; Vulnerability Class, V; and Exposure Class, E) and the subsequent primary and secondary parameters involved.
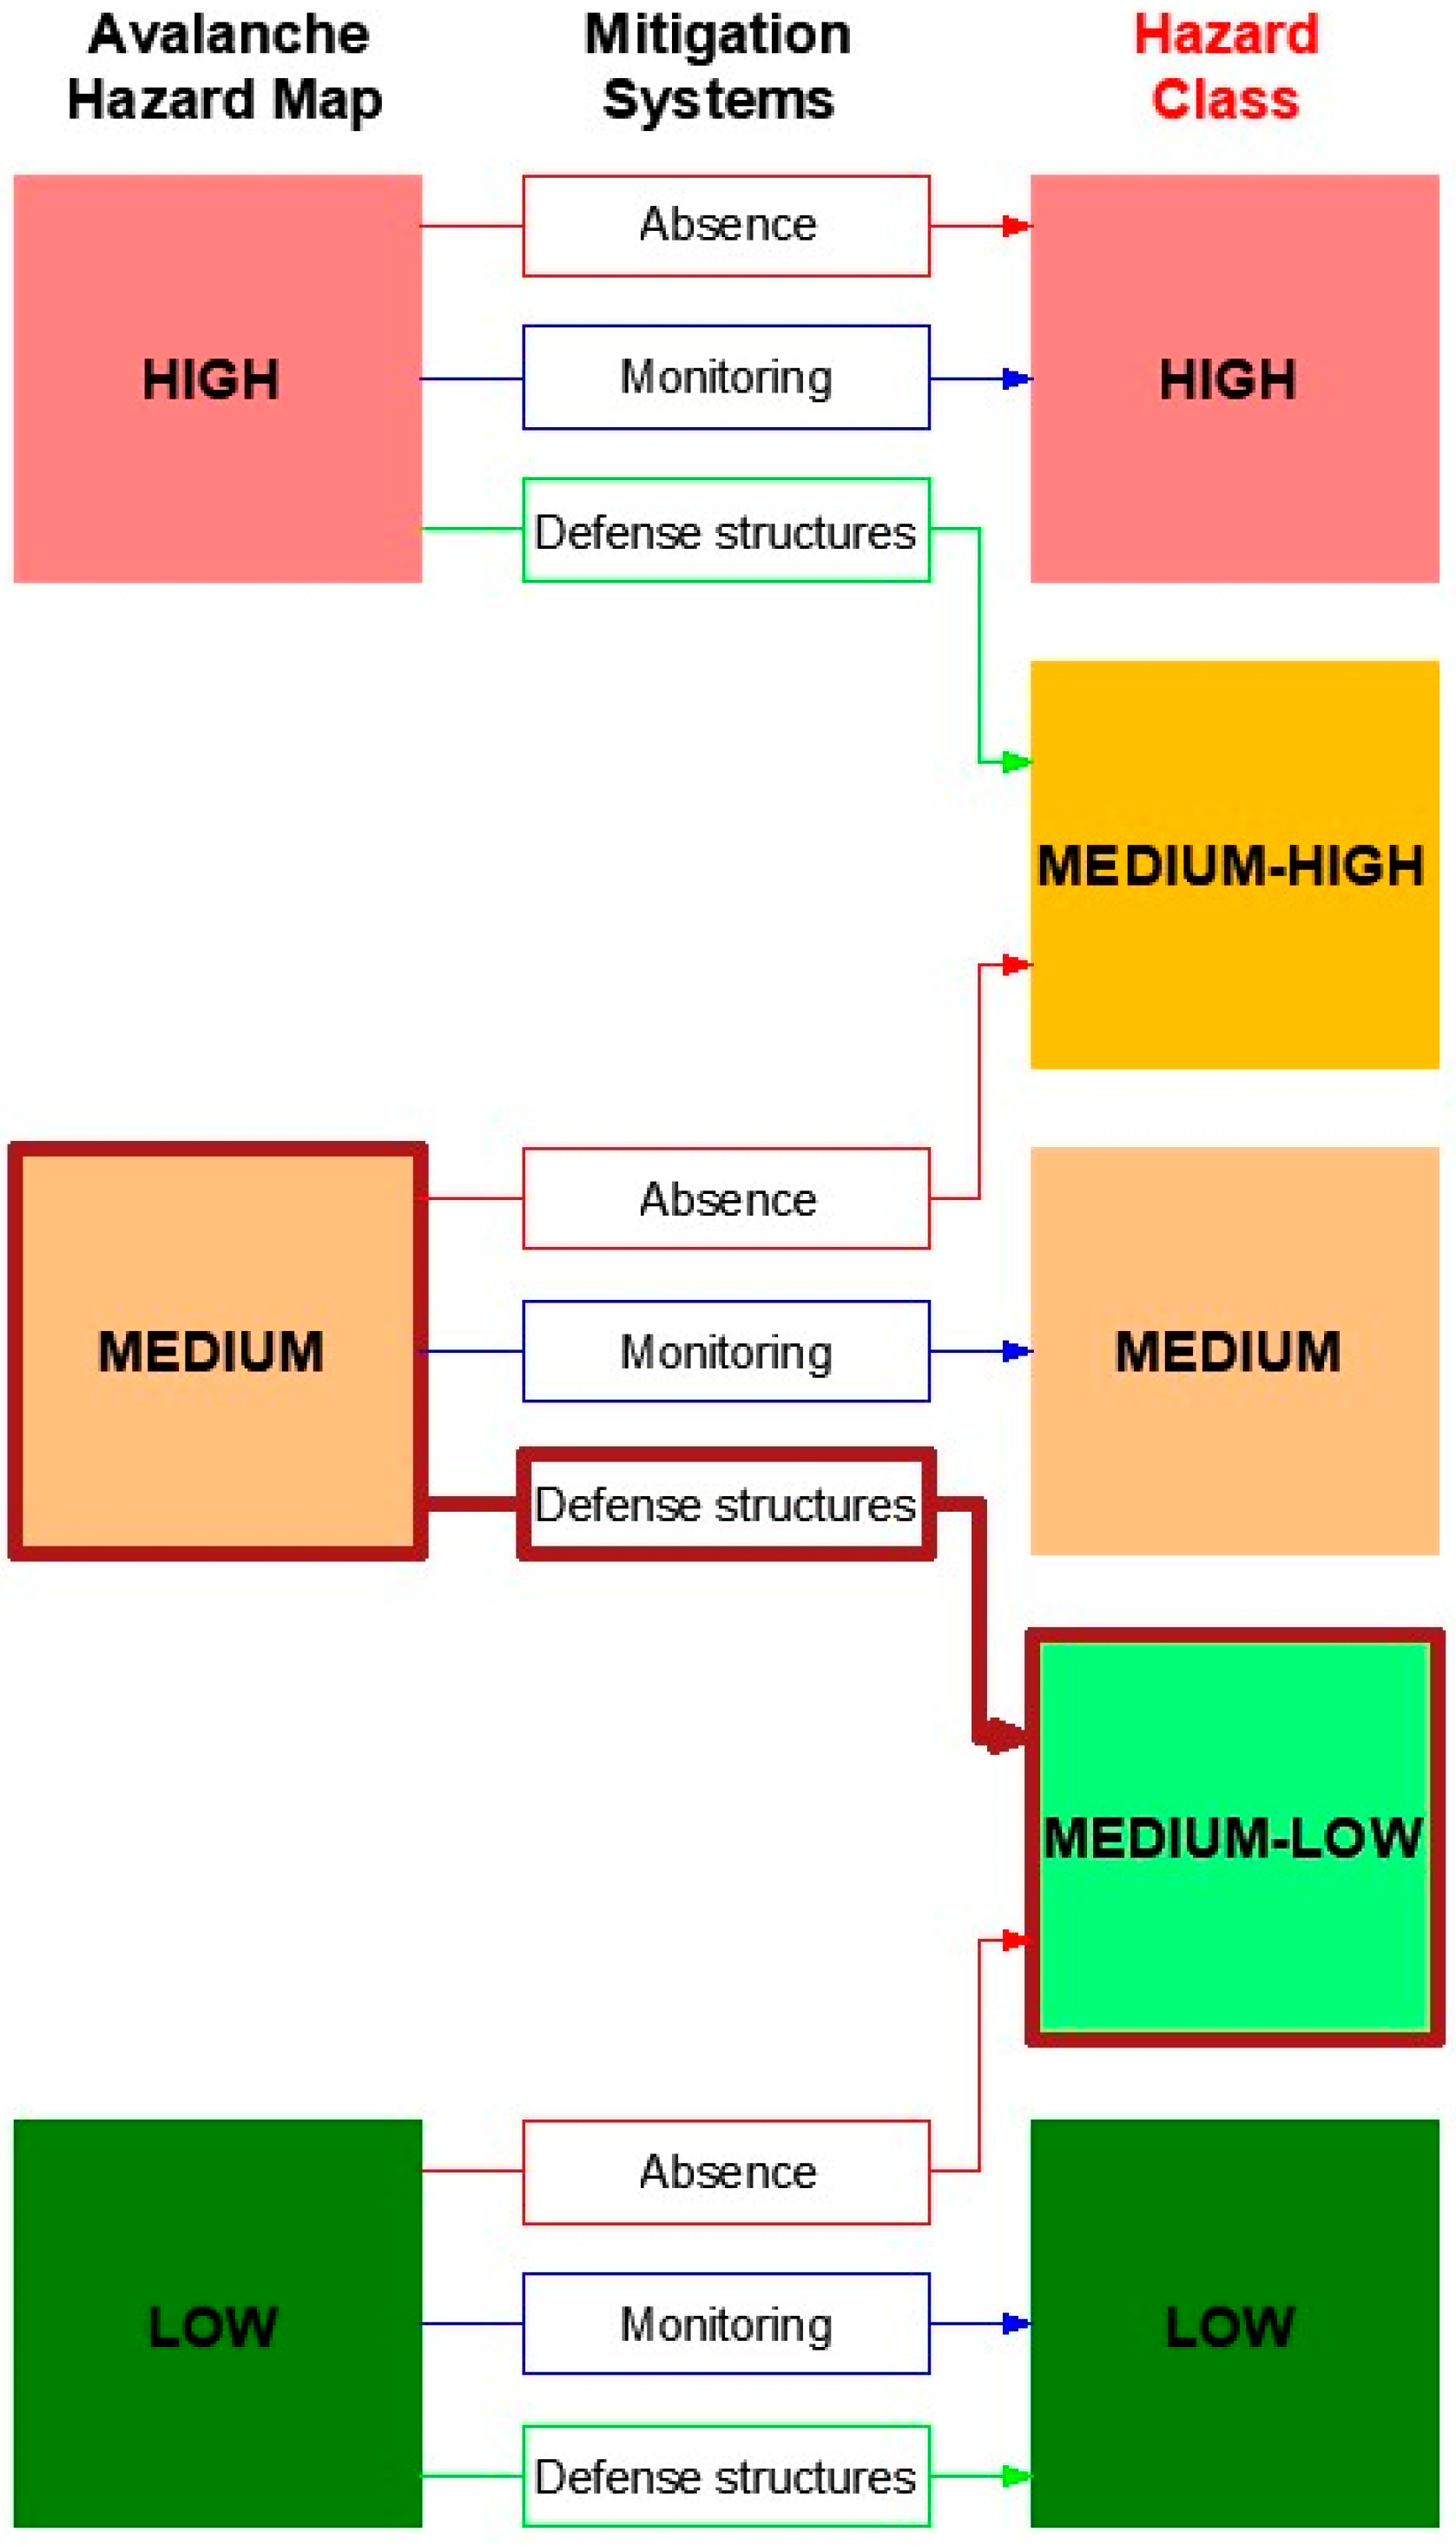
H aims to quantify the probability of the avalanche event (or events) occurring in the portion of land under analysis, without considering the presence of exposed element(s) and their characteristics. The hazard degree of individual avalanche tracks is determined from hazard intensity maps on selected avalanche tracks based on historical data, on-site investigations, and avalanche numerical simulations. It serves as the primary parameter. The secondary parameter takes into account the presence (or absence) of monitoring systems and/or defence measures in the analysed area. The weight factor is set to 0.40. The value of each weight parameter has been chosen to reflect the significance and reliability of each class; indeed, H is important and is the most reliable, coming from avalanche hazard intensity maps.
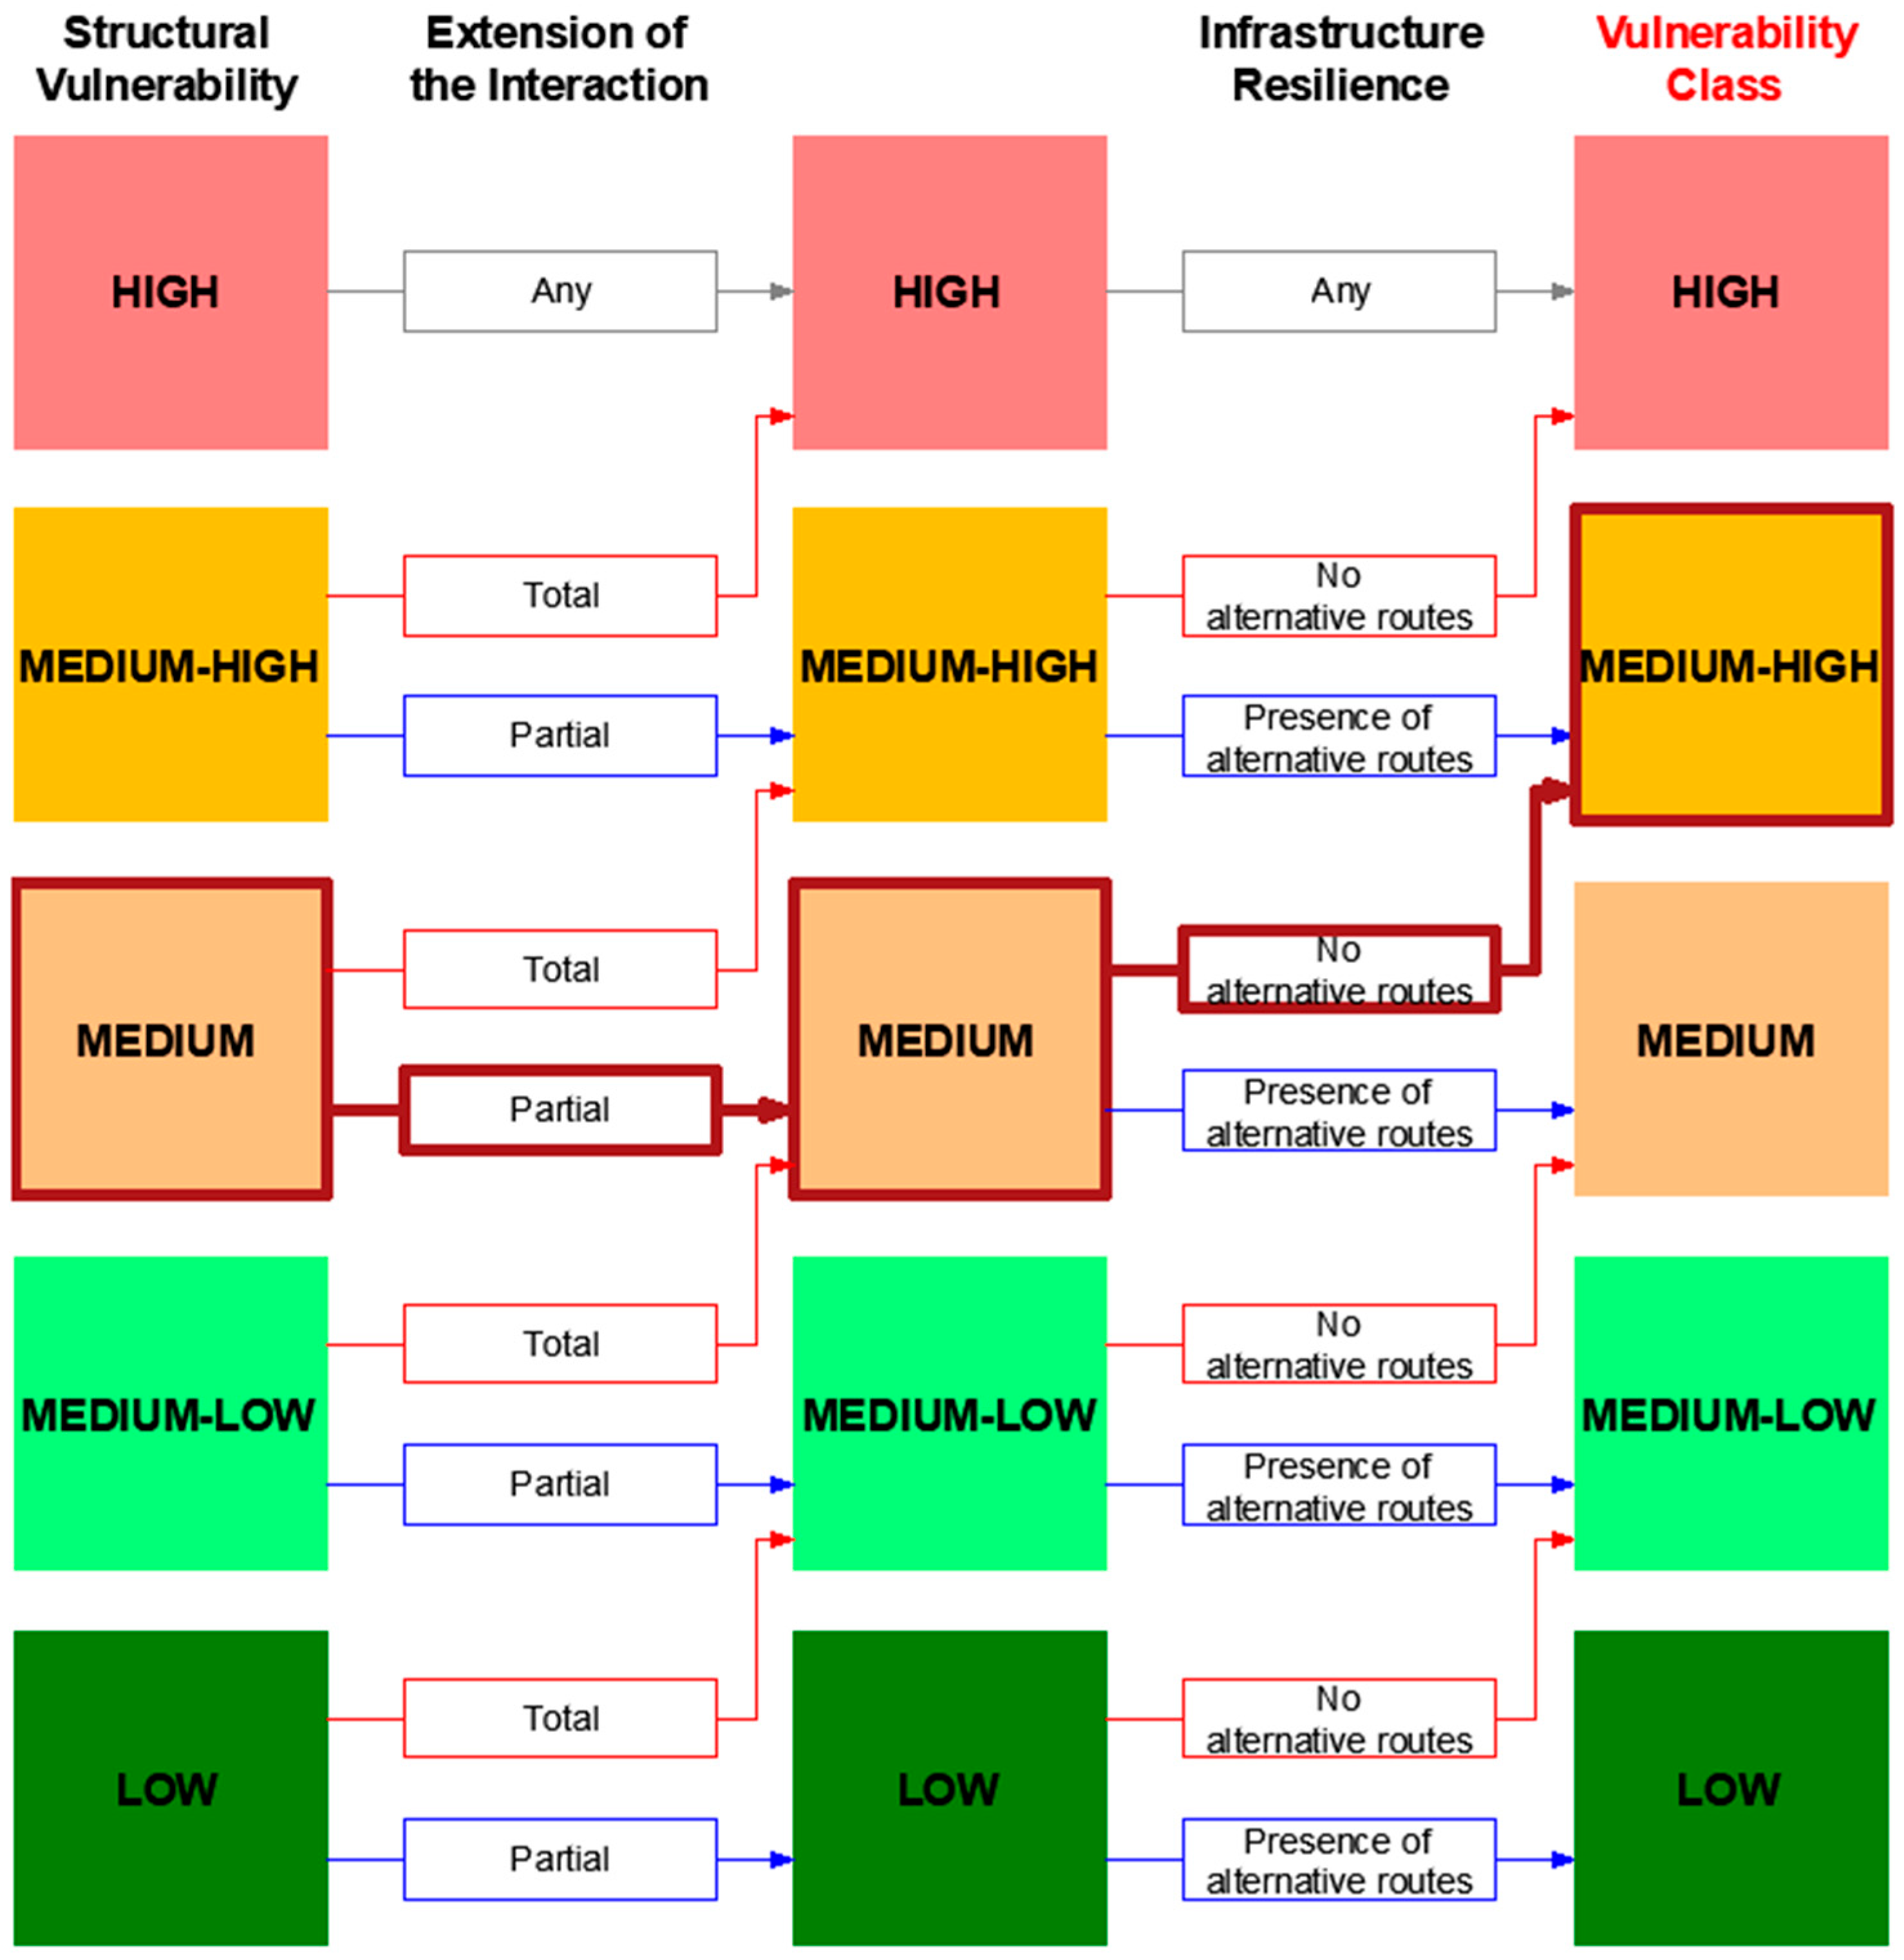
V is intended to describe the ability of buildings and infrastructure systems to withstand snow avalanches. From this perspective, the primary parameter is the building’s structural vulnerability, which can be defined by various robustness design strategies (i.e., specific local resistance, alternate load path, segmentation or compartmentalisation, and prescriptive design rules). The secondary parameter assesses the fraction of the structure exposed to the avalanche track compared to its total geometric size, distinguishing between partial and total exposure. In the case of a network system, an additional secondary parameter is introduced, the network resilience, which means the capacity of the system to withstand local failure (i.e., the presence of an alternative system providing the same service). is set to 0.2. V lacks reliability due to the absence of codified and unified metrics for vulnerability to consider it an objective parameter. This aspect will be further investigated in the Results.
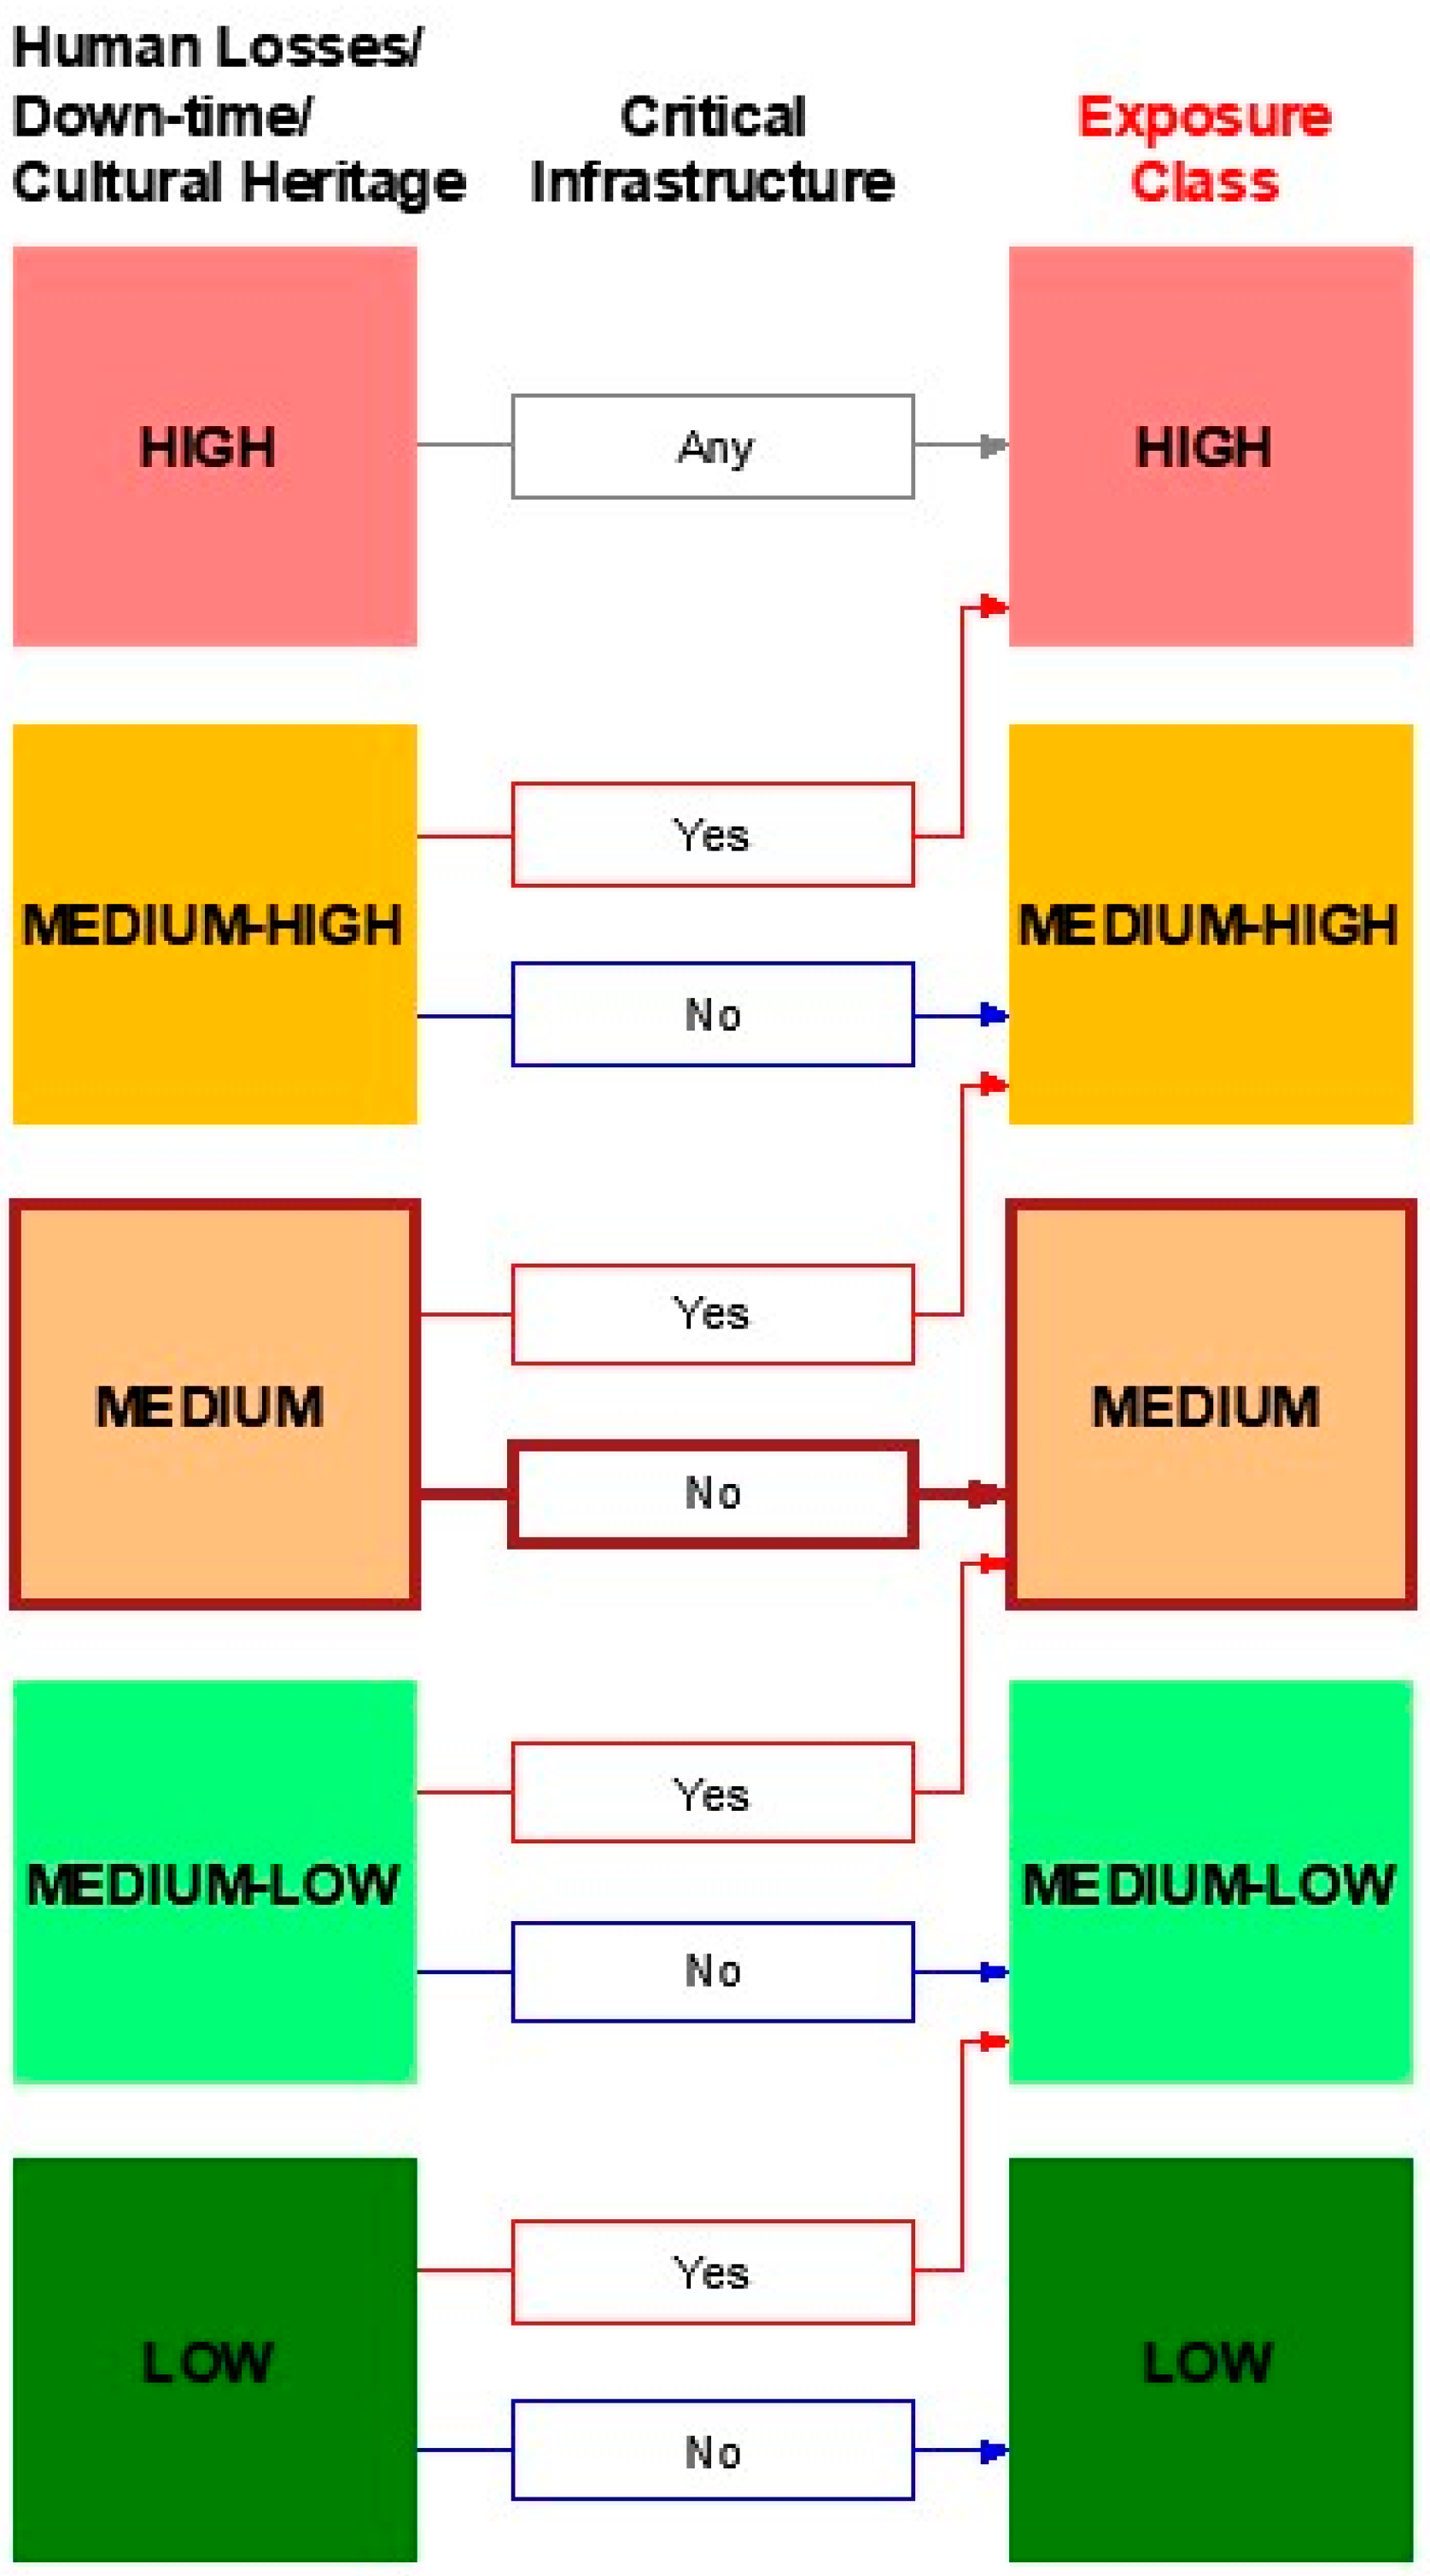
E is employed to determine the potential damage an exposed element could experience due to a snow avalanche. The E is defined according to the direct (i.e., human being) and indirect (i.e., economic losses, closing period) losses (primary parameter), for which the authors provide a simplified classification. The class is corrected according to the critical character of the construction (secondary parameter). E is a fundamental class since it expresses the potential human and economic losses; for this reason, the combination parameter is set to 0.4.
The result of the method is an RC coming from the combination of the H, V, and E, as shown in Equation (3). In a given territory, RCs assigned to constructions exposed to potential snow avalanches allow for a hierarchical evaluation of risk at a territorial scale. This method is intended to assist avalanche specialists and policymakers in prioritising mitigation measures in the process of risk management.
The highlight of this method is the chance for flexible employment since it has been designed to be applied to different types of structures (to a road and a hotel, in this case study). The method can also be advantageously employed for other types of structures, such as dwellings, cultural and socially valuable buildings, infrastructures, warehouses, mountain pastures, garages, and so on. To learn more about the McRA method, refer to [
23,
26].
3. Field Case Study
The study examines both a segment of Val Ferret Road that accesses Planpincieux village and the village itself. This chapter describes Val Ferret, initially from its geographic and orographic composition. Then, Val Ferret Road and Planpincieux hamlet are introduced, describing them and their avalanche susceptibility. Finally, avalanche paths flowing through the analysed area are detailed.
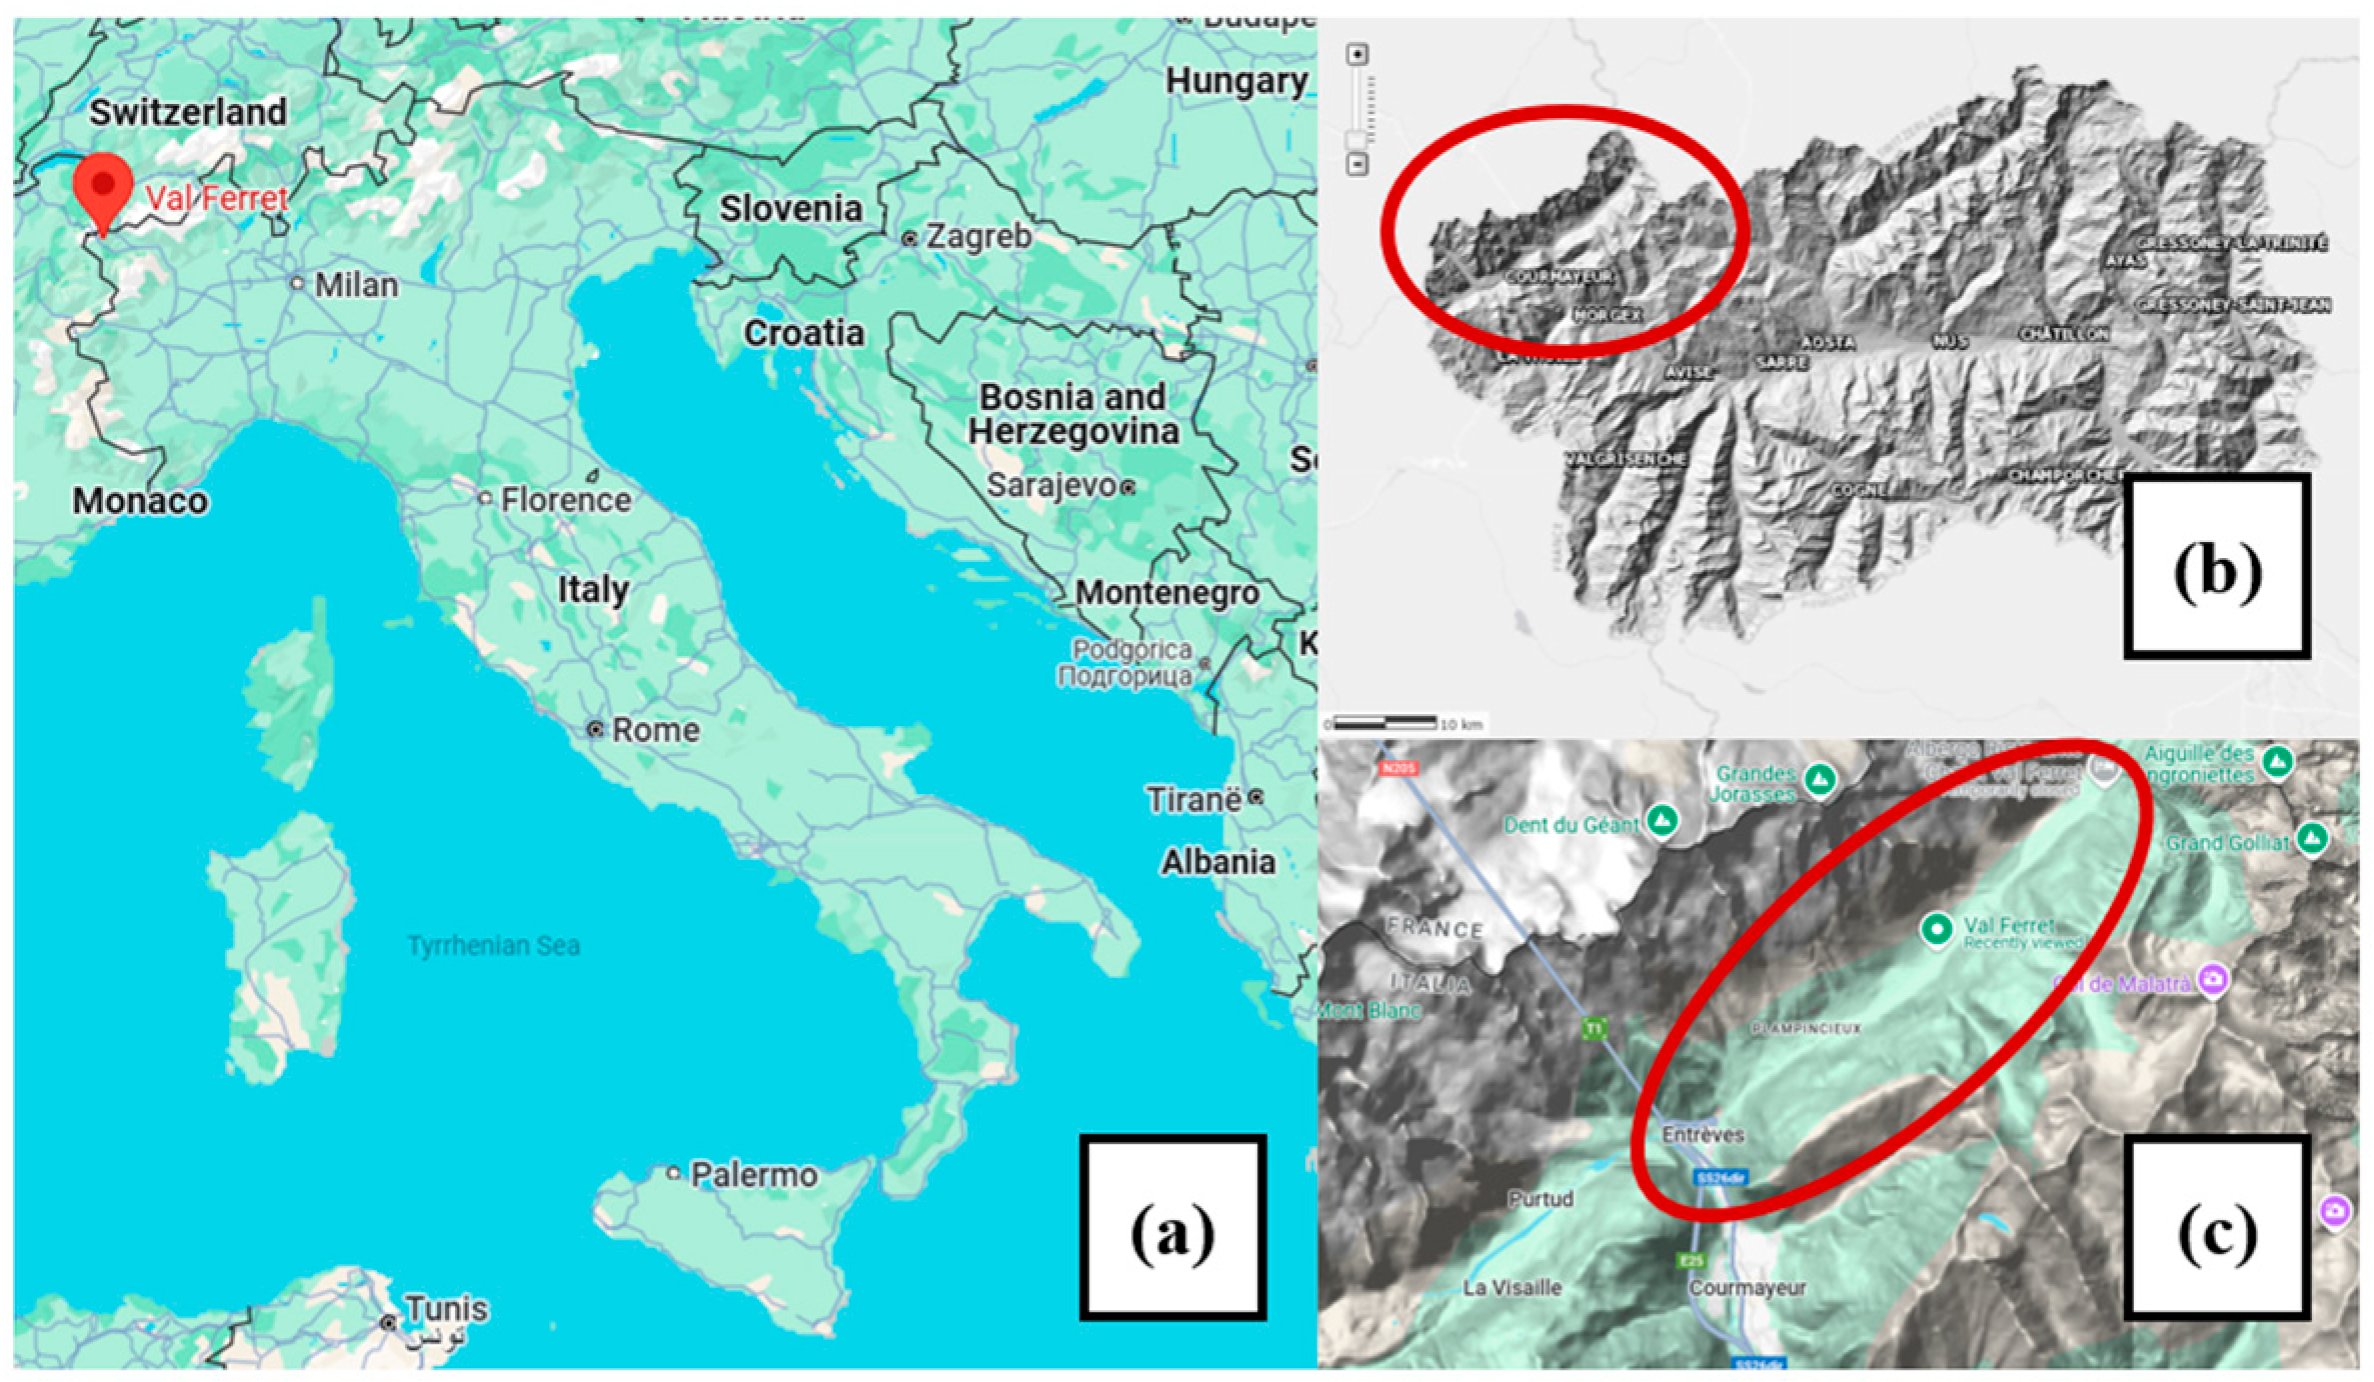
Val Ferret (
Figure 3) is an alpine valley located in the municipality of Courmayeur, Aosta Valley, in North-West Italy (45°47′41.28″ N 6°58′21.00″ E [
27]). Oriented in a South-West to North-East direction, it is about 12 km long [
28], the valley is at the feet of Monte Bianco (4805 m a.s.l.), and has on the orographic left, its highest peaks (i.e, the Dente del Gigante (4013 m a.s.l.), the Grandes Jorasses (4208 m a.s.l.), the Aiguille de Triolet (3870 m a.s.l.) and Mont Dolent (3820 m a.s.l.)) and, on the orographic right, the Mont de La Saxe (2348 m a.s.l.). A glacial torrent (Dora di Ferret) flows across the valley.
The orography of the valley strongly influences its usability. While, on the orographic left, the presence of Europe’s highest mountains results in steep, rugged, and rocky slopes from which mainly debris flows and boulder and ice collapses occur; the orographic right has gentle, low slopes, in patches covered by forests, from which numerous (and even large) avalanches are generated.
As one of Europe’s most beautiful valleys, Val Ferret is a major tourist attraction due to the beauty of the surrounding landscape and the outdoor activities that can be enjoyed in summer and winter. This implied an important growth in tourism, which is reflected in several tourism-related activities such as accommodation, restaurants, and cafés [
29].
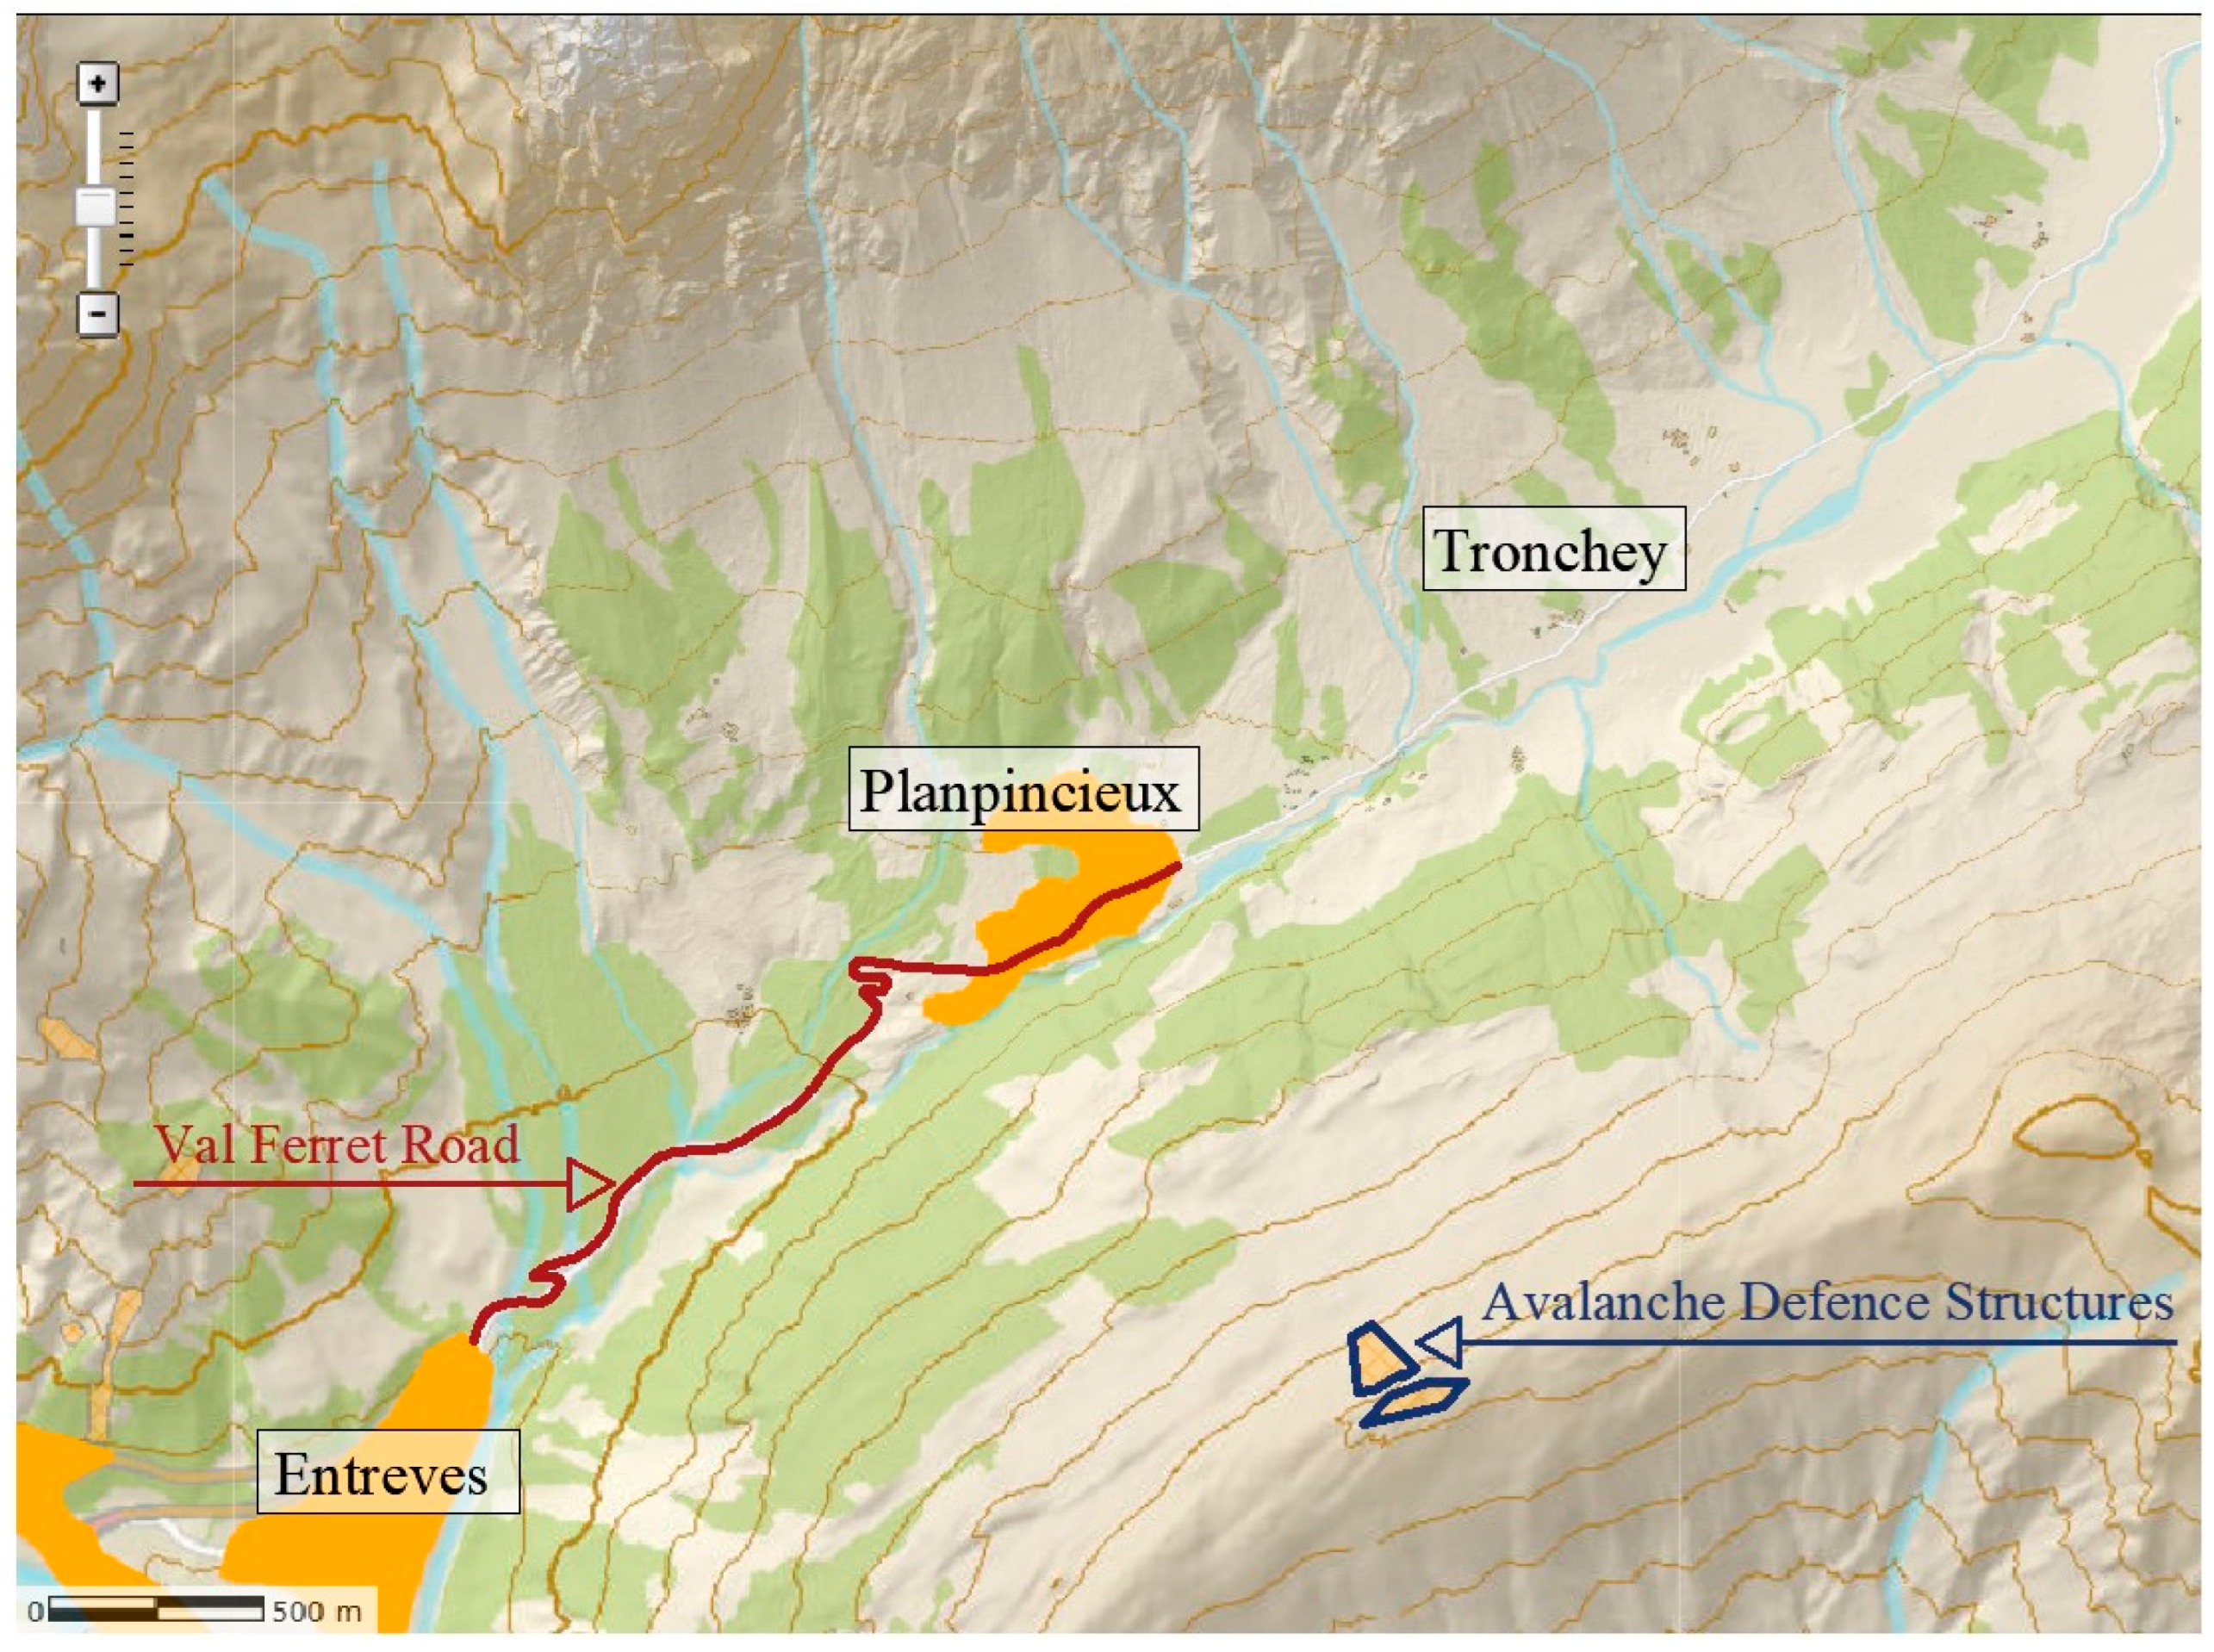
The street crossing through Val Ferret is a local dead-end road, connecting the geographical North of the Courmayeur valley (Entrèves hamlet) with the hamlet of Planpincieux and the other built-up areas along the valley until Lavachey settlement (Elena hut). The Val Ferret road crosses the whole of Val Ferret, but during the winter season, it is only accessible (and cleaned up) as far as the square in Planpincieux (
Figure 4). In fact, Planpincieux village is the most significant settlement in Val Ferret, with more than 50 buildings (holiday homes, dwellings, a hotel, cottages, a restaurant, and a café). It is located 6.3 km away from Courmayeur and 3.5 km from Entrèves. The same place is the starting point for different outdoor sportsmen during winter (cross-country skiing) and summer (hiking, fishing, and golf).
The traffic along the valley is modest but not negligible during tourist periods. During winter, the traffic is composed mainly of two categories: the tourists going up and down, especially during the day, and the commuters of tourism and service activities. Additionally, a transfer service is available, employing tourist shuttles composed of mini-buses and buses.
In the following paragraphs, the avalanche context of Val Ferret is further explored, focusing on the area of interest, thanks to the thematic map provided by the Avalanche Warning Service (AWS) of the Aosta Valley Region. In particular, the Regional Avalanche Cadastre (CRV) [
30] is taken into account.
Set up in the early 1970s, it is updated with the annual recording of avalanche events occurring throughout the Aosta Valley. For each recorded event, it contains the observations (e.g., damage to structures and/or forests), information (e.g., date/time of occurrence, technical documentation, newspaper articles, testimonies, etc.), photographs, and various parameters (size, perimeter, the thickness of the deposit and its altitude, release thickness, and its altitude, etc.) collected. The CRV subdivides the territory of the Aosta Valley into avalanche districts (made up of one or more territorially adjacent municipalities) in which each avalanche basin is indicated by a reference code. For each census avalanche basin, the CRV presents the temporal sequence of the avalanche events together with their collected information.
The data and information collected are presented in the form of thematic maps that define the maximum areal extension of each avalanche identified, based on known past events.
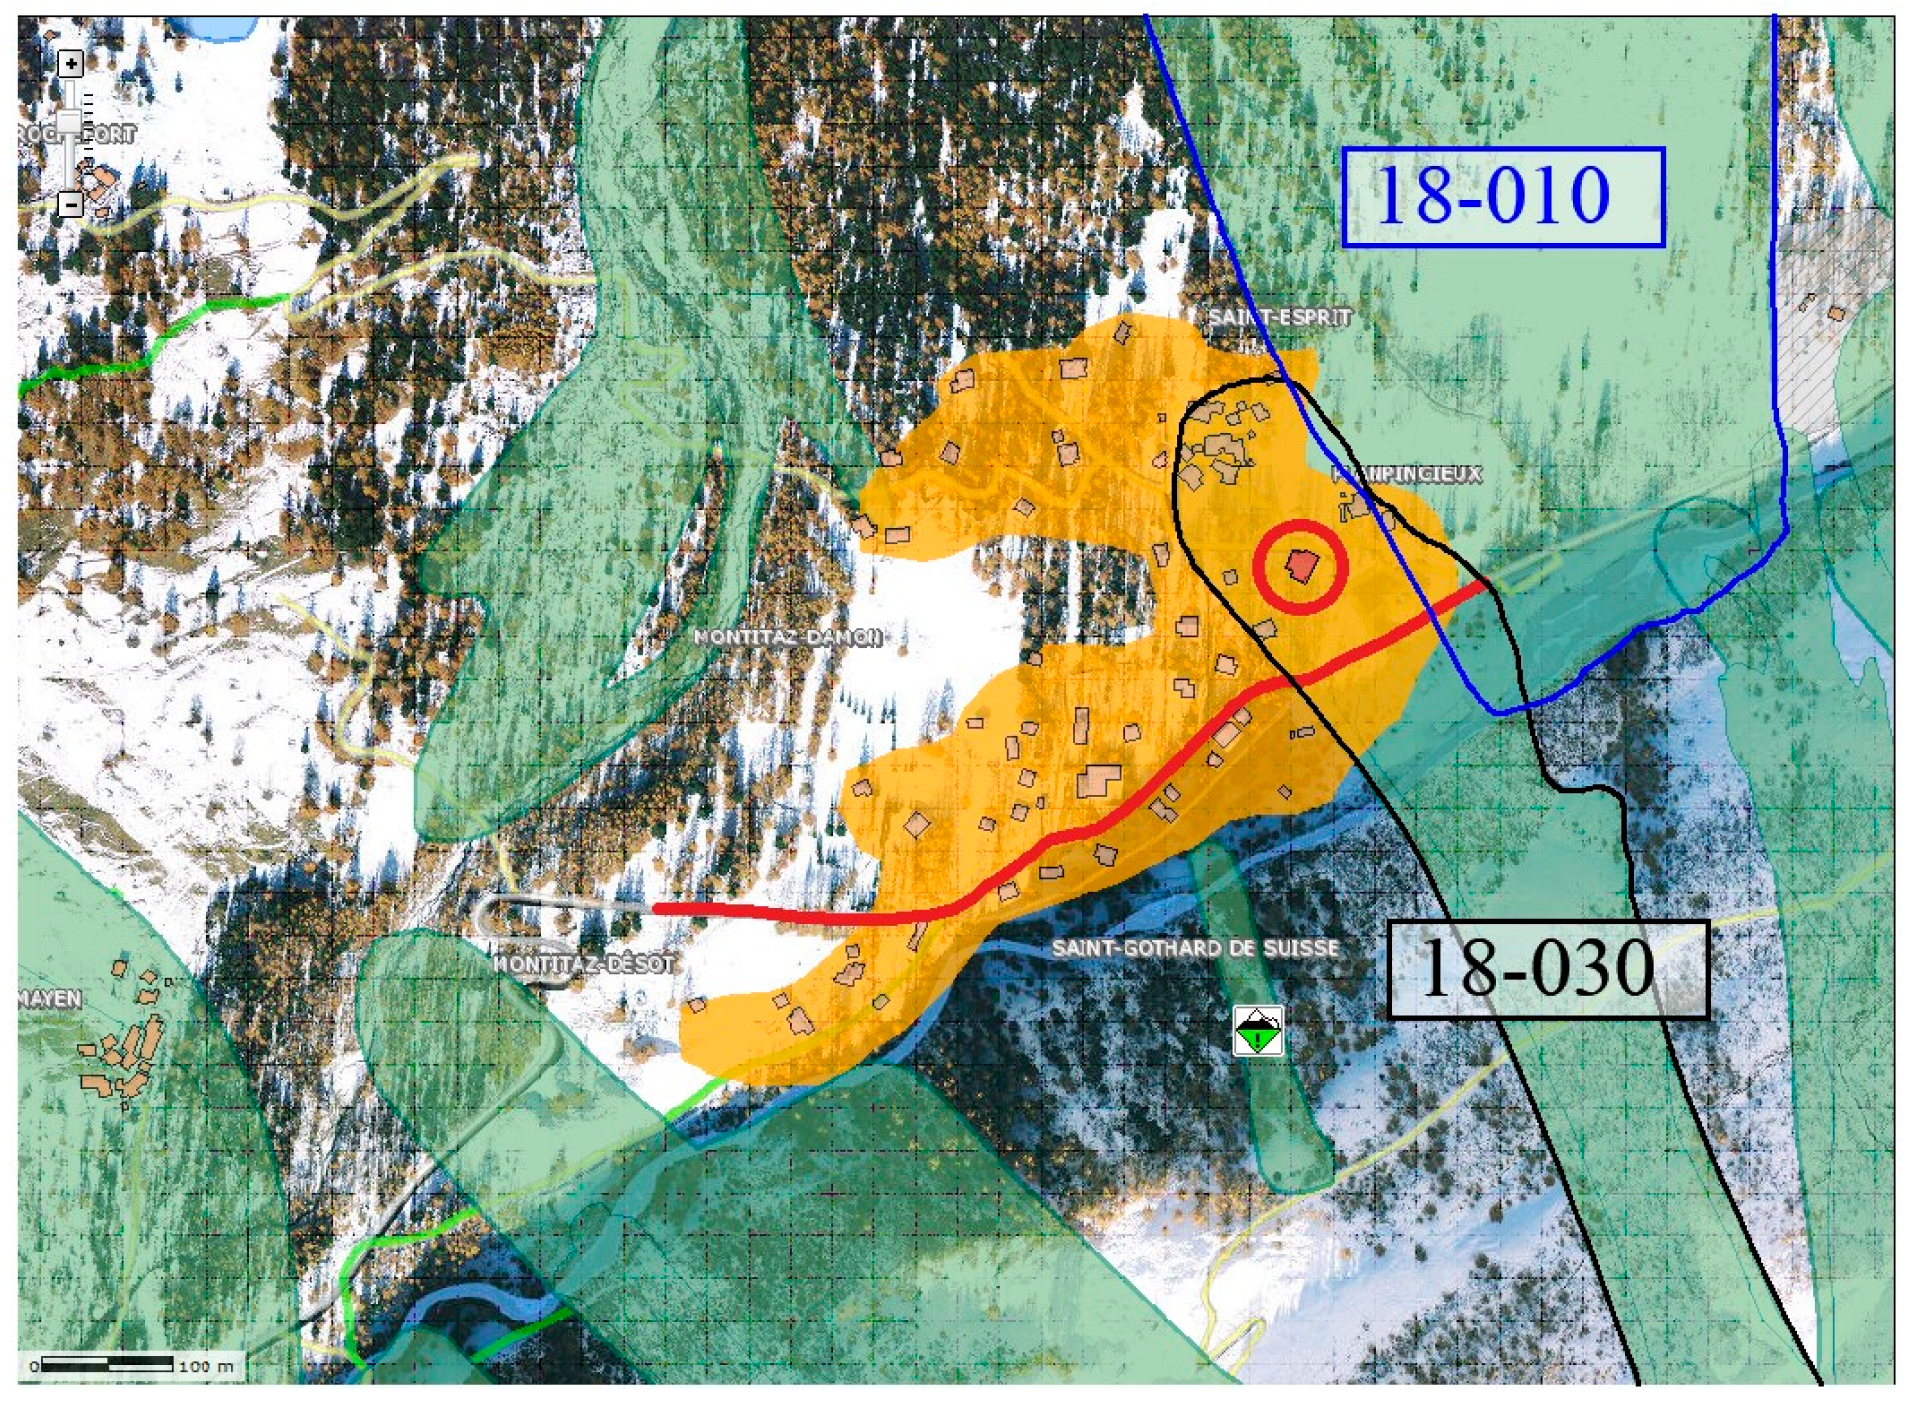
The CRV, in Val Ferret, identifies 85 different avalanche paths, some of them flowing in uninhabited areas, others interacting with the local road or the settlements. Specifically, the study area (
Figure 5) is affected by two avalanche paths: (1) the Planpincieux-Margueraz avalanche (identified by the code 18-010 in CRV), and (2) the Mont de la Saxe-Planpincieux A avalanche (coded 18-030 in CRV). The first one detaches from Mont Blanc massif (around 4200 m a.s.l.), laps the urbanised area, and intersects the local road; while the second one, the 18-030, has its starting zone in the proximity of the Mont the la Saxe ridge (around 2302 m a.s.l.) flowing and intercepting the road and the urbanised area (1579 m a.s.l.).
Due to the high relevance and tourist use of the hamlet, as well as the proven and frequent interference of the valley floor area in Planpincieux by avalanche 18-030, defence measures were implemented (
Figure 4). On the mountain ridge, 77 snowdrift fences were built between 1990 and 1996. They were installed in an area of 0.9 ha at an altitude of 2300 m a.s.l. In an area of 1.2 ha (between 2205 and 2310 m a.s.l.), below the ridge of Mont de La Saxe, 147 snow bridges have been installed between 1996 and 1997. The effect of these defence measures is mirrored in an increase in safety. The installation of the snowdrift fences and the snow bridges modified the starting zone of the avalanche, reducing its extension and decreasing the volume of snow released [
31].
Despite the countermeasures put in action, the street and the settlement may still be endangered by avalanches. For instance, the avalanche event of 7 January 2001, belonging to the 18-030 basin, travelled a vertical drop of approximately 710 m and reached the hamlet. This mixed-type surface avalanche, as evidenced by photographic documentation, reached the square, uprooting trees and sweeping away wooden cabins, while its powder component impacted the buildings.
For this reason, the area is subjected to additional management measures: the temporary closure of road access to Val Ferret, based on the Avalanche Warning Bulletin and avalanche experts’ consultation, and the artificial and controlled triggering of snow avalanches.
In addition, nowadays, in winter, the access to the valley is restricted in number of vehicles and parking, to preserve the environment.
4. Results
In order to highlight the advantages, disadvantages and differences between risk analyses given by the above two methods, it was necessary to apply them to the same territorial area, chosen as a portion of Val Ferret Road (
Figure 5). The risk analysis study is a 700 m long section, leading into the residential area of Planpincieux. The choice of this specific section of road was dictated by the application of the McRA method. This method allows the expeditious analysis of the avalanche risk of one or more elements, even of different types, of a specific territorial area (in this case, the village of Planpincieux). As will be seen below, in addition to the local road, the only hotel in the hamlet (lapped by the 18-030 avalanche event), the most important building (in terms of size and anthropic load) in Planpincieux, was also taken into account.
Regarding the application of Wilhelm’s method, this choice does not compromise the analysis because the local road is a single dead-end road, and the vehicular traffic for the whole Val Ferret is, in any case, equal to that on the chosen stretch.
As stated above, the historical and dynamic information on these two avalanches is available in the CRV archive (
https://valangheweb.partout.it/archivio accessed 17 December 2024), in map format. In the following, the risk analyses are performed. Finally, a quick discussion about the results of each method is outlined.
4.1. Wilhelm’s Method Application to Val Ferret Local Road
As shown in the past paragraphs, Wilhelm’s method requires data about the return period of interference (), length of the road intersected by the avalanche path (), mean speed of vehicles on that road or road stretch (), traffic composition, mean number of passengers per vehicle type (), and the probability of death inside a vehicle when hit by an avalanche ().
The mapping of the 18-010 and 18-030 avalanches shows that the intersection lengths are 46.12 m and 163.94 m, respectively (
Figure 5).
Regarding the return period, during the CRV surveillance period (between the seventies and 2022), 15 avalanches were recorded for avalanche 18-010 (
Figure 5). Still, none interfered with the Val Ferret Road. On the other hand, catastrophic events that happened outside the surveillance period could have involved the road. For safety, the interference return period has been imposed at 100 years.
For the avalanche path 18-030 (
Figure 5), among the 21 events recorded between 1973 and 2022, five events undoubtedly intersected the road, demonstrated by written, photographic and technical evidence, leading to a return period (
) equal to 10 years. Additionally, three events may have interfered with the road. In these three cases, the documentation available in the database is not sufficient for the authors to determine whether the avalanche interfered with the road or not. These three avalanches travelled vertical drops comparable to those that did interfere with the road, but there is no photographic evidence to confirm such interference. To take into account this uncertainty, a second
of 6 years has been computed considering eight events reaching the street during the surveillance period. An analysis employing both return periods will be conducted. For a description of the past events and further details, visit the CRV website (
https://valangheweb.partout.it/archivio accessed 17 December 2024).
The traffic data needed to apply this method were provided by [
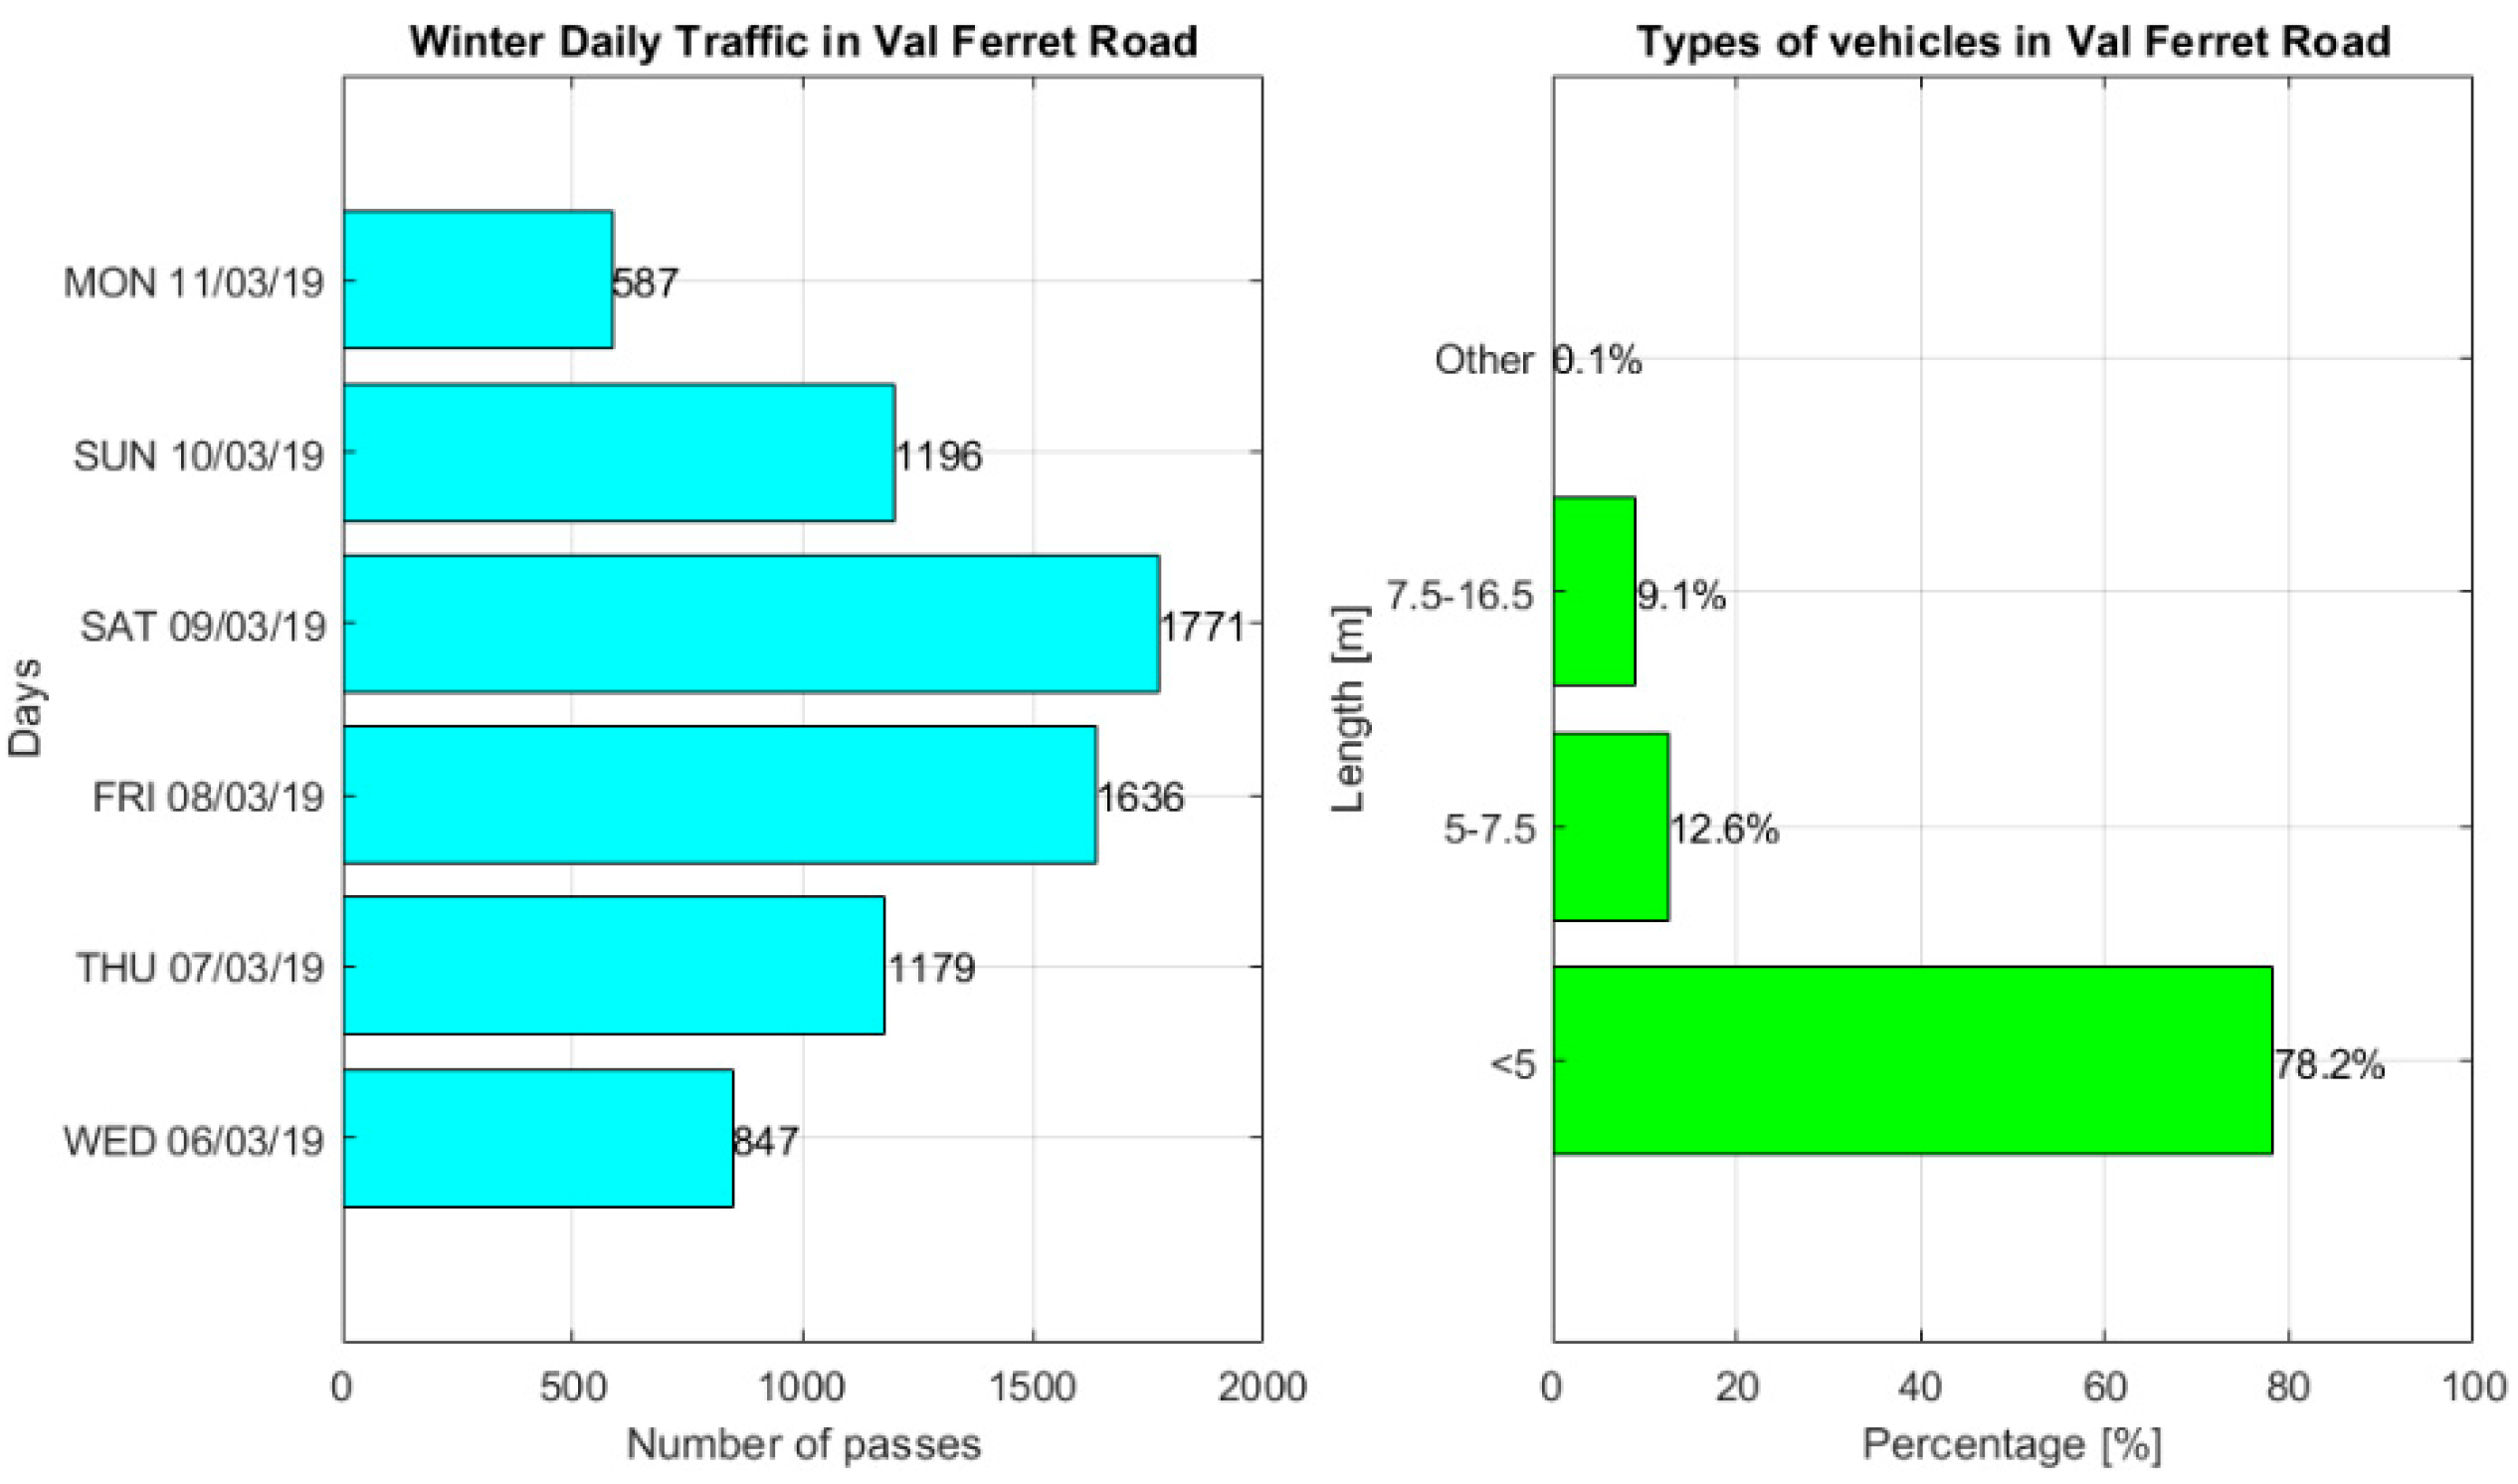
32]. It refers to a monitoring campaign carried out by the Courmayeur municipality along the Val Ferret Road, from 7 to 11 March 2019 (in the middle of the winter season). The survey counted the number of vehicles travelling along the street, dividing them into different classes based on the length of the vehicle itself as follows:
The vehicles shorter than 5 m represent the category of cars;
The ones long between 5 and 7.5 m, representing the category of vans;
The ones long 7.5–16.5 m, constituting the category of mini-buses and buses.
The results of this monitoring campaign are depicted in
Figure 6.
As stated in [
32], the traffic trend is steady, so this campaign can represent the past and future data about the traffic on the Val Ferret Road. The winter daily traffic exhibits a high fluctuation, highlighting the classic trend of tourist routes, depending on the day of the week and the daily weather conditions (
Figure 6). During the avalanche hazard season (November–April), traffic oscillates depending on the period, weather conditions, and holidays. Unfortunately, these trends have not been caught by the monitoring campaign. The cars mainly compose the traffic, but the other categories (vans and buses) cannot be neglected in the analysis, as stated in other similar work [
21].
As already pointed out, it has been supposed that all the monitored traffic will arrive at Planpincieux’s square. Under the mentioned considerations, the WDT (Average Winter Daily Traffic) is computed with Equation (4).
By summing and then averaging the winter daily traffic measured during the traffic campaign, a WDT of 1202 has been considered.
For the sake of simplicity, the probability of death in a vehicle (
) has been set to 0.18 for each identified traffic category. This value is the result of statistical data analysis, considering the number of fatalities out of the number of people buried during avalanche events in the Swiss Alps [
21]. For each type of vehicle, a different mean number of passengers was set to better depict the different carrying capacities of vehicles. The mean number of passengers per car (
) has been set to 3. This value differs from the ones adopted in other analyses; this increased value reflects the authors’ opinion of highlighting the touristic predominance of the traffic. For the vans,
has been set to 4, and for buses,
has been defined as 20 passengers.
Since the street is affected by a discrete level of traffic, simultaneously plenty of pedestrians cross the road to enter the cross-country ski trail and to use parking spots adjacent to the road, the mean velocity of movement of vehicles is supposed to be equal to 10 km/h (2.78 m/s), as previously described in [
32], along all the 700 m studied.
To compute the total collective avalanche risk
, looming on the stretch of road analysed, Equation (5) has been employed to take into consideration the different categories of vehicles composing the Val Ferret traffic, where
takes into account the vehicle category percentage.
The results of the method are depicted in
Table 1, considering the interference return period obtained with the doubtless interfering events. Additionally, the table illustrates the collective risk of a single avalanche path
(Equation (6)), the quantity that defines the contribution of i-
avalanche track to the total collective risk.
Similarly, considering the more conservative return period (the one that also finds the three events not certainly interfering with the route), a different collective risk of the single avalanche path 18-030 is obtained. This new value is computed by varying solely 18-030 from 10 to 6 years and maintaining unchanged all the other parameters of both the avalanche tracks. This is mirrored in a new path 18-030, that is 0.115. So, the total collective risk grows from 0.071 to 0.117 (increasing 64%).
These results underline how Wilhelm’s method enables the numerical definition of the avalanche risk acting on a specific road or a road stretch. However, pure numerical data do not give an actual level of risk. To obtain a more meaningful interpretation, it is necessary to compare the avalanche risk with other avalanche risk analyses in the same area or to refer to the acceptable values given for other risk scenarios, such as the ones given for landslides and rockslides [
33].
Wilhelm’s method shines when used in comparison. Indeed, dealing with more avalanche paths interfering with the analysed stretch of road, the method can be used to define which are the riskier, through , suggesting to the authorities which path(s) should focus on in the process of risk management.
The example shows the importance of a precise parameter definition, notably the return period of the avalanche interference. The value of this parameter is the most uncertain due to the difficulty of having time series that are longer than 50 years and reliable. Although today’s AWS puts a great deal of effort into updating the cadastre (also census events in remote and uninhabited areas), just 40–50 years ago, information on even major events interfering with (perhaps only seasonally) inhabited areas was not considered so important.
In addition, over the last 10 to 20 years, climate change has strongly altered the pattern of time series, imposing anomalies in the frequency of events, which greatly influence the results of risk analysis [
7].
4.2. McRA Application to Val Ferret Local Road
The same road stretch analysed before with Wilhelm’s method is now studied using the McRA procedure [
23]. As a result, the method provides the RC of each element considered potentially at risk, obtained by combining the avalanche H, V, and E of the element itself (the section of Val Ferret Road).
Following the procedure made explicit by [
23,
26], the RC of avalanche hazard is described by hazard maps (cartographic hazard), defined by avalanche impact pressure levels and return times. In the Aosta Valley, a regional law for the urban area defines avalanche hazard planning [
34] in three levels as follows:
High hazard areas (red zone), identified by impact pressures equal to or exceeding 3 kPa with a return period of 30 years (frequent events) or, alternatively, by pressures of at least 15 kPa associated with a 100-year return period (rare events);
Areas of moderate danger (yellow zone), identified by impact pressures lower than 3 kPa for frequent events, while for rare events, the pressures fall within the range of 3 kPa to 15 kPa;
Low hazard areas (green zone), identified by impact pressures below 3 kPa for rare events.
The risk analysis will be carried out for both the avalanche paths. At first, the 18-030 avalanche path will be analysed, well describing each step of the McRA method. Afterwards, the study on the 18-010 avalanche path will be briefly conducted.
Considering the 18-030 basin,
Figure 7 shows that the section of road under analysis falls in both a green and yellow hazard zone. For safety’s sake, the road stretch has been considered exposed to a medium hazard level.
This value is corrected according to the presence (or absence) of risk mitigation systems. Avalanche basin 18-030 has snow bridges and wind deflectors performing their protective action effectively. Furthermore, as already mentioned, risk management measures (monitoring of local snow and weather conditions, temporary closures of the road, and evacuations) are applied. Following the flowchart for the definition of the H depicted in
Figure 8, the resulting H is medium-low.
When dealing with a transport network, its structural vulnerability cannot be defined uniquely, and as suggested by the method, a medium level can be assigned. This value is subsequently corrected with the two secondary parameters: the extension of the interaction and the infrastructure resilience. As seen from the thematic avalanche hazard map, the stretch of Val Ferret Road is partially (with respect to avalanche 18-030) subjected to avalanche interference. In addition, as the only dead-end road that connects the settlements in Val Ferret with the downstream built-up area (Courmayeur), this infrastructure is not resilient. The combination of the road’s primary parameter with the second parameters leads to a medium-high V (
Figure 9).
Finally, the road exposure, as suggested by the method, is set as medium since it is a local road. Being non-strategic, the final E remains medium (
Figure 10).
Once the H, V, and E are defined, one last step is necessary to define the RC. The RC is the result of the combination of the medium-low H, medium-high V, and medium E by means of the relative weights, as shown in Equation (3). A graphical representation of the result of the combination of the three parameters by means of their respective weights is depicted in
Figure 11. So, in the case of avalanche 18-030, the resulting RC is medium.
When it comes to avalanche 18-010, as can be seen from
Figure 7, the section of road under analysis falls in a low-hazard zone. While no structural defences are present for avalanche 18-010, measures of risk management (the same as avalanche 18-030) are applied, resulting in a low H. Speaking about vulnerability and exposure, the same conclusion as the previous case can be outlined since the same road stretch is analysed. So, in the case of avalanche 18-010, the H is low, the V is medium-high, and the E is medium. The resulting RC obtained after the combination of the three classes is medium-low.
Summarising, the 18-010 and 18-030 avalanche paths pose an RC medium-low and medium, respectively, to the Val Ferret Road. The overall RC of this road stretch is the higher RC defined by the two previous risk analyses, i.e., the medium RC obtained from the interference with the 18-030 avalanche path.
4.3. McRA Application to the Hotel in Planpincieux
In conclusion, to illustrate the flexibility of the McRA in performing the risk analysis on different buildings, the calculation of the risk class of the only hotel, the most important building in Planpincieux, both considering the number of people that it houses, and the media interest in case of accidents, is performed.
After the observation of the evidence in the archive, it was found that some avalanche events from basin 18-030 hit the hotel with their powder component. On the other hand, there is no evidence of interference between the hotel and the 18-010 avalanche path. For this reason, the analysis was conducted only for avalanche basin 18-030.
This building is located in a low avalanche hazard area (
Figure 7) and, like the road, is subjected to the same defence measures, leading to a low H, following the flowchart illustrated in
Figure 8.
According to the guidelines, when no data or information on the structure and its construction are available, a vulnerability analysis cannot be performed. Therefore, high structural vulnerability is assumed for safety purposes. The building is entirely exposed to the interference, leading to a high V.
Finally, as suggested by the method, when dealing with densely populated buildings, the primary parameter of exposure should be set to high. With regards to the secondary parameter, the hotel is not a strategic building. Combining the primary parameter with the secondary one, as shown by the flowchart in
Figure 10, returns a high E.
Combining the three risk parameters, the resulting hotel RC is medium.
These results define the same RC (in this case, medium) for both the building (hotel) and the infrastructure (road), although they are located in different avalanche hazard zones (referring to the same avalanche path 18-030) and they have different degrees of vulnerability and exposure.
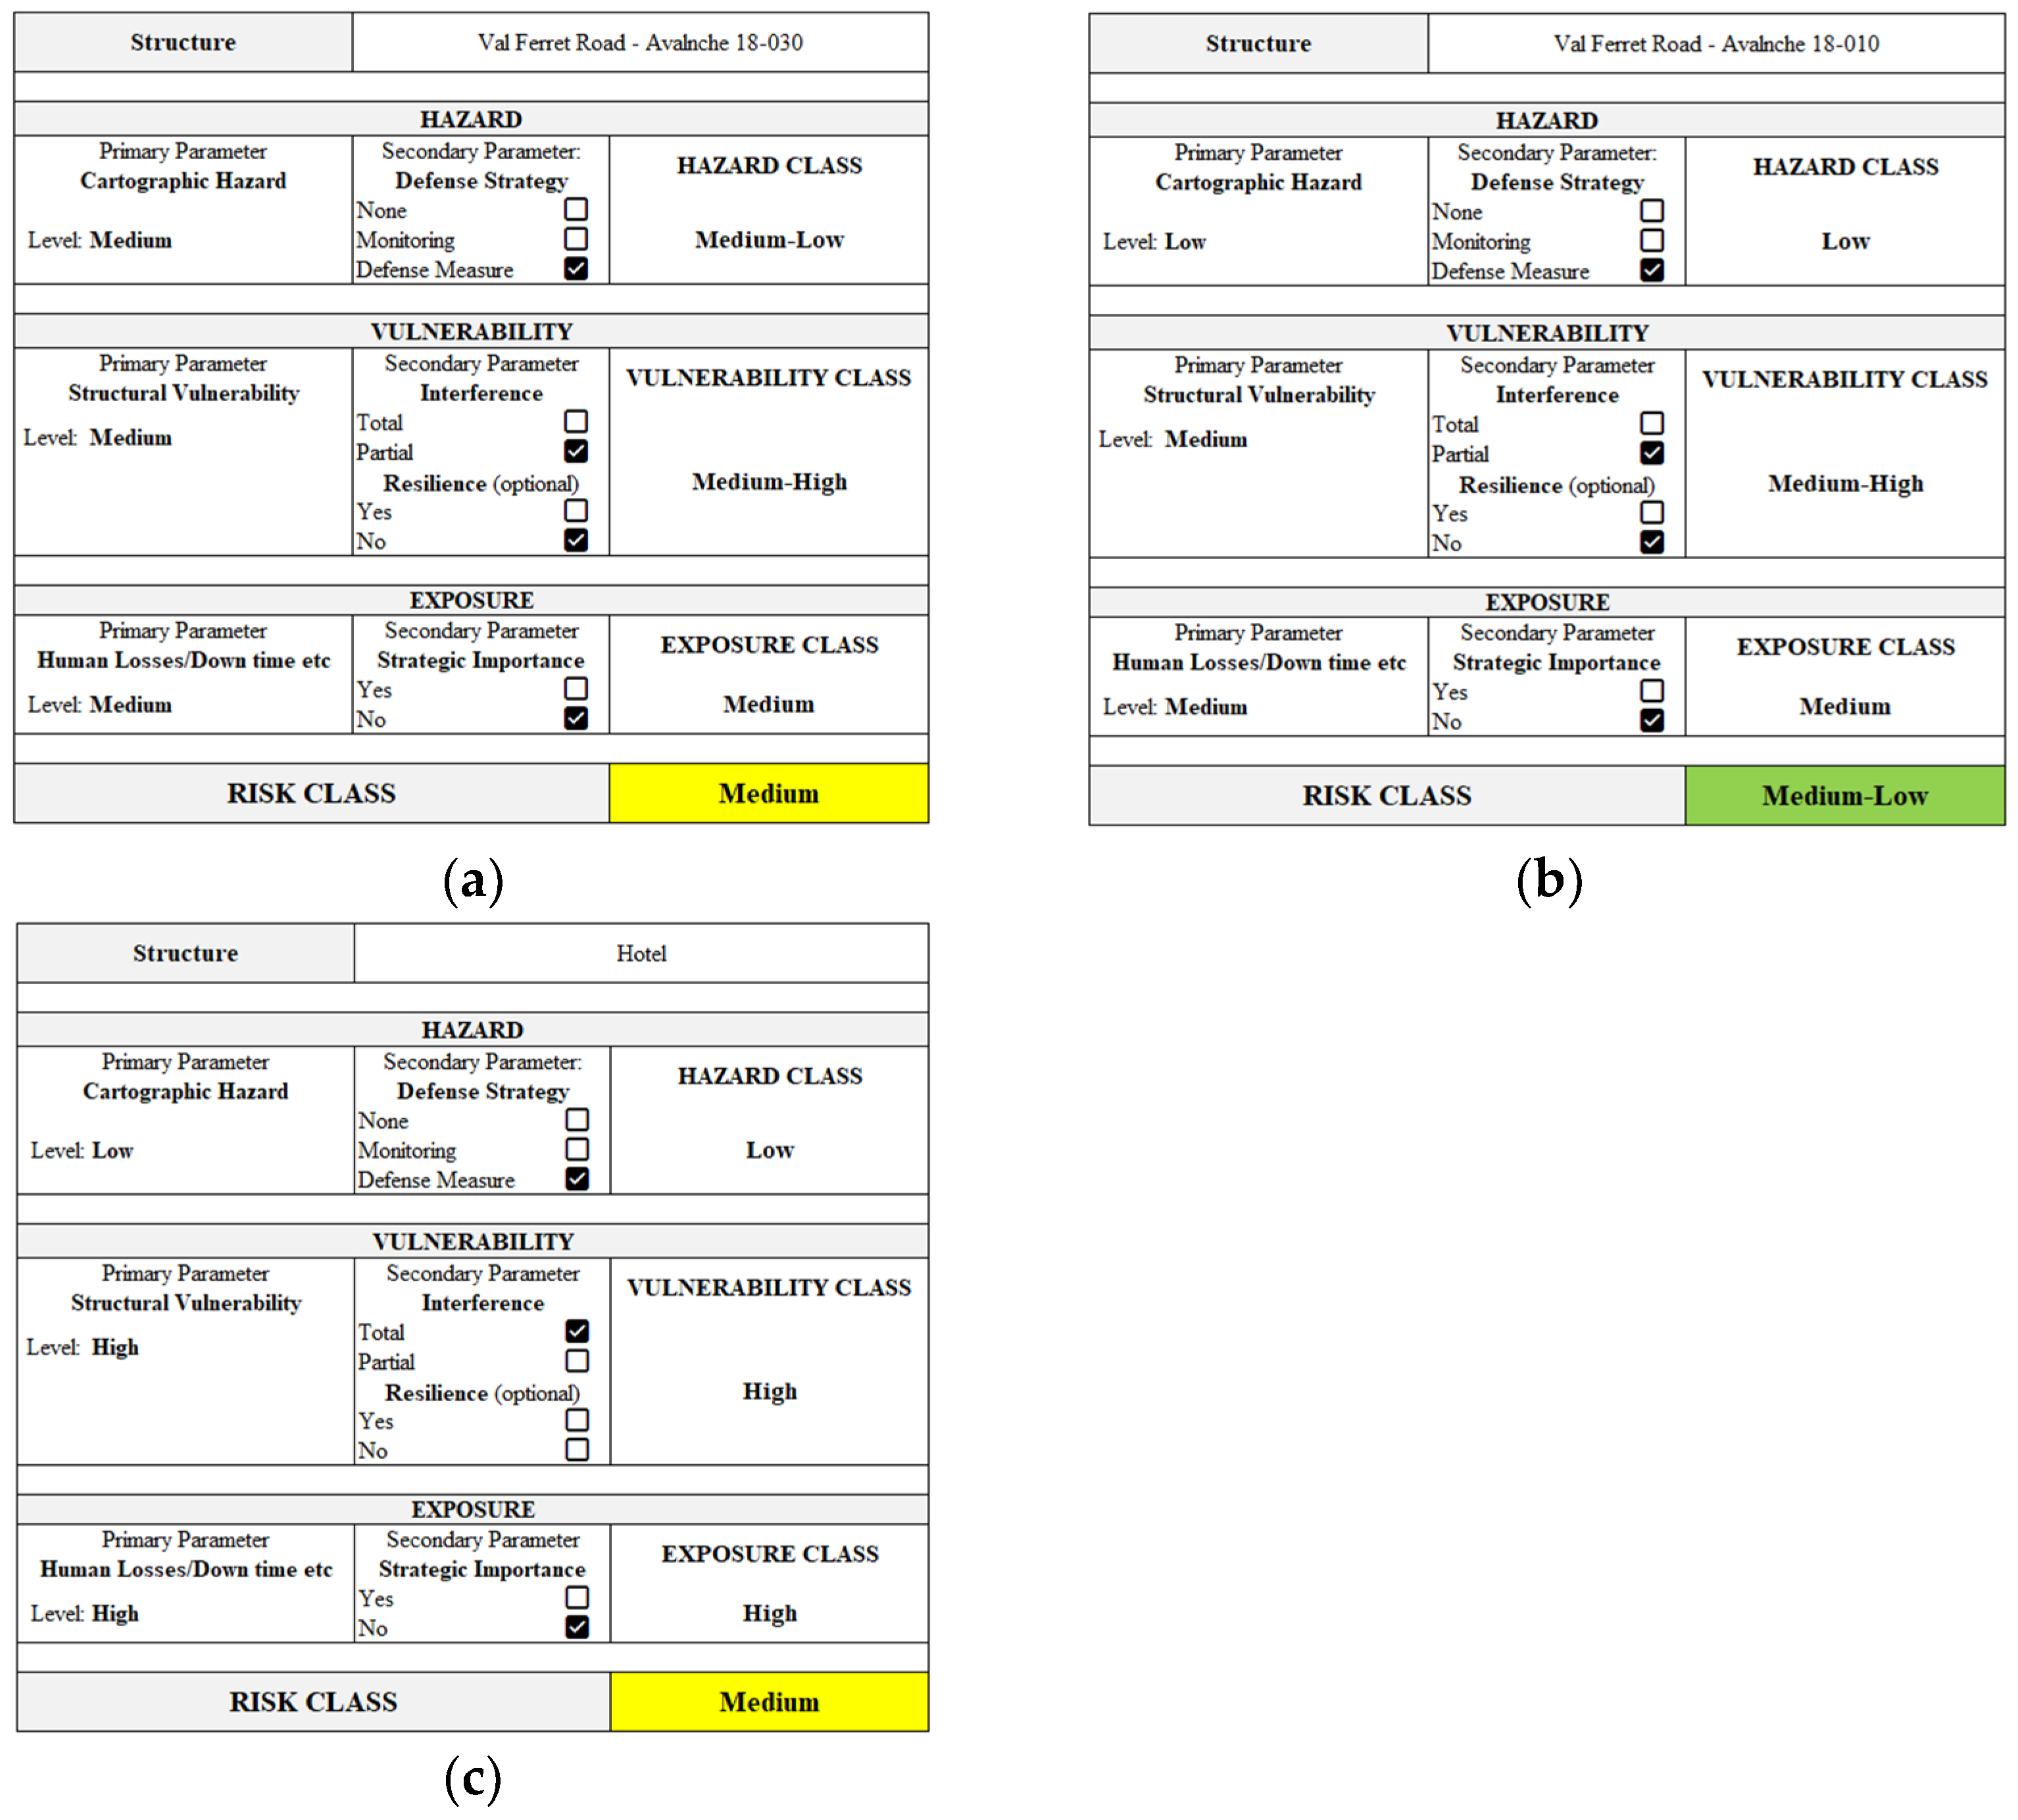
Figure 12 summarises the main steps described previously. In particular, for the cases studied (Val Ferret Road under the effect of the avalanche path 18-030 and 18-010, and the hotel), the primary and secondary parameters, and the consequent classes are depicted for each category (hazard, vulnerability, and exposure). At the end, the RCs are shown.
The McRA method, at the end of the avalanche risk analysis on a studied area, where various constructions, including buildings and infrastructures, have been analysed, allows for a hierarchical risk assessment at the territory scale. Being able to perform a risk assessment in a certain area allows for the definition of priorities between defence and mitigation strategies, thereby improving overall risk management.
The strength of the McRA lies in its simplicity. Furthermore, it can be effectively employed in avalanche-prone zones that pose risks to various structures (both buildings and infrastructures), providing a practical and effective risk assessment framework. However, the methodology is only applicable where reliable hazard intensity maps are available. This is a limitation for large-scale applications, as numerous mountainous regions lack these thematic maps, including parts of the Alps in Italy. Structural vulnerability class is a key factor that requires precise information about the structural characteristics of the building, which could be complex to collect. Additionally, standardised and codified metrics to define structural vulnerability are lacking, so it should be established and built on the personal judgement of structural engineers and technicians, leading to limited objectivity and homogeneity [
26].
4.4. Comparison of Wilhelm’s Method and McRA Method
By comparison of the two methods (Wilhelm’s and McRA methods), both quantitatively assess avalanche risk affecting an exposed element for one or more avalanche basins. However, the first method calculates and returns the risk as a numerical value without providing any indication of its severity level, whether it is acceptable or not. To obtain such indications, it is necessary to refer to well-established levels of acceptable risk provided for avalanche or landslide risk. McRA, on the other hand, expresses risk through an RC, which varies across a five-level scale, ranging from low to high. This allows the user to directly obtain an assessment of the severity of the risk threatening the target.
Although Wilhelm’s method is simple, the required information comes from specific monitoring campaigns (i.e., extended-in-time traffic monitoring) requiring a higher level of effort (with respect to the McRA method). In many cases, authorities do not have up-to-date data on traffic composition and volumes for the street(s) under examination. As a result, an additional preliminary campaign (or continuous traffic monitoring) is necessary, which takes time before the risk analysis can be conducted.
In the risk management perspective, McRA is a method developed for and suited to territorial risk planning, based on the structural characteristics of buildings and the assessment of potential damage that the construction may suffer due to avalanche interference. Wilhelm’s method, instead, is more appropriate when focusing on the variability of infrastructure use, particularly traffic.
Considering risk management as the process of defining and implementing defence strategy/strategies to protect the exposed elements, the two methods exhibit diametrically different operability. As well as taking them into consideration, the McRA framework is built to be dynamic; it enables updating the RC (the result of the Level 2 analysis) with the action put in place during the risk management phase (Level 3).
However, the method does not take into account the joint and/or multiple presence of defence structures and monitoring, as in the case of Val Ferret: the calculated RC value is, therefore, in favour of safety.
On the other hand, this integrated capability of uploading the avalanche risk judgment during and after risk management is not present in Wilhelm’s method. It requires a new analysis fed with new parameters adjusted and/or updated accordingly to the changes caused by the decision taken (i.e., mainly new or new obtained from dynamic numerical analyses of avalanche tracks with the implementation of the new defence measures).
Finally, it is important to note that Wilhelm’s method is tailored to the application of traffic routes, meaning it is used exclusively for calculating avalanche risk on roads. In contrast, the McRA method allows overcoming this limitation and allows computing the risk on different types of structures (dwellings, cultural and socially valuable buildings, infrastructures, warehouses, mountain pastures, and garages).
5. Conclusions
This paper employs Wilhelm’s and McRA methods to estimate the avalanche risk in the Val Ferret Valley. The analysis focuses on a stretch of the Val Ferret Route and a hotel located in the Planpincieux hamlet. As far as the road is concerned, both methods were applied. Wilhelm’s method requires the definition of the avalanche paths acting on the stretch, computes separately their collective risk contribution, and then sums them up. For instance, the R, obtained for T = 10 years (considering only the events that undoubtedly intersected the road), is 0.071 deaths/year. The avalanche path 18-010 (the one on the left side) contributes to 0.002 deaths/year, and the one on the right side, 18-030, adds 0.069 deaths/year. Changing the T to 6 years (considering the events that may have intersected the road as well), the R increases by 64% from the previous case, reaching 0.117.
The McRA method defines the RC as a weighted combination of the H, V, and E. Applying it to the road, it returns a medium RC for the 18-030 avalanche path and medium-low for the 18-010 one. This results in an overall medium RC of the road for the sake of safety. The McRA can be applied not only to infrastructures but also in buildings, as shown by the risk analysis on the hotel. In this case, the corresponding RC is medium.
In short, as shown in the study, Wilhelm’s method shines in comparing the risk posed by different avalanche paths. Nevertheless, it suffers from the problem of a precise parameter definition, especially the return period, which is strongly affected by the lack of reliable historical data. Moreover, climate change tends to invalidate the existing historical records. In addition, it requires the traffic data retrieved from extensive, specific, and above all, permanent monitoring campaigns. In fact, being a tourist area, the use of the road depends on seasonality, the holiday calendar and weather conditions. If these data are accessible, this method may be successfully applied in the case of avalanche risk assessment for temporary risk management operations.
As output, the McRA method returns a direct estimate of risk severity through RC and, as the study shows, can be interchangeably applied to buildings and infrastructures. Further, the method can be applied to obtain a hierarchical risk assessment at the territory scale and becomes an essential tool for land-use planning. This aspect can be limited by the lack of reliable hazard intensity maps and unified and codified metrics for structural vulnerability.


