Article

Experimental Studies to Evaluate the Effects of Different Unloading Stress Paths on Strength Properties of Unconsolidated Sands

by
Sabyasachi Prakash
1,
Michael Myers
1,*,
George Wong
1,
Lori Hathon
1 and
Duane Mikulencak
2
1
Cullen College of Engineering, University of Houston, Houston, TX 77004, USA
2
Shell International Exploration & Production, Inc., Houston, TX 77079, USA
*
Author to whom correspondence should be addressed.
Geosciences 2025, 15(5), 173; https://doi.org/10.3390/geosciences15050173
Submission received: 27 March 2025 / Revised: 6 May 2025 / Accepted: 8 May 2025 / Published: 13 May 2025
(This article belongs to the Section Geomechanics)

Abstract

:
The mechanical behavior of rocks under loading conditions depends on stress path and magnitude. With increasing load, rocks have an elasto-plastic behavior. Within the loading yield surface, constitutive models assume that rocks behave elastically and are independent of the stress path and magnitude (e.g., Mohr–Coulomb models). We performed tests on unconsolidated sands (no cementation), and under both loading and unloading conditions. We mapped the loading yield surface using a multi-stage triaxial test with the yield criterion as the point of positive dilatancy. We studied the yield behavior of the two different unloading stress paths: a constant axial stress unloading test (reducing mean effective stress and increasing shear stress) and a constant shear stress unloading test (reducing mean effective stress and keeping shear stress constant). The results show that unloading-based tests reach yield point at a lower shear stress than expected from the loading-based yield surface. The unloading-based yield surface is also dependent on the stress path. The application of this research includes a prediction of the geomechanical behavior of unconsolidated sands under injection conditions. Often, a constitutive model derived from loading stress paths is used for injection with the ad hoc assumption that the loading and unloading models are identical. These constitutive models provide results for injector design parameters, injection performance prediction, and safe injection envelopes. Therefore, it is essential to have accurate constitutive models that are representative of unloading stress paths. In calibrating these models, we demonstrated that the yield criterion (point of positive dilatancy) is reached before the loading-based yield surface during injection (decrease in mean effective stress) is reached. We also developed a minimum yield surface model. With a calibration using three tests, this model can predict the yield point for any stress path and at any initial stress state (within the bounds of the experiments).

1. Introduction

All materials deform under an applied load. If the material recovers from the deformation, the deformation is termed elastic. When a sufficiently high load is applied, the material may be permanently deformed (plastic deformation), and the material is said to be yielding. With even more strain, the material can carry a reduced load. This is termed as failure [1].
Reservoir rocks are granular materials with pore spaces occupied by fluids (water, oil, or gas). The total stresses applied to the rocks are supported by the rock framework and the fluid in the pore spaces. Therefore, to predict the mechanical properties of the rock in in situ conditions, we need to consider the total stresses applied, the fluid pressure inside the pore spaces, and the strength of the rock framework itself [2]. We used the effective stress technique in this study to discount for the fluid pressure supporting the fraction of total stresses.
The mechanical response of reservoir rocks is stress path- and magnitude-dependent. In addition, the inherent mechanical properties (strength, stiffness, cohesion, etc.) play a vital role [3]. The present research is focused on investigating the effects of the injection on unconsolidated sand test samples under different stress path directions and magnitudes. The stress path direction in the mean effective stress (p’)–shear stress (q) space is defined as the relative change in mean effective stress and shear stress [4]. The stress path direction is represented as a curve in the p’-q space [5]. The axial stress is represented as σ1, the confining stress is represented as σ3, and the pore pressure is represented as pp. The mean effective stress and shear stress (deviatoric stress) are defined as:
p = σ 1 + 2 σ 3 3 p p
q = σ 1 σ 3
This study performs all experiments as dry tests (without pore fluid); i.e., pp is zero in Equation (1).
All tests record axial and radial strain measurements. Volume strain ( ϵ v ) is calculated as the sum of axial strain ( ϵ a ) and twice the radial strain ( ϵ r ) As shown in Equation (3), compression (decrease in strain) is the positive direction when calculating volume strain, and dilation is the negative direction.
ϵ v = ϵ a + 2 ϵ r
The directions of the stress path during depletion and injection are inherently different in the p’-q space. When an oil well is under production, the reservoir pore pressure is reduced when oil and gas are drained out of the reservoir. Consequently, the mean effective stress is increasing, and the rock matrix supports the additional load of the overburden. When a well is under injection, the pore pressure increases, the stress supported by the rock matrix is reduced, and the rock matrix is being ‘unloaded’. The role of shear stress is different during depletion and injection. The shear stress is not affected by pore pressure. Mean stress changes with a change in pore pressure. Stress path direction is the change in shear stress over a unit change in mean effective stress [6].
Unloading-based failure characterization has been studied widely in the mining and tunneling industry. Researchers have published work on triaxial unloading tests performed on very stiff igneous or metamorphic samples such as granite and marble.
Xie et al. [7] performed loading and unloading tests on Plagioclase Gneiss and Granite Gneiss samples. Huang et al. [8] performed axisymmetric unloading and conventional loading triaxial tests on marble samples. Dai et al. [9] conducted an extensive program of 39 specimens to investigate the triaxial unloading mechanical properties of granite. Li et al. [10] studied the evolution of energy under loading and unloading triaxial tests in granite samples. Yin et al. [11] studied the failure characteristics of consolidated sandstone under the effect of static and dynamic loading and associated elastic-potential energy. Zhu et al. [12] compared direct shear tests with constant normal stress and decreasing normal stress on sandstone. Similar research has been published on granite [13,14], red sandstone [14], dacite [15], marble [16], soft rock [17], limestones [18,19], salt rock for gas storage [20], coal bed methane [21], and soft coal [22].
These studies conclude that loading yield stresses are similar to unloading yield stresses; i.e., there is no practical impact of the stress path direction of yield stress. The materials used in the above studies are significantly stiffer, with higher yield stresses than unconsolidated sands. They do not have pore-fluid effects, and research aims to understand the impact of excavation on the surrounding rock mass with a particular focus on stability.
Researchers have also published similar work on very soft soils. Barla [23] studied the unloading behavior of consolidated clays in predicting the stability of tunnels. Zhou [24] reported results on Guangzhou soft soils for both conventional triaxial compression tests and unloading direct shear tests. Huang et al. [25] performed unloading tests on soft soils. They concluded that failure stresses are stress path direction dependent. The maximum magnitudes of applied stresses for these tests ranged between 15 and 250 psi (0.1 and 1.7 MPa).
In the oil and gas industry, extensive studies have been completed in unconsolidated sand reservoirs to investigate the effects of injection. Researchers have investigated the strength properties of oil sands in unloading stress paths [26,27,28]. Chalaturnyk et al. [29] studied the effects of temperature on the strength properties of oil sands. These researchers concluded that the loading and unloading stress path does not impact the yielding behavior of oil sands. These research publications mostly focus on Canadian Oil sands which have a very low mean effective stress (50–250 psi). The major focus of their research was to quantify variation in permeability during injection. They found no difference between loading and unloading yield stresses.
Few examples are found in the literature to explain the effect of injection on the mechanical yield behavior of unconsolidated sands. The proposed research work aims to understand the effects of injection on unconsolidated sands. The referenced research work for unloading-based tests is performed on geotechnical or mining and tunneling engineering-related materials with high values of Unconfined Compressive Strength (UCS). In contrast, the reservoir (unconsolidated sands) of interest for this study has very low UCS values. The unconsolidated sands are characterized by much higher porosity and ductility than the materials used in the mining and tunneling industry. The mean effective stress magnitudes (~4000 psi or 27.6 MPa) are more than one order of magnitude higher than the effective stresses experienced by the oil sands. Since there is a stark contrast between the material properties, the proposed research adds new information and advances the science of rock mechanics. To our knowledge, unloading tests have not been published with unconsolidated sands to compare the failure yield surfaces and develop a constitutive model to correlate loading and unloading yield surfaces at these higher-pressure magnitudes.
The present work investigates the dependence of stress path magnitude and direction on the yielding behavior of unconsolidated sands under injection. It predicts yielding behavior under different stress path directions and magnitudes.
The methodology implemented for creating representative samples in this research work is described in an earlier paper by the same authors [30]. This technique ensures sample reproducibility and the representativeness of the reservoir’s mineralogy and geomechanical properties.

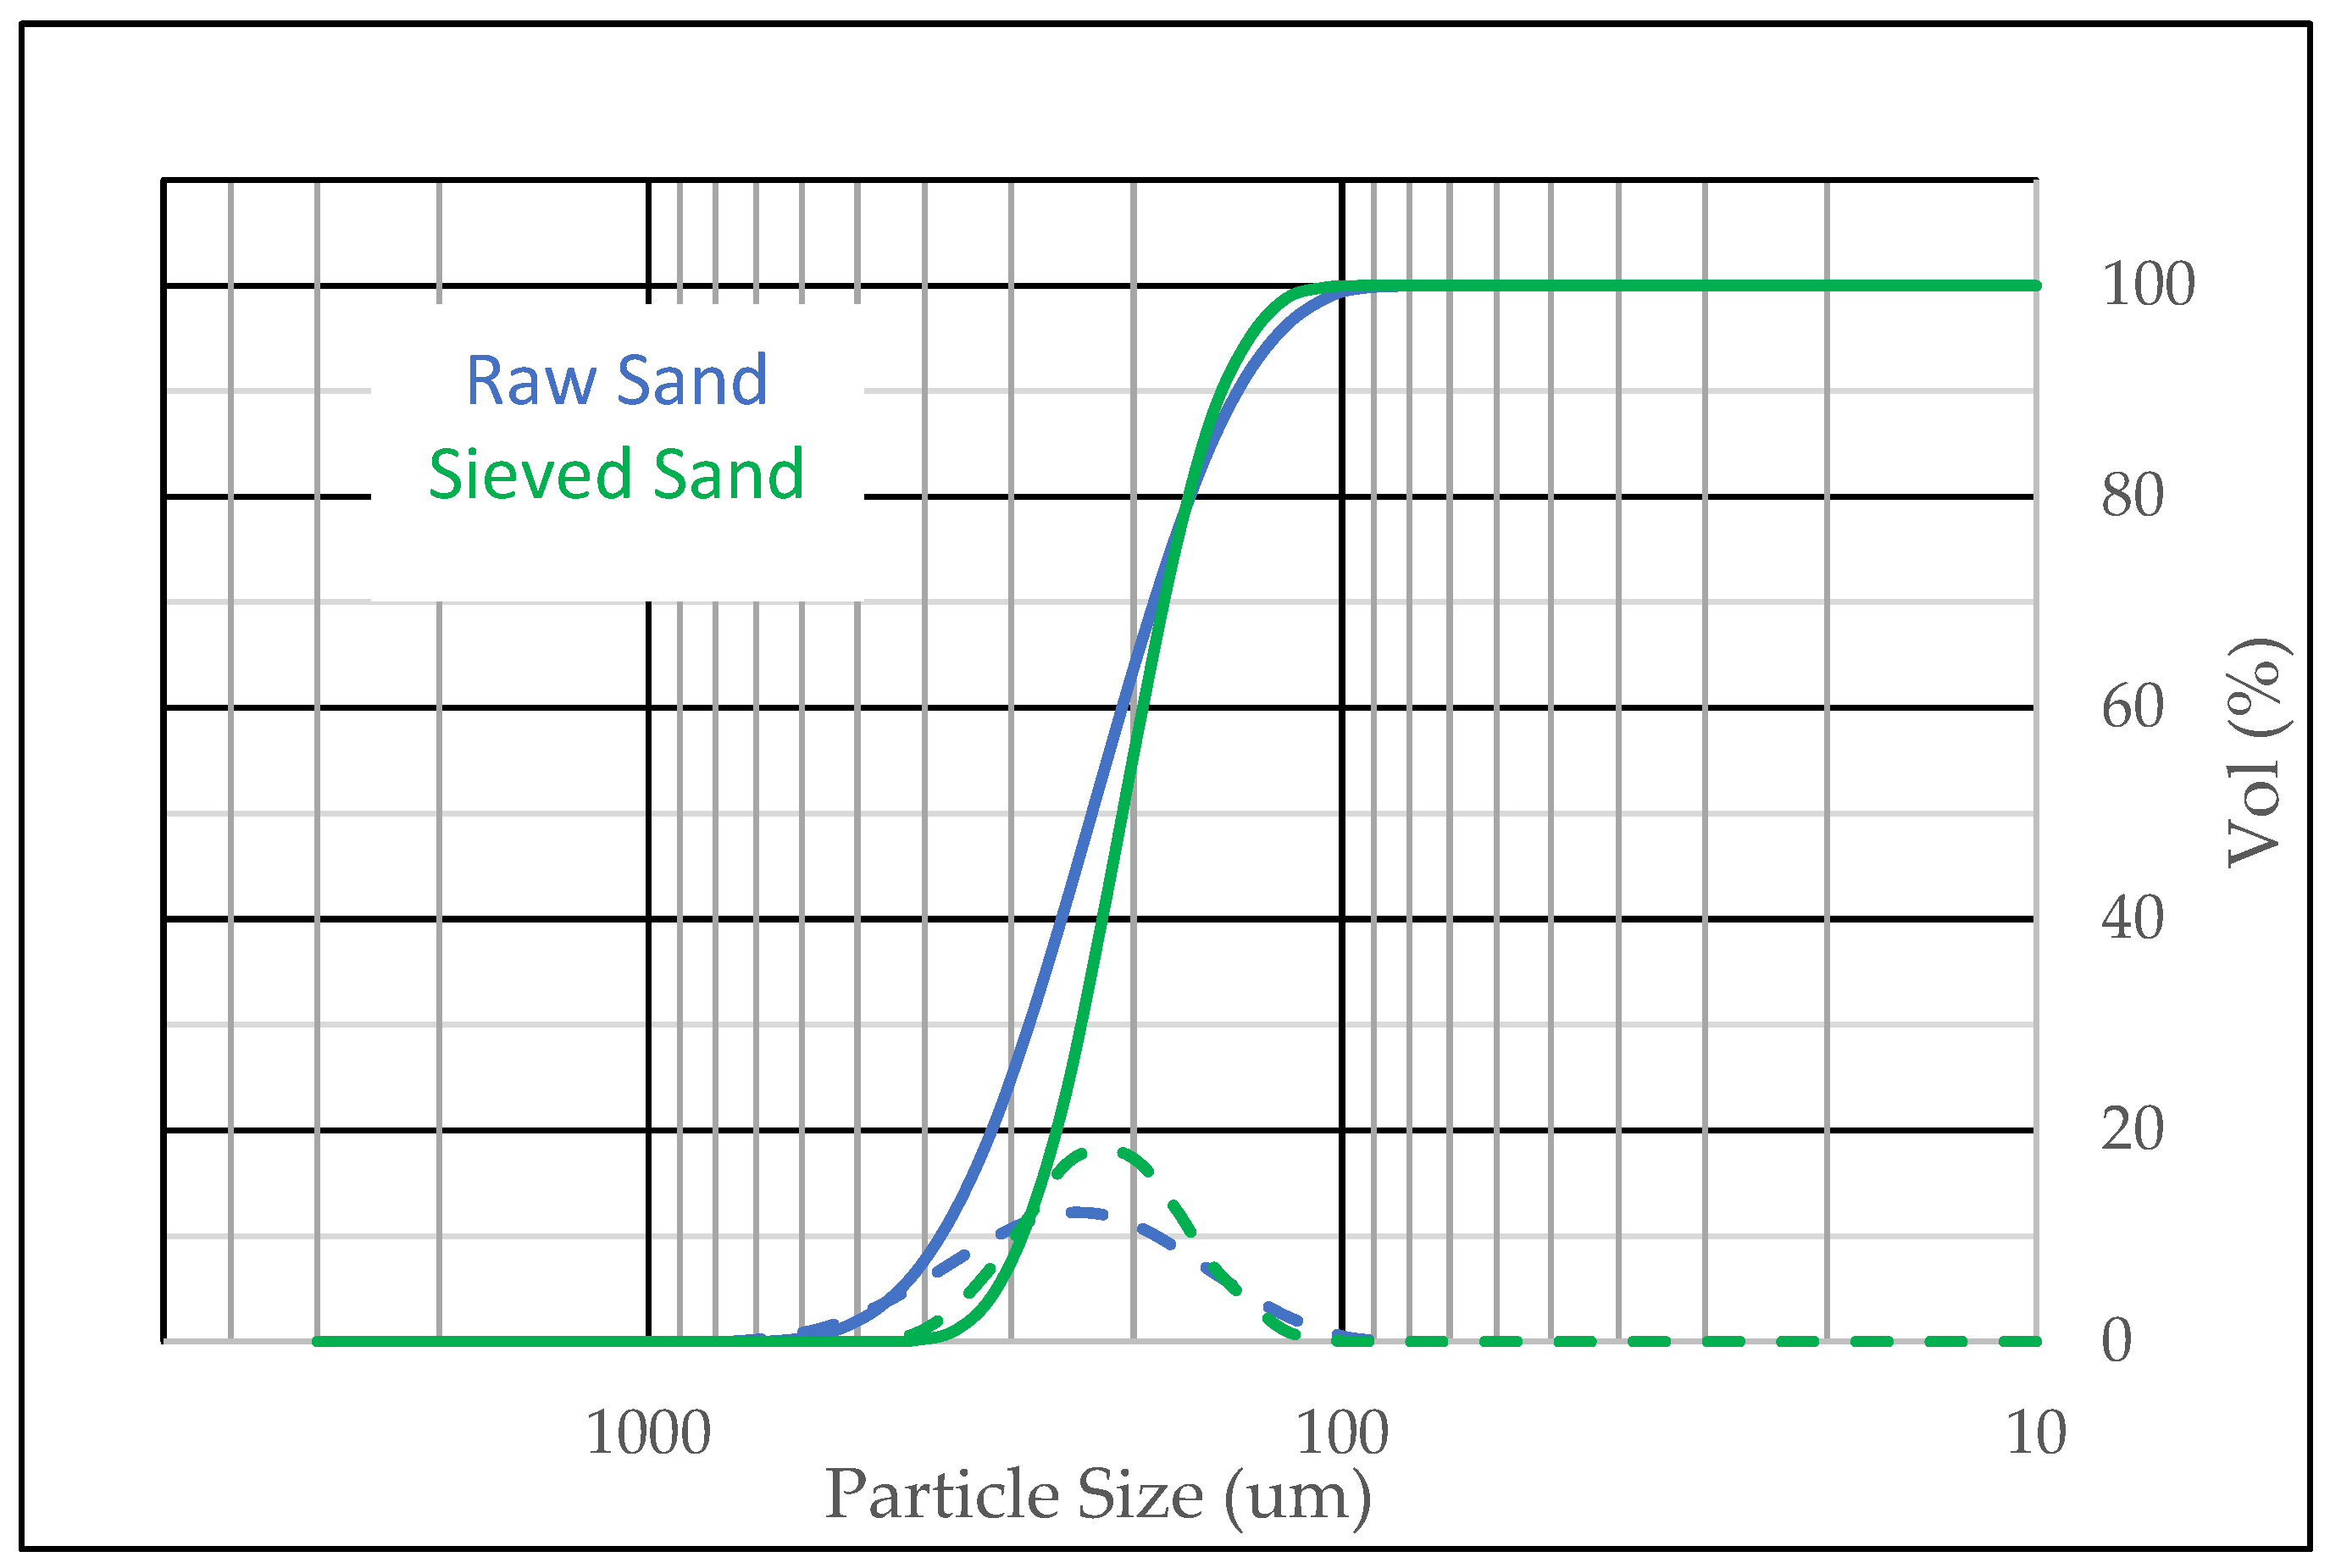
2. Sample Preparation and Material Characterization

This study’s target reservoir is a deep-water unconsolidated sand reservoir in the Gulf of Mexico. We need representative samples to predict unconsolidated sand reservoir behavior in the lab. Since deep-water unconsolidated sand cores are limited, a consistent and representative sample preparation procedure to create a reservoir analog is needed.
We sourced the starting material for the analog from Florida beach sand deposits. It is representative of the mineralogy and texture of Gulf of Mexico reservoirs. We sieved the sand to match the grain size range of the cored samples. Figure 1 shows the particle size distribution of the raw and sieved sand. The uniformity coefficient (d90/d40) was reduced from 1.84 (raw sand) to 1.44 (sieved sand). The particle size distribution for the sieved material closely matched the available core data.
After the sieving process, the representative sands were pluviated into a 1-inch diameter Kapton sleeve using a vibrating table to create the sample. It was imbibed with water, frozen with liquid nitrogen, and then cut to the required dimension (2 inches long). To avoid grain damage while achieving compaction of the synthetic sample (reduction in porosity), the sample was initially subjected to an incremental stress cycling (pre-consolidation) process. The sample was kept at 100 psi (0.7 MPa) deviatoric stress and 500 psi (3.45 MPa) confining stress to thaw and equilibrate for 24 h. This incremental stress cycling, pre-consolidation, ended when the sample had experienced the in situ mean stress values (4000 psi or 27.6 MPa) (Figure 2) and the axial strain was nearly elastic (95% recoverable strain) (Figure 3).
The material characteristics for the synthetic sample after pre-consolidation are shown in Table 1.

3. Experimental Methodology

We need to obtain both yield surfaces to compare the loading-based yield surface and the unloading-based yield surface. In this section, we detail the stress paths followed in the tests to obtain the yield surfaces. The loading stress paths have an angle of −90° < θ < 90° (increasing mean effective stress direction), and the unloading stress paths have an angle of 90° ≤ θ ≤ 270° (decreasing mean effective stress direction). Figure 4 depicts a sample initial stress point, stress paths, and stress path angles used in this study.
After the test samples are pre-consolidated, we bring each test sample to its initial stress point. The samples follow an isostatic stress path and a triaxial stress path to reach the initial conditions. The same stress path is used to bring each test sample to the initial stress point; therefore, the possible effects of using different stress paths to reach different initial stress points are avoided. We use three different subsequent stress path directions. These include one triaxial loading stress path and two unloading-based stress paths. The unloading tests consist of constant axial and shear stress tests.

3.1. Loading-Based Yield Behavior

To determine the triaxial loading yield surface, we use two triaxial tests. A multi-stage triaxial test is used to determine the loading-based yield surface for different initial mean effective stress points. A single-stage triaxial test is applied to verify the yield surface obtained from the multi-stage triaxial test. In this research work, Drucker–Prager criteria are used to obtain a yield surface in the mean effective stress (p’)–shear stress (q) plane, since intermediate stresses are present in our setup, and intermediate stresses play a significant role in determining the yielding of the specimen. Mean effective stress and shear stress are 1st and 2nd invariants of the stress tensor, i.e., there is no directional dependence in this stress space, and it is appropriate for comparing different stress paths and stress magnitudes.

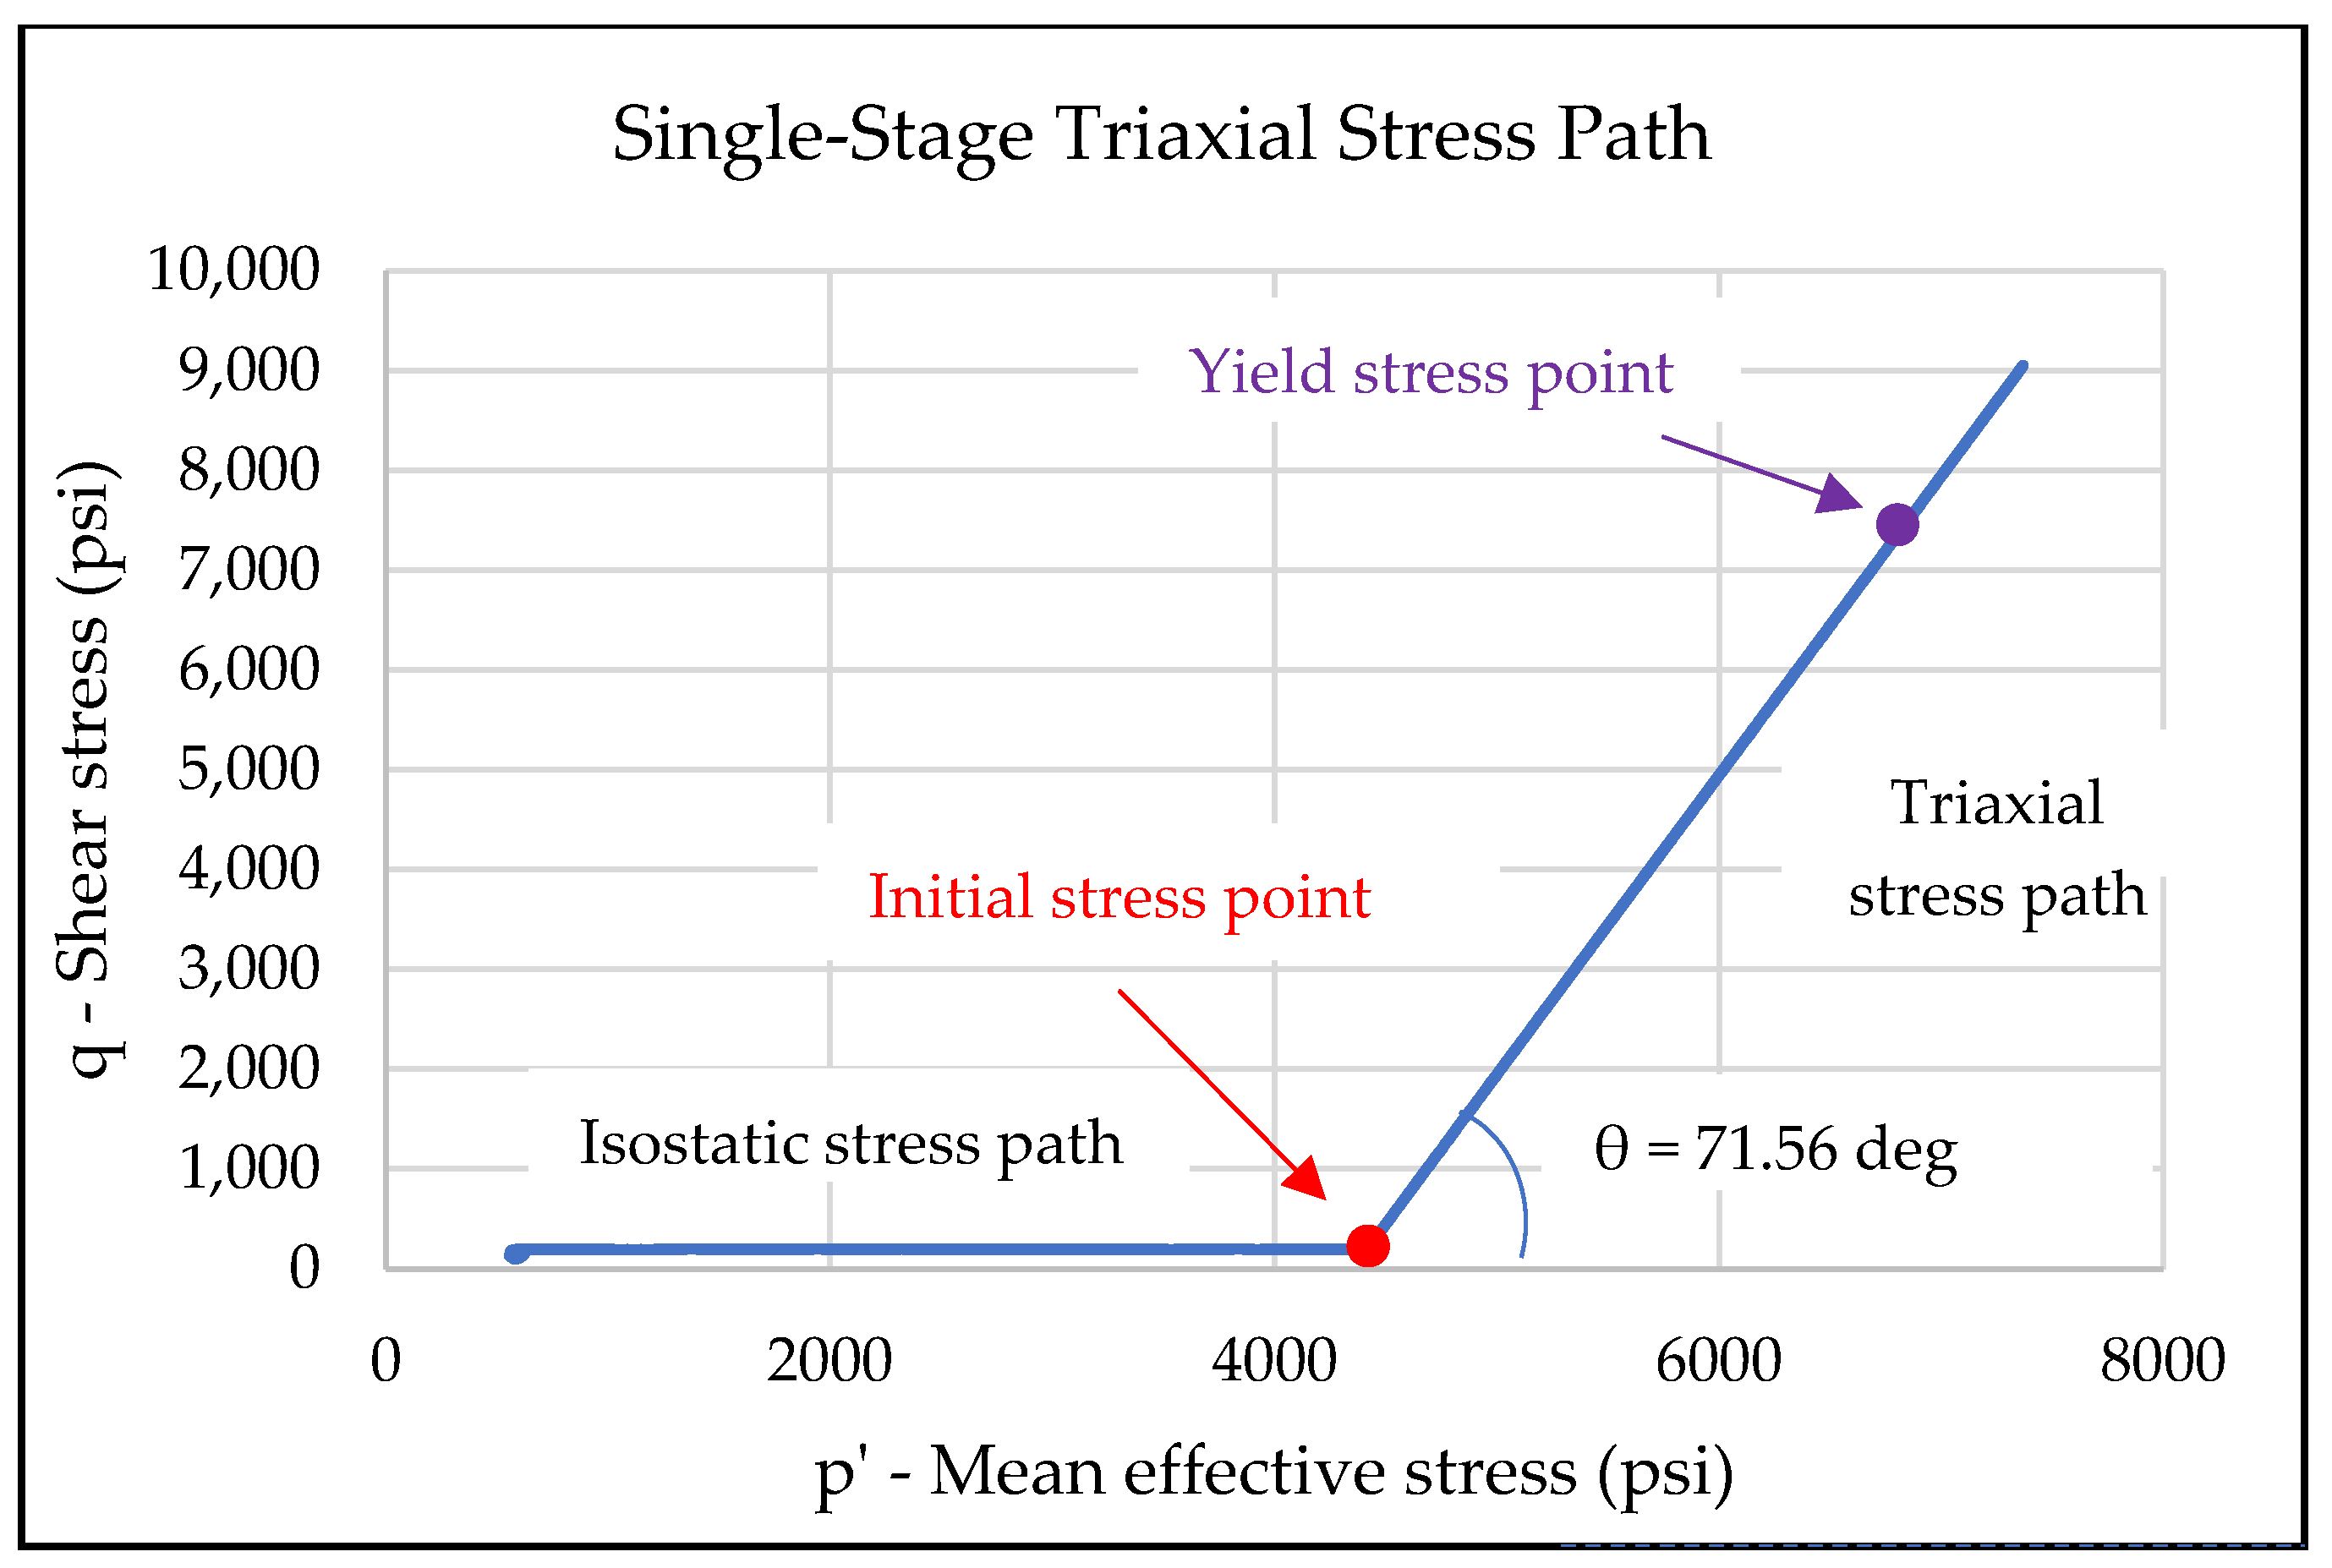
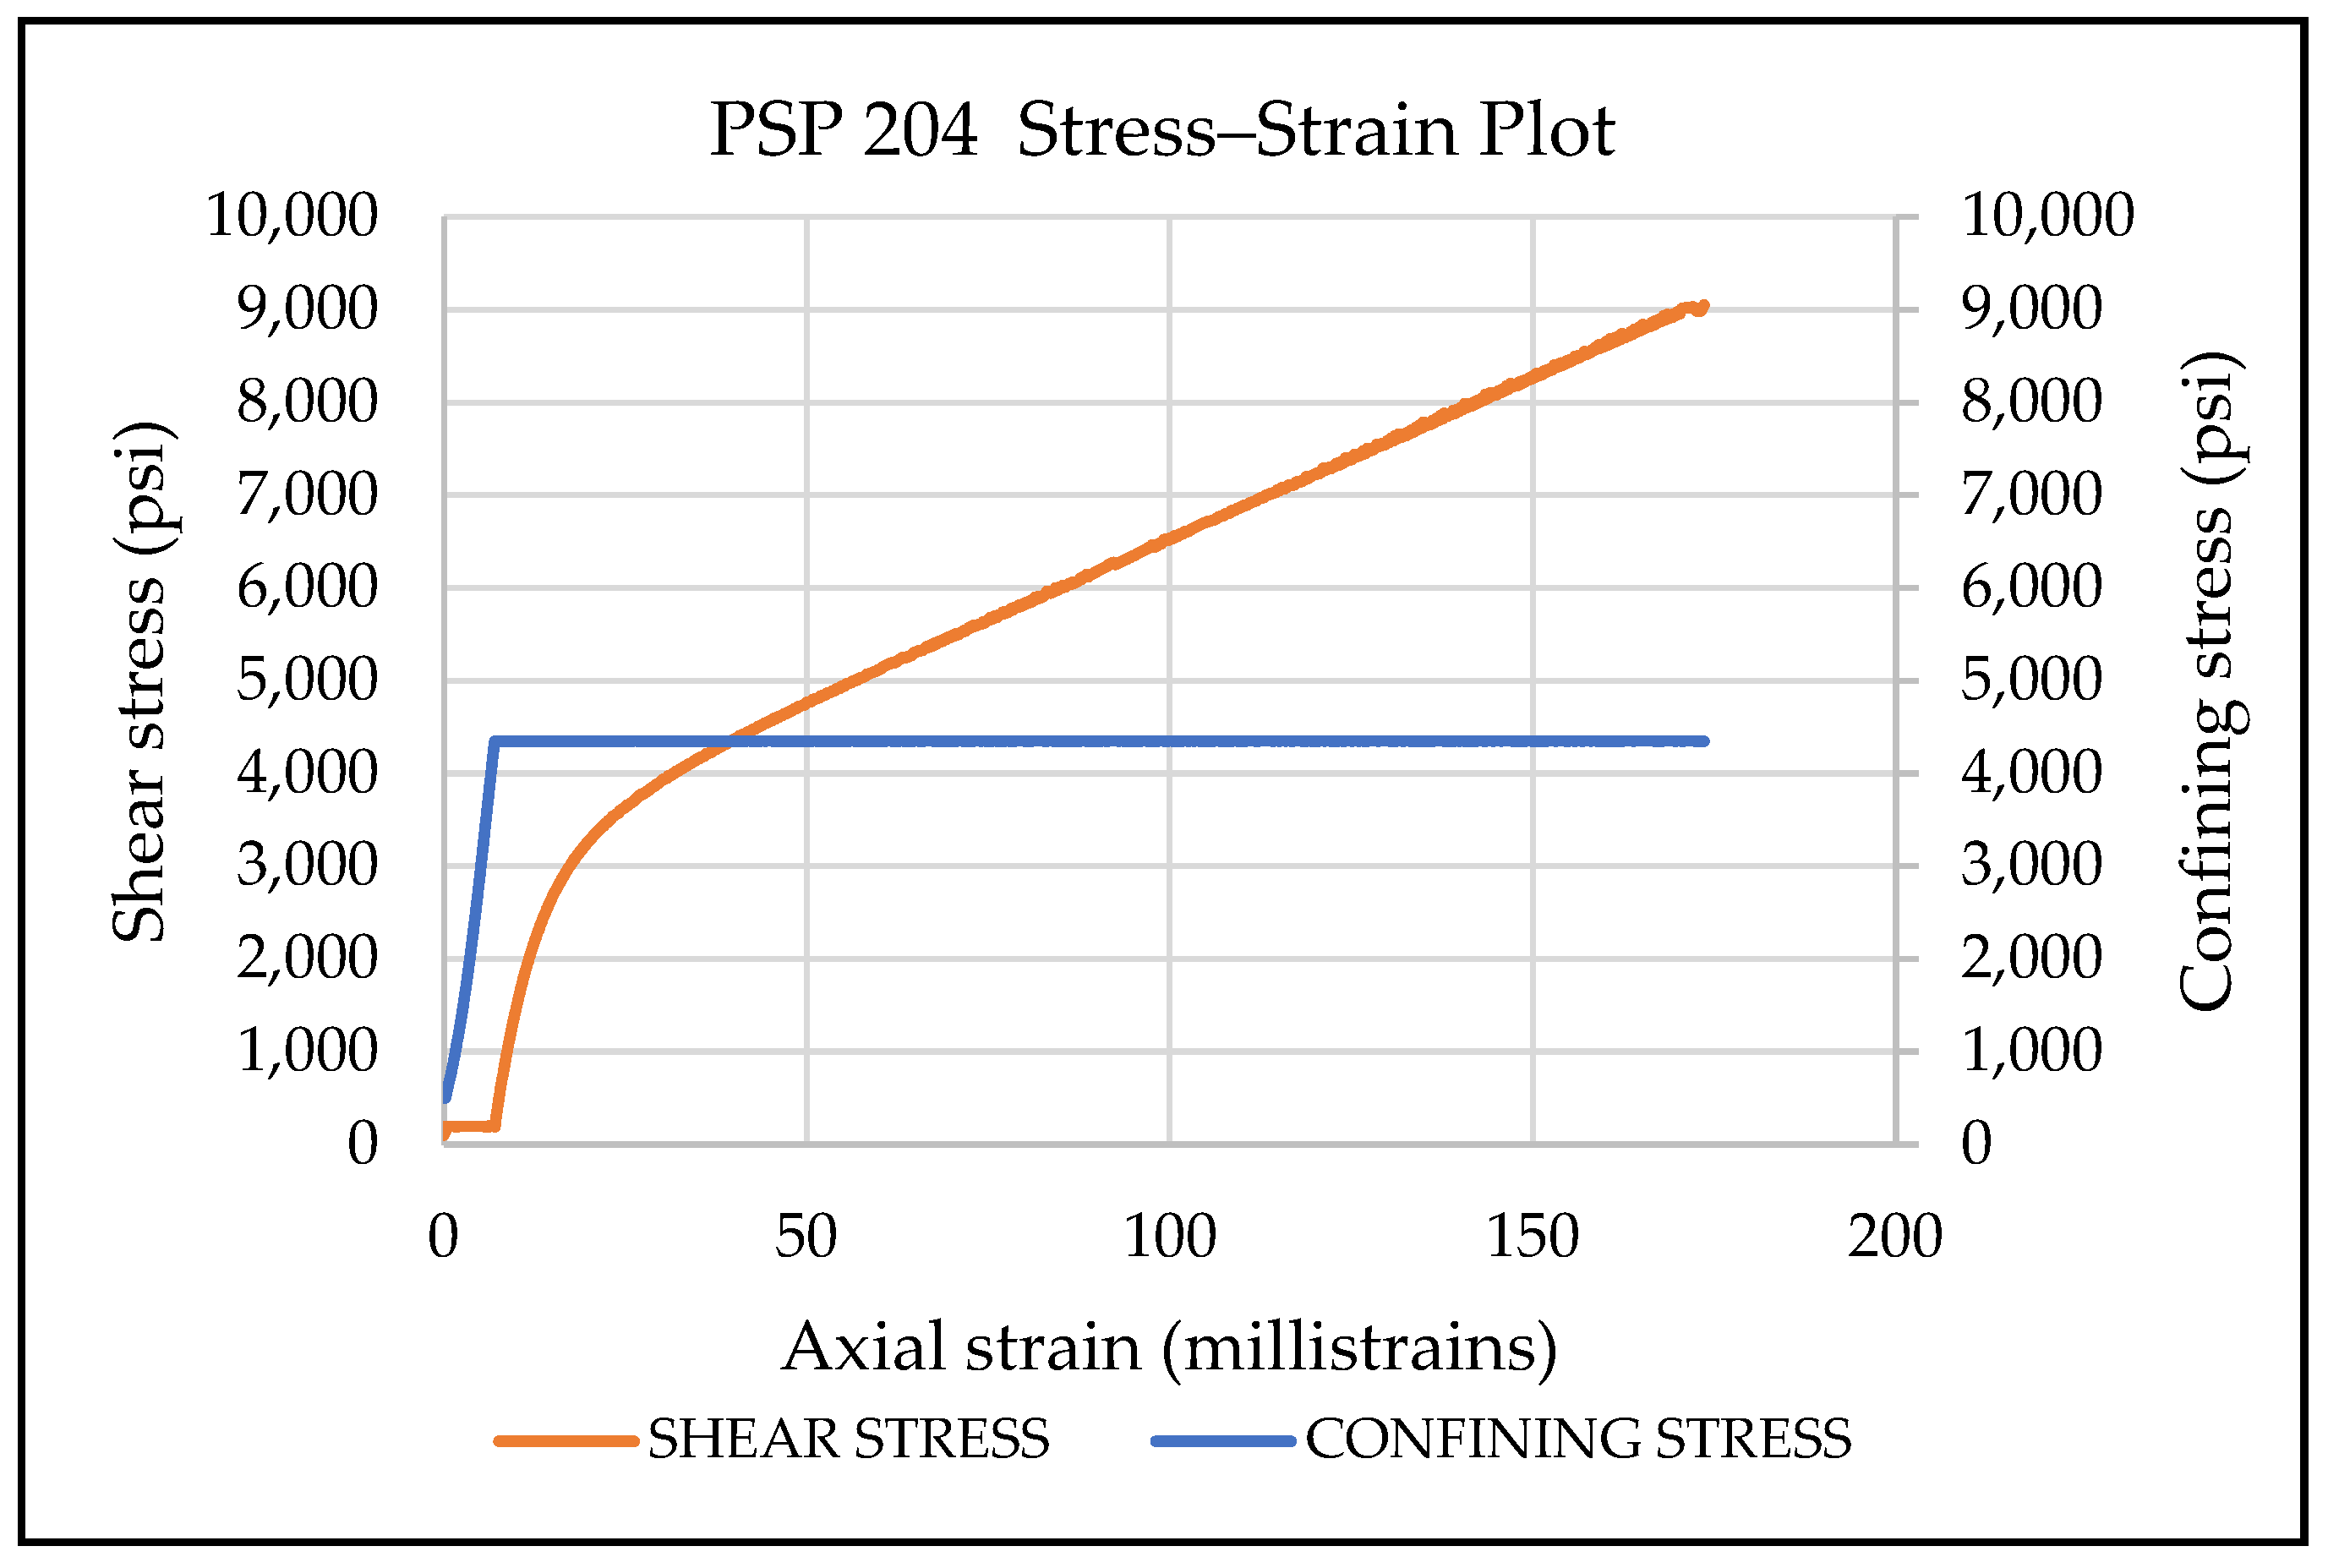
3.1.1. Single-Stage Triaxial Test

The single-stage triaxial test employs one sample to determine a single yield stress point. The path to obtain the initial mean effective stress point is isostatic, with a constant deviatoric stress of 100 psi. The sample is loaded on a triaxial stress path from the initial stress point to the yield stress point. The confining stress is held constant while the axial stress is increased until the axial strain reaches the measurement limit. Figure 5 shows the applied axial and confining stresses and the calculated shear stress versus time for this test. The sample is first loaded isostatically (with equal axial stress and confining stress) to 4350 psi. After that point, the confining stress of 4350 psi (30 MPa) is held constant while the axial stress is increased to yield the sample. Figure 6 depicts the isostatic stress path to the initial stress point and the triaxial stress path from the initial stress point to the yield stress point in the p’-q stress space. The yield stress point is the shear stress value at the tangent strain ratio of 0.5 (described in Section 4.1.3). The isostatic and triaxial stress paths are “loading” since they have increasing p’ and −90° < θ < 90° (Figure 4).

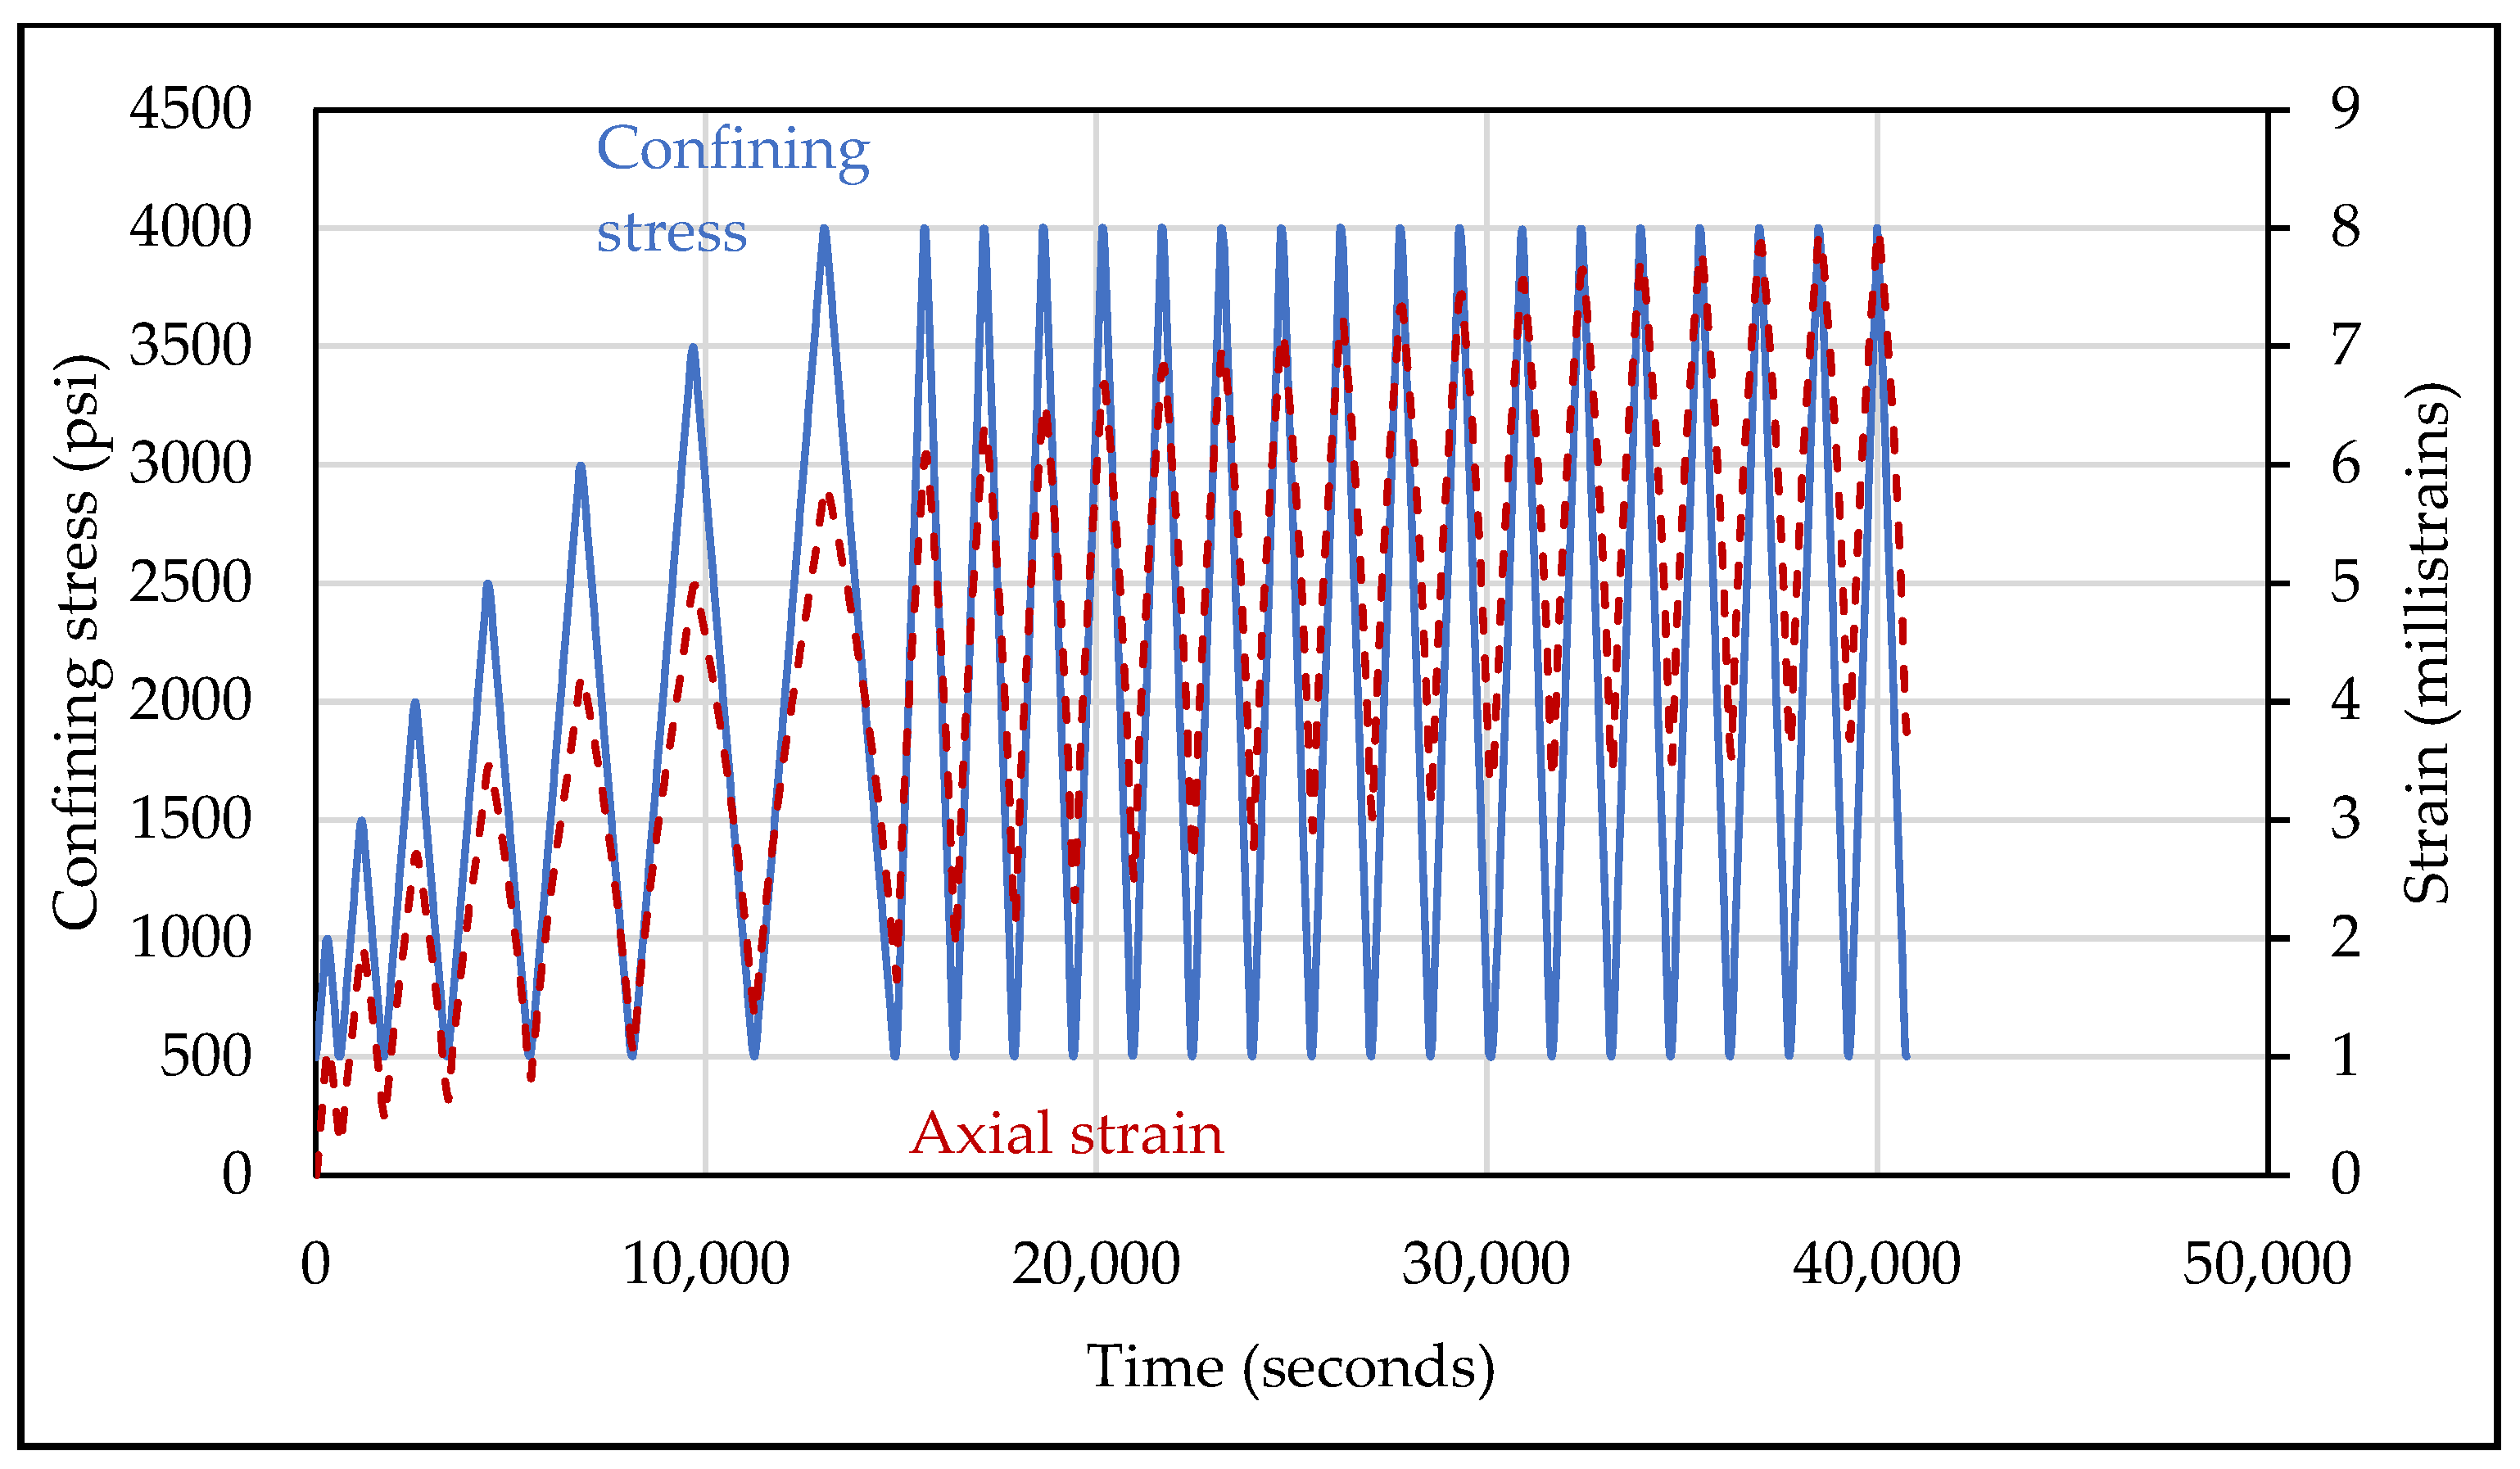
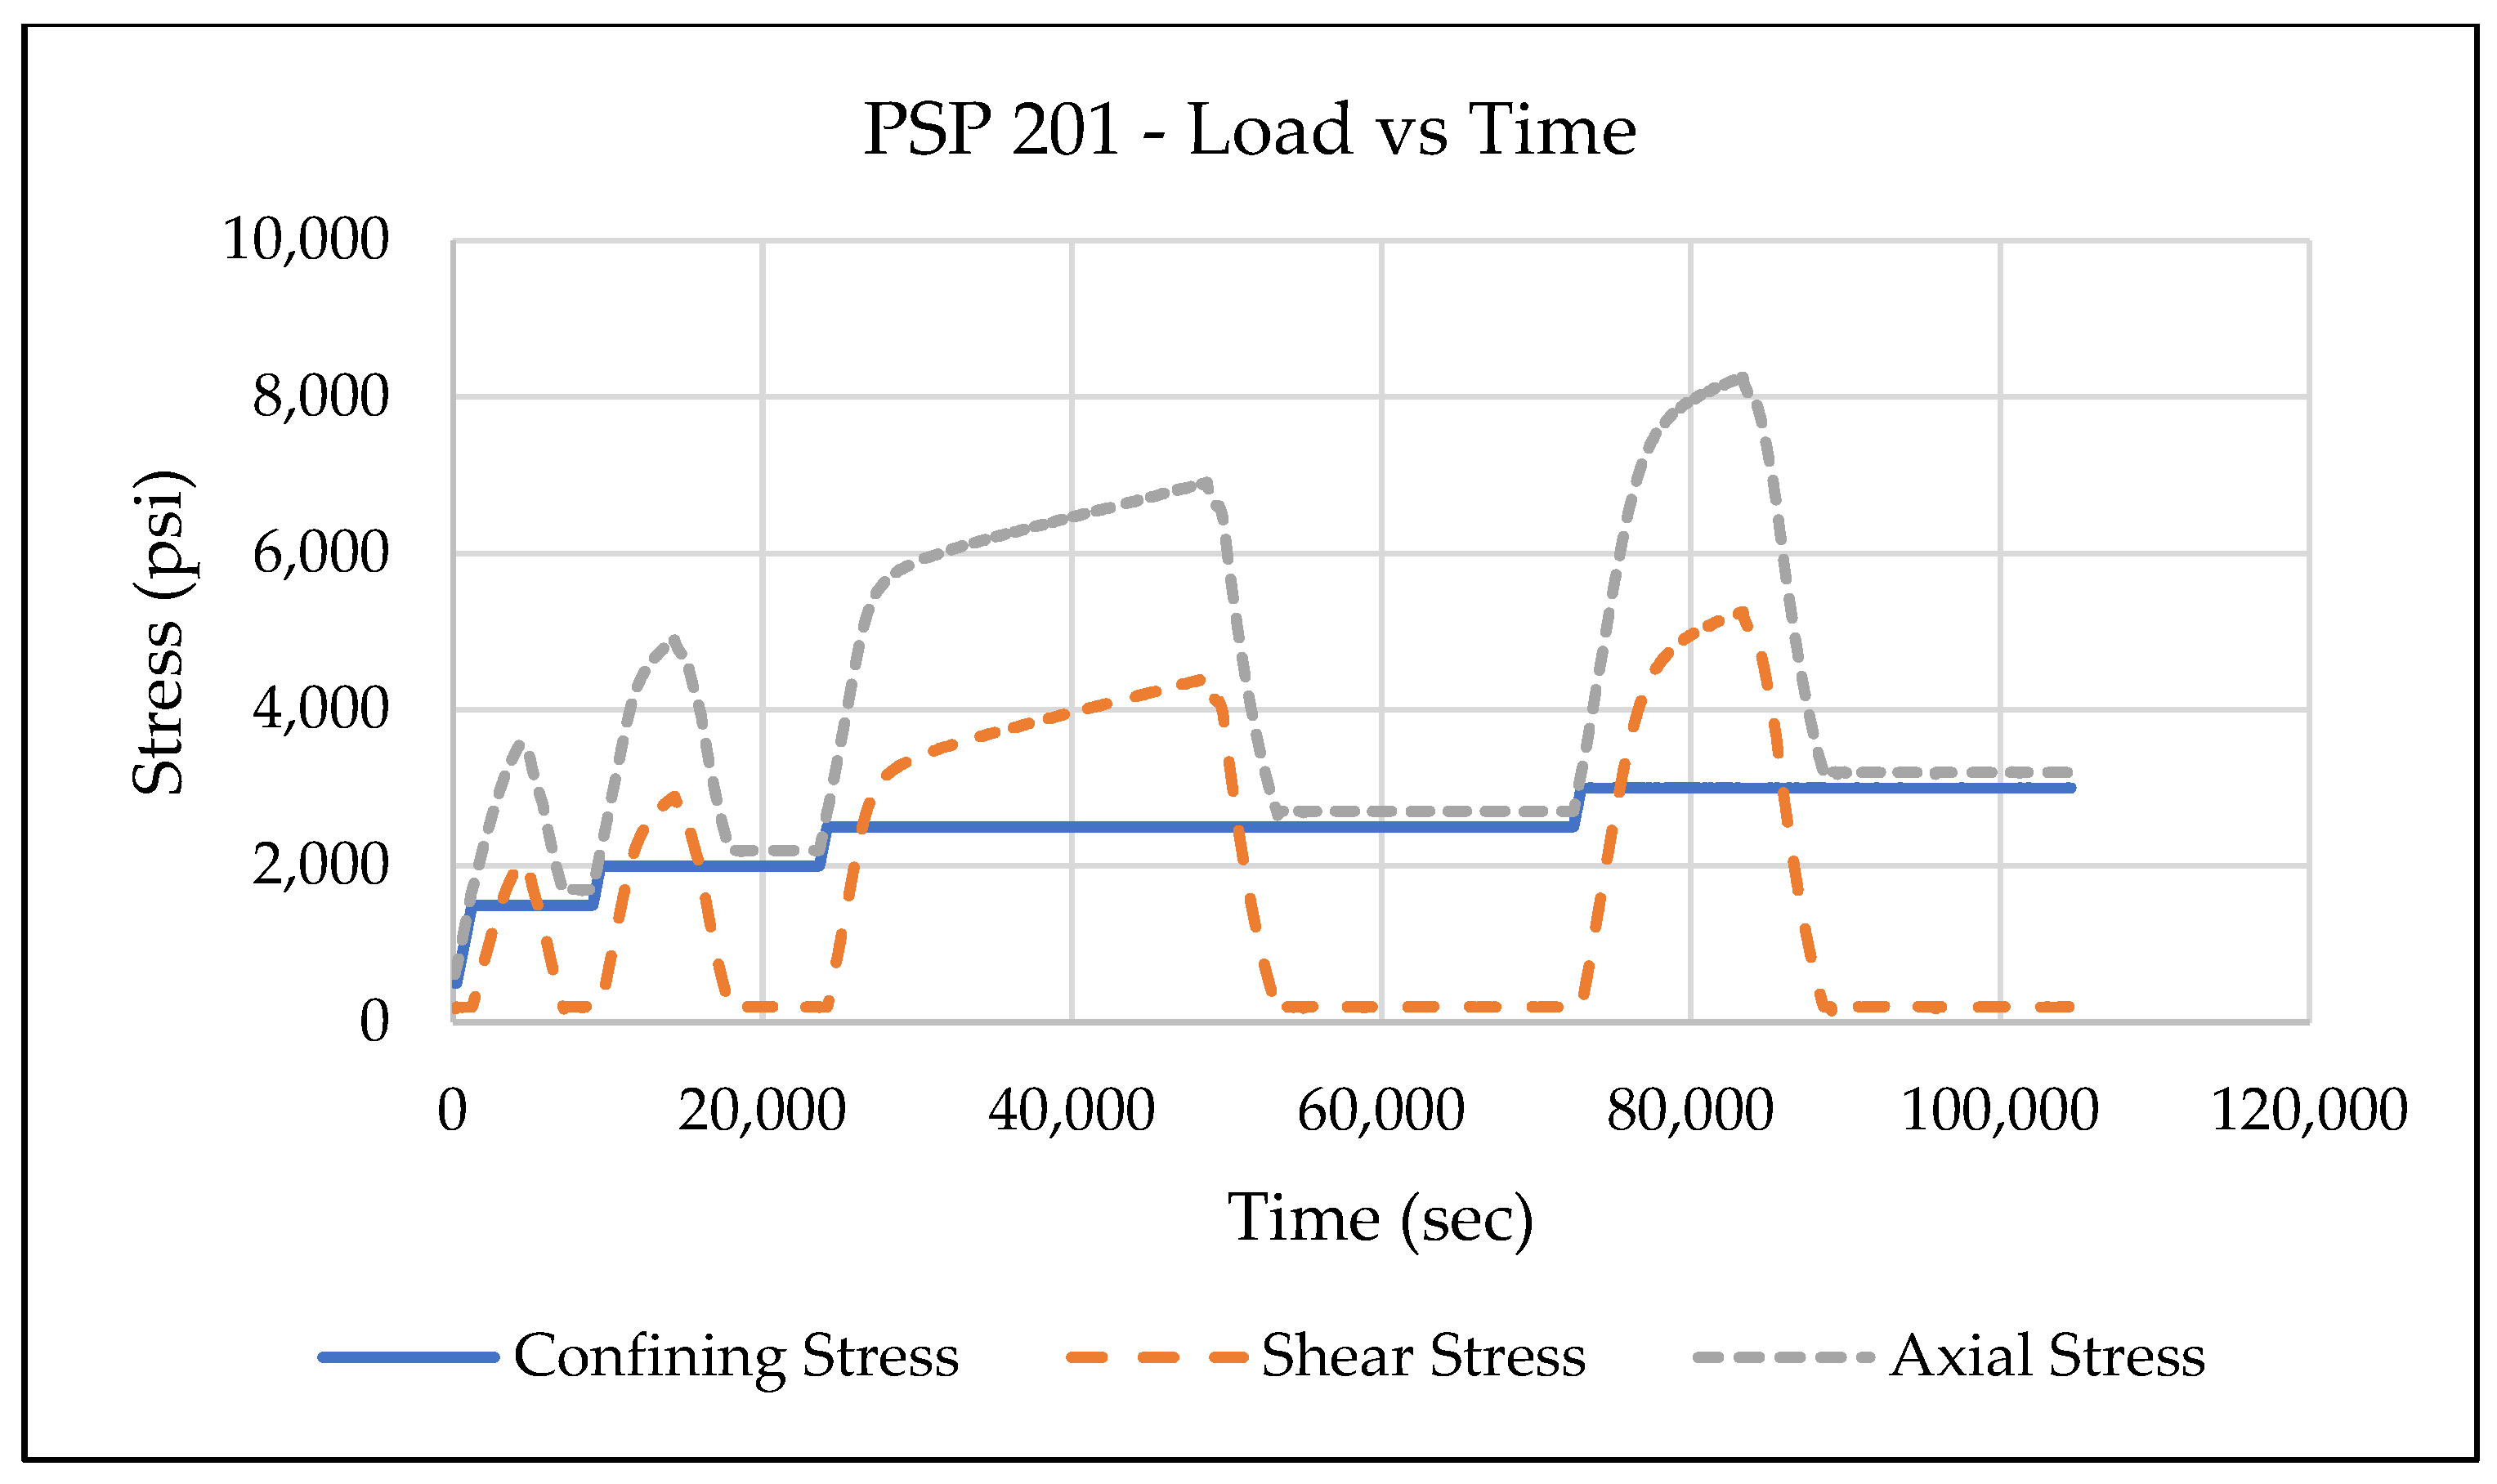
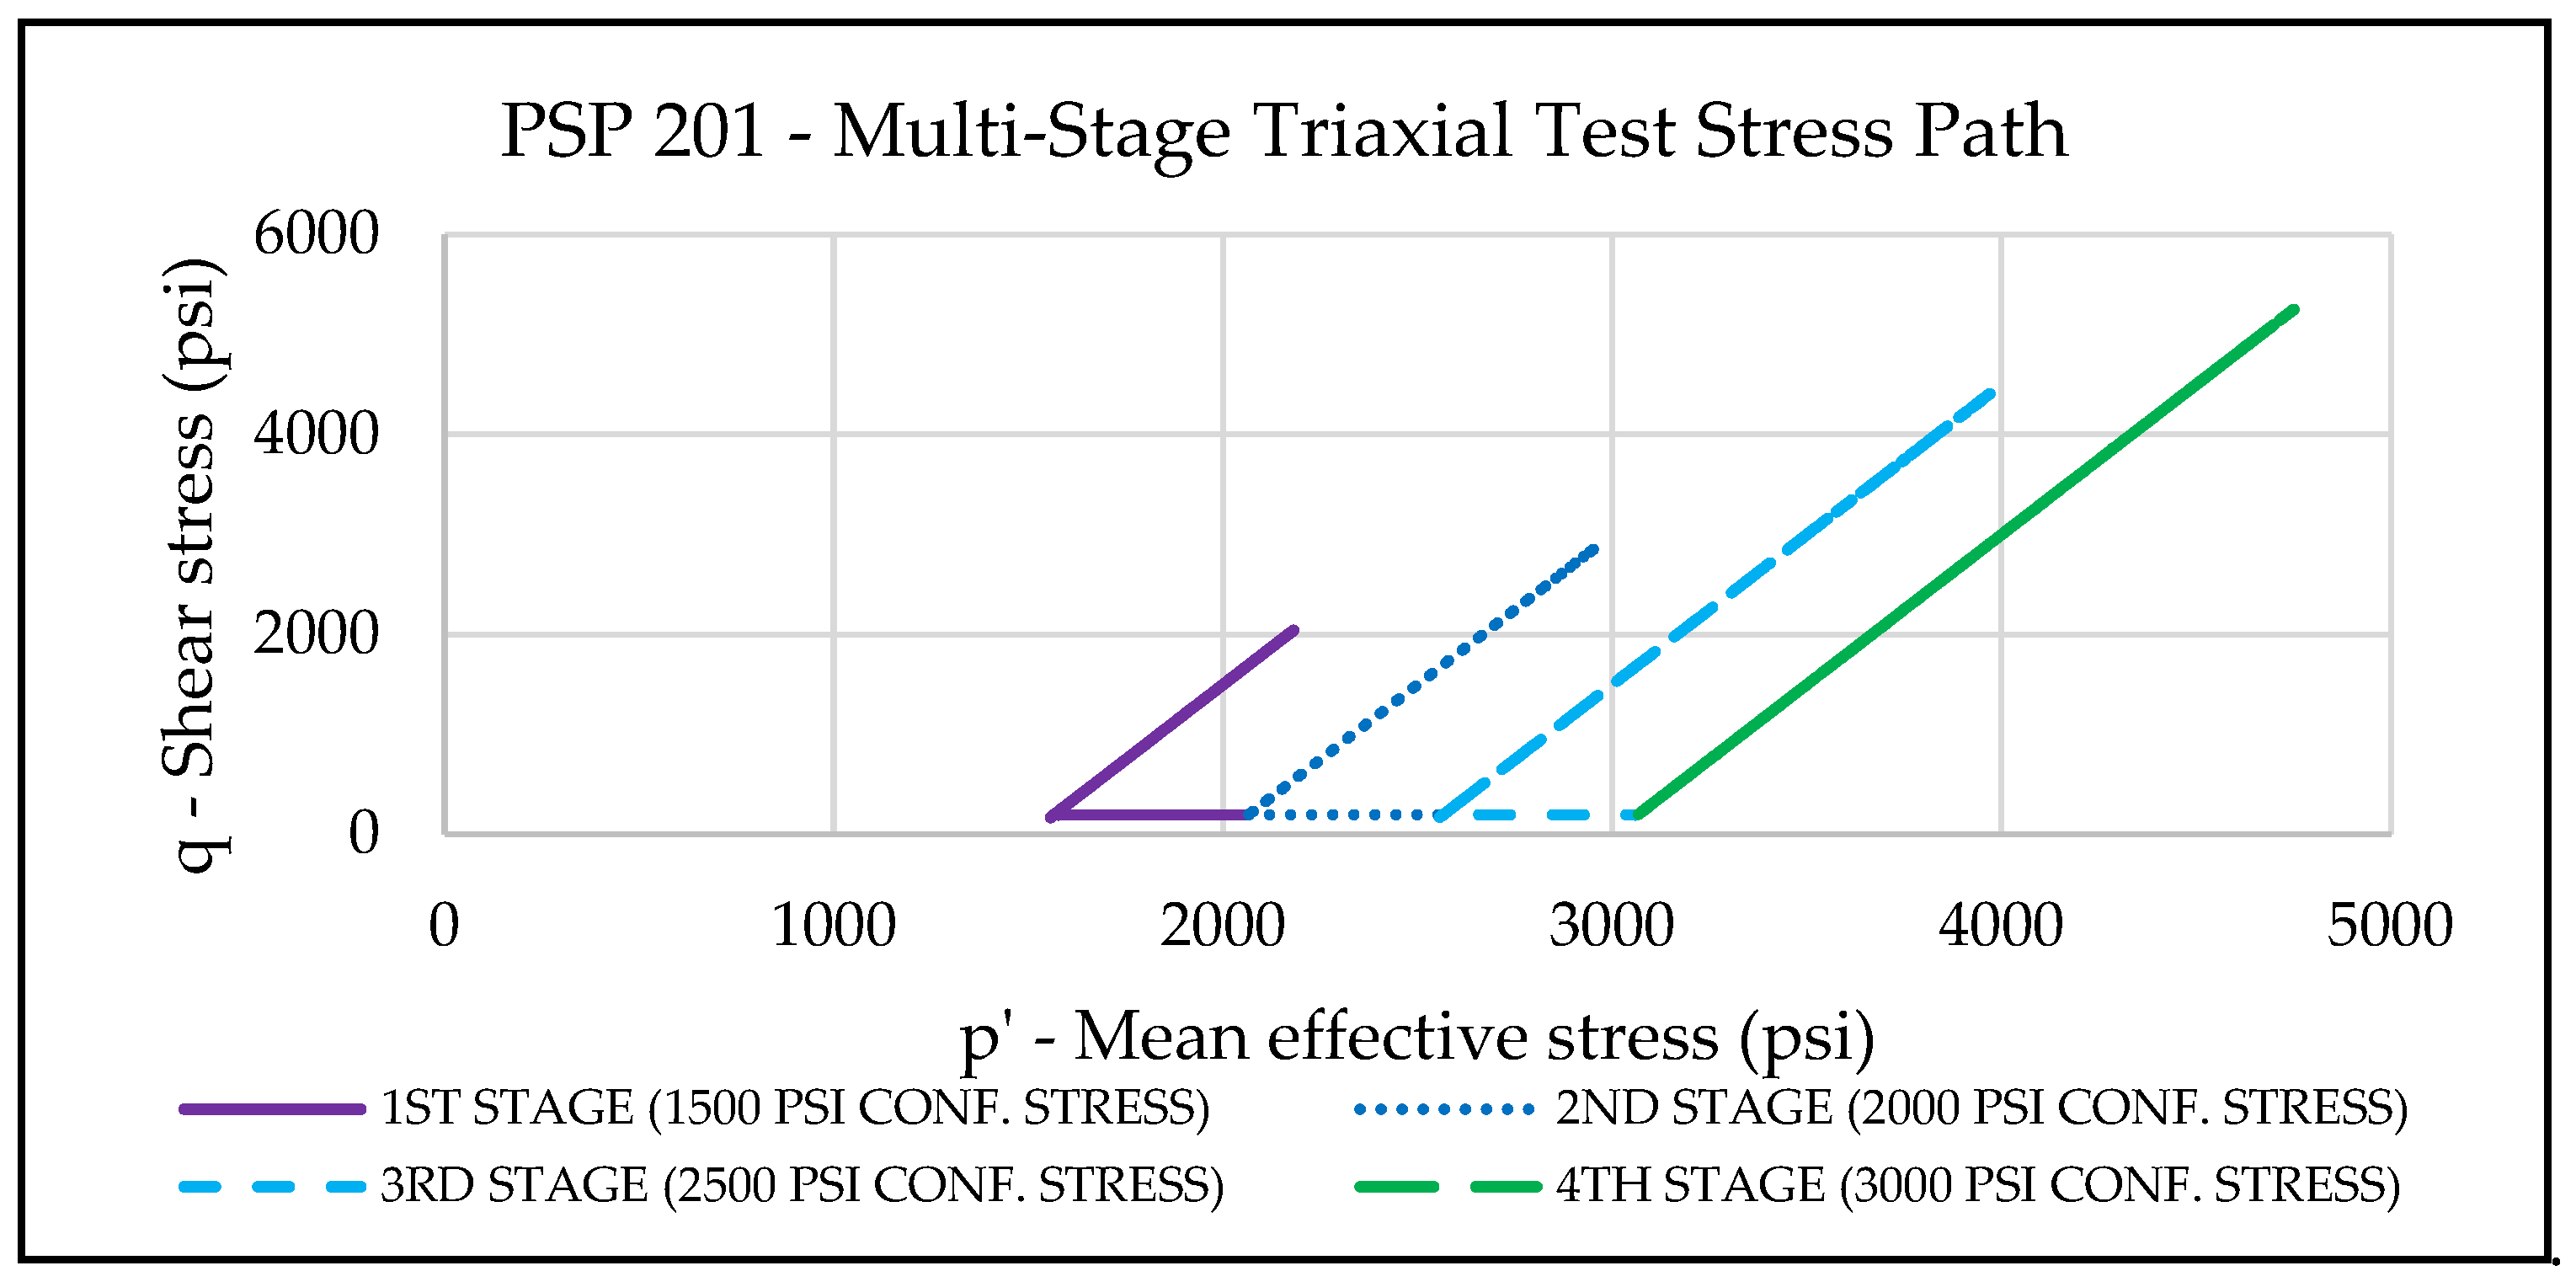
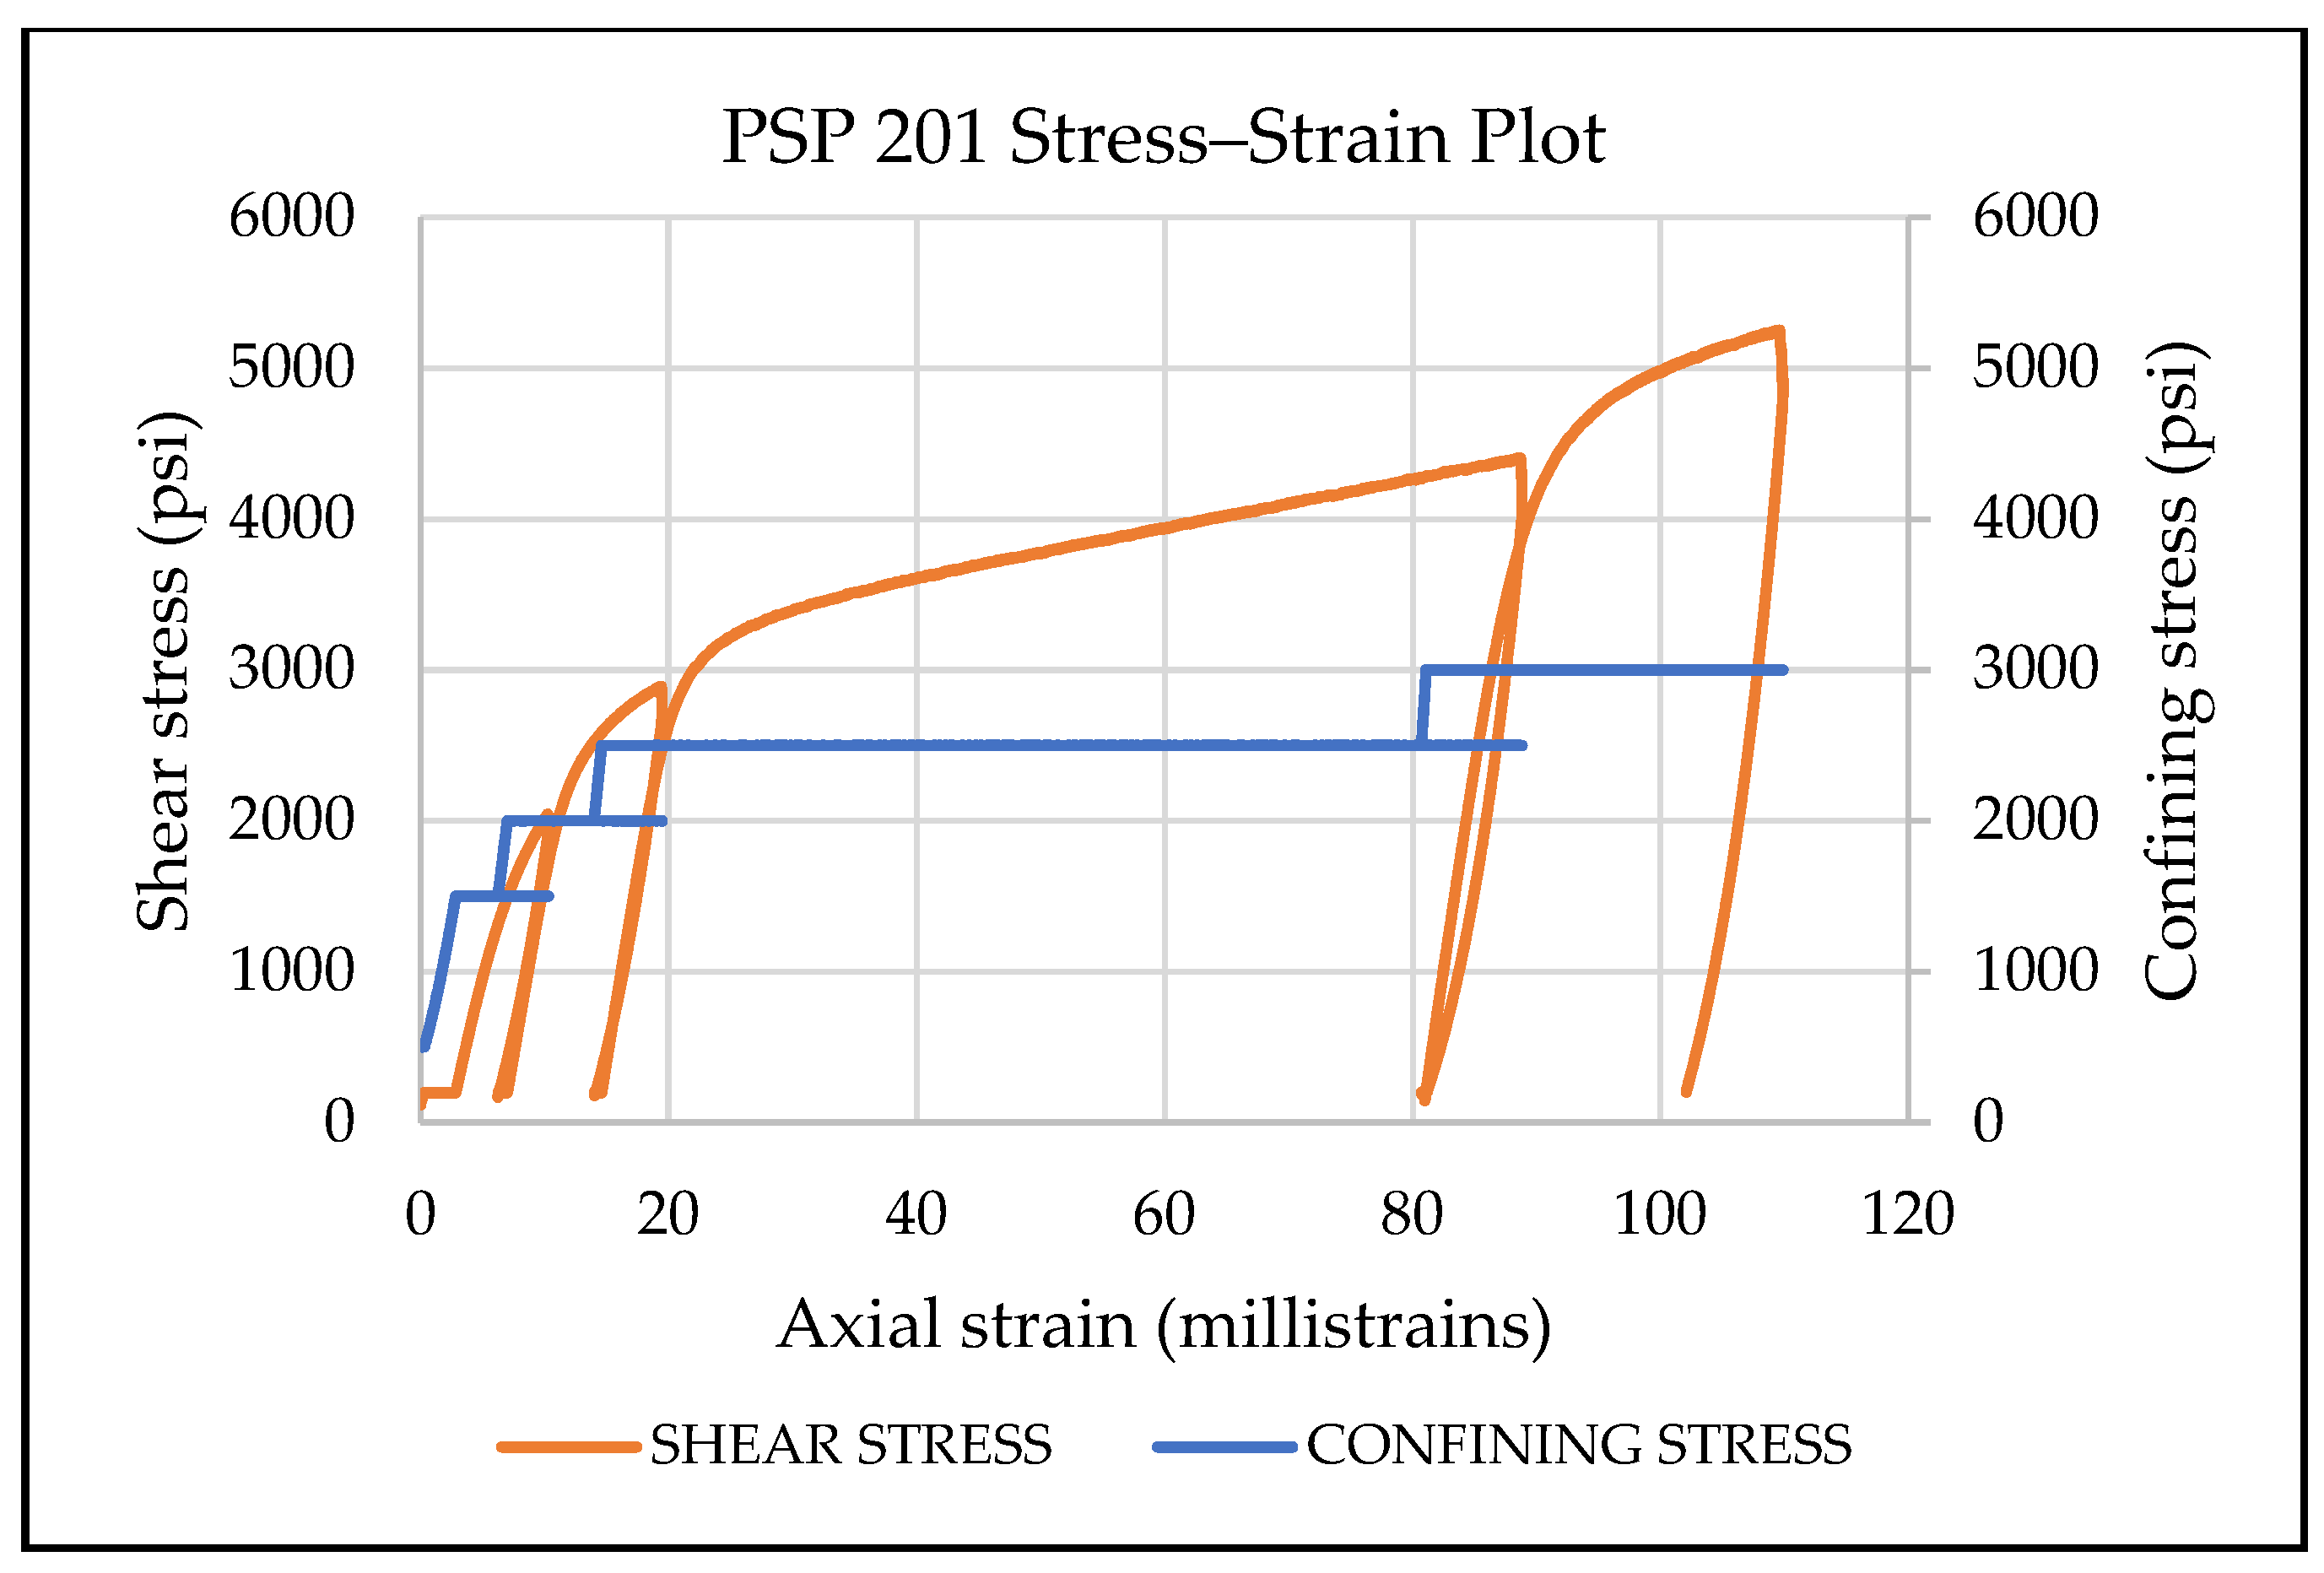
3.1.2. Multi-Stage Triaxial Test

Kovari et al. [31] introduced the “multiple failure” stage triaxial test. It is also known as the multi-stage triaxial test. A key advantage of this test is that it only requires one sample to determine the loading yield surface at different initial stress points. The single-stage triaxial test uses one sample to determine each yield stress point at each initial stress position. Therefore, multiple samples are needed to determine a yield surface, introducing issues with the ability to twin samples. Many researchers [32,33,34,35,36,37,38,39,40] have validated that the multi-stage triaxial testing procedure is an effective alternative to a series of single-stage triaxial tests to determine the loading yield surface.
The multi-stage triaxial test follows similar stress paths as the single-stage triaxial test at each stress step. The sample starts with an isostatic stress path to the first initial stress point, and then a triaxial stress path is followed to the yield point. The point of positive dilatancy [41], where the change in tangent strain ratio (the ratio of radial strain over axial strain) is 0.5, or volume strain changes direction from compaction to dilation, is used as the unloading point for individual stages of the multi-stage triaxial test. After that, the sample is unloaded back to the initial stress point, loaded to a higher confining stress, and the deviatoric stress is raised to the second yield stress. This process continues and repeats for subsequent confining stresses. Figure 7 shows the variation in applied loads (confining and axial stresses and the corresponding calculated shear stress) with time. A total of four “initial” confining stress stages are shown—1500 psi (10.34 MPa), 2000 psi (13.78 MPa), 2500 psi (17.24 MPa), and 3000 psi (20.68 MPa). Figure 8 depicts these initial stress points, loading stress paths, and corresponding yield stress points in the p’-q plot.

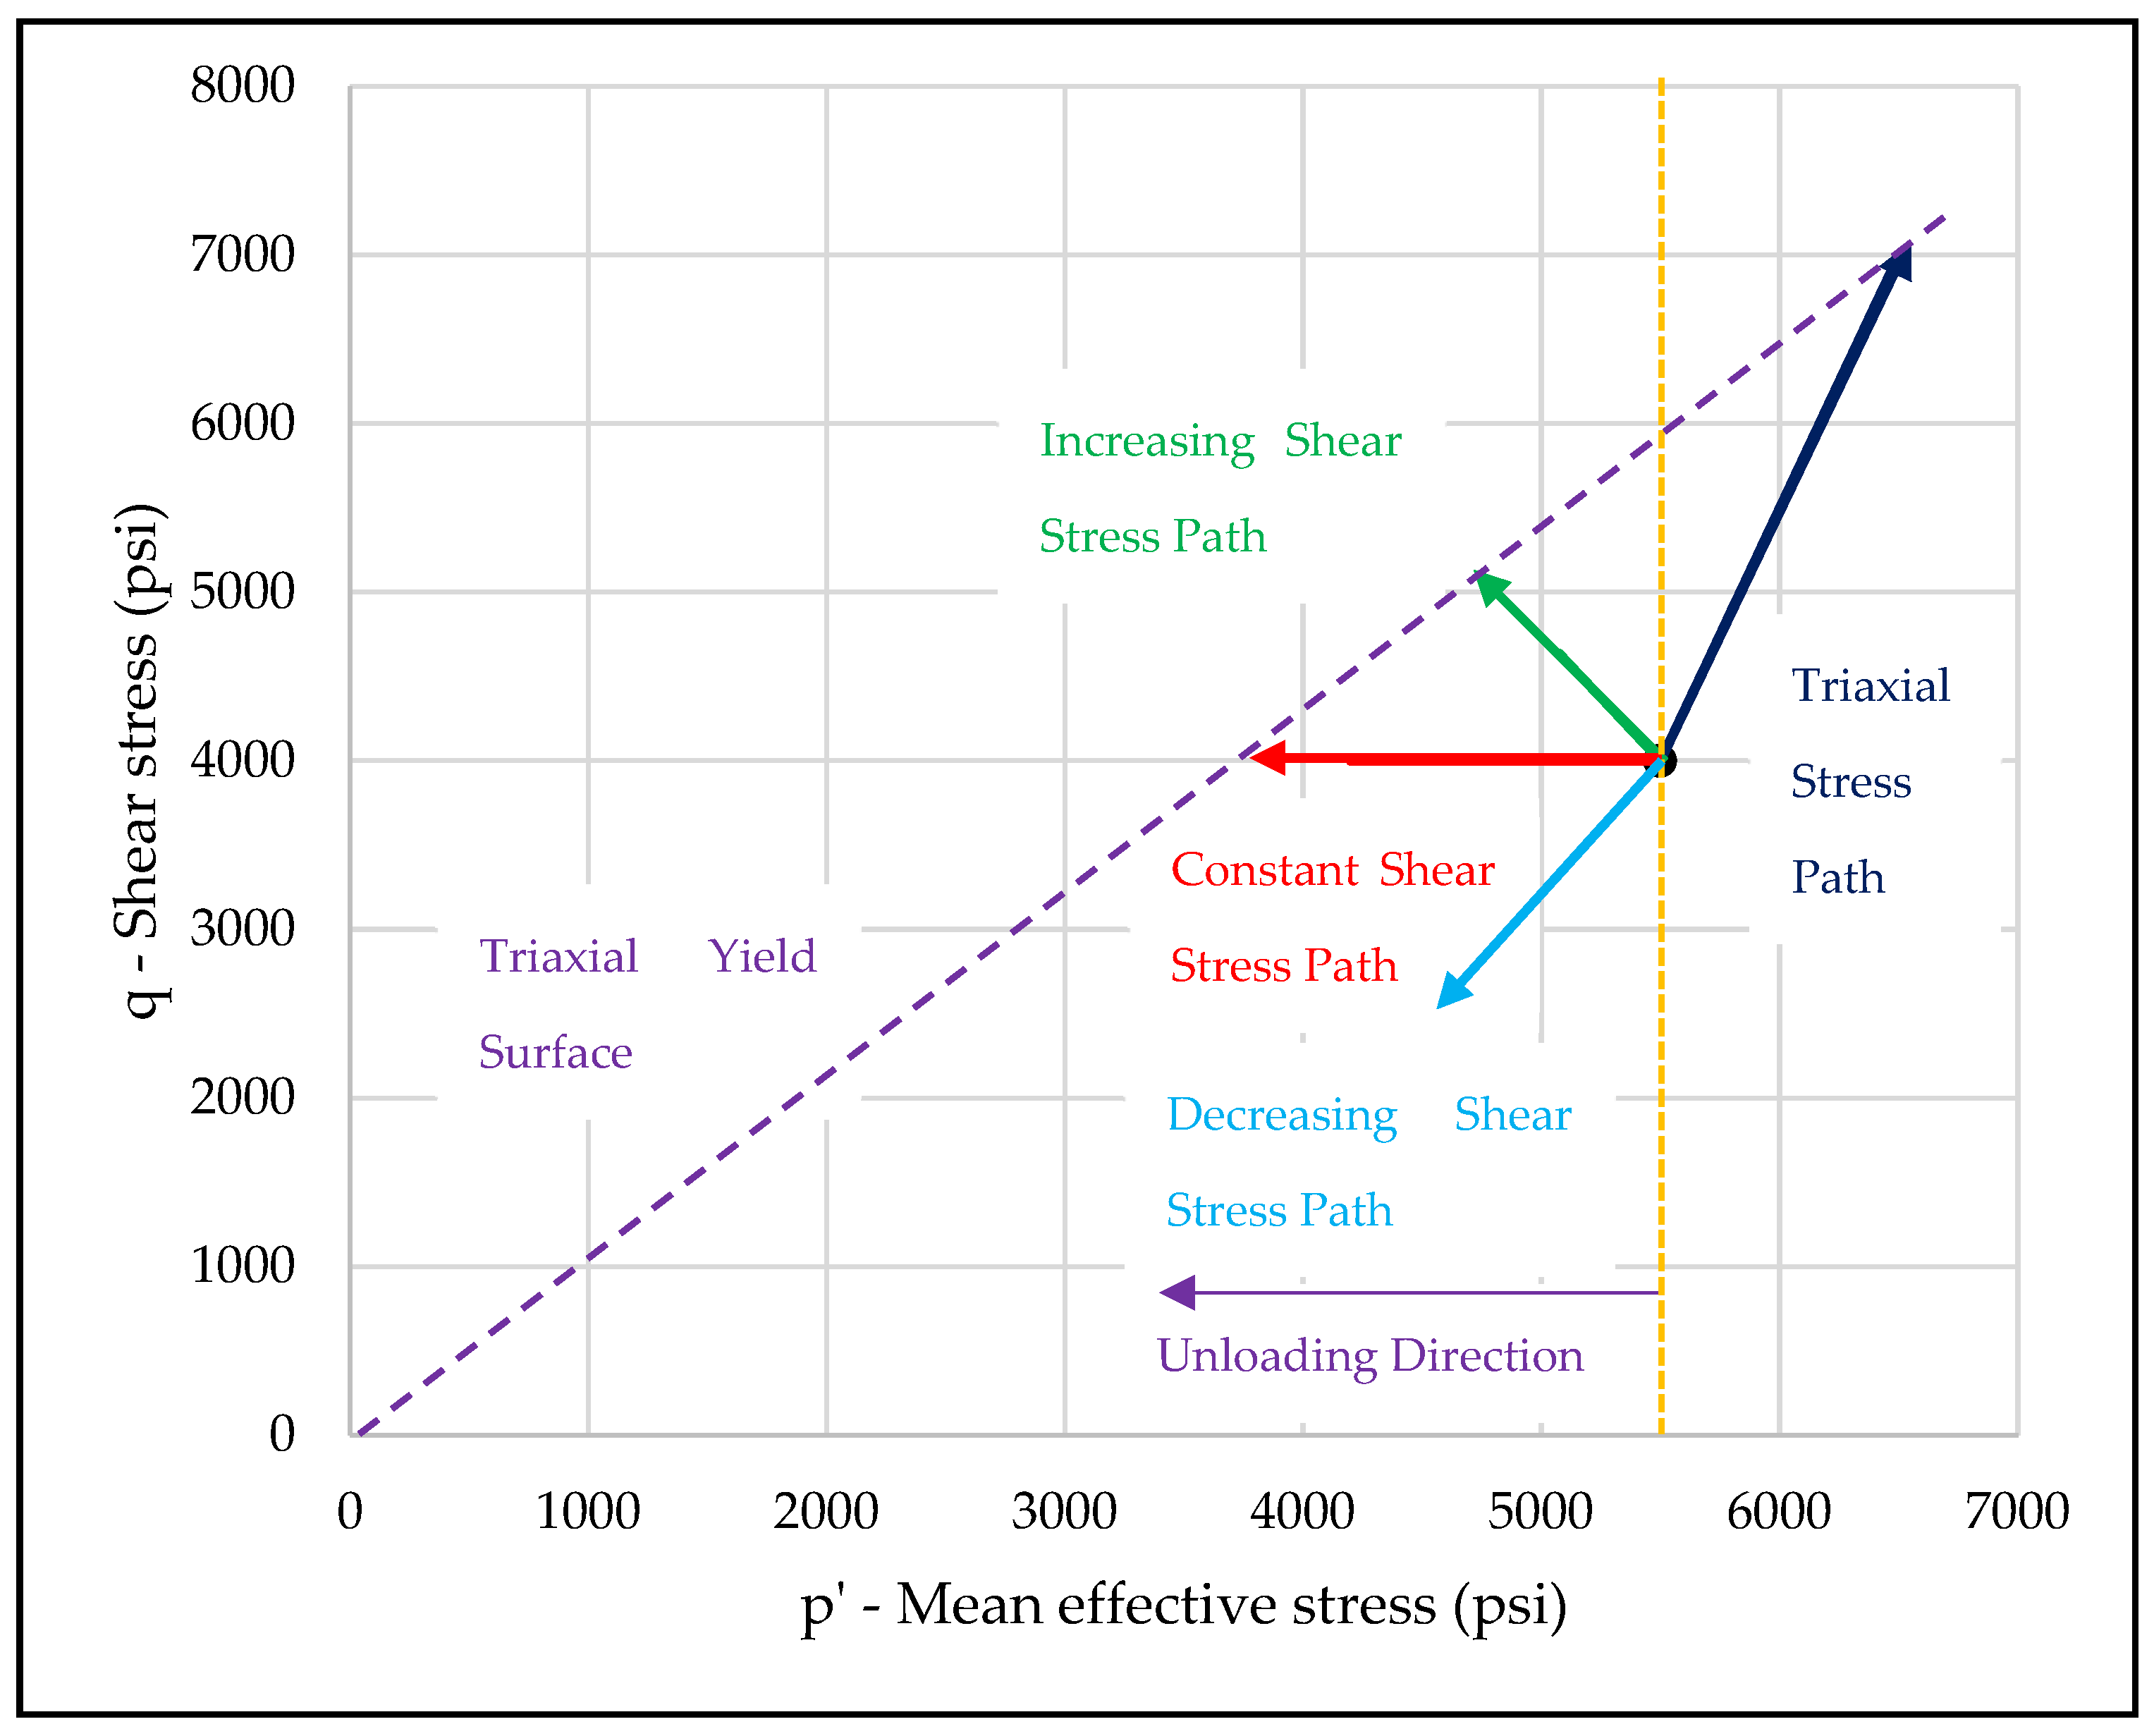
3.2. Unloading-Based Yield Behavior

Unloading-based yield behavior depends on the stress path and initial stress point. The values of this initial stress point and the “unloading” stress path determine where the unloading yield stress occurs. Stress path directions are termed unloading in reference to the decreasing nature of the mean effective stress. As shown in Figure 9, this unloading stress path angle may be in the range 90° ≤ θ ≤ 270°. Two unloading-based stress path directions are used to determine unloading-based yield surfaces.
During the injection phase, the pore pressure of the reservoir increases, and the mean effective stress on the rock matrix decreases. The reservoir stress path could have an increasing shear stress, constant shear stress, or decreasing shear stress direction, depending on the stress path values of the mean effective stress and shear stress applied (Figure 9). For a decreasing shear stress path, typically, we are moving away from the estimated yield surface as we unload both the mean effective stress and shear stress; the material is not expected to yield. For the two cases of increasing shear stress or constant shear stress, the yield surface is encountered as pore pressure increases, and the sample will yield in these cases.
Researchers in the mining and tunneling industry typically apply two unloading stress paths: the constant axial stress unloading test (CASUT) and the constant shear stress unloading test (CSSUT). In the former, the shear stress increases with decreasing mean effective stress. This stress path is more representative of reservoir conditions. The latter stress path maintains a constant shear stress while decreasing the mean effective stress. This stress path brackets the lower limit of unloading tests. We will also use these two unloading stress path measurements when comparing the yield surface for loading and unloading tests.

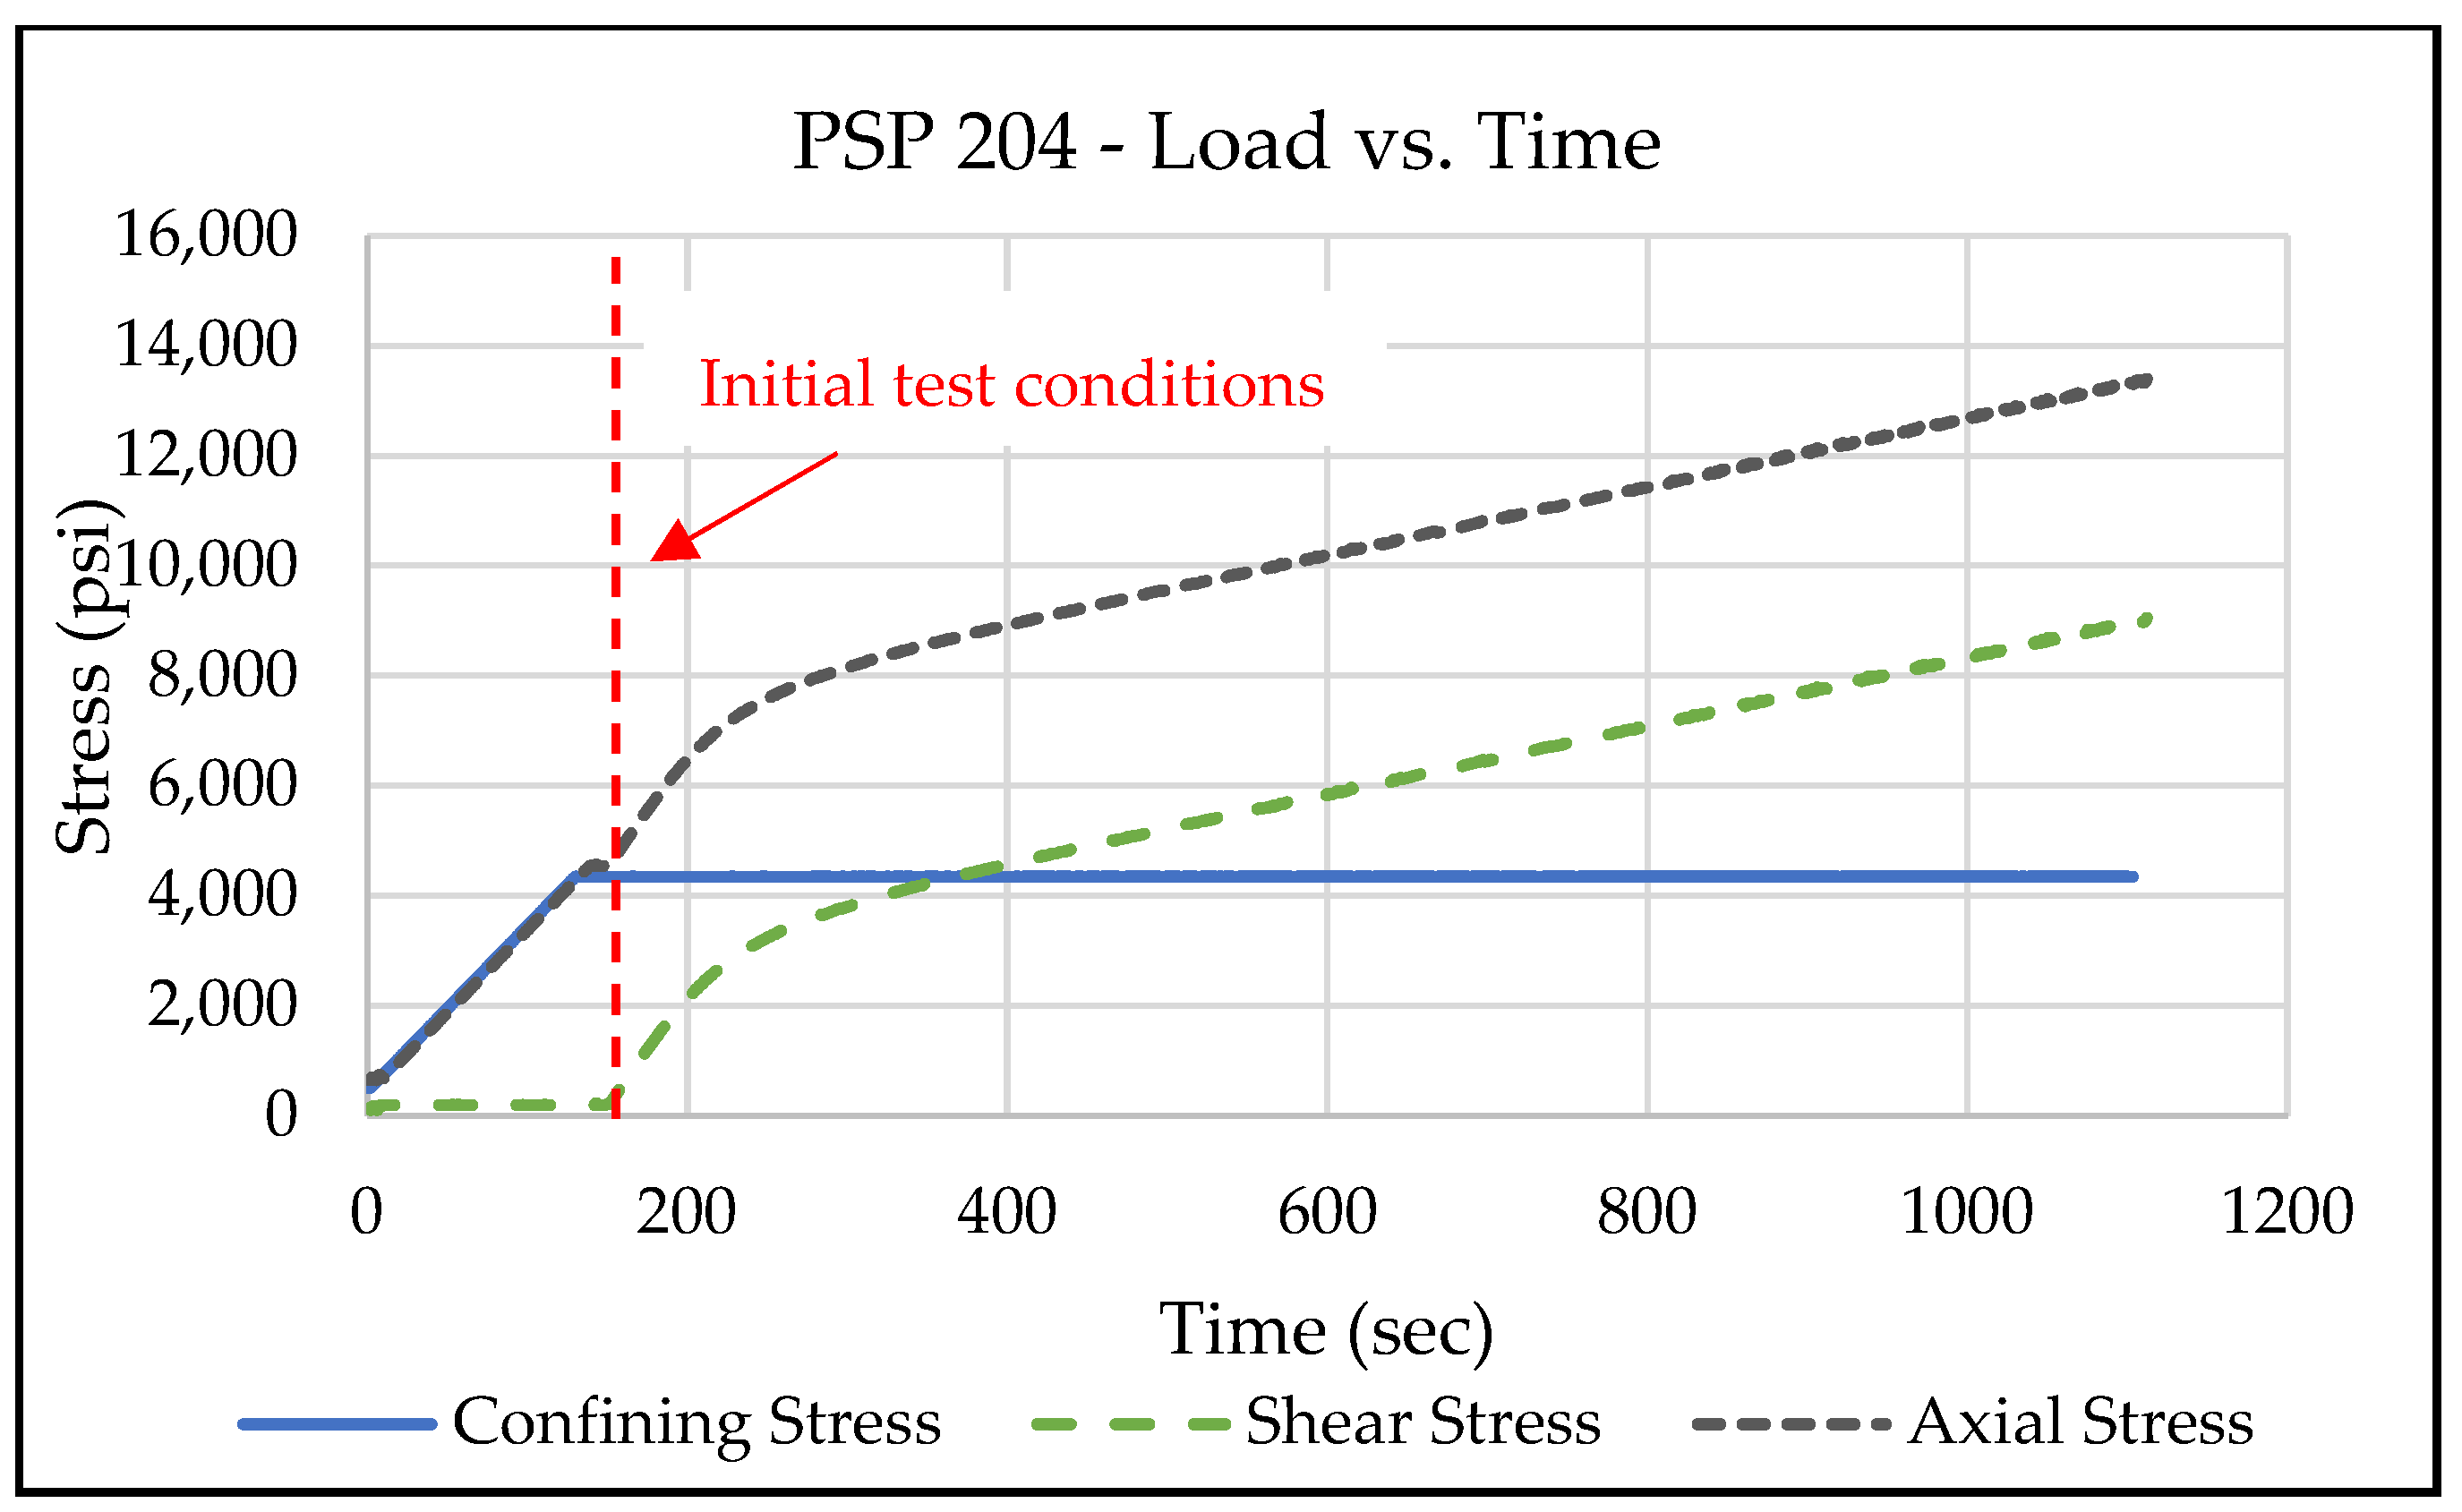
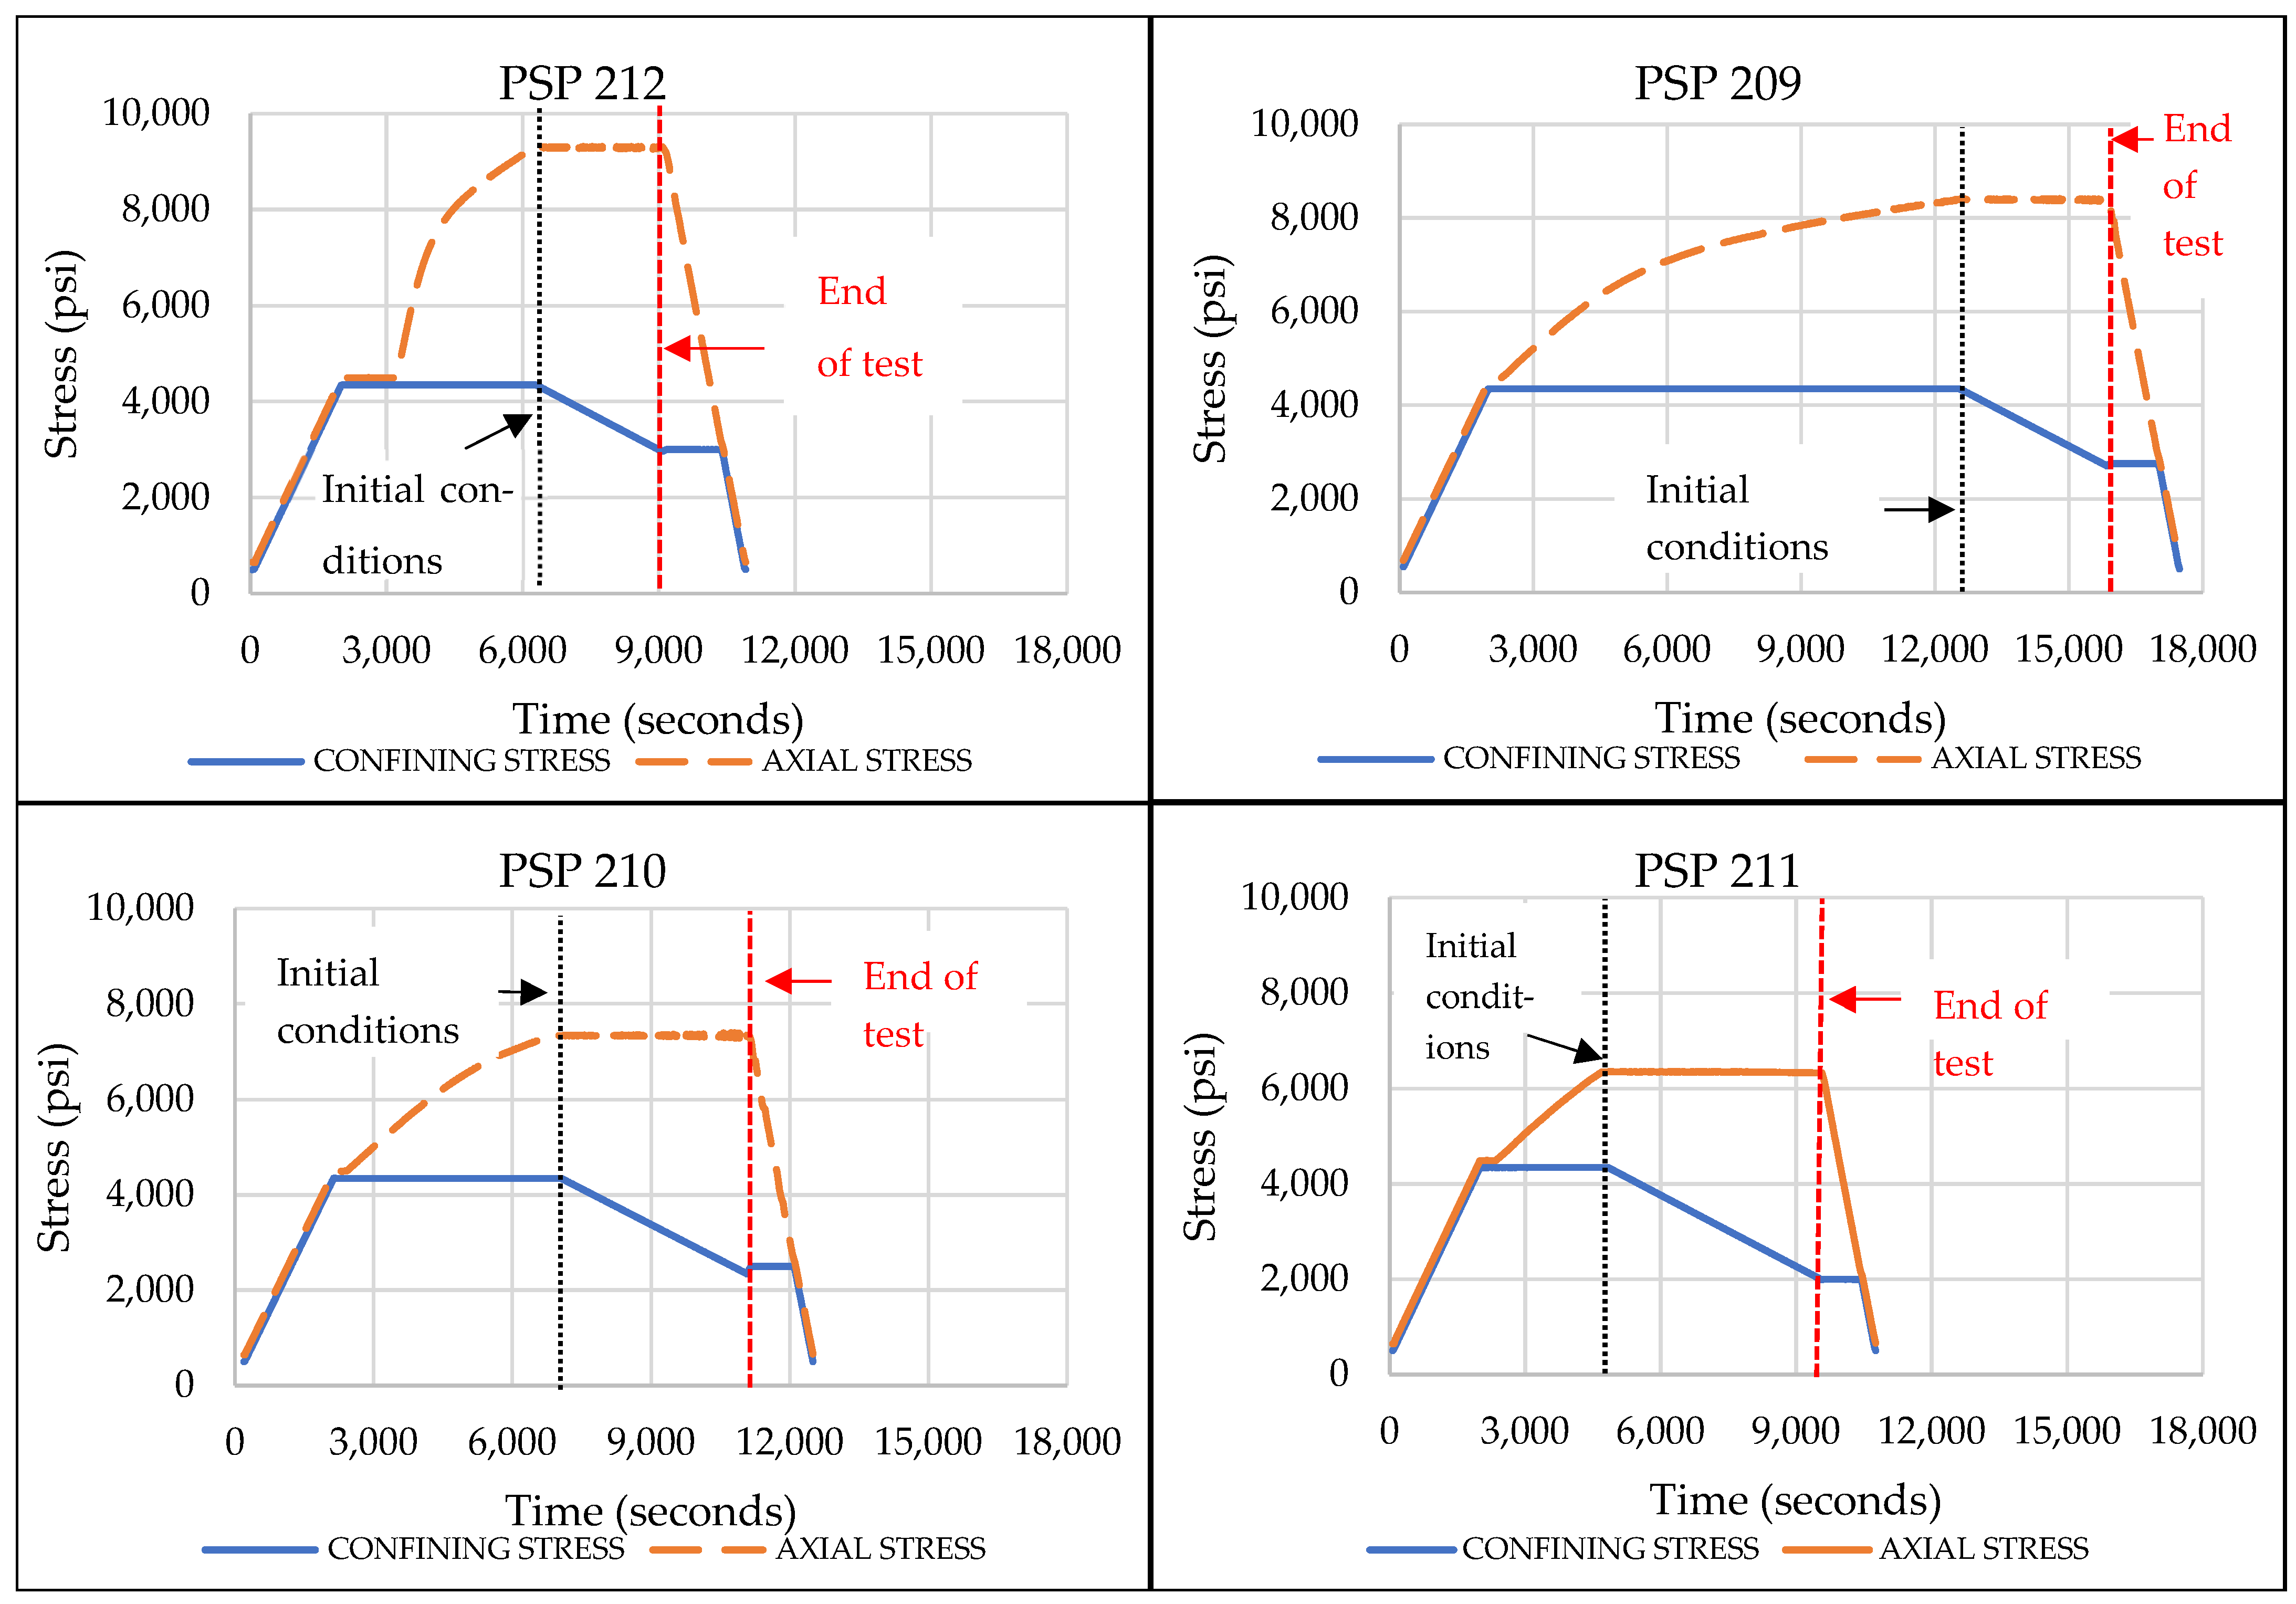
3.2.1. Constant Axial Stress Unloading Tests (CASUTs)

The first set of unloading-based tests examined is the constant axial stress unloading test (CASUT). CASUT was performed on four samples: PSP 212, PSP 209, PSP 210, and PSP 211. These twin samples were measured to map the unload yield surface from four initial stress points. The stress path used to reach these initial stress points is, again, a single-stage triaxial stress path, which consists of the following:
  • We start with the isostatic load to the confining stress of 4350 psi (30 MPa).
  • Then, a triaxial stress path is followed, and the sample is loaded to the specified initial axial stress point.
Table 2 summarizes the initial stress magnitudes of p’ and q for these four initial stress points and their corresponding applied axial (σ1) and confining (σ3) stresses. The axial stresses for the initial stress points are selected to have a uniform initial shear stress difference of ~1000 psi (6.9 MPa).
The unloading stress path to unload the sample involves decreasing the confining stress at 0.5 psi per second while keeping the axial stress constant until the axial strain gauges reach their measurement limit.
Figure 10 shows the load versus time plots for samples PSP 212, PSP 209, PSP 210, and PSP 211, showing the changes in axial and confining stress as we progress through the test.
Figure 11 shows the combined plot of stress paths for the constant axial stress tests (CASUTs) for four samples in the mean effective stress–shear stress space.

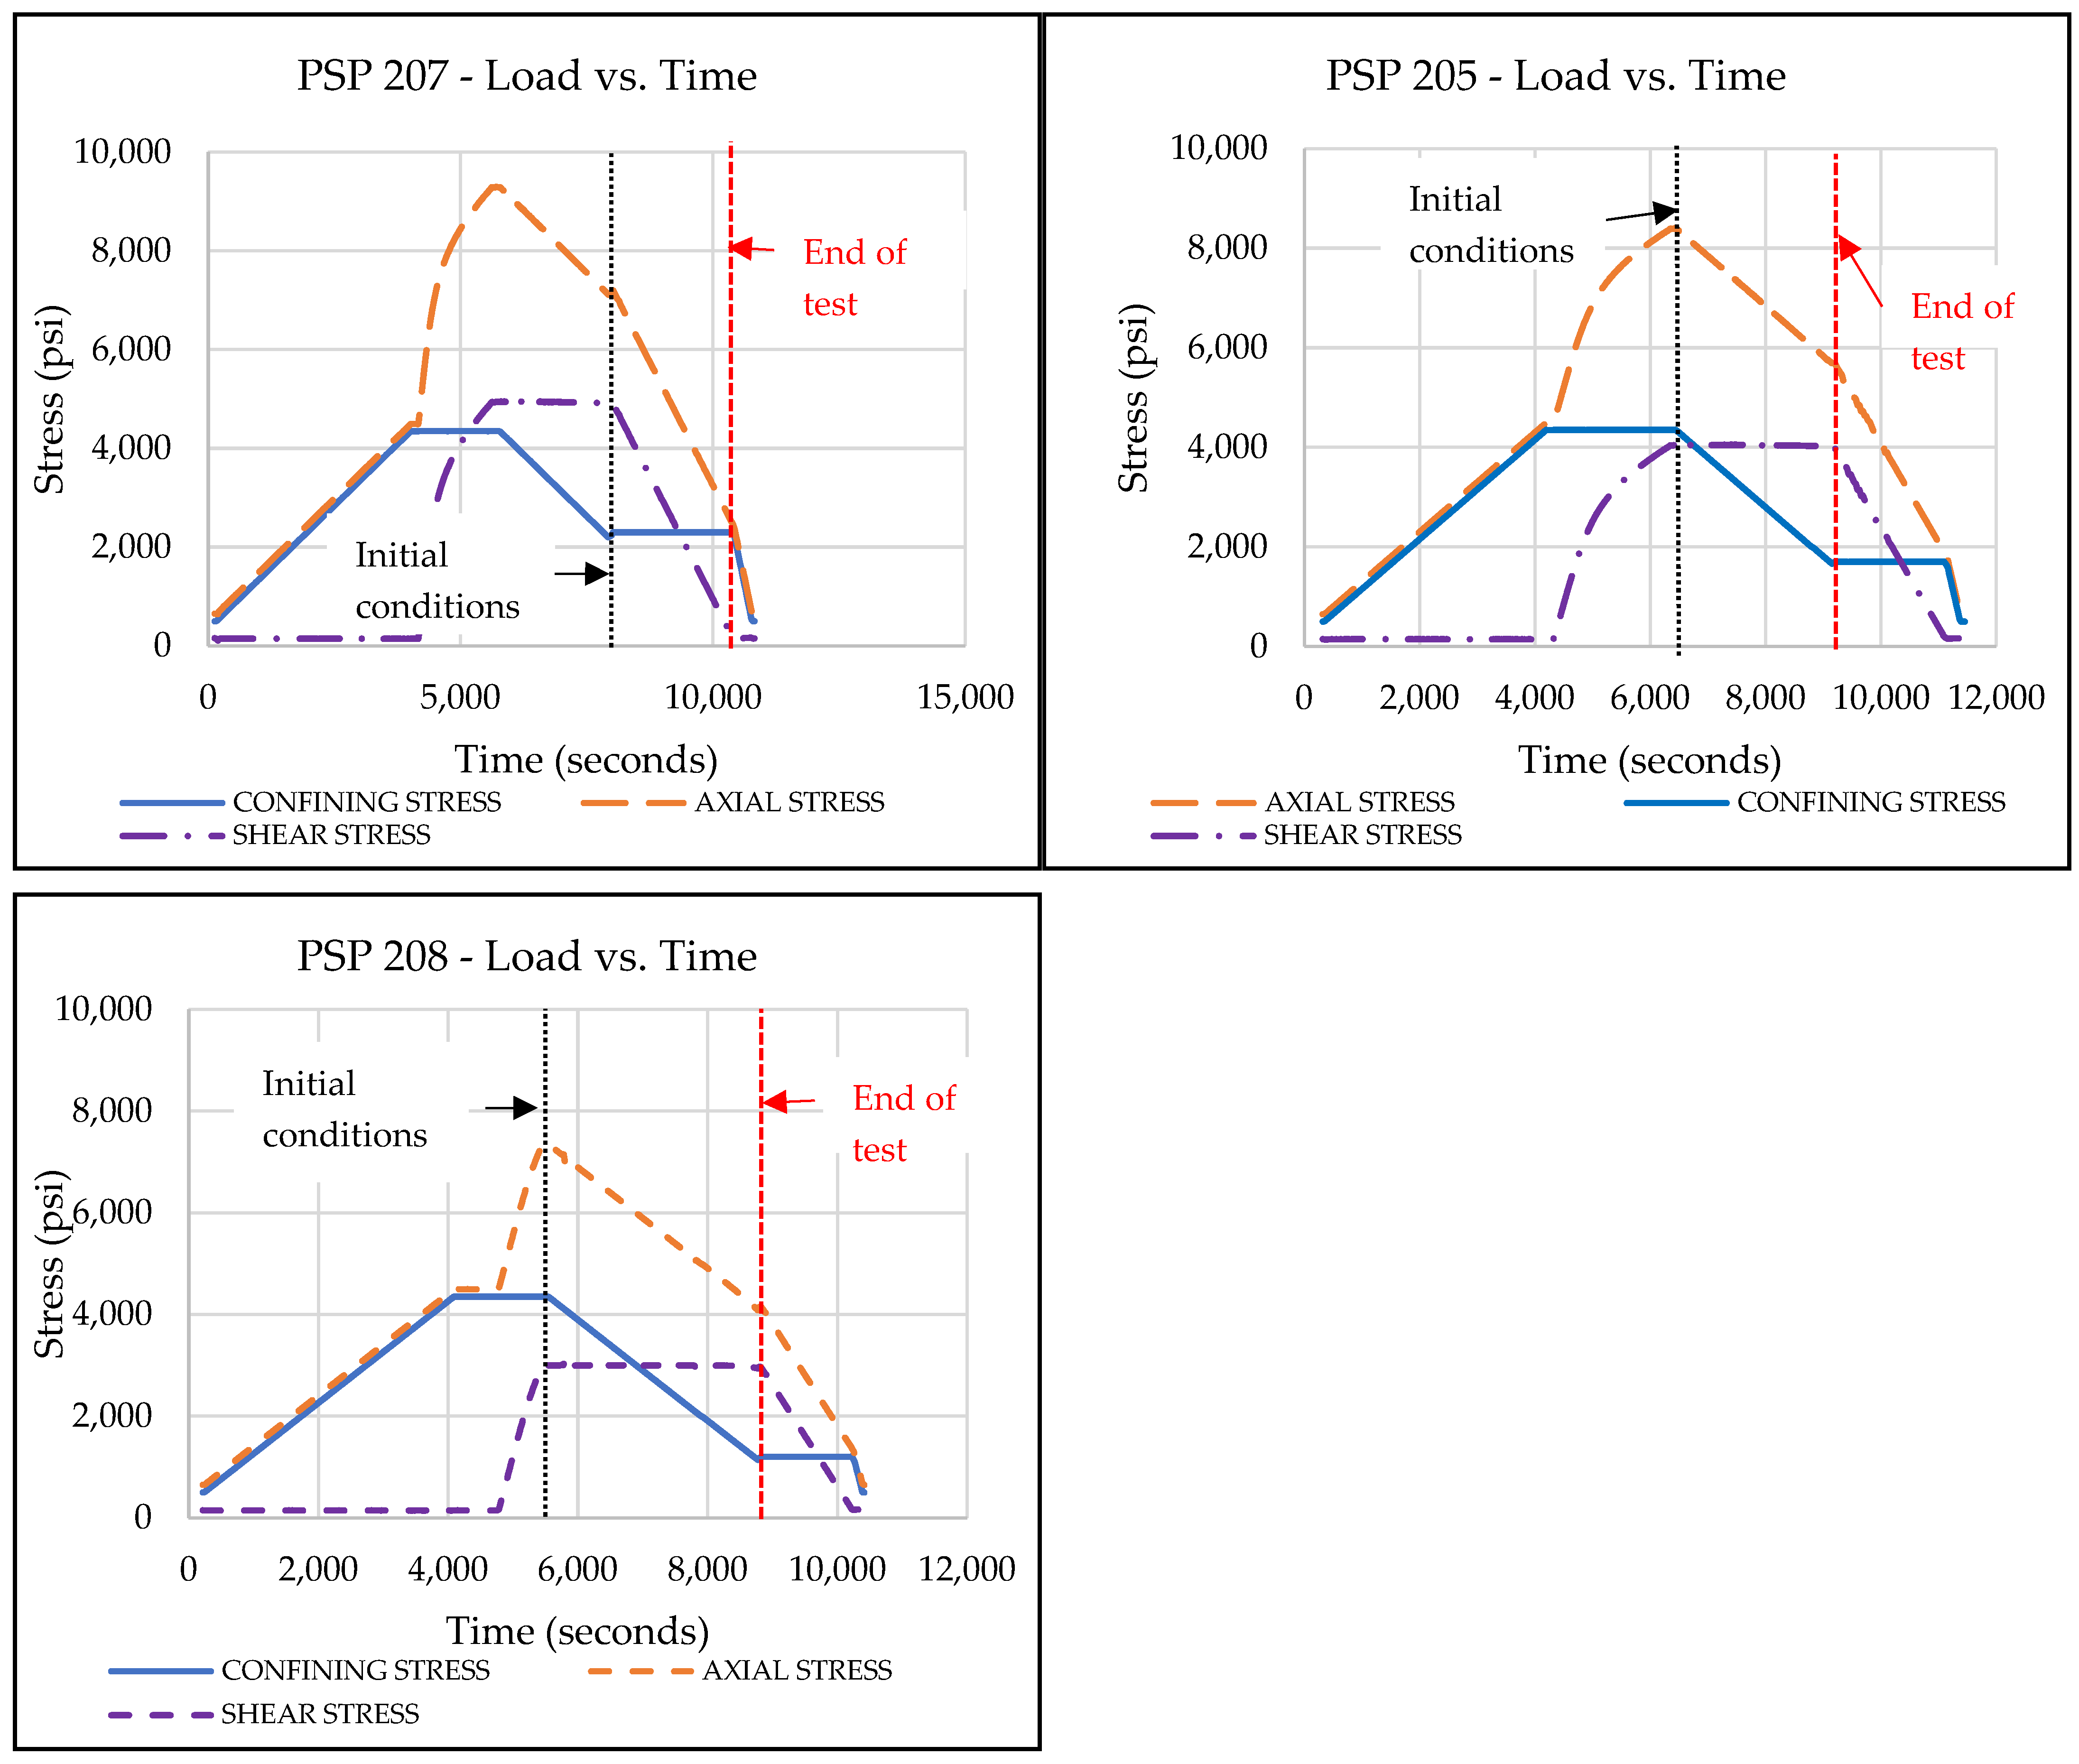
3.2.2. Constant Shear Stress Unloading Tests (CSSUTs)

Three constant shear stress unloading tests (CSSUTs) were performed on samples PSP 207, PSP 205, and PSP 208. These samples were tested to map the unload yield surface from three initial stress points. The stress path used to reach these initial stress points again follows the single-stage triaxial test.
Table 3 summarizes the initial stress magnitudes of p’ and q for these three initial stress points and their corresponding applied axial and confining stresses. The initial shear stresses of 4950 psi (34.13 MPa), 4050 psi (27.9 MPa), and 3000 psi (20.68 MPa) were chosen to have a uniform shear stress difference of ~1000 psi (6.9 MPa).
Once the sample has reached the desired initial stress point, the constant shear stress unloading stress path is as follows:
  • Unload the sample by decreasing the confining stress at 0.5 psi per second while keeping the shear stress constant. This is accomplished by controlling the axial load such that for a given confining stress change, the system maintains the shear stress constant.
  • Terminate the unloading test when the axial strain gauges reach their measurement limit.
Figure 12 shows load versus time plots for samples PSP 207, PSP 205, and PSP 208, showing the changes in axial stress, shear stress, and confining stress as we progress through the test.
Figure 13 shows the combined plot of stress paths for samples in the set of constant shear stress unloading tests.

4. Data Analysis

In this section, we will detail the sample response to the stress paths mentioned in the previous section. We will characterize the samples’ response in loading and unloading-based tests, and then compare both yield surface types.

4.1. Loading-Based Triaxial Tests

As described in the previous section, one multi-stage triaxial test and one single-stage triaxial test were performed on two samples to map the loading-based triaxial yield surface.

4.1.1. Multi-Stage Triaxial Test Analysis

Figure 14 shows a stress–strain plot of the sample under the four triaxial stages of the multi-stage triaxial test. Figure 15 shows a stress-strain plot of the single-stage triaxial test. Individual loading stages were unloaded when the sample reached the point of positive dilatancy [41]. Figure 16 shows the values of the tangent strain ratio during each stage. When the sample reaches the point of positive dilatancy, i.e., when the tangent strain ratio reaches 0.5, the sample is unloaded. The value of shear stress at the point of unloading is selected as the yield stress to map the loading yield surface.
Figure 17 plots the yield points in the Mohr–Coulomb plane to obtain the equivalent Mohr–Coulomb yield surface. For this research work, we also have intermediate stress values since the equipment applies radial (including both horizontal stresses) and axial stress. Therefore, we used a Drucker–Prager criterion to evaluate yield surfaces. On a mean effective stress–shear stress plane, the loading-based yield surface is shown in Figure 18. It is approximated to be a straight line passing through the origin with a slope of 1.07.

4.1.2. Single-Stage Triaxial Test Analysis

As mentioned in Section 2, a single-stage triaxial test with a confining stress of 4350 psi (30 MPa) was performed to validate the multi-stage triaxial test. Figure 15 shows the stress–strain plot of the single-stage triaxial test. The sample was loaded until the strain gauges reached their limit. As can be seen from the plot, a ductile failure with work hardening [2] occurs. Figure 16 shows the evolution of the tangent strain ratio with applied shear stress. The yield stress value at the positive dilatancy point is 7400 psi (51 MPa).

4.1.3. Summary Analysis of Loading-Based Triaxial Tests

In this section, the loading-based yield surface is mapped from both the multi-stage and the single-stage triaxial tests. Figure 16 shows a plot of the tangent strain ratio and shear stress for each stage of the multi-stage and single-stage triaxial tests. The yield stress points are selected from this plot to map the loading-based triaxial yield surface. Figure 17 shows the Mohr–Coulomb envelope of the combined yield points for the loading-based tests. The sample has a friction angle of ~27.6 degrees with nearly zero cohesion. This is expected for an unconsolidated sand sample.
Figure 18 shows the combined yield points on the Drucker–Prager plane. The yield point of the single-stage triaxial test aligns with the data from the multi-stage triaxial test, validating the use of the multi-stage triaxial test for measuring the strength properties of unconsolidated sands.
Previous work published by Hamoud [26], Oldakowski [27], and Touhidi [28], among others, was in low stress regimes (<250 psi or 1.7 MPa mean effective stress), primarily investigating the Alberta oil sands. The current work focuses on much higher stress magnitudes (~4000 psi or 27.6 MPa mean effective stress), which is one order of magnitude higher than the previous work. A comparison of prior work and current work is shown in Figure 19.

4.2. Unloading-Based Triaxial Tests

This research performed seven unloading-based tests with two different stress paths: four constant axial stress tests (CASUTs) and three constant shear stress tests (CSSUTs). A yield surface was mapped for each stress path, and then all the yield surfaces were compared.

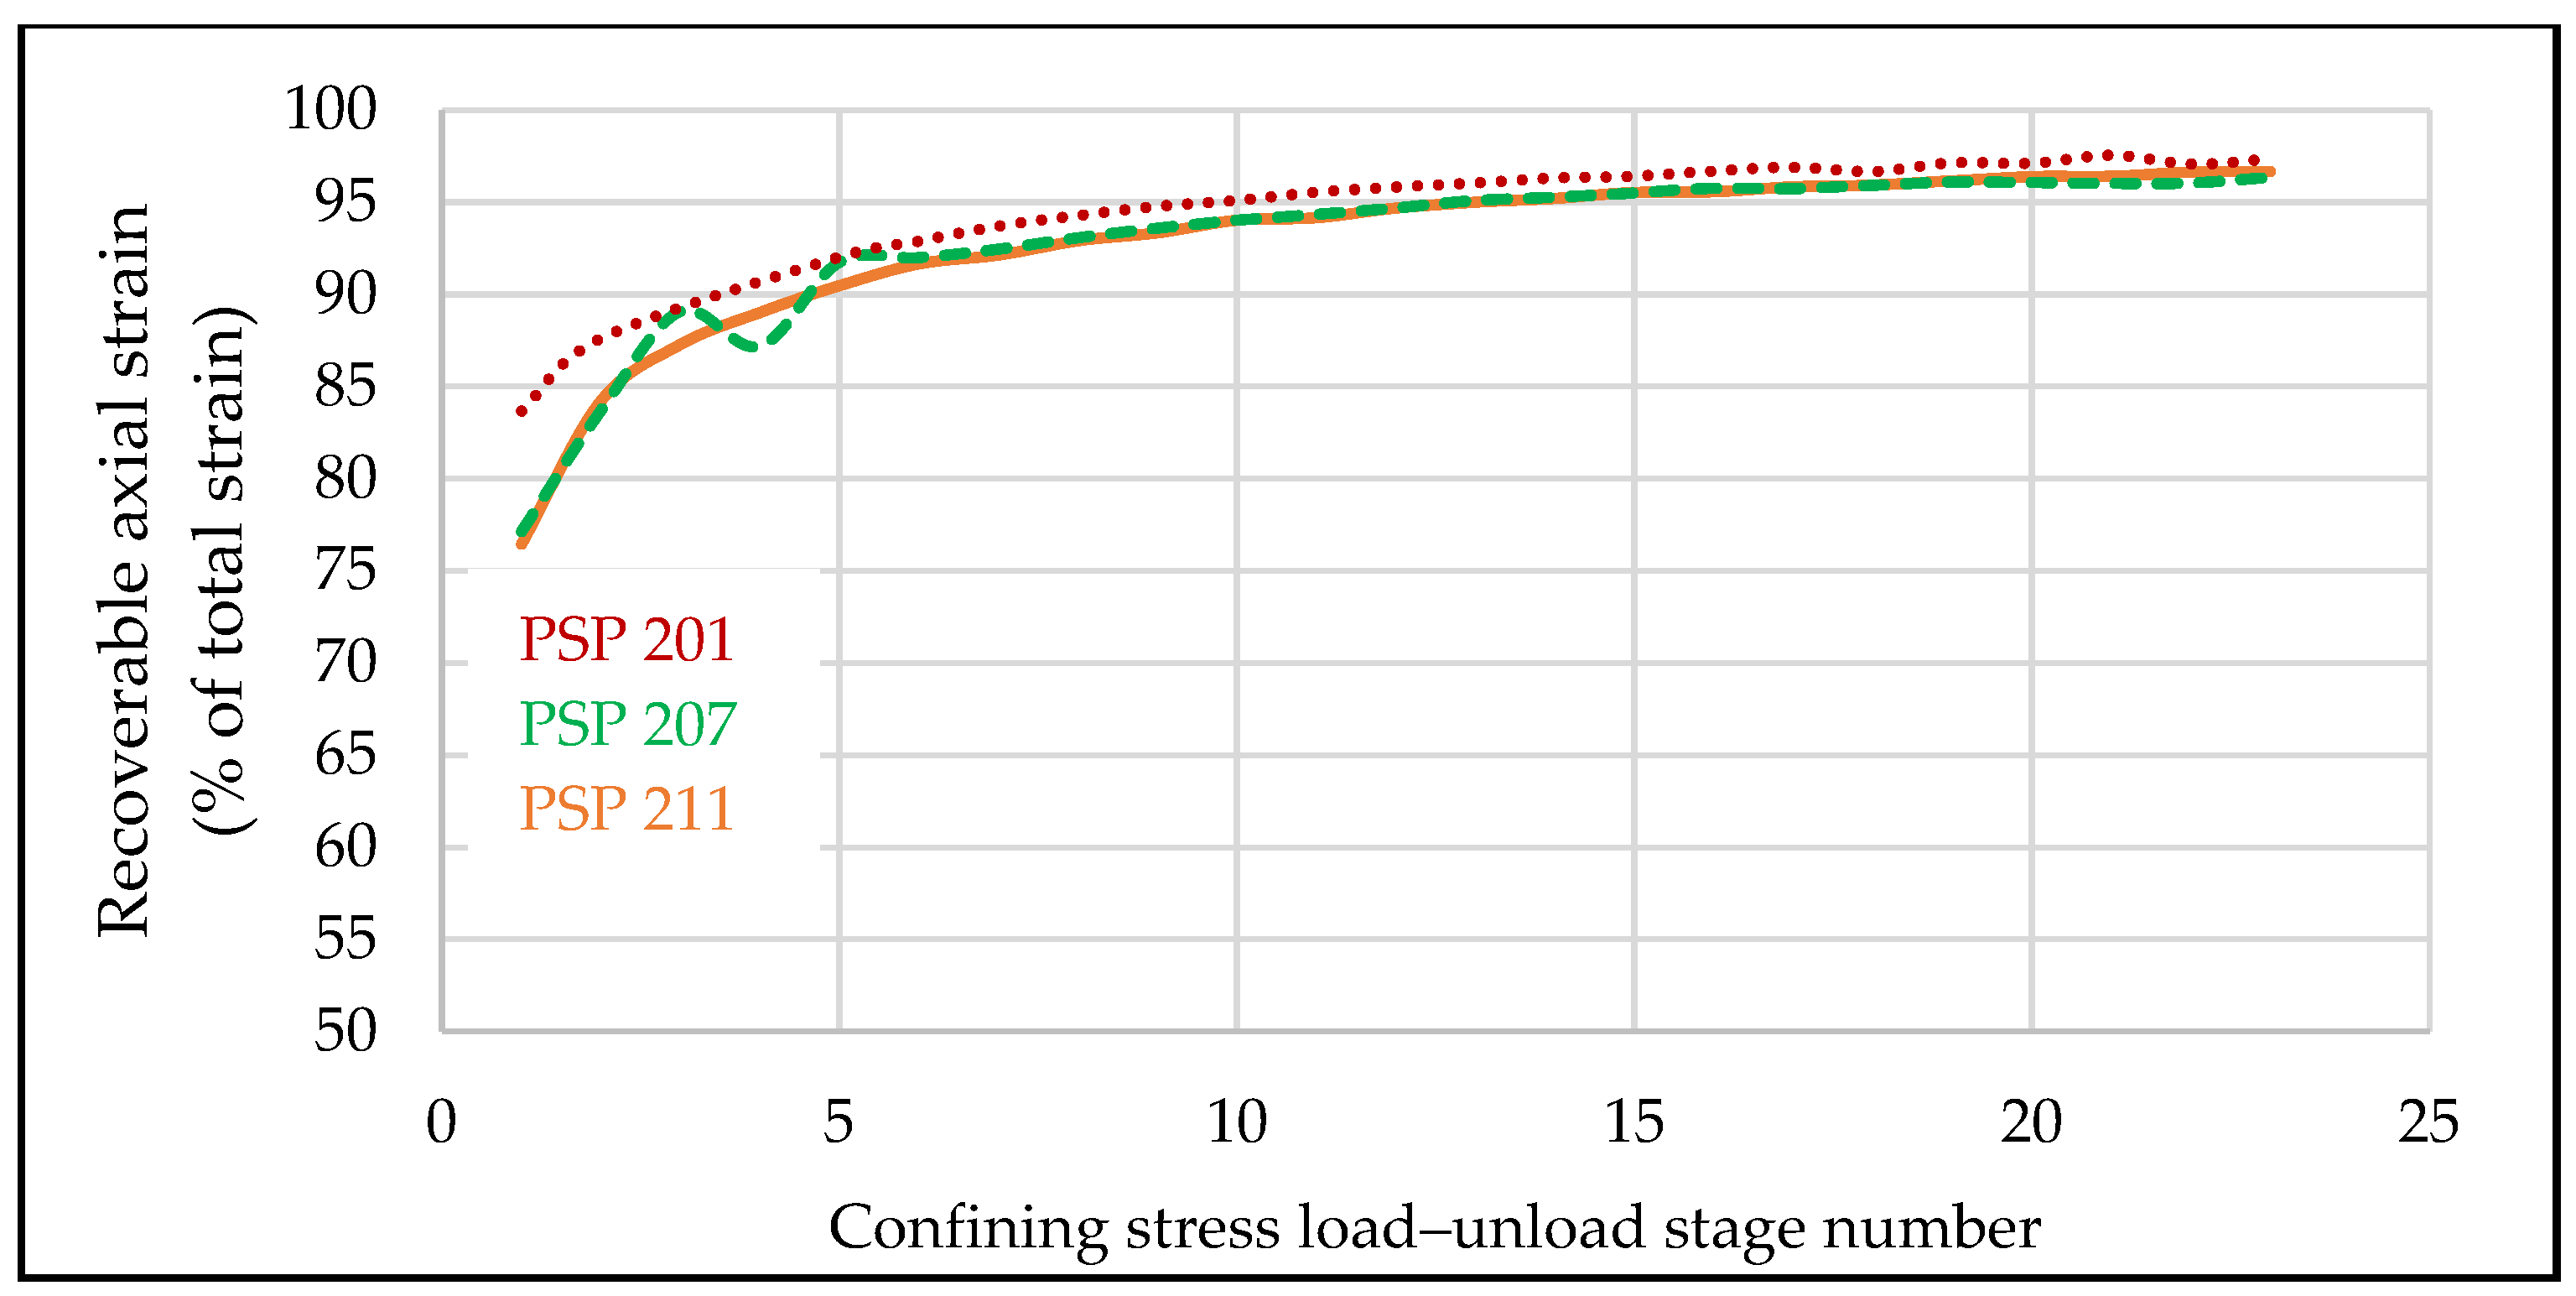
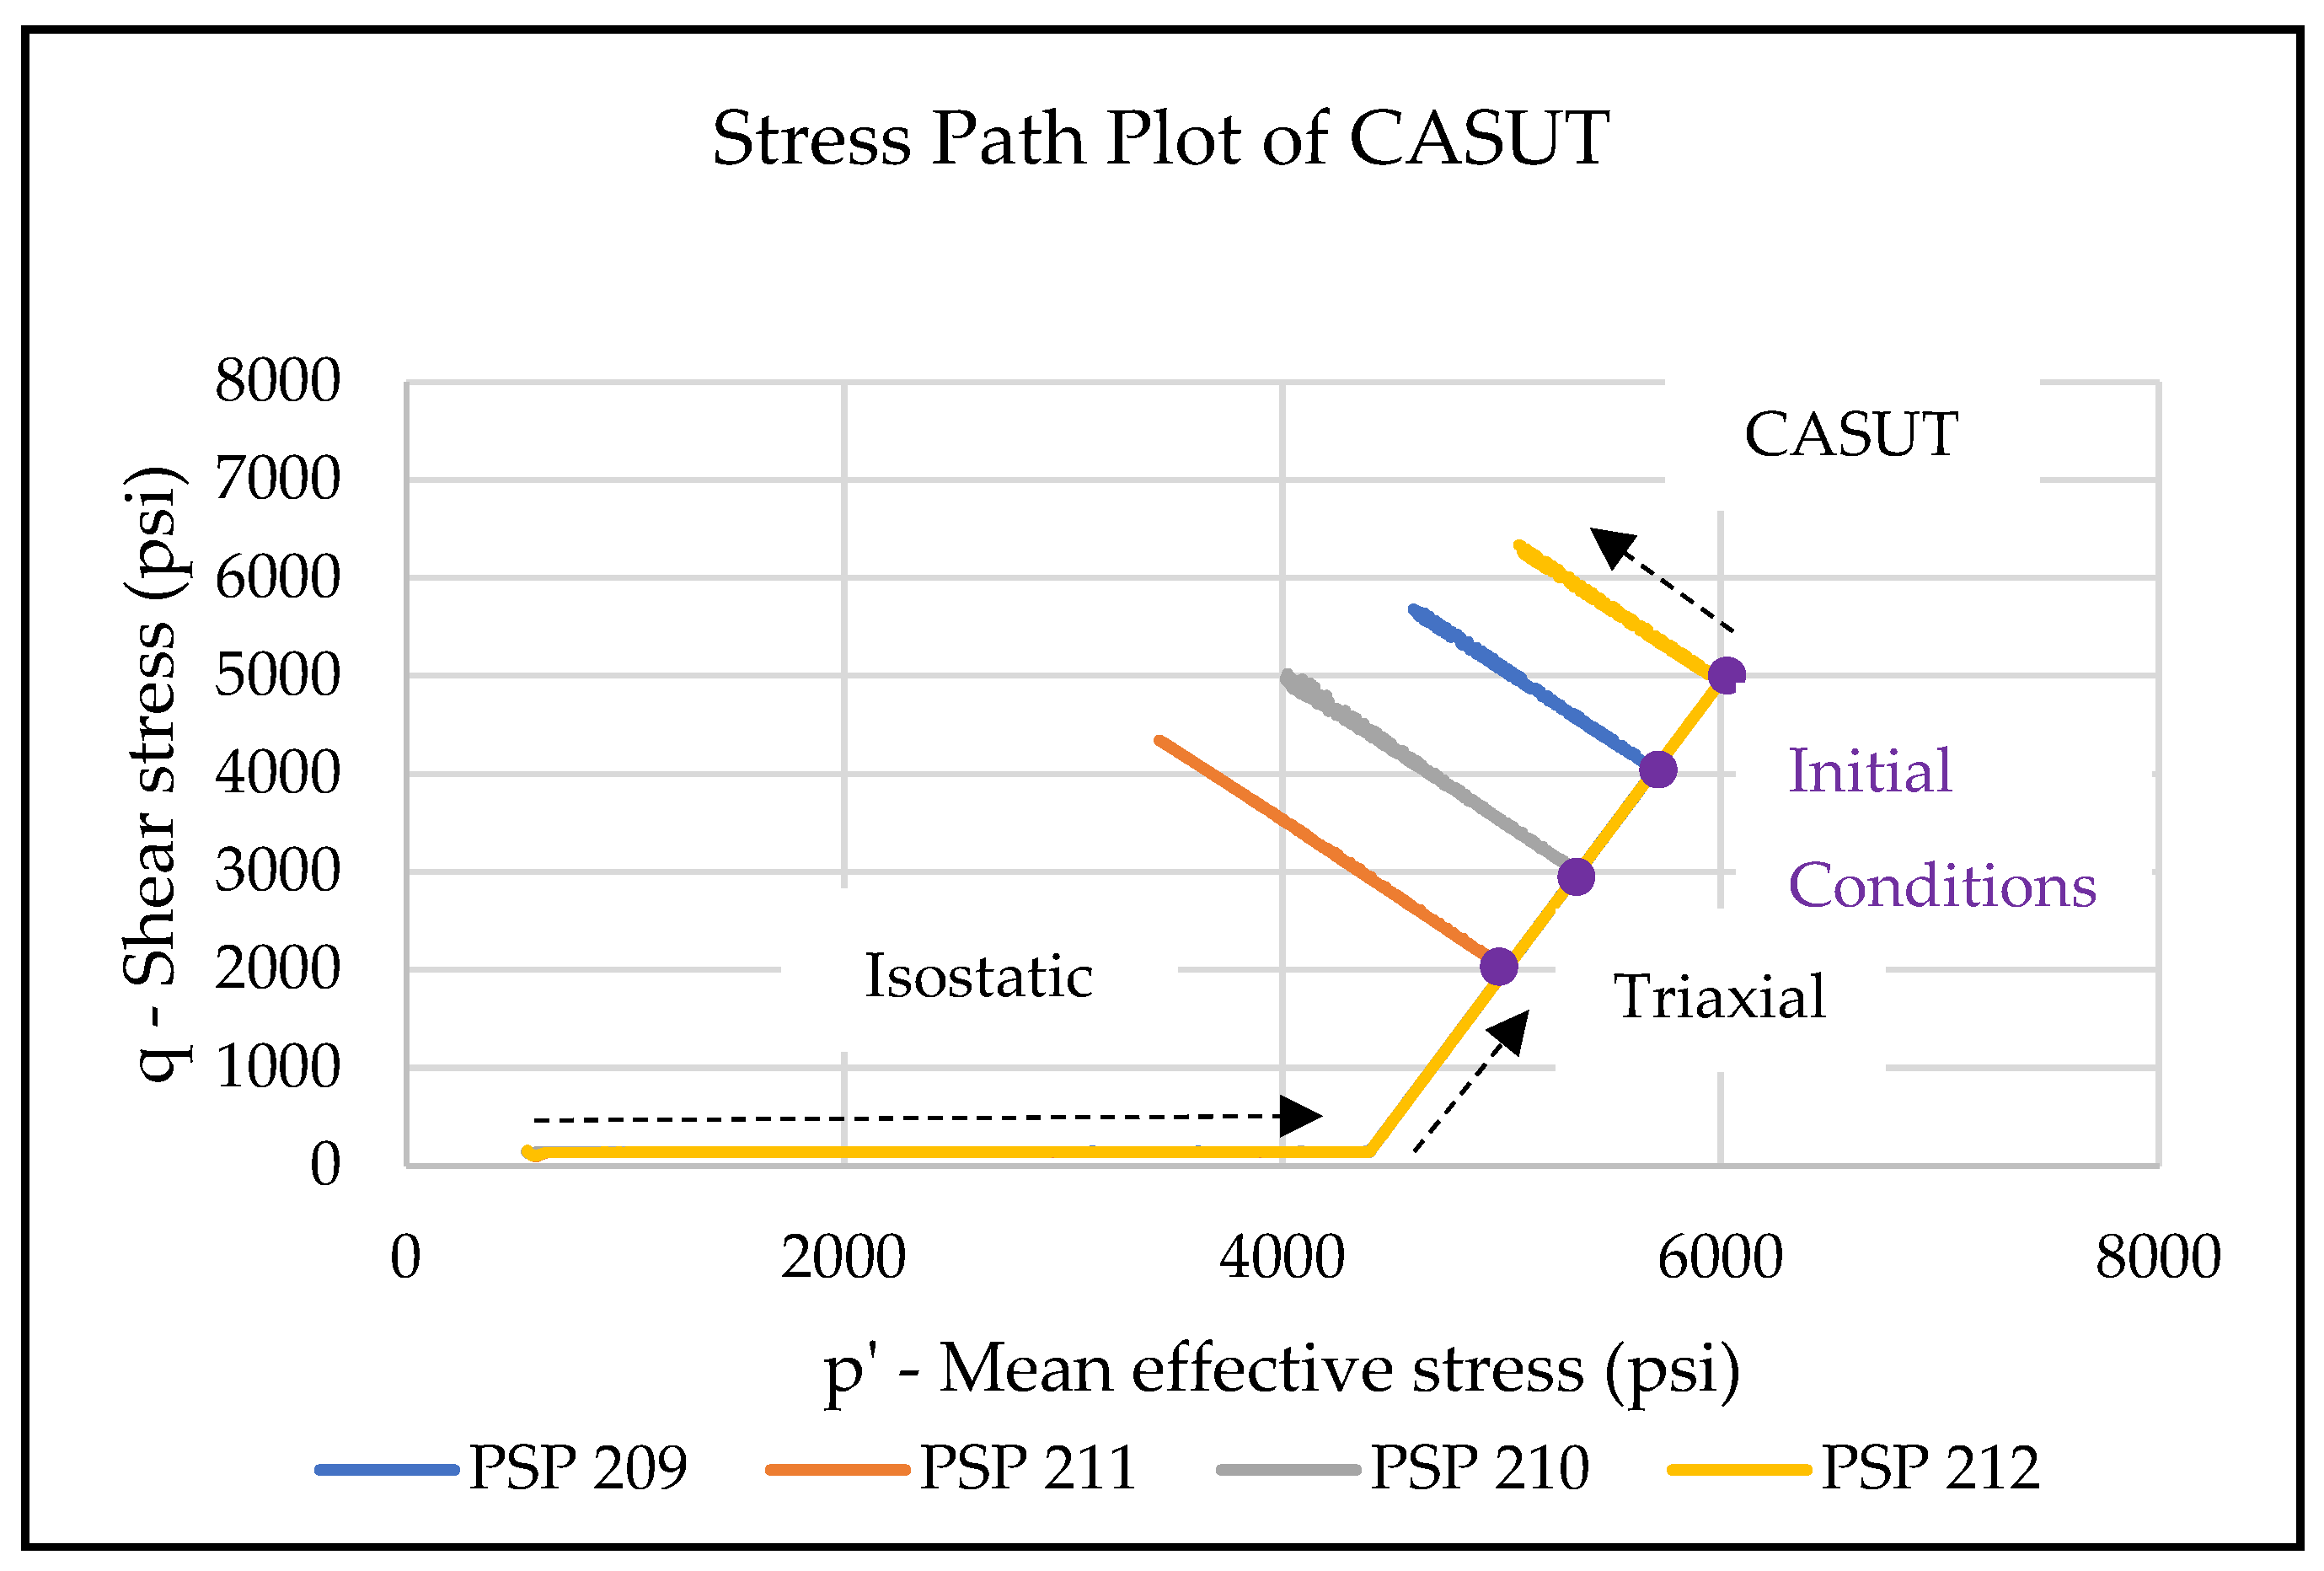
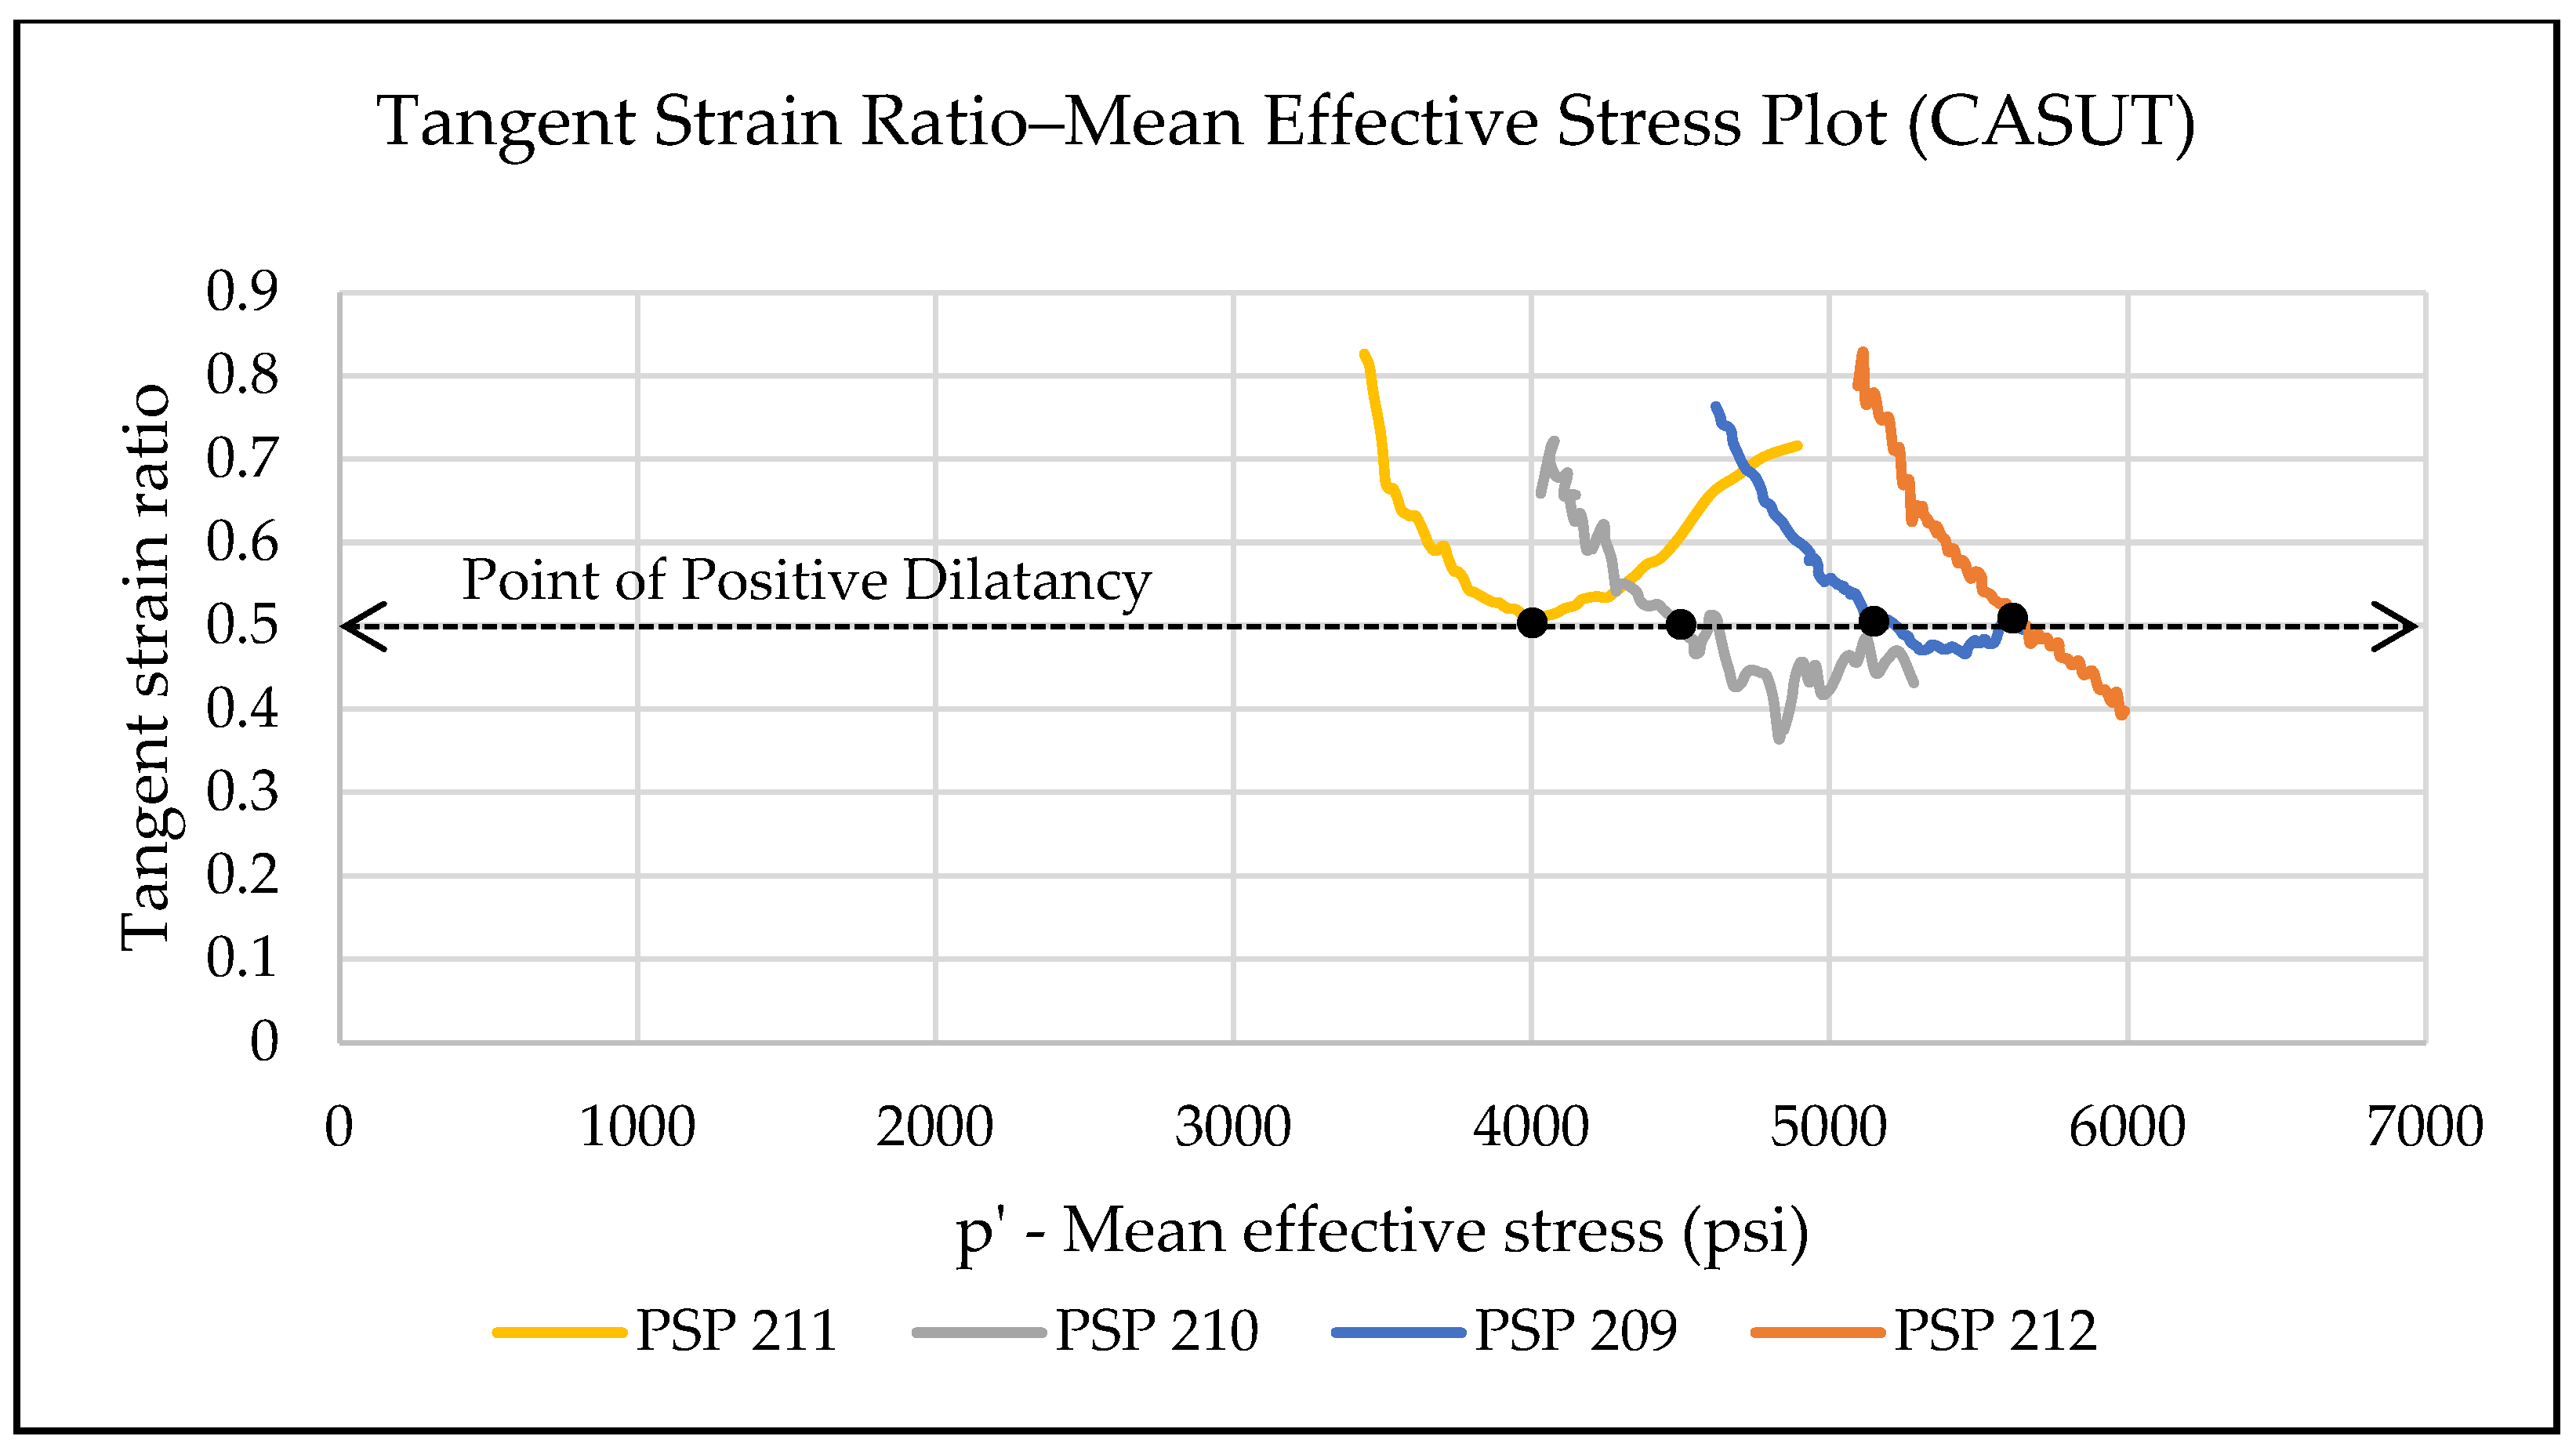
4.2.1. Constant Axial Stress Unloading Tests (CASUTs) Analysis

The constant axial stress unloading tests are performed by decreasing the confining stress while keeping the axial stress constant. Therefore, the shear stress increases as the test progresses. Figure 20 shows the combined plot of shear stress vs. axial strain for the four tests. Each test has different initial conditions, which can be seen from each sample’s starting value of shear stress.
Since the mean effective stress decreases with decreasing confining stress, a more appropriate stress–strain plot is the mean effective stress vs. volume strain plot, which captures the sample’s volumetric behavior. Figure 21 shows the plot of mean effective stress and volume strain. Volume strain shows a distinct change in slope for each sample.
The yield criterion used to pick yield points in this set of tests is the same as that of loading-based triaxial tests—the point of positive dilatancy. Figure 22 shows the combined plot of the tangent strain ratio and mean effective stress for all samples in this set. All samples pass through the point of positive dilatancy except for the test with the lowest initial shear stress (PSP 211). This type of behavior—starting out with a high tangent strain ratio and decreasing until it starts to increase again—is seen in all samples except for PSP 212 (the highest initial shear stress). An explanation for this observation is as follows:
  • An increase in the initial value of mean effective stress makes the sample stronger (it can support more additional load), whereas an increase in the initial value of shear stress makes the sample weaker (it can support less additional load).
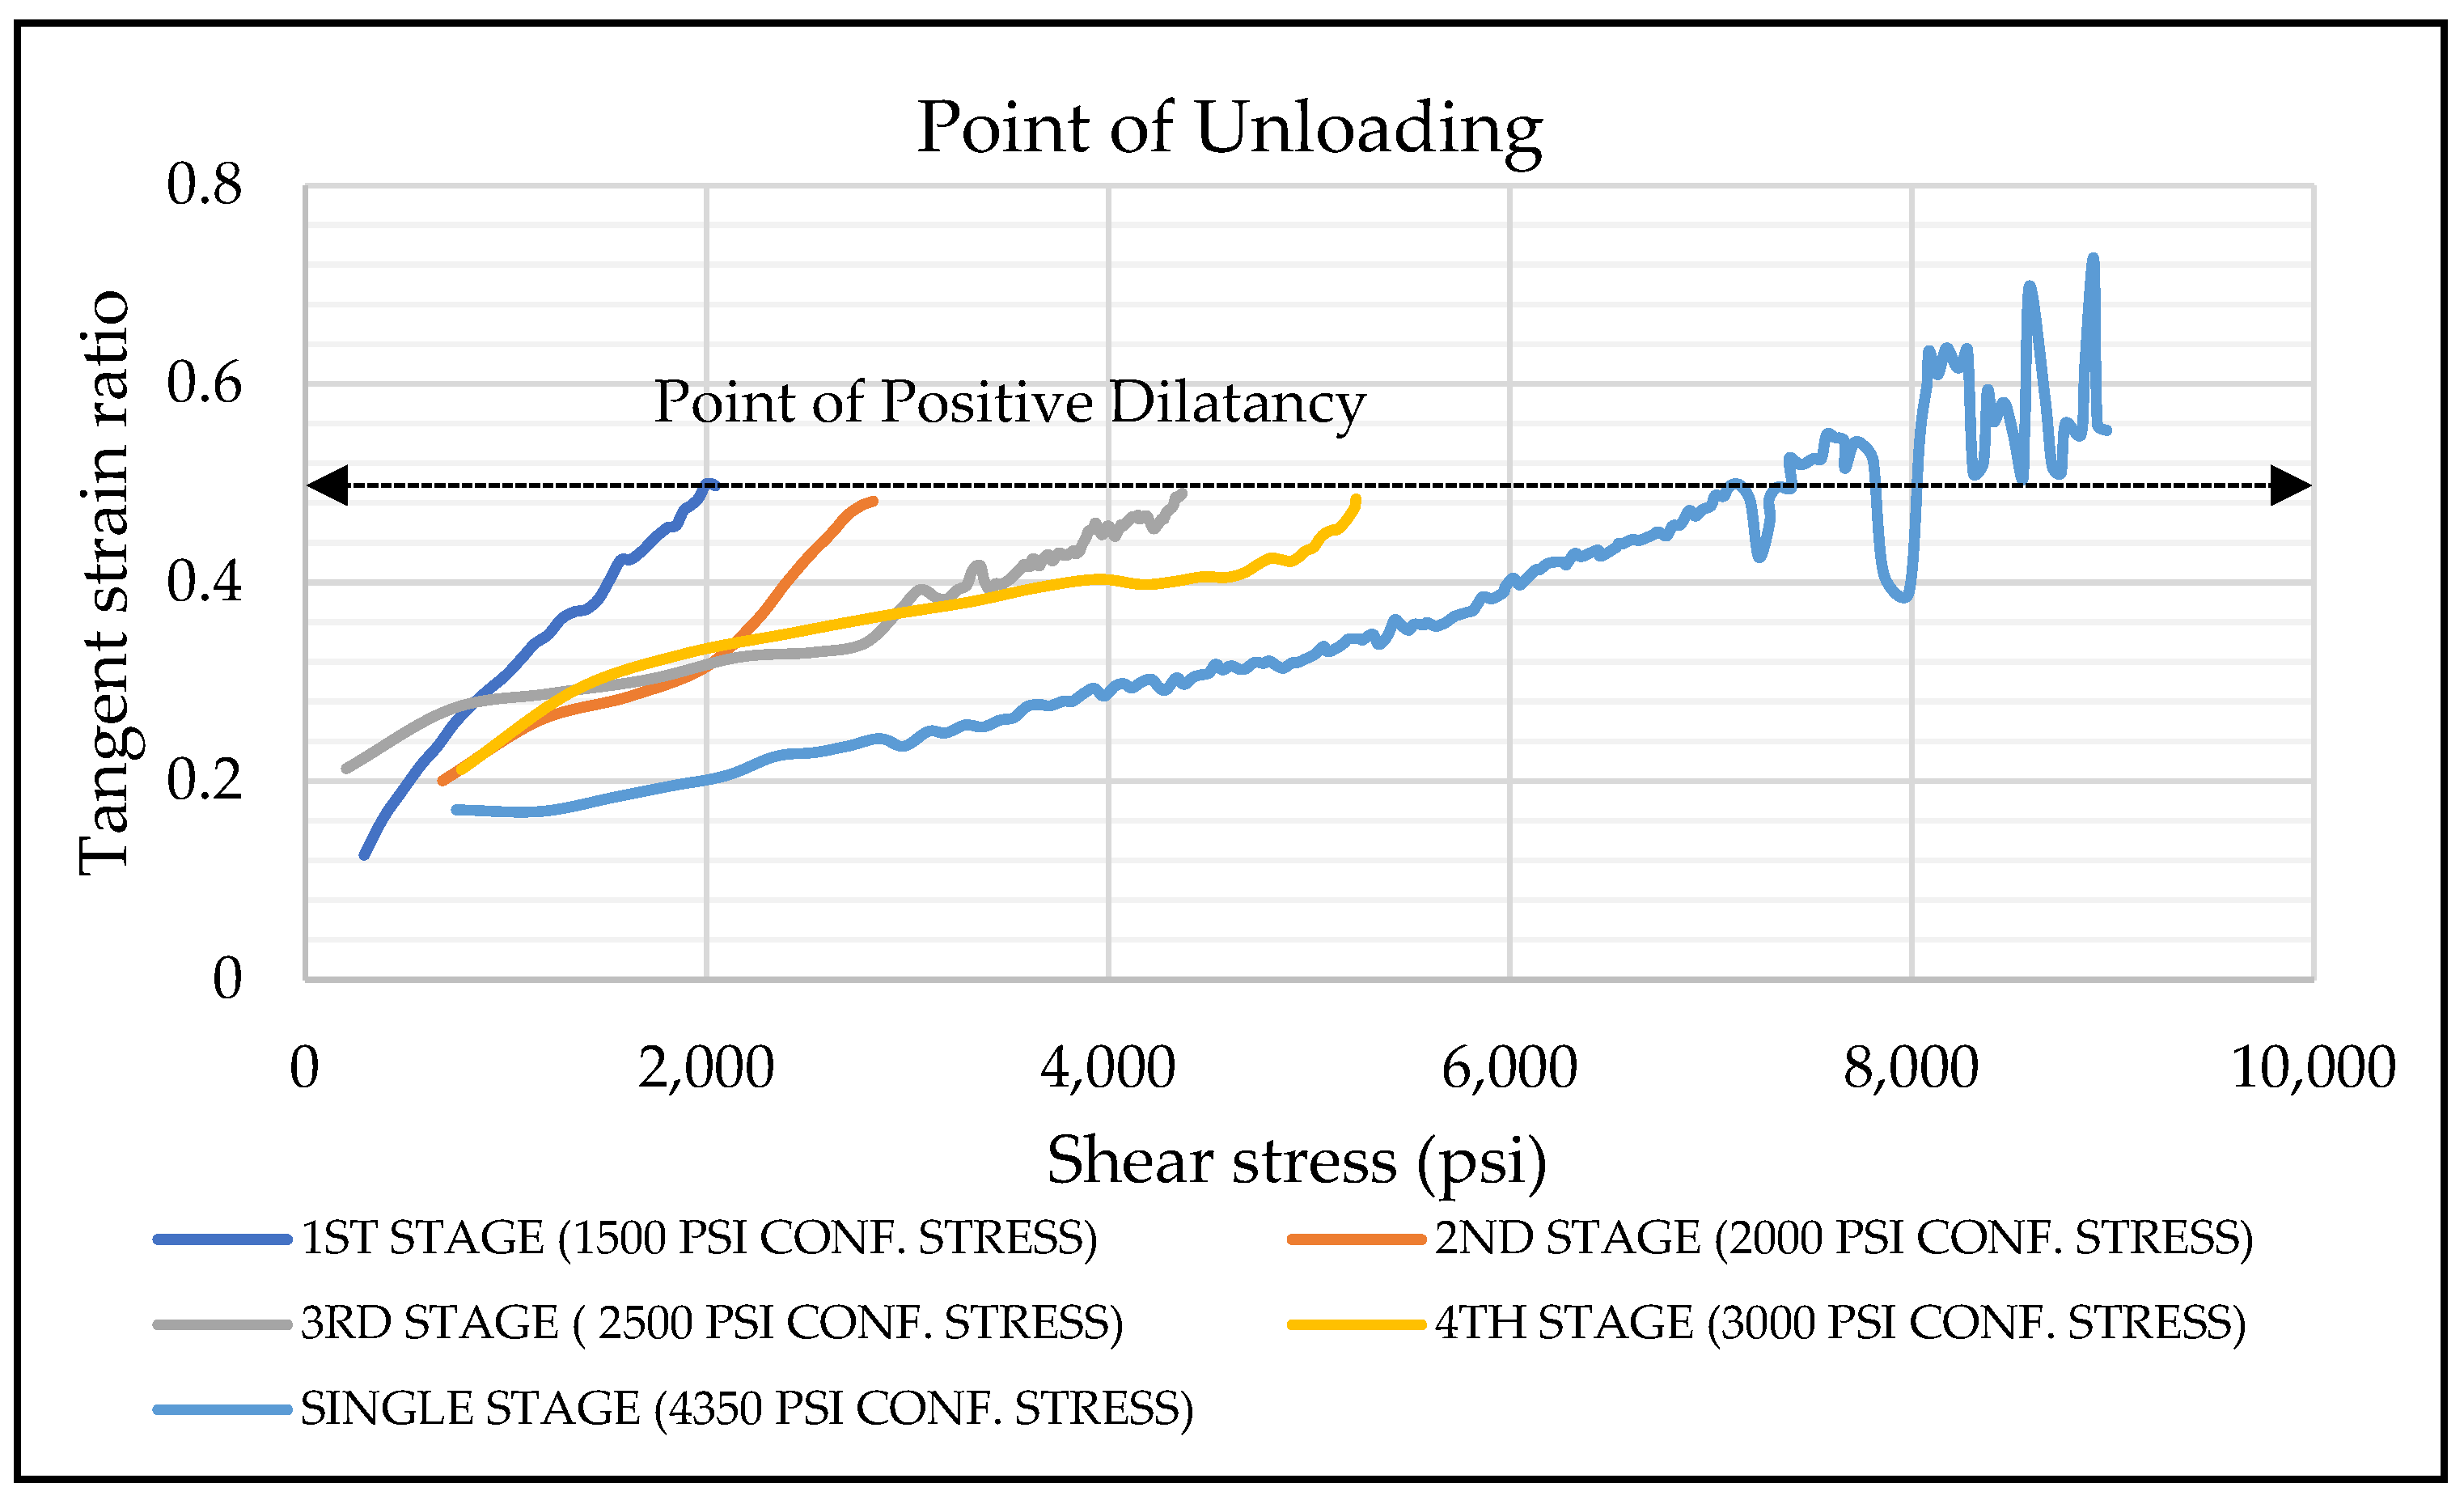
  • If the initial stress state of the sample is closer to the yield surface, the sample behaves similarly to PSP 212. It would start with a low value of tangent strain ratio and monotonically increase to the point of positive dilatancy and beyond.
  • If the sample’s initial stress state is farther away, the applied mean effective stress is higher than the required mean effective stress to support the applied shear stress. Reducing the mean effective stress does not affect the sample response. The sample behaves as if it is unloading in both directions, and the tangent strain ratio decreases.
  • At some point during the unloading test, the mean effective stress reaches a point where the value of the mean effective stress is no longer higher than the required mean effective stress to support the applied shear stress. At this point, the tangent strain ratio changes direction and starts to increase.
This increase in tangent strain ratio takes place through the rest of the loading cycle where the sample continues to deform to sustain the increasing shear stress applied with a reduction in mean effective stress.
The yield points used to map the unloading-based constant axial stress yield surface are inferred from the point of positive dilatancy. This point is also closely matched with the point of maximum curvature in the volume strain behavior (Figure 21).
Figure 23 shows the yield points from the constant axial stress tests mapped on a Mohr–Coulomb plane. The yield surface has a friction angle of 29.3 degrees with an intercept of ~−600 psi (4.14 MPa). The friction angle values obtained from the triaxial loading tests (Figure 17) equal those of constant axial stress unloading tests (within experimental error). However, the values of the intercepts are different for both sets of tests. Since the unloading tests have not been performed at zero mean stress values, the negative intercept value may not be cohesion. The intercept values are used to describe the yield surface geometrically (using a slope and an intercept).
The yield points are plotted in the Drucker–Prager stress space as shown in Figure 24. The slope of the unloading-based constant axial stress yield surface is 1.07. Similarly, to the observation with the Mohr–Coulomb plot, the slope is similar to that of the triaxial loading-based yield surface. However, the intercept differs from the triaxial loading-based yield surface.
The yield surface characteristics obtained from this suite of tests can be interpolated with the upper and lower bounds of the test conditions. However, extrapolating the yield surface to the lower stress values near the origin has to be substantiated with additional experimental observations before we can do so with high confidence.

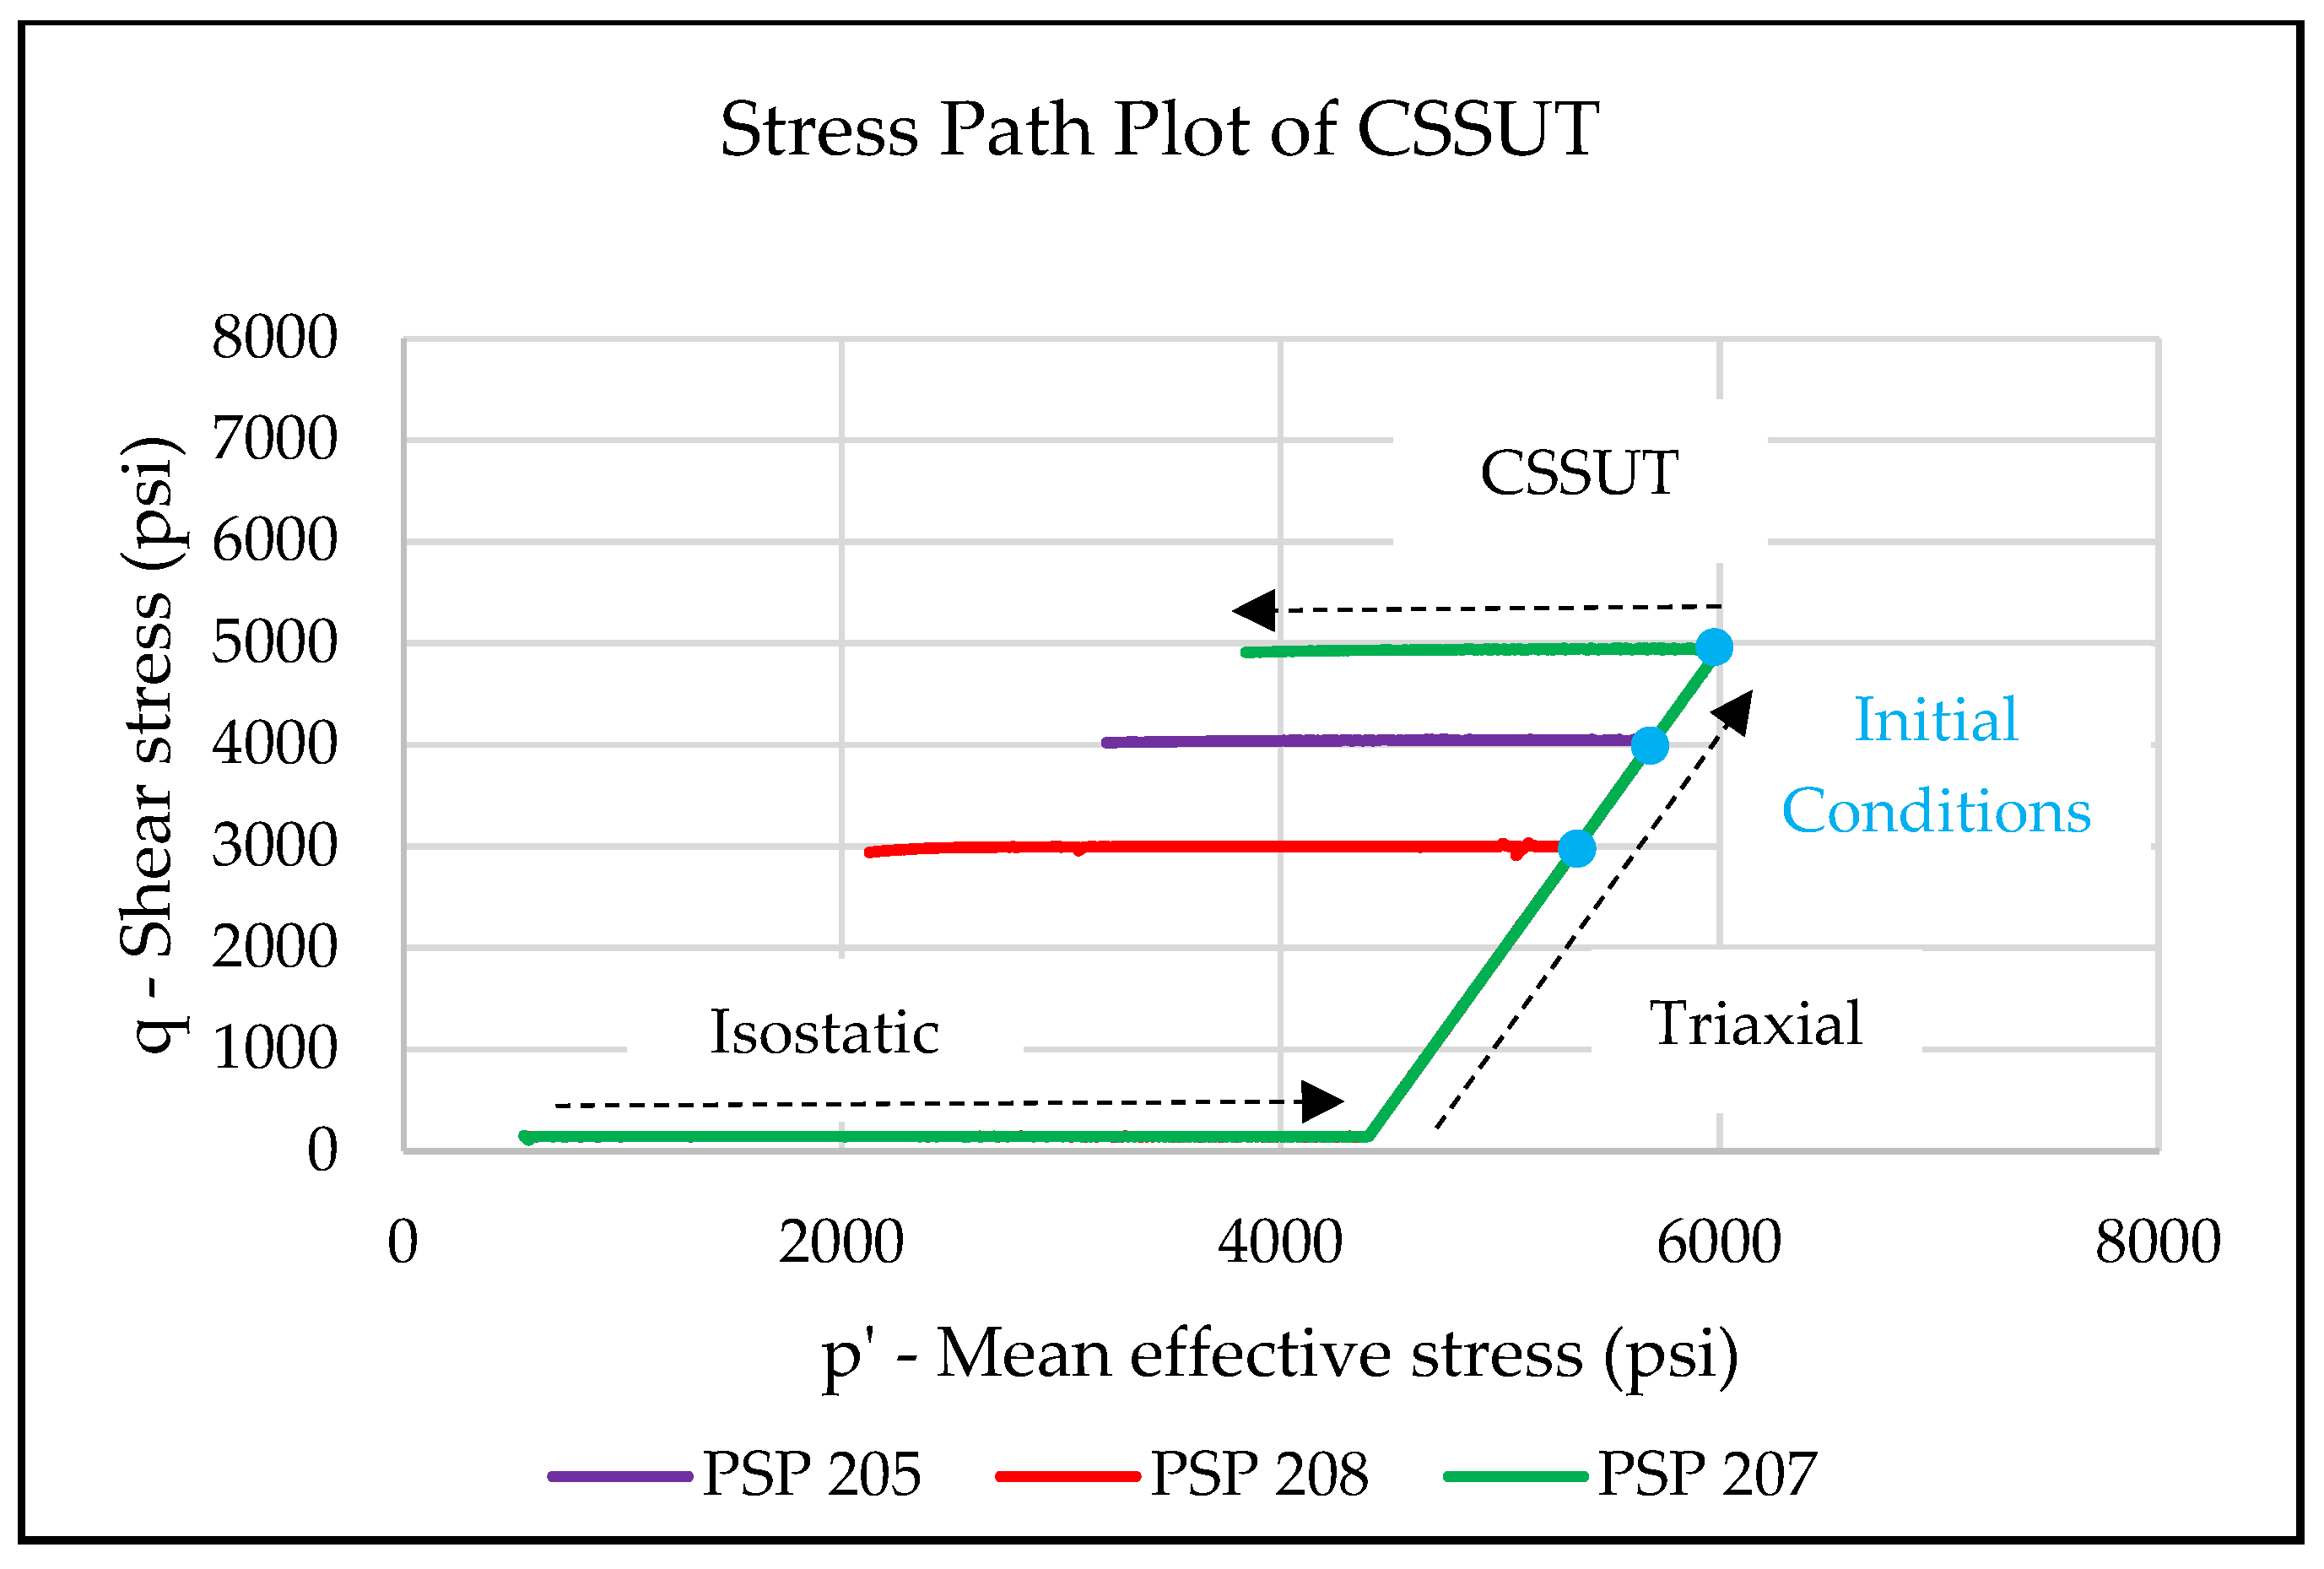
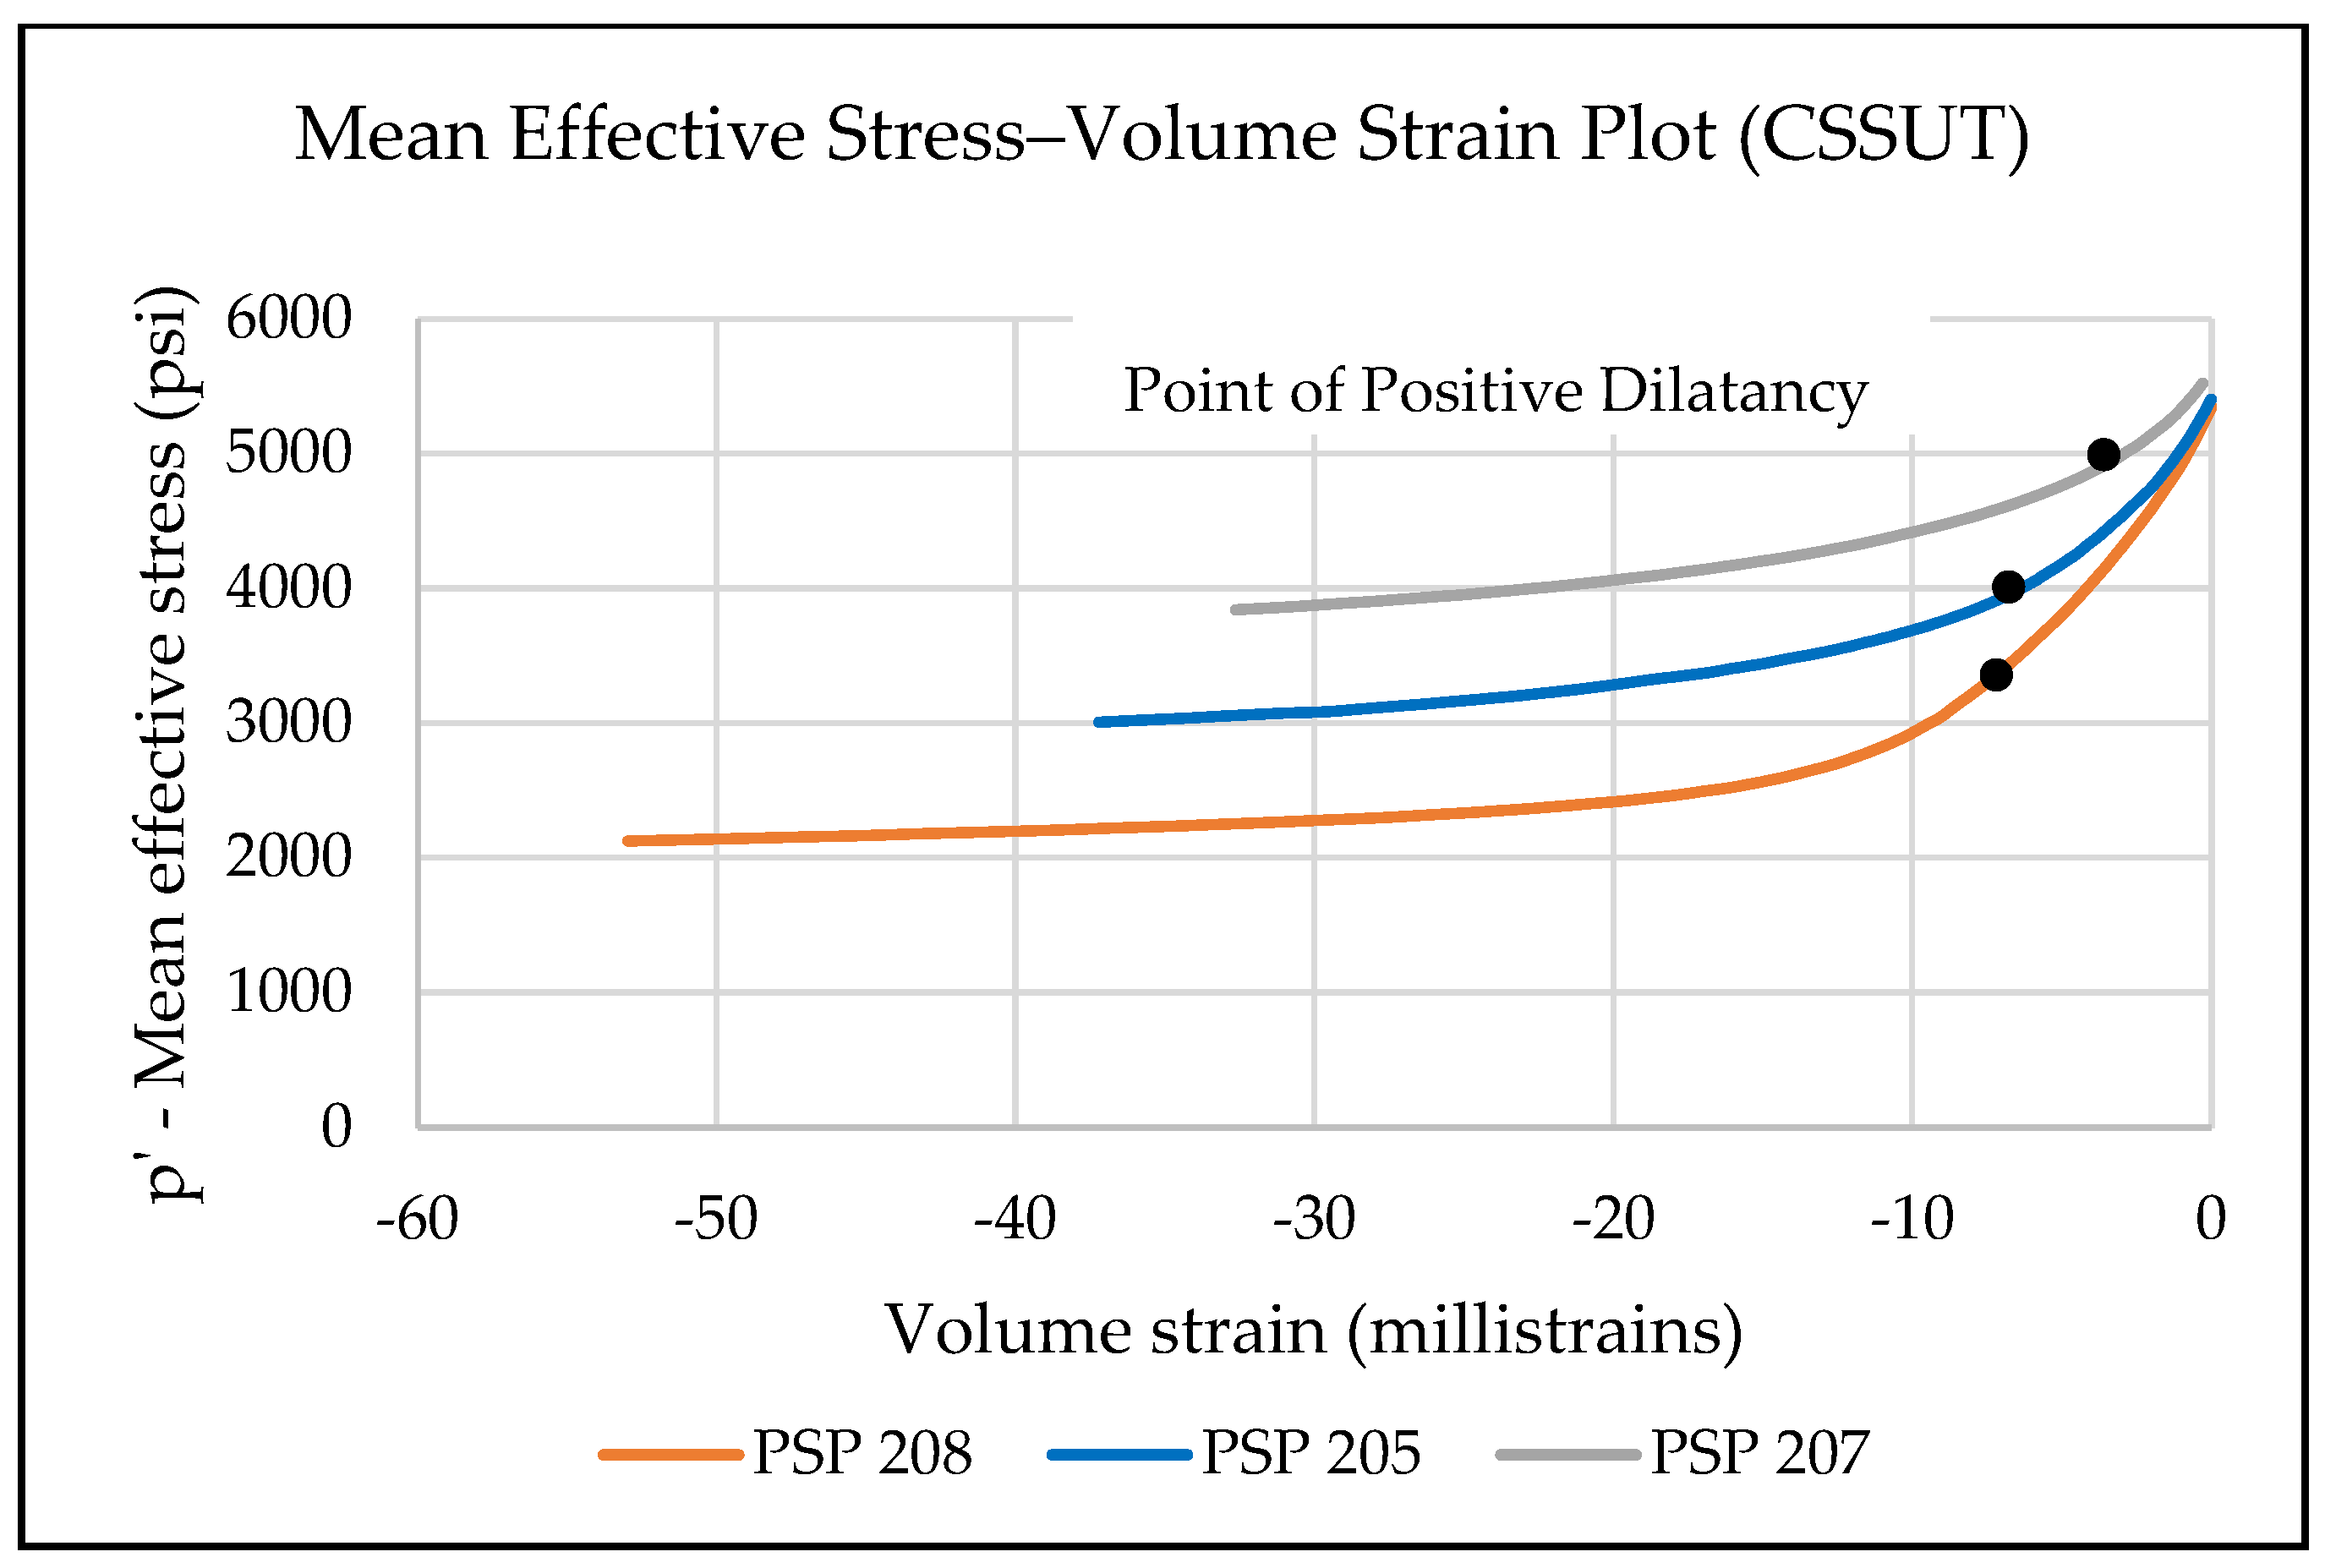
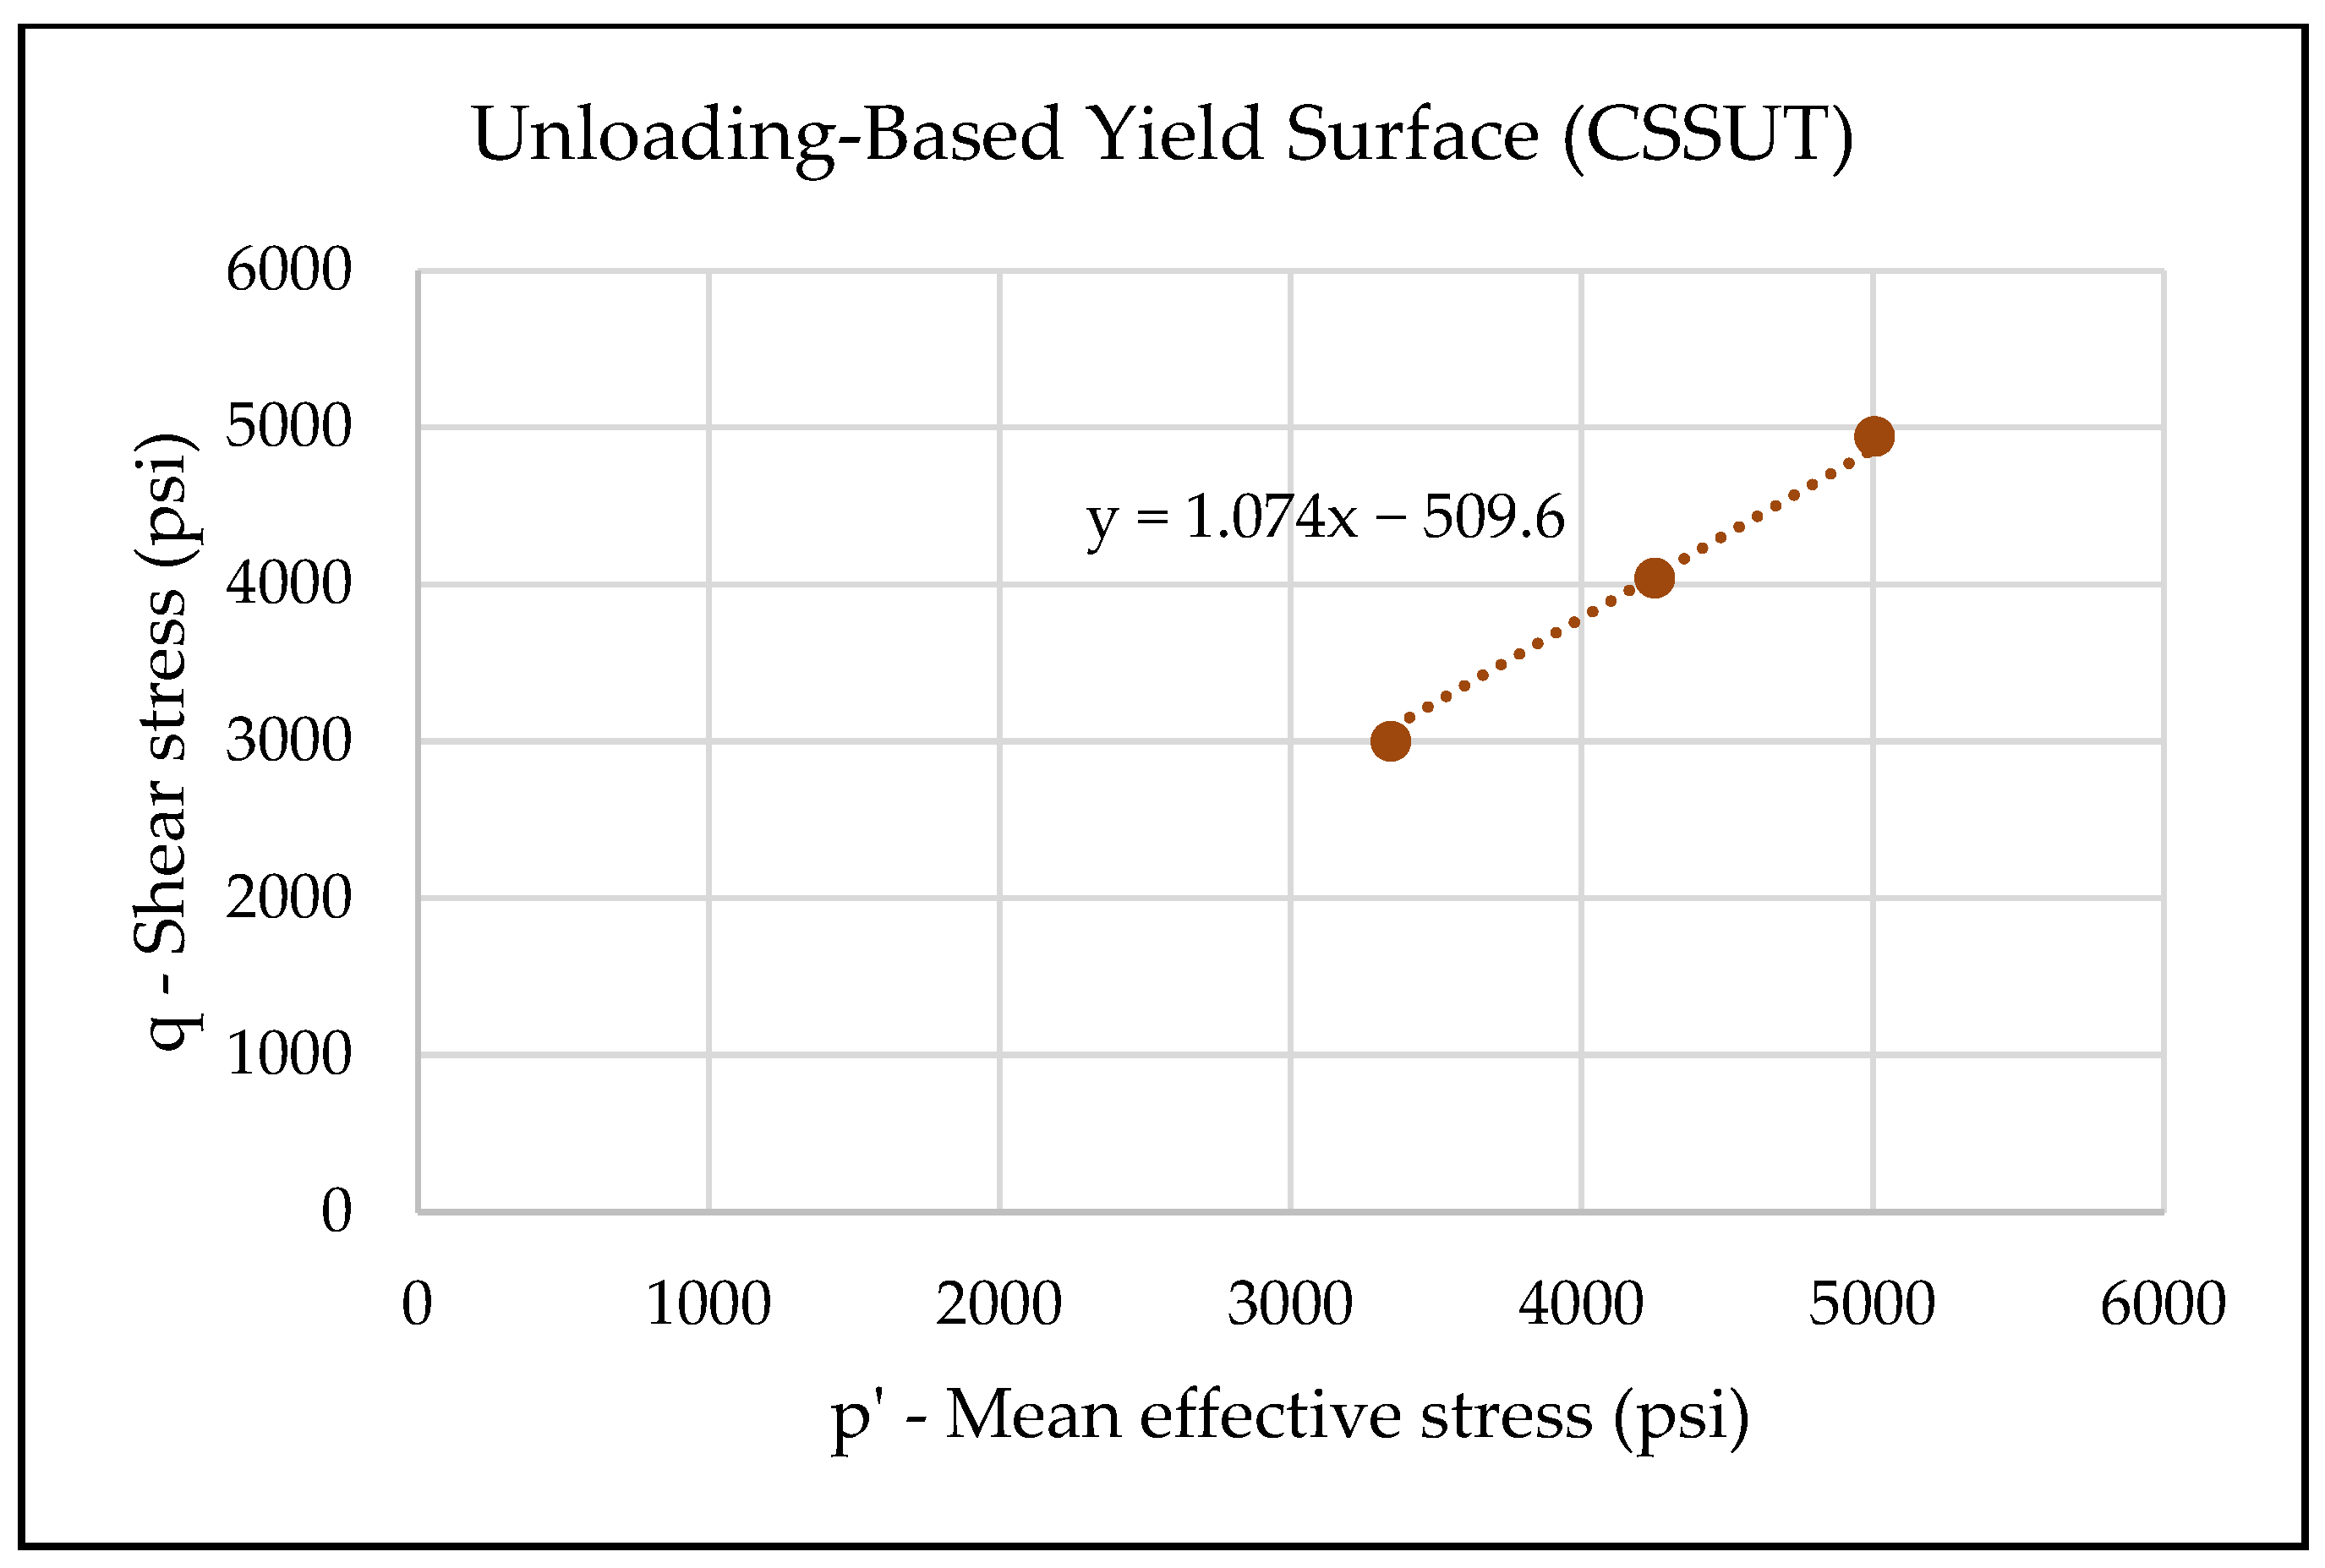
4.2.2. Constant Shear Stress Unloading Tests (CSSUTs) Analysis

The constant shear stress unloading tests are performed by decreasing the confining stress while keeping the shear stress constant. Therefore, the axial stress decreases as the test progresses. Figure 25 shows the combined plot of shear stress vs. axial strain for the three tests. Each test has different initial conditions, which can be seen from each sample’s starting value of shear stress.
Since the mean effective stress decreases with decreasing confining stress, a more appropriate stress–strain plot is the mean effective stress vs. volume strain plot, which captures the sample’s volumetric behavior. Figure 26 shows the plot of mean effective stress and volume strain. Volume strain shows a distinct change in slope for each sample.
The yield criteria used to pick the yield points for this set of tests differ from the other two. However, the volume strain behavior after the yield point is consistent in all three sets of tests. In Figure 26, it is observed that volume strain monotonically decreases with a decrease in mean stress. However, similarly to PSP 211 (Figure 21), a slope change is observed in all three test samples in this set. Therefore, the yield criteria of maximum curvature on volume strain are used to infer yield points to be mapped as a yield surface. The point of maximum curvature has been used to define the yield point in previous work [42,43].
Figure 27 shows the yield points from the constant shear stress unloading tests mapped on a Mohr–Coulomb plane. The yield surface has a friction angle of 29.3 deg with an intercept of ~−440 psi (3.03 MPa). The friction angle values obtained from the triaxial loading tests (Figure 17) are equal to those of constant shear stress unloading tests (Figure 27) (within experimental error). However, the values of the intercepts are different for both sets of tests.
The yield points are plotted in the Drucker–Prager stress space, as shown in Figure 28. The slope of the unloading-based constant shear stress yield surface is 1.07. Similarly, to the observation with the Mohr–Coulomb plot, the slope aligns closely with that of the triaxial loading-based yield surface. However, the intercept differs from the triaxial loading-based yield surface.
The yield surface characteristics obtained from tests in this study can be interpolated with the upper and lower bounds of the test conditions. However, extrapolating the yield surface to the lower stress values near the origin has to be substantiated with additional experimental observations before we can do so with high confidence.

5. Results and Discussion

In the previous section, we showed that the three yield surfaces obtained from the experiments have a similar slope but different intercept values. In this section, we will explore this phenomenon further.
Wong et al. [44] described a lower and upper bound for yield surfaces for sandstone samples for loading conditions (increasing mean effective stress). Nyugen et al. [43] published a study to understand the dependence of stress path effects on compaction in unconsolidated and weakly consolidated sandstones. They performed geomechanical tests on Durance sand (unconsolidated) under loading conditions (increasing mean effective stress). They also concluded that a lower and upper bound exists for unconsolidated sand loading-based yield surfaces for a set of loading-based stress paths.
This study investigates the yield surface bounds for loading-based stress paths (increasing mean effective stress) and unloading-based stress paths (decreasing mean effective stress) together. Figure 29 presents the summary plot of yield surfaces obtained from the three sets of tests in the p’-q space. All yield surfaces exhibit a similar slope (within experimental error), but different intercept values are observed. These intercept values illustrate the dependence of the yield surface on the stress path. For a mean effective stress value of 5000 psi (34.47 MPa), if the sample is on a triaxial stress path, it yields at a shear stress of 5400 psi (37.2 MPa); on a constant shear stress path, this value decreases to 5000 psi (34.47 MPa); on a constant axial stress path, it further decreases to 4600 psi (31.72 MPa). The stress path is a crucial criterion for predicting the yielding behavior for unconsolidated sands under a given set of initial conditions.
We investigate this experimental data further to obtain a minimum yield surface and the stress path angle to hit it. The slopes of yield surfaces from all three stress paths are similar, yet with changing stress path direction, the position of the yield surface goes through a minimum (Figure 30). A lower bound to the intercept value is geometrically determined by the shortest distance from the initial test conditions. Therefore, to have the shortest distance from the initial point, the stress path for this minimum yield surface is perpendicular to the yield surfaces. For our samples, the stress path perpendicular to the yield surface has a slope of 137 degrees.
Figure 31 shows a plot of the intercept value of the yield surface equation and the slope of the stress path (in degrees) in p’—q space to quantify the dependence of the stress path on the yield surfaces.
The point of minimum intercept value on this curve is found to be at 139 degrees. This supports our earlier conclusion that the stress path of nearly 137–139 degrees would produce the minimum yield surface. Thus, following the stress path with a slope of ~138 degrees in the p’-q space for a given initial condition will yield the sample at the lowest shear stress.
Within the bounds of the stress path slopes of −180 degrees (constant shear stress unloading) to +72 degrees (triaxial loading), multiple tested yield surfaces are found to be parallel. The minimum yield surface is found at the stress path angle of 138 degrees, which yields at the lowest shear stress values. Using a quadratic fit, all other yield surfaces can be interpolated, depending on the stress path within bounds of the experiments (−180 deg to +72 deg).
We hypothesize that for a different material (with similar characteristics), the minimum yield surface and all stress path-based yield surfaces are determined using just three geomechanical tests with reasonable certainty:
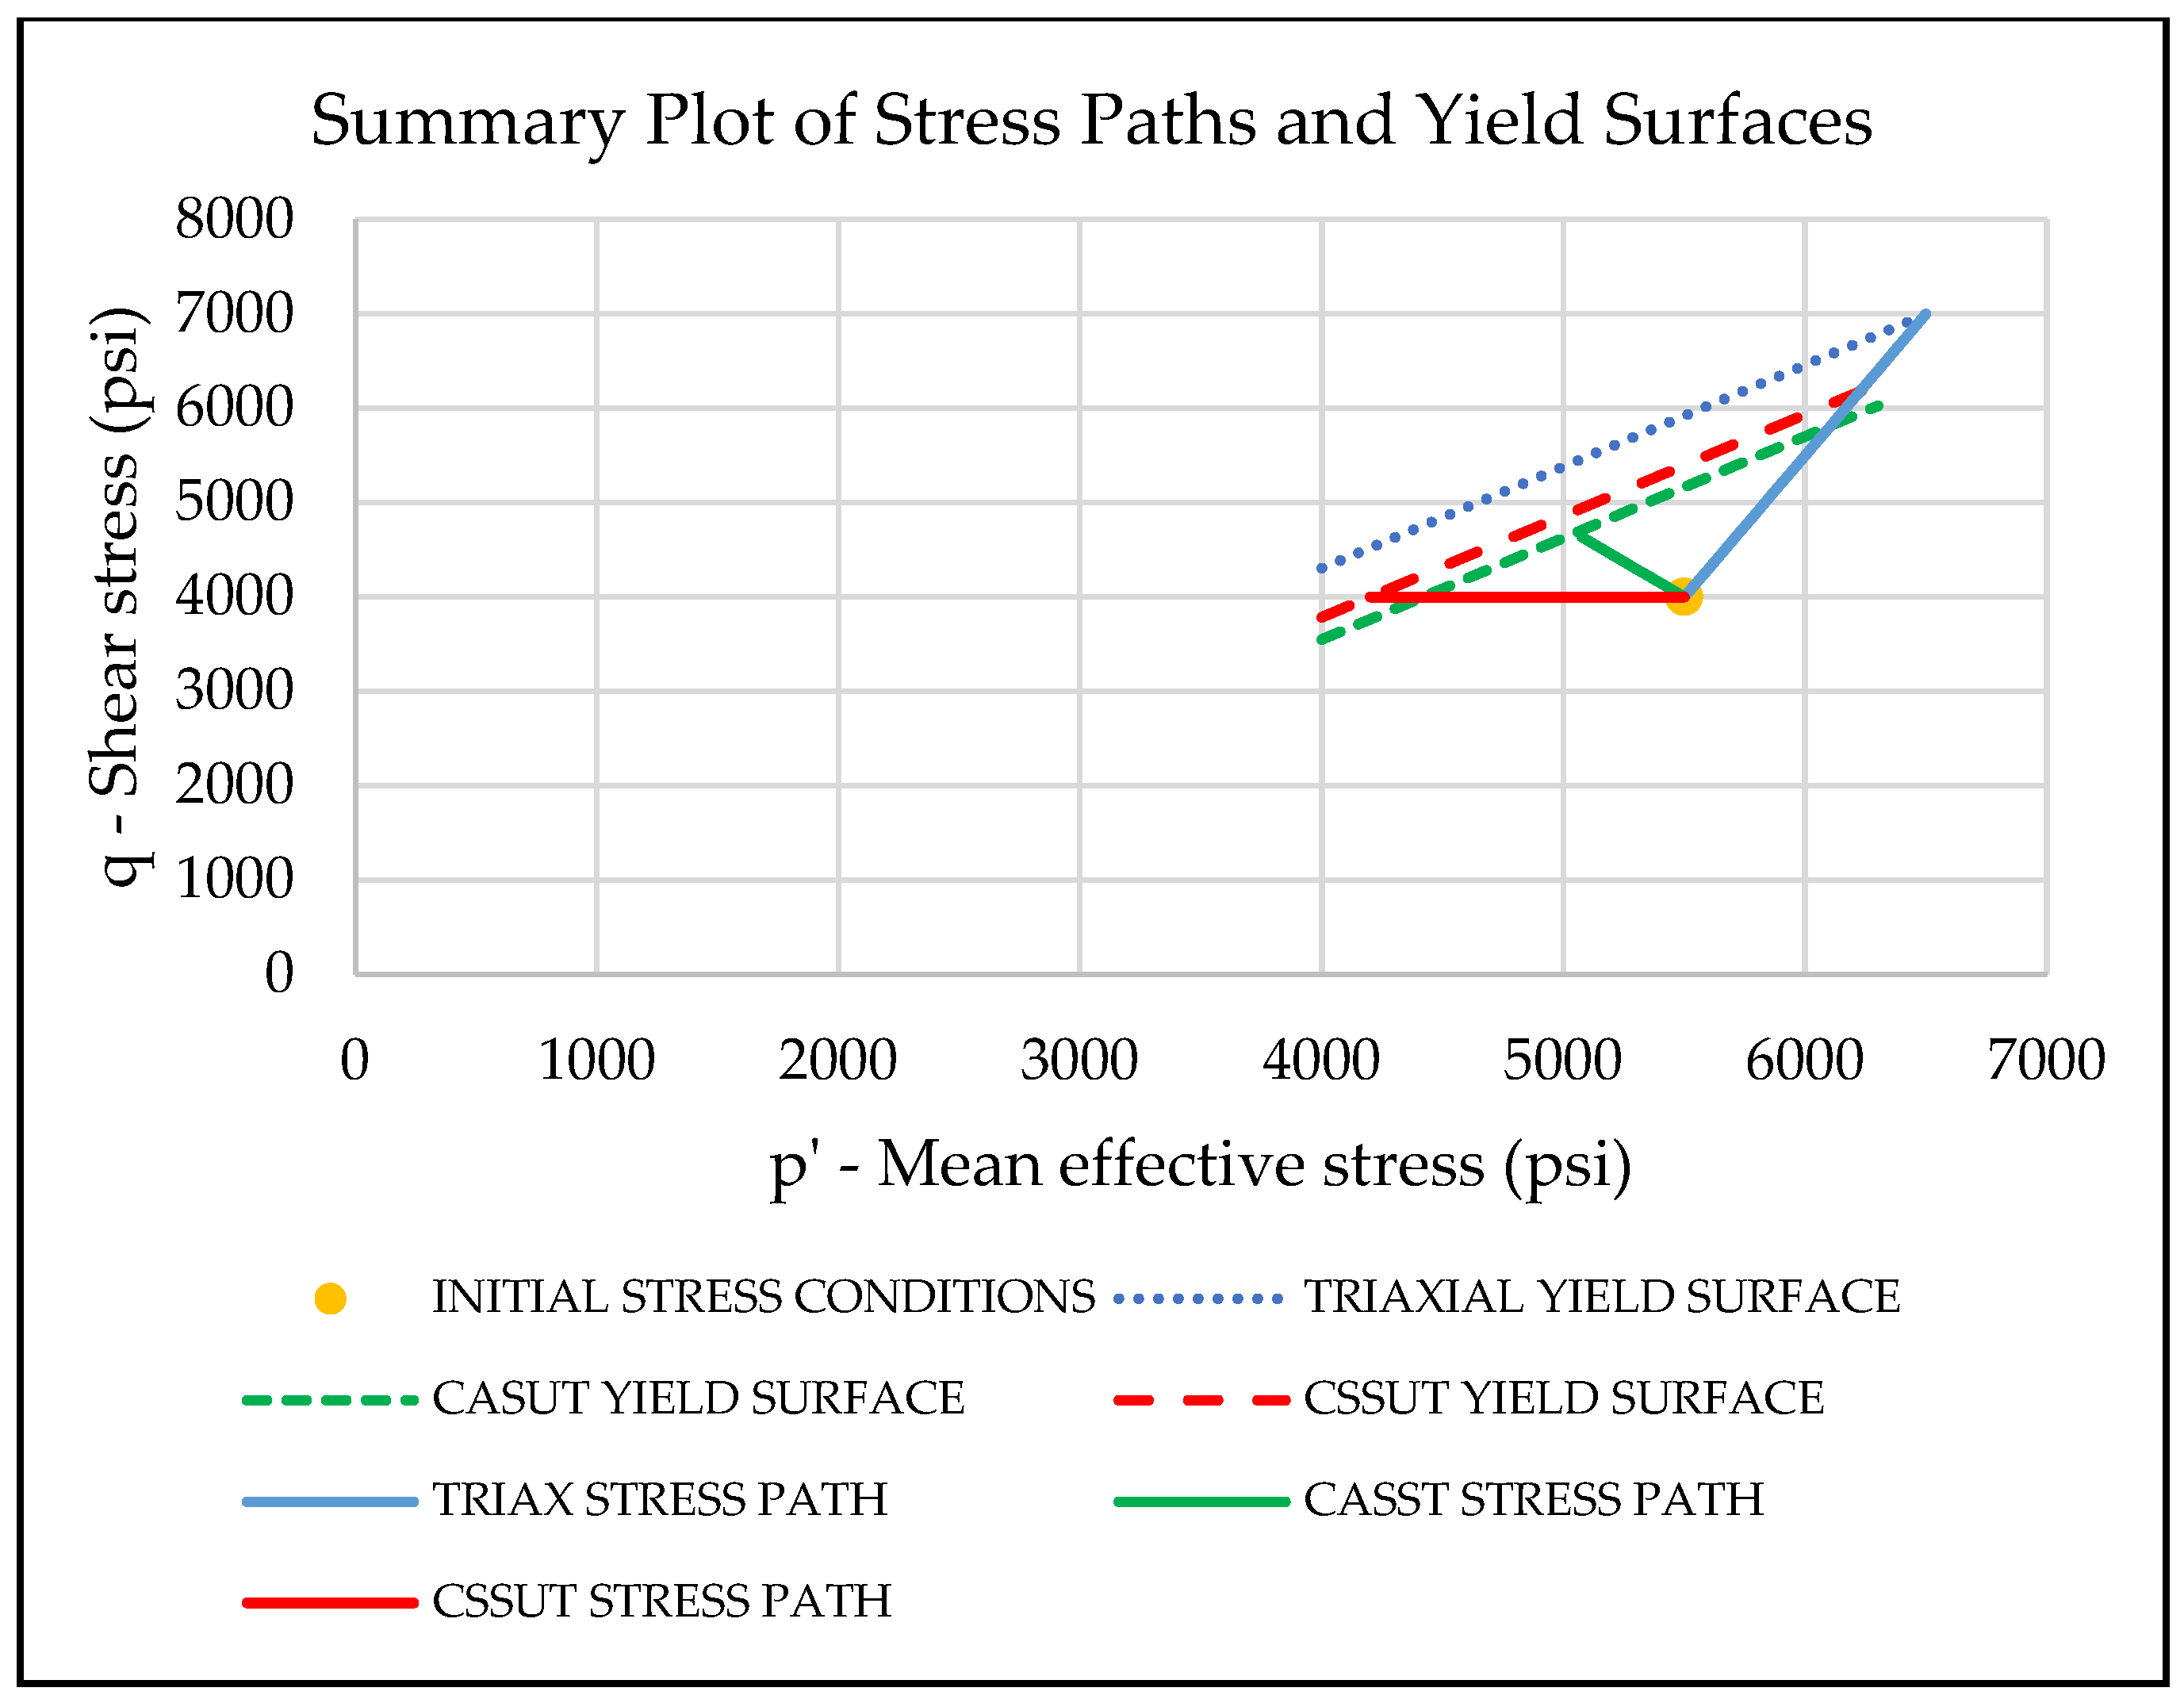
  • A multi-stage triaxial test with one sample to locate the loading-based yield surface.
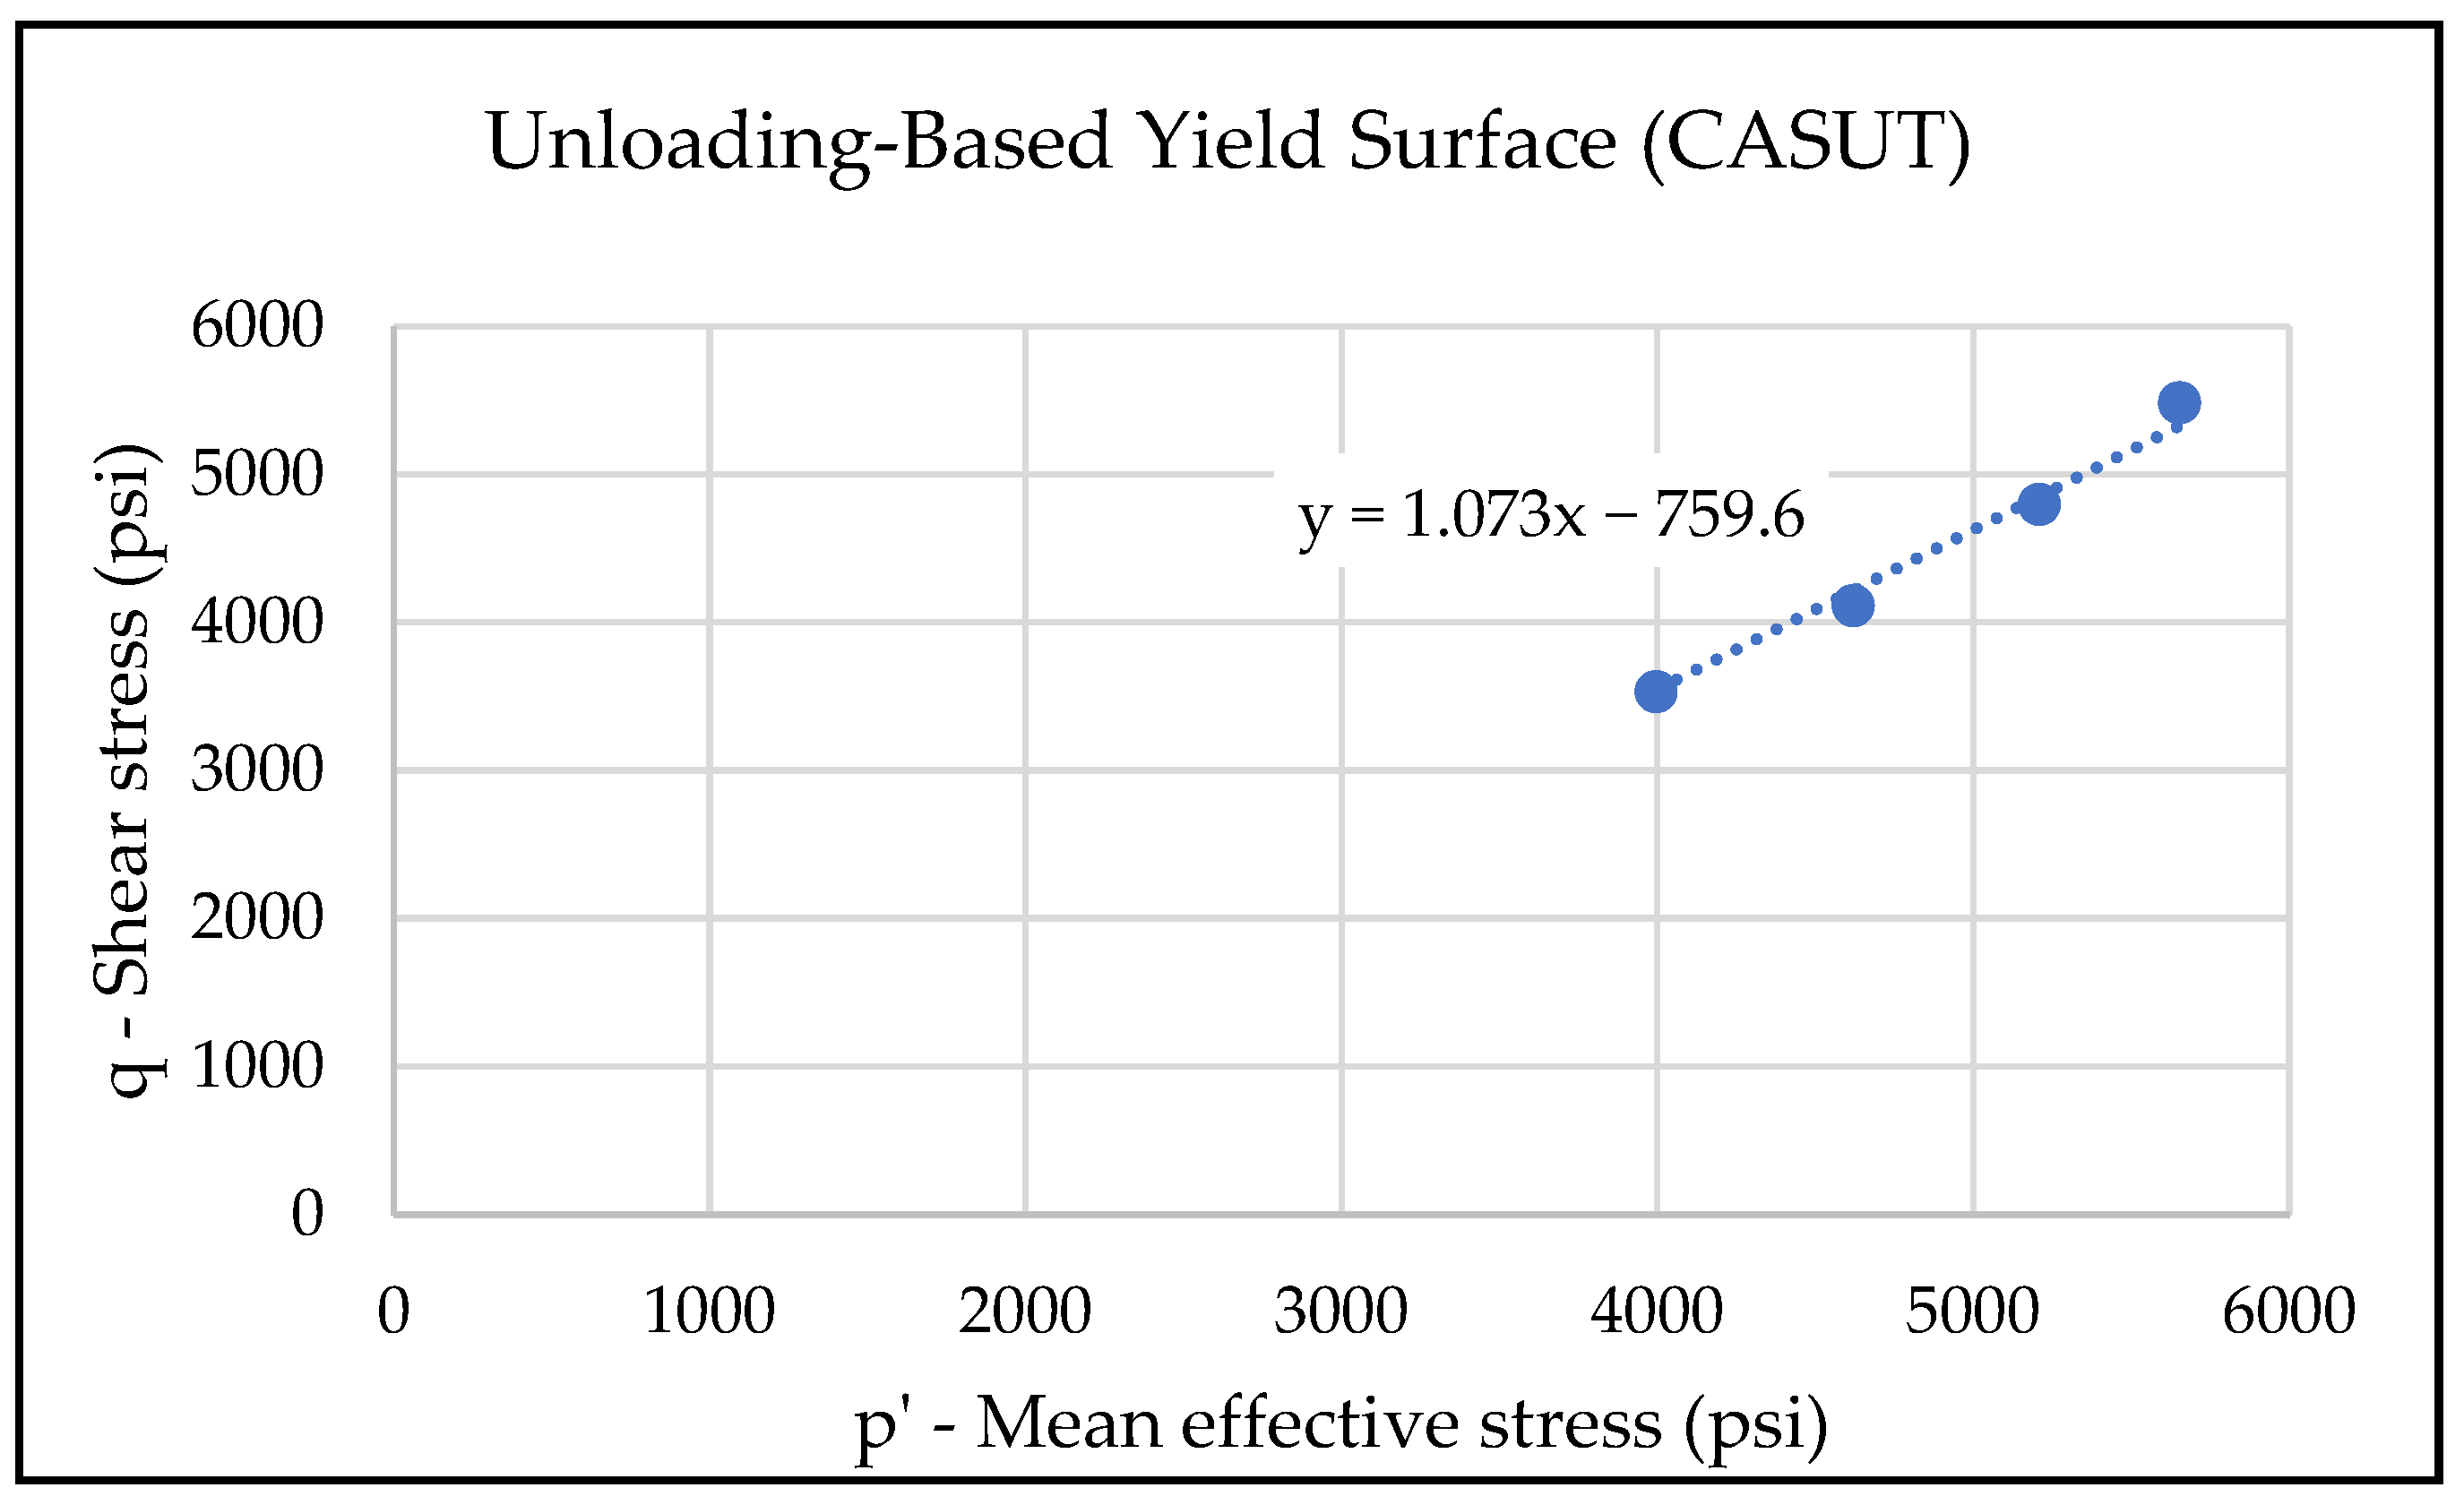
  • A constant axial stress unloading test (CASUT) to locate a yield point on the CASUT yield surface. Since all yield surfaces are parallel, the CASUT yield surface line can be determined geometrically using a slope (same as the triaxial yield surface slope) and the yield point.
  • A constant shear stress unloading test (CSSUT) to locate a yield point on the CSSUT yield surface. The CSSUT yield surface line can also be determined as 2.
  • The minimum surface can be determined as described earlier in this section.

6. Conclusions and Future Work

Coring operations in an offshore deep-water unconsolidated sand reservoir are costly and time-intensive. Only a few feet of core are often available for measurements (rock mechanics, capillary pressure, acoustics, etc.) and flow tests (core-flooding, permeability measurements, and geochemical interactions). Due to the limited availability of cores, it is often difficult to perform multiple tests to determine geomechanical behavior under different conditions. This paper provides a sample preparation technique to fabricate repeatable and consistent analogs. Several researchers have studied the effects of the yielding behavior of materials under unloading [45,46,47] for various injection fluids. The stress path traversed by the reservoir will depend on the stress anisotropy of the reservoir during depletion and injection operations. It may also be altered due to fluid localization (viscous fingering effects during CO2 injection). To determine yielding behavior for any stress path, this paper presents a unique method of three strategic stress paths to obtain the minimum yield surface and yield surfaces for any stress path. A geomechanical yield behavior model to estimate the yield point at any stress path angle provides a more robust technique to perform multiple simulations of depletion and injection, maximizing recovery while minimizing sand failure.
A suite of nine rock strength experiments was conducted on unconsolidated sands to understand the yielding behavior under different stress paths. One multi-stage triaxial test and one single-stage triaxial test were performed to develop the loading-based triaxial yield surface. Four constant axial stress unloading tests were conducted to develop the unloading-based constant axial stress yield surface. Three constant shear stress unloading tests were conducted to develop the unloading-based constant shear stress yield surface. Both Mohr–Coulomb and Drucker–Prager criteria were applied to develop the yield surface. Since the Drucker–Prager criterion accounts for intermediate stress, it was chosen to compare the yield surfaces. The following are the most important conclusions:
  • Yield surfaces for all three sets of experiments were found to be different.
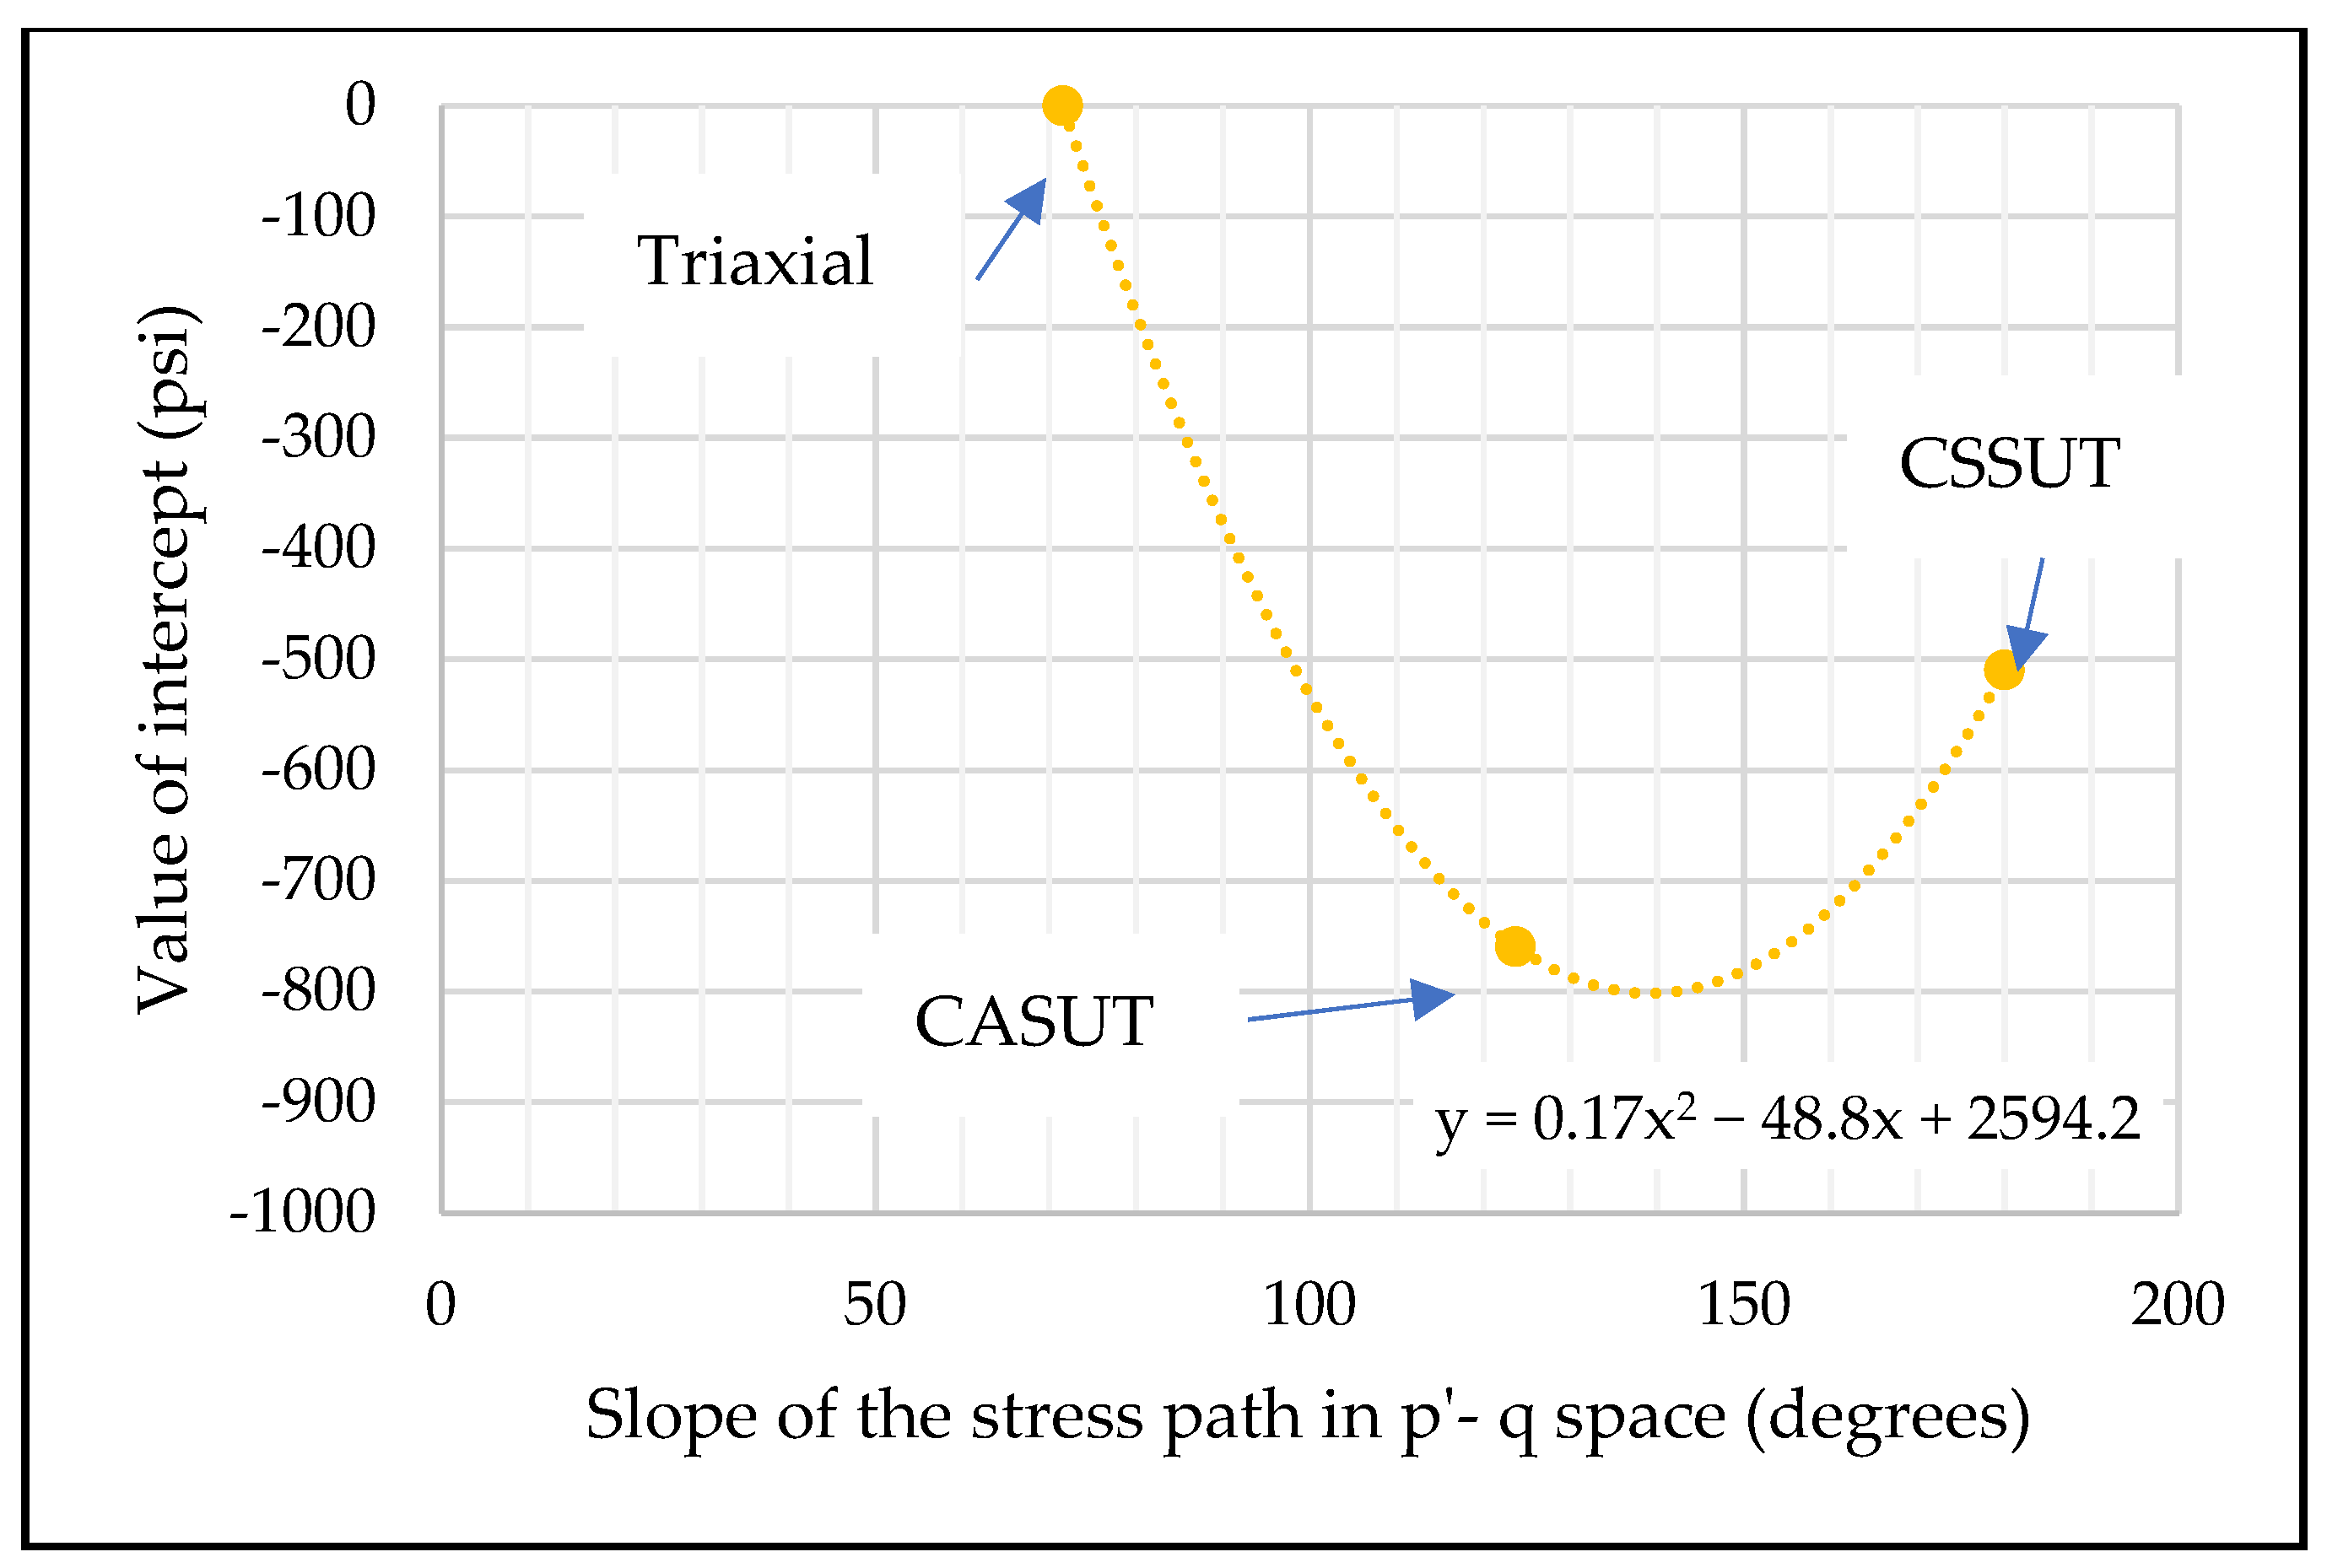
  • Yield surfaces for all three sets of experiments were parallel to each other with different values of intercepts.
  • The yielding behavior of a material depends on the stress path it traverses. For the same initial stress magnitudes, traversing different stress paths will produce different yield stresses. In the current research work, the triaxial loading stress path produced the highest yield stress, while the constant axial stress unloading path produced the lowest yield stress.
  • This work proposes a minimum global yield surface model. The material will have a minimum yield stress in the stress path perpendicular to the yield surfaces.
  • With a quadratic fit, all other yield surfaces from different stress paths (with bounds −180 deg to +72 deg) can be predicted.
  • With a three-experiment design as described, the global minimum yield surface and all yield points can be determined for a new material.
Future work for this research includes the following:
  • Validate the model with more stress paths and expand the upper and lower bounds to different stress paths and magnitudes.
  • Include different materials in the study if similar behavior is observed.
  • Building a global repository of different materials to quickly predict the yield stress of a material if the stress path is known.

Author Contributions

Conceptualization, S.P.; Methodology, S.P., M.M. and L.H.; Validation, M.M. and L.H.; Investigation, M.M. and G.W.; Resources, D.M.; Project Administration and Funding Acquisition, G.W. All authors have read and agreed to the published version of the manuscript.

Funding

This project was supported by the efforts of Shell Exploration and Production, Houston, Grant number—Shell: G0500642.

Data Availability Statement

Data are confidential and would not be openly accessible.

Conflicts of Interest

Author Duane Mikulencak is employed by Shell Exploration and Production Company and declare no conflict of interest. The remaining authors declare that the research was conducted in the absence of any commercial or financial relationships that could be construed as a potential conflict of interest.

References

  1. Fjær, E.; Holt, R.; Horsrud, P.; Raaen, A.; Risnes, R. Petroleum Related Rock Mechanics, 2nd ed.; Elsevier: Amsterdam, The Netherlands, 2008; pp. 1–93. [Google Scholar]
  2. Jaeger, J.C.; Cook, N.G.W.; Zimmerman, R.W. Fundamentals of Rock Mechanics, 4th ed.; Blackwell Publishing: Hoboken, NJ, USA, 2007; pp. 93–116. [Google Scholar]
  3. Lambe, T.W. Stress Path Method. J. Soil Mech. Found. Div. 1967, 93, 309–331. [Google Scholar] [CrossRef]
  4. Zhang, J. Applied Petroleum Geomechanics; Gulf Professional Publishing: Oxford, UK, 2020; pp. 2–8. [Google Scholar]
  5. Lade, P.V.; Duncan, J.M. Stress-Path Dependent Behavior of Cohesionless Soil. J. Geotech. Eng. Div. 1976, 102, 51–68. [Google Scholar] [CrossRef]
  6. Zoback, M.D. Reservoir Geomechanics; Cambridge University Press: Cambridge, UK, 2007. [Google Scholar]
  7. Xie, H.Q.; He, C.H. Study of the Unloading Characteristics of a Rock Mass Using the Triaxial Test and Damage Mechanics. Int. J. Rock Mech. Min. Sci. 2004, 41, 74–80. [Google Scholar] [CrossRef]
  8. Huang, D.; Li, Y. Conversion of Strain Energy in Triaxial Unloading Tests on Marble. Int. J. Rock Mech. Min. Sci. 2014, 66, 160–168. [Google Scholar] [CrossRef]
  9. Dai, B.; Zhao, G.Y.; Yang, C.; Dong, L.J. Experimental of Unloading Mechanical Properties of Rock Under Different Stress Paths. In International Society for Rock Mechanics and Rock Engineering; CRC Press: Boca Raton, FL, USA, 2014. [Google Scholar]
  10. Li, D.; Sun, Z.; Xie, T.; Li, X.; Ranjith, P.G. Energy Evolution Characteristics of Hard Rock During Triaxial Failure with Different Loading and Unloading Paths. Eng. Geol. 2017, 228, 270–281. [Google Scholar] [CrossRef]
  11. Yin, Z.; Li, X.; Jin, J.; He, X.; Du, K. Failure Characteristics of High Stress Rock Induced by Impact Disturbance Under Confining Pressure Unloading. Trans. Nonferrous Met. Soc. China 2012, 22, 175–184. [Google Scholar] [CrossRef]
  12. Zhu, T.; Huang, D. Experimental Investigation of the Shear Mechanical Behavior of Sandstone Under Unloading Normal Stress. Int. J. Rock Mech. Min. Sci. 2019, 114, 186–194. [Google Scholar] [CrossRef]
  13. Huang, R.; Wang, X.; Chan, L. Triaxial unloading test of rocks and its implication for rock burst. Bull. Eng. Geol. Environ. 2001, 60, 37–41. [Google Scholar] [CrossRef]
  14. Du, K.; Li, X.; Li, D.; Weng, L. Failure Properties of Rocks in True Triaxial Unloading Compressive Test. Trans. Nonferrous Met. Soc. China 2015, 25, 571–581. [Google Scholar] [CrossRef]
  15. Wang, S.; Xu, W.; Yan, L.; Feng, X.; Xie, W.; Chen, H. Experimental Investigation and Failure Mechanism Analysis for Dacite Under True Triaxial Unloading Conditions. Eng. Geol. 2020, 264, 105407. [Google Scholar] [CrossRef]
  16. Chen, W.Z.; Liu, D.; Yang, J. Power Function Based Mohr Strength Criterion for Marble with Unloading Confining Pressures. Chin. J. Rock Mech. Eng. 2008, 11, 2214–2220. [Google Scholar]
  17. Wang, H.; Chen, W.; Tan, X.; Tian, H.; Cao, J. Development of a New Type of Foam Concrete and its Application on Stability Analysis of Large-Span Soft Rock Tunnel. J. Cent. South Univ. 2012, 19, 3305–3310. [Google Scholar] [CrossRef]
  18. Gao, F.; Zhou, K.; Luo, X.; Zhai, J. Effect of Induction Unloading on Weakening of Rock Mechanics Properties. Trans. Non-Ferr. Met. Soc. China 2012, 22, 419–424. [Google Scholar] [CrossRef]
  19. He, M.C.; Miao, J.L.; Feng, J.L. Rock Burst Process of Limestone and its Acoustic Emission Characteristics Under True Triaxial Unloading Conditions. Int. J. Rock Mech. Min. Sci. 2010, 47, 286–298. [Google Scholar] [CrossRef]
  20. Guo, Y.; Yang, C.; Fu, J. Experimental Research on Mechanical Characteristics of Salt Rock Under Triaxial Unloading Test. Rock Soil Mech. 2012, 3, 725–730. Available online: http://ytlx.whrsm.ac.cn/EN/abstract/abstract11031.shtml (accessed on 2 May 2025).
  21. Zhang, X.; Zhang, D.; Leo, C. Damage Evolution and Post-peak Gas Permeability of Raw Coal Under Loading and Unloading Conditions. Transp. Porous Media 2017, 117, 465–480. [Google Scholar] [CrossRef]
  22. Liu, Q.; Cheng, Y.; Jin, K.; Tu, Q.; Zhao, W.; Zhang, R. Effect of Confining Pressure Unloading on Strength Reduction of Soft Coal in Borehole Stability Analysis. Environ. Earth Sci. 2017, 76, 173. [Google Scholar] [CrossRef]
  23. Barla, M. Numerical Simulation of the Swelling Behavior Around Tunnels Based on Special Tri-axial Tests. Tunneling Undergr. Space Technol. 2007, 23, 508–521. [Google Scholar] [CrossRef]
  24. Zhou, Q. Tests and Test Methods of Unloading Strength of Soft Soil. J. Yangtze River Sci. Res. Inst. 2013, 30, 35–39. [Google Scholar]
  25. Huang, W.; Wen, K.; Liu, D.; Dong, Q.; Li, J.; Li, Y.; Li, L. Experimental Study on Influence of Excess Pore Water Pressure and Unloading Ratio on Unloading Mechanical Properties of Marine Sedimentary Soft Soils. Ocean. Eng. 2020, 195, 106680. [Google Scholar] [CrossRef]
  26. Hamoud, M. Influence of Geomechanical Processes on Relative Permeability. Master’s Thesis, University of Alberta, Edmonton, AB, Canada, 2012. [Google Scholar]
  27. Oldakowski, K. Stress Induced Permeability Changes in Athabasca Oil Sands. Master’s Thesis, University of Alberta, Edmonton, AB, Canada, 1994. [Google Scholar]
  28. Touhidi, B.A. Absolute Permeability of McMurray Formation Oil Sands at Low Confining Stresses. Ph.D. Thesis, University of Alberta, Edmonton, AB, Canada, 1998. [Google Scholar]
  29. Chalaturnyk, R.J. Geomechanics of the Steam Assisted Gravity Drainage Process in Heavy Oil Reservoirs. Ph.D. Thesis, University of Alberta, Edmonton, AB, Canada, 1996. [Google Scholar]
  30. Prakash, S.; Myers, M.; Wong, G.; Hathon, L.; Mikulencak, D. Experimental Study: Stress Path Coefficient in unconsolidated Sands: Effects of Re-Pressurization and Depletion Hysteresis. Geosciences 2024, 14, 327. [Google Scholar] [CrossRef]
  31. Kovari, K.; Tisa, A. Multiple failure state and strain controlled triaxial tests. In Rock Mechanics and Rock Engineering; Springer: Berlin/Heidelberg, Germany, 1975; Volume 7, pp. 17–33. [Google Scholar]
  32. Kim, M.M.; Ko, H.Y. Multistage triaxial testing of rocks. Geotech. Test. J. 1979, 2, 98–105. [Google Scholar] [CrossRef]
  33. Crawford, A.; Wylie, D. A modified multiple failure triaxial testing method. In Proceedings of the ARMA US Rock Mechanics/Geomechanics Symposium, Tucson, AZ, USA, 29 June 1987. ARMA-87-0133. [Google Scholar]
  34. Holt, A.M.; Fjaer, E. Validity of Multiple Failure State Triaxial Tests in Sandstones. In Proceedings of the 7th ISRM Congress, Aachen, Germany, 16 September 1991. ISRM-7CONGRESS-1991-102. [Google Scholar]
  35. Pagoulatos, A. Evaluation of Multistage Triaxial Testing on Berea Sandstone. M.S. Thesis, University of Oklahoma, Norman, OK, USA, 2004. [Google Scholar]
  36. Jambunathan, V. Study of Mechanical Properties of Carbonates. Master’s Thesis, University of Oklahoma, Norman, OK, USA, 2008. [Google Scholar]
  37. Taheri, A.; Tani, K. Proposal of a New Multiple-Step Loading Triaxial Compression Testing Method. In Proceedings of the 5th Asian Rock Mechanics Symposium, Tehran, Iran, 24 November 2008. ISRM-ARMS5-2008-058. [Google Scholar]
  38. Alsalman, M.E.; Myers, M.T.; Sharf-Aldin, M.H. Comparison of multi-stage to single-stage tri-axial test. In Proceedings of the 49th US Rock Mechanics/ Geomechanics Symposium, Seattle, WA, USA, 28 June–1 July 2015. ARMA-2015-767. [Google Scholar]
  39. Bilal, A.; Myers, M.; Hathon, L. An Investigation of Static and Dynamic Data Using Multistage Triaxial Tests. In Proceedings of the Society of Exploration Geophysicists Conference, Dallas, TX, USA, 20 October 2016. SEG 16-13969660. [Google Scholar]
  40. Dessouki, M.; Myers, M.T.; Hathon, L.A. A New Approach to Calibrate the Modified Cam Clay Model by Using Multi-stage Triaxial Tests on Resedimented Mudrocks. In Proceedings of the 54th U.S. Rock Mechanics/Geomechanics Symposium, Golden, CO, USA, 28 June–1 July 2020. ARMA-2020-1558. [Google Scholar]
  41. Prakash, S.; Myers, M.T.; Hathon, L.A. Analysis of Damage Induced in Multistage Triaxial Tests Using Acoustic Emissions Data. In Proceedings of the 52nd U.S. Rock Mechanics/Geomechanics Symposium, Seattle, WA, USA, 17 June 2018. ARMA-2018-1223. [Google Scholar]
  42. Mesri, G.; Vardhanabhuti, B. Compression of granular materials. Can. Geotech. J. 2009, 46, 369–392. [Google Scholar] [CrossRef]
  43. Nguyen, V.H.; Gland, N.; Dautriat, J.; David, C.; Wassermann, J.; Guelard, J. Compaction, permeability evolution and stress path effects in unconsolidated sand and weakly consolidated sandstone. Int. J. Rock Mech. Min. Sci. 2014, 67, 226–239. [Google Scholar] [CrossRef]
  44. Wong, T.F.; David, C.; Zhu, W. The transition from brittle faulting to cataclastic flow in porous sandstone: Mechanical deformation. J. Geophys. Res. 1997, 102, 3009–3025. [Google Scholar] [CrossRef]
  45. Yale, D.P.; Mayer, T.; Wang, J. Geomechanics of Oil Sands Under Injection. In Proceedings of the 44th U.S. Rock Mechanics Symposium, Salt Lake City, UT, USA, 27–30 June 2010. ARMA-10-257. [Google Scholar]
  46. Gheibi, S.; Holt, R.M.; Vilarrasa, V. Effect of Faults on Stress Path Evolution During Reservoir Pressurization. Int. J. Greenh. Gas Control 2017, 63, 412–430. [Google Scholar] [CrossRef]
  47. Lynch, T.; Fisher, Q.; Angus, D.; Lorinczi, P. Investigating Stress Path Hysteresis in a CO2 Injection Scenario Using Coupled Geomechanical-Fluid Flow Modelling. Energy Procedia 2013, 37, 3833–3841. [Google Scholar] [CrossRef]
Figure 1. The particle size distribution (PSD) of the raw sand (d50-229 μm) and sieved sand (d50-203 μm) was used to generate analog test samples for this work.
Geosciences 15 00173 g001
Figure 2. Incremental confining stress cycling from 500 psi to 4000 psi at 500 psi increments. The last cycle step (4000 psi) is repeated until the axial strain is nearly elastic (>95% recoverable strain).
Geosciences 15 00173 g002
Figure 3. The percent recoverable/elastic strain for a few samples in each incremental confining stress cycling process stage. The recoverable strain is nearly elastic (>95% recoverable strain) towards the last few steps.
Geosciences 15 00173 g003
Figure 4. The loading stress path and unloading stress paths used in this study. The loading stress paths are in −90° < θ < 90°, and the unloading stress paths are in 90° ≤ θ ≤ 270°.
Geosciences 15 00173 g004
Figure 5. The initial test conditions and load vs. time plot for the single-stage triaxial test with a confining stress of 4350 psi (30 MPa).
Geosciences 15 00173 g005
Figure 6. The stress path followed by the single-stage triaxial test in a mean effective stress–shear stress plane, including the initial stress point and the yield stress point.
Geosciences 15 00173 g006
Figure 7. The stress path of the confining stress and shear stress in a typical multi-stage triaxial test.
Geosciences 15 00173 g007
Figure 8. The stress path followed by each stage in the multi-stage triaxial test is in a mean effective stress–shear stress space.
Geosciences 15 00173 g008
Figure 9. The different stress paths are applied for loading and unloading. During injection, the mean effective stress increases with decreasing, constant, or increasing shear stress. The increasing shear stress path is the most representative stress path for actual reservoir conditions.
Geosciences 15 00173 g009
Figure 10. The load vs. time plots for all four CASUT samples. Each sample has different initial conditions (black dotted line) and different end-of-test conditions (red dotted line).
Geosciences 15 00173 g010
Figure 11. A combined plot of stress paths for the constant axial stress tests (CASUTs) for four samples in the mean effective stress–shear stress space.
Geosciences 15 00173 g011
Figure 12. The load vs. time plots for all three CSSUT samples. Each sample has different initial conditions (black dotted line) and different end-of-test conditions (red dotted line).
Geosciences 15 00173 g012
Figure 13. A combined plot of stress path for constant shear stress tests (CSSUT) for three samples in the mean effective stress–shear stress space.
Geosciences 15 00173 g013
Figure 14. The stress vs. strain plot for the multi-stage triaxial test. Four different confining pressure stages—1500 psi, 2000 psi, 2500 psi, and 3000 psi were performed. The sample was unloaded at the point of positive dilatancy for each stage.
Geosciences 15 00173 g014
Figure 15. The stress–strain plot of the single-stage triaxial test. The test was concluded when the axial strain sensor was at its limit.
Geosciences 15 00173 g015
Figure 16. A combined plot of the tangent strain ratio and shear stress. Yield stress points from each stage of the multi-stage triaxial test and the single-stage triaxial test are used to map the yield surface. For the single-stage triaxial test, the tangent strain ratio after yielding the material is non-uniform, showing post-failure characteristics.
Geosciences 15 00173 g016
Figure 17. The Mohr–Coulomb (MC) envelope of the combined yield points. The sample has a friction angle of 27.6 degrees and a cohesion of ~0 psi (within experimental error).
Geosciences 15 00173 g017
Figure 18. The yield point from the single-stage triaxial test (SST) plotted on the multi-stage triaxial test (MST) yield surface shows a close match. This observation validates the use of a multi-stage triaxial test for determining the loading-based yield surface.
Geosciences 15 00173 g018
Figure 19. Previous work published by Hamoud [26], Oldakowski [27], and Touhidi [28], on the strength properties measurement of unconsolidated sands focused on the Alberta oil sands (effective stresses < 250 psi). Current work focuses on deep-water offshore reservoirs (effective stresses ~4000 psi).
Geosciences 15 00173 g019
Figure 20. The combined plot of four constant axial stress tests shows the evolution of axial strain with an increase in shear stress.
Geosciences 15 00173 g020
Figure 21. The combined plot of four constant axial stress tests, showing the evolution of volume strain with a decrease in mean effective stress.
Geosciences 15 00173 g021
Figure 22. The combined plot of tangent strain ratio vs. mean effective stress for all tests in the set of constant axial stress tests. As can be seen, all the curves touch the point of positive dilatancy.
Geosciences 15 00173 g022
Figure 23. The Mohr–Coulomb (MC) envelope for the yield points of constant axial stress tests (CASUTs). As can be seen, a yield surface with a friction angle of 29.3 degrees and an intercept of −582 psi is obtained.
Geosciences 15 00173 g023
Figure 24. The yield points of the constant axial stress unloading tests in the mean effective stress–shear stress plane. The slope of the yield surface is 1.07, similar to the triaxial loading yield surface, but the intercept is different.
Geosciences 15 00173 g024
Figure 25. The combined plot of three constant shear stress unloading tests, showing the evolution of axial strain as we progress through the tests. The shear stress maintains a constant value as it is a boundary condition for this set of tests.
Geosciences 15 00173 g025
Figure 26. The combined plot of three constant shear stress unloading tests showing the evolution of volume strain with the decrease in mean effective stress.
Geosciences 15 00173 g026
Figure 27. The Mohr–Coulomb envelope for the yield points of constant shear stress unloading tests. As can be seen, a yield surface with a friction angle of 29.3 degrees and an intercept of −438.5 psi is obtained.
Geosciences 15 00173 g027
Figure 28. The yield points of the constant shear stress unloading tests in the mean effective stress–shear stress plane. The slope of the yield surface is 1.07, similar to the triaxial loading yield surface, but the intercept is different.
Geosciences 15 00173 g028
Figure 29. Summary plot of the three yield surfaces obtained from experiments. All yield surfaces have similar slopes with different intercepts.
Geosciences 15 00173 g029
Figure 30. Sample yielding behavior on different stress paths. The constant axial stress unloading test has the lowest intercept, while the triaxial loading stress path has the highest intercept in this data set.
Geosciences 15 00173 g030
Figure 31. The value of the intercepts obtained from the yield surface plotted against the slope of the stress path.
Geosciences 15 00173 g031
Table 1. The values of the synthetic sample characteristics.
Material PropertyValue
Grain Size (d50)203 microns
Grain Density2.65
Mineralogy100% Quartz
Average Porosity35%
Sample Length2 in.
Sample Diameter1 in.
Test TypeDry (no pore fluid)
Table 2. Summary of initial stress states (in psi) for all constant axial stress unloading tests.
Sampleσ1σ3Initial p’Initial q
PSP 2129300435060004950
PSP 2098400435057004050
PSP 2107350435053503000
PSP 2116360435050202010
Table 3. The samples’ initial stress states (in psi) with the constant shear stress test.
Sampleσ1σ3Initial p’ Initial q
PSP 2079300435060004950
PSP 2058400435057004050
PSP 2087350435053503000
Disclaimer/Publisher’s Note: The statements, opinions and data contained in all publications are solely those of the individual author(s) and contributor(s) and not of MDPI and/or the editor(s). MDPI and/or the editor(s) disclaim responsibility for any injury to people or property resulting from any ideas, methods, instructions or products referred to in the content.

