Article

Chemistry in Retrieved Ryugu Asteroid Samples Revealed by Non-Invasive X-ray Microanalyses: Pink-Beam Fluorescence CT and Tender-Energy Absorption Spectroscopy

1
Department of Geosciences, Stony Brook University, Stony Brook, NY 11794, USA
2
National Synchrotron Light Source II, Brookhaven National Laboratory, Upton, NY 11973, USA
3
Department of Physics, State University of New York at Plattsburgh, Plattsburgh, NY 12901, USA
4
Department of Earth and Planetary Sciences, Tokyo Institute of Technology, Tokyo 152-8550, Japan
5
Department of Earth, Environmental, and Planetary Sciences, Brown University, Providence, RI 02912, USA
*
Author to whom correspondence should be addressed.
Geosciences 2024, 14(4), 111; https://doi.org/10.3390/geosciences14040111
Submission received: 18 March 2024 / Revised: 18 April 2024 / Accepted: 19 April 2024 / Published: 21 April 2024
(This article belongs to the Section Geochemistry)

Abstract

:
The Hayabusa2 space mission recently retrieved 5.4 g of material from asteroid Ryugu, providing the first direct access to pristine material from a carbonaceous asteroid. This study employs a novel combination of non-invasive synchrotron X-ray techniques to examine microscale chemistry (elemental distributions and element-specific chemical speciation and local structure) inside Ryugu grains without physically cutting the samples. Manganese primarily occurs in carbonate: Mn-bearing dolomite with minor earlier ankerite. Iron sulfides present as large single grains and as smaller particles in the finer-grained matrix are both predominantly pyrrhotite. At the 5 μm scale, Fe sulfides do not show the mineralogical heterogeneity seen in many carbonaceous meteorites but exhibit some heterogeneous localized oxidation. Iron is present often as intergrowths of oxide and sulfide, indicating incomplete replacement. Trace selenium substitutes for S in pyrrhotite. Copper is present as Fe-poor Cu sulfide. These results demonstrate multiple episodes of fluid alteration on the parent body, including partial oxidation, and help constrain the sequence or evolution of fluids and processes that resulted in the current grain-scale mineralogical composition of Ryugu materials.

1. Introduction

Earth is a dynamic and energetic system, and terrestrial processes have long ago obscured most geochemical records of the early solar system. Therefore, we look to extraterrestrial materials that better preserve that early history. Carbonaceous asteroids are some of the most important solar system objects because they are composed of primordial materials that escaped harsh planetary differentiation processes, although some were modified by post-accretion hydrothermal processes. Thus, they provide clues about the very beginning of the formation of our solar system and our planet. The JAXA Hayabusa2 spacecraft returned samples from the dark carbonaceous near-Earth asteroid 162,173 Ryugu [1]. Approximately 5.4 g of material was delivered to Earth in 2020; surface material (“A” series samples) was collected from the first touch-down site, while subsurface material (“C” series samples) was obtained from a second site in a crater produced by the impact of a projectile fired from the spacecraft. These unique samples provide access to terrestrially uncontaminated and unprocessed chemical components that are otherwise inaccessible in meteorites that fall on Earth. Initial analyses (e.g., [2,3,4]) indicated that the Ryugu particles contain abundant organic compounds, inorganic materials, and bound water, and are mineralogically and chemically similar to CI chondrite meteorites.
The major objectives of the Hayabusa2 mission were to understand the origin and the evolutionary history of primitive, organic-rich asteroids, as well as implications for the formation of the planets. Ryugu’s parent body likely formed in the colder outer ranges of the solar system, beyond the “snow line” for H2O and CO2 ices, capturing an important spatial aspect of Solar System formation, and was subsequently mildly heated to mobilize fluids that interacted with and significantly altered the original mineral and organic components, forming secondary phases such as phyllosilicates, carbonates, sulfides, and magnetite [3,4]. However, details of this primordial chemical evolution of Ryugu are not yet fully understood. Signatures of such aqueous processes are imprinted on the grain-scale mineralogy and chemistry of Ryugu samples, the study of which can shed significant light on the formation and chemical evolution of its parent body. In particular, element-specific studies identifying microscale oxidation state and chemical speciation are key to understanding and constraining both the formation and alteration history of very early solar system materials (e.g., [5,6,7]).
We were allocated two Ryugu samples by JAXA for these and related measurements. A0030 is from the surface-collected material, a 2.84 mm grain weighing 6.9 mg. C0034 is from the subsurface series, a 2.09 mm grain weighing 2.4 mg.
Synchrotron X-ray fluorescence (XRF) and X-ray absorption spectroscopy (XAS) microprobes are generally non-destructive, element-specific tools to characterize, at the micrometer to submicrometer spatial scale in heterogeneous materials, (a) the distributions and associations of most elements, and (b) their oxidation state, chemical speciation and local structure, in crystalline and non-crystalline phases. As such, these naturally complement electron microscopic techniques, providing chemical details and context, and scaling up the field of view in materials that are heterogeneous on a wide range of spatial scales. This study applies a novel combination of two less common XRF microprobe techniques to explore the chemistry within intact Ryugu samples without physical sectioning.

2. Methods

Synchrotron X-ray microprobes are most commonly used for 2-D mapping and spectroscopy of polished thin sections, due to the advantages of flat geometry and minimum thickness. Owing to the deep penetration and sampling depth of hard X-rays, sample thickness should be comparable to the probe beam footprint to optimize spatial resolution and avoid seeing overlap from grains below the surface. In order to overcome that limitation, and to preserve intact specimens, pink-beam fluorescence computed microtomography (FCT) uses XRF and absorption contrast to image the distributions and co-locations of elements (Cr and heavier) in a virtual slice through an intact sample without physically cutting it. On the other hand, “tender” energy (1–5 keV) fluorescence X-ray absorption microspectroscopy (μXRF and μXAS) probes lighter elements (Mg through Ti) [8]. Having a shallower sampling depth, tender-energy microbeam fluorescence measurements can be made on a whole grain regardless of sample thickness. Three-dimensional spatial resolution is comparable to the focused beam size for both techniques, optimizing clarity of the results. Applied to unprocessed grains, pink-beam FCT and tender-energy microspectroscopy are complementary, covering both heavier and lighter elements. In order to better relate these different measurements, we employ two trace-element proxy pairs. Strontium is well known to be co-located with Ca in most systems. Selenium is chemically similar to S, although its use as a proxy is less extensive; in this study, we use S and Se μXAS (at tender and hard X-ray energies, respectively) to substantiate applicability of this proxy in Ryugu samples.
Pink-beam FCT measurements utilized the X-ray Fluorescence Microprobe (XFM) beamline at NSLS-II. XFM is designed for monochromatic operation in the 2.3–23 keV range and optimized for high-quality, spatially resolved XAS in conjunction with element-specific XRF imaging and microdiffraction. It is also designed to operate in a pink-beam mode that delivers a 1 μm focus with up to 1000× more flux than monochromatic mode. The filtered “pink” beam X-rays are a subset of the full spectrum “white beam” from the synchrotron source, in this case ranging from approximately 12 to 20 keV.
Conventional 2-D hard X-ray microprobe measurements, with effective sampling depth tens to hundreds of μm, would require sample thickness comparable to the size of the beam focus. In contrast, FCT provides a virtual slice whose thickness is defined by the vertical dimension of the probe beam, in this case 1 μm. Pixel size in the plane of the slice is defined by measurement parameters and ultimately limited by beam size. This effectively provides measurement of multiple 1 μm thick virtual slices of much larger areas than could be physically obtained by mechanical ultramicrotome or FIB sectioning, particularly in such friable material as the Ryugu samples, while preserving precious samples unaltered. Here we report pink-beam FCT of a fragment of sample C0034. Details of how these measurements were made are provided in the Supplementary Material.
These FCT measurements identify major- and trace-element distributions and co-locations, while concurrent measurement of transmission through the sample provides a map of absorption contrast to identify specific phases within a sample. However, it is important to note that there are limitations to quantitative interpretations of concentration or elemental ratios. Over large cross-sections, the virtual slices show a decrease in signal toward the center. Similar artifacts of intensity occur within large high-density grains. These absorption effects are highly dependent on an element’s fluorescence energy, and are more pronounced for lighter elements. For example, Fe shows a steeper gradient of intensity than Se. Elements lighter than Cr are only visible near the edges of the slice. There is a similar energy- and depth-dependence for elemental sensitivity. Heavier elements such as Se can be detected at trace concentrations of ~100 ppm, while lighter elements require higher concentrations up to wt%. While it is challenging to present whole-slice images at a fixed color scale, it is clearer to view smaller areas of large slices. Tender-energy μXRF and μXAS measurements of whole grains were used to probe important lighter elements. “Tender”-energy X-rays are ~1–5 keV in energy, between more typical “hard” and “soft” X-rays. This work used a monochromatic beam tuned for the K absorption edges of, e.g., S and P, and to stimulate fluorescence from elements Mg through Ca. Since the sampling depth in this energy range is a few μm, comparable to beam focus size, these near-surface measurements can be made regardless of sample thickness. Here we report tender-energy microspectroscopy of whole grains C0034 and A0030, and the fragment of C0034 used for FCT.
Measurements utilized the TES beamline at NSLS-II, which was designed and optimized for μXRF and μXAS in the tender-energy range [8]. The monochromatic beam was focused by a KB mirror pair to a user-tunable spot size of 2 to 10 μm, and the sample was raster-scanned on-the-fly across this focus in a helium-filled sample chamber. Some tender-energy measurements were made at the XFM beamline employing an accessory helium-filled sample chamber. Although the XFM beamline is not optimized for the tender-energy range, it is capable of reaching down into that range as far as the S K-edge. Samples are interchangeable between TES and XFM.
Microbeam XAS measurements included both short and long-range scans. X-ray absorption near-edge spectroscopy (μXANES) provides element-specific information about oxidation state and chemical species, while extended X-ray absorption fine structure (μEXAFS) analysis provides details of local structure within about 10 Å. These are accessory measurements for both hard and tender energies, and are employed here for P, S, Se, Ca and Mn, to enhance the interpretation of FCT and XRF results. These spectroscopic techniques, particularly at tender energies, provide an opportunity to identify phases in samples that are too thick for effective microbeam XRD. μXANES spectra are measured by focusing the beam at a desired location and scanning the incident beam energy across an element’s absorption edge while measuring that element’s characteristic X-ray fluorescence. The absorption edge position is indicative of oxidation state, and spectral features can be used to identify chemical species relative to reference standards. These features, typically peaks and resonances, arise from potential electronic transitions that are sensitive to bond configurations (first- and second-neighbor) and crystal field effects, as well as the absorbing element’s structural and symmetry environments. Detailed spectral feature analysis deconstructs XANES spectra into these specific features that can be quantitatively associated with chemical species. μEXAFS measures the interference patterns of photoelectrons from the absorbing atom being reflected by neighboring atoms within about 10 Å. These oscillations extend up to about 1000 eV above the absorption edge, requiring longer scans. μXAS spectra were processed and normalized using the Athena software [9]. EXAFS data were processed, Fourier transformed to radial distribution functions, and fit to model structures using the Athena and Artemis software packages [9].
XANES spectra can also guide speciation imaging via multi-energy mapping, wherein an XRF map is repeated at incident beam energies tuned to particular XANES features characteristic of different chemical species of an element. Fluorescence intensities in these maps are then processed to isolate the contributions of each species in each pixel in order to map the relative distribution of those species (see e.g., [10,11]). This technique was used here for S.

3. Results

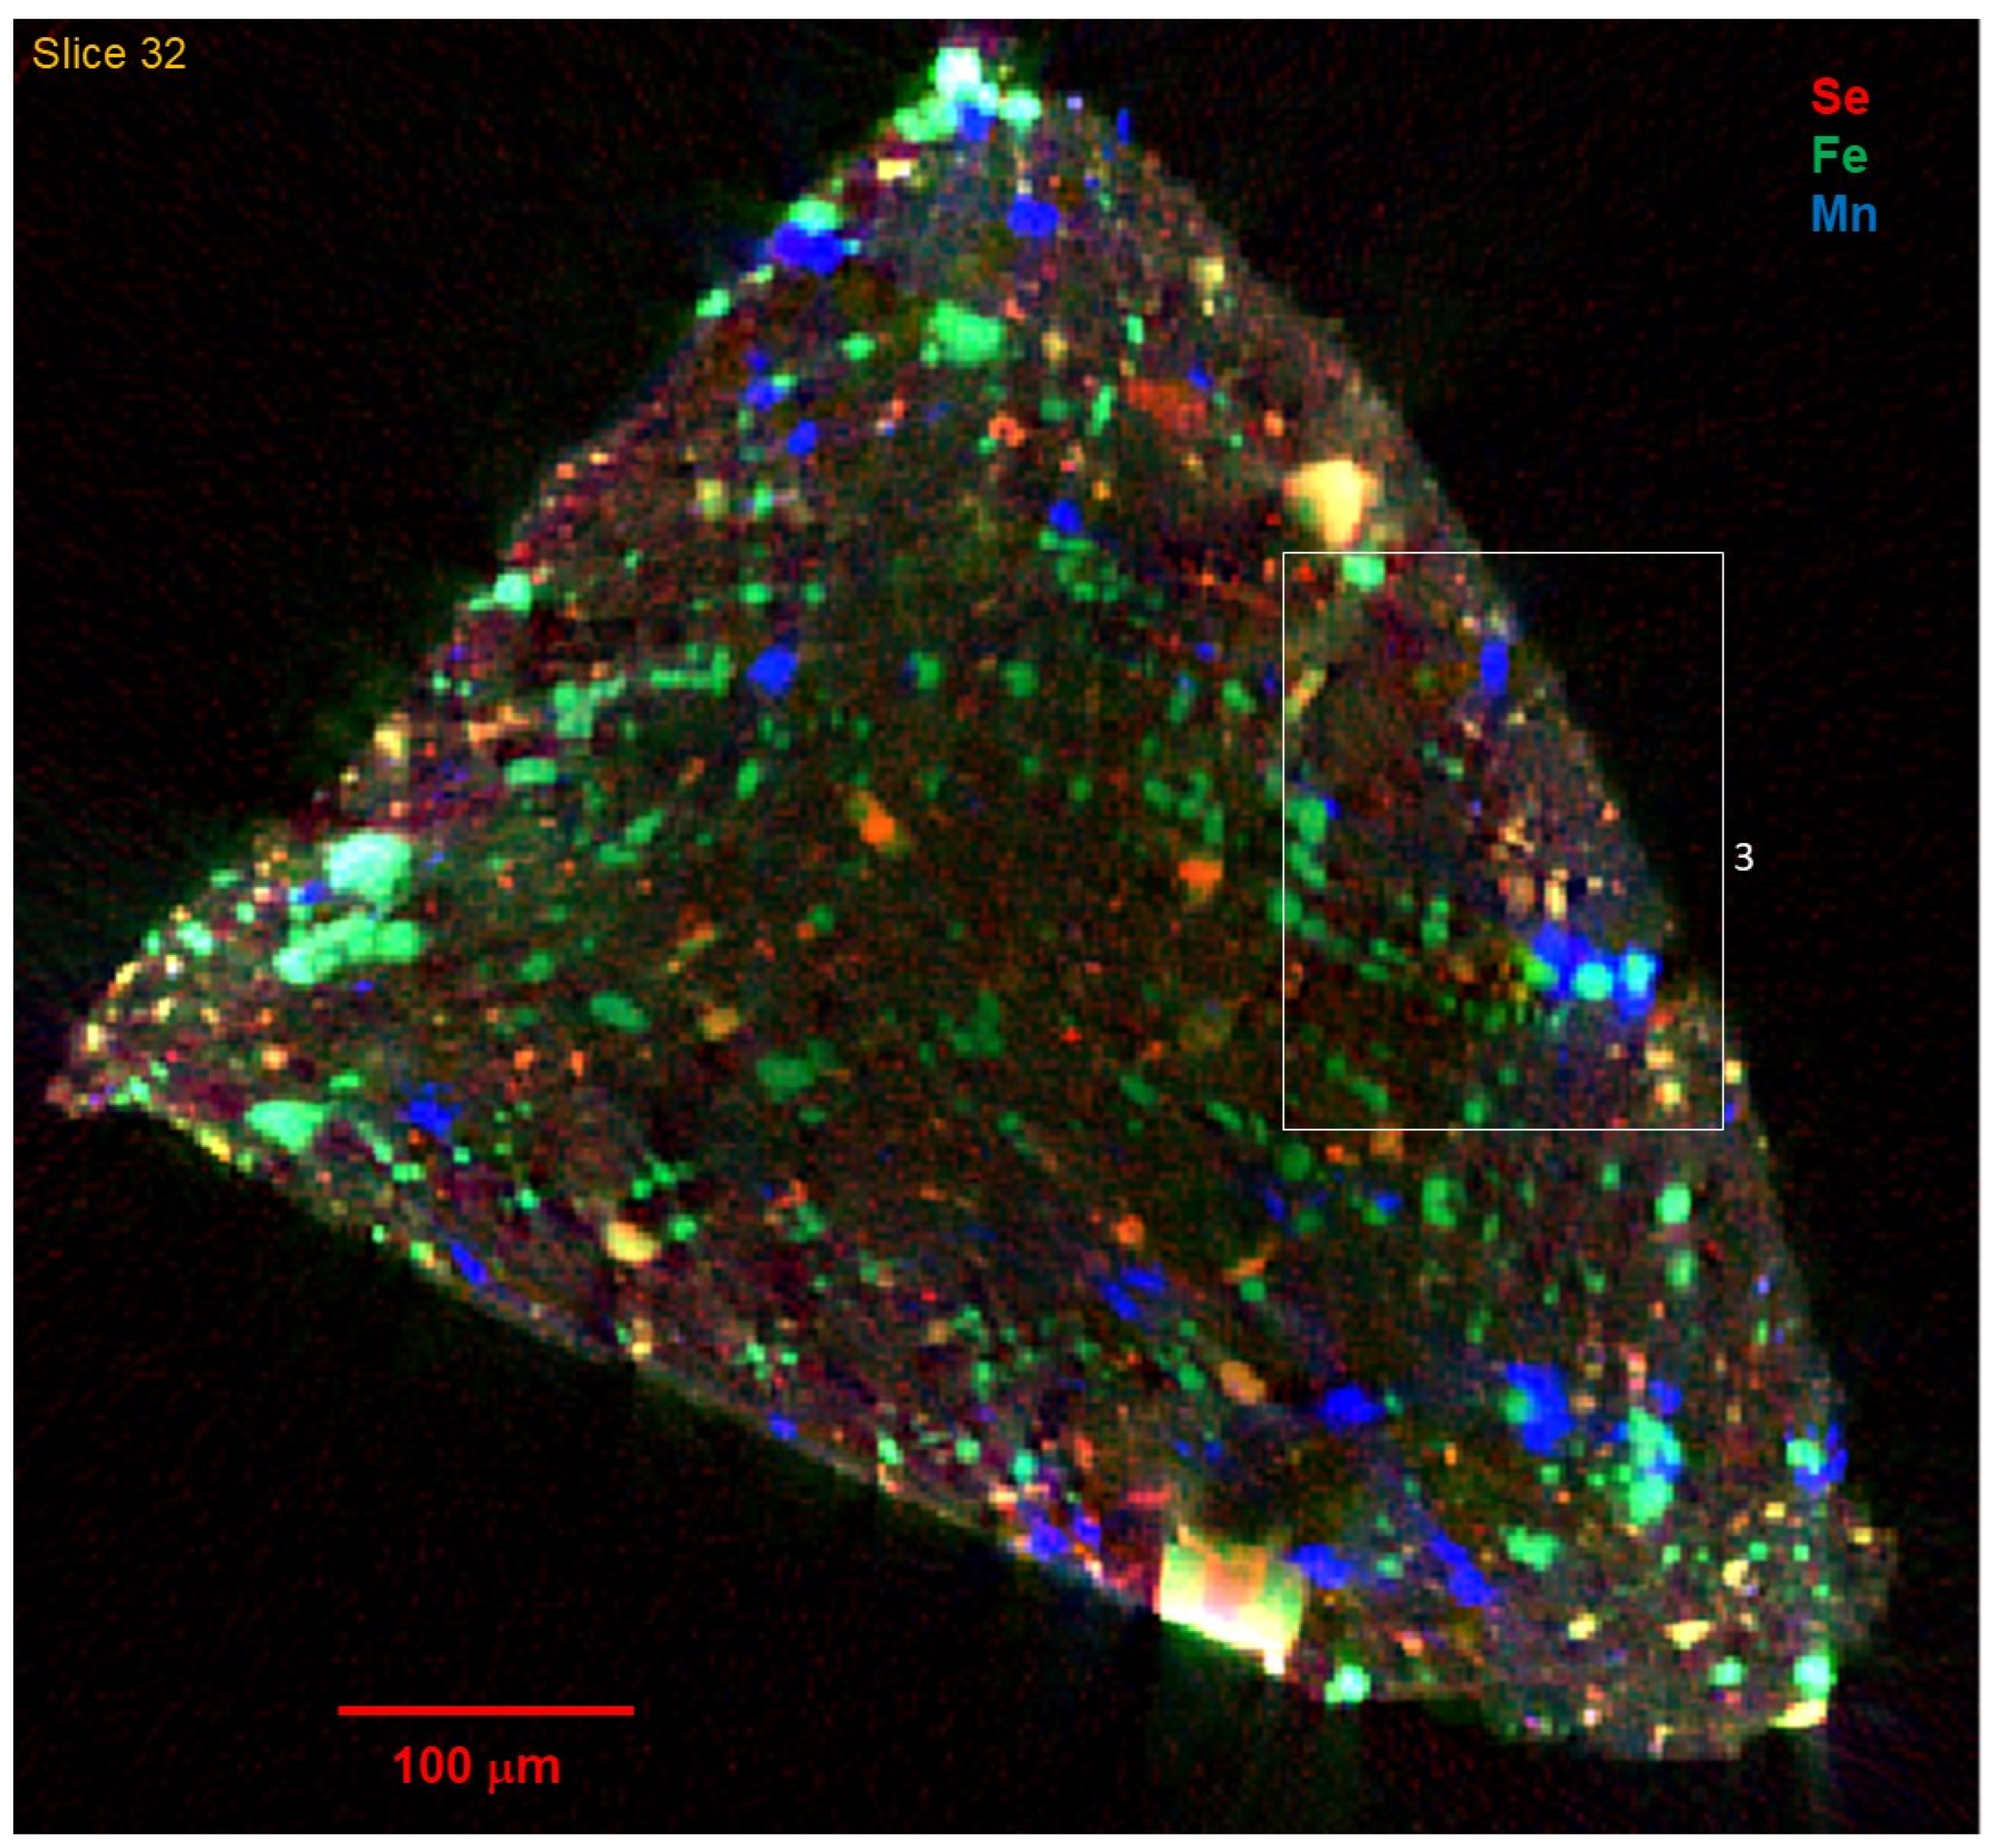
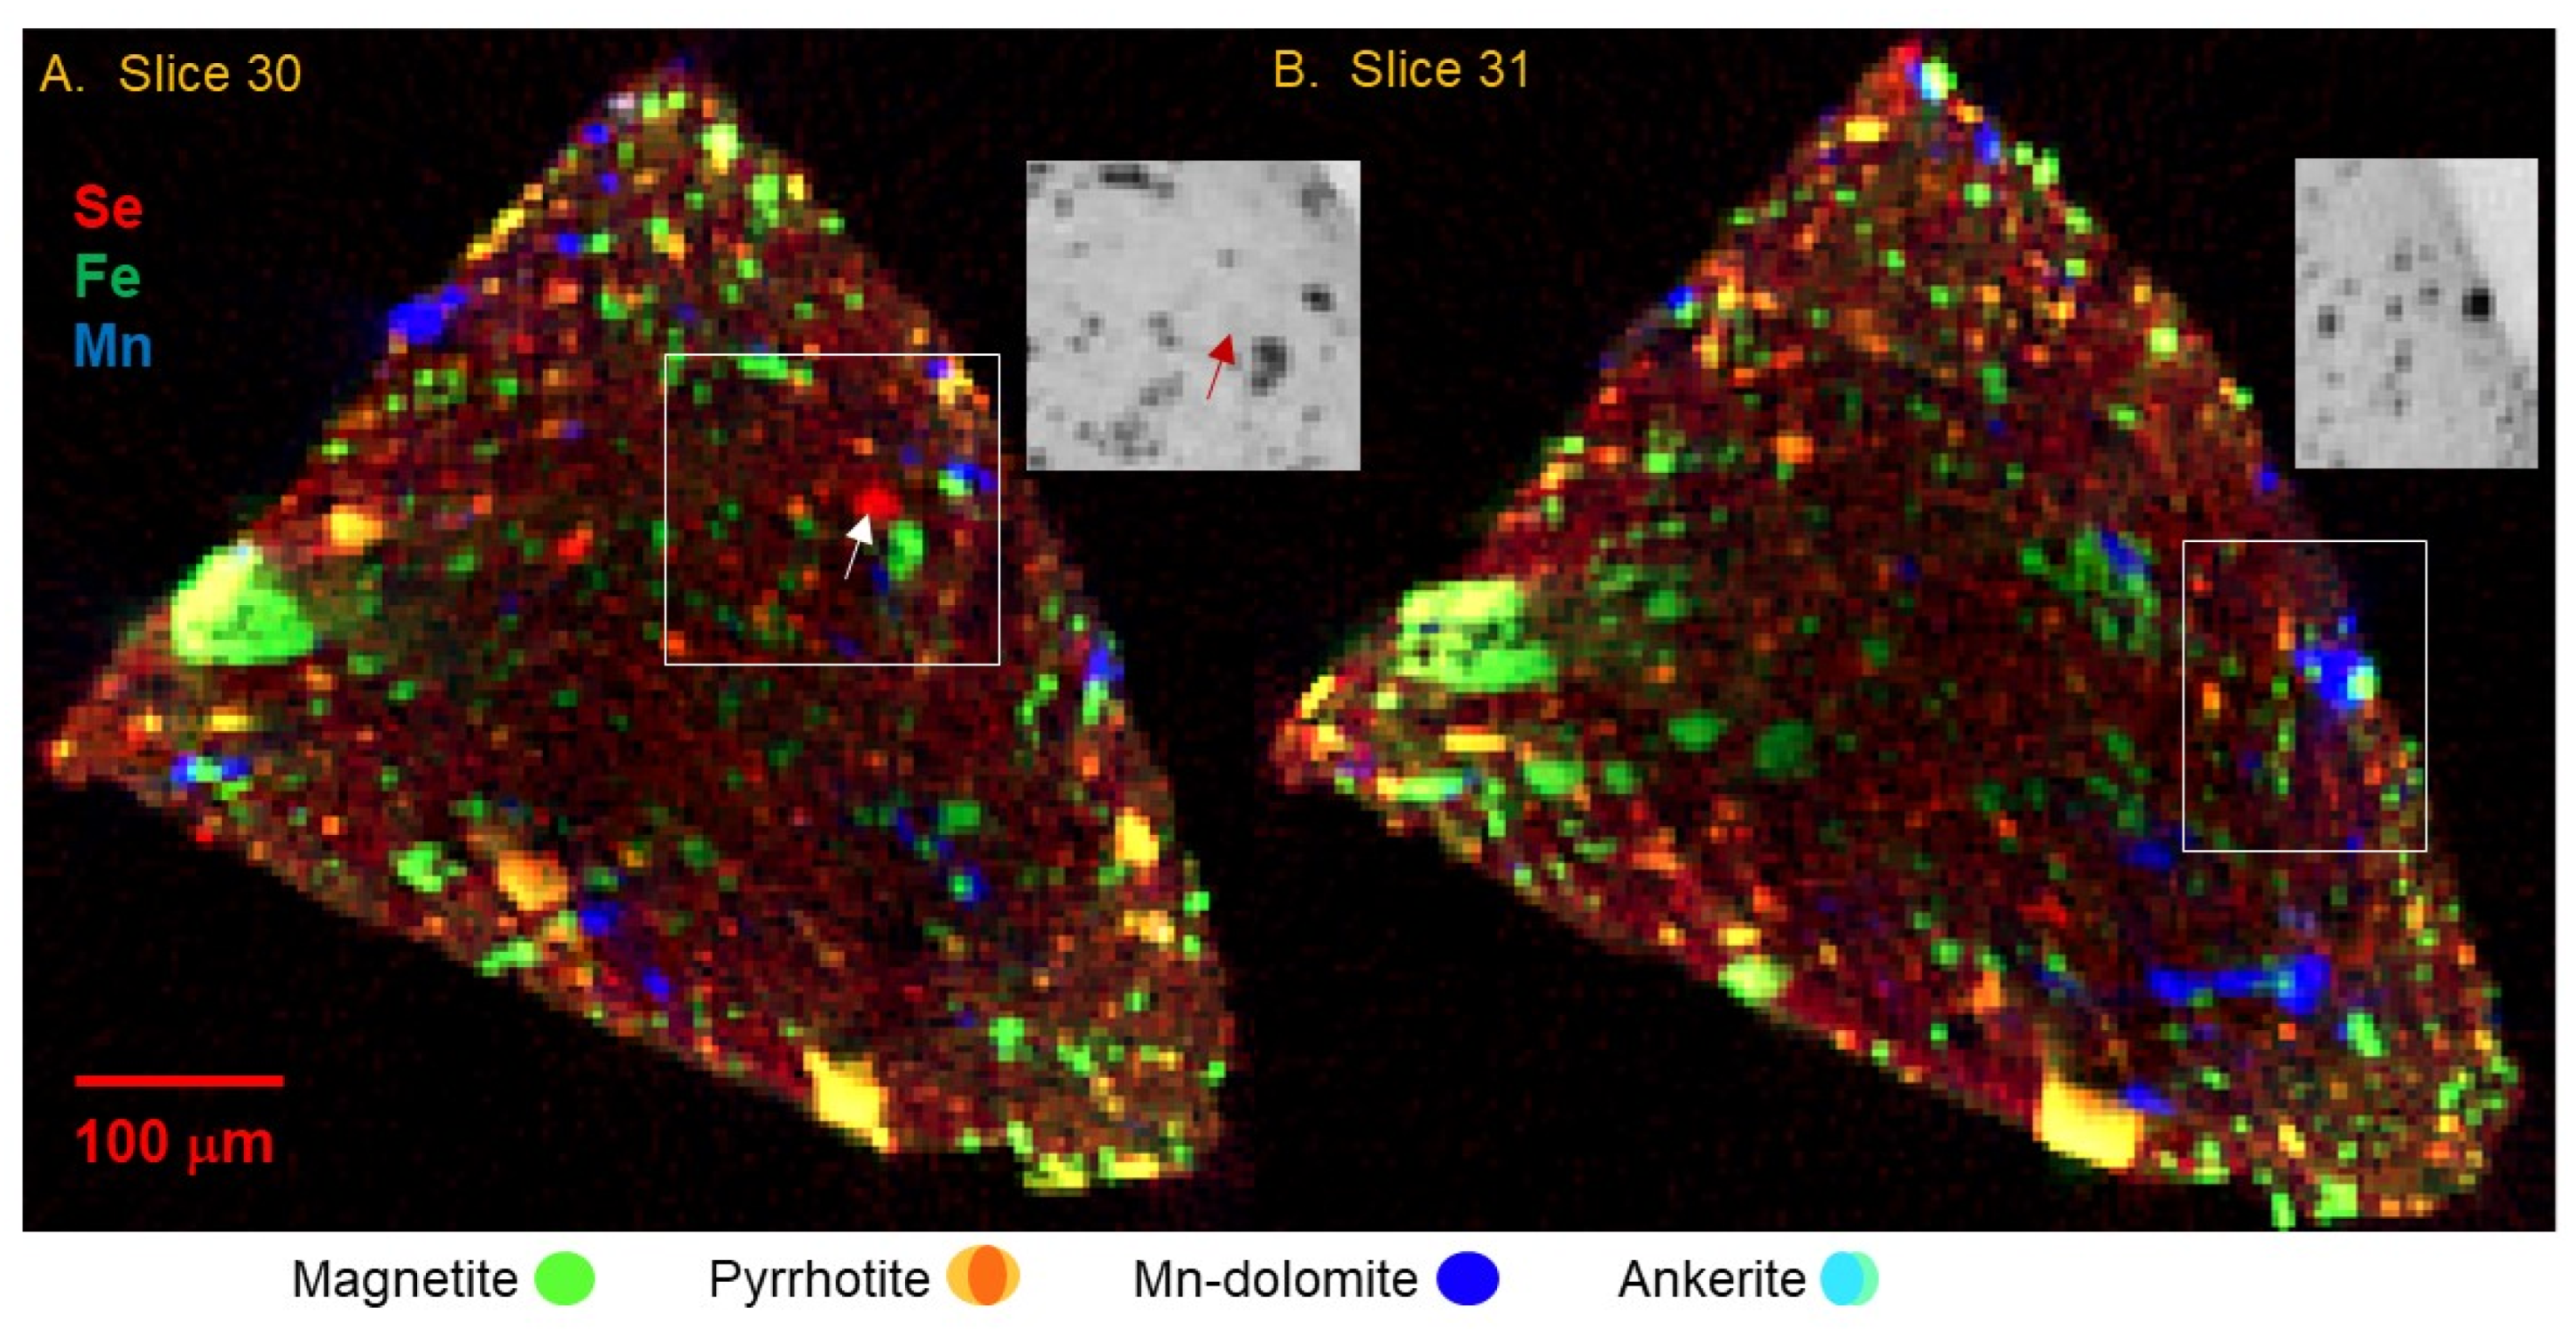
Figure 1 depicts the distribution of Se, Fe, and Mn in reconstructed tomographic slices numbered 30 and 31, at 4 μm spatial resolution, for a fragment of sample C0034. Figure 2 and Figure 3 show the same elements in slices 32 and 33, measured and reconstructed at finer 2 μm spatial resolution. Consecutive numbered slices were measured at 10 μm increments in z. Figure 4, Figure 5 and Figure 6 highlight closer views of these and other elements in selected areas of interest.
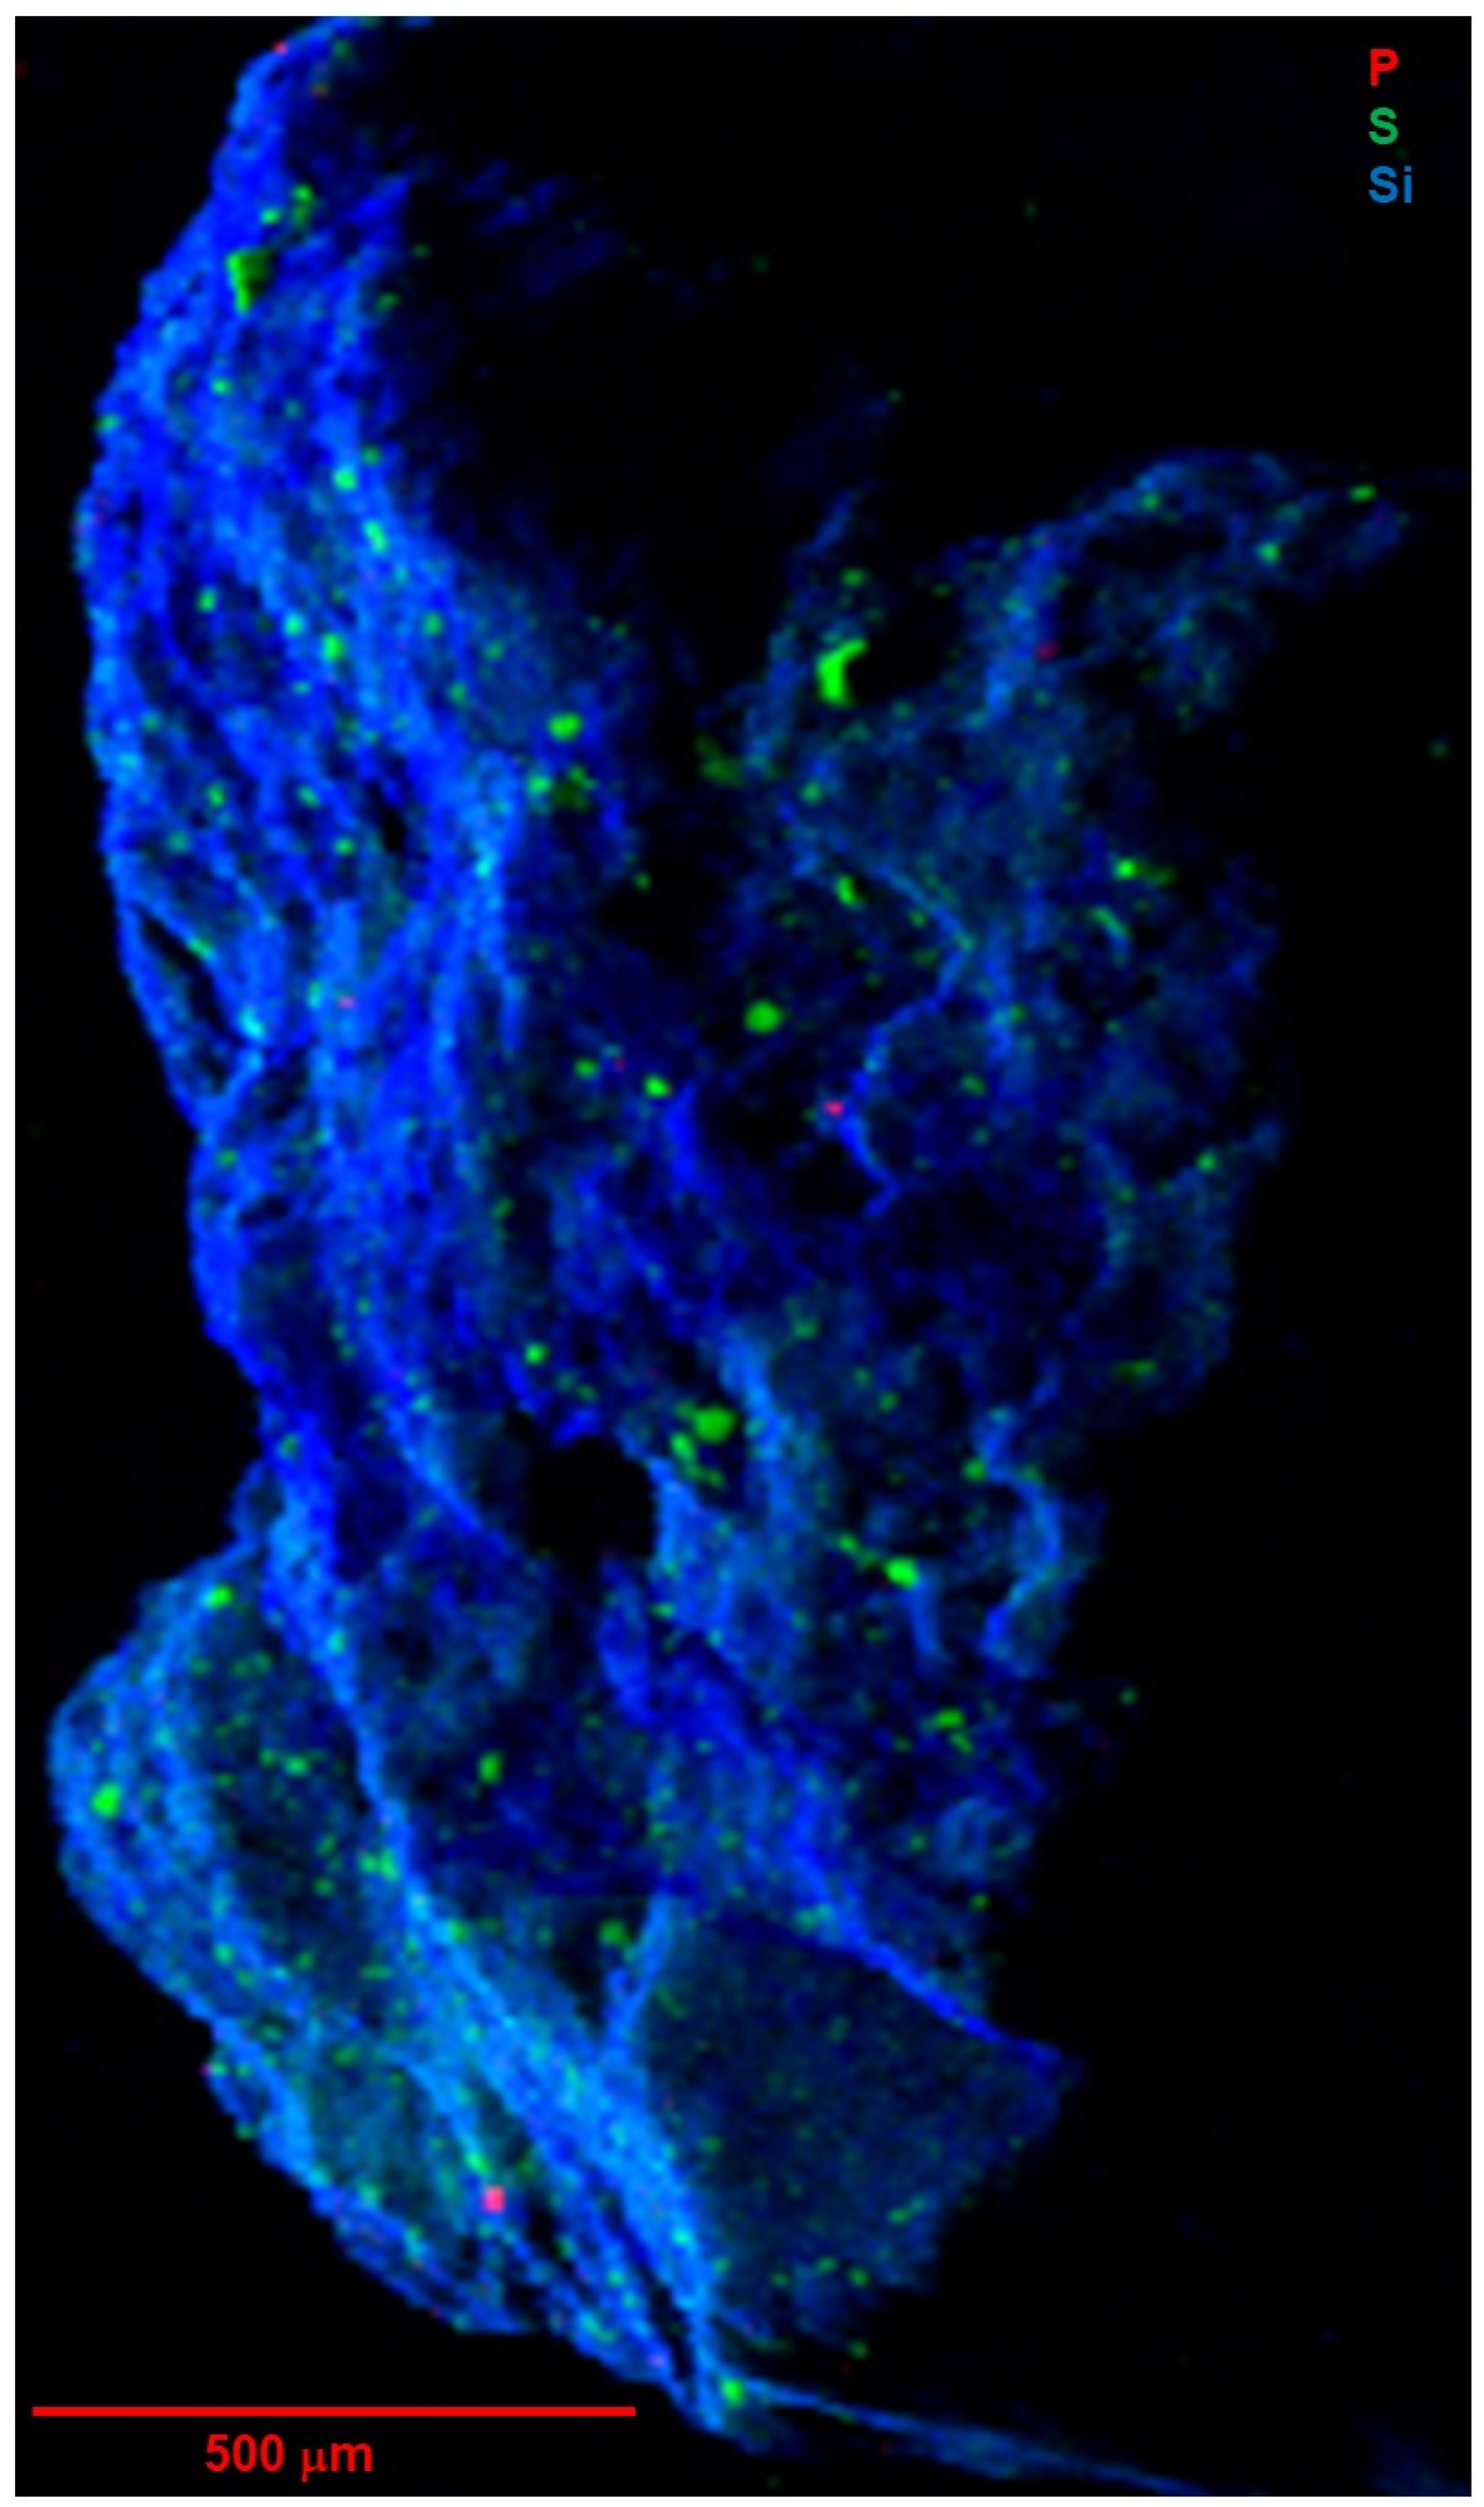
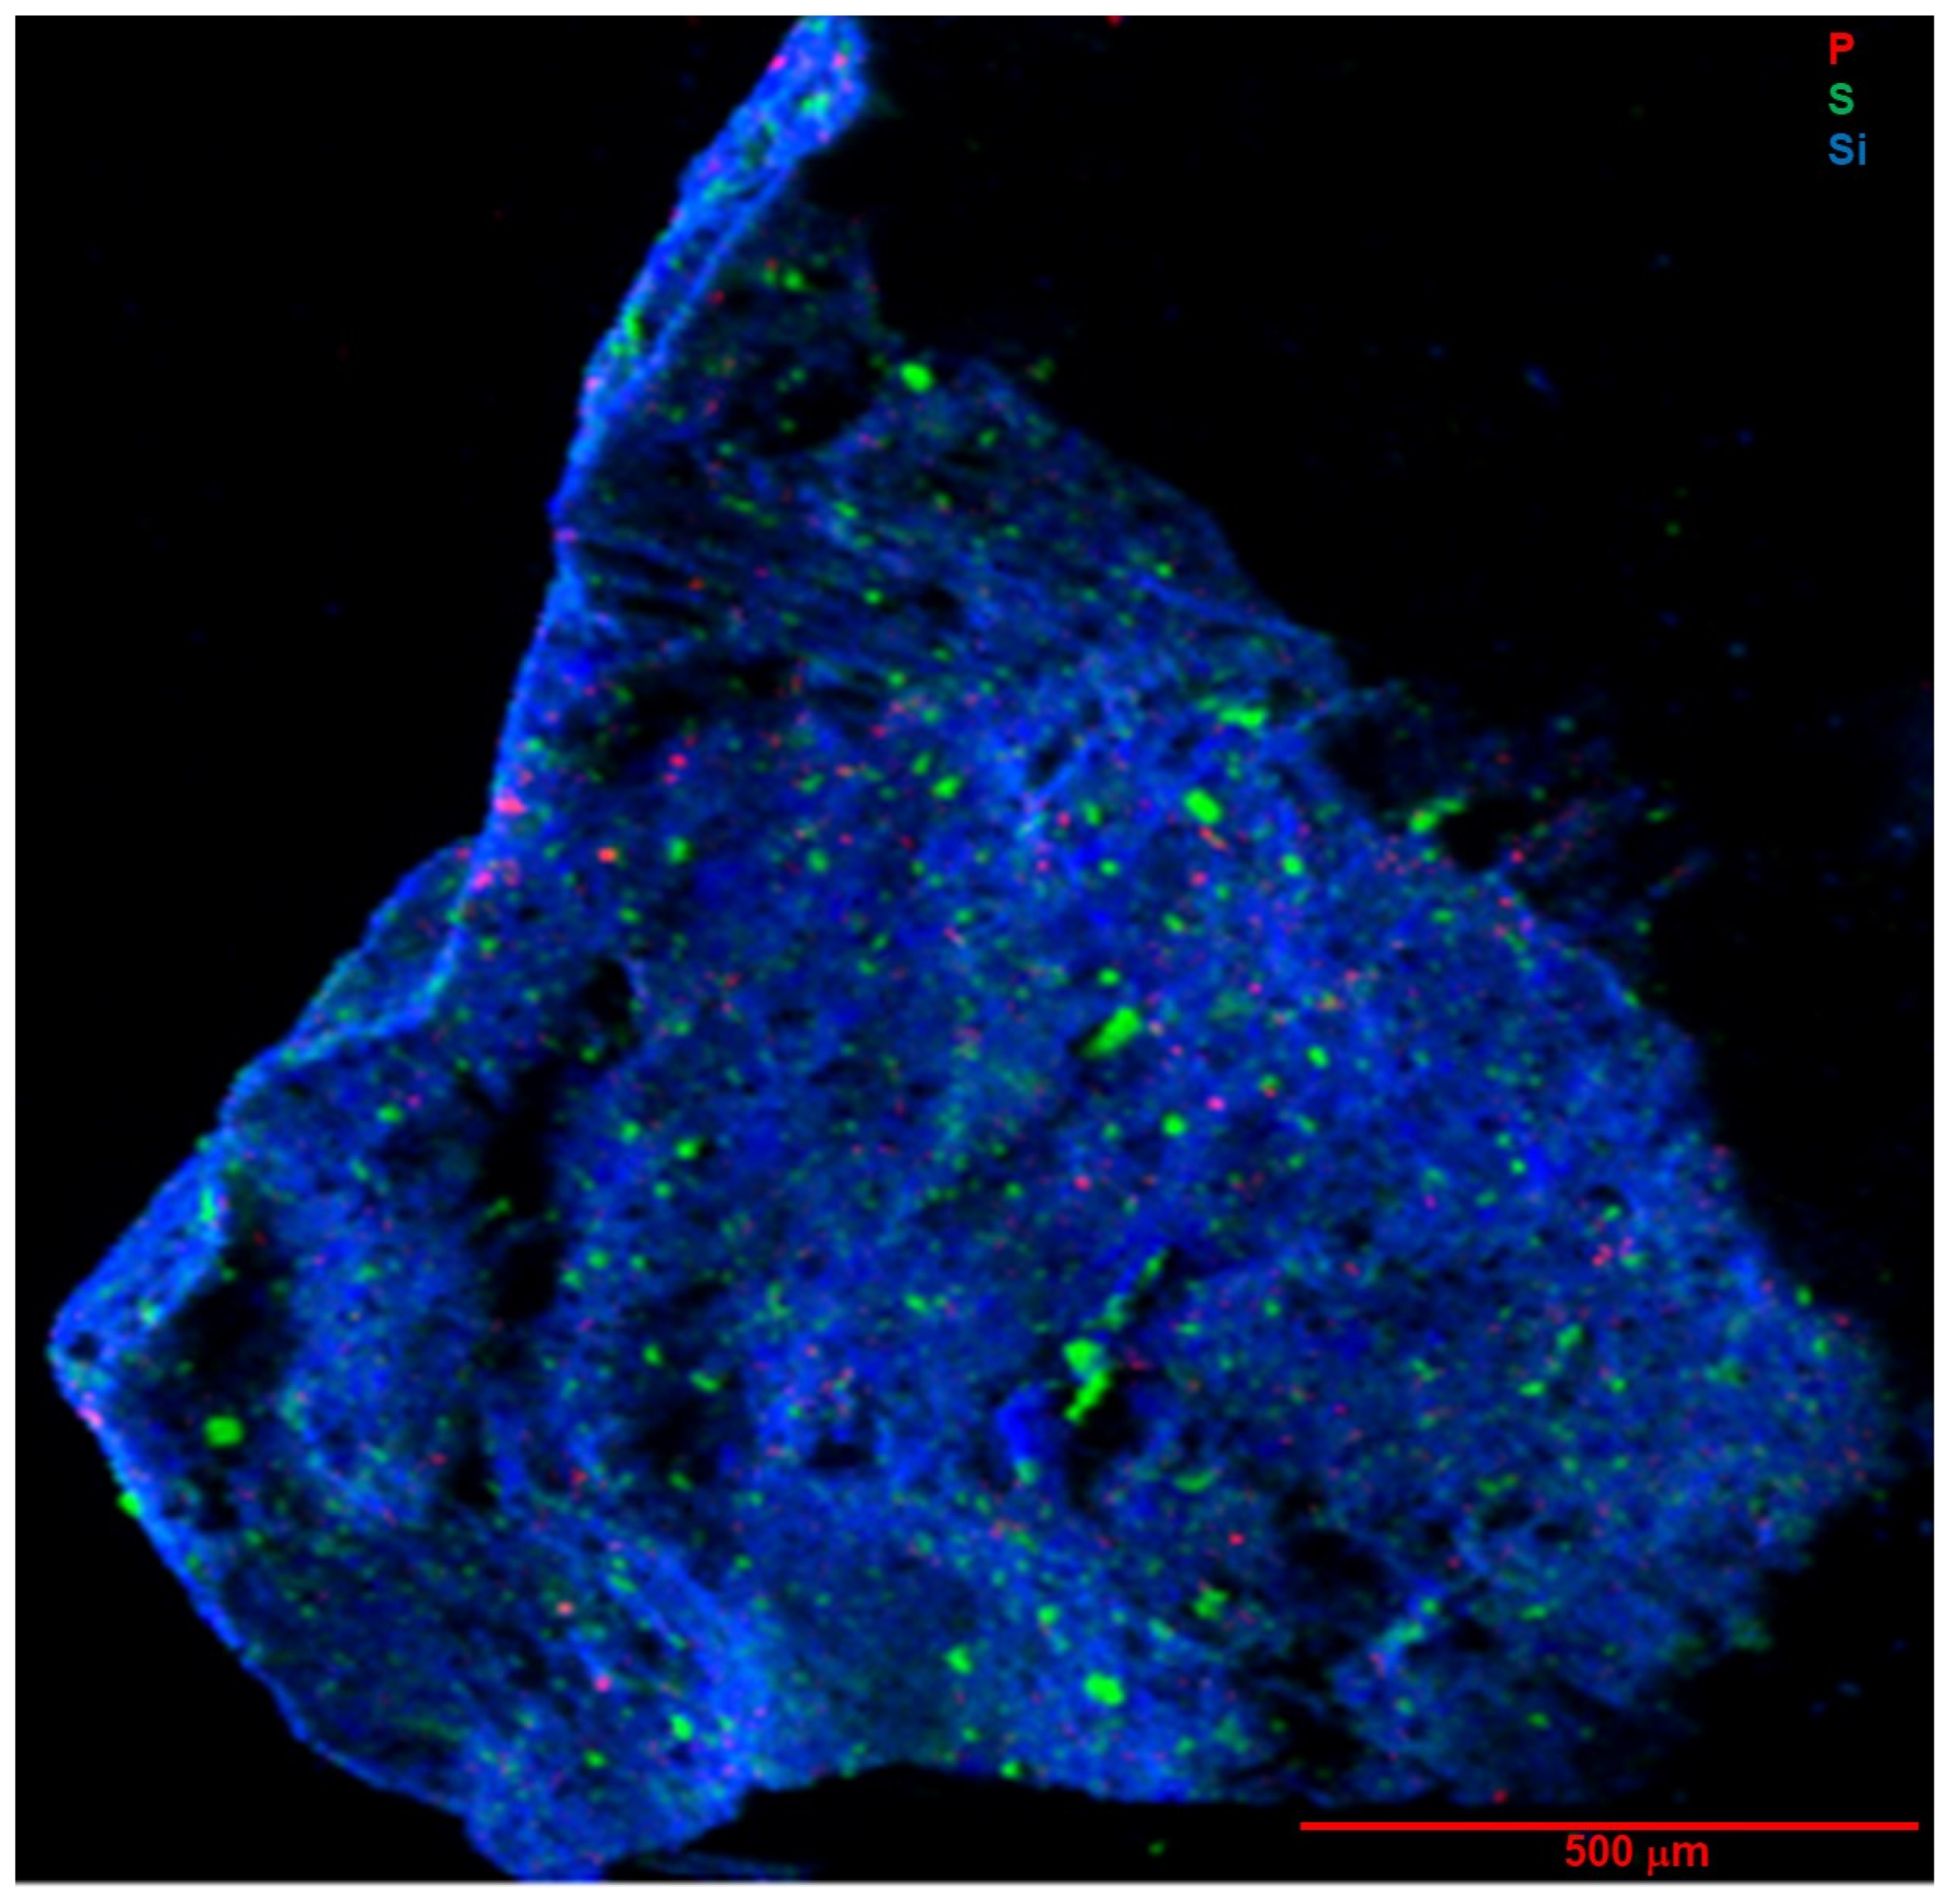
 Figure 7 and Figure 8 show tender-energy XRF maps of the near-surface distributions of lighter elements P, S, and Si in whole-particle A0030 and C0034, respectively. Figure 9 shows maps of lighter elements from Mg to Mn in the same fragment of C0034 as measured by FCT.
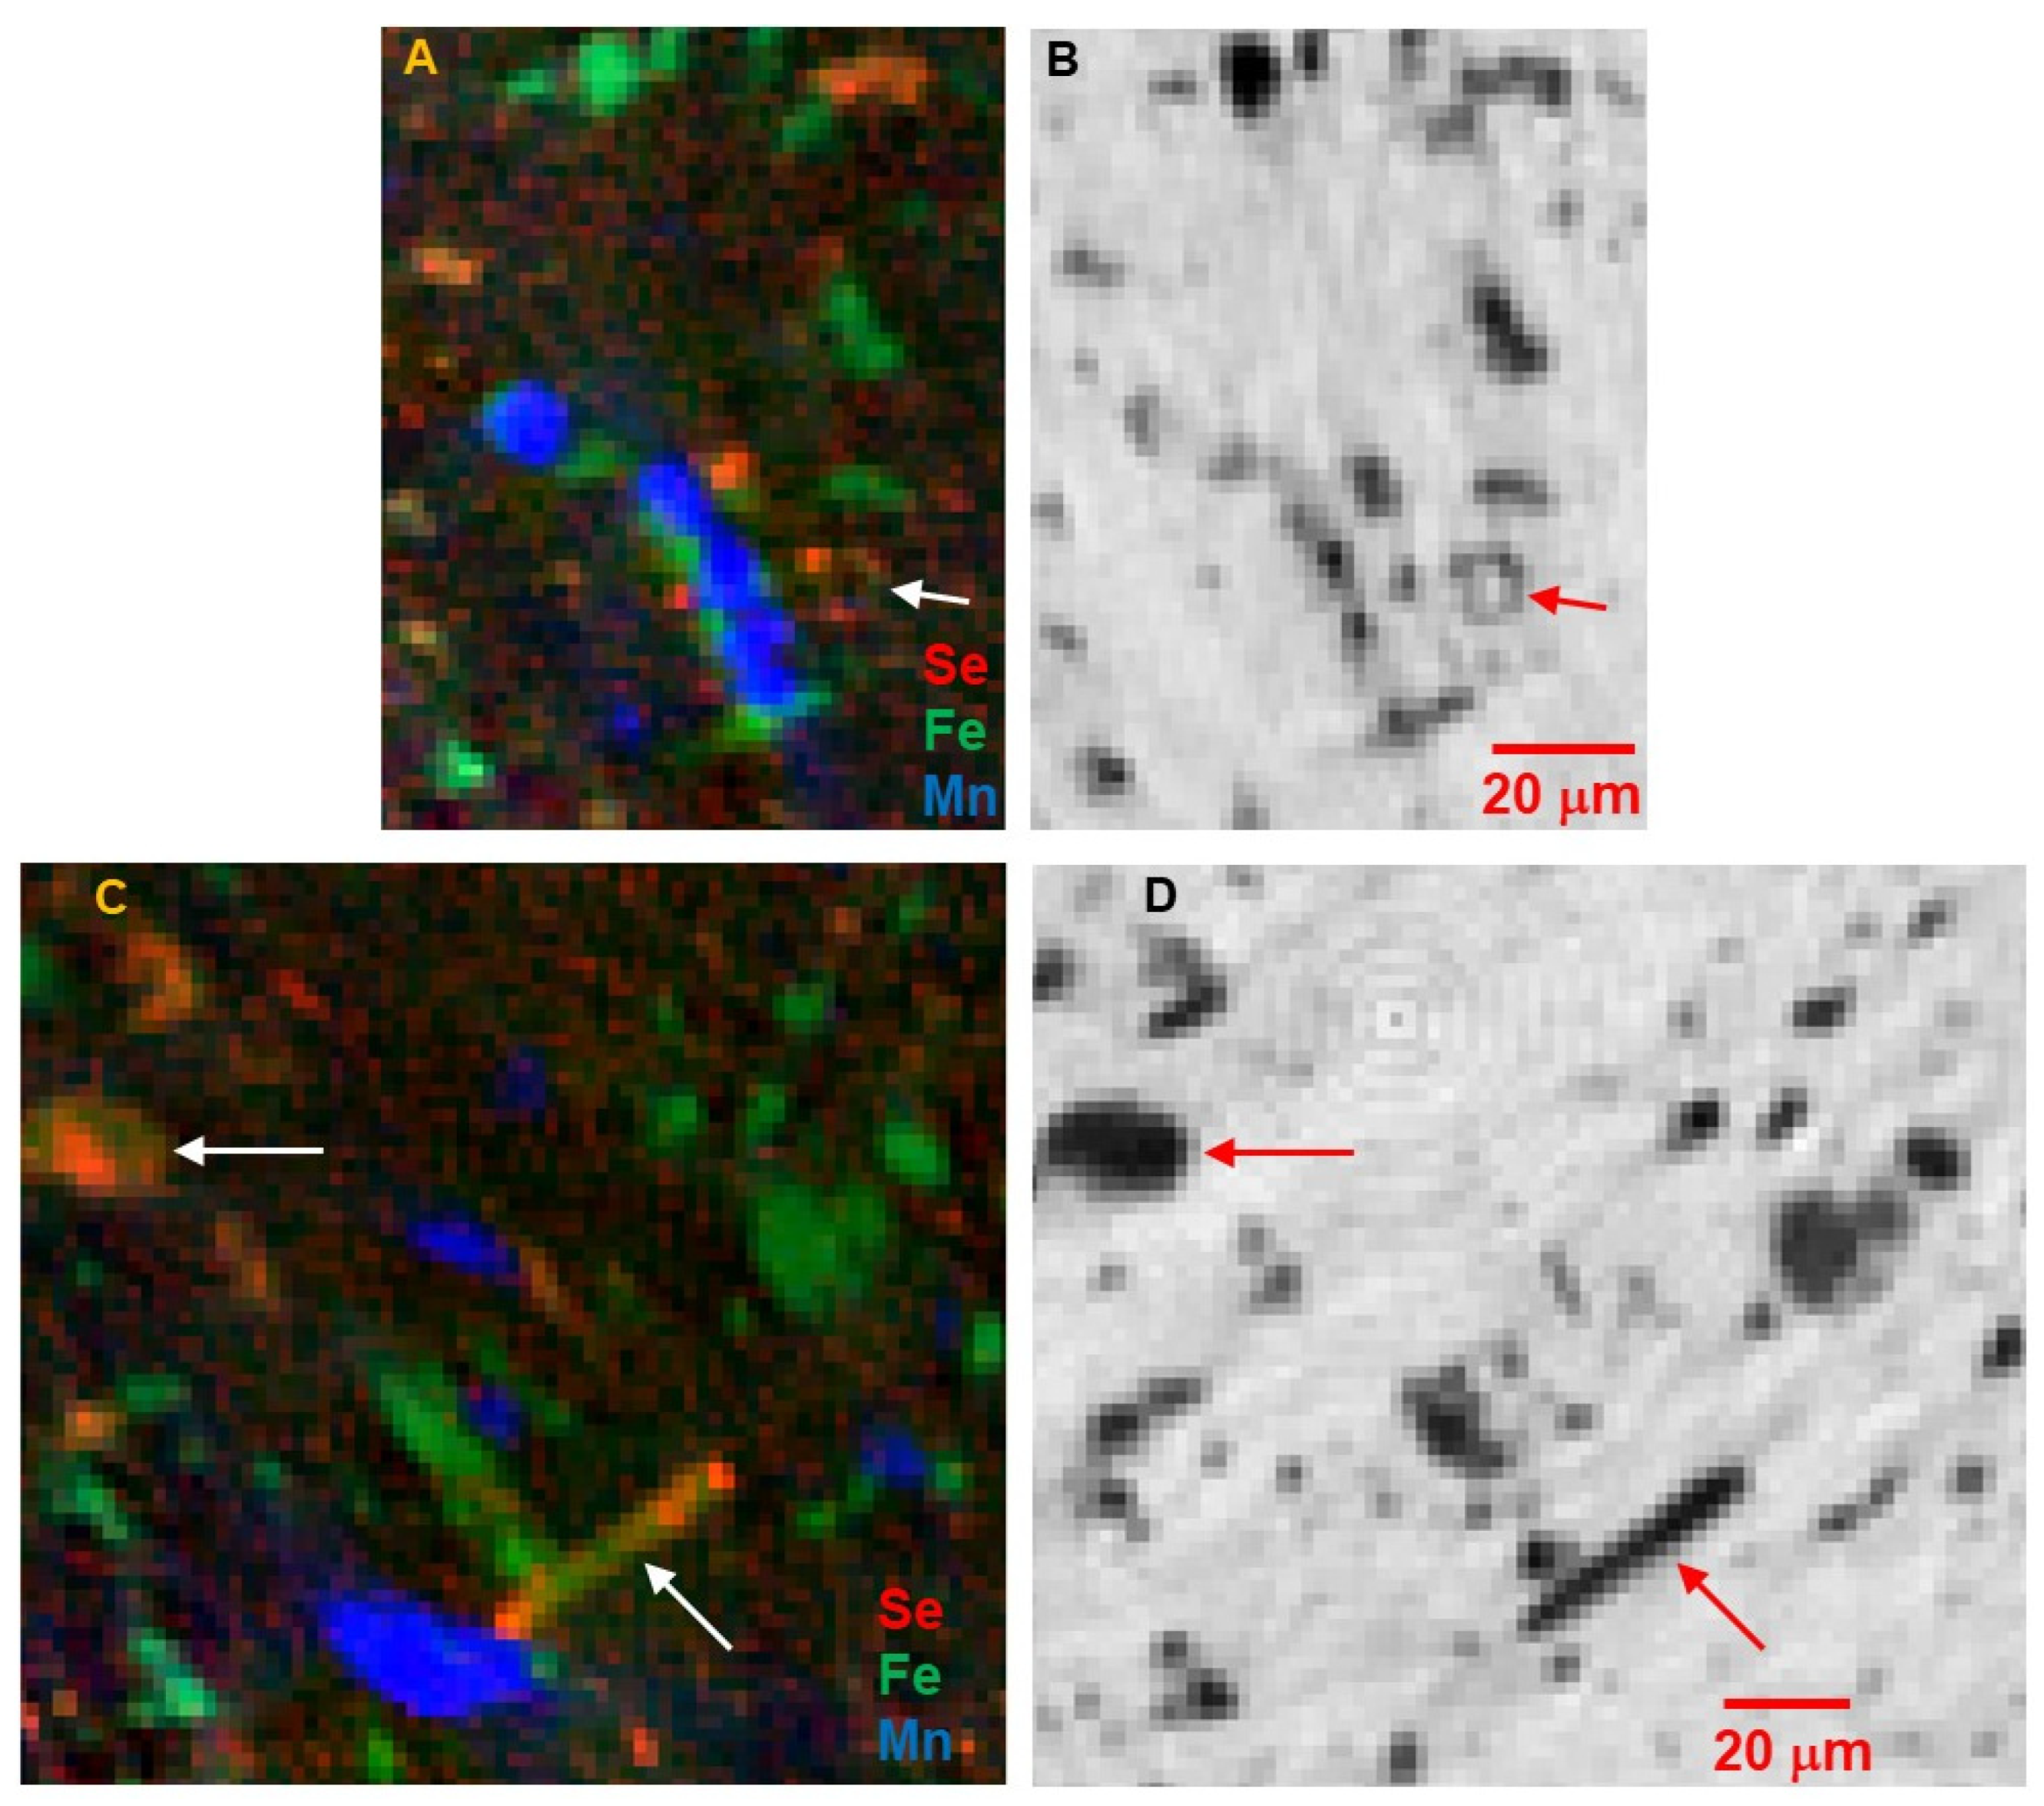
The tomograms show a complex texture that includes larger mineral grains up to >50 μm across, in a finer (<4 μm grains) matrix. The larger grains are mostly rounded in shape, although there are notably more euhedral rod-like or platy shapes as in Figure 4C,D. A subtle fabric is apparent, particularly in the close-up images in Figure 5, in which chains of like particles are oriented in slightly curved striae from upper left to lower right, while rod-like shapes (platy crystals intersecting the tomographic slice) are oriented at 90 degrees to that texture.
The dominant Fe phases are expected to be oxides and sulfides, with lesser amounts in silicates (primarily serpentine and ferruginous saponite) and carbonate. Figure 1, Figure 2, Figure 3, Figure 4, Figure 5 and Figure 6 show that Fe dominates the larger particles, and that these have the highest absorption contrast consistent with high Fe concentration as found in oxides and sulfides. The presence of Se with Fe distinguishes the sulfides. Selenium was chosen as a trace-element proxy for S to locate sulfides and other S-bearing phases. A clear Se signal is present in ~30% of the >5 μm Fe-bearing grains, but in ~80% of the fine-grained Fe-bearing particles in the matrix. Some of the large Fe-bearing grains, particularly as shown in 
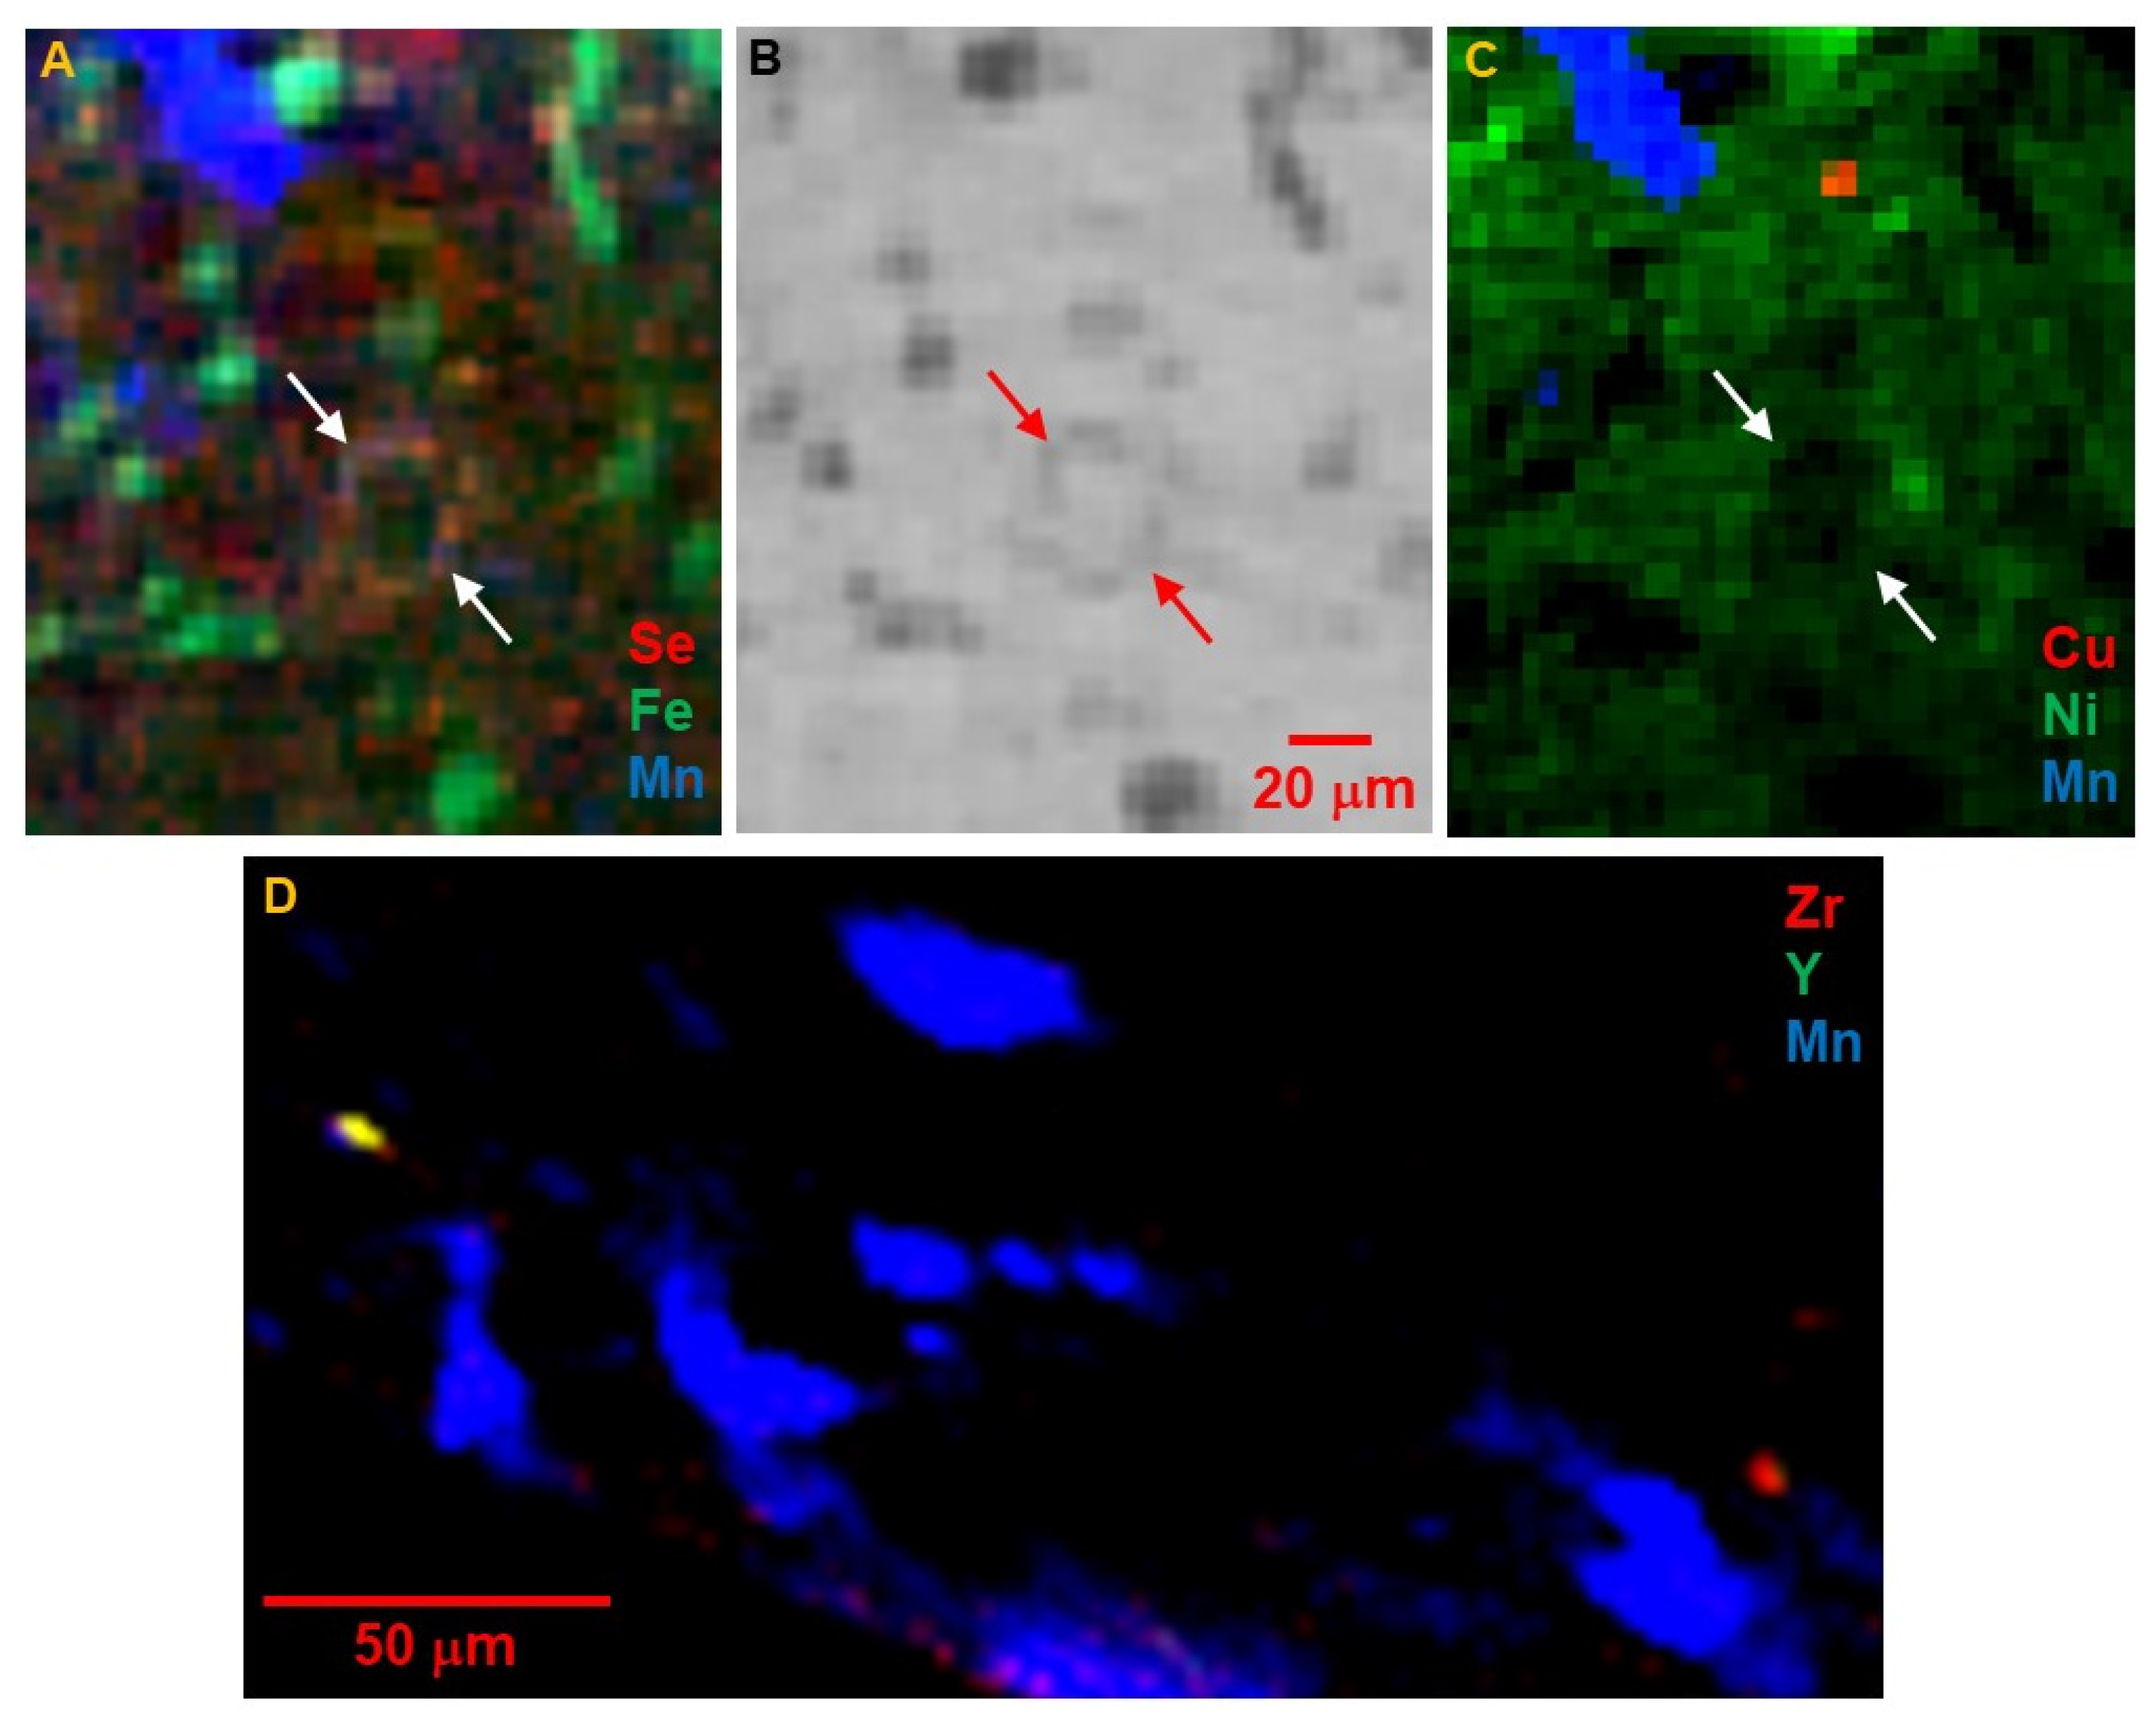
Figure 4C, are an intergrowth of sulfide and oxide; the importance of this is discussed below. There are also several instances, such as those shown in Figure 4A,B and Figure 6A,B, of small Fe-sulfide grains forming a rim on a round structure of Fe-poor low-absorption material. This is similar to the necklace-like string of Fe sulfide particles surrounding a phyllosilicate nodule as described in Figure 6 of [4].
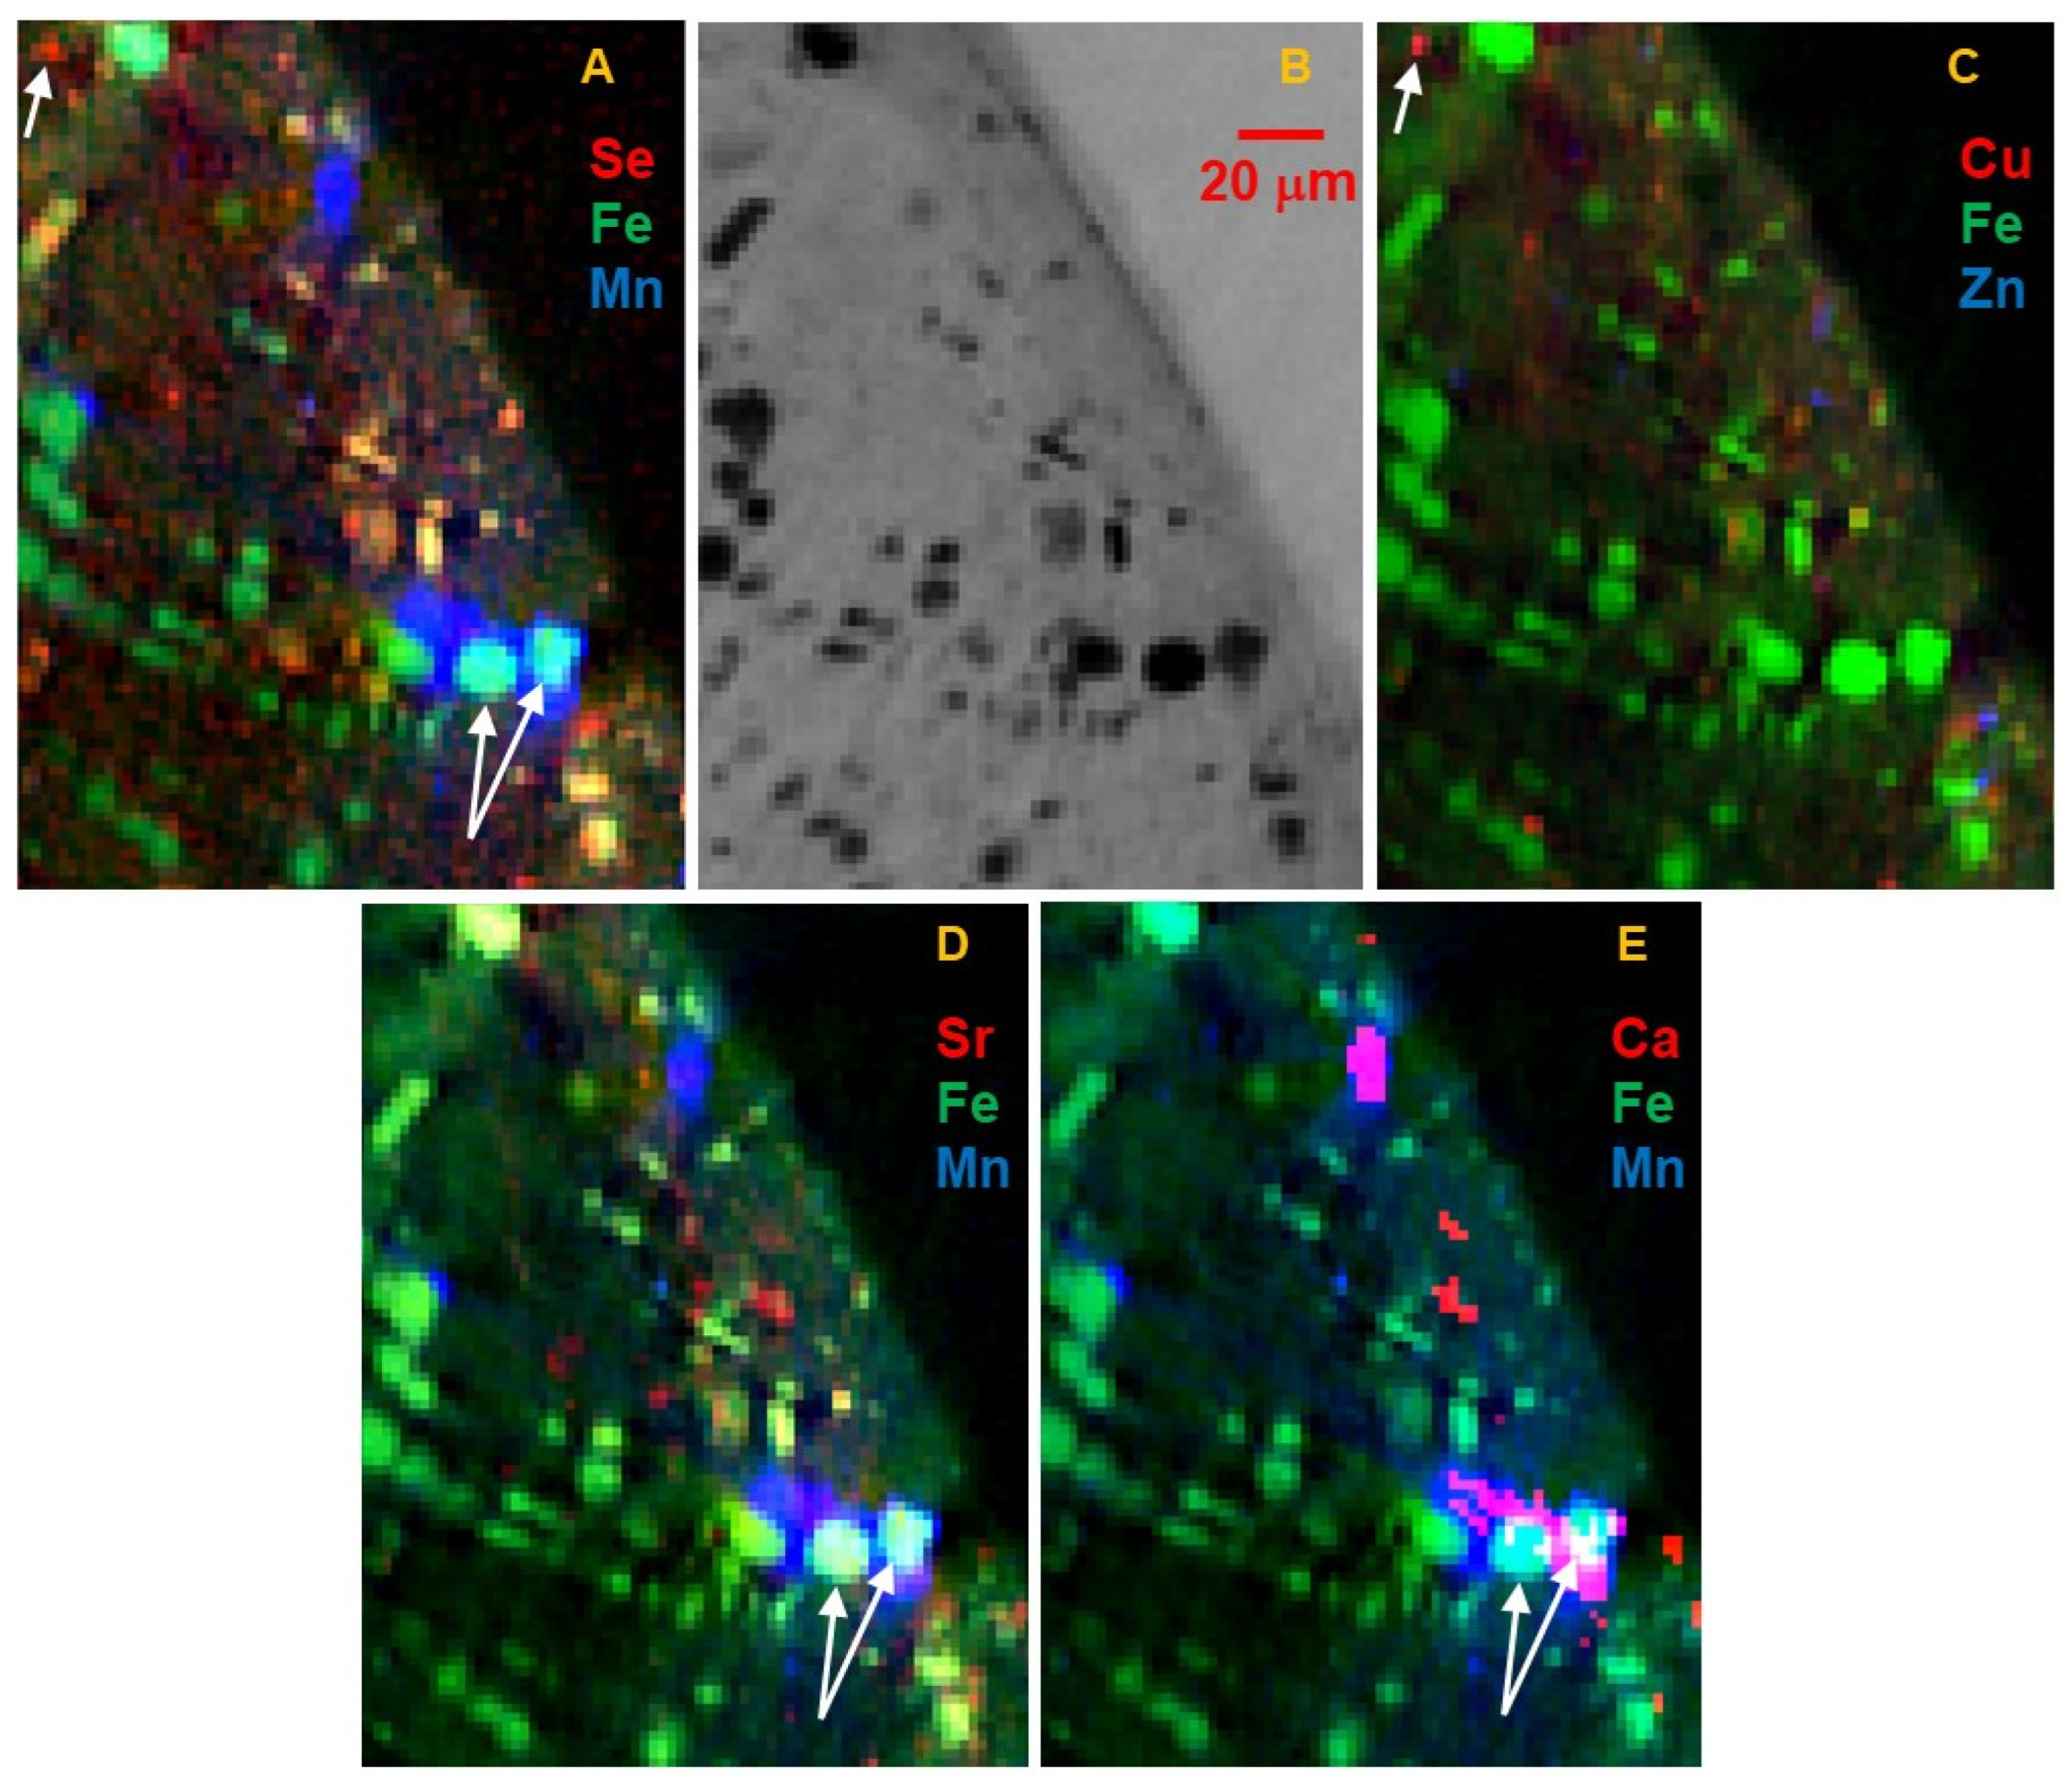
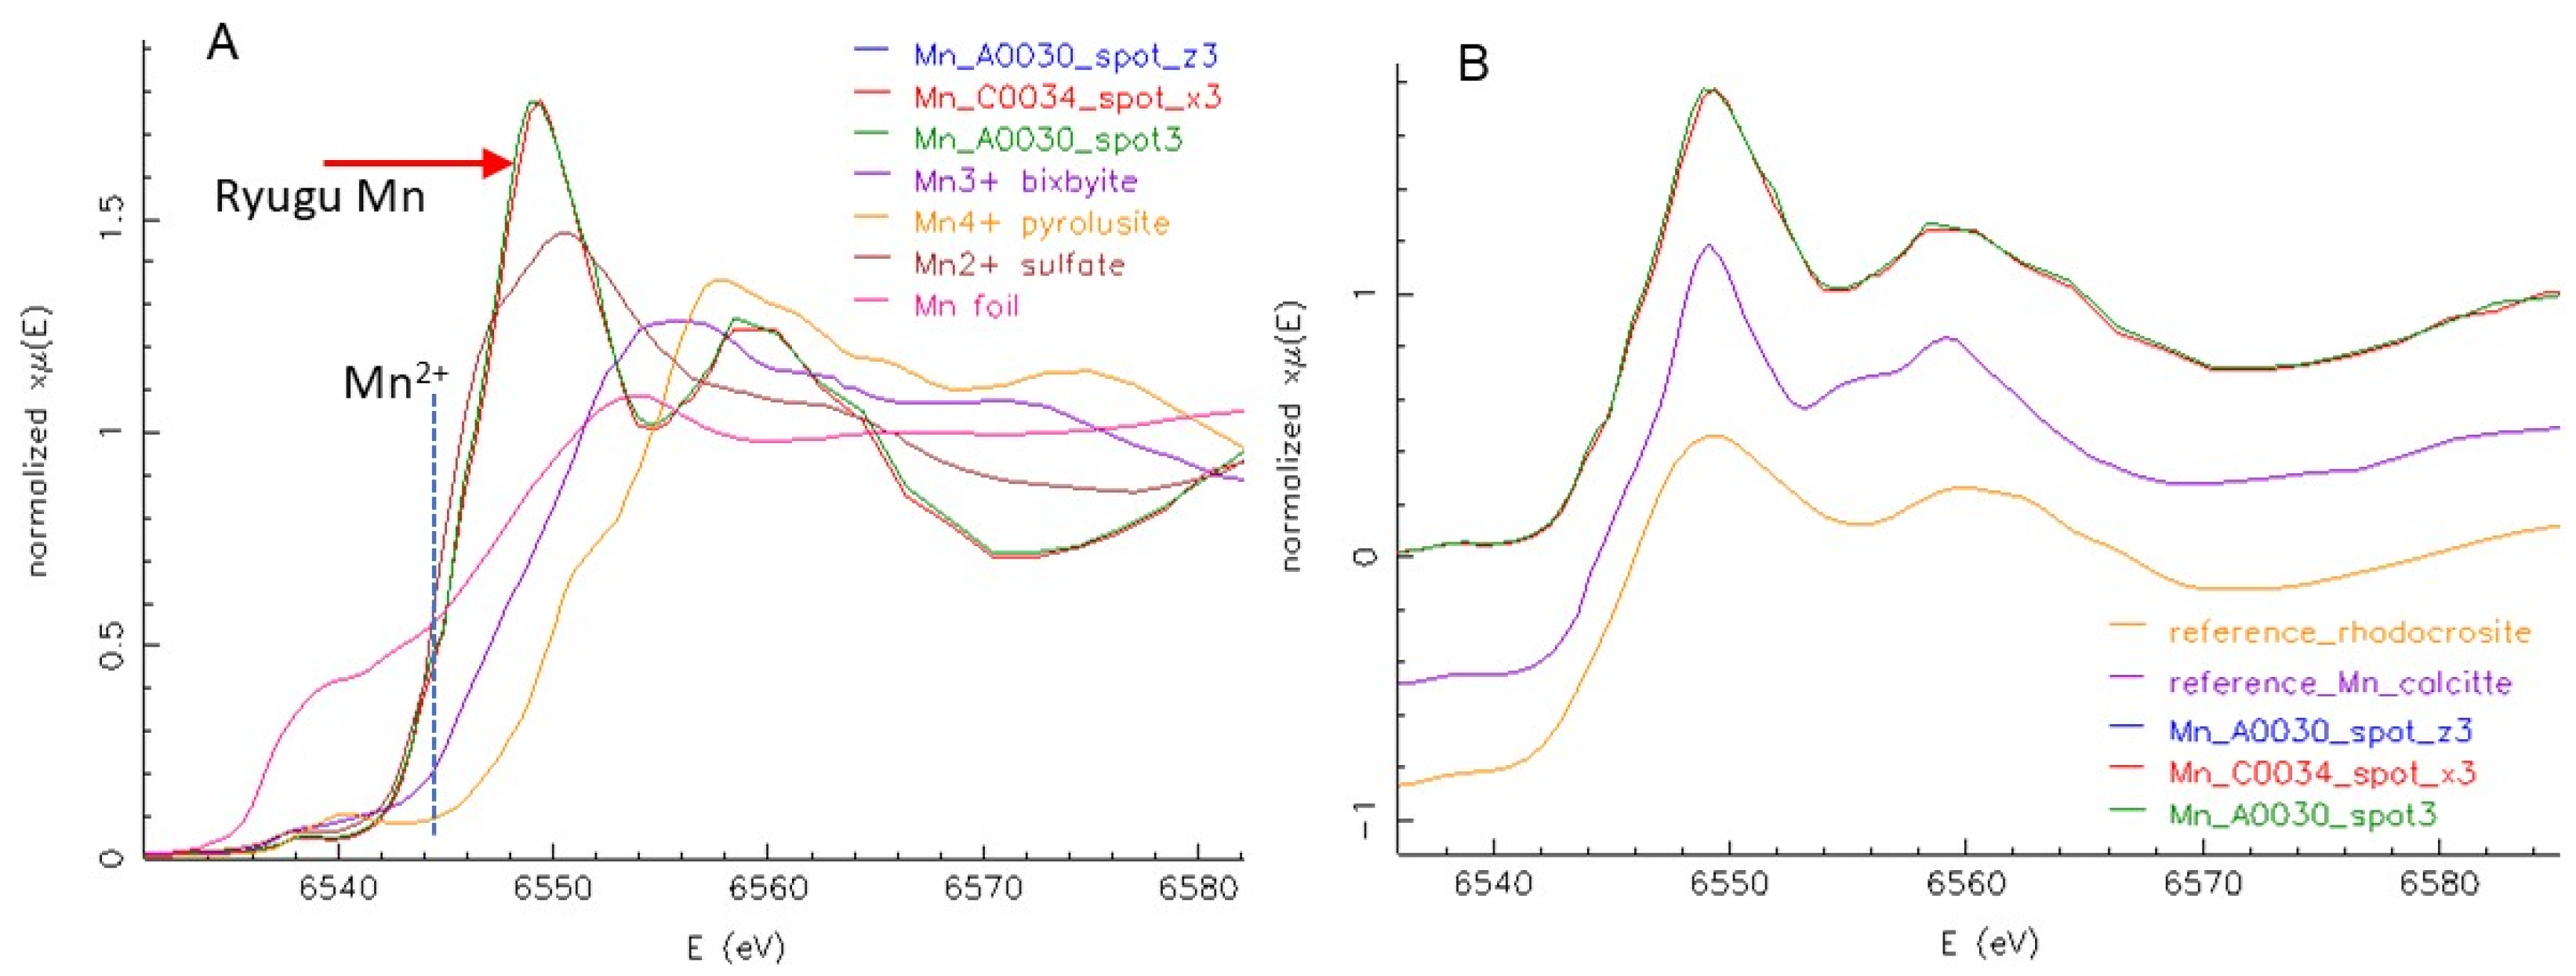
Manganese is negatively correlated with most high-Fe phases and is present in distinct 5 to 50 μm rounded grains. The low absorption and presence of Sr (Figure 5D) indicate these are carbonates. As shown in Figure 10, Mn μXANES of several different spots on the whole grain are very similar; all show that Mn is in the 2+ oxidation state, and spectral structure indicates it is incorporated into a rhombohedral, bilayered carbonate such as dolomite MgCa(CO3)2. Concentration of Mn is consistent across the Mn-bearing carbonates. Although much lower in Fe than the Fe oxide and sulfide phases, there is still significant Fe in the carbonates, ~1 wt% of both Fe and Mn. These carbonates are also evident as Ca hot spots correlated with Mn in the tender-energy whole-particle surface maps (Figure 9) and limited information from FCT (Figure 5E). A small number of grains with similar Mn content but higher absorption contrast and ~10× higher Fe (turquoise-colored grains in Figure 1, Figure 2, Figure 3 and Figure 5), high Ca and Sr, and inferred lower Mg, are ankerite FeCa(CO3)2. Ankerite grains are locally associated with or overgrown by dolomite. Calcium μXANES (Figure 11) of several spots on dolomite and ankerite grains confirm each of these elements. Figure 5D indicates that Sr concentration in the dolomite is zoned with slightly higher Sr in grain centers.
Copper is found as small <10 μm distinct hot spots. Most of these spots also have high Se (as illustrated in Figure 5C and Figure 6C), but low Fe, indicating a Cu sulfide, as previously reported for Ryugu [3]. Among other elements, Ni is dilutely distributed throughout the matrix, rather than in hot spots (Figure 6C), but is notably absent from the large Fe oxide and sulfide grains, the carbonates, and the low-absorption interiors of the round features rimmed by small Fe sulfides. Zinc is sparsely distributed as small fine-grained areas of moderate concentrations (Figure 5C). Zirconium and Y are rare, but concentrated in very small <5 μm hot spots, often together (Figure 6D). Grains with only Zr may be zircon or baddeleyite.
The distribution of P, shown in Figure 6, Figure 7 and Figure 8, is in sparse hot spots of up to ~25 μm. Most, but not all, of these also contain Ca, indicating that they are likely apatite Ca5(PO4)3(F, OH, Cl). In the tomograms, most of the small Sr hot spots that are not carbonates are likely apatite. K-edge μXANES of P matches apatite for most high-P spots measured (Figure 11C). Notably, however, there are a few spots having P without Ca, and the P μXANES spectra for these are distinctly different from apatite. These are phosphates but may be inorganic or organic species; a more detailed μXAS study of P speciation in additional Ryugu samples is underway.
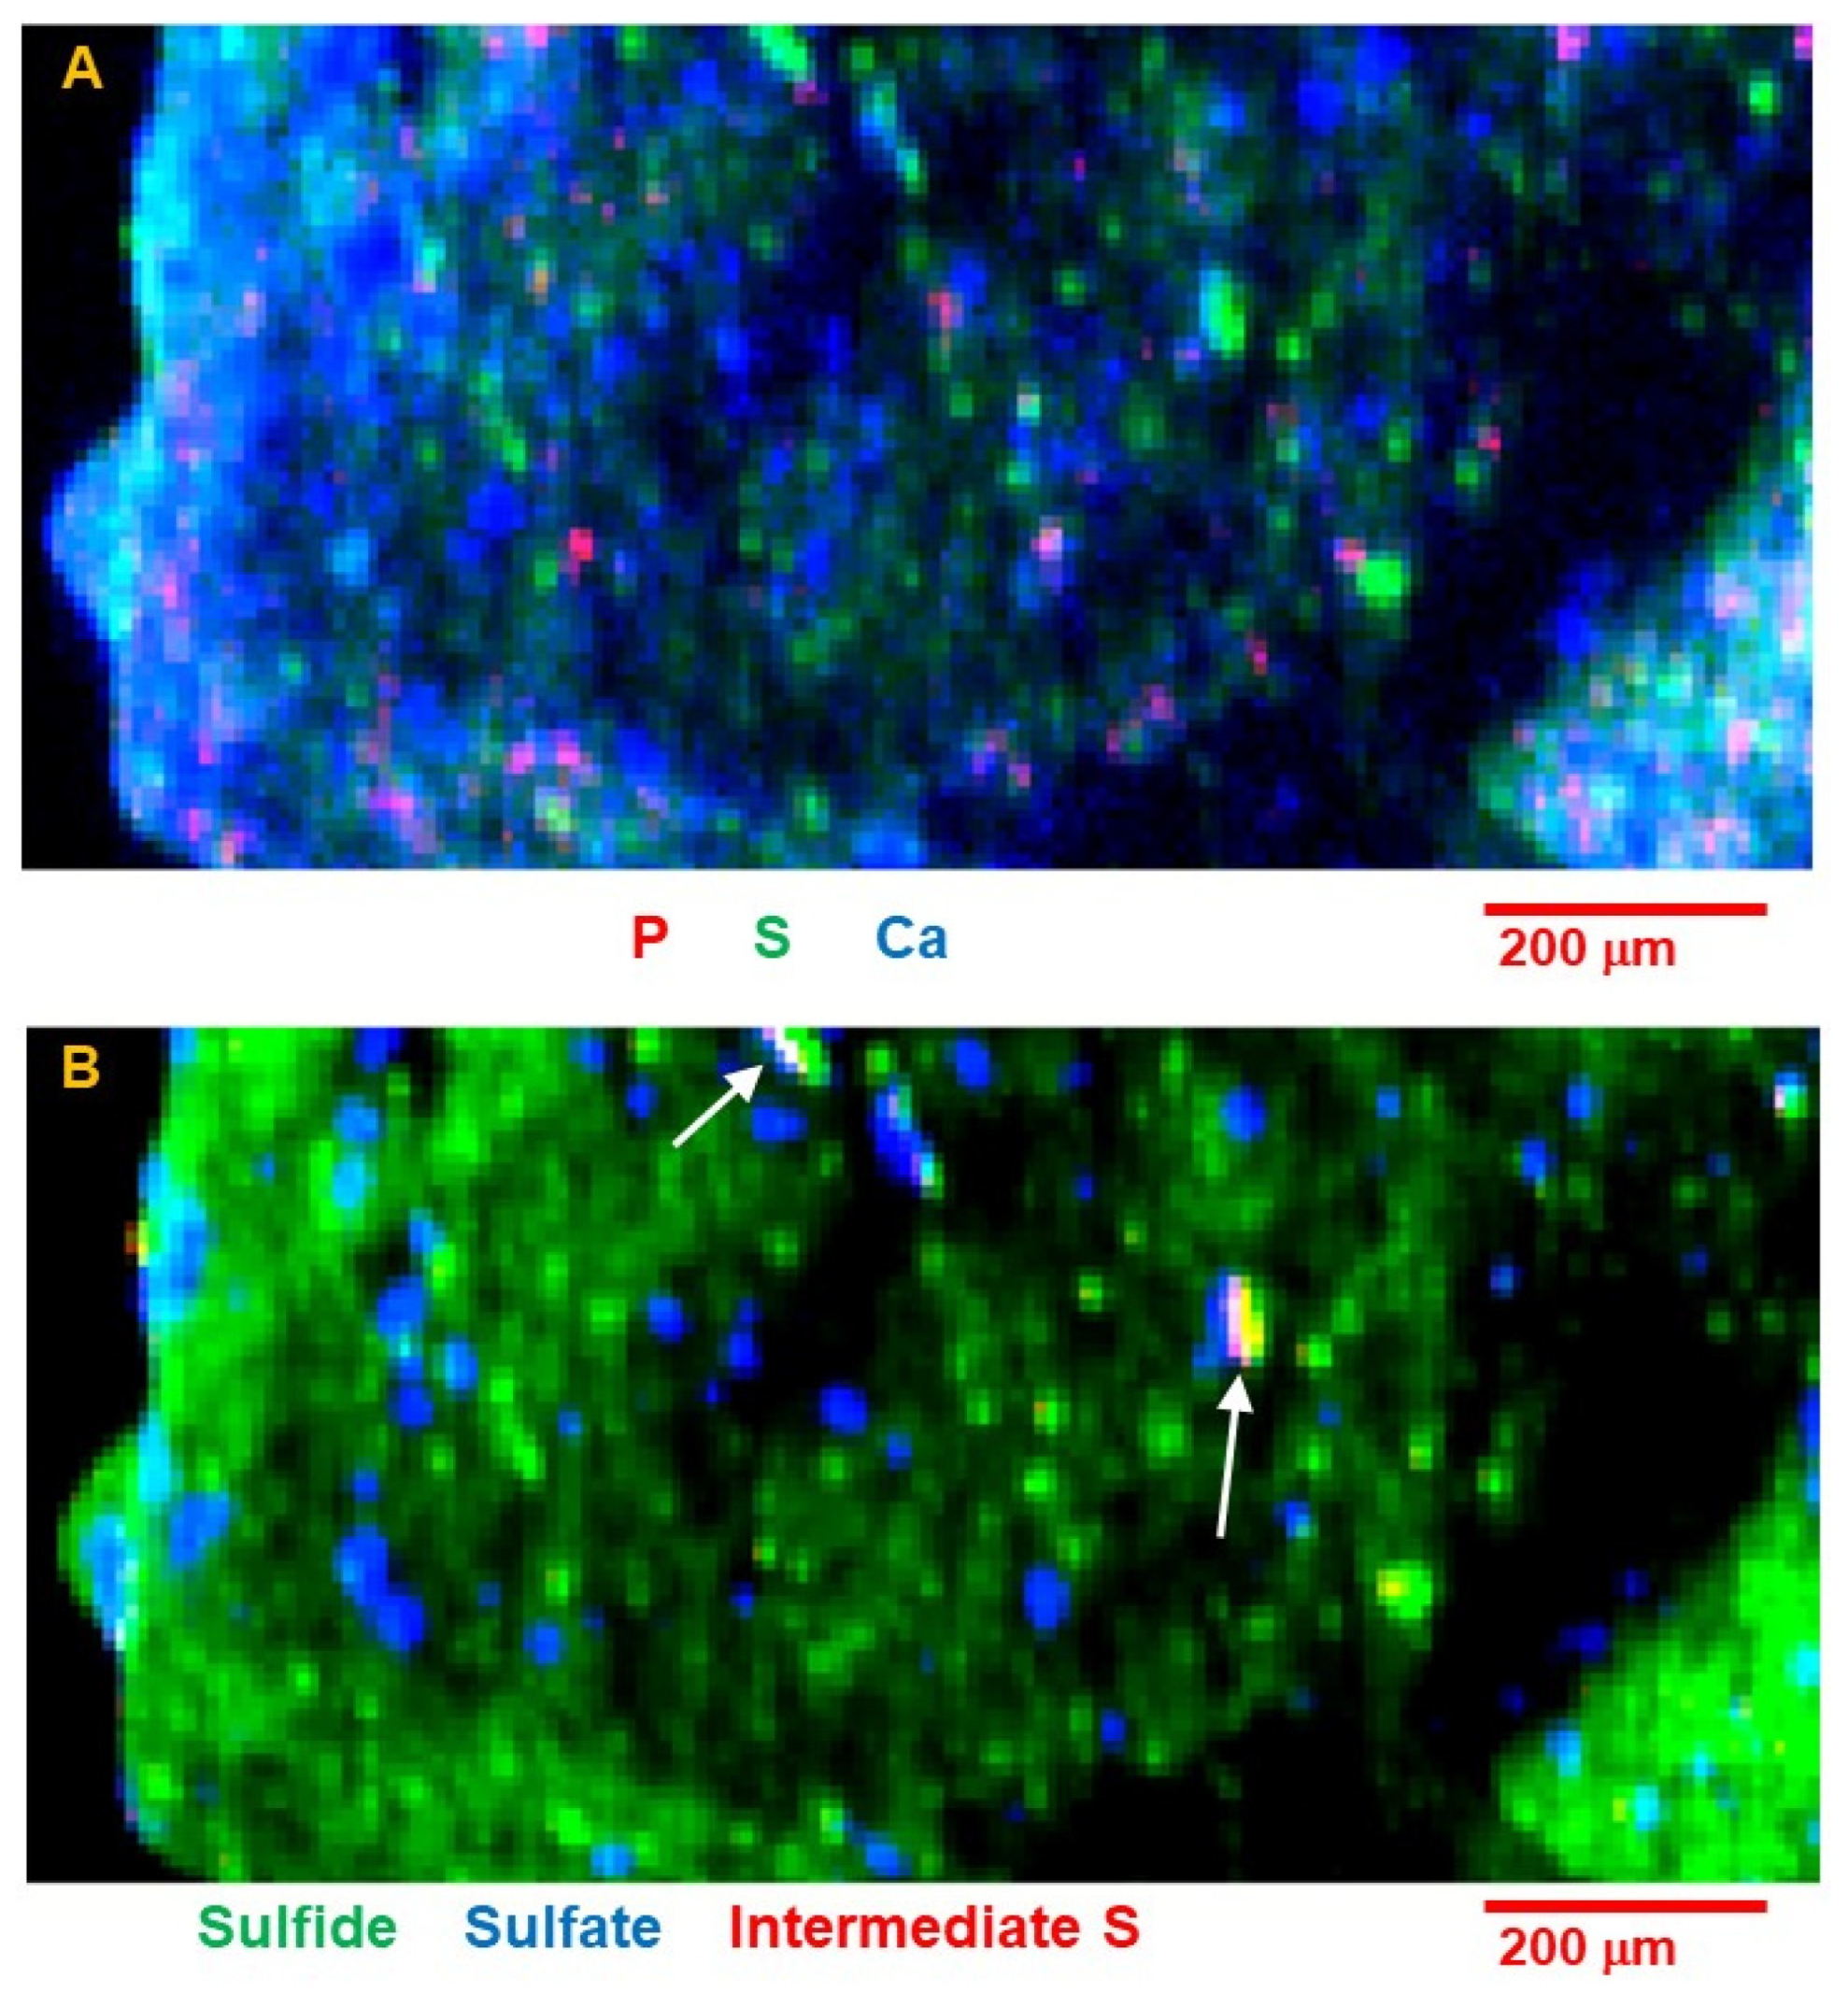
Sulfur is present in numerous grains up to ~40 μm as well as in much finer grains distributed through the matrix, matching the distribution of Se seen in the tomograms. Initial S speciation mapping (Figure 12B) reveals the distribution of different oxidation states. Most of the large S-bearing grains are sulfide, but there are a number of separate spots containing sulfate. These are lower in total S concentration, but are not spatially associated with the sulfides. There were also a very few areas of “intermediate” S species. This species may be a disulfide such as pyrite [13], elemental S [13,14], or an organic S species such as a thiol [15], thiophene or sulfoxide [16].
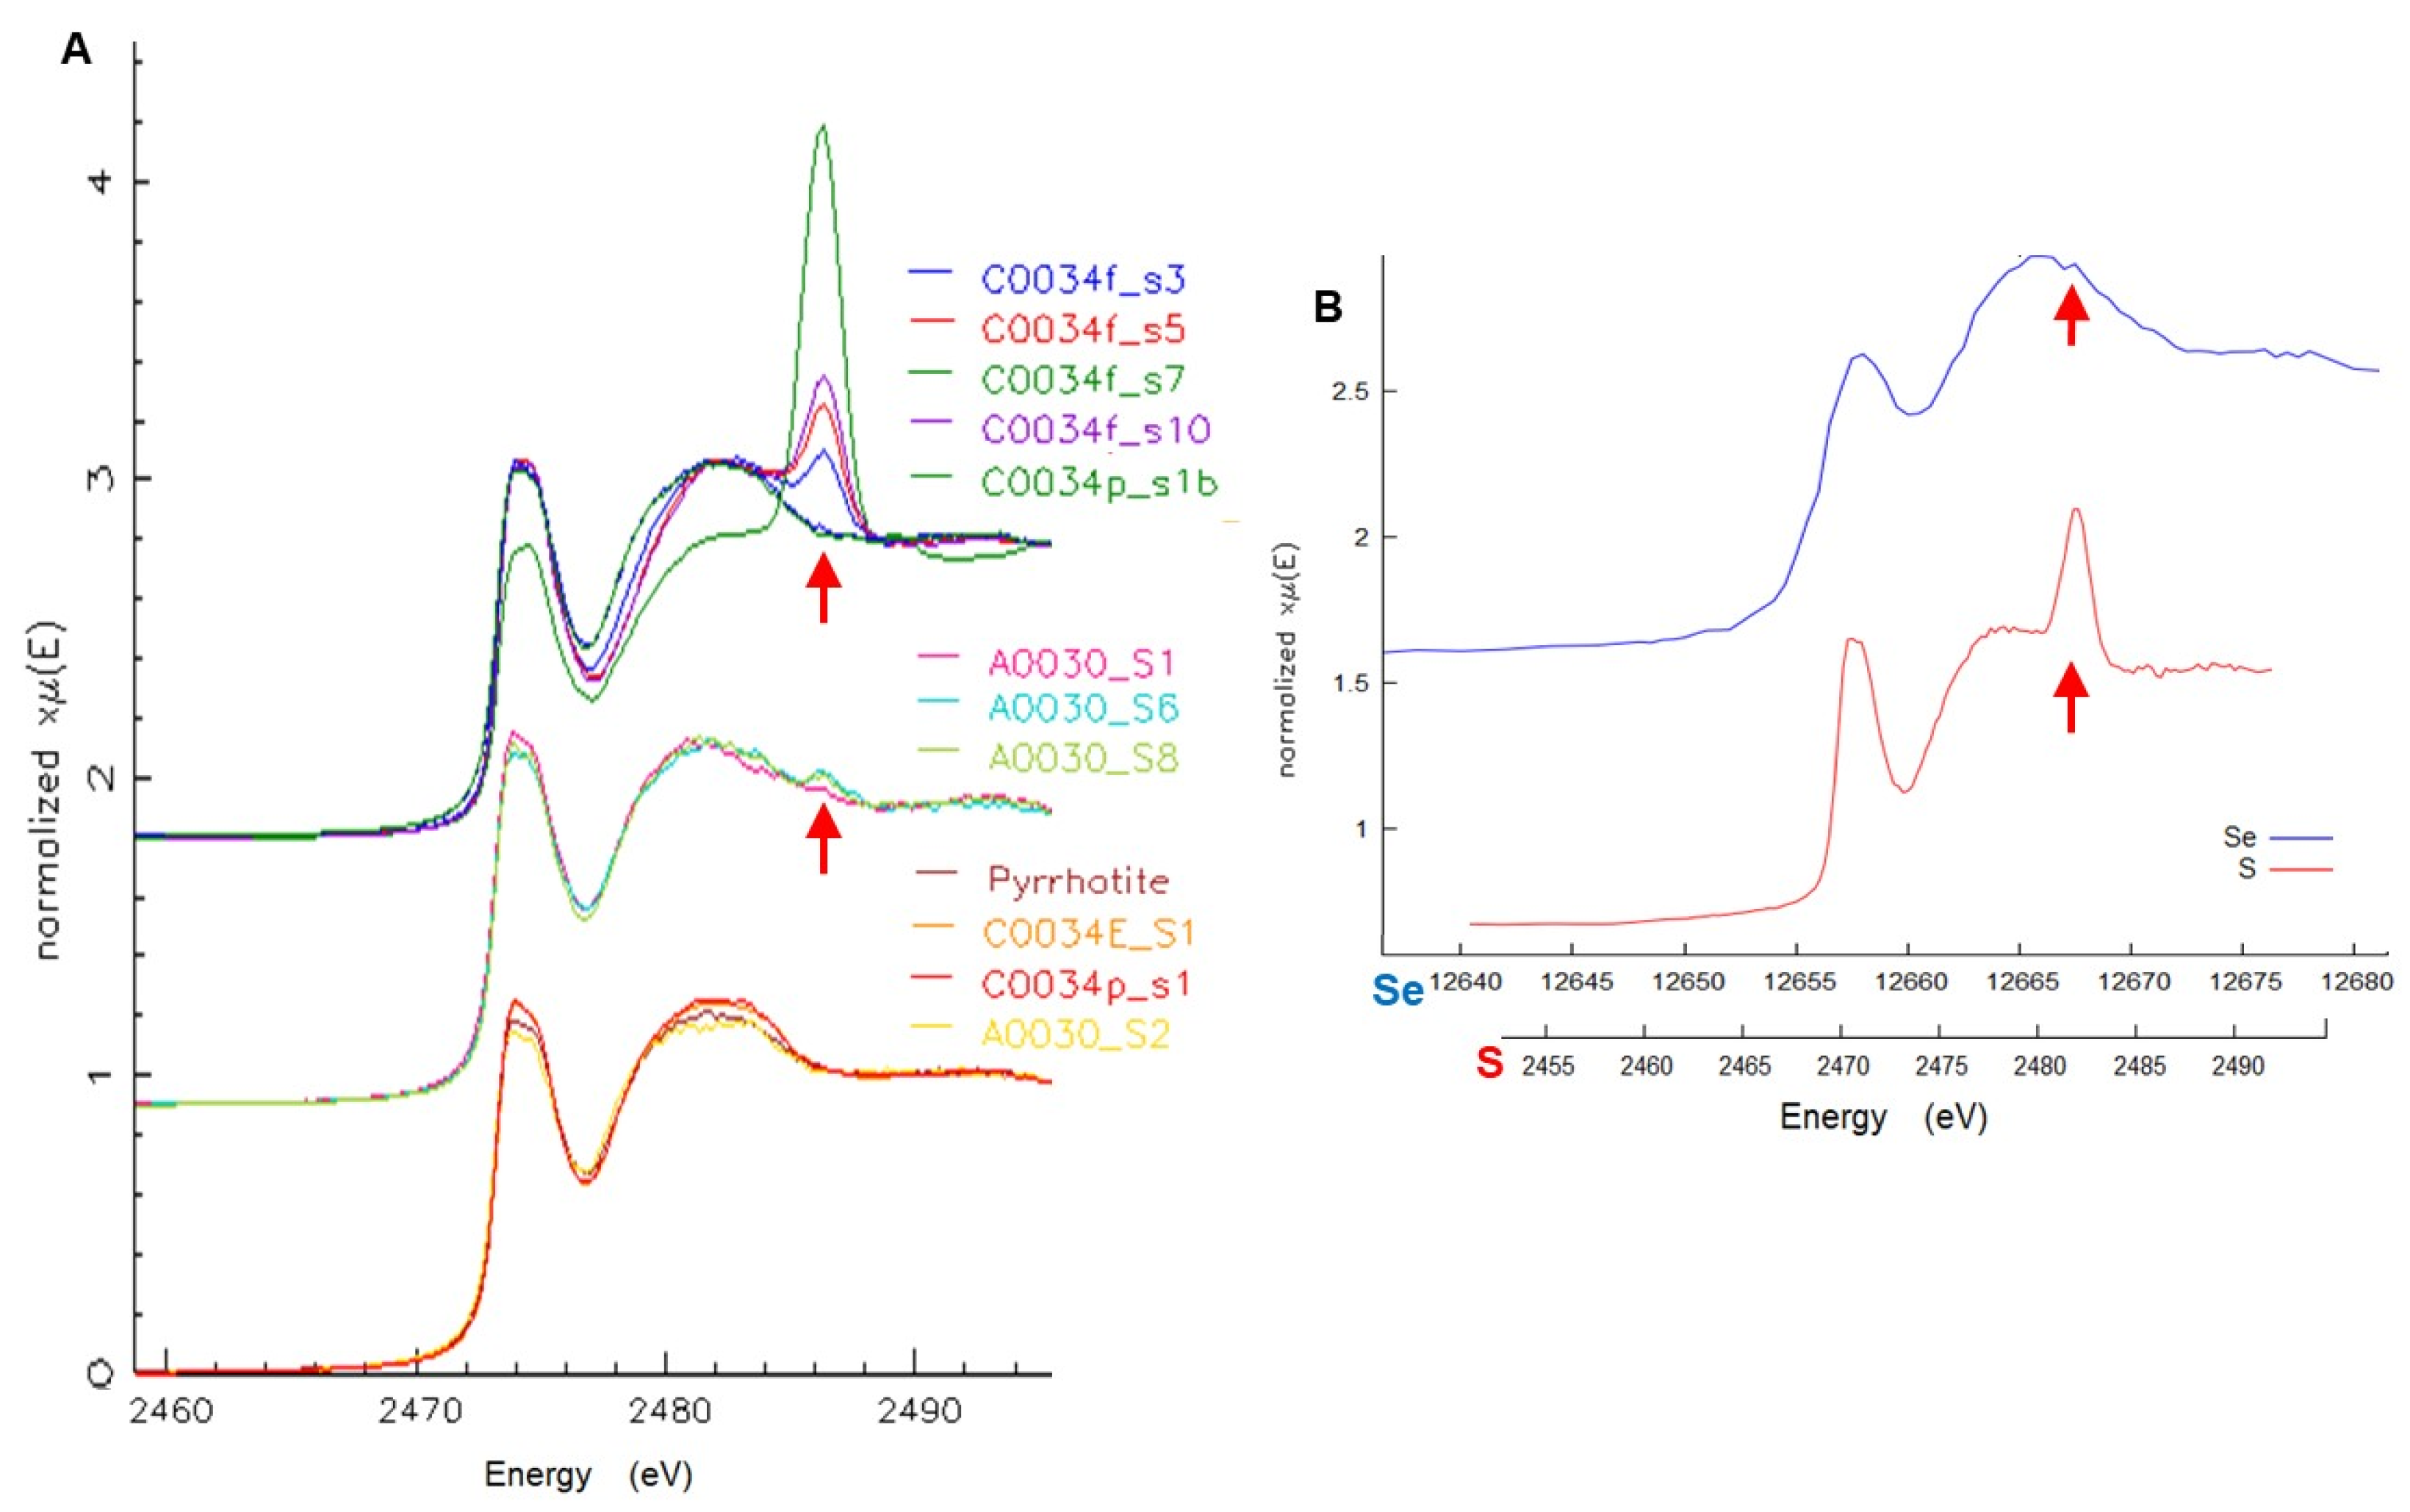
Microbeam XAS of S and Se were used to further characterize the sulfide species and confirm the applicability of Se as a proxy for S in FCT measurements of these samples. Sulfur K-edge μXANES of several 5 × 5 μm spots on the whole grains (Figure 13A) all show the same sulfide species, pyrrhotite, some with variable minor amounts of sulfate. These included examples of both the large single grains and the finer sulfides disseminated in the matrix. Selenium μXANES, although of limited spatial resolution due to large sampling depth, shows a selenide with similar spectral shape to S in pyrrhotite, and a very minor oxidized selenate component (Figure 13B). Detailed spectral feature analyses (Supplementary Material) give a range of sulfate component from 0 to 18.3% of total S in different 5 × 5 μm spots, while selenate was limited to <1% of total Se. The smaller observed fraction of selenate may be the result of a different extent of oxidation for Se compared to S, but could also reflect the sampling depths for which the S analyses show more localized variations weighted toward particle surfaces. In contrast, Se is sampled to greater depth and therefore exhibits more of a bulk average including the interiors of larger sulfide particles.
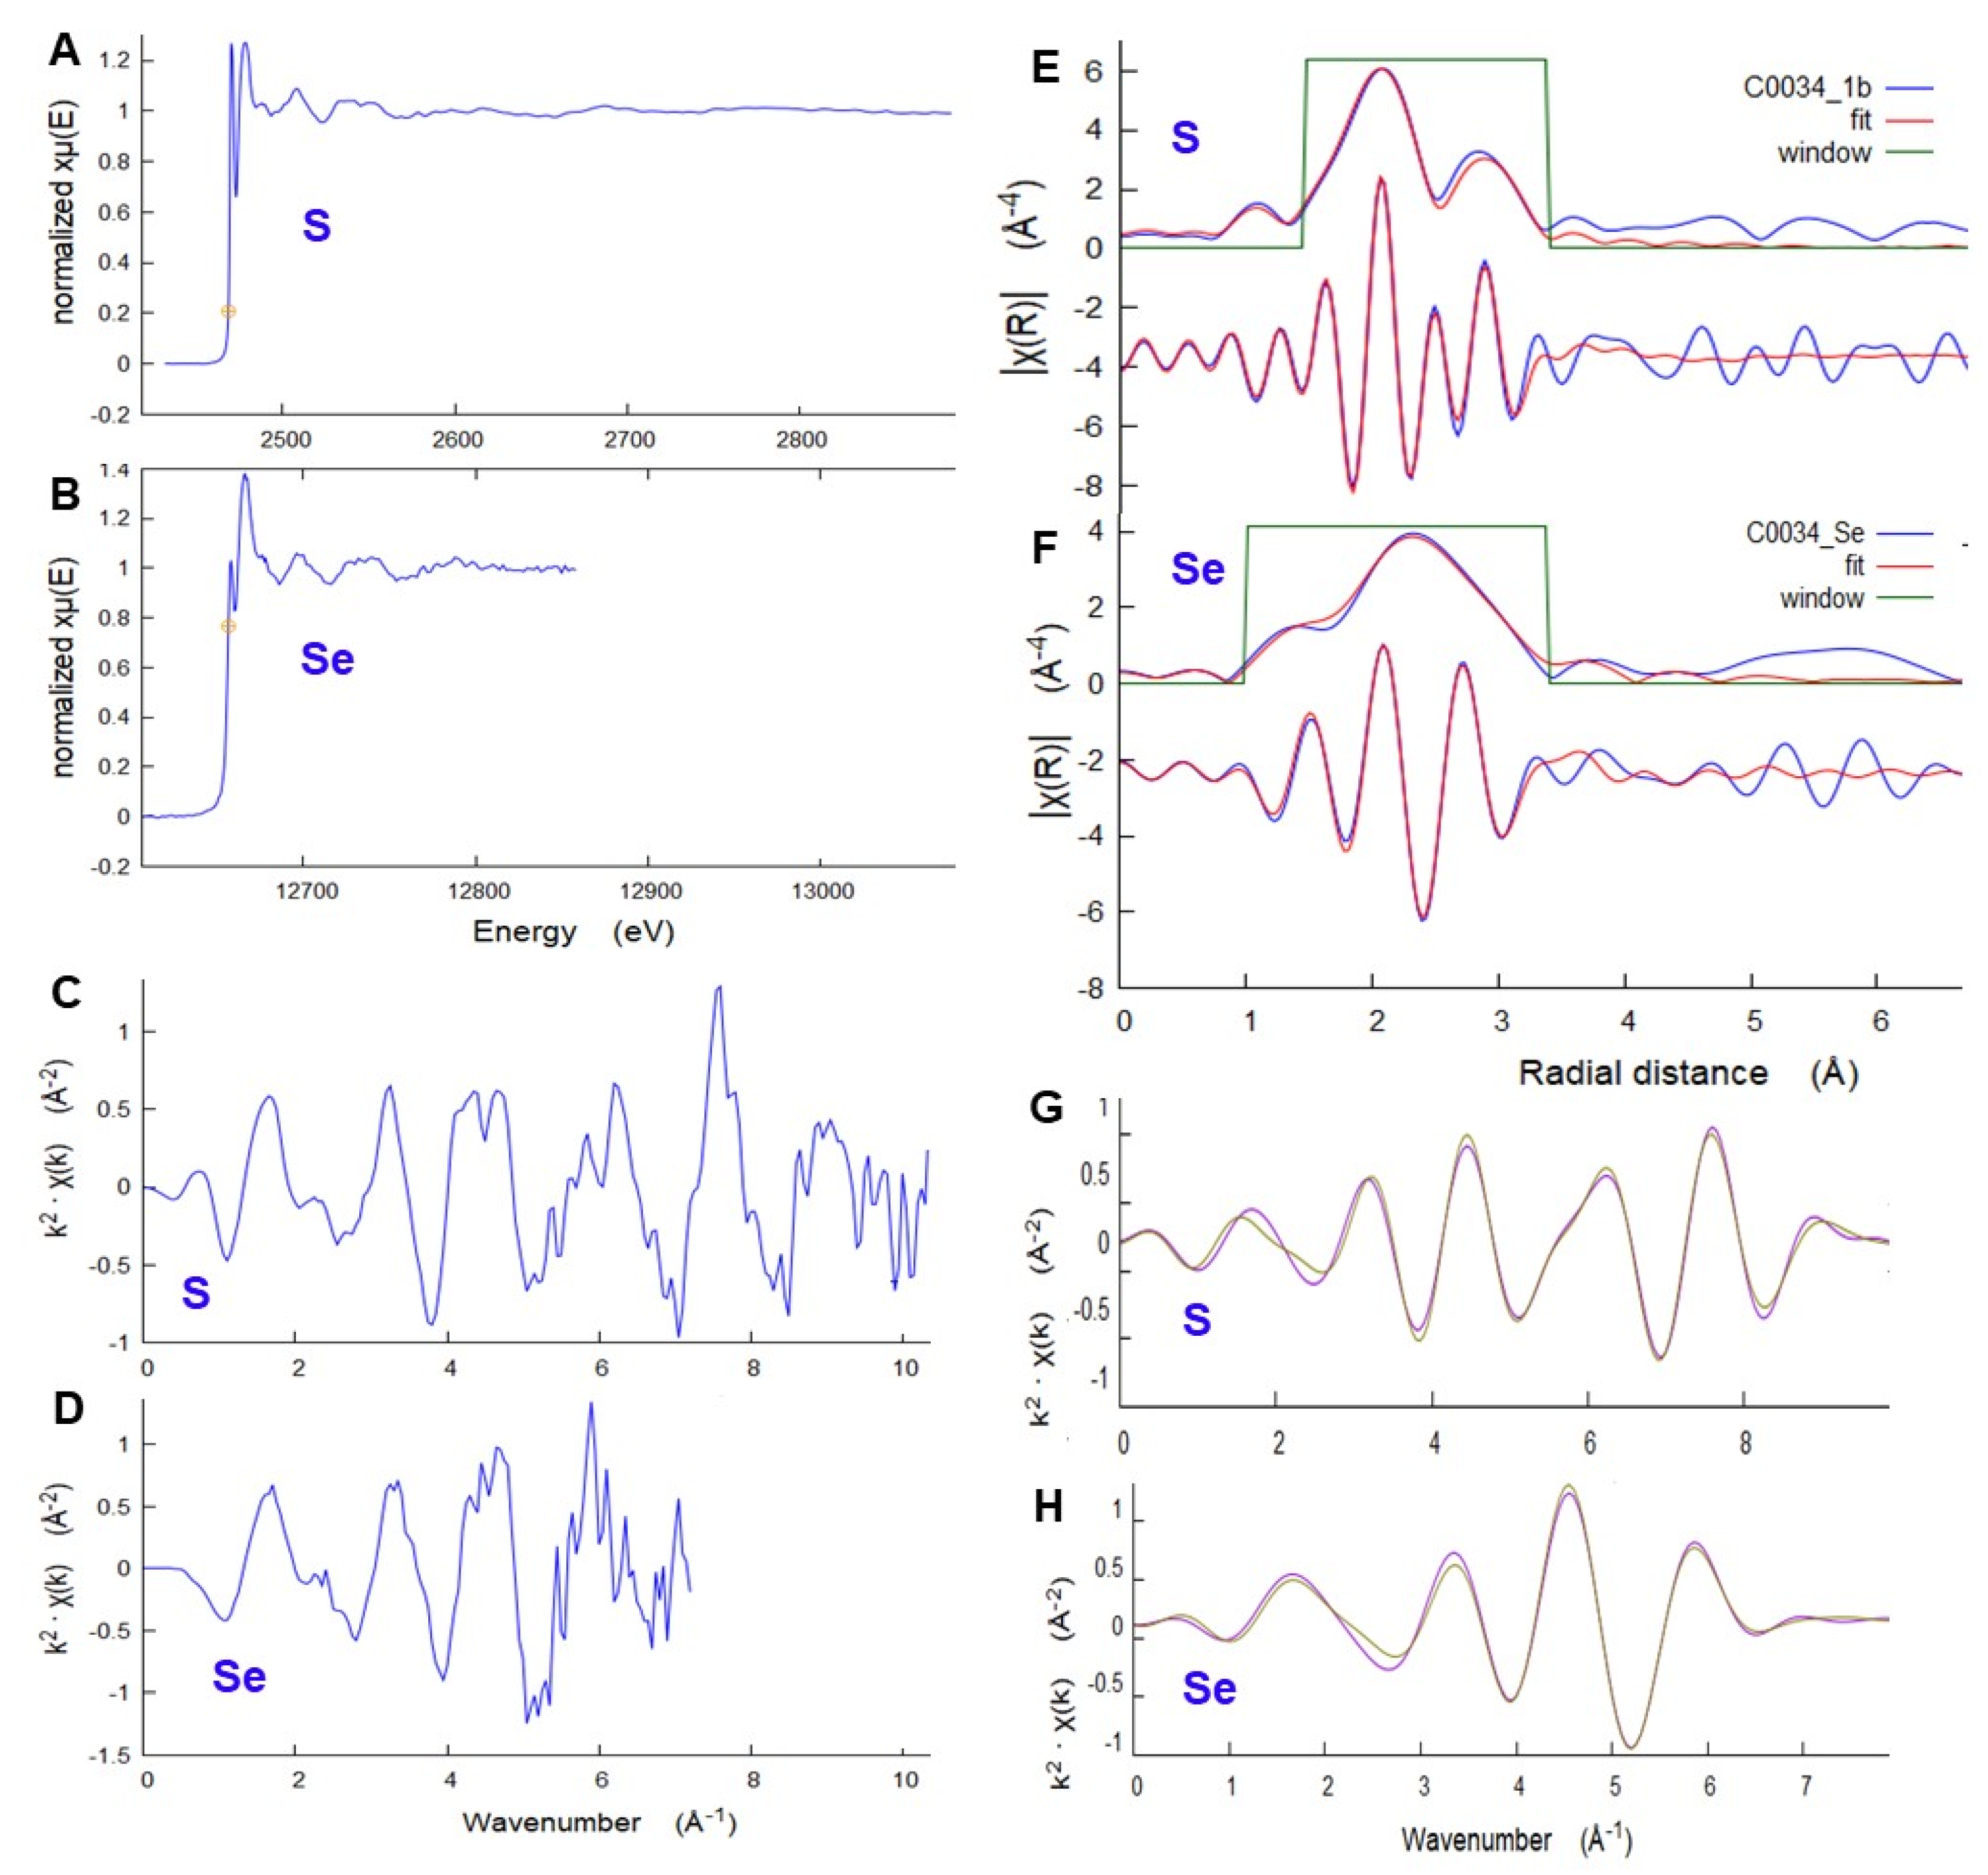
The detailed local structure around S and Se in a selected C0034 sulfide grain were studied using μEXAFS (Figure 14). Data for both elements closely match the specific distribution of interatomic distances in a model pyrrhotite structure [17], including first-neighbor S-Fe (Se-Fe) and second-neighbor S-S (Se-S) distances, adjusting only for uniform overall expansion. The resulting first-neighbor average distance is 2.42(1) Å for S and 2.54(1) Å for Se. Local expansion of the structure to accommodate the larger Se is 0.12 Å, comparable to the 0.14 Å difference in ionic radius [18] between S2− and Se2−. This local distortion relaxes to 0.02 Å for the second-neighbor distances. Details of EXAFS analyses are provided in Supplementary Materials.
Silicon is broadly distributed, mainly as phyllosilicates in the fine matrix, but there is no evidence of large silicate grains. Aluminum (Figure 9D) is concentrated in very few distinct grains up to 30 μm in size. Magnesium displays a similar distribution to Si but is also present in carbonates, spots without any Si.
Whole-grain measurements of elements heavier than Ca become less informative as z increases, due to the increasing effective sampling depth leading to overlapping signals from grains buried below the surface. Titanium is present as discrete small grains consistent with ilmenite, while Cr is dilutely distributed throughout the matrix as well as in small hot spots (Figure 9E).

4. Discussion and Conclusions

The novel combination of non-invasive synchrotron microprobe techniques applied here sheds light on the chemistry and evolution of the fluids that interacted with primitive material in the Ryugu parent body. Evidence supports multiple fluid episodes, or significantly evolving fluid character, recorded in grain-scale chemistry.
Sulfur is a major player in fluid chemistry and redox processes, and is closely involved with Fe chemistry. Yet, sulfur chemistry, reactions, and the formation of sulfur-based compounds (especially S-bearing organic molecules) on carbonaceous asteroids are not well-constrained [19]. The varying abundance of sulfur in the “A” and “C” Ryugu samples (~3.3 ± 0.7 wt% and ~5.5 ± 0.7 wt%, respectively), indicates a heterogeneous distribution of sulfides [20]. XAS at the 5 μm scale identified the dominant sulfide as pyrrhotite, both in large grains and finer particles in the matrix. This is in contrast to observed microscale heterogeneity of sulfide speciation in samples from carbonaceous meteorites such as Tarda, Murchison, Cold Bokkeveld, Aguas Zarcas, Northwest Africa 12748, and Tagish Lake [10,14,16,21].
Equilibrium condensation modeling indicates that S condenses from a cooling gas of solar composition as an Fe-sulfide [22], and the characterization of sulfides in primitive, anhydrous chondritic porous interplanetary dust particles, believed to be the least altered samples of nebula condensate available for laboratory study [23], indicates the dominant sulfide is pyrrhotite [24]. As a result, any sulfate would be an alteration phase. Sulfates are usually considered to be weathering products from terrestrial environments, as discussed in, e.g., [25] for CI chondrites. Our observation of oxidized S with sulfide may result from oxidation by atmospheric exposure during sample handling, or from beam-induced oxidation during XAS measurement (e.g., [26]), but we can discount these possibilities on the basis that (a) not all sulfide spots showed the presence of sulfate, there were no obvious μm-scale reaction rims at the scale of this study, and the amount of sulfate was not correlated to particle size as would be the case for surface oxidation; (b) particle C0034 had significantly more sulfate with the sulfides as compared to A0030, but both were handled similarly and equally exposed to atmosphere; and (c) there was no evidence of increasing sulfate with beam exposure when scans were repeated on the same spot. The formation of sulfate post-collection reaction products has been observed in Ryugu samples by electron microscopy [2], but these are small enough to be volumetrically insignificant compared to the scale of our measurements (tens of μm3).
The partial oxidation of sulfide observed in μXANES is therefore interpreted as original to the material, indicating an incomplete but significant oxidation process occurred on the parent body. This is consistent with the absence of Fe metal and formation of magnetite of various morphologies [27], as well as a study of isotopic compositions of Ryugu carbonates [28] which concluded that dolomite precipitated later in the alteration process in a more oxygen-rich CO2-dominated environment. It is also corroborated by the textural evidence of partial replacement of pyrrhotite by magnetite. The presence of sulfates spatially separated from sulfides in C0034 further implies that some resulting sulfate was transported by fluids. While it is possible that there were some more reactive sulfide species present, and these oxidized to sulfate on exposure to Earth’s atmosphere, such reactive species would likely have reacted during aqueous alteration by the somewhat oxidizing fluids that precipitated, e.g., magnetite. Observations of a few examples of intermediate S species in a layered geometry with sulfide and sulfate (Figure 12) raise interesting questions about formation of such a structure. Bose et al. observed this intermediate S in another Ryugu sample [15] and potentially related organic S species in Murchison [16]. Beyond the scope of the measurements reported here, the relationship of organic S species to other organic and inorganic phases will provide important information on the evolution of organic molecules in the early solar system.
Iron is present mainly as oxides and sulfides, the former being dominant among larger grains and the latter being prevalent in the fine-grained matrix. There is a notable absence of large Fe-bearing silicate grains. Several of the rod-like or platy Fe-rich grains, and some of the rounded Fe-rich grains, are composed of intergrown oxide and sulfide in an apparent partial-replacement alteration texture. Electron microscopy studies of Ryugu samples showing framboidal magnetite suggest that it was formed from a fluid (e.g., [3,4]). The large, often euhedral sulfide grains imply recrystallization by a fluid that was O-poor but did not have access to much of the fine-grained sulfides, so it must not have been the same fluid responsible for the alteration that formed the hydrated silicates that now dominate the matrix. Preservation of fine-scale structures such as sulfide rims on round features indicate that silicates were altered in situ without mobilization of silica, and the fluid responsible for silicate alteration did not significantly react with these sulfides, but likely mobilized Mg that later formed dolomite. Likewise, if the large sulfide grains are early fluid-mediated recrystallization products, then a later more O-rich fluid was responsible for altering some of the sulfide to magnetite but this fluid also did not have access to the smaller sulfides embedded in the silicate matrix. Alternatively, a single fluid may have evolved significantly over time, at some point becoming more O-rich.
This temporal separation between silicate alteration and formation of magnetite and dolomite is further supported by the observed distribution of Cr and Ni. If those elements were initially minor components of silicate phases or silicate-dominated assemblages, and alteration of the silicates occurred in situ and preserved textures like sulfide rims, then Cr and Ni would remain dispersed throughout the phyllosilicates either in the phyllosilicates themselves or in particles finer than the resolution of this study. Importantly, Ni is absent from the phyllosilicate nodule rimmed by sulfide grains, indicating that the original core of that structure was a low-Ni silicate, and the silicate-altering fluid did not transport Ni.
Carbonates are important in Ryugu and form large grains [29], but are generally limited in Ca and Fe content (i.e., no calcite or siderite). Most that we observed are Mn-rich dolomite, evidenced by the Ca and Mn XANES, the presence of Ca (and Sr), and the low absorbance indicating a significant Mg component; this agrees with [28], who found that dolomite was the most abundant carbonate in the Ryugu samples they analyzed. The dolomite we observed has significant minor concentrations of Fe and Mn substituting for Ca, and is the primary host for Mn in the sample. It is also consistent with remote spectroscopic observations interpreted as ferroan magnesite (sometimes called “breunnerite”) on Bennu [30], with similar indications for Ryugu [31]. The Mn, Fe, Sr, and Ca contents of the carbonates help constrain the composition of the fluid involved in their formation. While Fe and Mn content is quite uniform across the dolomite grains, the observed zoning of Sr indicates that the fluid became depleted in Sr during carbonate formation. Although Fe is abundant overall in the sample, and has undergone significant chemical processing, its low concentration in the dolomite implies that there was limited available Fe2+ in the carbonate-forming fluid relative to the greater availability of Mn2+ and Mg2+. Magnesium would have been mobilized during silicate alteration, perhaps linking that process to dolomite formation. The few ankerites we found crystallized first, as suggested by their spatial association with dolomite, and may have depleted Fe in the fluid. Alternatively, this may be the result of timing, such that the availability of carbonate did not coincide with conditions when more Fe was mobilized.

Supplementary Materials

The following supporting information can be downloaded at: https://www.mdpi.com/article/10.3390/geosciences14040111/s1, SupplementaryMaterials.docx containing (1) Details of FCT measurements [32], (2) Details of XANES analyses, and (3) Details of EXAFS analyses; individual data files of XANES and EXAFS spectra.

Author Contributions

Conceptualization, P.N.; methodology, R.T. and P.N.; measurements, R.T and P.N. (at XFM beamline), T.D.G., L.F., P.N., M.E.G. and G.P. (at TES beamline); data analyses, P.N. (XAS, XRF) and R.T. (CT); resources, M.Y., Y.K., T.D.G. and P.N.; writing—original draft preparation, P.N.; writing—review and editing, T.D.G., G.J.F., M.Y., R.T., M.E.G., Y.K. and G.P.; supervision, T.D.G. and P.N.; funding acquisition, T.D.G. and P.N. All authors have read and agreed to the published version of the manuscript.

Funding

This research was funded in part by NASA LARS grants 80NSSC19K0940 and 80NSSC21K0612 and the RISE2 node of NASA’s Solar System Exploration Research Virtual Institute; U.S. Department of Energy contract DE-SC0012704.

Data Availability Statement

The original contributions presented in the study are included in the article and Supplementary Materials. Further inquiries can be directed to the corresponding author.

Acknowledgments

Authors are grateful to JAXA for allocating the loan of these samples to Yesiltas, Kebukawa, Glotch, and Northrup. Measurements utilized XFM and TES beamlines at NSLS-II, a U.S. Department of Energy User Facility operated under contract DE-SC0012704. Work was supported by the Tender Energy Microspectroscopy Consortium. Authors appreciate the efforts of anonymous reviewers who provided valuable insights and useful suggestions to improve the final version of this manuscript.

Conflicts of Interest

The authors declare no conflicts of interest. The funders had no role in the design of the study; in the collection, analyses, or interpretation of data; in the writing of the manuscript; or in the decision to publish the results.

References

  1. Yada, T.; Abe, M.; Okada, T.; Nakato, A.; Yogata, K.; Miyazaki, A.; Hatakeda, K.; Kumagai, K.; Nishimura, M.; Hitomi, Y.; et al. Preliminary analysis of the Hayabusa2 samples returned from C-type asteroid Ryugu. Nat. Astron. 2022, 6, 214–220. [Google Scholar] [CrossRef]
  2. Yokoyama, T.; Nagashima, K.; Nakai, I.; Young, E.D.; Abe, Y.; Aléon, J.; Alexander, C.M.O.D.; Amari, S.; Amelin, Y.; Bajo, K.I.; et al. Samples returned from the asteroid Ryugu are similar to Ivuna-type carbonaceous meteorites. Science 2023, 379, eabn7850. [Google Scholar] [CrossRef] [PubMed]
  3. Nakamura, T.; Matsumoto, M.; Amano, K.; Enokido, Y.; Zolensky, M.E.; Mikouchi, T.; Genda, H.; Tanaka, S.; Zolotov, M.Y.; Kurosawa, K.; et al. Formation and evolution of carbonaceous asteroid Ryugu: Direct evidence from returned samples. Science 2022, 379, eabn8671. [Google Scholar] [CrossRef] [PubMed]
  4. Nakamura, E.; Kobayashi, K.; Tanaka, R.; Kunihiro, T.; Kitagawa, H.; Potiszil, C.; Ota, T.; Sakaguchi, C.; Yamanaka, M.; Ratnayake, D.M.; et al. On the origin and evolution of the asteroid Ryugu: A comprehensive geochemical perspective. Proc. Jpn. Acad. Ser. B 2022, 98, 227–282. [Google Scholar] [CrossRef] [PubMed]
  5. Stodolna, J.; Gainsforth, Z.; Leroux, H.; Butterworth, A.L.; Tyliszczak, T.; Jacob, D.; Westphal, A.J. Iron valence state of fine-grained material from the Jupiter family comet 81P/Wild 2–A coordinated TEM/STEM EDS/STXM study. Geochim. Cosmochim. Acta 2013, 122, 1–16. [Google Scholar] [CrossRef]
  6. Westphal, A.J.; Stroud, R.M.; Bechtel, H.A.; Brenker, F.E.; Butterworth, A.L.; Flynn, G.J.; Frank, D.R.; Gainsforth, Z.; Hillier, J.K.; Postberg, F.; et al. Evidence for interstellar origin of seven dust particles collected by the Stardust spacecraft. Science 2014, 345, 786–791. [Google Scholar] [CrossRef]
  7. Noguchi, T.; Bridges, J.C.; Hicks, L.J.; Gurman, S.J.; Kimura, M.; Hashimoto, T.; Konno, M.; Bradley, J.P.; Okazaki, R.; Uesugi, M.; et al. Mineralogy of four Itokawa particles collected from the first touchdown site. Earth Planets Space 2014, 66, 124. [Google Scholar] [CrossRef]
  8. Northrup, P. The TES Beamline (8-BM) at NSLS-II: Tender-energy spatially resolved X-ray absorption spectroscopy and X-ray fluorescence imaging. J. Synchrotron Radiat. 2019, 26, 2064–2074. [Google Scholar] [CrossRef]
  9. Ravel, B.; Newville, M. ATHENA, ARTEMIS, HEPHAESTUS: Data analysis for X-ray absorption spectroscopy using IFEFFIT. J. Synchrotron Radiat. 2005, 12, 537–541. [Google Scholar] [CrossRef]
  10. Northrup, P.; Wirick, S.; Flynn, G.J. Tender Energy X-Ray Microspectroscopy Reveals Microscale Heterogeneity of P and S Chemistry in CM2 Chondrite. In Proceedings of the 52nd Lunar and Planetary Science Conference, Virtual, 15–19 March 2021; Lunar and Planetary Institute Contributions, 2480. Available online: https://www.hou.usra.edu/meetings/lpsc2021/pdf/2480.pdf (accessed on 20 April 2024).
  11. Chu, Y.; Lee, W.-K.; Tappero, R.; Ge, M.; Huang, X.; Xiao, X.; Yan, H.; Northrup, P.; Thieme, J.; Kiss, A.; et al. Multimodal, multidimensional and multiscale X-ray Imaging at the National Synchrotron Light Source II. Synch. Rad. News 2020, 33, 29–36. [Google Scholar] [CrossRef]
  12. Schaub, D.R.; Northrup, P.; Nekvasil, H.; Catalano, T.; Tappero, R. Gas-mediated trace element incorporation into rhyolite-hosted topaz: A synchrotron microbeam XAS study. Am. Mineral. 2023, 108, 2153–2163. [Google Scholar] [CrossRef]
  13. Fleet, M.E. XANES spectroscopy of sulfur in earth materials. Can. Mineral. 2005, 43, 1811–1838. [Google Scholar] [CrossRef]
  14. Jung, J.; Northrup, P.; Glotch, T.D.; Flynn, G.J.; Flores, L. Microscale Heterogeneity of Sulfur Chemistry in Carbonaceous Chondrites: Microbeam XANES. In Proceedings of the 54th Lunar and Planetary Science Conference, Virtual, 13–17 March 2023; Lunar and Planetary Institute Contributions, 2749. Available online: https://www.hou.usra.edu/meetings/lpsc2023/pdf/2749.pdf (accessed on 20 April 2024).
  15. Bose, M.; Root, R.A. Ryugu Particles Contain Sulfur in Multiple Oxidation States. In Proceedings of the 54th Lunar and Planetary Science Conference, Virtual, 13–17 March 2023; Lunar and Planetary Institute Contributions, 2205. Available online: https://www.hou.usra.edu/meetings/lpsc2023/pdf/2205.pdf (accessed on 20 April 2024).
  16. Bose, M.; Root, R.A.; Pizzarello, S. A XANES and Raman investigation of sulfur speciation and structural order in Murchison and Allende meteorites. Meteorit. Planet. Sci. 2017, 52, 546–559. [Google Scholar] [CrossRef]
  17. Powell, A.V.; Vaqueiro, P.; Knight, K.S.; Chapon, L.C.; Sanchez, R.D. Structure and magnetism in synthetic pyrrhotite Fe7S8: A powder neutron-diffraction study. Phys. Rev. 2004, B70, 014415. [Google Scholar] [CrossRef]
  18. Shannon, R.D. Revised effective ionic radii and systematic studies of interatomic distances in halides and chalcogenides. Acta Cryst. 1976, A32, 751–767. [Google Scholar] [CrossRef]
  19. Ruf, A.; Bouquet, A.; Schmitt-Kopplin, P.; Boduch, P.; Mousis, O.; Danger, G. Sulfur ion irradiation experiments simulating space weathering of Solar System body surfaces-Organosulfur compound formation. Astron. Astrophys. 2021, 655, A74. Available online: https://www.aanda.org/articles/aa/full_html/2021/11/aa41190-21/aa41190-21.html (accessed on 20 April 2024). [CrossRef]
  20. Yoshimura, T.; Takano, Y.; Naraoka, H.; Koga, T.; Araoka, D.; Ogawa, N.O.; Schmitt-Kopplin, P.; Hertkorn, N.; Oba, Y.; Dworkin, J.P.; et al. Chemical evolution of primordial salts and organic sulfur molecules in the asteroid 162173 Ryugu. Nat. Commun. 2023, 14, 5284. Available online: https://www.nature.com/articles/s41467-023-40871-0 (accessed on 20 April 2024). [CrossRef] [PubMed]
  21. Flores, L.; Glotch, T.D.; Northrup, P.; Muñoz, A.; Jung, J.; De Gregorio, B.; Tappero, R.; Nicholas, S.; Flynn, G.J.; Herd, C. Correlated Micro-Scale Analyses of Four CM2 and C2 Ungrouped Carbonaceous Chondrites. In Proceedings of the 54th Lunar and Planetary Science Conference, Virtual, 13–17 March 2023; Lunar and Planetary Institute Contributions, 1853. Available online: https://www.hou.usra.edu/meetings/lpsc2023/pdf/1853.pdf (accessed on 20 April 2024).
  22. Lodders, K. Solar System Abundances and Condensation Temperatures of the Elements. Astrophys. J. 2003, 591, 1220–1247. [Google Scholar] [CrossRef]
  23. Ishii, H.A.; Bradley, J.P.; Dai, Z.-R.; Chi, M.; Kearsley, A.T.; Burchell, M.J.; Browning, N.D.; Molster, F. Comparison of Comet 81P/Wild 2 Dust with Interplanetary Dust from Comets. Science 2008, 319, 447–450. [Google Scholar] [CrossRef]
  24. Reitmeijer, F. Interplanetary Dust particles. In Planetary Materials; Papike, J.J., Ed.; Reviews in Mineralogy; Mineralogical Society of America: Washington DC, USA, 1998; Volume 36, pp. 2-1–2-95. [Google Scholar]
  25. Gounelle, M.; Zolensky, M.E. A terrestrial origin for sulfate veins in CI1 chondrites. Meteorit. Planet. Sci. 2001, 36, 1321–1329. [Google Scholar] [CrossRef]
  26. Kleinsasser, J.; Konecke, B.; Simon, A.; Northrup, P.; Lanzirotti, A.; Newville, M.; Borca, C.; Huthwelker, T.; Holtz, F. Sulfur speciation in dacitic melts using X-ray absorption near-edge structure spectroscopy of the S K-edge (S-XANES): Consideration of radiation-induced changes and the implications for sulfur in natural arc systems. Am. Mineral. 2024. [Google Scholar] [CrossRef]
  27. Dobrică, E.; Ishii, H.A.; Bradley, J.P.; Ohtaki, K.; Brearley, A.J.; Noguchi, T.; Matsumoto, T.; Miyake, A.; Igami, Y.; Haruta, M.; et al. Nonequilibrium spherulitic magnetite in the Ryugu samples, Geochim. Cosmochim. Acta 2023, 346, 65–75. [Google Scholar] [CrossRef]
  28. Fujiya, W.; Kawasaki, N.; Nagashima, K.; Sakamoto, N.; Alexander, C.M.O.; Kita, N.T.; Kitajima, K.; Abe, Y.; Aléon, J.; Amari, S.; et al. Carbonate record of temporal change in oxygen fugacity and gaseous species in asteroid Ryugu. Nat. Geosci. 2023, 16, 675–682. [Google Scholar] [CrossRef]
  29. Loizeau, D.; Pilorget, C.; Riu, L.; Brunetto, R.; Bibring, J.P.; Nakato, A.; Aléon-Toppani, A.; Hatakeda, K.; Yogata, K.; Carter, J.; et al. Constraints on Solar System early evolution by MicrOmega analysis of Ryugu carbonates. Nat. Astron. 2023, 7, 391–397. [Google Scholar] [CrossRef]
  30. Kaplan, H.H.; Lauretta, D.S.; Simon, A.A.; Hamilton, V.E.; DellaGiustina, D.N.; Golish, D.R.; Reuter, D.C.; Bennett, C.A.; Burke, K.N.; Campins, H.; et al. Bright carbonate veins on asteroid (101955) Bennu: Implications for aqueous alteration history. Science 2020, 370, eabc3557. [Google Scholar] [CrossRef] [PubMed]
  31. Matsumoto, T.; Noguchi, T.; Miyake, A.; Igami, Y.; Haruta, M.; Seto, Y.; Miyahara, M.; Tomioka, N.; Saito, H.; Hata, S.; et al. Influx of nitrogen-rich material from the outer Solar System indicated by iron nitride in Ryugu samples. Nat. Astron. 2024, 8, 207–215. [Google Scholar] [CrossRef]
  32. Newville, M. Larch: An Analysis Package for XAFS and Related Spectroscopies. J. Phys. Conf. Ser. 2013, 430, 012007. [Google Scholar] [CrossRef]
Figure 1. Pink-beam tomographic characterization of a fragment of sample C0034. Main images are false-color composite maps of reconstructed tomographic slices number 30 (A) and 31 (B), indicating XRF intensities for Se in red, Fe in green, and Mn in blue (all with independent intensity scales); yellow to orange spots have both Fe and Se; green spots are Fe without Se or Mn; blue spots are Mn with little or no Fe; turquoise-colored (blue + green) spots show the presence of both Fe and Mn. Shading differences from the outside to the center are due to absorption effects. See text for explanation of phase assignments shown in the legend. The 3-D voxel size is 4 × 4 μm in the plane of the slice × 1 μm thick. This is sufficient to distinguish the larger grains but not the fine-grained matrix. Insets: The outlined portions of each tomographic slice are shown in grayscale absorption contrast, which is a function of effective z-density. Darker voxels indicate higher absorption by such phases as metal oxides and sulfides. Silicates, phosphates, and carbonates are lighter, depending on what metals are in their composition, and organics and C phases are virtually transparent to hard X-rays. The arrows in (A) call attention to a grain that has high Se but no Fe or Mn, and the inset exhibits a low/intermediate absorption. The inset area in (B) highlights a composite carbonate grain, with a small high-Fe carbonate apparently overgrown by a low-Fe Mn-bearing carbonate.
Geosciences 14 00111 g001
Figure 2. Higher-resolution tomographic slice number 33, with voxel size 2 × 2 × 1 μm, showing Se (red), Fe (green), and Mn (blue) as in Figure 1. Absorption effects slightly attenuate signal from the center of the image, more so for lighter elements like Fe relative to, e.g., Se. Outlined areas 1, 2, 4, and 5 are shown in more detail in Figure 4A,B, Figure 4C,D, Figure 6A–C, and Figure 6D, respectively. Compared to lower-resolution tomograms shown in Figure 1, tomograms at 2 × 2 × 1 μm voxel size provide significantly better resolution of the fine-grained material surrounding the larger grains.
Geosciences 14 00111 g002
Figure 3. High-resolution tomographic slice number 32, voxel size 2 × 2 × 1 μm and showing Se (red), Fe (green), and Mn (blue). Outlined area 3 is shown in more detail in Figure 5.
Geosciences 14 00111 g003
Figure 4. Close-up views of areas marked in Figure 2. (A) Area 1 from virtual slice 33, showing Se, Fe, and Mn in red, green, and blue, respectively, as in Figure 2. (B) Corresponding absorption contrast map, showing relative absorption of components. Arrows in (A,B) indicate a feature that consists of small Fe + Se grains with high absorption forming a circular rim around a low-absorption low-Fe material. (C) Area 2 from virtual slice 33, showing Se, Fe, and Mn as in (A). (D) Corresponding absorption contrast image. Arrows in (C,D) point out a rod-like structure (actually a plate shape intersecting the plane of this slice) with high absorption, that is a composite of Fe and Fe + Se components, while the more rounded grain to the upper left is similarly a composite of those two components.
Geosciences 14 00111 g004
Figure 5. Close-up view of area 3 from virtual slice 32. (A) Se, Fe, and Mn as in Figure 3. (B) Corresponding image of absorption contrast. (C) Same area, depicting Cu in red, Fe in green, and Zn in blue. Arrows in the upper left of (A,C) mark a small grain that is high Cu and high Se but low Fe. There is only a scattering of small, low-signal spots with measurable Zn. (D) The same area, in this case depicting strontium (red), Fe (green), and Mn (blue). Note that the central areas of the Mn-bearing grains have a subtle purple to pink shading indicating the presence of trace Sr with the Mn. The two grains marked by arrows in the lower right of (A,D,E) exhibit a combination of Fe, Mn, and Sr. There are also some scattered very small red grains showing Sr without Mn or Fe. (E) The same area, showing Ca (red), Fe (green), and Mn (blue). Ca fluorescence is too low in energy for effective tomography, so it is only visible in the outermost ~40 μm of the sample, i.e., just along the edge. However, even that is sufficient to show here that the high-Mn grains are pink-purple colored and therefore contain significant Ca with the Mn. The two grains marked in (A,D) having both Mn and Fe also contain significant Ca. A number of small Ca-bearing grains appear red, indicating Ca without Mn or Fe. This distribution of Ca agrees with that of Sr in (D), confirming that Sr can be used to identify locations of Ca in the interior of the slice.
Geosciences 14 00111 g005
Figure 6. Close-up views of other areas marked in Figure 2. (A) Area 4 from virtual slice 33, showing Se, Fe, and Mn as in Figure 2. Arrows in (AC) bracket a structure having a fine-grained rim of Fe + Se and some Fe around a low-Fe low-absorption area, a feature like the one in Figure 4A,B. (B) Corresponding image of absorption contrast. (C) The same area showing Cu (red), Ni (green), and Mn (blue). Ni is relatively low signal, distributed throughout the matrix but not in the large high-Fe grains prominent in (A), the Mn-bearing carbonates, nor in the interior of the round feature with the rim of Fe + Se grains. (D) Area 5, from virtual slice 33, depicting Zr (red), Y (green), and Mn (blue). Zr and Y are present in small, widely scattered hot spots; some of these have both Zr and Y, appearing yellow, and others consist of Zr without Y.
Geosciences 14 00111 g006
Figure 7. Tender-energy XRF false-color map of the near-surface composition of whole-particle A0030, showing the distributions of P in red, S in green, and Si in blue. Note that the significant effect of surface orientation on XRF signal across the grain causes the bright and shadow effects, thus indicating topography as well as chemistry. Image was measured at the TES beamline with incident beam energy of 3.9 keV, beam focus size of 5 μm, and mapped at 5 μm pixel size.
Geosciences 14 00111 g007
Figure 8. Tender-energy XRF map of whole-particle C0034, showing P, S, and Si as in Figure 7. Image was measured at the TES beamline with incident beam energy of 2.7 keV, beam focus size of 5 μm, and 5 μm pixel size.
Geosciences 14 00111 g008
Figure 9. Tender-energy near-surface XRF maps of the smaller fragment of C0034 that was used for pink-beam FCT measurements. (A) Distributions of P in red, S in green, and Si in blue. (B) Corresponding map of Ca (red), Ti (green), and Mn (blue). This illustrates co-location of Ca and Mn; note that since sampling depth is greater for Mn than for Ca, grains buried below the surface may show Mn but not Ca signal. The grain marked with a circle is apatite, as it contains Ca but not Mn, and coincides with high P in (A). Locations marked were further probed using Ca K-edge XANES to identify phases apatite (Ap), dolomite (Dol), and ankerite (Ank). (C) Distributions of Mg (red), Al (green) and Si (blue). Al is concentrated in small spots, while Si and Mg are broadly distributed. (D) Distributions of P (red), Al (green), and Si (blue), more clearly showing the Al hot spots and the absence of Si in the carbonate and sulfide phases. (E) Distributions of Ti (red), Cr (green), and Mn (blue). Ti is present in discrete spots, while Cr is more broadly distributed at low concentration, with discrete higher concentration spots that are not correlated with Ti or Fe. Maps (A,C,D) were measured at the TES beamline with a probe beam energy of 2.7 keV, focused to 5 μm, and pixel size of 5 μm. Maps (B,E) were measured on the same mounted sample in the same orientation, at the XFM beamline with a beam energy of 7 keV, focus of 5 μm, and pixel size 4 μm.
Geosciences 14 00111 g009
Figure 10. (A) Mn K-edge μXANES of three representative spots on the two Ryugu samples are compared to reference spectra for Mn foil, Mn2+ (sulfate), Mn3+ (bixbyite Mn2O3), and Mn4+ (pyrolusite, MnO2) (reference spectra from [12]). The absorption edge (initial rise) position in energy is characteristic of oxidation state and shows that Mn in these Ryugu grains is Mn2+ as marked by the vertical dotted line. (B) Closer examination of Mn μXANES: bottom spectrum is reference rhodochrosite, MnCO3 (Sweet Home Mine, Alma, Colorado, USA), which has two dominant peaks at 6548.5(1) eV and 6560.6(2) eV. Middle spectrum is trace Mn in calcite (Franklin, New Jersey, USA), which has corresponding peaks at 6549.1(2) eV and 6559.3(2) eV and an additional peak at 6555.0(6) eV. Top spectra are two spots on A0030 and one on C0034; these spectra closely match each other and display two peaks that are each split at 6549.1(1) eV with a shoulder at 6552.4(1.4), and at 6559.3(4) and 6564.2(1.4) eV. This structure is analogous to that observed in Ca μXANES of dolomite (Figure 11), corroborating a dolomite structure host.
Geosciences 14 00111 g010
Figure 11. (A) Ca K-edge μXANES of several spots on C0034 (Figure 9B), identifying Ca-bearing minerals. The lower spectrum is reference calcite (sample from Brazil), which is dominated by peaks at 4048.0(1) eV with a shoulder at 4050.5(2) eV and 4059.1(1) eV. In dolomite, these spectral features are each split into two peaks at 4047.5(1) eV and 4050.6(1) eV, and 4057.1(4) eV and 4061.1(1) eV. The two middle spectra are that of reference dolomite (sample from Eugui, Spain) and closely match Ryugu C0034 dolomite with corresponding peak positions at 4047.4(1), 4050.6(1), 4057.1(3), and 4061.2(1) eV. In ankerite, there is wider separation of these spectral features, with component peaks at 4047.0(4), 4051.2(1), 4056.7(5), and 4061.6(2) eV. The upper two spectra compare reference ankerite (sample from Temagami, Canada) to ankerite in C0034, with peak positions at 4047.1(2), 4050.9(1), 4056.9(3), and 4061.8(1) eV. Details of spectral feature analyses are given in Supplementary Materials. (B) Ca μXANES of a different spot on C0034 (Figure 9B), one with coincident P fluorescence, matching the spectrum of reference apatite (Durango, Mexico). (C) In addition to the Ca XANES, phosphorus K-edge μXANES of representative spots on A0030 and C0034 match the P μXANES of the reference apatite.
Geosciences 14 00111 g011
Figure 12. A different view of whole-particle C0034. (A) XRF map depicting P in red, S in green, and Ca in blue; blue spots indicate Ca-bearing carbonate, while pink-purple spots indicate Ca phosphate such as apatite. Some of the smaller P spots are P without Ca. (B) A sulfur speciation map derived from maps of the same area made at multiple energies to isolate sulfide (shown as green), sulfate (shown in blue), and an undetermined intermediate S species (shown in red and pointed out with arrows). Note that different S species are scaled independently: sulfide is at significantly higher concentration than sulfate or intermediate S. These maps were measured at the XFM beamline, with probe beam energy near 2.47 keV, beam focus of 5 μm, and pixel size of 8 μm.
Geosciences 14 00111 g012
Figure 13. (A) Microbeam S K-edge XANES. The lower set of spectra are unoxidized sulfide spots (two on C0034 and one on A0030) compared to a natural terrestrial pyrrhotite reference sample (Lausitz, Germany), showing a close match in spectral structure. In particular, the initial peak of pyrrhotite is distinctively composed of two close peaks at 2469.9 and 2471.3 eV. The middle set of spectra are three spots on A0030, also matching pyrrhotite and some showing a small peak at 2482.5 eV (marked with arrow) indicating partial oxidation to sulfate. The upper set of spectra are of several spots on C0034, again all matching pyrrhotite but exhibiting a wider range of sulfate content. (B) Comparison of representative S and Se μXANES of Ryugu sulfides, having a similar general shape indicating similar host species. The Se spectrum shows a very small component of selenate (peak marked with arrow), analogous to the sulfate observed with sulfide in the S μXANES.
Geosciences 14 00111 g013
Figure 14. S and Se μEXAFS analyses. (A) A single scan of S in a sulfide grain in C0034, measured with a 5 μm beam spot at the TES beamline, showing EXAFS oscillations extending out beyond the XANES range. (B) Corresponding Se μEXAFS of the same sulfide grain, measured as the sum of six replicate scans using a 5 μm beam at the XFM beamline. Note that the length of Se scan was limited by experimental constraints. (C,D) Extracted EXAFS signal from the spectra in (A,B), plotted with k2 weight. (E) Fourier transform of this S EXAFS data vs. the corresponding fit to the pyrrhotite structure model. Upper plot is the radial distribution function magnitude, while the lower plot is the real component; measurement is shown in blue, fit in red. (F) Similar fit of Se data to the pyrrhotite model. (G,H) Back-transformed data (blue) and fit (red), for the range of R used in the fit, presented as k2-weighted plots demonstrating excellent fits for both S and Se. Fits to the pyrrhotite model include first-neighbor S-Fe (Se-Fe) and second-neighbor S-S (Se-S) distances.
Geosciences 14 00111 g014
Disclaimer/Publisher’s Note: The statements, opinions and data contained in all publications are solely those of the individual author(s) and contributor(s) and not of MDPI and/or the editor(s). MDPI and/or the editor(s) disclaim responsibility for any injury to people or property resulting from any ideas, methods, instructions or products referred to in the content.

