Abstract
An 8th century CE earthquake severely damaged inland cities across the southern-central Levant, but reported evidence of this earthquake along the coastline is scarce. In Caesarea Maritima, archaeologists have found contemporaneous anomalous sand and shelly layers within nearshore structures and interpreted them as construction fill, aeolian accumulation, or abandonment debris. Recently, similar sand deposits were exposed in a Roman-to-Islamic harbor-side warehouse. This presented the first opportunity to directly sample and systematically analyze in situ, undisturbed deposits in order to determine their origin and taphonomic (source and transport) history. Two sediment cores from the deposit as well as comparative reference samples from defined contexts were analyzed for grain size distribution, foraminifera (abundance/taphonomy), and relative age (POSL, archaeochronology). The results support the interpretation that the deposit was formed from the transport of offshore marine sediments during a high-energy inundation event, most likely a tsunami associated with the 749 CE earthquake.
1. Introduction
Records of modern, historical, and paleotsunami deposits are critical for guiding coastal disaster management and risk assessment. Coastal archaeological sites have the potential to reveal integrated anthropogenic and natural deposits, among them traces from past tsunamis. Not only can this improve the accuracy of the tsunami record, it also offers a glimpse into the human responses to ‘natural’ disasters. At present, however, tsunami deposits reported in coastal archaeological sites worldwide number only in the few dozens [1,2,3,4,5,6,7,8,9,10,11,12,13,14,15,16,17,18,19].
This dearth of information regarding sedimentary deposits of past tsunami events (paleo and historical) is the product of a few factors. First, the techniques used to identify, analyze, and record tsunami deposits have advanced significantly only in the past two decades, following major tsunamis (e.g., the 2004 Boxing Day tsunami, 2011 Tōhoku tsunami). Until then, by contrast, geoarchaeologists and sedimentologists found it difficult at best to distinguish storm deposits and even anthropogenic coastal strata (construction fill-layers, etc.) from tsunamites, and tended not to recognize tsunami deposits when they encountered them. Secondly, there is the problem of preservation: once a deposit occurs, it will only remain intact if it is somehow protected from subsequent natural erosion and clean-up efforts, or otherwise covered or buried. Established communities frequently cling tenaciously to their locations and therefore clean up or otherwise reconstruct their settlements in ways that can mask or entirely erase an event from the record. When tsunamis damage populated regions, particularly areas important to the local economy or sites whose inhabitants have the means or motive to renovate, extensive effort may be devoted to cleaning up the coastline and rebuilding damaged structures [4].
The 2004 Boxing Day Tsunami, which damaged coastal settlements and left sedimentary deposits all around the Indian Ocean, gave researchers the opportunity to observe both natural and anthropogenic processes affecting the preservation of tsunamigenic sediments over time [20]. Within a few years, flooding, reworking by waves, bioturbation, and root growth eroded or disturbed previously identified tsunami deposits [21,22,23]. These findings demonstrated how rapidly tsunami deposits are altered or erased from the landscape and contributed to our understanding of the likelihood of tsunami sediment preservation over time.
Additional factors impacting the long-term preservation of tsunami deposits have been identified elsewhere as well. In arid coastal Peru, when tsunamis damaged populated sections of the coastline in 1996, 2001, and 2007, the sandy horizons left behind were used as construction material in rebuilding efforts [24]. This redistributed and altered those original deposits. Tsunami deposits often survive best in low-energy environments, such as protected harbors, bays, lagoons, inland coastal lakes, or farther offshore at deeper depths below the storm wave base, where they have some protection from erosion, disturbance, anthropogenic interference, and general mechanical reworking and resorting [1,11,25,26,27,28,29,30,31,32,33,34,35,36,37,38].
Where deposits are preserved, there may or may not be a direct, recent tsunami deposit analogue from that specific site with which to compare. Therefore, studies may need to rely on reference samples as stand-ins to create end-members from which to identify, negate, or relate the results. A commonly used sedimentological method is to compare samples to reference samples from known environmental contexts of either contemporaneous or contemporary deposits. For example, in the Red Sea, comparative samples from recent floods and a transect of sediments offshore were used to assess an anomalous layer within a core, proposed as the remains from a large inundation event (tsunami) 2000 years ago [39]. In the Mediterranean, samples from before and after a large storm (<15 m wave heights) were compared with proposed tsunami derived deposits to determine whether they could be differentiated [40]. This approach is also commonly applied when using micropaleontological markers [41,42].
Many empires have controlled the eastern Mediterranean since the beginning of recorded history. Coastal areas hosted important maritime industries and were vectors of trade and long-distance communications. The tectonically stable regime of the region, coupled with the historical record of natural disasters, allows researchers to correlate tsunami deposits with recorded events from the past several thousand years. Surviving written accounts are often vague, however, and may date long after the events they purport to record, such that there is still much confusion as to the exact number, chronology, and severity of the inundations they mention [43]. It is, therefore, important to corroborate these written accounts with the sedimentary record.
Along the eastern Mediterranean coast of Israel (Figure 1), Caesarea was an important port-city from the Roman through Crusader periods (1st c. BCE–13rd c. CE) and contains evidence for at least three tsunami events in the past two millennia. There is also evidence for earlier events, including one that is synchronous with the Bronze Age eruption of Thera and another from the Chalcolithic period (6 ka) [3,4,6,8,39,40,44]. These events were reported from contexts in and around the harbor and farther offshore, based on sedimentological, archaeological, and geophysical criteria.
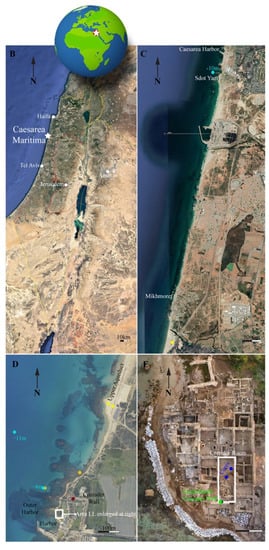
Figure 1.
Location and aerial photographs of Caesarea Maritima. All colored dots are linked to locations where samples were taken. (A) Location of the study site. Shaded region shows zone of intense damage from the 749 CE earthquake [45]. (B) Map of Israel with Caesarea Maritima marked along the coast. (C) Map of the coastal study region. (D) Aerial view of the archaeological site and southern part of the Upper aqueduct, where reference samples were collected (See Table 1 for color legend.). (E) Aerial view of Area LL, bordering the northern side of the inner harbor basin. The blue dots indicate cores collected within the excavation layers, and the green dots mark the southern baulk adjacent to a later crusader wall (after [46]. The bolded white rectangle in E highlights the Corridor area of Area LL, the primary focus of the study.
The first tsunami deposits discovered that postdated the construction of the Herodian harbor (c. 10 BCE) were dated to the 2nd c. CE [8], plausibly in connection with the major eastern Mediterranean earthquake of 115 [43] or perhaps the more local 110–114 earthquake [47]. This was a prosperous time in the harbor’s history; therefore, event clean-up and rebuilding would have occurred, as is evident across the site in the decades following the event [3,8]. The next major event documented by both textual and material evidence is the powerful earthquake and tsunami reported to have struck the coast of the Levant in 551 CE [3,6,39,48,49], again during a relatively prosperous time for the harbor and city [45,50,51,52]. The same lack-of-data issue exists, likely related to the inability during most of the 20th century excavations to recognize tsunami deposits. More recent archaeological reports identify thick deposits at least partially attributable to a sixth-century marine inundation in the shallower parts of the harbor [3,52,53].
A third tsunami occurred in the eighth century CE, possibly coinciding with a powerful inland earthquake that originated along the Dead Sea Fault in ~749 CE, which caused well-documented damage at many sites in the Levant [4,54,55,56,57,58,59,60]. Previous sedimentary evidence for this event was found in the upper part of the 551 CE offshore deposit [6,8,61], as well as throughout the site in the form of laterally extensive sands, shells, and even articulated human skeletons [61]. To read an in-depth account of this evidence and the interpretations provided by those excavators, see reference [4]. Summarized, interpreting any deposit as a tsunamite was beyond the interpretive options understood at that time.
Large sand deposits that include Islamic period artifacts (8–10th c CE) have also been described outside of the centrally developed parts of the site, especially in the coastal area to the south. Their origins were variously interpreted as the result of sand transport and stabilization [62], aeolian sand also appearing within ancient garbage dumps [63], and agricultural activity using anthropogenically enriched sandy soils [64]. While these deposits were found across terrestrial Caesarea Maritima and generally described, the research focus primarily concentrated on their association to their archaeological and historical context, or their coarser characteristics with the aim of associating to broader stratigraphy. Therefore, their similarity to various sediment sources or taphonomic histories was mostly presumed but not directly analyzed using comparative sedimentological techniques.
2016. Area LL Excavation
Area LL was partially excavated between the 1970s and 2000s (by Lee Israel Levine and Ehud Netzer in the 1970s [65] and Kenneth Holum and Jennifer Stabler in the 1990s and early 2000s [66]). Their reports described a fine, clean sand horizon of significant size (from 50 cm to 2 m thick) and without a clear purpose or cause. The same area was reopened and expanded in 2016 by the Israel Antiquities Authority and Caesarea Development Corporation as part of park renovations.
The excavation in 2016, during which collections for this study were taken, focused on the western and eastern warehouse structures of Area LL; the findings are described in the preliminary report of Area LL, published in 2018 [46]. The eastern warehouse consists of a north-south-oriented corridor with rooms branching off its eastern and western sides. This warehouse was rebuilt c. 400 atop earlier structures and remained in use at least through the early 7th century, judging by the large quantities of Byzantine pot-sherds and bag-shaped jars found there [66]. The warehouse was overlain by a later structure with a new floor plan. Finds within this overlying stratum include late seventh-century Aegean-imported amphorae and Umayyad cooking utensils and tableware (Figure S1, Room 12, found above the Byzantine bag-shaped jars). Above this is a destruction layer consisting of roof tiles, collapsed columns, and charcoal remains, along with fire-reddened walls at that same level, above a dark soil layer separating it from the Umayyad stratum and directly below a 1.5–2-m-thick deposit of sand and building stones from the collapsed southern and southwestern walls (Figure 2). This is an extension of the same sand horizon that was recorded in earlier excavations [66], wherein they focused on the northern side of the eastern warehouse in an effort to expand information from an even earlier excavation [65]. This sand layer was overlain by another completely new floorplan, delineating structures that were more poorly-constructed than the complexes from the strata below. Finds from this stratum include Abbasid-era artifacts (late-eighth to ninth centuries). There are also intrusions of later structures from the Crusader age [46].
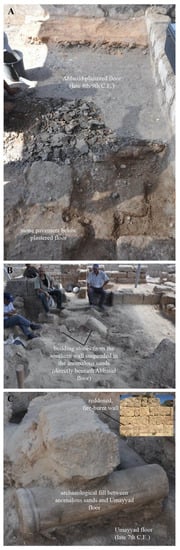
Figure 2.
Archaeological layers uncovered during the 2016 excavation. Chronology in the figure is based on archaeological finds associated with the layers [46]. (A) Abbasid floor. (B) Anomalous layer (the top of which touched the Abbasid floor above). (C) Umayyad archaeological fill directly underlying the anomalous deposit. Inset shows fire-burnt stones in the eastern wall of the corridor, at the same level as the top of the Umayyad archaeological fill.
The 2016 excavation provided the opportunity to expose portions of the Umayyad-period sandy horizons and analyze them directly to determine their origin and depositional history. The aim of this study was to negate or support the thesis that these eighth-century sand deposits across the site are preserved tsunami deposits. This was approached using multi-proxy analysis and comparison to known (analytically) characteristics of local sediments representing a wide assortment of local environments, taphonomic processes, and conditions. Should the deposits be tsunami-derived, a strong circumstantial case could be made for attributing them to an inundation provoked by the earthquake of 749 CE, which could in turn contribute to a broader understanding of tsunami dynamics, tsunami deposit preservation, and the overall history of the site of Caesarea Maritima.
2. Materials and Methods
2.1. Fieldwork
Excavation of Area LL in 2016 was performed manually with Israel Antiquities Authority (IAA) archaeologists (Uzi Ad, Yoav Arbel, and Peter Gendelmen, Permit A-7664) and a supervised work crew, with non-archived archaeological fill materials removed in construction bags, some of which were used as a protective storm barrier at the lower part of the site. Archaeological materials and finds were recorded and processed according to the standard procedures of the IAA.
2.1.1. Coring and Excavation Collections
A set of cores were collected for sedimentological analysis from within the central, long, rectangular corridor (Figure S4), after the upper Abbasid floor was removed and the anomalous sands were exposed. The cores were collected using a fence driver and 10 cm diameter light-tight aluminum pipes, as well as 7 cm plastic coring tubes. After hammering them into the sand, the cores were left while the area was excavated and then capped and extracted once exposed later in the excavations. Before transportation to the laboratory for opening, sampling, and analysis, packing materials were inserted into the tops to stabilize the upper part of the sediments before turning the core horizontally. Two aluminum cores, C1 and C2, were selected for study, and two additional cores were archived for possible future needs. A sedimentological description and nineteen sediment samples were taken from a baulk section on the southernmost trench of the excavation (Figure S3). This sequence forms the southern boundary of the corridor and abuts a Crusader wall from a structure on the western side.
2.1.2. Core Description
Both cores were fully described in terms of their sedimentary units, and photographs were taken. Artifacts found in the cores were bagged and labeled. One untreated charcoal (~20 mg) sample from the top 3-cm of sediment in the Umayyad archaeological fill and one untreated sample of various organic material (~20 mg) from the top 5-cm of the same layer in core C1, as close as possible to the contact with the lower anomalous deposit, were collected for radiocarbon dating. The samples were rinsed in distilled water to remove adhering particles, weighed, and sent to the Direct AMS Radiocarbon Dating Service in Bothell, Washington, U.S. The calculated radiocarbon ages with error were calibrated in OxCal v4.4.4 [67,68]. The calibration curve IntCal20 was chosen for calibration, which uses atmospheric data for the Northern Hemisphere [69,70]. All of the sediment from cores C1 and C2 was sub-sampled at 1 cm intervals and placed in containers for further sedimentological analyses described previously (grain size distribution, foraminiferal assemblage, and total organic carbon (TOC)).
2.1.3. Reference Sample Collection
In addition, a reference set of surface samples (13 total) from environmentally known contexts were collected from across the site and nearby in the region. These reference samples underwent the same analysis as the core and baulk samples. Three dune samples were taken from the natural Michmoret sand dunes, located south of Caesarea. Two samples were taken from Aqueduct Beach, north of Caesarea Maritima National Park: one from the sandy berm that forms a sand ramp against the seaward, beach side of the early Roman Aqueduct, and one from the beach. Five shallow-water surface sediment samples were collected by divers: two from eleven meters’ depth north of the ancient harbor and 500 m offshore; two from four and five meters’ depth (also north of the ancient harbor); and one from ten meters’ depth offshore Kibbutz Sdot Yam near a rocky reef, south of Caesarea Maritima National Park (Figure S5). Three sandy loamy soil (Hamra) samples were collected: one came from a core taken a few meters west of the Byzantine cloaca, and two came from the seafloor surface near the Late Roman shipwreck at four meters’ depth, north of the ancient harbor. Two storm-deposited sediment samples were collected from within the Crusader moat (~125 m from the sea). A storm or storms in the 2019/2020 winter season transported and deposited sediments underneath the pedestrian bridge over the moat of the northern Crusader fortifications surrounding Caesarea Maritima’s ancient harbor area (Figure S6). Major storms of the 2019/2020 winter season occurred on 9 December, 13 December, 24–27 December, 4–5 January, 8 January, and 16 January (which occurred closest to the time of sampling with significant wave heights of around 1 m). However, the strongest storm of the season occurred on 24–27 December with significant wave heights of more than 4 m (Israel Oceanographic and Limnological Research [IOLR] Mediterranean GLOSS #80 station, www.ocean.org.il, accessed repeatedly between 9 December 2019 and 20 January 2020), which is the storm most likely to have deposited the sediment collected. One sample came from a partially dry, exposed part of the deposit, and one from an area that still contained standing water. A map of sampling locations can be seen in Figure 1.
2.2. Analytical Methods
2.2.1. Granulometry
Grain size distribution analysis was performed on sub-samples from all reference samples and core samples. To remove organic matter, each sample was digested in 35% H2O2 until the solution stopped reacting with the sediment. Using a Beckman Coulter LS 13 320 Laser Diffraction Particle Size Analyzer, each sample was analyzed for grain size distribution between 0.04 and 2000 microns. By measuring the diffraction of light from a laser with a 750 nanometer wavelength, the instrument can measure grains with a certain diameter from 0.4 to 2000 microns [71,72,73]. The machine also uses polarized beams with wavelengths of 450, 600, and 900 nanometers so that the polarization intensity differential of scattered light (PIDS) system can then measure grain sizes at ten to sixty percent of these additional beam wavelengths so that the 0.04 to 0.4 fraction can be measured [71,74]. 116 size classes are used to detect the full spectrum of grain size distribution in volume, from 0.04 to 2000 microns [73]. The optical model, Fraunhofer.rf780d, was used to process the data. Since none of the samples analyzed contained large fractions of particles less than 10 microns in size, the variation in results between optical models is insignificant [74]. The machine has high precision for the sediments analyzed in this study: under 1% for well-sorted material and under 1.5% for poorly-sorted sands [73]. After analysis, the data was then exported to an excel worksheet for further data analysis. The Grain size was classified according to the Udden-Wentworth scale [75].
In addition to plotting the data in the more traditional standard X/Y graphs by mode, mean, and standard deviation, we also exported the data to Ocean Data View (ODV) Version 5.5.2 (Schlitzer, Reiner, Ocean Data View, https://odv.awi.de, 2021, accessed 1 February 2021) as a X, Y, Z scatter plot to illustrate how the grain size distribution and degree of grain sorting change with depth in section or core. The side color bar shows the percentage of a sample (set from 0 up to 13%) at a specific class size value. Data-Interpolating Variational Analysis (DIVA) gridding was used to interpolate the space between the class size values.
The grain size distribution data for all core and reference samples was also exported and plotted in PAleontological STatistics (PAST), Version 3.25 software. Using principal coordinate analysis (PCoA), a multivariate ordination statistical method, PAST software allows for the correlation of data points with multiple variables. In our case, the variables are the class size values. Class size values for each sample are put into a separate column so that each row contains all the grain size distribution data for a particular sample, creating a matrix. Using the algorithm by Davis (1986) [76], PCoA calculates the eigenvalues and percent variance from the Euclidean distances (raised to the power of 2) among samples [77]. PAST then plots the data points on a 2-D scatter plot based on how similar they are to each other (i.e., the closer two data points are, the more similar they are in grain size distribution). This method is helpful for finding clustering in the data and determining the sediment samples that most closely resemble each other in grain size distribution.
2.2.2. Total Organic Carbon
Total organic carbon (TOC) and inorganic carbon (IC) contents were calculated for several samples from each core, as well as one shallow marine sample from 5 meters’ depth and one sample from the Aqueduct beach natural dunes. TOC and IC were directly measured using a Skalar PrimacsSNC Analyzer (Skalar Analytical B.V., Stockholm, Sweden). For TC measurement, this instrument heats a powdered sediment sample (of known mass) to 1000 °C to remove both organic and inorganic carbon. TOC was then calculated (in percentage) by dividing the mass after carbon is removed by the original sample mass. Another powdered sediment sample (of known mass) is digested in concentrated HCl to remove only the IC. IC was then calculated (also in percentage) by dividing the mass after inorganic carbon is removed by the original sample mass. From these calculations, TOC was then calculated.
2.2.3. Foraminiferal Analysis
Core and reference samples were analyzed for their foraminiferal assemblages. For each sample, ten cubic centimeters of sediment were wet sieved through 500, 125, and 63-micron mesh sieves. Then, the 125–500-micron fraction was split into incrementally smaller volumes to make foraminiferal analysis more manageable. Using a binocular microscope, at least 300 foraminifera (if possible) were hand-picked from each sample and placed onto a slide [78]. Then, the total abundance of foraminifera per cubic centimeter was calculated:
Total number of foraminifera counted/(original vol(cc))*split).
In addition, the recent specimens were categorized based on whether the tests were pristine (including sharp edges and clear features/chambers) or weathered (including rounded edges and indistinguishable features/chambers). Furthermore, the total number of pristine tests per cubic centimeter was calculated from the abundance:
Number of pristine foraminifera counted/(original vol(cc)*split).
A JCM-6000 Benchtop SEM (JEOL) scanning electron microscope was used to take high-resolution images (beyond the magnification that Stereo microscopes are capable of) of the most common foraminifera from each sediment type as well as their taphonomic condition. Representative foraminifera from each sediment type were centrifuged in distilled water to clean off any agglutinating particles. They were then glued onto a black conducting pad on a metal stub, which was placed into a vacuum-sealed chamber of the SEM. A tungsten-hairpin filament is then heated to emit electrons, and an electron beam is then used to scan the surfaces of the foraminifera. The electrons penetrate the foraminifera, and the interaction between the electrons and the foraminifera is picked up as signals by detectors and used to produce high-quality images of the surface topography of the foraminifera [79].
2.2.4. Portable-Optically Stimulated Luminescence (P-OSL)
Several studies have demonstrated the utility of POSL relative dating in stratigraphic sections [80] and cores [81]. The LL cores were cut while protected from light to prevent exposure of the buried quartz grains. The cores were then fully opened in the Geomorphology and Portable Luminescence Laboratory (University of Haifa) under red light (‘dark room’) conditions. Twelve five-gram dry bulk samples were subsampled from the longer core (core C1): eight samples from the anomalous layer (Unit A), two from the mixed contact (Unit B), and two from the Umayyad archaeological fill (Unit C). The shorter core (core C2) did not have a thick enough anomalous segment (only ~9 cm) for representative results.
The lab measurements were taken following the continuous wave optically stimulated luminescence protocol (CW-OSL) [82]. One measurement was taken for each sample, during which the untreated samples were exposed to two 30-s pulses of infrared and then blue light by a pulsed-photon portable stimulated luminescence reader. The infrared light pulses release the infrared light stimulated luminescence (IRSL) signals from just feldspar grains, while the blue light pulses release the blue light optically stimulated luminescence (BOSL) signals of both the quartz and feldspar grains [82]. The signals were measured in photon-counts, and the B-OSL calculated net values [83] were plotted in MatLab to show the changing luminescence signals of only the quartz grains (the predominant mineral of coastal sands along Israeli shores [84,85]) with depth in core C1.
3. Results
3.1. Core C1
3.1.1. Description of LL Cores
Four separate sedimentary units (A–D) were identified from the two cores. Core LL C1 was 65 cm long and contained all four units (Figure 3), while core LL C2 was 50 cm long and contained only two units (A and C). Both were collected after the Abbasid Floor was removed and the underlying sands were exposed. Unit A, also referred to as the ‘anomalous’ deposit (0–34 cm depth in core C1 and 0–9 cm depth in core C2), consists of clean, loose quartz sand with no sedimentary structures or cultural artifacts. Unit B (from 34 to 40 cm in C1) consists of the same sediment as Unit A but with additions of several marine-encrusted potsherds and reddened, partially heat-fused sand clusters. Unit C, also referred to as the Umayyad archaeological fill (after Ad et al., 2018 [46] and C14 ages) (40–58 cm depth in C1 and from 9 to 50 cm depth in C2), is a dark gray/brown (10YR 6/2), organic-rich layer with many cultural artifacts, including potsherds, glass shards, shells, beach pebbles, charcoal, and bone fragments. Below Unit C, C1 penetrated into a compact earthen floor (from 58 to 65 cm depth), referred to as Unit D. Descriptions summarizing the characteristics of the units are presented in the main text for C1. C2, which agrees with C1′s values but contains only two of the units, is available in the supplement (Figure S2).
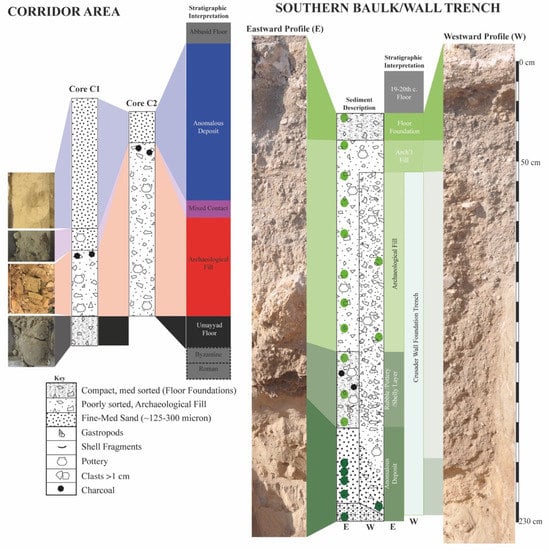
Figure 3.
Cores C1 and C2 (left) and Southern Baulk section (right). Descriptions of all layers identified in cores C1, C2, and the Southern Baulk section.
3.1.2. Grain Size Distribution
The top 40 cm of C1 (Units A and B) are dominated by well-sorted fine sand with minor trends towards medium sand (Figure 4). The specific mean values of Unit A are between 229 and 270 microns. Most samples in Unit A have a mode value of 223 microns, except for seven samples with a mode of 203 microns (at 23–25 cm, 27–28 cm, and 33–34 cm depth). Their standard deviation values are between 77 and 102, with one outlier at 21 cm depth with a value of 121. Unit B ranges in mean values between 239 and 329 microns (mainly medium sand). Two samples in Unit B have a mode value of 223 microns, while the other four samples have a mode of 203 microns (fine sand). Unit B’s standard deviation values are between 92 and 324.
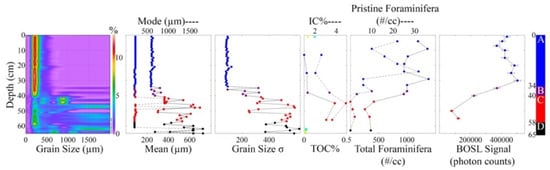
Figure 4.
Core LL16 C1 results. Grain size distribution with depth in the core (1 cm sampling resolution) presented as a contour map (Ocean Data View ‘ODV’ Version 5.5.2 (Schlitzer, Reiner, Ocean Data View, https://odv.awi.de, 2021, accessed 1 February 2021)) as well as in conventional profiles (mean, mode, standard deviation). TOC and IC values (%) of a representative set of samples are shown as a profile for Core C1, reference samples are shown in squares (TOC) and triangles (IC) to show their comparative values to the core (yellow = aqueduct beach sand ramp; aquamarine = shallow marine (−5 m depth), see Figure 1 for specific locations). Total and pristine foraminiferal abundances are shown plotted by core depth, sampling resolution of 5 cm. B-OSL signals (photon-counts) are plotted by depth with a resolution of about 3–5 cm in units A and B, and 10 cm in Unit C. The far right core illustration provides the thickness of each unit to scale, and the colors of the data points correspond with visually recognizable units.
In sharp contrast to and with a well-defined transition from Unit B above, Unit C has a significantly higher range in mean grain-size values, which are between 300 and 648 microns, ranging from medium to coarse sand. Unit C also has a high range of mode values (five samples at 203, seven samples at 223, four samples at 905, and one sample at 1739 microns), ranging from fine to very coarse sand. These samples also have a significantly higher range in standard deviation values between 250 and 589. Unit D has a similarly high range in mean values, which are between 360 and 724 microns, and a high range in mode values (three samples at 203, one sample at 684, and three samples at 1584). These samples have an even higher range in standard deviation values, between 371 and 622.
3.1.3. Total Organic and Inorganic Carbon Content
The two Unit A samples have total organic carbon (TOC) contents of less than 0.05% and inorganic carbon (IC) contents of less than three percent (2.62% and 2.06%). The topmost sample’s TOC content is even lower than the instrument’s detectable limit of 0.01%. The Unit B sample’s TOC content is 0.04%, compared with the lower Unit A sample’s 0.03%. The Unit B sample’s IC content is 3.38%. The two Unit C samples have TOC contents of 0.36% and 0.26% and IC contents of 4.92% and 3.64%, respectively.
3.1.4. Foraminiferal Analysis
Twelve samples from C1 were analyzed for foraminiferal abundance in roughly 5-cm intervals. The seven samples from Unit A have total abundances ranging from 944 to 1376 foraminifera/cc and pristine-only abundances ranging from 6 to 32 pristine foraminifera/cc. The two Unit B samples have values of 998 and 938 total foraminifera/cc. One of the Unit B samples has a pristine-only abundance value of 10 pristine foraminifera/cc, while the other has a lower value of three. The three Unit C samples have total abundances ranging from 254 to 413 total foraminifera/cc and near-zero pristine-only abundance values. The Unit D sample has a total abundance value of 358 and a pristine-only abundance value of 0.
3.1.5. Portable OSL
The net values of blue signal (B-OSL) from 12 bulk sediment samples were measured by a pulsed-photon optically stimulated luminescence reader. The eight Unit A samples range from ~370 k to 504 k photon counts. Two separate clusters were identified in Unit A. The three uppermost samples (0, 4, and 7 cm downcore) were defined by a decrease in counts from about 436 k to 370 k. The underlying five samples from Unit A have values with ranges that overlap one another (463 k to 504 k counts), and do not exhibit an overall trend in either a negative or positive direction.
The upper sample (35 cm) from Unit B is similar in count value (about 371 k) to Unit A above. The lower sample from Unit B (40 cm) has a significantly lower count value (about 223 k) than Unit A. The two Unit C samples from 50 and 55 cm depth have significantly lower counts values (79 k and 122 k) compared with Units A and B and show a linear increase in counts values with depth, and their value ranges do not overlap with each other.
3.2. LL Southern Baulk
3.2.1. Grain Size Distribution
The lower portion of the LL Southern Baulk section, from 195 to 230 cm depth, is composed of well-sorted fine sand with some medium sand input (Figure 5). The lower LL Southern Baulk is characterized by a small range of mean values from approximately 239 to 248 microns (fine sand), with one outlier at 225–230 cm depth with a mean value of 299 microns (medium sand). In addition, these samples have a single mode value of 223 microns (fine sand) and a small range of standard deviation values that range from 73 to 97, with one outlier at 225–230 cm depth with a value of 288.
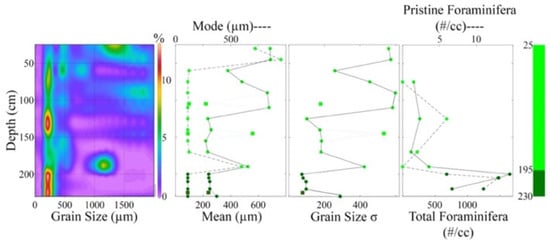
Figure 5.
‘LL Southern Baulk’ Results. ODV graph (far left) showing grain size distribution and grain sorting with depth in the LL Southern Baulk Section (19 samples); grain size statistics; total and pristine foraminiferal abundances with depth for several samples taken from each unit; section illustration with the thicknesses of each unit. Light green data points correspond to the upper ‘LL Southern Baulk’ section samples, while the dark green points correspond to the lower ‘LL Southern Baulk’ section samples.
Above this, the upper LL Southern Baulk section, from 25 cm to 190 cm depth, has a much higher grain size distribution and is poorly sorted, with multiple grain size peaks. However, two samples at 120–125 cm depth and 135–140 cm depth have a similar grain size distribution to that of the lower LL Southern Baulk, with mean values of 234 and 258 microns. The upper LL Southern Baulk is typically characterized by a high range of mean values that range from 219 to 689 microns (fine to coarse sand). The upper samples also contain a high range of mode values that range from 223 to 1908 microns (fine to very coarse sand). However, seven upper samples have the same mode (223 microns–fine sand) as the lower samples (at 70–75 cm, 85–90 cm, 105–110 cm, 120–125 cm, 135–140 cm, 140–145 cm, and 150–155 cm depth). Their standard deviation values also fluctuate widely, from 100 to 582.
3.2.2. Foraminiferal Abundance and Taphonomic Analysis
Seven samples from the LL Southern Baulk were analyzed for foraminiferal abundance. The four upper section samples have total abundances ranging from 131 to 406 total foraminifera/cc and pristine-only abundances ranging from 0 to 6 pristine foraminifera/cc. The three lower section samples have values, between 762 and 1651 total foraminifera/cc and pristine-only abundance values ranging from 6 to 13 pristine foraminifera/cc.
3.3. Reference Samples
3.3.1. Grain Size Distribution
The two storm-deposited samples have mean grain size values of 252 and 290 microns, mode values of approximately 223, and standard deviations of 98 and 157. The five dune samples have mean grain size values ranging from 230 to 268 microns, mode values of 223 (four samples) and 245 microns (Aqueduct beach sand), and standard deviations from 57 to 81. The three Hamra samples have mean grain size values ranging from 205 to 226 microns, mode values of 185 and 203 (two samples) microns, and standard deviations from 79 to 92. Finally, the three shallow marine samples that were analyzed for grain size distribution have mean grain size values ranging from 203 to 257 microns, mode values of 223 and 203 (two samples) microns, and standard deviations from 74 to 90. All grain size data from reference, LL Southern Baulk, and C1 and C2 samples were used to form a PCoA plot in PaST. The plot shows similarities in total grain size distribution among all samples analyzed. In addition, the mean grain size of all samples analyzed was plotted from the smallest to the highest mean value (Figure 6).
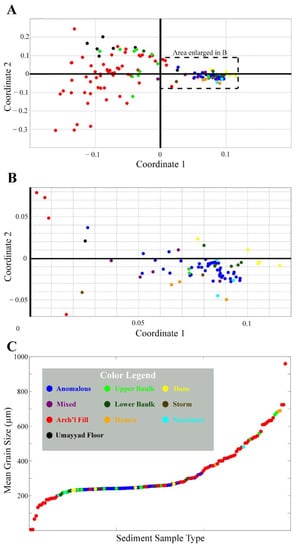
Figure 6.
Grain size analysis of all samples collected. (A) PaST plot showing the similarity in grain size distribution among all sediment samples analyzed, using principal coordinate analysis. (B) Expanded view of samples in outlined region. (C) Mean grain size values, plotted from lowest to highest, of all sediment samples analyzed. Refer to Figure 1 for sample collection locations.
3.3.2. Total and Inorganic Carbon
One natural dune and one shallow marine surface (5 meters’ depth) sample have been analyzed for TOC and IC content. The natural dune sample has TOC and IC contents of 0% and 1.33%, respectively. The shallow marine sample has TOC and IC contents of 0.02% and 1.98%, respectively (see Figure 4).
3.3.3. Foraminiferal Analysis
The two storm-deposited samples have total abundance values of 470 and 520 total foraminifera/cc and pristine-only abundance values of 3 and 10 pristine foraminifera/cc. The five dune samples have total abundance values ranging from 140 to 356 total foraminifera/cc (with the Aqueduct beach sample having the highest total abundance) and pristine-only abundance values of between 1 and 4 pristine foraminifera/cc. The two Hamra samples have total abundance values of 29 and 45 total foraminifera/cc and pristine-only abundance values of 0 pristine foraminifera/cc. The five nearshore samples have total abundance values of 494 (4 meters’ depth), 1104 (5 meters’ depth), 1875 (10 meters’ depth), and 686 and 725 (11 meters’ depth) total foraminifera/cc, and pristine-only abundance values of 14 (4 meters’ depth), 38 (5 meters’ depth), 90 (10 meters’ depth), and 24 and 46 (11 meters’ depth) pristine foraminifera/cc. The total and pristine-only abundances of all samples analyzed, including reference, LL Southern Baulk, and C1 and C2 samples, were plotted from lowest to highest abundance in Figure 7.
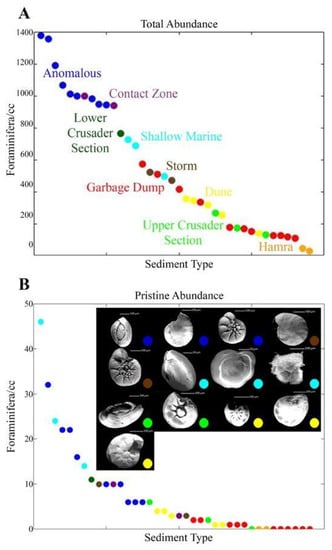
Figure 7.
Foraminiferal abundances of all samples collected. (A) Total and (B) Pristine abundances of both core and reference samples of foraminifera per cubic centimeter of sediment. Refer to Figure 1 for sample collection locations.
3.4. Dating
Archaeological data in area LL constrains the maximum possible age range of the units studied. Units A and B lie directly on top of an Umayyad archaeological fill, which has been dated using archaeological finds to the late 7th to early 8th centuries CE, and directly below an Abbasid floor, which has been dated to the late-8th to early-9th centuries CE. A single piece of charcoal from the surface of the Umayyad archaeological fill (Unit C) in core C1 has been radiocarbon dated with 95.4% probability to 649–687 calCE (73.5%) or 743–773 calCE (22.0%), consistent with the archaeological finds. A second radiocarbon age was measured on a mix of small organic materials from the same layer as the previous charcoal sample, with a result of 605–665 calCE (95.4% probability). Table S1 gives the raw data for all samples analyzed.
4. Discussion
4.1. Comparison of Anomalous Samples to Reference Set
For this specific region, there has not been a recent tsunami (post-instrumentally recorded) from which it is possible to directly compare the sediments. Therefore, determining unequivocally whether the anomalous sandy deposit (‘Unit A’) seen within the excavation is a tsunami deposit is impossible. However, it is possible to compare these deposits to known sources of sediment deposition, thus providing support for or negating the various proposed options. In the case that the analytical results do not support deposition from non-tsunami sources (e.g., reference context samples) and the deposit fits known tsunamigenic criteria from parallel research elsewhere and general sedimentary dynamics, then it can be argued that the deposit could be interpreted as a tsunamite. Here, comparisons between reference sample characteristics and those of Unit A, the anomalous sandy layer of interest, are discussed.
Unit A does not match the results of the multi-proxy data of any of the reference samples. It shares the most properties with the shallow marine samples but varies with regard to the amount of foraminifera (greater than most) as well as the number of pristine individuals (lower). The characteristics of the mixed contact samples (Unit B) are very similar to those of the anomalous deposit (Unit A). Unit B varies in that it contains marine-encrusted potsherds and chunks of reddened, partially-melted-together sand chunks. These reddened, fire-marked sand chunks are in agreement with the presence of reddened in-situ building blocks along the intact eastern wall of the room (and elsewhere along the walls). These markers indicate a fire that took place before the arrival of the anomalous sands. Furthermore, the marine-encrusted potsherds mixed in with the anomalous sands indicate that these inclusions were previously submerged in the marine system for long enough for the encrustation to take place, suggesting that they were transported from the sea to land at the time of the event.
The Umayyad archaeological fill at the bottom of both cores (Unit C) was broadly exposed during excavations and is typical of an ancient garbage dump. There is a high concentration of cultural artifacts in a matrix of organic-rich brown sediment. Wind-transported sand from the beach makes up some of the matrix sediment. These archaeological fill samples have very different values from the anomalous samples (Unit A) in all analyses. Most of the samples have similar abundance values to the dune and upper ‘LL Southern Baulk’ section, while a couple of samples have similar values to the storm and shallow marine samples from four meters’ of water depth, which could indicate minor mixing with the anomalous deposit above.
Construction fills are often made of a heterogeneous mix of onshore materials easily accessible near the construction site and will often include a high concentration of organic material and cultural artifacts. A construction fill deposit can also exhibit dumping sequences from the method of construction. Since onshore material is commonly incorporated into construction, such as dune or beach sand, the sediment should have a low concentration of eroded foraminifera. As expected, much of the upper ‘LL Southern Baulk’ section met these criteria. The samples were quite similar to the Umayyad archaeological fill samples (Unit C). Based on the macroscopic sediment characteristics, grain size distribution, and foraminiferal characteristics, we can exclude this anthropogenic process, namely construction activities, as the origin of the anomalous deposit (Unit A).
However, the lower ‘LL Southern Baulk’ section samples were different than those from the upper portions of the section and clustered with the anomalous samples in the nearby warehouse corridor (Unit A). Figure S3 shows the ‘LL Southern Baulk’ section, with the lower section abutting the Crusader wall highlighted. We propose that the lower ‘LL Southern Baulk’ section is associated with the anomalous deposit within area LL’s cores from the central corridor. When the Crusaders built a structure on the southwestern portion of the earlier complex, they dug through the preserved anomalous deposit to place the foundation of a wall there. However, due to the loose nature of sand, the sand deposits flowed back into place after the construction trench was dug, which is now seen abutting the Crusader wall. This sand flow into the newly dug trench is also confirmed by the presence of a loosely compacted ‘cavity’ further away from the wall (Figure S3a,b). This is indicative of the negative space created when these sands flowed and left materials above it without underlying support. During this process, the anomalous sandy sediment may have mixed with surrounding sediments, which accounts for their minor deviance in grain size distribution and foraminiferal abundances in the better-sealed sand layer collected in the cores. Then, the trench was refilled with a mixture of materials found nearby.
Although the dune sand samples have similar TOC, IC, and grain size distribution values as Unit A, their foraminiferal (total and pristine) abundances vary significantly (Figure 7). Due to the nature of aeolian transport from the beach source that creates these coastal dunes, the total foraminiferal abundances and preservation of tests were significantly lower than those of the anomalous samples (e.g., abundance of 400 versus 1400 individuals/cc and <5/cc versus ~30/cc, Figure 7). Therefore, dune formation is negated as a possible origin of the anomalous deposit.
The storm-deposited samples from the Crusader moat were collected within weeks after several major winter storms, the largest of which included significant wave heights exceeding 4 m (Israel Oceanographic and Limnological Research [IOLR] Mediterranean GLOSS #80 station, www.ocean.org.il). The storm samples collected were also quite different from the anomalous samples. While one sample was similar in grain size distribution, the total average foraminiferal abundances were two-fold less than those of the anomalous samples and had values similar to those of the shallow marine sands from four meters’ depth. This indicates that a modern strong winter storm along the coast in the vicinity of Caesarea Maritima can transport sediments from the seafloor at around four meters of water depth, a value also measured in nearby offshore sediment suspension studies from depths wherein resuspension occurred at the same depths during similar storms [86].
It should also be noted that storms with greater than 10 m significant wave height occur along this coastline on a 10–20 year basis, and four events greater than Hs > 7 m have occurred since 2000 (February 2001, December 2002, December 2010, and February 2015, Haifa measurement station [87]). Offshore seafloor samples from the 2010 storm event (waves measured at 14 m height at the nearest station, 4 km from the research site) were compared in two previous studies to proposed tsunami layers in coastal and offshore sediment cores, and in both cases were found to be a non-match [5,40]. Furthermore, coastal sand accumulations due to these storms have never been reported, though significant coastal erosion and retreat have been reported [88]. Inundation values along the Caesarea beach, north of the study site, following the 2010 storm did not exceed 50 m.
The results from the sedimentological analysis of the shallow marine reference samples are the closest match to the anomalous samples. The total and pristine foraminiferal abundances of the shallow marine samples even exceeded the total values of many of the shallower reference samples. In the shallow marine realm, increasing depth of the seafloor typically corresponds to higher foraminiferal abundances and correlates to depth values [89,90].
4.2. Foraminifera Taphonomy as Tsunami Marker
Tsunami sedimentological research studies have demonstrated the efficacy of foraminifera-based data as a proxy for identifying and differentiating coastal processes, sea-level change, and tsunami events in particular [91,92]. While taxonomic-based assemblages have been a mainstay of environmental and paleoreconstruction research for decades [93], many other ways of mining foraminifera collections beyond their taxonomically-anchored statistical assemblages have also been introduced [5,6,31,40,41,94].
Areas lacking discrete sub-environments or that result from processes that may lead to heavy mixing between source sediments might not produce meaningful taxonomy-based assemblages due to their similarities. Caesarea is an example of such a place. The gradually sloping, shallow, sandy upper shelf zone (up to about ~35 mbsl and 2.5 to 5 km distance from the coast) may have a high degree of taxonomic-based assemblage homogeneity. Indeed, a study that meticulously documented the taxonomy of seventy-four samples from nine transects and four isolated collections covering the <100 m depth region offshore of Israel [95] resulted in three cluster groups, with all samples shallower than ~40 m clustering taxonomically into one group. The ~40 m water depth also demarcates the transition from sandy to more clay-rich silty deposits [96], suggesting a strong substrate-dependent relationship for this group.
Planktic/benthic values (P/B), which generally coincide with increasing water depths, can be an important proxy for reconstructing marine sediment transport [94]. Here, planktic foraminifera were not found in any samples. This is expected, as even at water depths of ~40 m, they are sometimes absent entirely, rarely greater than 2% relative to benthic individuals in surface sediment collections [97], and only exceed values of 20% beyond hundreds of meters of water depth.
For all of these reasons, taxonomic-based assemblages are, in some cases, such as in Caesarea, the wrong tool for the job. If we look even closer at the study site, research on Caesarea’s ancient harbor and the microfossils associated with it [98,99] showed that the differentiation of harbor phases (destruction/tsunami, active) was determined mostly by the relative presence of two foraminifera species, and the overall group assemblages were weak as an independent proxy. However, these phases did correspond with the presence or absence of specific, albeit rarely-occurring, individual species. In many statistical clustering protocols, these would be excluded as their weighted errors would exceed their presence, despite their potential as a defining proxy [6]. The results of such assemblage work will produce statistical clusters, as will any matrix of data, but the clusters will not necessarily produce categories relevant to the question but rather only a mathematical value. Instead, for this environment, taphonomic characteristics and other non-taxonomic quantitative information, such as the total average number of foraminifera, ‘corrassion’ (erosion/staining), breakage, sizes, and condition (pristine/non-pristine), we argue, provide a stronger and more relevant means of comparison between these samples and create a robust dataset for determining sample similarity.
4.3. Probable Origin of the Anomalous Deposit
Only one of the proposed processes has not been eliminated as a potential source for Unit A (Table 1). Unit A’s grain size and foraminiferal abundances are the strongest evidence for a marine origin. The possibilities for deposition of marine sand on land in this location include storm deposition, dredging operations, sea level fluctuations, or tsunami deposition. Depending on the local environment, storm and tsunami deposits can be difficult to distinguish from each other, making this the topic of many studies of coastal environments around the world [100,101,102,103]. In this case, we argue that the foraminiferal results provide a clear distinction between tsunamis and modern storms. The anomalous sediment’s much higher foraminiferal abundance values relative to the storm-deposited sediment indicate that it originated from a depth below that from which modern winter storms in the Levant typically transport. However, we cannot conclude, at this point, whether storms in the 8th century were as powerful as, or possibly more powerful than, modern storms along the present Israeli coastline. Nor can we be 100% certain that our modern storm samples are the best comparison to those past storms. That said, we can easily differentiate the anomalous from the modern storm, and the modern storm is not the closest match relative to other reference samples. Therefore, we feel confident excluding the storm interpretation. Relative sea level has not changed significantly over the past 2000 years, in fact fluctuating by about 0.3 m over that time and being approximately at today’s level during the eighth century [104]. As there are no significant age gaps within the harbor sediments [98], large-scale dredging operations can also be ruled out. This leaves tsunami deposition as the only possibility that cannot be refuted.

Table 1.
Overall Comparison Table. Table comparing the anomalous sediment characteristics to each reference sediment type. For each parameter, sample values for each sediment type have been averaged. The anomalous samples are all shaded in black. For all reference sediments, the box for each parameter is shaded based on how distant (by %) it is from the anomalous sample values, which are shaded black. With each 5% difference away from the anomalous samples, the shading becomes lighter. White cells indicate a value that shares the least similarity while black or dark gray indicates closer similarity.
An additional aspect of the destruction layer that supports its tsunamigenic origin is the directionality and concentration of the collapse of the walls into the rooms. In earthquake debris, the damage tends to be distributed over an area, with damage decreasing with distance from the epicenter (disregarding substrate character changes) [54,105]. Tsunamis, on the other hand, tend to leave a ‘wrackline’ between the damaged and undamaged areas [105,106]. In Area LL, the severity of the damage is isolated to the south and west sides of the building. Similar destruction patterns have been described after the modern 2018 tsunami in Sulawesi, Indonesia, and the ancient, Thera-eruption-driven tsunami at Cesme Baglararasi [7,107].
Furthermore, the collapse of the wall appears to have come from a southern direction (Figure 8), rather than the more ‘obvious’ western, seaward direction. This can be explained as the result of a phenomenon that often occurs when tsunamis enter harbors and other confined spaces. The shallowing and constriction of the wave energy can redirect flow and produce eddies that magnify the intensity of erosion and destruction along the harbor’s edges, often more so than on open coastlines exposed directly to the incoming waves [34,108]. For example, an earthquake-generated tsunami in the Gulf of Aqaba-Eilat offshore the southeastern Sinai Peninsula reached an amplitude of about 1 m along the Sinai’s open coast. However, the amplitude reached three to four meters after entering Nuweiba Harbor [109,110]. In addition, tsunamis with amplitudes of only 1.5 m have been known to produce currents in harbors strong enough to detach freighter ships from their mooring lines [111,112]. Area LL is located on the northern side of the harbor basin, and therefore, the wave’s arrival and destruction from the south fits a causal tsunami mechanism better than storm- or aeolian-delivered sands.
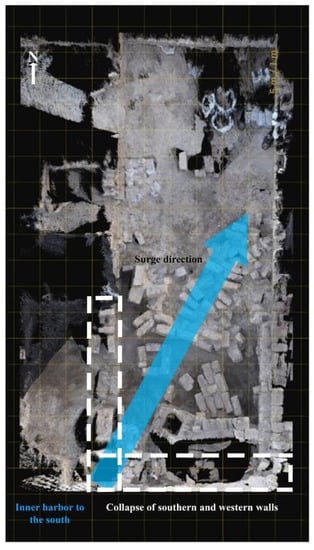
Figure 8.
Tsunami corridor. Based on the damage to the southern and southwestern walls and orientation of the collapsed building stones, the dominant destruction came from the southern harbor-facing side of the corridor. Structure by Motion created at CHEI, University of California-San Diego.
4.4. Chronological Association with the Earthquake of 749 CE
The 8th century CE timing of the collapsed warehouse room coincides with the earthquake of 749 CE. At Caesarea, clear and unequivocal evidence for such a massive earthquake at that time was absent. Rather, isolated reports describe single-column-fall damage or other structural failures [113], but none were as comprehensive as those seen inland.
The collapse of the ceiling in Area LL’s eastern warehouse possibly coincided with this earthquake, along with the fire that ravaged the complex, reddening stones in the warehouse walls and producing the abundance of charcoal found in the upper Umayyad archaeological fill. The burnt chunks of sand (see Figure 3) could indicate that the tsunami water and deposits extinguished that raging fire. In addition, several historical sources, including the Chronicle of Michael the Syrian, mention a flooding of the coastline around this time [48,114,115]. However, these accounts were written down hundreds of years after the earthquake occurred, so the correlation between the earthquake of 749 CE and a tsunami cannot be secured based solely on the historical record.
Depending on a tsunami deposit’s contents and condition and the unique set of circumstances specific to tsunami transport, many approaches to chronology have been used [2,7,15,24,116,117,118]. One important thing to establish is whether the deposit occurred in a single event rather than gradually. This is complicated by the problem that tsunamis can entrain and redistribute older materials from the landscape, and therefore older dates, as well as a wide range of dates, can be expected and even diagnostic. Dating is especially dependent on the bracketing produced by underlying and overlying deposits. There, too, one must be cautious because lower erosional contacts can lead to even older dates. Great care must be taken to try to measure the most representative materials, as well as in the interpretation of results.
OSL ages in tsunami deposits from Caesarea Maritima were shown to have wide overdispersion values [116], which is a reflection of the chaotic mixing during transport, wherein grains of varying burial times are mixed together, zeroing is incomplete, and the sediments are reburied quickly enough to conserve their original signal. In this case, the most recent dates in those measurements are a better reflection of the deposit’s age, and the overdispersion values are useful in confirming the sedimentary transport mechanism. Another tool for establishing chronology involves the use of only articulated bivalves for radiocarbon dating. Dead bivalves rarely maintain their pairing when in open-water conditions or when predation occurs; they tend to remain intact only if buried rapidly while still alive or recently dead [15]. In some cases, the presence of cultural remains such as pottery or other closely datable artifacts can also help to date a deposit [15], or at least establish the earliest possible date-range for its deposition (it cannot pre-date the materials deposited below it unless mixing or layer reversal occurred).
In the case of the deposit in Area LL at Caesarea Maritima, the radiocarbon dates of charcoal and organic material from the upper contact of the Umayyad archaeological deposit (Unit C) range from 605 to 779 CE. Only a chronological range that, with error, is later than 749 would negate the possibility that the deposit is synchronous with the earthquake of that year. The stratigraphic placement of the deposit between one floor still in use in the early 8th century and another installed in the later 8th or early 9th centuries [46] further supports the association of the deposit with the event of 749 CE. Table S2 lists all reliable earthquakes that fit these chronological constraints (partially or fully) and details why they are or are not likely candidates for the LL deposit.
4.5. Primary, Secondary, and Tertiary Events
Although the 749 CE earthquake occurred inland, it could have triggered an offshore submarine landslide (slump) that, in turn, generated a tsunami. Through modeling, it has been proposed that earthquakes with magnitudes over 6–6.5 with epicenters along the Dead Sea Transform less than 80–100 km from the coast can trigger marine slumping events [43], which leave distinctive morphological features in the offshore bathymetry. Many such forms have been identified along the Israeli continental shelf [119,120], some of which could have corresponded with this earthquake. Over the past 2000 years, several earthquakes with inland epicenters in the Levant have been associated with historically-documented tsunami events that have impacted the Levantine coast [121]. Until recently, this terrestrial earthquake-offshore slump-tsunami sequence was anchored in historical sources, modeling, and theoretical parameters [43], but lacked physical evidence. However, a 7.7 magnitude earthquake in 2013 with its epicenter along the inland Makran subduction zone, struck southern Pakistan. Immediately afterwards, tide gauges in ports in Oman and Iran recorded tsunami waves of approximately 1 m in height. Submarine slides along the Makran margin most likely generated these tsunami waves [122]. In addition, the eastern Mediterranean has a multitude of tsunami-generating sources; so a different offshore source, independent but chronologically close to the recorded 749 CE earthquake, is also a possibility [123].
4.6. Lack of Other Identified Onshore Deposits
As described in Dey et al., 2014 [4], other onshore deposits from the same tsunami event have likely been exposed during previous excavations. In the decades after the transition from Umayyad to Abbasid rule, Area LL was reoccupied and rebuilt [46], but instead of removing the entire tsunami deposit, the restorers apparently simply leveled the anomalous layer where necessary to support the new floors built above it. This is what led to the preservation of the deposit, and it follows that the extant portions represent only a remnant of the original deposit, which was probably both thicker in places and more extensive (as thick, sandy layers documented elsewhere in the LL complex in the past indeed suggest [46]. The original deposit, prior to post-depositional disturbances, may have contained other signs of typical tsunami deposits found along Israel’s coast, such as allochthonous shell beds or debris from the harbor bottom. Nevertheless, enough of the deposit was preserved to shed light on its probable origins.
4.7. Tsunami Sediment Source
One final consideration is the source of the sediment deposited in Area LL. Reinhardt and Raban (1999) [99] postulate that a natural barrier of sand formed across the entrance to the harbor beginning in the fourth century [99]. Evidence for this lies in the fine-grained muddy sediment from the harbor bottom during this period, which resembled a lagoonal environment [98]. Archaeology of the harbor and site indicates that the harbor was in disrepair, and while maritime commerce continued, onloading/offloading activities probably shifted to anchoring locations seaward [61]. Therefore, a natural feature, such as a sand barrier overlying and connecting the disarticulated remains of the original Roman harbor, could have been responsible for the creation of this lagoonal environment. This increased availability of sand overall, and particularly near the warehouse complex in Area LL, may explain why transport and deposition by the tsunami of 749 CE contained such large volumes of marine sand. A similar clean, sandy tsunami deposit on the floor of a building has been observed in a post-earthquake-tsunami survey in 2018 on Sulawesi, Indonesia [124].
4.8. Summary of Events, Presuming Tsunami Interpretation
As Caesarea Maritima transitioned from a capital Byzantine city before 640 CE to a smaller early Islamic settlement from the mid-7th century on, usage of the harbor declined further. The harbor warehouse complex eventually fell out of use during the late seventh century and was abandoned. In 749 CE, the region was devastated by an earthquake, and while Caesarea Maritima did not bear the brunt of the impact, the earthquake was strong enough to shake the warehouse complex, causing the roof to collapse and a fire to spread. This earthquake also indirectly created a tsunami that arrived from the west and entered the harbor, causing further damage to harbor infrastructure. Structures on the interior sides of the harbor, such as the warehouse, were particularly vulnerable to the force of the tsunami due to eddy formation and magnification. The force of the tsunami collapsed the southern wall of the warehouse, and the inundation and deposition of marine sand may have extinguished the active fires. The tsunami damage to this area was left unremedied until several decades after the incorporation of the city into the Abbasid Caliphate (beginning 750 CE), when the deposit was merely flattened and built over during the resettlement of Area LL, effectively preserving the remains of the tsunami deposit.
4.9. Tsunami in Caesarea Maritima and Social Context: The Umayyad-Abbasid Shift of Power
Where human societies are concerned, there is no such thing as a ‘natural’ disaster. The perception, recording, responses to—and scientific study of—environmental and biological traumas are, essentially, social phenomena. Floods and droughts, plagues and famines, earthquakes and tsunamis do not affect communities in uniform and predictable ways, nor do they necessarily lead to ‘negative’ outcomes (such as demographic collapse and breakdowns in social and/or material structures) in the long term. They may even have constructive consequences, such as increased community cohesion, the redistribution of resources, and opportunities for upward mobility for the survivors. What matters most for the future prospects of an individual city or an entire society afflicted by a ‘natural’ cataclysm is not so much the severity of an event (however this is measured or perceived: in terms of deviation from established norms, duration, body-count, etc.), but rather the capacity of the affected population to respond and recover, and the mechanisms and mitigation strategies it employs in order to do so, which in turn depend on contingent webs of environmental, biological, social, political, and economic factors [125,126,127,128].
Hence, we would steer well clear of any simplistic, generalizing claims that the earthquake and tsunami of 749 inevitably transformed the historical trajectory of the settlement at Caesarea, much less of the early Islamic Levant as a whole. At the same time, the earthquake and perhaps especially the resulting tsunami clearly caused localized destruction in Caesarea and disruptions in the lives of its inhabitants. By integrating the 8th-century tsunami deposits identified in terrestrial contexts with the expanding archaeological record for the town as a whole, we can hope to learn more about ways in which this particular population coped with the effects of a substantial ‘natural’ disaster.
Most of the c. 128 ha enclosed within the old Byzantine city had already become depopulated in the century following the Islamic conquest in 640 CE [45,129,130,131]; and in these areas, the extensive deposits we propose were left by the marine inundation of 749, which apparently accelerated processes of abandonment and dereliction that were already well under way. Between the temple platform and the theater in the south, for example, expanses of irrigated gardens installed among abandoned buildings were buried under layers of shell and sand that were never removed, where subsequently only sparse burials testify to any continuing human presence [4,45]. In the zone around the old inner harbor, which was becoming the center of the much-reduced Islamic town, however, the tsunami appears not to have compromised future development in profound and lasting ways. On the contrary, in the former warehouse complex in Area LL and also in the other excavated areas around the inner harbor (Areas TP, I, and Z), a phase of relative vitality begins in the later 8th and early 9th centuries. We have already described the new structures that rose above the marine deposits in the warehouse in Area LL in the decades around 800, and similar clusters of houses, workshops, and granaries formed among and above Byzantine-era structures in Areas TP, I, and Z also beginning in the later 8th and early 9th centuries. Based also on the quantities of pottery and other small finds recovered from the surroundings of the inner harbor, it looks as though population and density of settlement were, if anything, increasing in the century after 749 [46,67,130]. This also appears to be when the roughly rectangular circuit of walls surrounding the inner harbor on three sides (later rebuilt and considerably thickened during the Crusader period) was first built. While far smaller than the Byzantine circuit that preceded it, this was a very substantial masonry structure, 2.5 m thick and reinforced with projecting towers, that enclosed an area of 24 ha [132]. Evidence for more activity and agriculture in the southern dunefields also support this argument [62].
Together, these developments indicate considerable investment in the townscape. The new circuit of walls in particular was a resource- and labor-intensive project that presumably (there is no hard evidence one way or the other) required the intervention of the governing authorities, beginning in the Abbasid period after 750 or, perhaps more likely, beginning under the Abbasids themselves [132]. In any case, Caesarea’s relative resurgence during the first century of Abbasid rule is striking, particularly in light of the prevailing consensus for declining prosperity and investment in Palestine’s towns following the Abbasids’ overthrow of the Umayyads and their transfer of the capital from nearby Damascus to distant Baghdad [131,133,134,135]. Perhaps, for reasons that can only be guessed at, the Abbasids and their local governors decided to privilege Caesarea as a strategic coastal site and consequently sponsored its new circuit of walls and possibly offered other incentives to encourage settlement in the intramural area. Whatever the explanation, the point stands that the town-center was apparently somewhat more densely settled and prosperous in 800, a half-century after the earthquake and tsunami, than it had been in the period c. 700–750.
Evidently, then, the earthquake and tsunami of 749 did not strike a mortal blow to a town already in terminal decline. More archaeological work by excavators primed to recognize tsunami deposits in terrestrial contexts is needed to flesh out our understanding of how Caesarea’s population responded to the trauma of 749. Based on the evidence already available, however, it would seem that some of the destruction and marine deposits left by the inundation of the inner harbor area were put to practical and essentially constructive uses. In the former warehouse in Area LL, the thick deposits left in situ became the foundation for a distinctly Islamic neighborhood that rose some 2 m above the Byzantine levels below, where the new structures were perhaps somewhat drier and less exposed to future marine inundations, and similar sequences of later 8th- and 9th-century buildings atop probable tsunami deposits were observed in the 1990s in the nearby Area I [4,136]. We would thus propose as a working hypothesis, pending the results of future investigations, that those responsible for the consolidation of the town-center in the early Abbasid period took the destruction and marine deposits around the inner harbor as an opportunity to begin shaping a new town center, distinct in both plan and elevation from the derelict remains of antiquity that it partially superseded.
5. Significance
This study aimed to further the understanding and identification of terrestrial tsunami deposits within archaeological contexts, particularly with regards to tsunami-prone coastlines or insecurely interpreted deposits are present. Defining the characteristics of these tsunami deposits can help in the early identification of anomalous sandy units as potential tsunami deposits in future excavations along Mediterranean shores. It is important to note that he approach is exclusionary, meaning ha I can increase the confidence of interpretation through elimination of known possibilities, but is not a fool-proof means to determine with absolute certainty. The findings of this paper call for the reevaluation of previously reported eighth-century sandy deposits in the region. In addition, the identification of further terrestrial tsunami deposits can help in defining the minimum distance inland that future tsunamis have the potential of reaching, as well as the energy of such tsunamis. This will enhance efforts in tsunami mitigation and improve the accuracy of hazard maps.
Supplementary Materials
The following are available online at https://www.mdpi.com/article/10.3390/geosciences13040108/s1, Figure S1: Umayyad findings in eastern warehouse. (A–B); Figure S2: Core LL16 C2 results; Figure S3: Sampling the ‘LL Southern Baulk’ section, looking southwest; Figure S4: Coring the anomalous sediment; Figure S5: Shallow marine surface sample collection; Figure S6: Storm-deposited sample collection; Table S1: Raw data for all sediment samples analyzed; Table S2: All possible earthquakes that fit the chronology.
Author Contributions
Conceptualization, B.N.G.-T., H.W.D. and C.J.E.IV; methodology, B.N.G.-T., C.J.E.IV, J.R., L.R. and R.J.; formal analysis, B.N.G.-T. and C.J.E.IV; investigation, B.N.G.-T., C.J.E.IV, U.‘A. and H.W.D.; resources, U.‘A., P.G., J.S. and O.B.; writing—original draft preparation, C.J.E.IV, B.N.G.-T. and H.W.D.; writing—review and editing, all; visualization, C.J.E.IV and B.N.G.-T.; supervision, B.N.G.-T. and H.W.D.; funding acquisition, B.N.G.-T. All authors have read and agreed to the published version of the manuscript.
Funding
This research was funded by Sir Mick Davis, Norman Krischer, and the Israel Science Foundation (ISF 984/10).
Institutional Review Board Statement
Not applicable.
Informed Consent Statement
Not applicable.
Data Availability Statement
Data is contained within the article or Supplementary Material.
Acknowledgments
The sediment cores used in this study were collected with the help of the Israel Antiquities Authority. We would like to thank the Israel Oceanographic and Limnological Research institution for providing wave height data for interpretation of part of the results. We would also like to thank the Cultural Heritage Engineering Initiative (CHEI) at the University of California-San Diego for creating the Structure by Motion, used for Figure 8.
Conflicts of Interest
The authors declare no conflict of interest. The funders had no role in the design of the study; in the collection, analyses, or interpretation of data; in the writing of the manuscript; or in the decision to publish the results.
References
- Bony, G.; Marriner, N.; Morhange, C.; Kaniewski, D.; Perinçek, D. A High-Energy Deposit in the Byzantine Harbour of Yenikapi, Istanbul (Turkey). Quat. Int. 2012, 266, 117–130. [Google Scholar] [CrossRef]
- Bruins, H.J.; Van Der Plicht, J.; MacGillivray, J.A. The Minoan Santorini Eruption and Tsunami Deposits in Palaikastro (CRETE): Dating by Geology, Archaeology, 14C, and Egyptian Chronology. Radiocarbon 2009, 51, 397–411. [Google Scholar] [CrossRef]
- Dey, H.; Goodman-Tchernov, B. Tsunamis and the Port of Caesarea Maritima over the Longue Durée: A Geoarchaeological Perspective. J. Rom. Archaeol. 2010, 23, 265–284. [Google Scholar] [CrossRef]
- Dey, H.; Goodman-Tchernov, B.; Sharvit, J. Archaeological Evidence for the Tsunami of January 18, A.D. 749: A Chapter in the History of Early Islamic Qâysariyah (Caesarea Maritima). J. Rom. Archaeol. 2014, 27, 357–373. [Google Scholar] [CrossRef]
- Hoffmann, N.; Master, D.; Goodman-Tchernov, B. Possible Tsunami Inundation Identified amongst 4–5th Century BCE Archaeological Deposits at Tel Ashkelon, Israel. Mar. Geol. 2018, 396, 150–159. [Google Scholar] [CrossRef]
- Goodman-Tchernov, B.N.; Dey, H.W.; Reinhardt, E.G.; McCoy, F.; Mart, Y. Tsunami Waves Generated by the Santorini Eruption Reached Eastern Mediterranean Shores. Geology 2009, 37, 943–946. [Google Scholar] [CrossRef]
- Sahoglu, V.; Sterba, J.H.; Katz, T.; Cayır, U.; Gundogan, U.; Tyuleneva, N.; Tugcu, I.; Bichler, M.; Erkanal, H.; Goodman-Tchernov, B.N. Volcanic Ash, Victims, and Tsunami Debris from the Late Bronze Age Thera Eruption Discovered at C¸es¸me-Ba Glararası (Turkey). Proc. Natl. Acad. Sci. USA 2022, 119, e2114213118. [Google Scholar] [CrossRef]
- Reinhardt, E.G.; Goodman, B.N.; Boyce, J.I.; Lopez, G.; Van Hengstum, P.; Rink, W.J.; Mart, Y.; Raban, A. The Tsunami of 13 December A.D. 115 and the Destruction of Herod the Great’s Harbor at Caesarea Maritima, Israel. Geology 2006, 34, 1061–1064. [Google Scholar] [CrossRef]
- McFadgen, B.G.; Goff, J.R. Tsunamis in the New Zealand Archaeological Record. Sediment. Geol. 2007, 200, 263–274. [Google Scholar] [CrossRef]
- Goff, J.R.; McFadgen, B.G. Catastrophic Seismic-Related Events and Their Impact on Prehistoric Human Occupation, Coastal New Zealand. Antiquity 2001, 75, 155–162. [Google Scholar] [CrossRef]
- Vött, A.; Hadler, H.; Willershäuser, T.; Ntageretzis, K.; Brückner, H.; Warnecke, H.; Grootes, P.M.; Lang, F.; Nelle, O.; Sakellariou, D. Ancient Harbours Used as Tsunami Sediment Traps-the Case Study of Krane (Cefalonia Island, Greece). BYZAS 2014, 19, 743–771. [Google Scholar]
- Ünlü, S.; Alpar, B.; Altınok, Y.; Ozer, N.; Unlu, S.; Altinok, Y. Rapid Coastal Changes and Tsunami Impacts at the Patara Harbour (Turkey). In Proceedings of the International Conference on Land-Sea Interaction in the Coastal Zone, Byblos, Lebanon, 6–8 November 2012; pp. 411–418. [Google Scholar]
- Ubeid, K.F. Tsunami Event Identified in a Sedimentary Record of the Gaza Strip, Palestine. Stud. Quat. 2021, 38, 43–51. [Google Scholar] [CrossRef]
- Maselli, V.; Oppo, D.; Moore, A.L.; Gusman, A.R.; Mtelela, C.; Iacopini, D.; Taviani, M.; Mjema, E.; Mulaya, E.; Che, M.; et al. A 1000-Yr-Old Tsunami in the Indian Ocean Points to Greater Risk for East Africa. Geology 2020, 48, 808–813. [Google Scholar] [CrossRef]
- Goodman-Tchernov, B.N. Archaeological Dating of Tsunami and Storm Deposits. Geol. Rec. Tsunamis Other Extreme Waves 2020, 729–743. [Google Scholar] [CrossRef]
- Hoffmann, G.; Grützner, C.; Reicherter, K.; Preusser, F. Geo-Archaeological Evidence for a Holocene Extreme Flooding Event within the Arabian Sea (Ras Al Hadd, Oman). Quat. Sci. Rev. 2015, 113, 123–133. [Google Scholar] [CrossRef]
- Shtienberg, G.; Yasur-Landau, A.; Norris, R.D.; Lazar, M.; Rittenour, T.M.; Tamberino, A.; Gadol, O.; Cantu, K.; Arkin-Shalev, E.; Ward, S.N. A Neolithic Mega-Tsunami Event in the Eastern Mediterranean: Prehistoric Settlement Vulnerability along the Carmel Coast, Israel. PLoS ONE 2020, 15, e0243619. [Google Scholar] [CrossRef]
- Shtienberg, G.; Gadol, O.; Levy, T.E.; Norris, R.D.; Rittenour, T.M.; Yasur-Landau, A.; Tamberino, A.; Lazar, M. Changing environments and human interaction during the Pleistocene–Early Holocene from the shallow coastal area of Dor, Israel. Quat. Res. 2022, 105, 64–81. [Google Scholar] [CrossRef]
- Shtienberg, G.; Cantu, K.; Mischke, S.; Sivan, D.; Norris, R.D.; Rittenour, T.M.; Edelman-Furstenberg, Y.; Yasur-Landau, A.; Sisma-Ventura, G.; Levy, T.E. Holocene sea-level rise and coastal aquifer interactions: Triggering mechanisms for environmental change and impacts on human settlement patterns at Dor, Israel. Quat. Sci. Rev. 2022, 294, 107740. [Google Scholar] [CrossRef]
- Szczuciński, W. The Post-Depositional Changes of the Onshore 2004 Tsunami Deposits on the Andaman Sea Coast of Thailand. Nat. Hazards 2012, 60, 115–133. [Google Scholar] [CrossRef]
- Mettier, R.; Schlunegger, F.; Schneider, H.; Rieke-Zapp, D.; Schwab, M. Relationships between Landscape Morphology, Climate and Surface Erosion in Northern Peru at 5°S Latitude. Int. J. Earth-Sci. 2009, 98, 2009–2022. [Google Scholar] [CrossRef]
- Nichol, S.L.; Kench, P.S. Sedimentology and Preservation Potential of Carbonate Sand Sheets Deposited by the December 2004 Indian Ocean Tsunami: South Baa Atoll, Maldives. Sedimentology 2008, 55, 1173–1187. [Google Scholar] [CrossRef]
- Goto, K.; Imamura, F.; Keerthi, N.; Kunthasap, P.; Matsui, T.; Minoura, K.; Ruangrassamee, A.; Sugawara, D.; Supharatid, S. Distribution and Significance of the 2004 Indian Ocean Tsunami Deposits. Initial Results from Thailand and Sri Lanka. In Tsunamiites–Features and Implications; Elsevier: Amsterdam, The Netherlands, 2008. [Google Scholar]
- Spiske, M.; Piepenbreier, J.; Benavente, C.; Bahlburg, H. Preservation Potential of Tsunami Deposits on Arid Siliciclastic Coasts. Earth-Sci. Rev. 2013, 126, 58–73. [Google Scholar] [CrossRef]
- Donato, S.V.; Reinhardt, E.G.; Boyce, J.I.; Pilarczyk, J.E.; Jupp, B.P. Particle-Size Distribution of Inferred Tsunami Deposits in Sur Lagoon, Sultanate of Oman. Mar. Geol. 2009, 257, 54–64. [Google Scholar] [CrossRef]
- Goff, J.R.; Lane, E.; Arnold, J. The Tsunami Geomorphology of Coastal Dunes. Nat. Hazards Earth Syst. Sci. 2009, 9, 847–854. [Google Scholar] [CrossRef]
- Matsumoto, D.; Shimamoto, T.; Hirose, T.; Gunatilake, J.; Wickramasooriya, A.; DeLile, J.; Young, S.; Rathnayake, C.; Ranasooriya, J.; Murayama, M. Thickness and Grain-Size Distribution of the 2004 Indian Ocean Tsunami Deposits in Periya Kalapuwa Lagoon, Eastern Sri Lanka. Sediment. Geol. 2010, 230, 95–104. [Google Scholar] [CrossRef]
- Atwater, B.F.; ten Brink, U.S.; Buckley, M.; Halley, R.S.; Jaffe, B.E.; López-Venegas, A.M.; Reinhardt, E.G.; Tuttle, M.P.; Watt, S.; Wei, Y. Geomorphic and Stratigraphic Evidence for an Unusual Tsunami or Storm a Few Centuries Ago at Anegada, British Virgin Islands. Nat. Hazards 2012, 63, 51–84. [Google Scholar] [CrossRef]
- Atwater, B.F.; Moore, A. A Tsunami About 1000 Years Ago in Puget Sound. Science 1992, 258, 1614–1617. [Google Scholar] [CrossRef]
- Tamura, T.; Sawai, Y.; Ikehara, K.; Nakashima, R.; Hara, J.; Kanai, Y. Shallow-Marine Deposits Associated with the 2011 Tohoku-Oki Tsunami in Sendai Bay, Japan. J. Quat. Sci. 2015, 30, 293–297. [Google Scholar] [CrossRef]
- Quintela, M.; Costa, P.J.M.; Fatela, F.; Drago, T.; Hoska, N.; Andrade, C.; Freitas, M.C. The AD 1755 Tsunami Deposits Onshore and Offshore of Algarve (South Portugal): Sediment Transport Interpretations Based on the Study of Foraminifera Assemblages. Quat. Int. 2016, 408, 123–138. [Google Scholar] [CrossRef]
- Van Den Bergh, G.D.; Boer, W.; De Haas, H.; Van Weering, T.C.E.; Van Wijhe, R. Shallow Marine Tsunami Deposits in Teluk Banten (NW Java, Indonesia), Generated by the 1883 Krakatau Eruption. Mar. Geol. 2003, 197, 13–34. [Google Scholar] [CrossRef]
- Abrantes, F.; Alt-Epping, U.; Lebreiro, S.; Voelker, A.; Schneider, R. Sedimentological Record of Tsunamis on Shallow-Shelf Areas: The Case of the 1969 AD and 1755 AD Tsunamis on the Portuguese Shelf off Lisbon. Mar. Geol. 2008, 249, 283–293. [Google Scholar] [CrossRef]
- Paris, R.; Fournier, J.; Poizot, E.; Etienne, S.; Morin, J.; Lavigne, F.; Wassmer, P. Boulder and Fine Sediment Transport and Deposition by the 2004 Tsunami in Lhok Nga (Western Banda Aceh, Sumatra, Indonesia): A Coupled Offshore–Onshore Model. Mar. Geol. 2010, 268, 43–54. [Google Scholar] [CrossRef]
- Smedile, A.; De Martini, P.M.; Pantosti, D.; Bellucci, L.; Del Carlo, P.; Gasperini, L.; Pirrotta, C.; Polonia, A.; Boschi, E. Possible Tsunami Signatures from an Integrated Study in the Augusta Bay Offshore (Eastern Sicily-Italy). Mar. Geol. 2011, 281, 1–13. [Google Scholar] [CrossRef]
- Mischke, S.; Schudack, U.; Bertrand, S.; Leroy, S.A.G. Ostracods from a Marmara Sea Lagoon (Turkey) as Tsunami Indicators. Quat. Int. 2012, 261, 156–161. [Google Scholar] [CrossRef][Green Version]
- Avşar, U. Sedimentary Geochemical Evidence of Historical Tsunamis in the Eastern Mediterranean from Ölüdeniz Lagoon, SW Turkey. J. Paleolimnol. 2019, 61, 373–385. [Google Scholar] [CrossRef]
- Cita, M.B.; Aloisi, G. Deep-Sea Tsunami Deposits Triggered by the Explosion of Santorini (3500 y BP), Eastern Mediterranean. Sediment. Geol. 2000, 135, 181–203. [Google Scholar] [CrossRef]
- Goodman-Tchernov, B.N.; Katz, T.; Shaked, Y.; Qupti, N.; Kanari, M.; Niemi, T.; Agnon, A. Offshore evidence for an undocumented tsunami event in the ‘low risk’ Gulf of Aqaba-Eilat, Northern Red Sea. PLoS ONE. 2016, 11, e0145802. [Google Scholar] [CrossRef] [PubMed]
- Tyuleneva, N.; Braun, Y.; Katz, T.; Suchkov, I.; Goodman-Tchernov, B. A New Chalcolithic-Era Tsunami Event Identified in the Offshore Sedimentary Record of Jisr Al-Zarka (Israel). Mar. Geol. 2018, 396, 67–78. [Google Scholar] [CrossRef]
- Pilarczyk, J.E.; Dura, T.; Horton, B.P.; Engelhart, S.E.; Kemp, A.C.; Sawai, Y. Microfossils from coastal environments as indicators of paleo-earthquakes, tsunamis, and storms. Palaeogeogr. Palaeoclimatol. Palaeoecol. 2014, 413, 144–157. [Google Scholar] [CrossRef]
- Dura, T.; Hemphill-Haley, E.; Sawai, Y.; Horton, B.P. The application of diatoms to reconstruct the history of subduction zone earthquakes and tsunamis. Earth-Sci. Rev. 2016, 152, 181–197. [Google Scholar] [CrossRef]
- Salamon, A.; Rockwell, T.; Ward, S.N.; Guidoboni, E.; Comastri, A. Tsunami Hazard Evaluation of the Eastern Mediterranean: Historical Analysis and Selected Modeling. Bull. Seismol. Soc. Am. 2007, 97, 705–724. [Google Scholar] [CrossRef]
- Goodman-Tchernov, B.N.; Austin, J.A. Deterioration of Israel’s Caesarea Maritima’s Ancient Harbor Linked to Repeated Tsunami Events Identified in Geophysical Mapping of Offshore Stratigraphy. J. Archaeol. Sci. 2015, 3, 444–454. [Google Scholar] [CrossRef]
- Holum, K.G. Caesarea Palaestinae, a Paradigmatic Transition? In Shaping the Middle East, Jews, Christians, and Muslims in an Age of Transition 400–800 C.E.; Holum, K.G., Lapin, H., Eds.; University Press of Maryland: Bethesda, MD, USA, 2011; pp. 111–131. [Google Scholar]
- ‘Ad, U.; Arbel, Y.; Gendelman, P. Caesarea, Area LL. 2018; Hadashot Arkheologiyot: Excavations and Surveys in Israel/חדשות ארכיאולוגיות חפירות וסקרים בישראל. [Google Scholar]
- Ambraseys, N.N. Earthquakes in the Mediterranean and Middle East, A Multidisciplinary Study of Seismicity up to 1900; Cambridge University Press: Cambridge, UK, 2009. [Google Scholar]
- Amiran, D.; Arieh, E.; Turcotte, T. Earthquakes in Israel and Adjacent Areas: Macroseismic Observations since 100 B.C.E. Isr. Explor. J. 1994, 44, 260–305. [Google Scholar]
- Mart, Y.; Perecman, I. Neotectonic Activity in Caesarea, the Mediterranean Coast of Central Israel. Tectonophysics 1996, 254, 139–153. [Google Scholar] [CrossRef]
- Hohlfelder, R.L. Byzantine Coin Finds from the Sea: A Glimpse of Caesarea Maritima’s Later History. In Harbour Archaeology; Raban, A., Ed.; BAR International Series: Oxford, UK, 1985; pp. 179–184. [Google Scholar]
- Stieglitz, R. Stratonos Pyrgos–MigdalSar–Sebastos: History and Archaeology. In Caesarea Maritima–Retrospective after Two Millennia; Raban, A., Holum, K.G., Eds.; Brill: Leiden, The Netherlands, 1996; pp. 593–608. [Google Scholar]
- Raban, A. The Inner Harbour Basin of Caesarea; Archaeological Evidence for Its Gradual Demise. In Caesarea Maritima: A Retrospective after Two Millennia; Raban, A., Holum, K.G., Eds.; Brill: Leiden, The Netherlands, 1996; Volume 21, pp. 628–666. [Google Scholar]
- Raban, A. The Harbour of Sebastos (Caesarea Maritima) in Its Roman Mediterranean Context By; BAR Publishing: Oxford, UK, 2009. [Google Scholar]
- Marco, S.; Hartal, M.; Hazan, N.; Lev, L.; Stein, M. Archaeology, History, and Geology of the A.D. 749 Earthquake, Dead Sea Transform. Geology 2003, 31, 665–668. [Google Scholar] [CrossRef]
- Wechsler, N.; Katz, O.; Dray, Y.; Gonen, I.; Marco, S. Estimating Location and Size of Historical Earthquake by Combining Archaeology and Geology in Umm-El-Qanatir, Dead Sea Transform. Nat. Hazards 2009, 50, 27–43. [Google Scholar] [CrossRef]
- Ferrario, M.F.; Katz, O.; Hillman, A.; Livio, F.; Amit, R.; Michetti, A.M. The Mid-Eighth Century CE Surface Faulting along the Dead Sea Fault at Tiberias (Sea of Galilee, Israel). Tectonics 2020, 39, e2020TC006186. [Google Scholar] [CrossRef]
- Stoehr, G.W. The potential for earthquake damage to Temple II architecture at Roman Omrit. In The Roman Temple Complex at Horvat Omrit: Interim Report; Overman, J.A., Schowalter, D., Eds.; British Archaeological Reports: Oxford, UK, 2011; pp. 85–100. [Google Scholar]
- Namdar, L.; Gadot, Y.; Mavronanos, G.; Gross, B.; Sapir-Hen, L. Frozen in time: Caprine pen from an early Islamic earthquake complex in Tel Beth Shemesh. J. Archaeol. Sci. Rep. 2022, 45, 103555. [Google Scholar] [CrossRef]
- Margalit, A. Diferential earthquake footprints on the masonry styles at Qal’at al-Subayba (Nimrod fortress) support the theory of its ancient origin. Herit. Sci. 2018, 6, 62. [Google Scholar] [CrossRef]
- Eklund, S. Stone weathering in the monastic building complex on Mountain of St Aaron in Petra, Jordan. Master’s Thesis, Department of Archaeology, University of Helsinki Institute for Cultural Studies, Helsinki, Finland, 2008; p. 113. [Google Scholar]
- Boyce, J.I.; Reinhardt, E.G.; Goodman, B.N. Magnetic Detection of Ship Ballast Deposits and Anchorage Sites in King Herod’s Roman Harbour, Caesarea Maritima, Israel. J. Archaeol. Sci. 2009, 36, 1516–1526. [Google Scholar] [CrossRef]
- Raban, A. The Harbours of Caesarea Maritima. Results of the Caesarea Ancient Harbour Excavation Project, 1980–1985, 491st ed.; Raban, A., Ed.; BAR: Oxford, UK, 1989; Volume 1. [Google Scholar]
- Roskin, J.; Sivan, D.; Shtienberg, G.; Roskin, E.; Porat, N.; Bookman, R. Natural and Human Controls of the Holocene Evolution of the Beach, Aeolian Sand and Dunes of Caesarea (Israel). Aeolian Res. 2015, 19, 65–85. [Google Scholar] [CrossRef]
- Shtienberg, G.; Dix, J.K.; Roskin, J.; Waldmann, N.; Bookman, R.; Bialik, O.M.; Porat, N.; Taha, N.; Sivan, D. New Perspectives on Coastal Landscape Reconstruction during the Late Quaternary: A Test Case from Central Israel. Palaeogr. Palaeoclim. Palaeoecol. 2017, 468, 503–519. [Google Scholar] [CrossRef]
- Roskin, J.; Taxel, I. “He Who Revives Dead Land”: Groundwater Harvesting Agroecosystems in Sand along the Southeastern Mediterranean Coast since Early Medieval Times. Med. Geosc. Rev. 2021, 3, 293–318. [Google Scholar] [CrossRef]
- Levine, L.I.; Netzer, E. Excavations at Caesarea Maritima 1975, 1976, 1979-Preliminary Report; The Institute of Archaeology: Jerusalem, Israel, 1986. [Google Scholar]
- Stabler, J.; Holum, K.; Stanley, F.H., Jr.; Risser, M.; Iamim, A. The Warehouse Quarter (Area LL) and the Temple Platform (Area TP), 1996–2000 and 2002 Seasons. In Caesarea Reports and Studies: Excavations 1995–2007 within the Old City and the Ancient Harbor; Holum, K., Stabler, J., Reinhardt, E., Eds.; BAR International Series: Oxford, UK, 2008; Volume 1784, pp. 1–39. [Google Scholar]
- Bronk Ramsey, C. Bayesian Analysis of Radiocarbon Dates. Radiocarbon 2009, 51, 337–360. [Google Scholar] [CrossRef]
- Heaton, T.J.; Blaauw, M.; Blackwell, P.G.; Ramsey, B.C.; Reimer, P.J.; Scott, M. The IntCal20 Approach to Radiocarbon Calibration Curve Construction: A New Methodology Using Bayesian Splines and Errors-in-Variables. Radiocarbon 2020, 62, 821–863. [Google Scholar] [CrossRef]
- Reimer, P.J.; Austin, W.E.N.; Bard, E.; Bayliss, A.; Blackwell, P.G.; Ramsey, C.B.; Butzin, M.; Cheng, H.; Edwards, R.L.; Friedrich, M.; et al. The IntCal20 Northern Hemisphere Radiocarbon Age Calibration Curve (0-55 Cal KBP). Radiocarbon 2020, 62, 725–757. [Google Scholar] [CrossRef]
- Eshel, G.; Levy, G.J.; Mingelgrin, U.; Singer, M.J. Critical Evaluation of the Use of Laser Diffraction for Particle-Size Distribution Analysis. Soil Sci. Soc. Am. J. 2004, 68, 736–743. [Google Scholar] [CrossRef]
- Buurman, P.; Pape, T.; Muggler, C.C. Laser Grain-Size Determination in Soil Genetic Studies 1. Practical Problems. Soil Sci. 1997, 162, 211–218. [Google Scholar] [CrossRef]
- Blott, S.J.; Pye, K. Particle Size Distribution Analysis of Sand-Sized Particles by Laser Diffraction: An Experimental Investigation of Instrument Sensitivity and the Effects of Particle Shape. Sedimentology 2006, 53, 671–685. [Google Scholar] [CrossRef]
- Beckman-Coulter. Coulter LS Series: Product Manual; Beckman Coulter: Miami, FL, USA, 1994. [Google Scholar]
- Wentworth, C.K. A Scale of Grade and Class Terms for Clastic Sediments. J. Geol. 1922, 30, 377–392. [Google Scholar] [CrossRef]
- Davis, J.C. Statistics and Data Analysis in Geology; John Wiley & Sons: New York, NY, USA, 1986. [Google Scholar]
- Hammer, Ø.; Harper, D.A.T.; Ryan, P.D. PAST: Paleontological Statistics Software Package for Education and Data Analysis. Palaeontol. Electron. 2001, 4, 1–9. [Google Scholar]
- Schönfeld, J.; Alve, E.; Geslin, E.; Jorissen, F.; Korsun, S.; Spezzaferri, S.; Abramovich, S.; Almogi-Labin, A.; du Chatelet, E.A.; Barras, C.; et al. The FOBIMO (FOraminiferal BIo-MOnitoring) Initiative-Towards a Standardised Protocol for Soft-Bottom Benthic Foraminiferal Monitoring Studies. Mar. Micropaleontol. 2012, 94, 1–13. [Google Scholar] [CrossRef]
- Vernon-Parry, K.D. Scanning Electron Microscopy: An Introduction. III-Vs Rev. 2000, 13, 40–44. [Google Scholar] [CrossRef]
- Robins, L.; Greenbaum, N.; Yu, L.P.; Bookman, R.; Roskin, J. High-Resolution Portable-OSL Analysis of Vegetated Linear Dune Construction in the Margins of the Northwestern Negev Dunefield (Israel) during the Late Quaternary. Aeolian Res. 2021, 50, 100680. [Google Scholar] [CrossRef]
- Munyikwa, K.; Telfer, M.; Baker, I.; Knight, C. Core Drilling of Quaternary Sediments for Luminescence Dating Using the Dormer Drillmite TM. Anc. TL 2011, 29, 15–23. [Google Scholar]
- Sanderson, D.C.W.; Murphy, S. Using Simple Portable OSL Measurements and Laboratory Characterisation to Help Understand Complex and Heterogeneous Sediment Sequences for Luminescence Dating. Quat. Geochronol. 2010, 5, 299–305. [Google Scholar] [CrossRef]
- Muñoz-Salinas, E.; Bishop, P.; Sanderson, D.C.; Zamorano, J.J. Interpreting Luminescence Data from a Portable OSL Reader: Three Case Studies in Fluvial Settings. Earth Surf. Proc. Landf. 2011, 36, 651–660. [Google Scholar] [CrossRef]
- Nir, Y. Sedimentological Aspects of the Israel and Sinai Mediterranean Coasts; Coastal Education & Research Foundation, Inc: Jerusalem, Israel, 1989. [Google Scholar]
- Zviely, D.; Kit, E.; Rosen, B.; Galili, E.; Klein, M. Shoreline Migration and Beach-Nearshore Sand Balance over the Last 200 Years in Haifa Bay (SE Mediterranean). Geo-Mar Lett 2009, 29, 93–110. [Google Scholar] [CrossRef]
- Katz, T.; Crouvi, O. Sediment Flux Dynamics over the Shallow (25 m Depth) Shelf of the Mediterranean Sea along the Israeli Coast. Mar. Geol. 2018, 406, 1–11. [Google Scholar] [CrossRef]
- Bitan, M.; Zviely, D. Sand Beach Nourishment: Experience from the Mediterranean Coast of Israel. J. Mar. Sci.Eng. 2020, 8, 273. [Google Scholar] [CrossRef]
- Katz, O.; Mushkin, A. Characteristics of sea-cliff erosion induced by a strong winter storm in the eastern Mediterranean. Quat. Res. 2013, 80, 20–32. [Google Scholar] [CrossRef]
- Bandy, O.L.; Arnal, R.E. Concepts of Foraminiferal Paleocology. Bull. Am. Assoc. Pet. Geol. 1960, 44, 1921–1923. [Google Scholar]
- Buzas, M.A.; Gibson, T.G. Species Diversity: Benthonic Foraminifera in Western North Atlantic. Science 1969, 163, 72–75. [Google Scholar] [CrossRef]
- Horton, B.P.; Engelhart, S.E.; Kemp, A.C.; Sawai, Y. Microfossils in tidal settings as indicators of sea-level change, paleoearthquakes, tsunamis, and tropical cyclones. Treatise Geomorphol. 2013, 14, 292–314. [Google Scholar]
- Mamo, B.; Strotz, L.; Dominey-Howes, D. Tsunami sediments and their foraminiferal assemblages. Earth-Sci. Rev. 2009, 96, 263–278. [Google Scholar] [CrossRef]
- Scott, D.B.; Medioli, F.S.; Schafer, C.T. Monitoring in Coastal Environments Using Foraminifera and Thecamoebian Indicators; Cambridge University Press: Cambridge, UK, 2007. [Google Scholar]
- Tapia, R.; Le, S.; Ho, S.L.; Bassetti, M.; Lin, I.; Lin, H.; Chang, Y.; Jiann, K.; Wang, P.; Lin, J.; et al. Planktic-benthic foraminifera ratio (%P) as a tool for the reconstruction of paleobathymetry and geohazard: A case study from Taiwan. Mar. Geo. 2022, 453, 106922. [Google Scholar] [CrossRef]
- Avnaim-Katav, S.; Hyams-Kaphzan, O.; Milker, Y.; Almogi-Labin, A. Bathymetric zonation of modern shelf benthic foraminifera in the Levantine Basin, eastern Mediterranean Sea. J. Sea. Res. 2015, 99, 97–106. [Google Scholar] [CrossRef]
- Almogi-Labin, A.; Ashckenazi-Polivoda, S.; Edelman-Furstenberg, Y.; Benjamin, C. Anoxia-dysoxia at the sediment-water interface of the southern Tethys in the late Cretaceous: Mishash Formation, southern Israel. In Anoxia: Evidence for Eukaryote Survival and Paleontological Strategies; Springer: Berlin/Heidelberg, Germany, 2012. [Google Scholar]
- Avnaim-Katav, S.; Almogi-Labin, A.; Sandler, A.; Sivan, D. Benthic foraminifera as palaeoenvironmental indicators during the last million years in the eastern Mediterranean inner shelf. Palaeogeogr. Palaeoclimatol. Palaeoecol. 2013, 386, 512–530. [Google Scholar] [CrossRef]
- Reinhardt, E.G.; Patterson, R.T.; Schroeder-Adams, C.J. Geoarchaeology of the Ancient Harbor Site of Caesarea Maritima, Israel; Evidence from Sedimentology and Paleoecology of Benthic Foraminifera. J. Foraminifer. Res. 1994, 24, 37–48. [Google Scholar] [CrossRef]
- Reinhardt, E.G.; Raban, A. Destruction of Herod the Great’s Harbor at Caesarea Maritima, Israel–Geoarchaeological Evidence. Geology 1999, 27, 811–814. [Google Scholar] [CrossRef]
- Dawson, A.G.; Shi, S. Tsunami Deposits. Pure Appl. Geophys. 2000, 157, 875–897. [Google Scholar] [CrossRef]
- Einsele, G.; Chough, S.K.; Shiki, T. Depositional Events and Their Records—An Introduction. Sediment. Geol. 1996, 104, 1–9. [Google Scholar] [CrossRef]
- Nanayama, F.; Shigeno, K.; Satake, K.; Shimokawa, K.; Koitabashi, S.; Miyasaka, S.; Ishii, M. Sedimentary Differences between the 1993 Hokkaido-Nansei-Oki Tsunami and the 1959 Miyakojima Typhoon at Taisei, Southwestern Hokkaido, Northern Japan. Sediment. Geol. 2000, 135, 255–264. [Google Scholar] [CrossRef]
- Goff, J.; McFadgen, B.G.; Chagué-Goff, C. Sedimentary Differences between the 2002 Easter Storm and the 15th-Century Okoropunga Tsunami, Southeastern North Island, New Zealand. Mar. Geol. 2004, 204, 235–250. [Google Scholar] [CrossRef]
- Dean, S.; Horton, B.P.; Evelpidou, N.; Cahill, N.; Spada, G.; Sivan, D. Can We Detect Centennial Sea-Level Variations over the Last Three Thousand Years in Israeli Archaeological Records? Quat. Sci. Rev. 2019, 210, 125–135. [Google Scholar] [CrossRef]
- Lario, J.; Bardají, T.; Silva, P.G.; Zazo, C.; Goy, J.L. Improving the Coastal Record of Tsunamis in the ESI-07 Scale: Tsunami Environmental Effects Scale (TEE-16 Scale). Geol. Acta 2016, 14, 179–193. [Google Scholar] [CrossRef]
- Syamsidik; Benazir; Luthfi, M.; Suppasri, A.; Comfort, L.K. The 22 December 2018 Mount Anak Krakatau Volcanogenic Tsunami on Sunda Strait Coasts, Indonesia: Tsunami and Damage Characteristics. Nat. Hazards Earth Syst. Sci. 2020, 20, 549–565. [Google Scholar] [CrossRef]
- Putra, P.S.; Aswan, A.; Maryunani, K.A.; Yulianto, E.; Nugroho, S.H.; Setiawan, V. Post-Event Field Survey of the 22 December 2018 Anak Krakatau Tsunami. Pure Appl. Geophys. 2020, 177, 2477–2492. [Google Scholar] [CrossRef]
- Lynett, P.J.; Borrero, J.C.; Weiss, R.; Son, S.; Greer, D.; Renteria, W. Observations and Modeling of Tsunami-Induced Currents in Ports and Harbors. Earth Planet. Sci. Lett. 2012, 327–328, 68–74. [Google Scholar] [CrossRef]
- Basta, N.Z.; Salem, E.M.; El Shahat, A.M.; Habib, A.F.; Ahamed, A.E.; El Hakim, B.A. Seismicity of Gulf of Aqaba before and after Aqaba 95 Quake. In Proceedings of the Egyptian Geological Survey Cenn Conference, Cairo, Egypt, 15–20 March 1996. [Google Scholar]
- Frucht, E.; Salamon, A.; Gal, E.; Ginat, H.; Grigorovitch, M.; Tov, R.S.; Ward, S. A Fresh View of the Tsunami Generated by the Dead Sea Transform, 1995 Mw 7.2 Nuweiba Earthquake, along the Gulf of Elat–Aqaba. Seism. Res. Lett. 2019, 90, 1483–1493. [Google Scholar] [CrossRef]
- Gaythwaite, J.W. Design of Marine Facilities for the Berthing, Mooring, and Repair of Vessels; American Society of Civil Engineers: New York, NY, USA, 2004; ISBN 978-0-7844-0726-4. [Google Scholar]
- Okal, E.A.; Fritz, H.M.; Raad, P.E.; Synolakis, C.; Al-Shijbi, Y.; Al-Saifi, M. Oman Field Survey after the December 2004 Indian Ocean Tsunami. Earthq. Spectra 2006, 22, 203–218. [Google Scholar] [CrossRef]
- Holum, K.G.; Stabler, J.A.; Reinhardt, E.G. Caesarea Reports and Studies: Excavations 1995-2007 within the Old City and the Ancient Harbor; Holum, K.G., Stabler, J.A., Reinhardt, E.G., Eds.; Archaeo Press: Oxford, UK, 2008. [Google Scholar]
- Shalem, N. Seismic Tidal Waves (Tsunamis) in the Eastern Mediterranean. Soc. Explor. Eretz Isr. 1956, 20, 159–170. (In Hebrew) [Google Scholar]
- Tsafrir, Y.; Foerster, G. The Dating of the ‘Earthquake of the Sabbatical Year’ of 749 C.E. in Palestine. Bull. Sch. Orient. African Stud. 1992, 55, 231–235. [Google Scholar] [CrossRef]
- López, G.I.; Goodman-Tchernov, B.N.; Porat, N. OSL Over-Dispersion: A Pilot Study for the Characterisation of Extreme Events in the Shallow Marine Realm. Sediment. Geol. 2018, 378, 35–51. [Google Scholar] [CrossRef]
- Ishizawa, T.; Goto, K.; Yokoyama, Y.; Goff, J. Dating Tsunami Deposits: Present Knowledge and Challenges. Earth-Sci. Rev. 2020, 200, 102971. [Google Scholar] [CrossRef]
- Prendergast, A.L.; Cupper, M.L.; Jankaew, K.; Sawai, Y. Indian Ocean Tsunami Recurrence from Optical Dating of Tsunami Sand Sheets in Thailand. Mar. Geol. 2012, 295–298, 20–27. [Google Scholar] [CrossRef]
- Frey Martinez, J.; Cartwright, J.; Hall, B. 3D seismic interpretation of slump complexes: Examples from the continental margin of Israel. Basin Res. 2005, 17, 83–108. [Google Scholar] [CrossRef]
- Katz, O.; Reuven, E.; Aharonov, E. Submarine Landslides and Fault Scarps along the Eastern Mediterranean Israeli Continental-Slope. Mar. Geol. 2015, 369, 100–115. [Google Scholar] [CrossRef]
- Salamon, A.; Rockwell, T.; Guidoboni, E.; Comastri, A. A Critical Evaluation of Tsunami Records Reported for the Levant Coast from the Second Millennium BCE to the Present. Isr. J. Earth-Sci. 2011, 58, 327–354. [Google Scholar] [CrossRef]
- Heidarzadeh, M.; Satake, K. Possible Sources of the Tsunami Observed in the Northwestern Indian Ocean Following the 2013 September 24 Mw 7.7 Pakistan Inland Earthquake. Geophys. J. Int. 2014, 199, 752–766. [Google Scholar] [CrossRef]
- Wang, Y.; Heidarzadeh, M.; Satake, K.; Mulia, I.E.; Yamada, M. A tsunami warning system based on offshore bottom pressure gauges and data assimilation for Crete Island in the Eastern Mediterranean Basin. J. Geophys. Res. Solid Earth 2020, 125, e2020JB020293. [Google Scholar] [CrossRef]
- Widiyanto, W.; Santoso, P.B.; Hsiao, S.C.; Imananta, R.T. Post-Event Field Survey of 28 September 2018 Sulawesi Earthquake and Tsunami. Nat. Hazards Earth Syst. Sci. 2019, 19, 2781–2794. [Google Scholar] [CrossRef]
- Haldon, J.; Rosen, A. Society and Environment in the East Mediterranean ca 300-1800 CE. Problems of Resilience, Adaptation and Transformation. Hum. Ecol. 2018, 46, 275–290. [Google Scholar] [CrossRef]
- Haldon, J.; Mordechai, L.; Newfield, T.P.; Chase, A.F.; Izdebski, A.; Guzowski, P.; Labuhn, I.; Roberts, N. History Meets Palaeoscience: Consilience and Collaboration in Studying Past Societal Responses to Environmental Change. Proc. Natl. Acad. Sci. USA 2018, 115, 3210–3218. [Google Scholar] [CrossRef] [PubMed]
- Izdebski, A.; Mordechai, L.; White, S. The Social Burden of Resilience: A Historical Perspective. Hum. Ecol. 2018, 46, 291–303. [Google Scholar] [CrossRef]
- van Bavel, B.; Curtis, D.R.; Dijkman, J.; Hannaford, M.; de Keyzer, M.; van Onacker, E.; Soens, T. Disasters and History. The Vulnerability and Resilience of Past Societies; Cambridge University Press: Cambridge, UK, 2020. [Google Scholar]
- Holum, K.G. Caesarea in Palestine: Shaping the Early Islamic Town. In Le Proche-Orient de Justinien aux abbassides. Peuplement et dynamiques spatiales (Turnhout); Borrut, A., Debié, M., Papaconstantinou, A., Pieri, D., Sodini, J.P., Eds.; Brepols Publishers: Turnhout, Belgium, 2011; pp. 169–186. [Google Scholar]
- Whitcomb, D. Qaysariyah as an Early Islamic Settlement; Holum, K.G., Lapin, H., Eds.; Cambridge University Press: Cambridge, UK, 2011. [Google Scholar]
- Avni, G. The Byzantine-Islamic Transition in Palestine: An Archaeological Approach, 1st ed.; Oxford University Press: Oxford, UK, 2014. [Google Scholar]
- Mesqui, J. Césarée Maritime. Ville Fortifiée Du Proche-Orient: Paris, French, 2014. [Google Scholar]
- Wickham, C. Framing the Early Middle Ages: Europe and the Mediterranean 400–800; Oxford University Press: Oxford, UK, 2005. [Google Scholar]
- Walmsley, A. Early Islamic Syria: An Archaeological Appraisal; Gerald Duckworth & Co. Ltd: London, UK, 2007. [Google Scholar]
- Kennedy, H. The Prophet and the Age of the Caliphates. The Islamic Near East from the Sixth to the Eleventh Centuries, 3rd ed.; Routledge: New York, NY, USA; London, UK, 2016. [Google Scholar]
- Raban, A.; Toueg, R.; Yankelevitz, S.; Arnon, Y. Land Excavations in the Inner Harbour (1993–1994). In Caesarea Papers 2; Holum, K., Raban, A., Patrich, J., Eds.; Journal of Roman Archaeology Supplementary Series: Portsmouth, UK, 1999; Volume 35, pp. 198–224. [Google Scholar]


Disclaimer/Publisher’s Note: The statements, opinions and data contained in all publications are solely those of the individual author(s) and contributor(s) and not of MDPI and/or the editor(s). MDPI and/or the editor(s) disclaim responsibility for any injury to people or property resulting from any ideas, methods, instructions or products referred to in the content. |
© 2023 by the authors. Licensee MDPI, Basel, Switzerland. This article is an open access article distributed under the terms and conditions of the Creative Commons Attribution (CC BY) license (https://creativecommons.org/licenses/by/4.0/).