Case Report

Embankments Damaged in the Magnitude Mw 6.4 Petrinja Earthquake and Remediation

by
Ivan Mihaljević
1 and
Sonja Zlatović
2,*
1
Geokon-Zagreb j.s.c., 10000 Zagreb, Croatia
2
Department of Civil Engineering, Zagreb University of Applied Sciences, 10010 Zagreb, Croatia
*
Author to whom correspondence should be addressed.
Geosciences 2023, 13(2), 48; https://doi.org/10.3390/geosciences13020048
Submission received: 28 November 2022 / Revised: 4 January 2023 / Accepted: 28 January 2023 / Published: 31 January 2023
(This article belongs to the Special Issue Assessment of Earthquake-Induced Soil Liquefaction Hazard)

Abstract

:
The main shock of the Petrinja earthquake occurred on 29 December 2020 with a magnitude Mw = 6.4. The earthquake and the aftershocks caused most of their damage in the alluvial plains of the rivers Kupa and Sava, where liquefaction occurred in the loose layers of sands and silty sands. Maybe most important was the damage to some of the embankments built in the mid-20th century to protect the area from floods. Longitudinal cracks along the embankments, in some places transverse cracks, followed by settlement, with some sandy ejecta near the embankments, were obvious consequences of liquefaction in the lower layers, and lateral spreading. The presence of the sandy layers at a depth of 6 to 8 m was known from previous investigations performed in order to improve the flood protection system. Representatives of the Croatian Waters Authorities (Hrvatske vode) who own, manage, and maintain the embankments, inspected all the embankments and, in the first days after the earthquake, carried out the necessary emergency repairs or built temporary secondary embankments. Soon after, the necessary investigation and design of the remediation began. In 2022, construction got underway. This paper gives an overview of the damage, an interpretation of the failure mechanisms, the rationale for the reconstruction methods and the solutions, together with a short overview of the liquefaction analysis performed.

1. Introduction

The Petrinja earthquake struck Croatia and the surrounding area on 29 December 2020 at 12:19 pm local time (11:19 am UTC), with an intensity VIII–IX on the EMS scale in the epicentre and a Richter magnitude ML = 6.2 (Croatian Seismological Survey 2021) [1,2], near the city of Petrinja, approximately 50 km south of Zagreb, the capital of Croatia. The felt reports are given in Figure 1 (EMSC 2020 [3]). The moment magnitude was estimated to be Mw = 6.4 [4], and the peak ground accelerations estimated by USGS [5] are shown in Figure 2.
The earthquake was preceded a day before with an earthquake ML = 5.0 and a series of smaller ones, and followed by many aftershocks, as shown in Figure 3, for a 2-year period, as reported by the Croatian Seismological Survey [6]. The epicentres of these earthquakes are given in Figure 4, as assessed for the first two days by the Croatian Seismological Survey [1], together with the earthquakes with magnitudes of 3 or more in the next two years as assessed by USGS [7].
A joint reconnaissance report between EERI and StEER was published in January 2021, led by Eduardo Miranda and based on the work of many Croatian volunteers on the site and colleagues in the USA—working online due to the COVID situation—giving a preliminary overview of the characteristics and effects of the Petrinja earthquake [4].
Concentrating more on the geotechnical conditions and damage, the GEER report made by many volunteers and led by Ingrid Tomac and Sonja Zlatović, was published in March 2021 [10], with a chapter on the earthen levee systems [11].
The detailed investigation and design was done by Geokon-Zagreb and led by Ivan Mihaljević [12,13].
Figure 4. Epicentres of the 2020 Petrinja earthquake, its foreshocks and aftershocks from 28 December to 30 December 2020—shown with coloured circles (Croatian Seismological Survey, 2020) [14] and epicentres of earthquakes of magnitude 3 or stronger from 31 December 2020 to 29 December 2022 —shown in black symbols [5]. Locations of the damaged embankments are shown in red.
Geosciences 13 00048 g004
This paper gives an overview of the damage, an interpretation of the failure mechandisms, the rationale for the reconstruction methods and the solutions, together with an overview of the liquefaction analysis adopted.

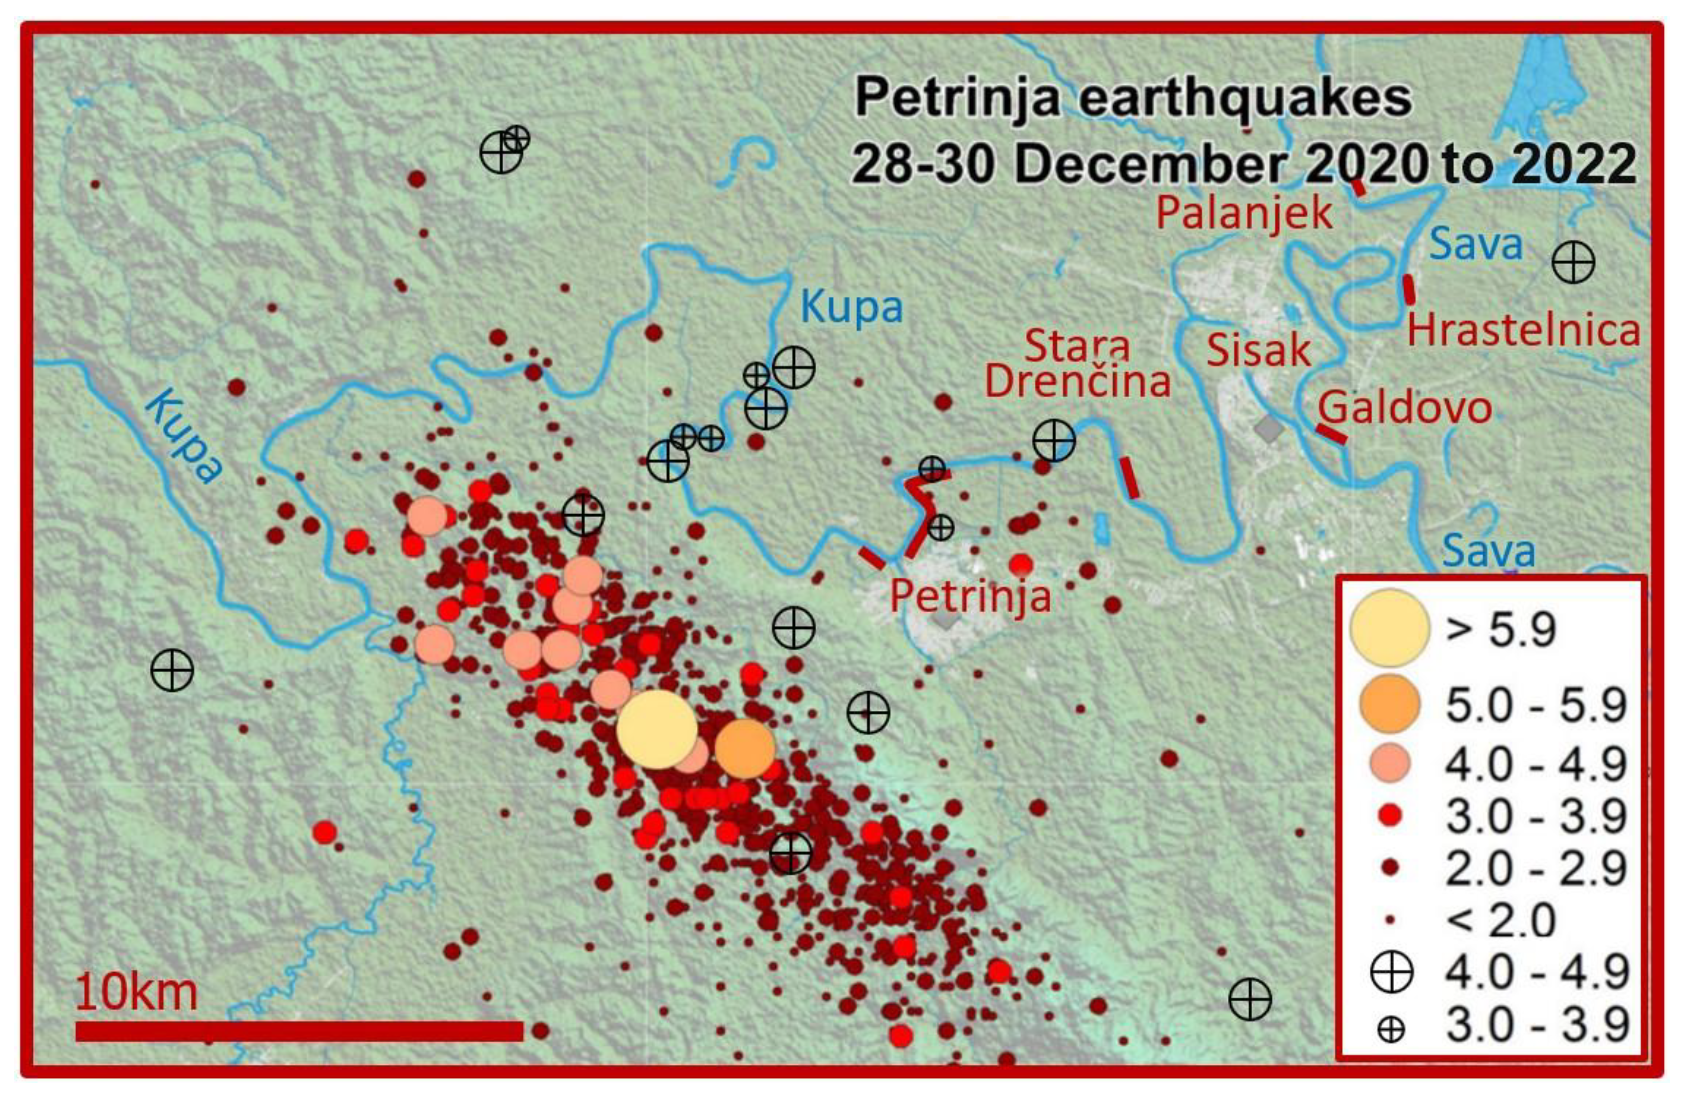
2. Position of Damage and the Basic Geotechnical Data

The positions of the locations discussed in this paper are given in Figure 4. Both the river Sava and its tributaries, the most important being the river Kupa, are meandering in this flat area, and the surface sediments are mostly loose and soft.
The embankments are homogeneous, typically up to 4.5 m high, crown width 4 m, slope 1:2.
Geotechnical investigations on these locations generally show the presence of sandy soils, with thicknesses of 1–2 m, at a depth of several (typically 5–8) m, as illustrated in Figure 5—which were not found or were not recognized as being a problem in the mid-20th century when the levees were built. These are overlaid with clay of high or intermediate plasticity.

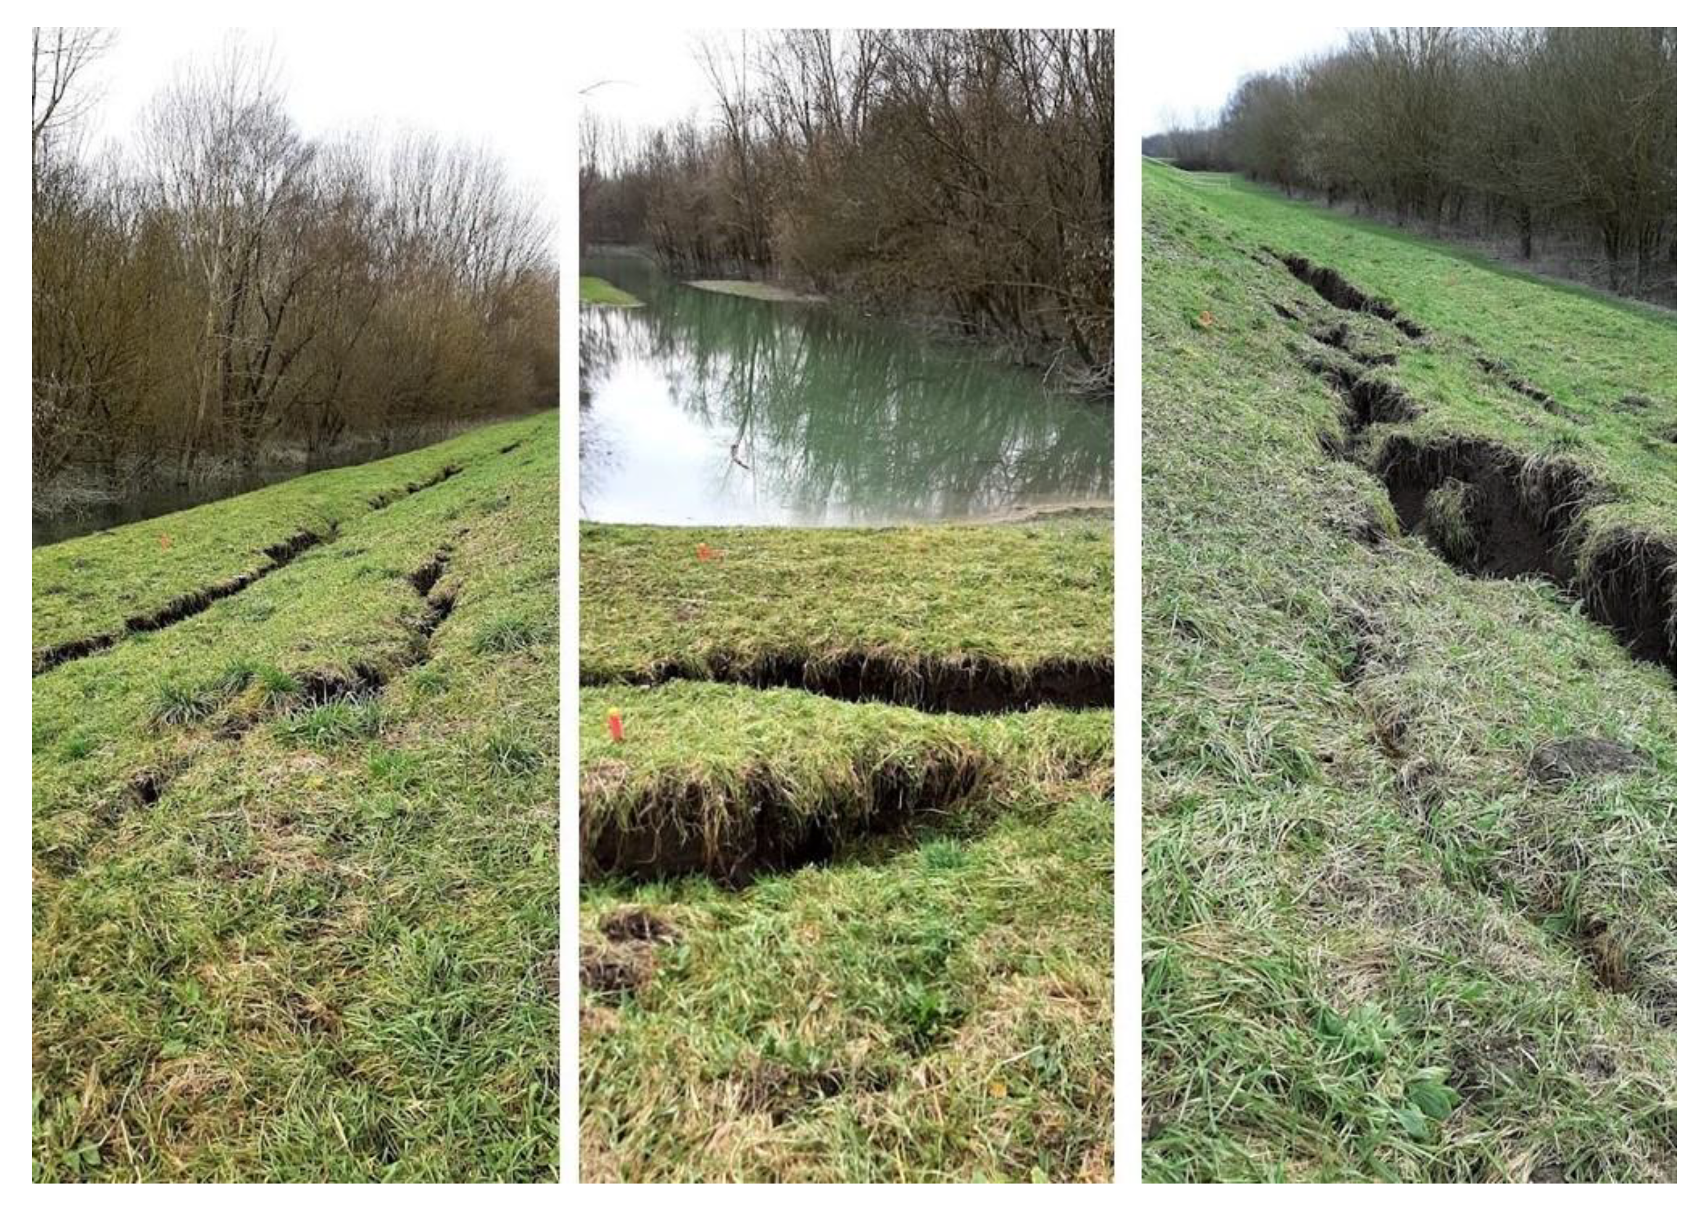
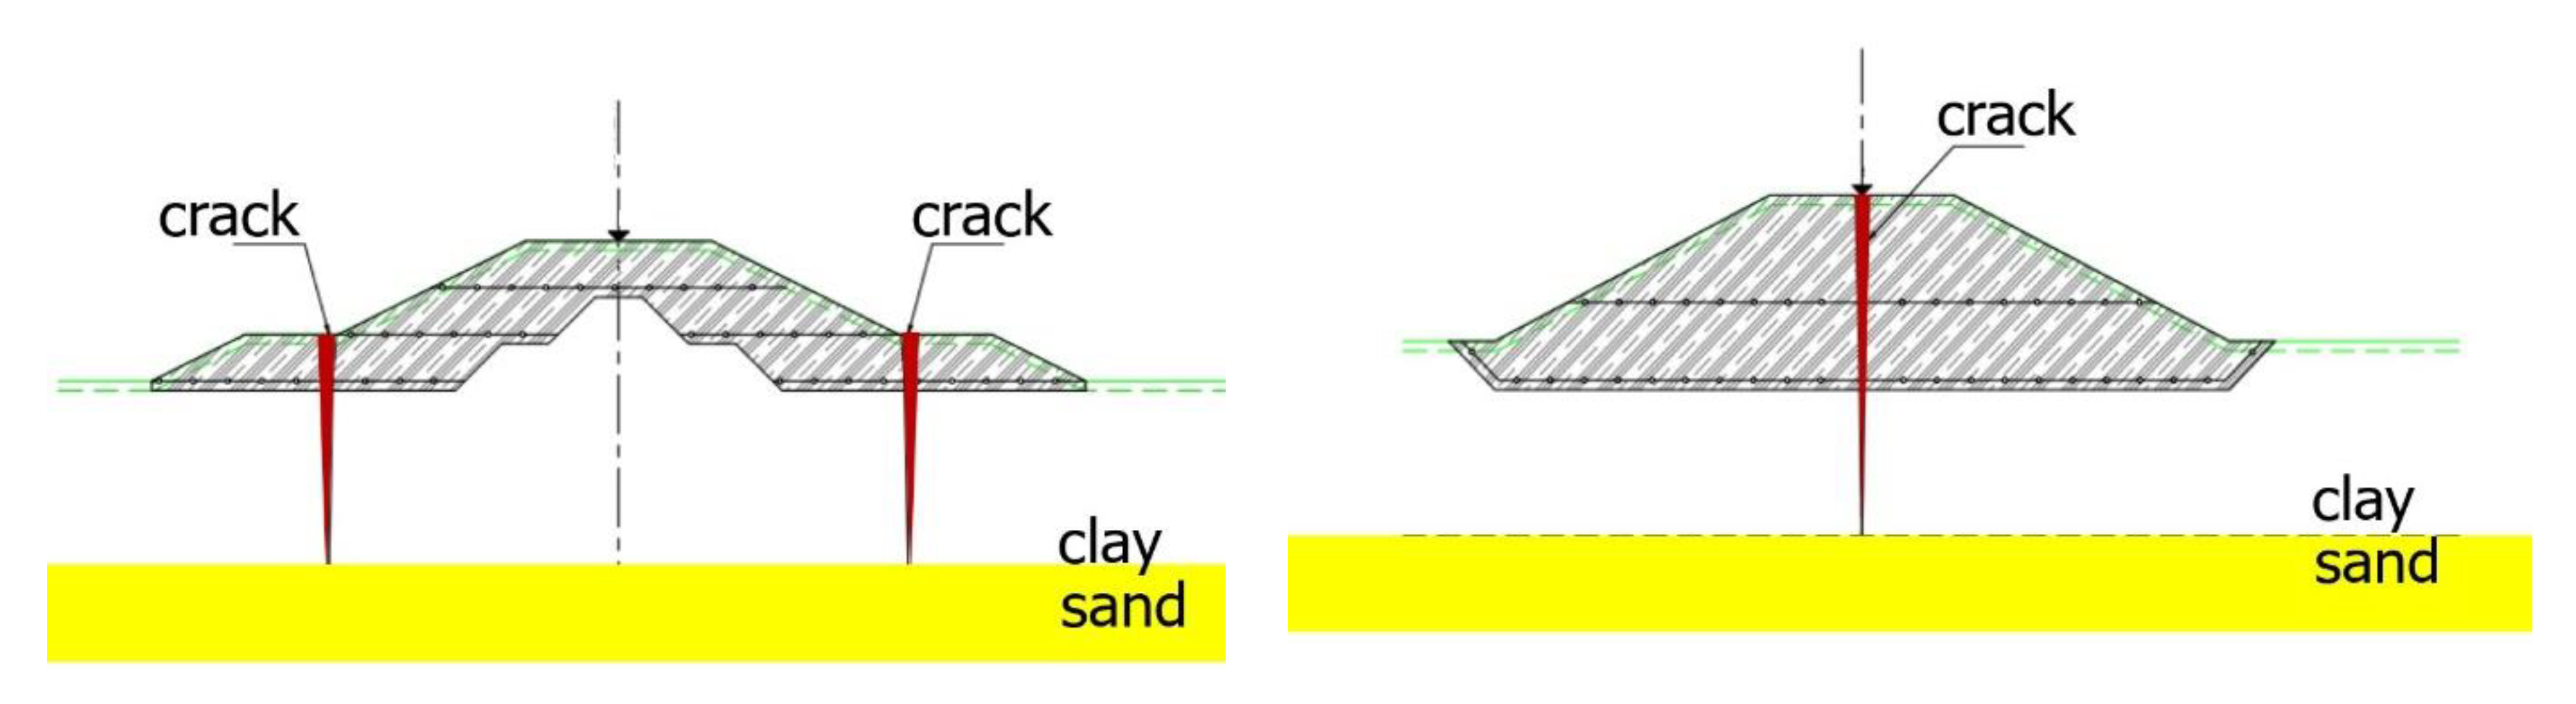
3. Types of Damage and Discussion

The damage observed on some of the embankments was mostly longitudinal cracks with lateral spreading and settlement, like those near Galdovo on the Sava river shown in Figure 6. In some cases—like near Stara Drenčina on the Kupa river, for example—cracks traversed the crown, as shown in Figure 7, to the side of the river Kupa, causing subsidence of the embankmentIn the village of Palanjek, the cracks and settlement occurred at the connection of two perpendicular sections of the embankments, as shown in Figure 8; the cracks continue along the embankment.
In the area of the cracks, in many places, along the bottom or near it, ejecta of sandy soils was found—similar to many places in the fields or near houses, where also wells were often filled with sandy soil. The ground surface is mostly sloped towards the river in these locations. This proves that softening and liquefaction occurred in some layers below the surface, the embankment body shook and moved on the softened layer, cracked in the motion, and sliding occurred towards the river leaving the opened cracks and causing sinking. The ejecta were found mostly on the higher side under the embankment. In some embankments’ sections, some longitudinal cracks with lateral spreading and settlement occurred without visible ejecta, which may be attributed to the lower position of the liquefied layer and opened space in the cracks—although vertical in general, the cracks were of irregular shape and mostly hidden below a depth of 2 m.
In some cases—near Petrinja for example—where the ground surface was almost horizontal, longitudinal cracks were visible only at the bottom of the levees, as shown in Figure 9b, with a tendency to heal at least at the ground surface, showing that some of the damage could pass unnoticed in spite of the quick response and inspection undertaken in the couple of days following the main earthquake.
Near Hrastelnica, ejected sandy soil covered a wide area on the river side of the embankment, as shown in Figure 10, and was present in many places on the opposite side, but only a slight crack was noticed on the embankment. However, it is possible that a layer liquefied under the embankment, therefore settlement could have occurred.
The aims of the reconstruction were to amend the recognized damage caused by the earthquakes, and to assure that future earthquakes do not cause damage—at least not at the repaired or reconstructed sections of the levees.
Although the temporary embankments were erected in the first days after the earthquake, it was necessary to choose methods of reconstruction which would allow the work to be done as quickly as possible, but also to be safe in case of heavier rains and higher waters.
In the period after the earthquake, the cracks in the ground partially collapsed, closed, and grew into the grass, but it was not believed that their self-healing was complete. Since there are more permeable layers of gravel and sand underneath clayey top layers, the remains of the cracks provided an open path for water flow during high water levels of the river. The increased hydraulic gradients, i.e. increased water velocities, would allow the transport of fine-grained material and sand – internal erosion and piping, and their ejection onto the surface. This would result in further damage to the embankments, including their subsidence. Additionally, the lack of local experience had to be considered. Therefore, the methods were to be as simple as possible, and solutions robust and safe against high waters and future earthquakes.
At the same time, the reconstructed embankments had to remain in the cadastral plots owned by the Croatian Waters Authorities (Hrvatske vode).

4. Solutions for Reconstruction

Based on international experience [17], the decision was made to increase the resistance of the levees in seismic conditions by reinforcing the foundation soil under the levees and the body of the levees with geogrid layers. Also, vertical cracks in the vicinity of the embankments had to be remediated to prevent seepage and possible piping.
The damaged sections of the embankments are to be reconstructed in the following steps, as illustrated in Figure 11: the damaged parts of the embankment are to be removed, as well as the surface part of the foundation soil, the cracks in the ground filled, the ground improved, and the body of the embankment rebuilt using geogrid reinforcements. If cracks were formed near the embankment, the disturbed soil is to be removed for at least 1 m either side and to at least 1.5 m in depth, and replaced with a well compacted wedge, as shown in Figure 12. Remediation of the foundation soil damaged by cracks – in the depth of 1.5 m—was chosen in order to provide a continuous (healthy) clay layer to ensure resistance against uplift and piping.
The liquefaction analysis was performed to show if the ground improvement would be necessary. On the sections with high liquefaction potential, where the liquefiable layers are covered by clayey layers, the use of ground improvement with jet grouting was chosen as illustrated with Figure 13.
In one section, predominantly with a sandy foundation soil, ground improvement with rapid impulse compaction (RIC) was selected—the process is currently underway as shown in Figure 14 and Figure 15. Figure 16 shows the installation of geogrids and compaction of new foundation soil under the embankment.
Other methods, such as cut-off walls or vertical drains, were discarded either for cost efficiency reasons, or the fact that increasing soil permeability under flood protection embankments must not be allowed.

5. Liquefaction Analysis Method

The reconstruction design [13] was based on Eurocode 7 (HRN EN 1997-1:2012; HRN EN 1997-1:2012/NA:2012) and Eurocode 8 (HRN EN 1998-5:2011; HRN EN 1998-5:2011/NA:2011).
Liquefaction analysis was performed mostly using the data obtained from CPT testing [12], and, in parallel, an analysis was performed using SPT data. Evaluation of the liquefaction resistance was performed using a procedure developed by 20 world experts [18]. The type of soil was chosen from CPT data [19]. Unit weight was also estimated from the CPT data [20], as well as the fines content [21]. The cyclic stress ratio (CSR) was estimated after the work published by Seed and Idriss [22], and the cyclic resistance ratio (CRR) after the work published by Boulanger and Idriss [23]. The transition from the factor of safety to the approximate probability of liquefaction was performed based on the results of Juang and coworkers [24,25].
Possible displacements were estimated after Yoshimine and his coworkers [26].

6. Conclusions

The damage to the levees in the Petrinja earthquake—in the form of cracks, subsidence, and sliding—was mostly caused by liquefaction and lateral spreading, and the cause can be attributed to the presence of sandy layers at a depth of several meters.
The function of the damaged levees was temporarily restored by the Croatian Water Authorities (Hrvatske vode) in a couple of days by the building of secondary embankments. Then the reparation or reconstruction was initiated for the sections with detected damage.
On the basis of an extensive geotechnical investigation on the damaged sections of the levees, the design solutions for reconstruction and seismic retrofitting of the levees were adopted. The solutions addressed the consequences of seismic shaking and liquefaction, as well as liquefaction resistance for future earthquakes.
Although a series of experts made a field inspection of all the flood protection embankments, and checked them and the surrounding areas visually for damage–and detected cracks, settlements, and ejecta–it is clear that maybe some of the consequences of the earthquake were hidden and that further investigations and maintenance should take this into account.

Author Contributions

Investigation: S.Z. and I.M.; testing: I.M.; writing S.Z. and I.M.; solutions for remediation: I.M. All authors have read and agreed to the published version of the manuscript.

Funding

This research received no external funding.

Data Availability Statement

Not applicable.

Acknowledgments

Croatian Waters Authorities (Hrvatske vode) are acknowledged for allowing the authors to publish these data.

Conflicts of Interest

The authors declare no conflict of interest.

References

  1. Croatian Seismological Survey. Potresi kod Petrinje za 28. i 29. Prosinac 2020. Godine. Published 2 February 2021. 2021. Available online: https://www.pmf.unizg.hr/geof/seizmoloska_sluzba/potresi_kod_petrinje?@=1m6am#news_118053 (accessed on 28 November 2022).
  2. Croatian Seismological Survey. Petrinjski Potresi-Novosti. Published 28 December 2021. 2021. Available online: https://www.pmf.unizg.hr/geof/seizmoloska_sluzba/potresi_kod_petrinje (accessed on 28 November 2022).
  3. EMSC. M6.4 CROATIA on December 29th 2020 at 11:19 UTC. 2021. Available online: https://www.emsc.eu/Earthquake/264/M6-4-CROATIA-on-December-29th-2020-at-11-19-UTC (accessed on 11 January 2021).
  4. Miranda, E.; Brzev, S.; Bijelic, N.; Arbanas, Ž.; Bartolac, M.; Jagodnik, V.; Lazarević, D.; Mihalić Arbanas, S.; Zlatović, S.; Acosta, V.; et al. Petrinja, Croatia December 29, 2020, Mw 6.4 Earthquake Joint Reconnaissance Report (JRR); ETH Zurich: Zürich, Switzerland, 2021; Available online: https://www.designsafe-ci.org/data/browser/public/designsafe.storage.published/PRJ-2959 (accessed on 28 November 2022).
  5. USGS. M 6.4—2 km WSW of Petrinja, Croatia. 2020. Available online: https://earthquake.usgs.gov/earthquakes/eventpage/us6000d3zh/executive (accessed on 28 November 2022).
  6. Croatian Seismological Survey. Dvije Godine od Petrinjskog Potresa. Published 28 December 2022. 2022. Available online: https://www.pmf.unizg.hr/geof/seizmoloska_sluzba/potresi_kod_petrinje (accessed on 28 November 2022).
  7. USGS. Earthquake Catalog: Earthquakes with Magnitudes 3.0 or above from 28 December 2020 to 29 December 2020 in the Chosen Area. 2022. Available online: https://earthquake.usgs.gov/earthquakes/map/?extent=44.44162,14.35913&extent=46.27483,18.99536&range=search&timeZone=utc&search=%7B%22name%22:%22Search%20Results%22,%22params%22:%7B%22starttime%22:%222020-12-28%2000:00:00%22,%22endtime%22:%222023-01-29%2023:59:59%22,%22maxlatitude%22:46,%22minlatitude%22:43,%22maxlongitude%22:18,%22minlongitude%22:13,%22minmagnitude%22:3,%22maxmagnitude%22:7,%22orderby%22:%22time%22%7D%7D (accessed on 28 November 2022).
  8. Pikija, M. Osnovna Geološka Karta SFRJ 1:100.000, List Sisak L33–93.—Geološki Zavod, Zagreb (1975–1986); Savezni Geološki Institut: Beograd, Serbia, 1987. [Google Scholar]
  9. Pikija, M. Osnovna Geološka Karta SFRJ 1:100.000, Tumač za List Sisak L33–93.—Geološki Zavod, Zagreb (1986); Savezni Geološki Institut: Beograd, Serbia, 1987. [Google Scholar]
  10. Tomac, I.; Zlatovic, S.; Athanasopoulos-Zekkos, A.; Bleiziffer, J.; Domitrovic, D.; Frangen, F.; Gjetvaj, V.; Govorcin, M.; Grilliot, M.; Gukov, I.; et al. 2020 Petrinja, Croatia Earthquake. 2021. Available online: https://geerassociation.org/index.php/component/geer_reports/?view=geerreports&layout=build&id=99 (accessed on 28 November 2022).
  11. Zlatović, S.; Athanasopoulos-Zekkos, A.; Tomac, I.; Mihaljević, I. Earthen Levee Systems. 2021. Available online: https://geerassociation.org/components/com_geer_reports/geerfiles/Chapter%208.pdf (accessed on 28 November 2022).
  12. Geokon-Zagreb d.d. Geotehnički Istražni Radovi za Izvanredno Održavanje l.o. Savskog Nasipa od n.km.r. 101+200 do n.km.r. 102+000 u Naselju Galdovo; Hrvatske Vode: Zagreb, Croatia, 2021. [Google Scholar]
  13. Geokon-Zagreb d.d. Projekt Izvanrednog Održavanja Lijevoobalni Savski Nasip od n.km 101+200 do n.km 102+000 u Naselju Galdovo, Sisačko-Moslavačka Županija; Hrvatske Vode: Zagreb, Croatia, 2021. [Google Scholar]
  14. Croatian Seismological Survey. Preliminarni Rezultati Serije Potresa kod Petrinje od 28. Prosinca 2020. do 28. Siječnja 2021. 2020. Available online: https://www.pmf.unizg.hr/geof/seizmoloska_sluzba/mjesec_dana_od_glavnog_petrinjskog_potresa (accessed on 28 November 2022).
  15. Geokon-Zagreb d.d. Izvanredni Pregled Oštećenja Lijevog Savskog Nasipa na Dionicama u Palanjku, Hrastelnici i Galdovu Uzrokovanih Potresom od 29.12.2020; Geokon-Zagreb d.d.: Zagreb, Croatia, 2020. [Google Scholar]
  16. Geokon-Zagreb d.d. Izvanredni Pregled Oštećenja Desnog Kupskog Nasipa na Dionici od Mosta u Brestu do cca 3km Nizvodno od Ušča Petrinjčice u Kupu Uzrokovanih Potresom od 29.12.2020; Geokon-Zagreb d.d.: Zagreb, Croatia, 2020. [Google Scholar]
  17. Sasaki, Y.; Fukuwatari, T.; Tsuji, T.; Sawada, S. A Study on the Performance of a Reinforced Dike Section with Geogrid during the Tottori-Ken Seibu Earthquake. In Proceedings of the 5th International Conference on Case Histories in Geotechnical Engineering, New York, NY, USA, 13–17 April 2004; Available online: https://scholarsmine.mst.edu/cgi/viewcontent.cgi?article=2383&context=icchge (accessed on 28 November 2022).
  18. Youd, T.L.; Idriss, I.M.; Andrus, R.D.; Arango, I.; Castro, G.; Christian, J.T.; Dobry, R.; Finn, W.D.L.; Harder, L.F., Jr.; Hynes, M.E.; et al. Liquefaction Resistance of Soils: Summary Report from the 1996 NCEER and 1998 NCEER/NSF Workshops on Evaluation of Liquefaction Resistance of Soils. J. Geotech. Geoenviron. Eng. 2001, 127, 297–313. [Google Scholar] [CrossRef] [Green Version]
  19. Robertson, P. Cone Penetration Test (CPT)-Based Soil Behaviour Type (SBT) Classification System—An Update; Gregg Drilling & Testing Canada Ltd.: Prince George, BC, Canada, 2016. [Google Scholar]
  20. Kovacevic, M.S.; Gavin, K.G.; Reale, C.; Libric, L. The use of neural networks to develop CPT correlations for soils in northern Croatia. In Cone Penetration Testing 2018; CRC Press: Boca Raton, FL, USA, 2018. [Google Scholar]
  21. Kovacevic, M.S.; Gavin, K.; Reale, C.; Libric, L. Developing correlations between the soil fines content and CPT results using neural networks. In Proceedings of the XVII ECSMGE-2019 Geotechnical Engineering Foundation of the Future, Reykjavik, Iceland, 1–6 September 2019. [Google Scholar]
  22. Seed, H.B.; Idriss, I.M. Analysis of Soil Liquefaction: Niigata Earthquake. J. Soil.Mech. Found.Div. 1967, 93, 83–108. [Google Scholar] [CrossRef]
  23. Boulanger, R.W.; Idriss, I.M. CPT and SPT Based Liquefaction Triggering Procedures, Report No. UCD/CGM-14/01; Center for Geotechnical Modeling, Department of Civil & Environmental Engineering, College of Engineering, University of California at Davis: Davis, CA, USA, 2014. [Google Scholar]
  24. Juang, C.H.; Jiang, T.; Andrus, R.D. Assessing Probability-based Methods. J. Geotech. Geoenviron. Eng. 2002, 128, 580–589. [Google Scholar] [CrossRef]
  25. Chen, C.J.; Juang, C.H. Calibration of SPT- and CPT-based liquefaction evaluation methods. U: P. Mayne & R. Hryciw, ur. In Innovations Applications in Geotechnical Site Characterization; Geotechnical Special Publication No. 97; ASCE: New York, NY, USA, 2000; pp. 49–64. [Google Scholar]
  26. Yoshimine, M.; Nishizaki, H.; Amano, K.; Hosono, Y. Flow deformation of liquefied sand under constant shear load and its application to analysis of flow slide of infinite slope. Soil Dyn. Earthq. Eng. 2006, 26, 253–264. [Google Scholar] [CrossRef]
Figure 1. Felt reports for the Petrinja 2020 earthquake and epicentre location—marked with a star, from the European-Mediterranean Seismological Centre [3]. White rectangle shows the area presented in Figure 2.
Geosciences 13 00048 g001
Figure 2. Peak ground acceleration of the 2020 Petrinja earthquake and the epicentre according to United States Geologic Survey [5]. Red rectangle shows the area presented in Figure 4.
Geosciences 13 00048 g002
Figure 3. Magnitudes of the earthquakes from 28 December 2020 to 28 December 2022 [6]. The most affected areas were the villages and cities in the valley of the meandering rivers, Kupa and Sava, and their tributaries, with mostly soft layers of sands, silts, and clays, and a high ground water table [8,9]. The embankments erected to protect the cities, villages, and fields from the high waters of the Sava and Kupa rivers, were inspected by the representatives of the Croatian Waters Authorities (Hrvatske vode) immediately after the main earthquake. In the following several days, the necessary repairs were made and secondary18 embankments were built to prevent further damage in case of heavier rains and an increase in the water levels of the rivers.
Geosciences 13 00048 g003
Figure 5. Some of the geotechnical data on the discussed damaged sections. White numbers show the depth of the sandy layer below the ground surface—in the figure shown as a red line. Surface layers are clays of intermediate or high plasticity, presented in violet colour; sand with a high content of clay or silt is present at depths of several metres, presented in yellow. The number of SPT blows before the earthquake are shown as red numbers on the right.
Geosciences 13 00048 g005
Figure 6. Typical embankment damage at Galdovo are longitudinal cracks with a depth of 2 m or more.
Geosciences 13 00048 g006
Figure 7. Embankment near Stara Drenčina. The crack crosses the embankment and causes subsidence. A white secondary embankment is visible.
Geosciences 13 00048 g007
Figure 8. Embankment near Palanjek. A crack over 30 cm wide crosses the connection between two perpendicular embankments (ac) [15]. The ejecta are visible on both sides of the main embankment, as well as the longitudinal cracks along it over 15 cm wide (d).
Geosciences 13 00048 g008
Figure 9. Typical damage to the embankment near Petrinja. There were numerous longitudinal cracks along the embankment, especially on the river side as in (a,b). On the opposite side, ejecta were found, as seen in (c). (Figure 9b,c are copied from [16]).
Geosciences 13 00048 g009
Figure 10. Embankment and surroundings near Hrastelnica (a). The ejecta were found on both sides of the embankment, the river side is shown here (b). The crack on the embankment (c) is barely visible4. Rationale for the Reconstruction.
Geosciences 13 00048 g010
Figure 11. Embankment reconstruction where cracks have opened through the embankment body: the embankment needs to be removed and reconstructed with geogrid reinforcements for better performance in future earthquakes.
Geosciences 13 00048 g011
Figure 12. The solution for cracks under the embankment: at the locations of cracks, it is necessary to remove the soil to a depth of at least 1.5 m, and to a width of 1 m, and to compact the clay material in layers.
Geosciences 13 00048 g012
Figure 13. The solution for cracks under the embankment: at the locations of cracks, it is necessary to remove the soil to a depth of at least 1.5 m, and to a width of 1 m, and to compact the clay material in layers.
Geosciences 13 00048 g013
Figure 14. Another solution for sections with high liquefaction potential consists of removal of the embankment and the subsoil to a depth of at least 1.5 m from the ground surface, rapid impulse compaction, replacement of the foundation soil with the installation of geogrids, and construction of the embankment to the designed height.
Geosciences 13 00048 g014
Figure 15. Rapid impulse compaction (RIC) at the Sava river embankment at Galdovo.
Geosciences 13 00048 g015
Figure 16. Installation of geogrids in the foundation soil of the Kupa embankment near Petrinja.
Geosciences 13 00048 g016
Disclaimer/Publisher’s Note: The statements, opinions and data contained in all publications are solely those of the individual author(s) and contributor(s) and not of MDPI and/or the editor(s). MDPI and/or the editor(s) disclaim responsibility for any injury to people or property resulting from any ideas, methods, instructions or products referred to in the content.

